:KLFK )HDWXUHV RI 6SDQLVK /HDUQHUV 3URQXQFLDWLRQ 0RVW ,PSDFW /LVWHQHU (YDOXDWLRQV" .DUD 0F%ULGH Hispania, Volume 98, Number 1, March 2015, pp. 14-30 (Article) 3XEOLVKHG E\ -RKQV +RSNLQV 8QLYHUVLW\ 3UHVV DOI: 10.1353/hpn.2015.0001 For additional information about this article Access provided by Saint Louis University (1 Apr 2015 20:45 GMT) http://muse.jhu.edu/journals/hpn/summary/v098/98.1.mcbride.html

Welcome message from author
This document is posted to help you gain knowledge. Please leave a comment to let me know what you think about it! Share it to your friends and learn new things together.
Transcript
h h F t r f p n h L rn r Pr n n t nt p t L t n r v l t n
r Br d
Hispania, Volume 98, Number 1, March 2015, pp. 14-30 (Article)
P bl h d b J hn H p n n v r t PrDOI: 10.1353/hpn.2015.0001
For additional information about this article
Access provided by Saint Louis University (1 Apr 2015 20:45 GMT)
http://muse.jhu.edu/journals/hpn/summary/v098/98.1.mcbride.html
Hispania 98.1 (2015): 14–30AATSP Copyright © 2015
Which Features of Spanish Learners’ Pronunciation Most Impact Listener Evaluations?
Kara McBrideSaint Louis University
Abstract: This study explores which features of Spanish as a foreign language (SFL) pronunciation most impact raters’ evaluations. Native Spanish speakers (NSSs) from regions with different pronunciation norms were polled: 147 evaluators from northern Mexico and 99 evaluators from central Argentina. These evaluations were contrasted with ratings from non-native SFL instructors. Evaluators rated speech samples in terms of comprehensibility and pleasantness, and identified the specific features of the learn-ers’ pronunciation that they found either acceptable or unsatisfactory. For all groups, negative personal attributes were associated with less accurate pronunciation. Significant quantitative differences were found in groups’ ratings, with the non-native raters falling between the two groups of NSSs. The different groups of NSS raters were largely in agreement in terms of the specific pronunciation features that they identi-fied as important, however. Compared to non-native raters, the NSSs focused more on suprasegmentals and global voice qualities. Phonemes that appear to have the greatest impact on listeners’ evaluations are identified, and teaching implications are discussed.
Keywords: affective response/reacción afectiva, comprehensibility/inteligibilidad, nativeness/nativo versus no nativo, pleasantness/agrado, pronunciation/pronunciación
Introduction
Clear pronunciation is required for listeners to understand the words that a second lan-guage (L2), speaker produces. However, it is not comprehensibility alone that contributes to how speech is perceived. In both first language (L1) and L2 speech, pronunciation
can strongly impact the impressions that listeners form of the speaker (Bresnahan et al. 2002; Derwing and Munro 2010; Lippi-Green 1997; Llurda 2000). These impressions can affect the quality of interactions between speakers and listeners (Cunningham-Andersson 1997; Golombek and Jordon 2005; Lippi-Green 1997).
Choices about which pronunciation features one displays are decisions about identity expression (Golombek and Jordon 2005). In order to make well-informed choices in this arena, L2 speakers need information about how different aspects of their speech may be perceived by speakers of the L2. This kind of information can also help teachers make informed decisions about pronunciation instruction.
Features of SFL Speech
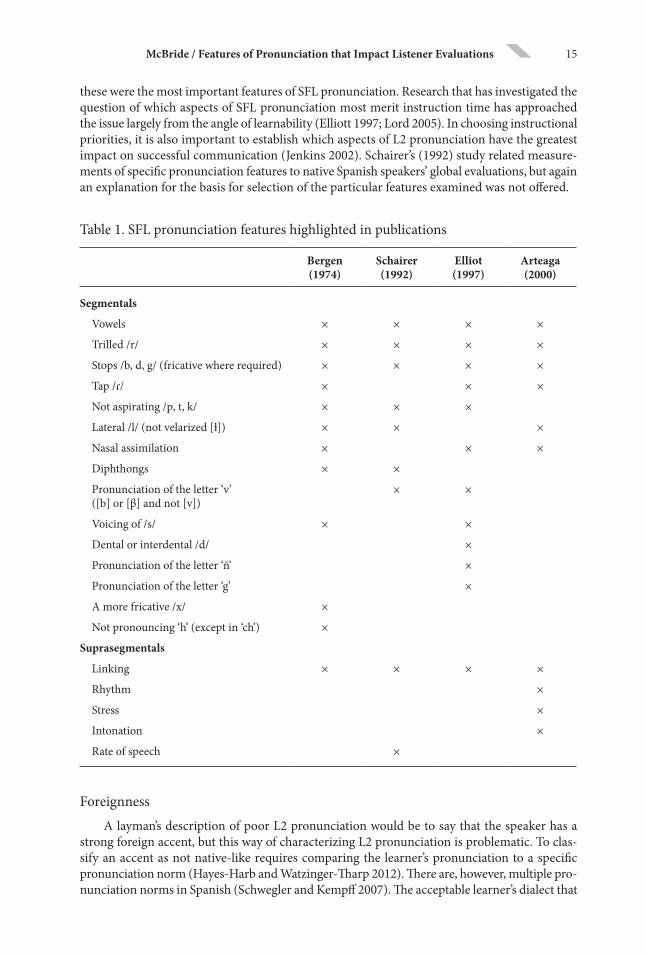
Table 1 summarizes the features that Bergen (1974) proposed as the most essential pro-nunciation features for Spanish as a foreign language (SFL) learners to master for a clear and nonirritating accent—what he calls a “learner’s dialect” (480). Arteaga (2000) explicitly borrowed Bergen’s concept of a learner’s dialect but advocated for a slightly different set of features (343) (see Table 1). Neither of these authors, however, offered empirical evidence for their claims that
15McBride / Features of Pronunciation that Impact Listener Evaluations
these were the most important features of SFL pronunciation. Research that has investigated the question of which aspects of SFL pronunciation most merit instruction time has approached the issue largely from the angle of learnability (Elliott 1997; Lord 2005). In choosing instructional priorities, it is also important to establish which aspects of L2 pronunciation have the greatest impact on successful communication (Jenkins 2002). Schairer’s (1992) study related measure-ments of specific pronunciation features to native Spanish speakers’ global evaluations, but again an explanation for the basis for selection of the particular features examined was not offered.
Table 1. SFL pronunciation features highlighted in publications
Bergen (1974)
Schairer (1992)
Elliot (1997)
Arteaga (2000)
Segmentals
Vowels × × × ×
Trilled /r/ × × × ×
Stops /b, d, g/ (fricative where required) × × × ×
Tap /ɾ/ × × ×
Not aspirating /p, t, k/ × × ×
Lateral /l/ (not velarized [ɫ]) × × ×
Nasal assimilation × × ×
Diphthongs × ×
Pronunciation of the letter ‘v’ ([b] or [β] and not [v])
× ×
Voicing of /s/ × ×
Dental or interdental /d/ ×
Pronunciation of the letter ‘ñ’ ×
Pronunciation of the letter ‘g’ ×
A more fricative /x/ ×
Not pronouncing ‘h’ (except in ‘ch’) ×
Suprasegmentals
Linking × × × ×
Rhythm ×
Stress ×
Intonation ×
Rate of speech ×
Foreignness
A layman’s description of poor L2 pronunciation would be to say that the speaker has a strong foreign accent, but this way of characterizing L2 pronunciation is problematic. To clas-sify an accent as not native-like requires comparing the learner’s pronunciation to a specific pronunciation norm (Hayes-Harb and Watzinger-Tharp 2012). There are, however, multiple pro-nunciation norms in Spanish (Schwegler and Kempff 2007). The acceptable learner’s dialect that
16 Hispania 98 March 2015
Bergen (1974) and Arteaga (2000) sought was neither tied to one particular Spanish norm nor, for that matter, meant to sound exactly native-like.
Another problem with using foreign accentedness as a means of evaluating L2 speech is that it implies that the L2 speaker’s goal can and should be to produce the L2 in a way that is indistinguishable from the oral production of a native speaker. Ample research suggests that most adult L2 learners cannot reach such a goal in the area of pronunciation (Flege, Munro, and MacKay 1995; Levis 2005; Moyer 1999, 2004). Furthermore, because accent is intimately tied to identity and the presentation of self (Golombek and Jordon 2005), many L2 learners may not want to attain a native-like accent.
In Hayes-Harb and Watzinger-Tharp’s (2012) study, there was no significant correlation between foreign accentedness and comprehensibility. Foreign accentedness, then, may be at times a counterproductive means by which to measure L2 speakers’ pronunciation. This is not to say, however, that it is not possible to formulate meaningful evaluations of L2 pronunciation in ways that can usefully inform L2 instruction. What is important in communication is first whether listeners can understand the spoken message, and second, what kind of effect the speaker’s pronunciation has on listeners’ perception of the speaker.
Comprehensibility
Not all L1 phonetic transfer causes difficulties in L2 comprehensibility. The severity of the impact that a non-native-like pronunciation feature has on listeners’ comprehension varies depending on the phonemes in question (Cunningham-Andersson 1997; Jenkins 2002; Munro and Derwing 2006). Furthermore, the key to achieving highly comprehensible L2 speech may not be exclusively or even primarily in specific phonemes, but may be highly associated with more global features such as stress, rhythm, and intonation (Derwing, Munro, and Wiebe 1998).
The studies thus far cited in this discussion of comprehensibility were done with learners of English as a second language (ESL). One study has investigated the question of which SFL pronunciation features correlate the highest with differences in listener evaluations. Schairer (1992) had native speakers of Spanish rate speech samples of SFL learners. She also analyzed each speech sample in terms of the nine features indicated in Table 1. Using regression analysis, Schairer (1992) concluded that vowels accounted for 90% of the variance in the native speakers’ evaluations (315). It is possible, however, that other SFL pronunciation features that were not included in Schairer’s analysis were also significant in shaping native speakers’ evaluations. If so, their absence in Schairer’s study may have led to an overrepresentation of the impact of vowels. Because of this possibility, the present study included a number of open-ended questions.
The quantitative measure of comprehensibility in the present study used Derwing and Munro’s (2009) definition of the term: “The listener’s perception of how easy or difficult it is to understand a given speech sample” (478). Using evaluators’ impressions to measure this variable is in keeping with how the comprehensibility of L2 speakers’ speech is judged in most situations. As Trofimovich and Isaacs (2012) point out, interlocutors in everyday communicative encounters and L2 teachers and examiners respond to the L2 speech that they hear impressionistically, and not, generally, by using objective measures of the kind that machine analysis could render. Thus, eliciting evaluators’ perceptions corresponds to what is meant by this term in teaching and communicative contexts.
Affective Responses
Investigations into listeners’ attitudes toward accents generally ask evaluators to indicate their responses using semantic differential scales describing the characteristics being investigated, such as the evaluators’ sense of solidarity with or the prestige of the speaker (Garrett, Coupland, and Williams 2003). The design of such studies must try to isolate the impact of pronunciation
17McBride / Features of Pronunciation that Impact Listener Evaluations
from other factors. By having subjects read prepared texts, researchers attempt to eliminate differ ences in grammar and word choice from one speech sample to another (Garrett, Coupland, and Williams 2003). The matched-guise technique, in which the same speaker speaks with different accents and is presented to evaluators as different people, is frequently employed to minimize issues of voice quality. It is not always possible for the same speaker to accurately represent different accents, however. The alternative is to use a large number of speech samples.
Cunningham-Andersson’s (1997) study used the matched-guise paradigm to study atti-tudes about ESL pronunciation. She found that different sounds had different levels of impact on how friendly and intelligent raters considered each speaker to be. The same speakers were judged differently, even by the same rater, depending on which type of pronunciation error was heard. It is, therefore, important to look not only at overall impressions but specific features of L2 pronunciation.
In the present study, a seven-point Likert scale from ‘irritating’ to ‘pleasant’ was included. This was used to gauge listeners’ overall sense of the acceptability of the SFL learners’ pronuncia-tion and calculate its relation to other scores. In order to further explore the range of affective responses that the evaluators had to SFL speech and the bases upon which they were founded, an open-ended item, in which the raters were asked to describe the speaker, was included.
Allowing participants to choose their own descriptors avoids some problems associated with closed-ended items presented to diverse populations (Al-Hindawe 1996). One consideration in the present study was the possibility of nonequivalence between translations: a given word may be the best available translation but have different connotations that could lead subjects to interpret the item in a way not meant by the researcher. Also possible was that some words could have different connotations for the two main groups of native Spanish speakers (NSSs) that participated in this study. In such a case, a translated item might be understood as intended by one NSS group but not by the other. By first seeing what the evaluators wrote and then consulting with native speakers from the evaluators’ region, it was hoped that a more accurate interpretation of the data could be made. Another danger in relying on closed-ended items in attitude studies is that participants may vary the associations that they make with a given adjective, depending on whether they apply it to one group or another (e.g., males or females) (Al-Hindawe 1996).
Affective responses to pronunciation can be significantly affected by listeners’ attitudes toward the L2 speakers’ ethnic group (Gatbonton, Trofimovich, and Magid 2005; Llurda 2000) and whether the listeners consider the speakers to be their status peers (Cargile and Giles 1998). For these reasons and others that will be explained below, it is important to consider differences between groups of evaluators.
Types of Evaluators
The more familiar a rater is with a particular L2 accent, the more comprehensible he or she will find the speech of speakers with that same L1 (Bradlow and Bent 2008). Familiarity can affect other aspects of a listener’s reception of an accent as well. DeShields and Kara (2011) found that NSS evaluators from Mexico were more likely to find speech samples convincing if they were familiar with the L2 accent. Evaluators who lived in a region where residents had frequent contact with native English speakers rated native Spanish speakers and (US) SFL speakers as equally convincing in Spanish, whereas evaluators who lived in a region of Mexico where contact with native English speakers was rare found NSSs significantly more convincing than SFL speakers.
In Cunningham-Andersson’s (1997) study, raters with previous second language teaching experience were generally the most lenient judges of mispronunciation severity. On the other hand, Flege and Fletcher (1992) found that trained raters can become more critical of foreign accents on materials that they are more familiar with. Although trained raters can detect more in a speech sample than untrained raters, and this can obviously benefit research, Munro (2008) argued in favor of using untrained raters as well, precisely because training alters perception.

18 Hispania 98 March 2015
For these reasons, the present study used both linguistically trained English speakers and untrained NSS evaluators.
Another characteristic of evaluators that may influence their perception is which variety of the target language they speak (Hayes-Harb and Watzinger-Tharp 2012). Arteaga’s (2000) attempt to establish an SFL learner’s dialect was intended to be “unmarked,” but the wide variety of pronunciation norms in the Spanish-speaking world throws into question the possibility of such neutrality (343). It could be that NSSs with very different pronunciation norms would respond differently to the same L2 speech. The present study investigated this possibility by including evaluators from northern Mexico and central Argentina.
Finally, there is evidence to suggest that native speakers and non-native speakers judge L2 learners’ pronunciation differently (Fayer and Krasinski 1987; Kang 2012; Rossiter 2009). Generally speaking, non-native speakers focus more on form errors, whereas native speakers tend to be more influenced by issues of comprehensibility. Thus, while this study was primarily designed to investigate native Spanish speakers’ views of SFL pronunciation, evaluations were also collected from non-native SFL teachers for the purpose of comparison.
The Study
This study sought to answer the following questions:
1) Which characteristics of SFL speech do listeners find to be the greatest barriers to comprehensibility?1
2) Which features of SFL speech do evaluators classify as irritating, and which as pleasant?
3) Are the answers to the above the same for NSSs from northern Mexico and from central Argentina?
4) Are there any consistent differences between the evaluations of naive NSSs as com-pared to those of NSSs with extensive linguistic training and an advanced knowledge of the speakers’ L1, English?
5) Do non-native teachers of SFL focus on the same features that the NSSs do in their evaluations?
6) For each group of evaluators, are the obstacles to comprehensibility that they identify the same features that are categorized as irritating, and are these the features that are identified as signaling foreignness?
Materials
Recordings
The SFL speakers were 60 first-semester university Spanish students in their thirteenth week of the semester. They read two verses of the poem “Versos sencillos” by José Martí (see Appendix). This poem appeared in their textbook (Terrell, Andrade, Egasse, and Muñoz 2006) in the chapter they were studying at the time (163). Students were asked to study the poem before class. In class, students listened to a professional recording of the poem read by a native, Latin American Spanish speaker.2 Next, students, still with the text in front of them, heard the poem read line by line and were recorded repeating each line during the pauses. This was done in order to minimize mispronunciations caused by a lack of familiarity with Spanish orthography. Originally over 200 recordings were made. These were recorded on HP desktop computers using the software Sony Virtuoso/Soloist 9.0. Sixty recordings were chosen semirandomly, selecting 30 men and 30 women, evenly distributed across classes. A few originally selected recordings were rejected for having background noise or low volume. These were replaced by other recordings
19McBride / Features of Pronunciation that Impact Listener Evaluations
representing similar demographics. The recordings that the evaluators listened to were edited so that only the students’ voices were heard, as if reading the poem straight through, with natural, brief pauses between lines. They were about 50 seconds long each.
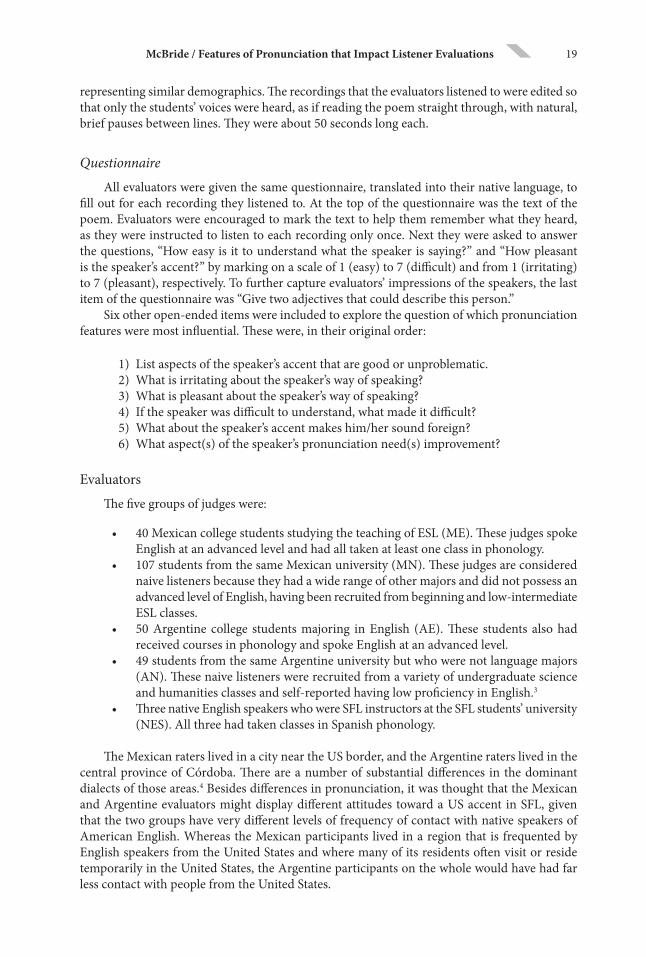
Questionnaire
All evaluators were given the same questionnaire, translated into their native language, to fill out for each recording they listened to. At the top of the questionnaire was the text of the poem. Evaluators were encouraged to mark the text to help them remember what they heard, as they were instructed to listen to each recording only once. Next they were asked to answer the questions, “How easy is it to understand what the speaker is saying?” and “How pleasant is the speaker’s accent?” by marking on a scale of 1 (easy) to 7 (difficult) and from 1 (irritating) to 7 (pleasant), respectively. To further capture evaluators’ impressions of the speakers, the last item of the questionnaire was “Give two adjectives that could describe this person.”
Six other open-ended items were included to explore the question of which pronunciation features were most influential. These were, in their original order:
1) List aspects of the speaker’s accent that are good or unproblematic. 2) What is irritating about the speaker’s way of speaking? 3) What is pleasant about the speaker’s way of speaking? 4) If the speaker was difficult to understand, what made it difficult? 5) What about the speaker’s accent makes him/her sound foreign? 6) What aspect(s) of the speaker’s pronunciation need(s) improvement?
Evaluators
The five groups of judges were:
• 40 Mexican college students studying the teaching of ESL (ME). These judges spoke English at an advanced level and had all taken at least one class in phonology.
• 107 students from the same Mexican university (MN). These judges are considered naive listeners because they had a wide range of other majors and did not possess an advanced level of English, having been recruited from beginning and low-intermediate ESL classes.
• 50 Argentine college students majoring in English (AE). These students also had received courses in phonology and spoke English at an advanced level.
• 49 students from the same Argentine university but who were not language majors (AN). These naive listeners were recruited from a variety of undergraduate science and humanities classes and self-reported having low proficiency in English.3
• Three native English speakers who were SFL instructors at the SFL students’ university (NES). All three had taken classes in Spanish phonology.
The Mexican raters lived in a city near the US border, and the Argentine raters lived in the central province of Córdoba. There are a number of substantial differences in the dominant dialects of those areas.4 Besides differences in pronunciation, it was thought that the Mexican and Argentine evaluators might display different attitudes toward a US accent in SFL, given that the two groups have very different levels of frequency of contact with native speakers of American English. Whereas the Mexican participants lived in a region that is frequented by English speakers from the United States and where many of its residents often visit or reside temporarily in the United States, the Argentine participants on the whole would have had far less contact with people from the United States.
20 Hispania 98 March 2015
Procedure
Using headphones, the NSSs listened to the recordings on mp3 players. 24 playlists of five recordings each were created so that each recording appeared twice. A recording’s position (early, middle, or late) was alternated between lists. Attention was also given to alternating whether a speaker was followed by a speaker of the same sex or not. NSS evaluators typically had one hour for the procedure. They rated an average of four recordings each.5 This resulted in 595 evaluations from the Mexican group and 395 from Argentina. The NES group listened to the recordings on a computer, using headphones. NES evaluators each rated all 60 recordings (180 evaluations total). The playlist had been counterbalanced for gender and the speakers’ SFL instructors. The NES evaluators did not have information about the speakers’ nor their instructors’ identities.
Results
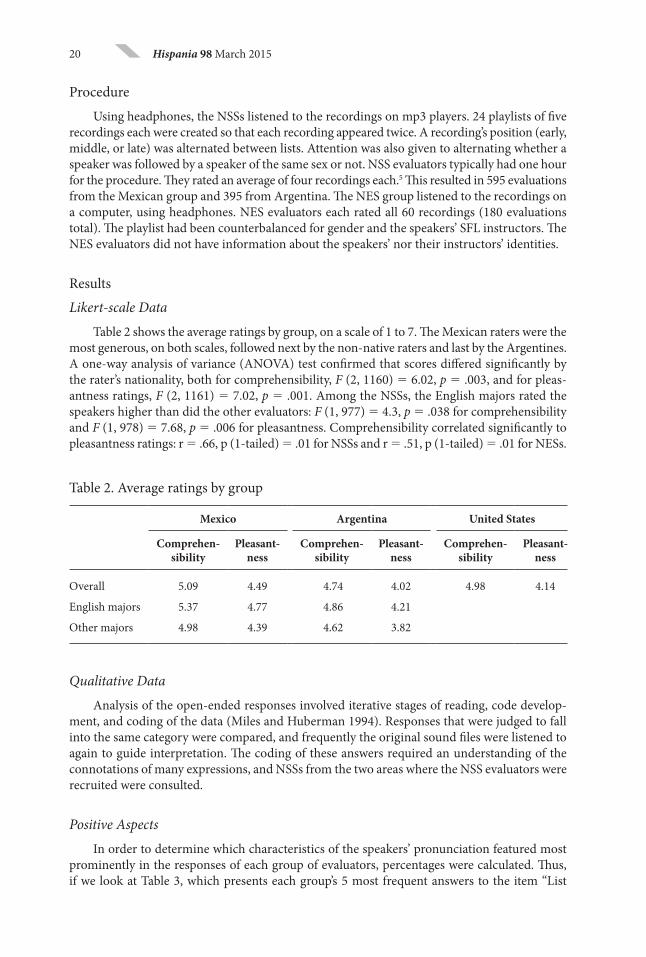
Likert-scale Data
Table 2 shows the average ratings by group, on a scale of 1 to 7. The Mexican raters were the most generous, on both scales, followed next by the non-native raters and last by the Argentines. A one-way analysis of variance (ANOVA) test confirmed that scores differed significantly by the rater’s nationality, both for comprehensibility, F (2, 1160) 6.02, p .003, and for pleas-antness ratings, F (2, 1161) 7.02, p .001. Among the NSSs, the English majors rated the speakers higher than did the other evaluators: F (1, 977) 4.3, p .038 for comprehensibility and F (1, 978) 7.68, p .006 for pleasantness. Comprehensibility correlated significantly to pleasantness ratings: r .66, p (1-tailed) .01 for NSSs and r .51, p (1-tailed) .01 for NESs.
Table 2. Average ratings by group
Mexico Argentina United States
Comprehen-sibility
Pleasant-ness
Comprehen-sibility
Pleasant-ness
Comprehen-sibility
Pleasant-ness
Overall 5.09 4.49 4.74 4.02 4.98 4.14
English majors 5.37 4.77 4.86 4.21
Other majors 4.98 4.39 4.62 3.82
Qualitative Data
Analysis of the open-ended responses involved iterative stages of reading, code develop-ment, and coding of the data (Miles and Huberman 1994). Responses that were judged to fall into the same category were compared, and frequently the original sound files were listened to again to guide interpretation. The coding of these answers required an understanding of the connotations of many expressions, and NSSs from the two areas where the NSS evaluators were recruited were consulted.
Positive Aspects
In order to determine which characteristics of the speakers’ pronunciation featured most prominently in the responses of each group of evaluators, percentages were calculated. Thus, if we look at Table 3, which presents each group’s 5 most frequent answers to the item “List
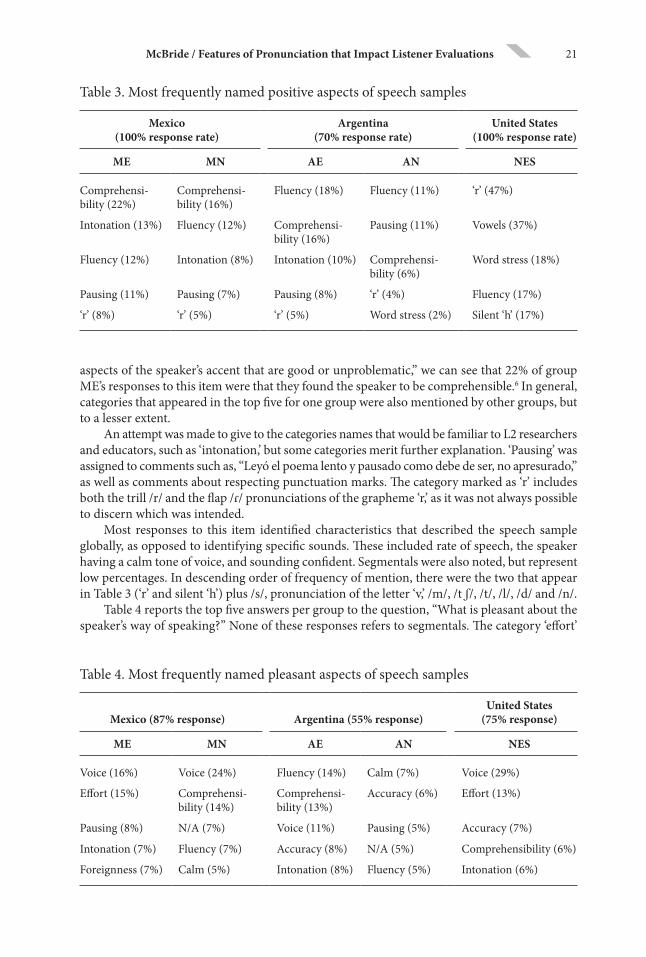
21McBride / Features of Pronunciation that Impact Listener Evaluations
aspects of the speaker’s accent that are good or unproblematic,” we can see that 22% of group ME’s responses to this item were that they found the speaker to be comprehensible.6 In general, categories that appeared in the top five for one group were also mentioned by other groups, but to a lesser extent.
An attempt was made to give to the categories names that would be familiar to L2 researchers and educators, such as ‘intonation,’ but some categories merit further explanation. ‘Pausing’ was assigned to comments such as, “Leyó el poema lento y pausado como debe de ser, no apresurado,” as well as comments about respecting punctuation marks. The category marked as ‘r’ includes both the trill /r/ and the flap /ɾ/ pronunciations of the grapheme ‘r,’ as it was not always possible to discern which was intended.
Most responses to this item identified characteristics that described the speech sample globally, as opposed to identifying specific sounds. These included rate of speech, the speaker having a calm tone of voice, and sounding confident. Segmentals were also noted, but represent low percentages. In descending order of frequency of mention, there were the two that appear in Table 3 (‘r’ and silent ‘h’) plus /s/, pronunciation of the letter ‘v,’ /m/, /t ʃ/, /t/, /l/, /d/ and /n/.
Table 4 reports the top five answers per group to the question, “What is pleasant about the speaker’s way of speaking?” None of these responses refers to segmentals. The category ‘effort’
Table 3. Most frequently named positive aspects of speech samples
Mexico(100% response rate)
Argentina(70% response rate)
United States (100% response rate)
ME MN AE AN NES
Comprehensi-bility (22%)
Comprehensi-bility (16%)
Fluency (18%) Fluency (11%) ‘r’ (47%)
Intonation (13%) Fluency (12%) Comprehensi-bility (16%)
Pausing (11%) Vowels (37%)
Fluency (12%) Intonation (8%) Intonation (10%) Comprehensi-bility (6%)
Word stress (18%)
Pausing (11%) Pausing (7%) Pausing (8%) ‘r’ (4%) Fluency (17%)
‘r’ (8%) ‘r’ (5%) ‘r’ (5%) Word stress (2%) Silent ‘h’ (17%)
Table 4. Most frequently named pleasant aspects of speech samples
Mexico (87% response) Argentina (55% response)United States
(75% response)
ME MN AE AN NES
Voice (16%) Voice (24%) Fluency (14%) Calm (7%) Voice (29%)
Effort (15%) Comprehensi-bility (14%)
Comprehensi-bility (13%)
Accuracy (6%) Effort (13%)
Pausing (8%) N/A (7%) Voice (11%) Pausing (5%) Accuracy (7%)
Intonation (7%) Fluency (7%) Accuracy (8%) N/A (5%) Comprehensibility (6%)
Foreignness (7%) Calm (5%) Intonation (8%) Fluency (5%) Intonation (6%)
22 Hispania 98 March 2015
was created to capture answers such as “Es una persona que aunque le es difisil en algunas ocaciones, continua intendandolo.”7
The category ‘N/A’ was applied only when respondents wrote in answers expressing that little to nothing was pleasant about the speech sample, but this sentiment was probably also shared by most of the raters who did not answer the question. If so, roughly half of the evaluators from Argentina found nothing pleasant about the SFL learners’ speech. In contrast, 7% of ME’s answers to this question were that they enjoyed the non-native accent of the speaker. Other frequently remarked upon features, for all groups, were the kindness or self-assurance that the evaluator sensed from the speaker’s voice.
Negative Aspects
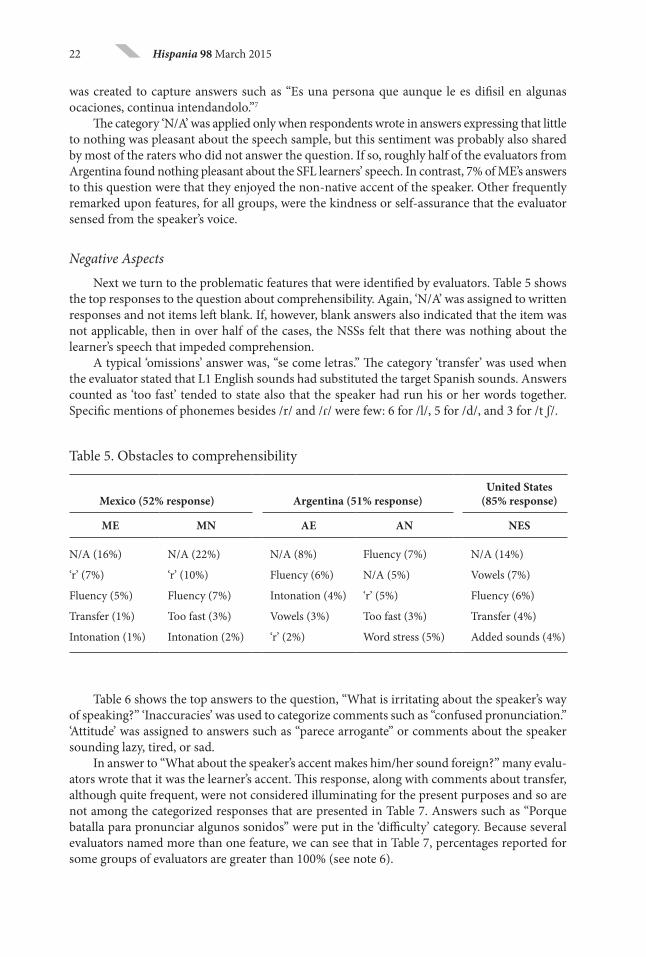
Next we turn to the problematic features that were identified by evaluators. Table 5 shows the top responses to the question about comprehensibility. Again, ‘N/A’ was assigned to written responses and not items left blank. If, however, blank answers also indicated that the item was not applicable, then in over half of the cases, the NSSs felt that there was nothing about the learner’s speech that impeded comprehension.
A typical ‘omissions’ answer was, “se come letras.” The category ‘transfer’ was used when the evaluator stated that L1 English sounds had substituted the target Spanish sounds. Answers counted as ‘too fast’ tended to state also that the speaker had run his or her words together. Specific mentions of phonemes besides /r/ and /ɾ/ were few: 6 for /l/, 5 for /d/, and 3 for /t ʃ/.
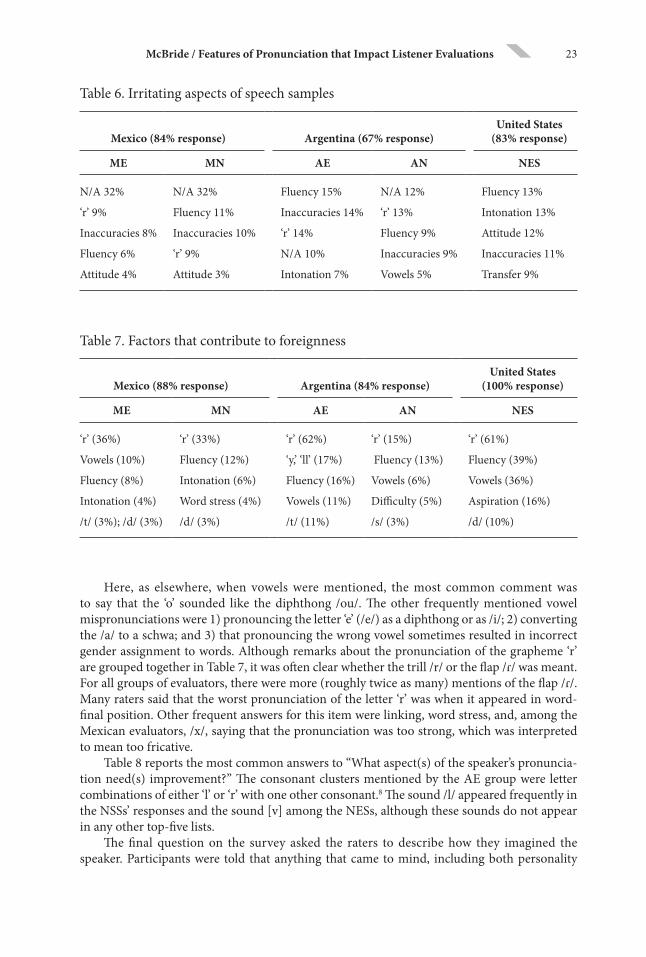
Table 6 shows the top answers to the question, “What is irritating about the speaker’s way of speaking?” ‘Inaccuracies’ was used to categorize comments such as “confused pronunciation.” ‘Attitude’ was assigned to answers such as “parece arrogante” or comments about the speaker sounding lazy, tired, or sad.
In answer to “What about the speaker’s accent makes him/her sound foreign?” many evalu-ators wrote that it was the learner’s accent. This response, along with comments about transfer, although quite frequent, were not considered illuminating for the present purposes and so are not among the categorized responses that are presented in Table 7. Answers such as “Porque batalla para pronunciar algunos sonidos” were put in the ‘difficulty’ category. Because several evaluators named more than one feature, we can see that in Table 7, percentages reported for some groups of evaluators are greater than 100% (see note 6).
Table 5. Obstacles to comprehensibility
Mexico (52% response) Argentina (51% response)United States
(85% response)
ME MN AE AN NES
N/A (16%) N/A (22%) N/A (8%) Fluency (7%) N/A (14%)
‘r’ (7%) ‘r’ (10%) Fluency (6%) N/A (5%) Vowels (7%)
Fluency (5%) Fluency (7%) Intonation (4%) ‘r’ (5%) Fluency (6%)
Transfer (1%) Too fast (3%) Vowels (3%) Too fast (3%) Transfer (4%)
Intonation (1%) Intonation (2%) ‘r’ (2%) Word stress (5%) Added sounds (4%)
23McBride / Features of Pronunciation that Impact Listener Evaluations
Table 6. Irritating aspects of speech samples
Mexico (84% response) Argentina (67% response)United States
(83% response)
ME MN AE AN NES
N/A 32% N/A 32% Fluency 15% N/A 12% Fluency 13%
‘r’ 9% Fluency 11% Inaccuracies 14% ‘r’ 13% Intonation 13%
Inaccuracies 8% Inaccuracies 10% ‘r’ 14% Fluency 9% Attitude 12%
Fluency 6% ‘r’ 9% N/A 10% Inaccuracies 9% Inaccuracies 11%
Attitude 4% Attitude 3% Intonation 7% Vowels 5% Transfer 9%
Table 7. Factors that contribute to foreignness
Mexico (88% response) Argentina (84% response)United States
(100% response)
ME MN AE AN NES
‘r’ (36%) ‘r’ (33%) ‘r’ (62%) ‘r’ (15%) ‘r’ (61%)
Vowels (10%) Fluency (12%) ‘y,’ ‘ll’ (17%) Fluency (13%) Fluency (39%)
Fluency (8%) Intonation (6%) Fluency (16%) Vowels (6%) Vowels (36%)
Intonation (4%) Word stress (4%) Vowels (11%) Difficulty (5%) Aspiration (16%)
/t/ (3%); /d/ (3%) /d/ (3%) /t/ (11%) /s/ (3%) /d/ (10%)
Here, as elsewhere, when vowels were mentioned, the most common comment was to say that the ‘o’ sounded like the diphthong /ou/. The other frequently mentioned vowel mispronunciations were 1) pronouncing the letter ‘e’ (/e/) as a diphthong or as /i/; 2) converting the /a/ to a schwa; and 3) that pronouncing the wrong vowel sometimes resulted in incorrect gender assignment to words. Although remarks about the pronunciation of the grapheme ‘r’ are grouped together in Table 7, it was often clear whether the trill /r/ or the flap /ɾ/ was meant. For all groups of evaluators, there were more (roughly twice as many) mentions of the flap /ɾ/. Many raters said that the worst pronunciation of the letter ‘r’ was when it appeared in word-final position. Other frequent answers for this item were linking, word stress, and, among the Mexican evaluators, /x/, saying that the pronunciation was too strong, which was interpreted to mean too fricative.
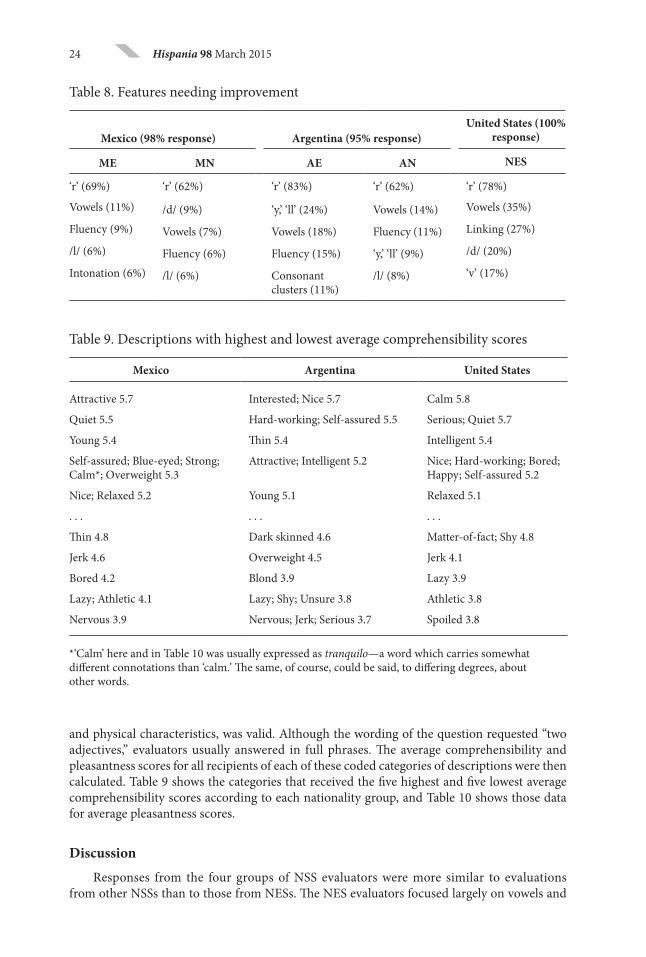
Table 8 reports the most common answers to “What aspect(s) of the speaker’s pronuncia-tion need(s) improvement?” The consonant clusters mentioned by the AE group were letter combinations of either ‘l’ or ‘r’ with one other consonant.8 The sound /l/ appeared frequently in the NSSs’ responses and the sound [v] among the NESs, although these sounds do not appear in any other top-five lists.
The final question on the survey asked the raters to describe how they imagined the speaker. Participants were told that anything that came to mind, including both personality
24 Hispania 98 March 2015
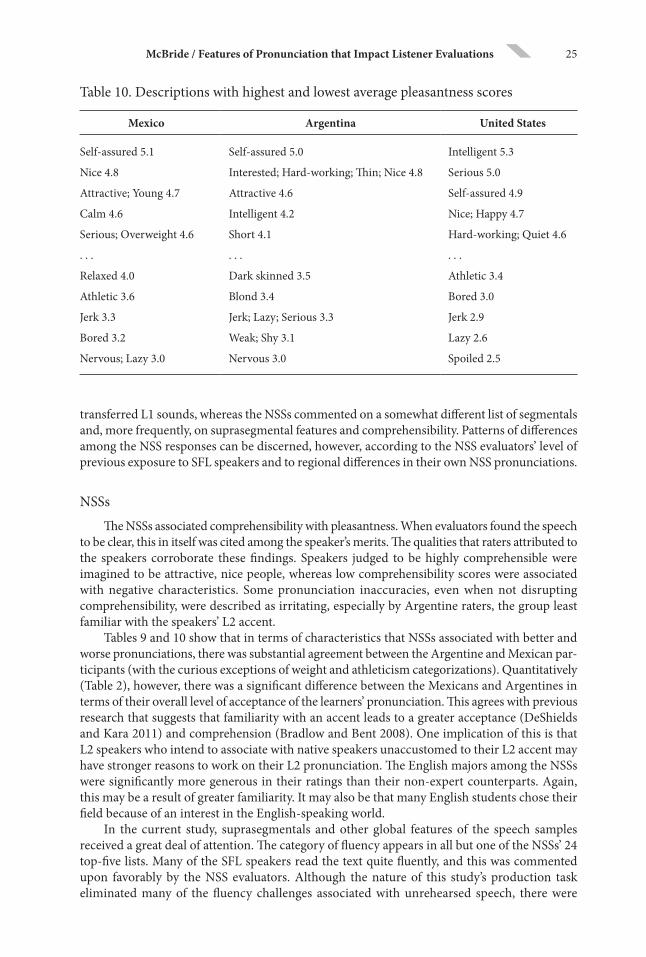
and physical characteristics, was valid. Although the wording of the question requested “two adjectives,” evaluators usually answered in full phrases. The average comprehensibility and pleasantness scores for all recipients of each of these coded categories of descriptions were then calculated. Table 9 shows the categories that received the five highest and five lowest average comprehensibility scores according to each nationality group, and Table 10 shows those data for average pleasantness scores.
Discussion
Responses from the four groups of NSS evaluators were more similar to evaluations from other NSSs than to those from NESs. The NES evaluators focused largely on vowels and
Table 9. Descriptions with highest and lowest average comprehensibility scores
Mexico Argentina United States
Attractive 5.7 Interested; Nice 5.7 Calm 5.8
Quiet 5.5 Hard-working; Self-assured 5.5 Serious; Quiet 5.7
Young 5.4 Thin 5.4 Intelligent 5.4
Self-assured; Blue-eyed; Strong; Calm*; Overweight 5.3
Attractive; Intelligent 5.2 Nice; Hard-working; Bored; Happy; Self-assured 5.2
Nice; Relaxed 5.2 Young 5.1 Relaxed 5.1
. . . . . . . . .
Thin 4.8 Dark skinned 4.6 Matter-of-fact; Shy 4.8
Jerk 4.6 Overweight 4.5 Jerk 4.1
Bored 4.2 Blond 3.9 Lazy 3.9
Lazy; Athletic 4.1 Lazy; Shy; Unsure 3.8 Athletic 3.8
Nervous 3.9 Nervous; Jerk; Serious 3.7 Spoiled 3.8
*‘Calm’ here and in Table 10 was usually expressed as tranquilo—a word which carries somewhat different connotations than ‘calm.’ The same, of course, could be said, to differing degrees, about other words.
Table 8. Features needing improvement
Mexico (98% response) Argentina (95% response) United States (100%
response)
ME MN AE AN NES
‘r’ (69%) ‘r’ (62%) ‘r’ (83%) ‘r’ (62%) ‘r’ (78%)
Vowels (11%) /d/ (9%) ‘y,’ ‘ll’ (24%) Vowels (14%) Vowels (35%)
Fluency (9%) Vowels (7%) Vowels (18%) Fluency (11%) Linking (27%)
/l/ (6%) Fluency (6%) Fluency (15%) ‘y,’ ‘ll’ (9%) /d/ (20%)
Intonation (6%) /l/ (6%) Consonant clusters (11%)
/l/ (8%) ‘v’ (17%)
25McBride / Features of Pronunciation that Impact Listener Evaluations
transferred L1 sounds, whereas the NSSs commented on a somewhat different list of segmentals and, more frequently, on suprasegmental features and comprehensibility. Patterns of differences among the NSS responses can be discerned, however, according to the NSS evaluators’ level of previous exposure to SFL speakers and to regional differences in their own NSS pronunciations.
NSSs
The NSSs associated comprehensibility with pleasantness. When evaluators found the speech to be clear, this in itself was cited among the speaker’s merits. The qualities that raters attributed to the speakers corroborate these findings. Speakers judged to be highly comprehensible were imagined to be attractive, nice people, whereas low comprehensibility scores were associated with negative characteristics. Some pronunciation inaccuracies, even when not disrupting comprehensibility, were described as irritating, especially by Argentine raters, the group least familiar with the speakers’ L2 accent.
Tables 9 and 10 show that in terms of characteristics that NSSs associated with better and worse pronunciations, there was substantial agreement between the Argentine and Mexican par-ticipants (with the curious exceptions of weight and athleticism categorizations). Quantitatively (Table 2), however, there was a significant difference between the Mexicans and Argentines in terms of their overall level of acceptance of the learners’ pronunciation. This agrees with previous research that suggests that familiarity with an accent leads to a greater acceptance (DeShields and Kara 2011) and comprehension (Bradlow and Bent 2008). One implication of this is that L2 speakers who intend to associate with native speakers unaccustomed to their L2 accent may have stronger reasons to work on their L2 pronunciation. The English majors among the NSSs were significantly more generous in their ratings than their non-expert counterparts. Again, this may be a result of greater familiarity. It may also be that many English students chose their field because of an interest in the English-speaking world.
In the current study, suprasegmentals and other global features of the speech samples received a great deal of attention. The category of fluency appears in all but one of the NSSs’ 24 top-five lists. Many of the SFL speakers read the text quite fluently, and this was commented upon favorably by the NSS evaluators. Although the nature of this study’s production task eliminated many of the fluency challenges associated with unrehearsed speech, there were
Table 10. Descriptions with highest and lowest average pleasantness scores
Mexico Argentina United States
Self-assured 5.1 Self-assured 5.0 Intelligent 5.3
Nice 4.8 Interested; Hard-working; Thin; Nice 4.8 Serious 5.0
Attractive; Young 4.7 Attractive 4.6 Self-assured 4.9
Calm 4.6 Intelligent 4.2 Nice; Happy 4.7
Serious; Overweight 4.6 Short 4.1 Hard-working; Quiet 4.6
. . . . . . . . .
Relaxed 4.0 Dark skinned 3.5 Athletic 3.4
Athletic 3.6 Blond 3.4 Bored 3.0
Jerk 3.3 Jerk; Lazy; Serious 3.3 Jerk 2.9
Bored 3.2 Weak; Shy 3.1 Lazy 2.6
Nervous; Lazy 3.0 Nervous 3.0 Spoiled 2.5
26 Hispania 98 March 2015
occasions in some recordings where the SFL speakers stumbled over a word or spoke haltingly. These disfluencies, although minor compared to how students at that level might otherwise speak when extemporizing, appear to have had a major impact on the NSSs’ perceptions; fluency is mentioned in all NSS groups’ top-five lists regarding obstacles to comprehensibility, irritating features, markers of foreignness, and aspects needing improvement.
Intonation was the second most commonly mentioned suprasegmental. Raters were also influenced by the related characteristics of voice quality and the attitude that they perceived in speakers. These latter speech characteristics are issues that are not normally mentioned in L2 pedagogical materials, but they have been discussed with respect to some groups of ESL students (Derwing 2008). Self-assurance, calmness, and sincere effort were responded to positively, while perceived boredom and arrogance provoked condemnation.
While suprasegmentals and other global characteristics dominated NSSs’ remarks about comprehensibility and pleasantness, segmental features received more of their attention when they listed foreign-sounding features. Pronunciations of the letter ‘r’ (especially tap /ɾ/) were the most important to the NSSs, appearing on every top-five list except in Table 4, about pleasant features, where it is absent. Although vowels were named by the NSSs as features marking foreignness and needing improvement, vowels were not identified as important obstacles to comprehensibility. This contrasts sharply with Schairer (1992), in which vowels were found to be overwhelmingly the most important feature. One possible explanation for this is that other factors, such as fluency, intonation, and the tap /ɾ/—some of the most frequently remarked upon features in the present study but which were not taken into account in Schairer—may correlate highly with the mispronunciation of vowels. If so, vowel pronunciation would have served as a proxy factor in Schairer’s regression analysis, picking up the variation that would have been attributed to other factors had they been included in the analysis. This points to a disadvantage in preselecting features when investigating speech perception.
According to the NSSs of this study, the segmentals that followed the pronunciation of the letter ‘r’ in importance were /d/ and /t/. The numerous mentions of /d/ are likely connected to the obligatory but not phonemic (that is, not representing minimal pairs) fricative-stop contrasts that also apply to /b/ and /g/, and, similarly, mentions of /t/ speak to the importance of repressing an English-like aspiration of /p, t, k/. The data contained mentions of /b, g, p, k/ as well, but these were considerably less frequent. These four phonemes were somewhat less numerous in the text that was read aloud. Another likely explanation for the greater focus on /d/ and /t/ is that, in addition to the Spanish-English contrasts just mentioned, these phonemes have a different point of articulation in Spanish (in which they are dental) and English (alveolar) (Schwegler and Kempff 2007: 143, 206). In fact, some NSS remarks on the SFL pronunciation of /d/ specified that the learners’ /d/ sounded like the alveolar flap /ɾ/ of ‘r.’
The other segmental that was frequently noted was the /l/, which in Spanish is never real-ized as the ‘dark l’ found in syllable-final position in English (Schwegler and Kempff 2007: 266). Transfer of this L2 pronunciation can in turn affect surrounding sounds. The surprising number of times that evaluators identified an ‘m’ as mispronounced appears to have been, in all cases, due to the influence of a mispronounced ‘l’ in the word alma.
Differences as to which features were named across nationalities were few. One striking dif-ference, however, was with ‘y’ and ‘ll,’ which Argentines pronounce differently from the majority of the Spanish-speaking world. Argentines not only labeled this as a signal of foreignness but also as a feature needing improvement. Similarly, although not to be found within top-five lists, some Mexicans complained that many learners’ /x/ was too strongly fricative. This phoneme is typically not strongly fricative in that region of Mexico (Lipski 2008: 86). Finally, mentions of learners’ ‘s’ were frequent in the AN raters’ list of foreign-sounding features. The few raters who explained said that the sound was held for too long.
27McBride / Features of Pronunciation that Impact Listener Evaluations
NESs
Like the NSSs, the NES evaluators attributed positive characteristics to the speakers with clearer accents. NESs remarked on rhythm less and segmentals more than their NSS counterparts. Top among the segmentals were vowels, in contrast with the NSSs. This is likely a byproduct of the NESs’ training: having been instructed that vowel pronunciation is essential to good Span-ish pronunciation (e.g., Schwegler and Kempff 2007), they assumed that it heavily impacted comprehensibility. This assumption may also have come from their experiences with non-native speakers of English. Since mispronounced vowels can seriously reduce comprehensibility in English (Jenkins 2002), the NESs may have assumed the same was true in SFL. Two other sounds that the NESs often mentioned were the [v] pronunciation of the grapheme ‘v’ and the error of pronouncing the letter ‘h.’ These are features the NSSs mentioned rarely. Since many NSSs find it difficult to distinguish between [v] and [b] when they learn English (Avery and Ehrlich 1992: 149), it may be that few NSSs can detect this error in Spanish.
Since NES raters shared the SFL learners’ L1 and were SFL instructors at the learners’ university, they were very familiar with the pronunciation of this group and had little difficulty understanding the recordings. Therefore the features that they listed as obstacles to comprehen-sibility were largely conjectures on their part. The evidence suggests that the NESs judged the L2 speech against a list of features of Spanish phonology that they, as advanced speakers and teachers of SFL, were aware of. This helps to explain why, in keeping with previous research, non-native speakers in this study focused more on details of form and less on issues of comprehensibility.
As for the questionnaire item about personal attributes, differences between evaluator groups appear to have more to do with peer status than with native status. The NESs had reason to imagine the L2 speakers as potential students of theirs, while the NSSs, being fellow college students, may have imagined the L2 speakers as potential classmates and friends. NSSs made numerous comments about the speakers’ level of attractiveness, while NESs made no such observations. NESs focused instead on intelligence, effort, and seriousness. They also, like many teachers might, detected some boredom in the best performing students but found their boredom irritating.
Limitations and Future Research
Findings would have been more potentially generalizable if there were a similar number of NES raters as NSSs. It is possible that the three NES raters displayed a high degree of agree-ment in their evaluations as a result of working on the same teaching team. SFL teachers from other institutions might focus on a somewhat different set of features. It would be interesting to investigate the ways in which the beliefs of non-native L2 teachers, across institutions, vary in terms of what they value most in L2 pronunciation.
The effect of the experimental task should also be further explored. While studies of accent perception typically rely on read texts, it would be important to see how results vary with a change in the type of text or with spontaneous speech. Using spontaneous speech would likely result in speech samples that varied much more in terms of fluency, and this, along with the speakers’ word choice and differing grammaticality, could impact evaluators’ perception of pronunciation.
Teaching Implications
The most fundamental implication of the results of this study is that L2 pronunciation mat-ters, not only in terms of comprehensibility, but because it has a serious impact on native and non-native speakers’ initial impression of the speaker. The findings summarized in Tables 9 and
28 Hispania 98 March 2015
10 demonstrate that negative personality characteristics are frequently attributed to L2 speakers with inaccurate or unpleasant pronunciation. Sharing this information with L2 learners may help them to understand the importance of improving their pronunciation.
SFL pronunciation instruction has tended to focus on segmentals (Arteaga 2000). This study, however, indicates that—as has been found in ESL studies (e.g., Derwing, Munro, and Wiebe 1998)—suprasegmentals and global speech characteristics heavily impact listeners’ perceptions. The high frequency with which fluency was mentioned by NSSs—despite the fact that the speech samples were of rehearsed speech—suggests that fluency plays an important role in shaping native speakers’ perception of SFL speech. Fluency promotion activities such as the ones described in Derwing, Munro, and Wiebe (1998) and Rossiter et al. (2010) might be adapted to target SFL fluency. Because some of these activities involve formulaic expressions and mimicry, they may strike some teachers as incompatible with communicative teaching practices, but Iruela (2007) and Rossiter et al. (2010) argue convincingly that this is not the case.
Also striking in the present study was the extent to which evaluators reacted to the attitudes that they perceived in the L2 speakers’ voices. This factor is rarely mentioned in pronunciation teaching materials but appears to merit some attention. If not reminded of the importance of the overall quality of their speech, students may focus too exclusively on very fine details, which can be damaging to fluency (Derwing, Munro, and Wiebe 1998; Iruela 2007).
Virtually every contrastive sound difference between Spanish and English appeared at least once in the data. This means that in order to remove all markers of a non-native pronunciation, all such sounds would eventually need to be attended to. L2 learners are not, however, and cannot become monolingual native speakers of their target language. Reasonable and useful learning goals will be those that most promote successful communication via the L2. The present study has helped to identify which features of SFL pronunciation can be most important in achieving such goals.
ACKNOWLEDGEMENTS
This study was supported by Saint Louis University’s Summer Research and Mellon Faculty Development Grants. Many thanks to research assistants Mariela López and Haley Jacobson, Nolvia Cortez in Mexico, and Lidia Soler in Argentina for their assistance in conducting the study and ideas on how to proceed. I am also indebted to all of the study’s participants, the cooperating university instructors, and several consultants from the three regions involved.
NOTES1 ‘SFL’ is used here to mean specifically native English speakers from the United States. 2 The actor had been professionally trained to speak in a dialect-neutral style (Scott Tinetti, Senior
Director of Development, World Languages, McGraw-Hill, email message to author, September 6, 2013).3 Whereas the Mexican university required all undergraduate students to take English, no such
requirement existed at the Argentine university. This made recruiting large numbers of AN students from beginning ESL classes impossible.
4 Among these are 1) while the Mexican participants would be expected to produce most syllable final /-s/ with a full sibilant pronunciation ([s]), the Argentines frequently elide or aspirate ([h]) it; 2) the graphemes ‘y’ and ‘ll’ represent the sound [ ʝ] for the Mexican population but [ʃ], [tʃ], [ʒ] or [dʒ] for most Argentines; 3) the phoneme /x/ in Mexican Spanish tends to be less strongly fricative than in other Spanish dialects, including the Argentine dialects; 4) vowel nasalization and vowel reduction are common processes in Mexico but not in Argentina; and 5) there exist dramatic differences in the typical intonation patterns of these two groups (Schwegler and Kempff 2007).
5 When a new evaluator listened to an mp3 player, the next recording up would play, further random-izing the order in which recordings were heard.
29McBride / Features of Pronunciation that Impact Listener Evaluations
6 Percentages were calculated by dividing the total number of one kind of answer by the total number of evaluation sheets from that group, whether or not an answer for that particular question was written.
7 Comments are reproduced as originally written, including errors.8 Argentine English instructors consulted confirmed that these are taught explicitly in English
classes there.
WORKS CITED
Al-Hindawe, Jayne. (1996). “Considerations When Constructing a Semantic Differential Scale.” La Trobe Papers in Linguistics 9.7: 1–9. Print.
Arteaga, Deborah (2000). “Articulatory Phonetics in the First-Year Spanish Classroom.” Modern Language Journal 84.3: 339–54. Print.
Avery, Peter, and Susan Ehrlich. (1992). Teaching American English Pronunciation. New York: Oxford UP. Print.
Bergen, John. (1974). “A Practical Framework for Teaching Pronunciation in Beginning Spanish Courses.” Hispania 57.3: 479–83. Print.
Bradlow, Ann, and Tessa Bent. (2008). “Perceptual Adaptation to Non-native Speech. Cognition 106: 707–29. Print.
Bresnahan, Mary Jiang, Rie Ohashi, Wen Ying Liu, Reiko Nebashi, and Sachiyo Morinaga Shearman. (2002). “Attitudinal and Affective Response toward Accented English.” Language and Communication 22: 171–85. Print.
Cargile, Aaron Catelan, and Howard Giles. (1998). “Language Attitudes toward Varieties of English: An American-Japanese Context.” Journal of Applied Communication Research 26: 338–56. Print.
Cunningham-Andersson, Una. (1997). “Native Speaker Reactions to Non-native Speech.” Second-Language Speech. Ed. Allan James and Jonathan Leather. New York: Gruyter. 133–44. Print.
Derwing, Tracey. (2008). “Second Language Phonology in Optimality Theory.” Phonology and Second Language Acquisition. Ed. Jette G. Edwards Hansen and Mary L. Zampini. Amsterdam: Benjamins. 347–69. Print.
Derwing, Tracey, and Murray Munro. (2009). “Putting Accent in Its Place: Rethinking Obstacles to Commun ication.” Language Teaching 42.4: 476–90. Print.
———. (2010). “Comprehensibility as a Factor in Listener Interaction Preferences: Implications for the Workplace.” Canadian Modern Language Review 66.2: 181–202. Print.
Derwing, Tracey, Murray Munro, and Grace Wiebe. (1998). “Evidence in Favor of a Broad Framework for Pronunciation Instruction.” Language Learning 48.3: 393–410. Print.
DeShields, Oscar, and Ali Kara. (2011). “The Varying Influence of Spokesperson’s Accent in Commun-ication Effectiveness: A Comparative Study in Two Different Regions of Mexico.” Journal of Targeting, Measurement and Analysis for Marketing 19.1: 55–65. Print.
Elliott, A. Raymond. (1997). “On the Teaching and Acquisition of Pronunciation within a Communicative Approach.” Hispania 80.1: 95–108. Print.
Fayer, Joan, and Emily Krasinski. (1987). “Native and Nonnative Judgments of Intelligibility and Irritation.” Language Learning 37: 313–26. Print.
Flege, Emil, and Katheryn Fletcher. (1992). “Talker and Listener Effects on Degree of Perceived Foreign Accents.” Journal of the Acoustical Society of America 91: 370–89. Print.
Flege, James E., Murray J. Munro, and Ian R. A. MacKay. (1995). “Talker and Listener Effects on Degree of Perceived Foreign Accents.” Journal of the Acoustical Society of America 91: 370–89. Print.
Garrett, Peter, Nikolas Coupland, and Angie Williams. (2003). Investigating Language Attitudes: Social Meanings of Dialect, Ethnicity and Performance. Llandybie, Great Britain: Dinefwr. Print.
Gatbonton, Elizabeth, Pavel Trofimovich, and Michael Magid. (2005). “Learners’ Ethnic Group Affiliation and L2 Pronunciation Accuracy: A Sociolinguistic Investigation.” TESOL Quarterly 39.3: 489–511. Print.
Golombek, Paula, and Stefanie Rehn Jordan. (2005). “Becoming ‘Black Lambs’ Not ‘Parrots’: A Poststruc-turalist Orientation to Intelligibility and Identity.” TESOL Quarterly 39.3: 513–33. Print.
Hayes-Harb, Rachel, and Johanna Watzinger-Tharp. (2012). “Accent, Intelligibility, and the Role of the Listener: Perceptions of English-Accented German by Native German Speakers.” Foreign Language Annals 45.2: 260–82. Print.
Iruela, Augustín. (2007). “Principios didácticos para la enseñanza de la pronunciación en lenguas extran-jeras.” MarcoELE Revista de didáctica 4. Web. 23 Oct. 2014.
30 Hispania 98 March 2015
Jenkins, Jennifer. (2002). “A Sociolinguistically Based, Empirically Researched Pronunciation Syllabus for English as an International Language.” Applied Linguistics 23.1: 83–103. Print.
Kang, Okim. (2012). “Impact of Rater Characteristics and Prosodic Features of Speaker Accentedness on Ratings of International Teaching Assistants’ Oral Performance.” Language Assessment Quarterly 9: 249–69. Print.
Levis, John. (2005). “Changing Contexts and Shifting Paradigms in Pronunciation Teaching.” TESOL Quarterly 39.3: 369–77. Print.
Lippi-Green, Rosina. (1997). English with an Accent. New York: Routledge. Print. Lipski, John. (2008). Varieties of Spanish in the United States. Washington, DC: Georgetown UP. Print. Llurda, Enric. (2000). “Effects of Intelligibility and Speaking Rate on Judgments of Non-Native Speakers’
Personalities.” IRAL 38: 289–99. Print. Lord, Gillian. (2005). “(How) Can We Teach Foreign Language Pronunciation? On the Effects of a Spanish
Phonetics Course.” Hispania 88.3: 557–67. Print.Miles, Matthew, and A. Michael Huberman. (1994). Qualitative Data Analysis. Thousand Oaks: Sage. Print. Moyer, Alene. (1999). “Ultimate Attainment in L2 Phonology: The Critical Factors of Age, Motivation and
Instruction.” Studies in Second Language Acquisition 21: 81–108. Print.———. (2004). Age, Accent and Experience in Second Language Acquisition. Buffalo: Multilingual. Print.Munro, Murray. (2008). “Foreign Accent and Speech Intelligibility.” Phonology and Second Language Acqui-
sition. Ed. Jette G. Edwards Hansen and Mary L. Zampini. Amsterdam: Benjamins. 199–224. Print. Munro, Murray, and Tracey Derwing. (2006). “The Functional Load Principle in ESL Pronunciation
Instruction: An Exploratory Study.” System 34: 520–31. Print.Rossiter, Marian. (2009). “Perceptions of L2 Fluency by Native and Non-native Speakers of English.”
Canadian Modern Language Review 65.3: 395–412. Print. Rossiter, Marian, et al. (2010). “Oral Fluency: The Neglected Component in the Communicative Language
Classroom.” The Canadian Modern Language Review 66.4: 583–606. Print. Schairer, Karen. (1992). “Native Speaker Reaction to Non-native Speech.” Modern Language Journal 76.3:
309–19. Print. Schwegler, Armin, and Juergen Kempff. (2007). Fonética y fonología españolas. Hoboken: Wiley. Print. Terrell, Tracy D, Magdalena Andrade, Jeanne Egasse, and Elías Miguel Muñoz. (2006). Dos mundos:
En breve. New York: McGraw. Print. Tinetti, Scott. Email to the author. 6 Sept. 2013.Trofimovich, Pavel, and Talia Isaacs. (2012). “Disentangling Accent from Comprehensibility.” Bilingualism:
Language and Cognition 15.4: 905–16. Print.
APPENDIX
The selection of Rubén Darío’s “Versos sencillos” that the learners read:
Yo soy un hombre sinceroDe donde crece la palma, Y antes de morirme quieroEchar mis versos del alma.
Yo vengo de todas partesY hacia todas partes voy:Arte soy entre las artes.En los montes, monte soy.
Oigo un suspiro, a travésDe las tierras y la mar,Y no es un suspiro, —esQue mi hijo va a despertar.
Con los pobres de la tierraQuiero yo mi suerte echarEl arroyo de la sierraMe complace más que el mar.
Related Documents