University of Pennsylvania From the SelectedWorks of Grace Kao 2008 Where are all the Boys? Examining the Black Gender Gap in Post-Secondary Aainment Rachelle Brunn, Virginia Polytechnic Institute and State University Grace Kao, University of Pennsylvania Available at: hp://works.bepress.com/grace_kao/33/

Welcome message from author
This document is posted to help you gain knowledge. Please leave a comment to let me know what you think about it! Share it to your friends and learn new things together.
Transcript
University of Pennsylvania
From the SelectedWorks of Grace Kao
2008
Where are all the Boys? Examining the BlackGender Gap in Post-Secondary AttainmentRachelle Brunn, Virginia Polytechnic Institute and State UniversityGrace Kao, University of Pennsylvania
Available at: http://works.bepress.com/grace_kao/33/
STATE OF THE ART
WHERE ARE ALL THE BOYS?Examining the Black-White Gender Gap inPostsecondary Attainment1
Rachelle BrunnRobert F. Wagner Graduate School of Public Service, New York University
Grace KaoDepartment of Sociology, University of Pennsylvania
Abstract
We explore the gender gap in college completion among Blacks and Whites. Using theNational Education Longitudinal Study of 1988, we examine how early school achievementand educational expectations affect attainment by following a nationally representativesample of youths from 1988 (approximately age fourteen) to 2000 (approximately agetwenty-six). The odds of attaining an associate’s or a bachelor’s degree among Blackwomen are greater than the odds among White men after controlling for familysocioeconomic status. However, the difference between Black men and White men isadditionally dependent on differences in middle school and high school achievement andin high school sequencing.
Keywords: Race, Gender, Higher Education, Degree Attainment, Achievement
INTRODUCTION
The race-gender gap in higher education has received extensive media attention inrecent years. On March 3, 2003, Newsweek ran a cover story, “The Black GenderGap,” which argued that Black women are outstripping Black men educationally.Though the article presented statistics about the percentage of young Black men andwomen attending college, 25% and 35%, respectively, it does not explain the causesof this disparity in rates of college attendance, opting instead to focus on the conse-quences for the marriage market of Black women.
Although the gender gap in college enrollment and degree attainment is evidentamong all racial-ethnic groups, the gender gap is most pronounced among raciallystigmatized groups ~Lopez 2003!. More specifically, Cathy Cohen and Claire Nee~2000! have argued that the gender differential is most extreme among Black stu-
Du Bois Review, 5:1 (2008) 137–160.© 2008 W. E. B. Du Bois Institute for African and African American Research 1742-058X008 $15.00doi:10.10170S1742058X08080077
137
dents.2 In addition to this, the gender gap in postsecondary enrollment and degreeattainment became evident in Black communities before it became visible in otherracial-ethnic communities. In fact, when discussing the implications of trends inbachelor’s degrees awarded in 1975076 and 1980081, William Trent ~1991! warned ofan impending “feminization of education” among Blacks.
The Census Bureau began regularly tracking bachelor’s degree recipients by raceand gender in 1976077. At that time, Black women earned approximately 57% of allbachelor’s degrees conferred to Blacks ~Cross 1999!. In contrast, during the sameperiod, White women earned 46% of all bachelor’s degrees conferred to Whites~authors’ calculation from the Digest of Education Statistics 2005, Snyder et al., 2006!.3
The corresponding figure for Hispanic and Asian women is approximately 45%. Theenrollment rates during this period follow the same general pattern. Black womencomposed approximately 54% of Black undergraduates enrolled in degree-grantinginstitutions in the United States in 1976. This is compared to 48% for Whitewomen, and 46% for Hispanic and Asian women ~authors’ calculations from Digest ofEducation Statistics 2002, Snyder 2002!.4
By 199902000, Black women composed approximately 63% of all Black studentsattending college. In contrast, White women composed 56% of all White studentsenrolled in institutions of higher education ~Snyder 2002!.5 The correspondingpercentages for Hispanic and Asian women were 57% and 52%, respectively. Moredramatically, Gniesha Dinwiddie and Walter Allen ~2003! found that Black womenenrolled in colleges and universities at roughly twice the rate of Black men. DouglasMassey et al. ~2003! and Michael Nettles and Laura Perna ~1997! also documentedthis pattern at selective colleges and universities.
In this paper, we examine how the gender gap in degree attainment occursamong Black males and females compared to White males and females. To do this,we examine the process of stratification from eighth grade to the completion ofcollege. Using the National Education Longitudinal Study of 1988 ~NELS!, weanalyze how early school experiences lead to divergent college completion patterns.While we are most interested in the gender gap among Black students, we compareBlack students to White students in order to understand if and how the gender gapamong Blacks differs from the gender gap among Whites.
Our paper begins by summarizing trends in degree attainment and reviewingresearch that addresses racial and ethnic differences in the educational outcomes ofstudents, focusing primarily on the postsecondary experiences of Black students.Then we review studies that highlight the experiences of women in institutions ofhigher education. It is noteworthy that few studies have explored the intersection ofrace and gender among students in the context of higher education. This is highlyproblematic given that prior research ~Trent 1984! has shown that failing to disag-gregate degree recipients by race and sex can lead to erroneous interpretations oftrends in degree attainment. Our paper contributes to the literature by examiningdegree attainment at the intersection of race and gender.
Next, we introduce our theoretical framework, describe our data, and reviewdescriptive analyses of school performance, educational aspirations, and teachers’expectations early in the youths’ educational careers. We then present logistic regres-sion models that examine how grade point averages in eighth, tenth, and twelfthgrades, and students’ expectations ~as well as teachers’ expectations of students intenth grade! affect the odds of attaining at least an associate’s degree or a bachelor’sdegree by December 2000. Students who graduated from high school on time wouldhave received their diploma eight and a half years prior ~in 1992!. This is very crucial,as Clifford Adelman ~1998! has argued that when measuring degree attainment,
Rachelle Brunn and Grace Kao
138 DU BOIS REVIEW: SOCIAL SCIENCE RESEARCH ON RACE 5:1, 2008
researchers should analyze receipt more than five or six years after college enroll-ment. Lastly, we discuss the implications of our findings.
LITERATURE REVIEW
Degree Attainment
Using the Integrated Postsecondary Education Data System ~IPEDS!, Nettles andPerna ~1997! document that nationally, the percentage of students receiving associate’sdegrees increased by about 34% from 1976077 to 1993094. Similarly, the percentageof African Americans who received associate’s degrees grew 37% between 1976 and1994. However, these changes do not reflect the gender imbalance in degree attain-ment. While the percentage of associate’s degrees awarded to African Americanwomen increased by approximately 60%, there was only an 11% increase for AfricanAmerican men ~Nettles and Perna, 1997!.
The percentage of associate’s degrees awarded in the United States has increasedby approximately 1% each year between 1991 and 1996. The percentage awarded tominorities has grown by approximately 7% each year during the same time period~Chenoweth 1998!. More specifically, Karin Chenoweth ~1998! illustrated that ratesof associate’s degree attainment increased 6% each year for African Americans, 7%for Native Americans, 8% for Hispanics, and 10% for Asian Americans. In contrast,the percentage of Whites earning associate’s degrees increased by less than 1% eachyear, and the percentage earning bachelor’s degrees declined by approximately 1%each year ~Chenoweth 1998!.
Bachelor’s degree completion rates have also increased in recent years, withfemales’ rates showing the most growth ~Trusty and Niles, 2004!. Nationwide, thepercentage of students receiving bachelor’s degrees in the United States in 1993094increased by 27% from 1976077. The percentage of bachelor’s degrees awarded toBlack students increased by 40%. However, the percentage of bachelor’s degreesawarded to Black men only increased by 20%, while the percentage awarded to Blackwomen increased by 55% ~Nettles and Perna, 1997!.
Jerry Trusty and Spencer Niles ~2004! examined the factors that lead to thesuccessful completion of a bachelor’s degree, which they defined as realized potential.Failing to earn a bachelor’s degree was defined as lost talent. Their sample wascomposed of students from NELS who fit two criteria: ~1! the students scored abovethe mean on reading and math cognitive-ability tests, and ~2! the students expectedto attain a bachelor’s degree or more education. Among the students in the sample,64% had completed a bachelor’s degree by 2000 ~Trusty and Niles 2004!. Trusty andNiles ~2004! concluded that even after controlling for variables related to degreeattainment—such as race0ethnicity, socioeconomic status, high school behaviors,and parental behaviors—female students continued to be more likely than malestudents to realize their potential. They also found that Asian Americans were morelikely than Latinos, Blacks, and Whites to earn a bachelor’s degree.
Trusty and Niles ~2004! discovered that background variables explain 11% of thevariability in bachelor’s degree attainment. High school variables explain an addi-tional 22%. They document that a one standard deviation in socioeconomic statusresults in a 64% increase in the likelihood of earning a bachelor’s degree in 2000,concluding: “Our results support the contention that the paths toward realizedpotential or lost talent diverge early in students’ educational careers” ~Trusty andNiles, 2004, p. 12!. They also concluded that the effects of high school variables intheir study were stronger for their sample of students who evidenced above-average
Where Are All the Boys?
DU BOIS REVIEW: SOCIAL SCIENCE RESEARCH ON RACE 5:1, 2008 139
ability early in their educational careers than for the general sample of “college-attending degree-seeking” participants in Trusty’s ~2004! study.
Black Students’ Access to Higher Education and Degree Attainment
Some researchers have focused on the changes in access to higher education anddegree completion among Blacks and Whites over the past several decades. Accord-ing to Robert Hauser and Douglas Anderson ~1991!, Black students’ college enroll-ment declined from 1977 to the mid-1980s while White students’ college enrollmentgrew rapidly. The authors investigated whether a change in Black and0or Whitestudents’ aspirations might explain this decline, but they did not find differences inaspirations between Black seniors and White seniors or between Black women andBlack men.
In their review of the research on racial and ethnic stratification of educationalattainment, Grace Kao and Jennifer Thompson ~2003! asserted that Black studentsare less likely than White students to make the immediate transition from highschool to college. Laura Walter Perna and Marvin Titus ~2005! also found thatBlacks are less likely than Whites to enroll in a four-year or a two-year college in thefall immediately following high school graduation. They concluded that Blacks’lower enrollment is due to their lower levels of human, economic, and culturalcapital and the reduced prevalence of social networks that provide resources topromote enrollment in their high schools. In an earlier paper, Perna ~2000! con-cluded that after controlling for factors related to college enrollment, such as gender,costs, benefits, financial resources, and academic ability, Black students were morelikely than White students to enroll in a four-year institution immediately aftergraduating from high school.
In The Shape of the River ~1998!, William Bowen and Derek Bok argued thatBlack students perform below the levels predicted by their SAT scores, and thedegree of underperformance increases as SAT scores rise. Extant research has alsohighlighted the effects of Black students’ lower grades on persistence. In their studyof undergraduates enrolled in four-year public postsecondary institutions in Indiana,Shouping Hu and Edward St. John ~2001! concluded that the persistence rate forBlack students declined modestly in the early 1990s. They argued that differences inundergraduate grades help to explain differences in persistence rates between Black,Hispanic, and White students. Other researchers have suggested that students’ classbackgrounds interact with race to influence persistence. Michael Paulsen and EdwardSt. John ~2002! argued that poor and working-class Black students ~but not middle-and upper-class Black students! were more likely to persist in college than theirWhite counterparts.
In their review of the research on educational achievement and attainment, Kaoand Thompson ~2003! reported that Black students take longer to complete collegethan White students. Similarly, Nettles and Perna ~1997! have argued that less than20% of Black men and less than 33% of Black women complete their bachelor’sdegree in four years. The authors also concluded that Blacks are less likely thanWhites to receive their degrees from prestigious research institutions. Kao andThompson ~2003! found that racial and ethnic minorities are also more likely thanWhites to attend community colleges. In addition to this, Black students are morelikely to drop out of college ~Nettles and Perna, 1997!. In their study of freshmenenrolled at the University of Minnesota in 1991, Stephen DesJardins et al. ~2002!argued that students who took time off from college were more likely to be male orfrom underrepresented minority groups. This is problematic given that the authors
Rachelle Brunn and Grace Kao
140 DU BOIS REVIEW: SOCIAL SCIENCE RESEARCH ON RACE 5:1, 2008
noted that only a very small percentage of students that discontinued their enroll-ment more than once eventually graduated from college.
There are many possible explanations for the racial gap in attainment as describedabove. Christopher Jencks and Meredith Phillips ~1998! found that when they usethe High School and Beyond data set to analyze the graduation rates of Blacks andWhites who have the same twelfth-grade test scores, Blacks are more likely thanWhites to complete college. Blacks’ relative advantage is even greater when theycompare Blacks and Whites with the same socioeconomic status. This indicates thatat least some of the disadvantage that Blacks face in baccalaureate attainment is dueto lower grades and parents’ inability to pay for college.6 This conclusion is sup-ported by researchers who have demonstrated that larger percentages of Black stu-dents ~as compared to Whites! come from lower-class or middle-class backgrounds~Hu and St. John, 2001; St. John et al., 2005!. Blacks are also more likely than Whitesto be financially independent and to have mothers with less than a bachelor’s degree~St. John et al., 2005!. Additionally, Hu and St. John ~2001! discovered that Blackstudents were more likely than White students to earn grades of C or below. Despitetheir lower grade point averages, Black students continue to have high educationalaspirations. Zhenchao Qian and Sampson Lee Blair ~1999! illustrated that educa-tional performance has less effect on the educational aspirations of Black studentsthan it has on White, Hispanic, or Asian students.
Female Students’ Access to Higher Education and Degree Attainment
Andrew Hacker ~2003! argued that, in general, females earn higher grades thanmales, outnumber males in advanced placement classes, and are more likely thanmales to attend college. There is some evidence that these differences may be due, inpart, to stereotype threat. Douglas Massey and Mary Fischer ~2005! have assertedthat males are more likely to internalize negative stereotypes than females. Theyhave also argued that this internalization causes male students to disidentify withschool which leads them to study less. Males are also more likely to experienceperformance burden which increases text anxiety and lowers academic achievement~Massey and Fischer, 2005!. Hacker ~2003! has not interrogated the interactionbetween race-gender differences, but he has investigated the role of class. His resultssuggested that as family income decreases, the relative share of female students whotake the SAT increases. He suggested that one reason for this trend may be theoverrepresentation of female-headed households at lower income levels. ~Hackerposits that females may have less influence over their sons.! This finding is especiallyrelevant to Black students because they disproportionately come from families withthe aforementioned demographic characteristics. In addition to this, Roslyn ArlinMickelson ~1990! concluded that being female is much more important in determin-ing the academic achievement of Black students than White students.
David Karen ~1991! found that although more women than men have graduatedfrom high school since 1870, women’s enrollments in higher education did notsurpass men’s until 1979.7 He argued that women’s participation in higher educationfollows a different pattern from that of other subordinate groups because they growup in the same households and share the same social backgrounds as men. Never-theless, we argue that men and women may experience being from the same socialbackground in different ways. Previous research has supported this claim. For exam-ple, Claudia Buchmann and Thomas DiPrete ~2006! concluded that the effect offathers’ education on college completion was more important for girls than boysprior to the 1950s, but that currently fathers’ education is more important for boys.
Where Are All the Boys?
DU BOIS REVIEW: SOCIAL SCIENCE RESEARCH ON RACE 5:1, 2008 141
Other researchers have also highlighted the superior educational outcomes offemale students. Cohen and Nee ~2000! illustrated that Black enrollment in highereducation is at an all-time high. However, when they examined the educationaltrends of Black students more closely, they found increasing postsecondary attain-ment for females “in the midst of declining, stagnating, and at best minimal increasesin the educational achievement of their male counterparts” ~Cohen and Nee, 2000,p. 1176!.8 St. John et al. ~2005! also noted that compared to White students, a largershare of Black students are female. This is in spite of the fact that Black women relyon financial aid more than their male counterparts because they are more likely to befinancially independent from their families and responsible for dependents ~Cohenand Nee, 2000!. Black women are also more likely to come from families where theirparents had secured at most a high school diploma. Finally, Nettles and Perna ~1997!have argued that approximately twice as many Black women ~as compared to Blackmen! receive bachelor’s degrees and master’s degrees annually, even though Blackwomen have lower SAT scores and are more likely to be first-generation collegestudents than Black men. Cohen and Nee ~2000! reviewed research that has tried toexplain the gender gap in Black enrollment, but they do not find satisfactoryexplanations.
Although it is beyond the scope of this paper, it is worth noting that extantresearch has highlighted how neighborhood characteristics may differentially affectthe educational outcomes of males and females. The results are mixed. Doris Entwisleet al. ~1994! concluded that neighborhood resources have a greater impact on boys’math scores than on girls’. Similarly, Jonathan Crane ~1991! found that having moreresidents in a neighborhood who worked in professional or managerial occupationsdecreased the likelihood that Black males would drop out of school, but he did notobserve the same effect among Black females.9 However, in their investigation of theeffects of neighborhood minority concentration, violence, and disorder on academicachievement among minority students at selective colleges and universities, NicholasEhrmann and Douglas Massey ~2008! have discovered that while males are morelikely to be exposed to neighborhood violence and disorder, the effects of exposureare more prevalent among female students.
THEORETICAL FRAMEWORK
The blocked-opportunities framework ~Hanson 1994; Kao and Tienda, 1998; Mick-elson 1990! posits that a significant number of youths are talented and motivated butdo not achieve because of structural barriers and their placement in the stratificationsystem. Similarly, Walter Allen and Daniel Solorzano ~2001! have argued that one ofthe biggest barriers to the success of Black college students is the cumulative disad-vantage they face from institutional racism and blocked opportunities while concur-rently being expected to achieve within educational institutions that do not addressthis legacy of racial stratification. Other scholars have asserted that schools actuallyreinforce larger societal patterns of inequality. For example, Sandra Hanson ~1994!has argued that educational systems replicate the status quo by using external crite-ria, such as gender, race, and class, in order to select out youths who will be successfuland to lower the educational aspirations of those who will not be successful.
In their seminal work, Schooling in Capitalist America, Samuel Bowles and Her-bert Gintis ~1976! argued that schools reinforce patterns of race, class, and genderinequality created by capitalism. In this paper, we examine teachers’ educationalexpectations for students as one example of how schools and school personnel can
Rachelle Brunn and Grace Kao
142 DU BOIS REVIEW: SOCIAL SCIENCE RESEARCH ON RACE 5:1, 2008
affect students’ educational expectations and subsequent degree attainment. Scholarshave criticized Bowles and Gintis ~1976! for failing to account for how students fromthe same socioeconomic background can have different cultural orientations towardseducation ~MacLeod 1995!. In this paper, we argue that gender may be one factorthat may affect the degree attainment of students from the same social-classbackground.
Previous research has documented the importance of teachers’ expectations andevaluations of students. For example, Ronald Ehrenberg et al. ~1995! found thatBlack, Hispanic, and White female students were rated more highly than their malecounterparts in each subject area. In their analysis of teacher-student bonding, Rob-ert Crosnoe et al. ~2004! asserted that students who had more positive relationshipswith their teachers did better in school and had fewer disciplinary problems. Becausethe authors observed that boys and children of color had lower levels of teacher-student bonding, they concluded that minority boys may be the most at risk ofalienation in school. Ann Arnett Ferguson ~2001! and Nancy Lopez ~2003! alsoreported that boys were punished much more often than were girls, and they werepunished more severely than girls for breaking the same rules. These results lead usto conclude that teachers may be less likely to think that boys will attend college andthat this negative evaluation may have an effect on boys’ lower likelihood of degreeattainment.
Other researchers have focused on how family socioeconomic status has influ-enced students’ degree attainment. Scholars working in the status attainment tradi-tion have attempted to model how socioeconomic status is passed on to futuregenerations within families. In The American Occupational Structure, Peter Blau andOtis Dudley Duncan ~1967! used father’s educational and occupational attainment topredict the occupational prestige of the son’s job. They found that the higher thefather’s educational and occupational status, the higher the son’s socioeconomicstatus. William Sewell and Vimal Shah ~1968! extended the work of Blau and Duncan~1967! by introducing psychological ~mental ability! and social psychological ~occu-pational and educational aspirations and significant other influences! variables to themodel. Here we examine teachers’ educational expectations for students as one typeof significant other influence.
It is important to differentiate aspirations from expectations and attitudes ~Mickel-son 1990!. One should not take for granted that these views on education comple-ment each other. According to Hauser and Anderson ~1991!, “Aspirations are desiredoutcomes that are not limited by constraints on resources” ~p. 270!. In contrast,expectations are more realistic assessments of what is likely to happen in the future.Finally, attitudes are universal beliefs students have about the value of education. Inthis paper, we focus on students’ educational expectations because we want to analyzehow students’ beliefs in their own ability combined with an analysis of their lifecircumstances affect their degree attainment. We now discuss the data and methodsemployed in this paper.
DATA AND METHODS
In this paper, we use NELS data from 1988 to 2000 to examine patterns of postsec-ondary attainment among Black males and females and White males and females.NELS is a nationally representative sample of students in 1000 schools who wereeighth graders in 1988. In the base year, 24,599 eighth graders were surveyed. Aportion of these respondents was then resurveyed in 1990, 1992, 1994, and 2000. In
Where Are All the Boys?
DU BOIS REVIEW: SOCIAL SCIENCE RESEARCH ON RACE 5:1, 2008 143
this paper, we utilize information from the base year ~1988! to the fourth follow-up~2000! to examine the determinants of Black students’ and White students’ likeli-hood of attaining an associate’s or a bachelor’s degree.
NELS is an ideal data source for this project for a number of reasons. First, thelongitudinal design allows researchers to examine the educational experiences ofBlack males and females and White males and females from eighth grade to wellbeyond high school graduation. Secondly, NELS collected information from stu-dents, parents, teachers, and administrators. This allows an investigator to cross-reference data, which increases the reliability of self-reports. The survey design alsoenables researchers to match students and teachers. We also do not have to rely onretrospective responses regarding past events.
It is important to note that because teachers are tied to the sample of students,NELS does not provide a nationally representative sample of teachers.10 However itdoes provide teacher evaluations for a nationally representative sample of students.Finally, NELS is an ideal data source because a large number of Black students—thepopulation of interest in this study—were sampled. In this paper, we utilize informa-tion from 974 Black students and 7632 White students who entered the study ineighth grade and remained in the study until the fourth follow-up survey in 2000.11
We also examine contextual data from the parent files in 1988 and teacher files in1990.12 The next section provides detailed descriptions of the variables of interest inthis paper.
Variables of Interest
In Table 1, we present information on the student, parent, and teacher variables ofinterest for this paper. We begin with variables that measure students’ demographiccharacteristics. First, we constructed four categories that combine race and gender.Black male is a dummy variable where 1 equals Black male, and 0 equals Other. Blackfemale, White male, and White female are coded in the same way. Next, we examinethree measures of postsecondary attainment. The first measure codes degree attain-ment in five categories, ranging from 0 ~no degree!, 1 ~certificate or license!, 2 ~associate’sdegree!, 3 ~bachelor’s degree!, 4 ~master’s degree!, to 5 ~doctorate or professional degree!.We also constructed two dummy variables that measure whether the respondentreceived an associate’s degree or more or a bachelor’s degree or more by 2000.13
We use two dependent variables for the logistic regression models. These are~1! whether or not a student received an associate’s degree or more and ~2! whetherthe student attained a bachelor’s degree or more by 2000. In 2000, students whograduated on time would have been out of high school for approximately eightyears. If a student reported receiving no postsecondary education; some postsecond-ary education, but no degree; or a certificate or license, the student was coded ashaving less than an associate’s degree. If a student reported receiving no postsec-ondary education; some postsecondary education, but no degree; a certificate orlicense; or an associate’s degree, the student was coded as having less than a bachelor’sdegree.
Next, we analyzed a number of variables from the parent file to obtain reliableinformation on the family background of the student. The educational attainment ofmothers and fathers ranges from 0 ~did not finish high school ! to 7 ~holds a graduate orprofessional degree!. Mothers’ and fathers’ occupation is grouped into large summarycategories. For example, laborers include craftspeople, farmers, farm managers, labor-ers, operatives, and technical workers. Service occupations include clerical workers,sales associates, and service workers. Professionals include managers, accountants,
Rachelle Brunn and Grace Kao
144 DU BOIS REVIEW: SOCIAL SCIENCE RESEARCH ON RACE 5:1, 2008
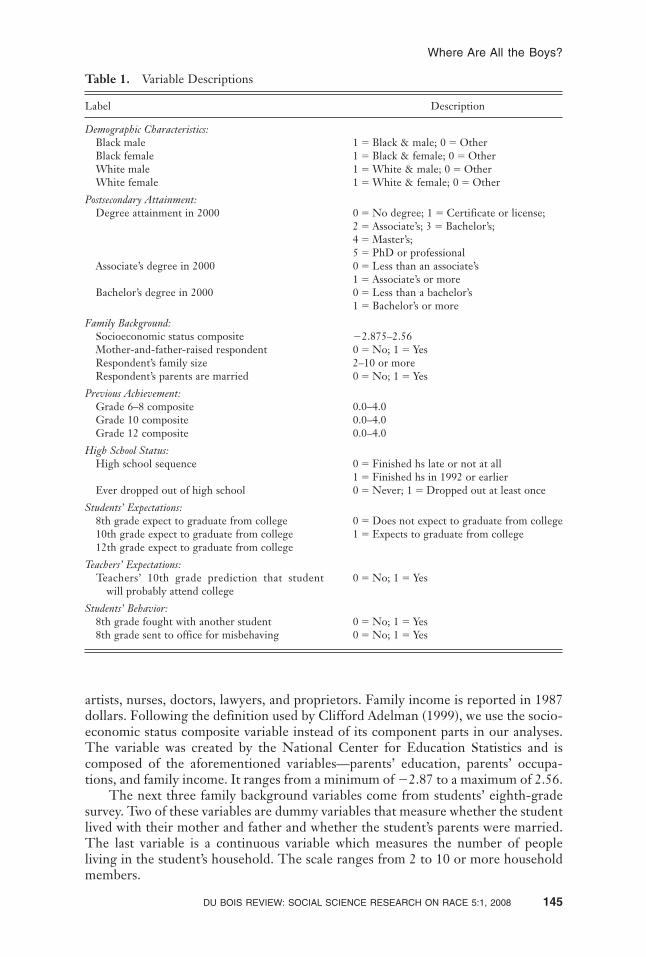
artists, nurses, doctors, lawyers, and proprietors. Family income is reported in 1987dollars. Following the definition used by Clifford Adelman ~1999!, we use the socio-economic status composite variable instead of its component parts in our analyses.The variable was created by the National Center for Education Statistics and iscomposed of the aforementioned variables—parents’ education, parents’ occupa-tions, and family income. It ranges from a minimum of �2.87 to a maximum of 2.56.
The next three family background variables come from students’ eighth-gradesurvey. Two of these variables are dummy variables that measure whether the studentlived with their mother and father and whether the student’s parents were married.The last variable is a continuous variable which measures the number of peopleliving in the student’s household. The scale ranges from 2 to 10 or more householdmembers.
Table 1. Variable Descriptions
Label Description
Demographic Characteristics:Black male 1 � Black & male; 0 � OtherBlack female 1 � Black & female; 0 � OtherWhite male 1 � White & male; 0 � OtherWhite female 1 � White & female; 0 � Other
Postsecondary Attainment:Degree attainment in 2000 0 � No degree; 1 � Certificate or license;
2 � Associate’s; 3 � Bachelor’s;4 � Master’s;5 � PhD or professional
Associate’s degree in 2000 0 � Less than an associate’s1 � Associate’s or more
Bachelor’s degree in 2000 0 � Less than a bachelor’s1 � Bachelor’s or more
Family Background:Socioeconomic status composite �2.875–2.56Mother-and-father-raised respondent 0 � No; 1 � YesRespondent’s family size 2–10 or moreRespondent’s parents are married 0 � No; 1 � Yes
Previous Achievement:Grade 6–8 composite 0.0–4.0Grade 10 composite 0.0–4.0Grade 12 composite 0.0–4.0
High School Status:High school sequence 0 � Finished hs late or not at all
1 � Finished hs in 1992 or earlierEver dropped out of high school 0 � Never; 1 � Dropped out at least once
Students’ Expectations:8th grade expect to graduate from college 0 � Does not expect to graduate from college10th grade expect to graduate from college 1 � Expects to graduate from college12th grade expect to graduate from college
Teachers’ Expectations:Teachers’ 10th grade prediction that student
will probably attend college0 � No; 1 � Yes
Students’ Behavior:8th grade fought with another student 0 � No; 1 � Yes8th grade sent to office for misbehaving 0 � No; 1 � Yes
Where Are All the Boys?
DU BOIS REVIEW: SOCIAL SCIENCE RESEARCH ON RACE 5:1, 2008 145
The fourth group of variables examines students’ previous academic achieve-ment. Students’ self-reported overall grade point averages from sixth to eighthgrade, tenth grade, and twelfth grade are assessed using variables that are measuredon a four-point scale. Higher values reflect higher grades. Grades in English, math,science, and social studies contribute to this overall grade point average.
The first variable in the high school status section measures timely completionof high school. Students receive a 1 if they finished high school on time ~in 1992 orearlier!. They receive a 0 if they finished high school late or not at all. The secondvariable details students’ dropout status. Students receive a 1 if the respondentdropped out of high school at least once. In auxiliary analyses we examined the effectof whether a student received a GED or a high school diploma, but the variable didnot provide additional explanatory power to the model.
The next section of explanatory variables includes measures of students’ educa-tional expectations and teachers’ educational expectations for students. Students’postsecondary education plans in eighth, tenth, and twelfth grades are measured by acategorical variable where 1 equals expects to graduate from college, and 0 equals does notexpect to graduate from college. In 1990, teachers were asked to predict whether or noteach of their students would probably attend college, where 0 indicates a negativeresponse, and 1 indicates an affirmative response.14
The final section of independent variables examines respondents’ behavior inschool. For the first variable, students receive a 1 if they have ever gotten into a fightwith another student or a 0 if they have not. The second variable measures whetherstudents have been sent to the office because they were misbehaving. Studentsreceive a 1 if they have been sent to the office or a 0 otherwise.
In the next section, we present our results. First, we analyze descriptive statisticsfor the variables of interest for Black males and females and White males andfemales. Then, we use binary logistic regression to examine how demographic char-acteristics, high school status, previous academic achievement, family backgroundcharacteristics, and postsecondary expectations affect students’ postsecondary attain-ment in 2000.
RESULTS
Descriptive Statistics
Table 2 reports means and frequencies for the variables of interest in this paper. Wealso report the results of significance tests between same-race males and females. Aswe can see, approximately 35% of Black females reported receiving at least anassociate’s degree by 2000. The corresponding percentage for Black males was 25%.About 48% of White females received an associate’s degree or higher by 2000.Approximately 43% of White males reported receiving at least a two-year degree.This indicates that females in each racial group were significantly more likely toreceive an associate’s degree or more education than men. However, the gap betweenmales and females is larger among Black respondents.
As expected, a smaller percentage of Black students and White students reportedreceiving a bachelor’s degree. The gender gaps are also slightly smaller withineach racial group than they were when we examined associate’s degree attainment.Our results indicate that approximately 28% of Black females and 19% of Blackmales received a bachelor’s degree or more education by 2000. The correspondingpercentages for White females and males were 40% and 36%, respectively. Onceagain, the gender gap appears to be wider among Black students than among White
Rachelle Brunn and Grace Kao
146 DU BOIS REVIEW: SOCIAL SCIENCE RESEARCH ON RACE 5:1, 2008
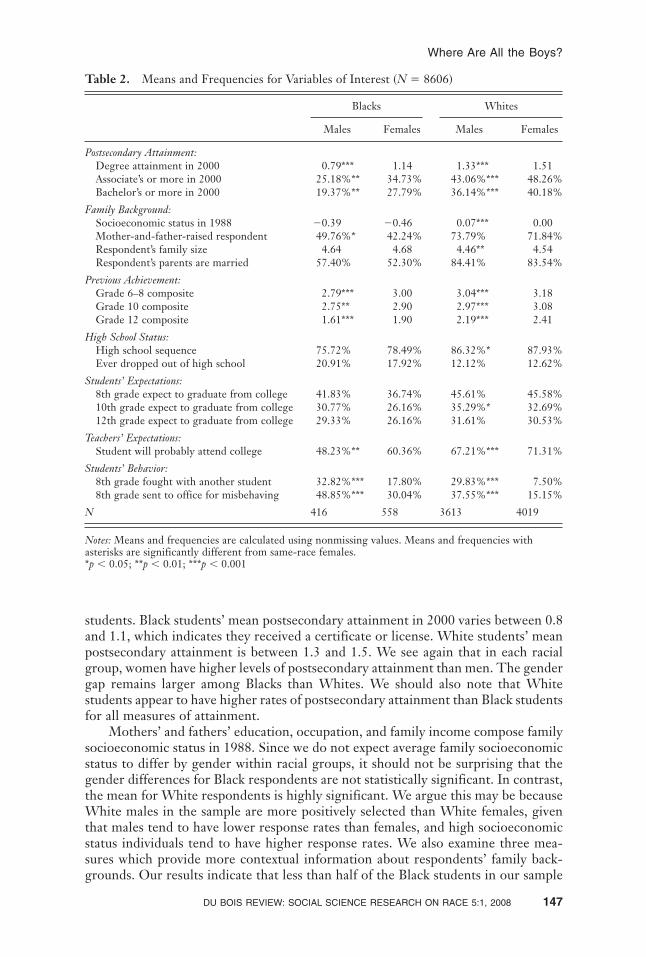
students. Black students’ mean postsecondary attainment in 2000 varies between 0.8and 1.1, which indicates they received a certificate or license. White students’ meanpostsecondary attainment is between 1.3 and 1.5. We see again that in each racialgroup, women have higher levels of postsecondary attainment than men. The gendergap remains larger among Blacks than Whites. We should also note that Whitestudents appear to have higher rates of postsecondary attainment than Black studentsfor all measures of attainment.
Mothers’ and fathers’ education, occupation, and family income compose familysocioeconomic status in 1988. Since we do not expect average family socioeconomicstatus to differ by gender within racial groups, it should not be surprising that thegender differences for Black respondents are not statistically significant. In contrast,the mean for White respondents is highly significant. We argue this may be becauseWhite males in the sample are more positively selected than White females, giventhat males tend to have lower response rates than females, and high socioeconomicstatus individuals tend to have higher response rates. We also examine three mea-sures which provide more contextual information about respondents’ family back-grounds. Our results indicate that less than half of the Black students in our sample
Table 2. Means and Frequencies for Variables of Interest ~N � 8606!
Blacks Whites
Males Females Males Females
Postsecondary Attainment:Degree attainment in 2000 0.79*** 1.14 1.33*** 1.51Associate’s or more in 2000 25.18%** 34.73% 43.06%*** 48.26%Bachelor’s or more in 2000 19.37%** 27.79% 36.14%*** 40.18%
Family Background:Socioeconomic status in 1988 �0.39 �0.46 0.07*** 0.00Mother-and-father-raised respondent 49.76%* 42.24% 73.79% 71.84%Respondent’s family size 4.64 4.68 4.46** 4.54Respondent’s parents are married 57.40% 52.30% 84.41% 83.54%
Previous Achievement:Grade 6–8 composite 2.79*** 3.00 3.04*** 3.18Grade 10 composite 2.75** 2.90 2.97*** 3.08Grade 12 composite 1.61*** 1.90 2.19*** 2.41
High School Status:High school sequence 75.72% 78.49% 86.32%* 87.93%Ever dropped out of high school 20.91% 17.92% 12.12% 12.62%
Students’ Expectations:8th grade expect to graduate from college 41.83% 36.74% 45.61% 45.58%10th grade expect to graduate from college 30.77% 26.16% 35.29%* 32.69%12th grade expect to graduate from college 29.33% 26.16% 31.61% 30.53%
Teachers’ Expectations:Student will probably attend college 48.23%** 60.36% 67.21%*** 71.31%
Students’ Behavior:8th grade fought with another student 32.82%*** 17.80% 29.83%*** 7.50%8th grade sent to office for misbehaving 48.85%*** 30.04% 37.55%*** 15.15%
N 416 558 3613 4019
Notes: Means and frequencies are calculated using nonmissing values. Means and frequencies withasterisks are significantly different from same-race females.*p , 0.05; **p , 0.01; ***p , 0.001
Where Are All the Boys?
DU BOIS REVIEW: SOCIAL SCIENCE RESEARCH ON RACE 5:1, 2008 147
were raised by their mother and father. However, Black males are slightly more likelythan Black females to have been raised by both parents. In contrast, approximately72% of White respondents were raised by their mother and father. There are alsoracial disparities in parents’ marital status. Approximately 84% of White students,but only 55% of Black students, reported that their parents were married. BothBlack and White respondents reported living in homes with four or five familymembers.
Next, we examine students’ previous academic achievement. By analyzing stu-dents’ self-reported grades over three points in time, we discover some interestingpatterns. First, the gender difference is highly significant for both racial groups at allpoints in time. Females consistently outperform their same-race counterparts. Thegender gap among Black students is also wider than it is among White students at allthree points in time. Finally, all students’ grade point averages drop over time. Thegrade reduction is most pronounced between tenth and twelfth grades and is moresubstantial for males in each racial group. Black students’ grades drop by more thanone grade point. This brings their grade point average from about a B to a C. Whitestudents’ grades drop by less than one grade point from about a B to a B�0C�.These results are very important given that Walter Allen and Nesha Haniff ~1991!concluded that for the students in their sample, high school grades are the strongestpredictor of college grades.
The high school status variables do not vary significantly by gender with theexception of high school sequence for White students. In this case, White femalesare slightly more likely than White males to finish high school on time. About18%–21% of Black students reported dropping out at least once in their high schoolcareer as compared to 12%–13% of White students.
Students’ post-secondary expectations decline over time, perhaps because oftheir declining grade point averages. There is only one significant gender difference.In the tenth grade, White males are more likely than White females to expect tograduate from college. In contrast, teachers are more likely to report that femalestudents will probably attend college. When respondents are in the tenth grade,teachers predict that approximately 60% of Black female students will attend collegeas compared to 48% of Black male students. The corresponding percentages forWhite female and male students are approximately 71% and 67%, respectively. Aswe can see, the gender gap in teachers’ expectations for students to attend college ismuch wider among Black students. It also seems that teachers think that Whitestudents are more likely to attend college than Black students.
There are highly significant gender differences in students’ behavior for bothWhite and Black students. Black males and White males are more likely than same-race females to report fighting with another student. Approximately 30% of Whitemales and 33% of Black males have been in a fight with a fellow student. Malestudents are also more likely than female students to have been sent to the officebecause they misbehaved. However, approximately 49% of Black males report beingdisciplined in this manner as opposed to 38% of White males. These findingssupport results from previous research where teachers reported that Black maleswere their most disruptive students ~Brunn and Kao, 2004!.
Multivariate Analyses
Table 3 presents the results of a binary logistic regression of demographic character-istics, previous academic achievement, high school status, teachers’ expectations thatstudents would probably attend college, and students’ own expectations for whether
Rachelle Brunn and Grace Kao
148 DU BOIS REVIEW: SOCIAL SCIENCE RESEARCH ON RACE 5:1, 2008
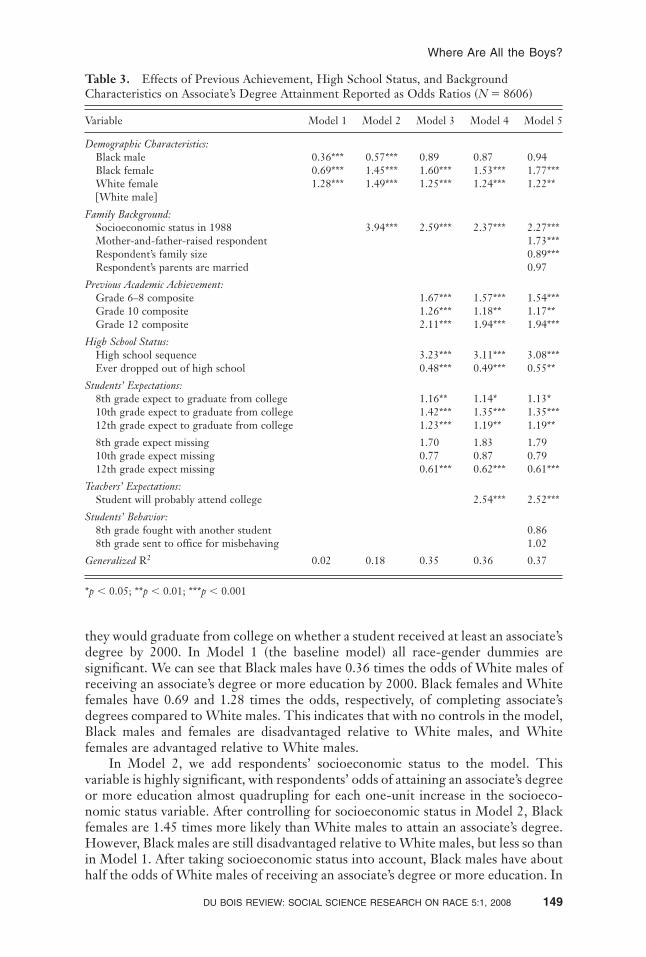
they would graduate from college on whether a student received at least an associate’sdegree by 2000. In Model 1 ~the baseline model! all race-gender dummies aresignificant. We can see that Black males have 0.36 times the odds of White males ofreceiving an associate’s degree or more education by 2000. Black females and Whitefemales have 0.69 and 1.28 times the odds, respectively, of completing associate’sdegrees compared to White males. This indicates that with no controls in the model,Black males and females are disadvantaged relative to White males, and Whitefemales are advantaged relative to White males.
In Model 2, we add respondents’ socioeconomic status to the model. Thisvariable is highly significant, with respondents’ odds of attaining an associate’s degreeor more education almost quadrupling for each one-unit increase in the socioeco-nomic status variable. After controlling for socioeconomic status in Model 2, Blackfemales are 1.45 times more likely than White males to attain an associate’s degree.However, Black males are still disadvantaged relative to White males, but less so thanin Model 1. After taking socioeconomic status into account, Black males have abouthalf the odds of White males of receiving an associate’s degree or more education. In
Table 3. Effects of Previous Achievement, High School Status, and BackgroundCharacteristics on Associate’s Degree Attainment Reported as Odds Ratios ~N � 8606!
Variable Model 1 Model 2 Model 3 Model 4 Model 5
Demographic Characteristics:Black male 0.36*** 0.57*** 0.89 0.87 0.94Black female 0.69*** 1.45*** 1.60*** 1.53*** 1.77***White female 1.28*** 1.49*** 1.25*** 1.24*** 1.22**@White male#
Family Background:Socioeconomic status in 1988 3.94*** 2.59*** 2.37*** 2.27***Mother-and-father-raised respondent 1.73***Respondent’s family size 0.89***Respondent’s parents are married 0.97
Previous Academic Achievement:Grade 6–8 composite 1.67*** 1.57*** 1.54***Grade 10 composite 1.26*** 1.18** 1.17**Grade 12 composite 2.11*** 1.94*** 1.94***
High School Status:High school sequence 3.23*** 3.11*** 3.08***Ever dropped out of high school 0.48*** 0.49*** 0.55**
Students’ Expectations:8th grade expect to graduate from college 1.16** 1.14* 1.13*10th grade expect to graduate from college 1.42*** 1.35*** 1.35***12th grade expect to graduate from college 1.23*** 1.19** 1.19**
8th grade expect missing 1.70 1.83 1.7910th grade expect missing 0.77 0.87 0.7912th grade expect missing 0.61*** 0.62*** 0.61***
Teachers’ Expectations:Student will probably attend college 2.54*** 2.52***
Students’ Behavior:8th grade fought with another student 0.868th grade sent to office for misbehaving 1.02
Generalized R2 0.02 0.18 0.35 0.36 0.37
*p , 0.05; **p , 0.01; ***p , 0.001
Where Are All the Boys?
DU BOIS REVIEW: SOCIAL SCIENCE RESEARCH ON RACE 5:1, 2008 149
contrast, White females are even more advantaged than White males after control-ling for socioeconomic status.
Model 3 adds controls for previous academic achievement, high school status,and students’ expectations. Our results indicate that students from privileged socio-economic backgrounds are more likely to have higher grade point averages, to havehigher academic expectations, and0or to finish high school on time. The odds ratiofor Black males is no longer significant in Model 3, suggesting that the odds ofattaining an associate’s degree are comparable for Black males and White males. Theadvantage of Black females over White males increases, while the advantage ofWhite females decreases.
What is remarkable is that grade point average from junior high school, tenthgrade, and twelfth grade are all highly significant in predicting the odds of earning anassociate’s degree.15 For sixth through eighth grade, a one-point increase on a four-point scale is associated with a 67% increase in the odds of attaining an associate’sdegree or more. The corresponding percentages for tenth grade and twelfth gradeare approximately 26% and 111%, respectively.
A student who finished high school on time is 3.23 times more likely than arespondent who finishes high school late or not at all to receive an associate’s degreeor more education. A respondent who dropped out of high school at least once hasless than half the odds of a respondent who never dropped out of high school ofreceiving an associate’s degree. Students’ educational expectations are also highlysignificant. Students who report in the eighth grade that they expect to graduatefrom college are 1.16 times more likely to earn an associate’s degree than those whodo not expect to graduate from college. The corresponding figures for tenth andtwelfth grade are 1.42 times the odds and 1.23 times the odds of students who do notexpect to graduate from college, respectively.16 Given that there were missing dataon the expectations questions, especially in twelfth grade, we include a dummyvariable that is equal to one if the respondent skipped this question. The variable issignificant in the twelfth grade, indicating that students who skip this question areless likely to earn an associate’s degree.
In Model 4 we add teachers’ expectations to the equation. This variable is highlysignificant. Students whose tenth-grade teachers said that they would probably attendcollege are about 2.5 times more likely to earn an associate’s degree or more educa-tion than students whose teachers said they probably would not attend college. It isinteresting that teachers’ expectations of students is such a strong predictor evenafter controlling for respondents’ grade point average. In the final model ~Model 5!,we attempt to identify factors that might mediate the relationship between familysocioeconomic status and degree attainment. By including these variables, we accountfor almost half of the effect of socioeconomic status in Model 1. Students who wereraised by both parents are 1.73 times more likely than students who were raised inanother family formation to earn an associate’s degree. In contrast, for each addi-tional person in a respondent’s family, his or her odds of attaining an associate’sdegree decrease by approximately 11%.
We also added two measures that are associated with students’ behavior in aneffort to explain the source of teachers’ expectations. However, neither measure issignificant. In the final model, Black females and White females remain advantagedrelative to White males. Black females’ odds of attaining an associate’s degree are1.77 times White males’ odds. White females’ odds are 1.22 times White males’odds. The effects of the control variables remain the same. Table 4 presents theresults of a binary logistic regression of demographic characteristics, previous aca-demic achievement, high school status, and teachers’ and students’ expectations on
Rachelle Brunn and Grace Kao
150 DU BOIS REVIEW: SOCIAL SCIENCE RESEARCH ON RACE 5:1, 2008
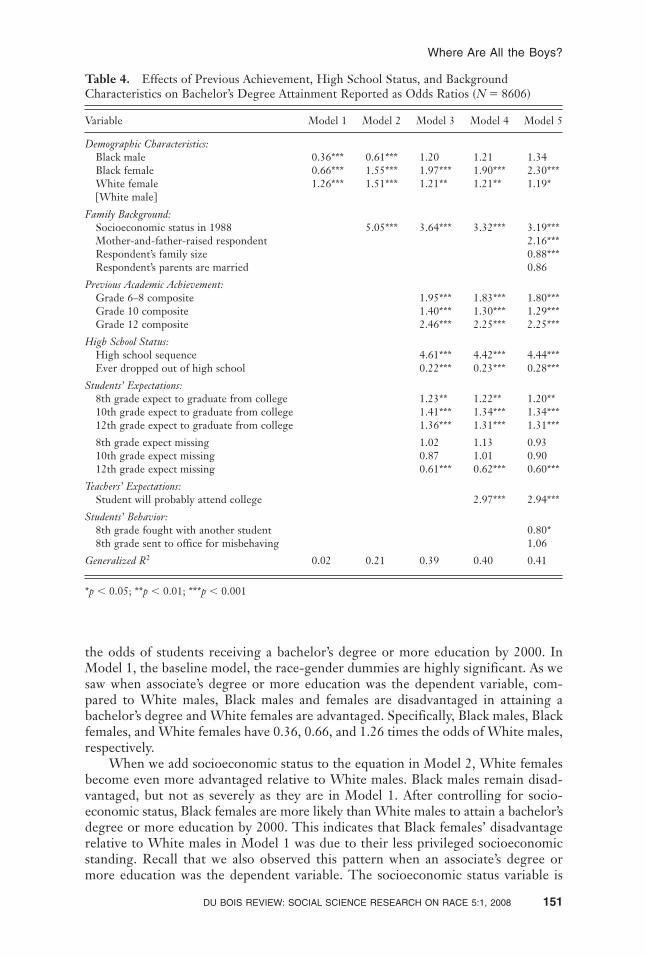
the odds of students receiving a bachelor’s degree or more education by 2000. InModel 1, the baseline model, the race-gender dummies are highly significant. As wesaw when associate’s degree or more education was the dependent variable, com-pared to White males, Black males and females are disadvantaged in attaining abachelor’s degree and White females are advantaged. Specifically, Black males, Blackfemales, and White females have 0.36, 0.66, and 1.26 times the odds of White males,respectively.
When we add socioeconomic status to the equation in Model 2, White femalesbecome even more advantaged relative to White males. Black males remain disad-vantaged, but not as severely as they are in Model 1. After controlling for socio-economic status, Black females are more likely than White males to attain a bachelor’sdegree or more education by 2000. This indicates that Black females’ disadvantagerelative to White males in Model 1 was due to their less privileged socioeconomicstanding. Recall that we also observed this pattern when an associate’s degree ormore education was the dependent variable. The socioeconomic status variable is
Table 4. Effects of Previous Achievement, High School Status, and BackgroundCharacteristics on Bachelor’s Degree Attainment Reported as Odds Ratios ~N � 8606!
Variable Model 1 Model 2 Model 3 Model 4 Model 5
Demographic Characteristics:Black male 0.36*** 0.61*** 1.20 1.21 1.34Black female 0.66*** 1.55*** 1.97*** 1.90*** 2.30***White female 1.26*** 1.51*** 1.21** 1.21** 1.19*@White male#
Family Background:Socioeconomic status in 1988 5.05*** 3.64*** 3.32*** 3.19***Mother-and-father-raised respondent 2.16***Respondent’s family size 0.88***Respondent’s parents are married 0.86
Previous Academic Achievement:Grade 6–8 composite 1.95*** 1.83*** 1.80***Grade 10 composite 1.40*** 1.30*** 1.29***Grade 12 composite 2.46*** 2.25*** 2.25***
High School Status:High school sequence 4.61*** 4.42*** 4.44***Ever dropped out of high school 0.22*** 0.23*** 0.28***
Students’ Expectations:8th grade expect to graduate from college 1.23** 1.22** 1.20**10th grade expect to graduate from college 1.41*** 1.34*** 1.34***12th grade expect to graduate from college 1.36*** 1.31*** 1.31***
8th grade expect missing 1.02 1.13 0.9310th grade expect missing 0.87 1.01 0.9012th grade expect missing 0.61*** 0.62*** 0.60***
Teachers’ Expectations:Student will probably attend college 2.97*** 2.94***
Students’ Behavior:8th grade fought with another student 0.80*8th grade sent to office for misbehaving 1.06
Generalized R2 0.02 0.21 0.39 0.40 0.41
*p , 0.05; **p , 0.01; ***p , 0.001
Where Are All the Boys?
DU BOIS REVIEW: SOCIAL SCIENCE RESEARCH ON RACE 5:1, 2008 151
highly significant in Model 2—every one-point increase in standing increases respon-dents’ odds of earning a bachelor’s degree or more education by a factor of five.
In Model 3, we add variables to measure previous academic achievement, highschool status, and students’ expectations. After controlling for these variables, theBlack-male dummy variable is no longer significant. This indicates that Black males’odds of attaining a bachelor’s degree or more education by 2000 are no different thanWhite males’ odds after accounting for socioeconomic status and high schoolexperiences.
Previous academic achievement, at all three time points, is highly significant. Aone-point increase on a four-point scale for grade point average multiplies respon-dents’ odds of attaining a bachelor’s degree or more education in 2000 by approx-imately 2.0, 1.4, and 2.5 in sixth through eighth grade, tenth grade, and twelfthgrade, respectively. Respondents who finished high school on time were more than4.5 times more likely to attain a bachelor’s degree than those who finished highschool late or not at all. Students who dropped out of school at least once by 1994had about 0.22 times the odds of earning a bachelor’s degree compared to studentswho never dropped out of school. Students’ educational expectations are also sta-tistically significant. As we anticipated, students who expect to graduate fromcollege are more likely to receive a bachelor’s degree. In Model 4, we add teachers’expectations of students. Students whose tenth-grade teachers said that they wouldprobably attend college are almost three times more likely to get a bachelor’sdegree or more education than students whose teachers said that they probablywould not attend college. The results for the other control variables are largelyunchanged.
In Model 5 we add variables to more fully understand how socioeconomic statusaffects degree attainment and to understand how teachers predict students’ likeli-hood of college attendance after holding students’ academic achievement constant.We find that students who were raised by their mother and father have more thantwo times the odds of earning a bachelor’s degree compared to students who were notraised by both parents. However, for each additional person living in a student’sfamily, his or her odds of earning a bachelor’s degree decrease by about 12%.Respondents who have gotten into a fight with another student have 0.8 times theodds of receiving a bachelor’s degree or more education, compared to respondentswho have not gotten into a fight.
Given that the question teachers were asked is more directly about postsecond-ary enrollment rather than postsecondary degree attainment, in auxiliary analyses weexamined the effect of teachers’ expectations on whether students reported receivingsome postsecondary education or no postsecondary education by 1994. If a studentreported receiving no postsecondary education, that they were currently working ona certificate or license, or that they had received a certificate or license, they werecoded as having no postsecondary education. If a student reported that they werecurrently working toward an associate’s or a bachelor’s degree, had received somepostsecondary education, or had already received an associate’s degree, they werecoded as having some postsecondary education.17 Students whose teachers said thatthey would probably attend college were 1.8 times more likely to have received somepostsecondary education than students whose teachers said that they probably wouldnot attend college. This indicates that teachers’ expectations have similar effects onboth enrollment and attainment.
While Tables 3 and 4 give us information on how Black males and Black femalescompare to White males with regard to associate’s and bachelor’s degree attainment,they do not tell us much about how Black males and Black females compare to each
Rachelle Brunn and Grace Kao
152 DU BOIS REVIEW: SOCIAL SCIENCE RESEARCH ON RACE 5:1, 2008
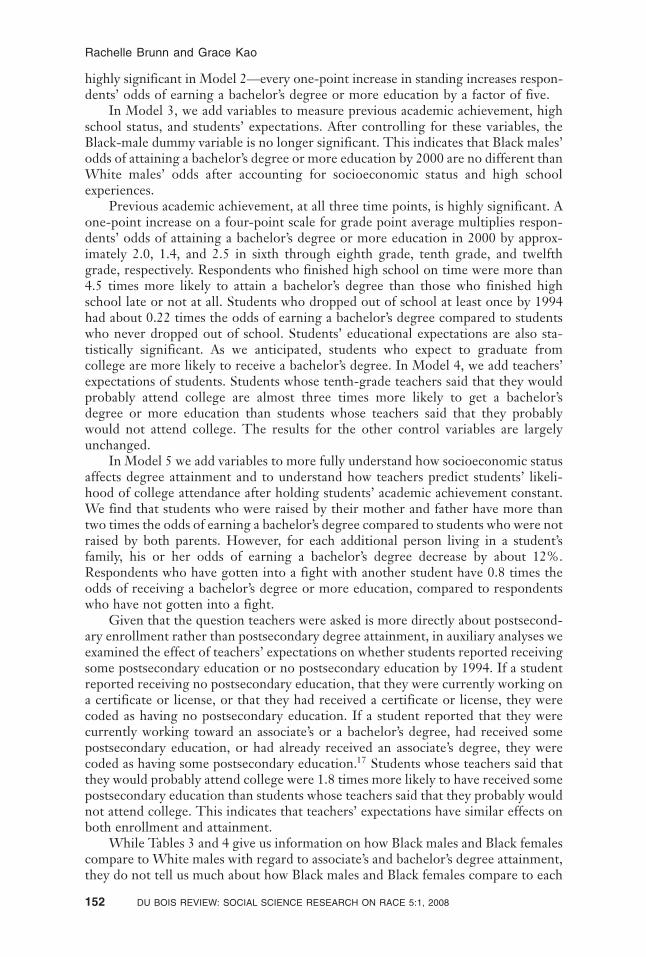
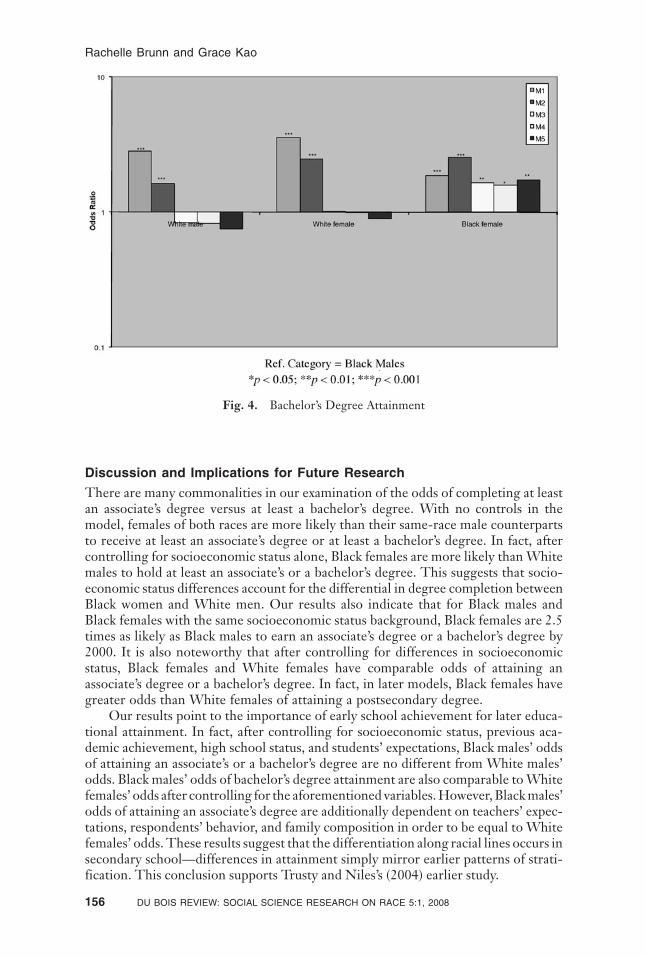
other. We are also interested in how Black and White females’ likelihood of attaininga degree differs. In order to observe these relationships we reran the models inTable 3 and Table 4 while switching the reference category. In Figures 1 through 4we present the odds ratios for the race-gender dummies. The figures are presentedon a logarithmic scale. As the odds ratios approach one, each race-gender groupbecomes more similar to the reference category. The control variables remain in themodel, but are not presented in the figures.
Figure 1 presents the race-gender effects on associate’s degree attainment whenWhite females are the reference category. In Model 1, Black males, Black females,and White males are disadvantaged relative to White females with regard to theirodds of attaining an associate’s degree or more education by 2000. After controllingfor socioeconomic status in Model 2, the odds ratio for Black females is no longerstatistically significant. This indicates that Black females and White females from thesame socioeconomic background are equally likely to hold at least an associate’sdegree by 2000. However, Black males and White males continue to be disadvan-taged relative to White females. In fact, White males are more disadvantaged thanthey were in Model 1.
Recall that in Model 3 we add controls for previous academic achievement, highschool status, and students’ educational expectations to the equation. Black malesand White males remain disadvantaged relative to White females, however not to theextent that they were in previous models. After controlling for teachers’ expectationsin Model 4, Black males and White males remain disadvantaged as compared toWhite females. In the full model, Model 5, we control for household composition,parents’ marital status, family size, and students’ behavior. After controlling for thesefactors, Black males are no longer statistically different from White females. Incontrast, Black females regain their advantage over White females. White malesremain disadvantaged relative to White females.
Fig. 1. Associate’s Degree Attainment
Where Are All the Boys?
DU BOIS REVIEW: SOCIAL SCIENCE RESEARCH ON RACE 5:1, 2008 153
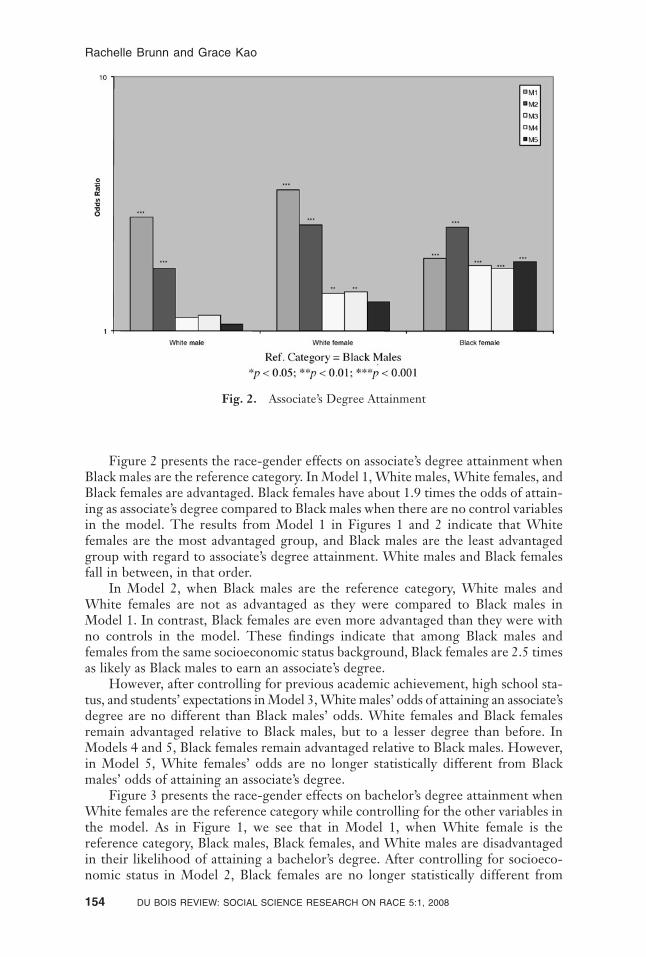
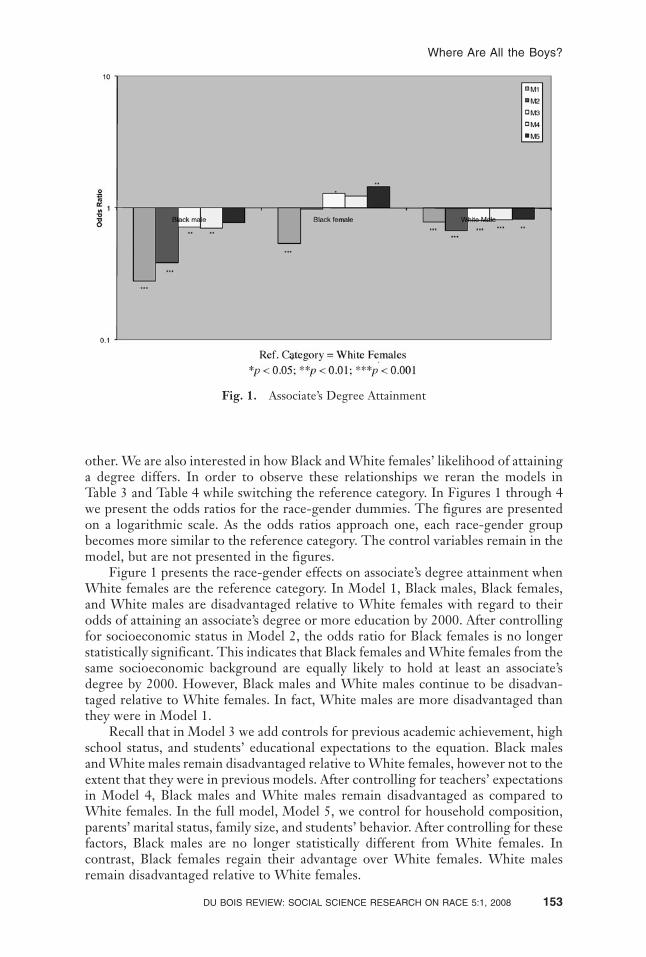
Figure 2 presents the race-gender effects on associate’s degree attainment whenBlack males are the reference category. In Model 1, White males, White females, andBlack females are advantaged. Black females have about 1.9 times the odds of attain-ing as associate’s degree compared to Black males when there are no control variablesin the model. The results from Model 1 in Figures 1 and 2 indicate that Whitefemales are the most advantaged group, and Black males are the least advantagedgroup with regard to associate’s degree attainment. White males and Black femalesfall in between, in that order.
In Model 2, when Black males are the reference category, White males andWhite females are not as advantaged as they were compared to Black males inModel 1. In contrast, Black females are even more advantaged than they were withno controls in the model. These findings indicate that among Black males andfemales from the same socioeconomic status background, Black females are 2.5 timesas likely as Black males to earn an associate’s degree.
However, after controlling for previous academic achievement, high school sta-tus, and students’ expectations in Model 3, White males’ odds of attaining an associate’sdegree are no different than Black males’ odds. White females and Black femalesremain advantaged relative to Black males, but to a lesser degree than before. InModels 4 and 5, Black females remain advantaged relative to Black males. However,in Model 5, White females’ odds are no longer statistically different from Blackmales’ odds of attaining an associate’s degree.
Figure 3 presents the race-gender effects on bachelor’s degree attainment whenWhite females are the reference category while controlling for the other variables inthe model. As in Figure 1, we see that in Model 1, when White female is thereference category, Black males, Black females, and White males are disadvantagedin their likelihood of attaining a bachelor’s degree. After controlling for socioeco-nomic status in Model 2, Black females are no longer statistically different from
Fig. 2. Associate’s Degree Attainment
Rachelle Brunn and Grace Kao
154 DU BOIS REVIEW: SOCIAL SCIENCE RESEARCH ON RACE 5:1, 2008
White females. Black males are less disadvantaged than they were in Model 1, andWhite males are more disadvantaged than they were in Model 1. This indicates thaton average, Black males and females in this sample are from less privileged socioeco-nomic backgrounds than White females, and on average, White males in this sampleare from more privileged socioeconomic backgrounds than White females.
After controlling for previous academic achievement, high school status, andstudents’ expectations in Model 3, Black males are no longer significantly differentfrom White females. However, Black females have 1.62 times the odds of attaining abachelor’s degree compared to White females. Black females continue to have higherodds of bachelor’s degree attainment than White females in Models 4 and 5. Theiradvantage grows slightly after controlling for household composition, parents’ mar-ital status, family size, and respondents’ behavior. White males remain disadvantagedas compared to White females in both models.
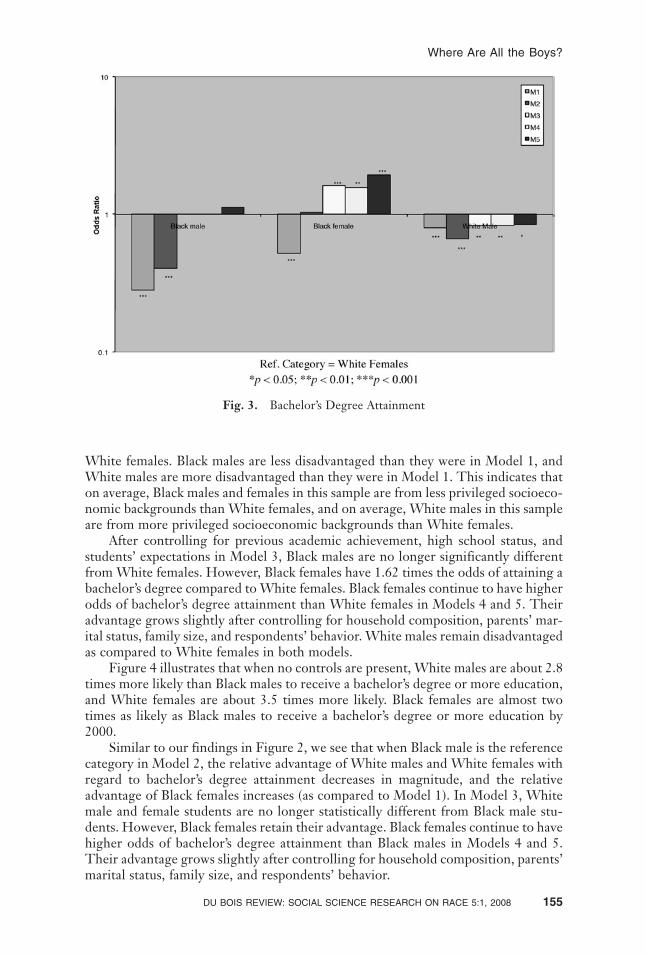
Figure 4 illustrates that when no controls are present, White males are about 2.8times more likely than Black males to receive a bachelor’s degree or more education,and White females are about 3.5 times more likely. Black females are almost twotimes as likely as Black males to receive a bachelor’s degree or more education by2000.
Similar to our findings in Figure 2, we see that when Black male is the referencecategory in Model 2, the relative advantage of White males and White females withregard to bachelor’s degree attainment decreases in magnitude, and the relativeadvantage of Black females increases ~as compared to Model 1!. In Model 3, Whitemale and female students are no longer statistically different from Black male stu-dents. However, Black females retain their advantage. Black females continue to havehigher odds of bachelor’s degree attainment than Black males in Models 4 and 5.Their advantage grows slightly after controlling for household composition, parents’marital status, family size, and respondents’ behavior.
Fig. 3. Bachelor’s Degree Attainment
Where Are All the Boys?
DU BOIS REVIEW: SOCIAL SCIENCE RESEARCH ON RACE 5:1, 2008 155
Discussion and Implications for Future Research
There are many commonalities in our examination of the odds of completing at leastan associate’s degree versus at least a bachelor’s degree. With no controls in themodel, females of both races are more likely than their same-race male counterpartsto receive at least an associate’s degree or at least a bachelor’s degree. In fact, aftercontrolling for socioeconomic status alone, Black females are more likely than Whitemales to hold at least an associate’s or a bachelor’s degree. This suggests that socio-economic status differences account for the differential in degree completion betweenBlack women and White men. Our results also indicate that for Black males andBlack females with the same socioeconomic status background, Black females are 2.5times as likely as Black males to earn an associate’s degree or a bachelor’s degree by2000. It is also noteworthy that after controlling for differences in socioeconomicstatus, Black females and White females have comparable odds of attaining anassociate’s degree or a bachelor’s degree. In fact, in later models, Black females havegreater odds than White females of attaining a postsecondary degree.
Our results point to the importance of early school achievement for later educa-tional attainment. In fact, after controlling for socioeconomic status, previous aca-demic achievement, high school status, and students’ expectations, Black males’ oddsof attaining an associate’s or a bachelor’s degree are no different from White males’odds. Black males’ odds of bachelor’s degree attainment are also comparable to Whitefemales’ odds after controlling for the aforementioned variables. However, Black males’odds of attaining an associate’s degree are additionally dependent on teachers’ expec-tations, respondents’ behavior, and family composition in order to be equal to Whitefemales’ odds. These results suggest that the differentiation along racial lines occurs insecondary school—differences in attainment simply mirror earlier patterns of strati-fication. This conclusion supports Trusty and Niles’s ~2004! earlier study.
Fig. 4. Bachelor’s Degree Attainment
Rachelle Brunn and Grace Kao
156 DU BOIS REVIEW: SOCIAL SCIENCE RESEARCH ON RACE 5:1, 2008
Previous research suggests that the negative experiences of Black students oncollege campuses may play a role in their higher attrition rates as compared toWhites. For example, Vincent Tinto ~1993! argued that students who are not attachedto their school are more likely to drop out. Extant research has suggested that Blackstudents may find it difficult to become attached to the colleges and universities theyattend. In The Agony of Education ~1996!, Joe Feagin et al. conducted focus groupinterviews with thirty-six randomly selected Black juniors and seniors at a predomi-nantly White public university. Respondents reported that they often felt invisible oncampus, that they perceived physical spaces on campus to be hostile, and that Whitestudents refused to recognize their unearned privilege.18 Our results, however, under-score the importance of middle school and high school experiences on attainment.What remains unexplained in our results is the gender disparity. Because females’advantage over same-race males in educational attainment cannot yet be explained, itis important that future research examine students’ college experiences at the inter-section of race and gender categories.
In our full models for both associate’s and bachelor’s degree attainment, Blackfemales’ odds are greater than those of White males, White females, and Blackmales. These results highlight the progress that Black females have made towardpostsecondary attainment. However, our findings also indicate that we must con-tinue to search for interventions that address the lower grade point averages of Blackmales. These interventions should begin in elementary school because our results, aswell as the work of previous researchers, have demonstrated that the gender gap inacademic performance already exists in eighth grade.
In addition to grades, socioeconomic status and students’ educational expecta-tions continue to be important predictors of degree attainment. Teachers’ expec-tations also appear to have powerful effects in these analyses. However, it is unclearwhether teachers are making accurate predictions of students’ likelihood of collegeattendance based on observed academic potential that cannot be measured by gradesalone, or if teachers’ lower expectations are depressing students’ subsequent attain-ment. Future research should attempt to disentangle these effects.
Corresponding author : Rachelle Brunn, Postdoctoral Fellow, Robert F. Wagner Graduate Schoolof Public Service, New York University, 295 Lafayette St., New York, NY 10012. E-mail: [email protected]
NOTES1. An earlier draft of this paper was presented at the 2005 Annual Meetings of the American
Sociological Association. This research was supported by a grant from the SpencerFoundation and the University of Pennsylvania Research Foundation.
2. Lisa Hudson et al. ~2005! found no difference in the gender gap among Whites aged18–24 as compared to the gender gap among Blacks of the same age group. It should benoted that the authors use participation rates as opposed to enrollment rates.
3. White males continued to receive more bachelor’s degrees than White females in 1980081. However, in 1984085 White females outnumbered White males among recipients ofbachelor’s degrees ~authors’ calculation from the Digest of Education Statistics 2005, Sny-der et al., 2006!.
4. By 1980, White females had surpassed White males in postsecondary enrollment ~authors’calculation from the Digest of Education Statistics 2002, Snyder 2002!.
5. Michael Nettles and Laura Perna ~1997! found that Black females’ enrollment is 24%higher than their male counterparts. The corresponding percentage for White females is10%.
6. Gender differences among Blacks, which is the primary topic of this paper, are alsoimportant and will be discussed later.
Where Are All the Boys?
DU BOIS REVIEW: SOCIAL SCIENCE RESEARCH ON RACE 5:1, 2008 157
7. As mentioned earlier, Black females’ enrollment in higher education had already sur-passed Black males’ enrollment when the Census began tracking enrollment systemati-cally by race and gender in 1976 ~Cross 1999!.
8. Examining increases in bachelor’s degree attainment between 1975076 and 1980081,William Trent ~1991! finds that most of the growth for all racial groups was attributableto females.
9. Crane ~1991! noted that the lack of a negative effect among Black females may be a resultof sampling bias.
10. After the students were identified in the base year, the school coordinator picked ateacher from a “hard class” ~math or science! and a “soft class” ~English or history! tocomplete the teacher questionnaire for each student. In Follow-up 1, teachers from ahard class and a soft class were surveyed again. In Follow-up 2, only one teacher wassurveyed ~Curtin et al., 2002!.
11. To reduce the amount of missing data we only include in the sample Blacks and Whiteswho filled out questionnaires in 1988, 1990, 1992, 1994, and 2000. We also use theappropriate weights in the descriptive statistics and the multivariate analyses to accountfor this sampling design.
12. One parent was surveyed in the base year of NELS ~Curtin et al., 2002!. In our sample,about 81.17% of parents who responded were the students’ mothers. Approximately14.86% of parents were the students’ fathers. The parent who responded was also askedto provide information about his or her spouse or partner.
13. In the text, we may simply write “an associate’s degree” or “a bachelor’s degree,” but in allinstances we mean an associate’s degree or higher, or a bachelor’s degree or higher.
14. A response of “I don’t know” was coded as zero.15. The correlation between students’ grades over the three time points is approximately
0.5.16. The correlation between students’ educational expectations over the three time points is
approximately 0.3.17. Since students who graduated on time finished high school in 1992, an associate’s degree
is the highest postsecondary degree they could have received by 1994.18. Mitzi Davis et al. ~2004! came to similar conclusions in their study of Black students at a
predominantly White university.
REFERENCESAdelman, Clifford ~1998!. More than 13 Ways of Looking at Degree Attainment. National
CrossTalk, 6~4!: 11–12.Adelman, Clifford ~1999!. Answers in the Tool Box: Academic Intensity, Attendance Patterns, and
Bachelor’s Degree Attainment. Washington, DC: U.S. Department of Education.Allen, Walter R., and Nesha Z. Haniff ~1991!. Race, Gender, and Academic Performance in
U.S. Higher Education. In Walter R. Allen, Edgar G. Epps, and Nesha Z. Haniff ~Eds.!,College in Black and White: African American Students in Predominantly White and in Histor-ically Black Public Universities, pp. 95–110. Albany, NY: State University of New YorkPress.
Allen, Walter R., and Daniel G. Solorzano ~2001!. Affirmative Action, Educational Equity,and Campus Racial Climate: A Case Study of the University of Michigan Law School.Berkeley La Raza Law Journal, 12~2!: 237–363.
Blau, Peter M., and Otis Dudley Duncan ~1967!. The American Occupational Structure. NewYork: Wiley.
Bowen, William G., and Derek Bok ~1998!. The Shape of the River: Long-Term Consequences ofConsidering Race in College and University Admissions. Princeton, NJ: Princeton UniversityPress.
Bowles, Samuel, and Herbert Gintis ~1976!. Schooling in Capitalist America: Educational Reformand the Contradictions of Economic Life. New York: Basic Books.
Brunn, Rachelle, and Grace Kao ~2004!. Do Teacher Expectations Matter for the Achieve-ment and Expectations of African Americans? A Comparison of African American andWhite Boys and Girls. Department of Sociology, University of Pennsylvania, Philadelphia,PA. Unpublished manuscript.
Buchmann, Claudia, and Thomas A. DiPrete ~2006!. The Growing Female Advantage inCollege Completion. American Sociological Review, 71~4!: 515–541.
Rachelle Brunn and Grace Kao
158 DU BOIS REVIEW: SOCIAL SCIENCE RESEARCH ON RACE 5:1, 2008
Chenoweth, Karin ~1998!. The Surging Degree Wave. Black Issues in Higher Education, 15~10!:20–23.
Cohen, Cathy J., and Claire E. Nee ~2000!. Educational Attainment and Sex Differentials inAfrican American Communities. American Behavioral Scientist, 43~7!: 1159–1206.
Cose, Ellis ~2003!. The Black Gender Gap. Newsweek. March 3, p. 46.Crane, Jonathan ~1991!. The Epidemic Theory of Ghettos and Neighborhood Effects on
Dropping Out and Teenage Childbearing. American Journal of Sociology, 96~5!: 1226–1259.Crosnoe, Robert, Monica Kirkpatrick Johnson, Glen H. Elder, Jr. ~2004!. Intergenerational
Bonding in School: The Behavioral and Contextual Correlates of Student-Teacher Rela-tionships. Sociology of Education, 77~1!: 60–81.
Cross, Theodore ~Ed.! ~1999!. Special Report: College Degree Awards: The Ominous GenderGap in African-American Higher Education. Journal of Blacks in Higher Education, no. 23:6–9.
Curtin, Thomas R., Steven J. Ingels, Shiying Wu, and Ruth Heuer ~2002!. National EducationLongitudinal Study of 1988: Base-Year to Fourth Follow-up Data File User’s Manual ~NCES2002-323!. Washington, DC: U.S. Department of Education, National Center for Educa-tion Statistics.
Davis, Mitzi, Yvonne Dias-Bowie, Katherine Greenberg, Gary Klukken, Howard R. Pollio,Sandra P. Thomas, and Charles L. Thompson ~2004!. “A Fly in the Buttermilk”: Descrip-tions of University Life by Successful Undergraduate Students at a Predominantly WhiteSoutheastern University. Journal of Higher Education, 75~4!: 420–445.
DesJardins, Stephen L., Dennis A. Ahlburg, and Brian P. McCall ~2002!. A Temporal Inves-tigation of Factors Related to Timely Degree Completion. Journal of Higher Education,73~5!: 555–581.
Dinwiddie, Gniesha Y., and Walter R. Allen ~2003!. Two Steps Forward, Three Steps Back:Campus Climate, Gender, and African American Representation in Higher Education. InCarol Camp Yeakey and Ronald D. Henderson ~Eds.!, Surmounting All Odds: Education, Oppor-tunity, and Society in the New Millennium, pp. 563–594. Greenwich, CT: Information Age.
Ehrenberg, Ronald G., Daniel D. Goldhaber, and Dominic J. Brewer ~1995!. Do Teacher’sRace, Gender, and Ethnicity Matter? Evidence from the National Educational Longitudi-nal Study of 1988. Industrial and Labor Relations Review, 48~3!: 547–561.
Ehrmann, Nicholas, and Douglas S. Massey ~2008!. Gender-Specific Effects of EcologicalConditions on College Achievement. Social Science Research, 37~1!: 202–219.
Entwisle, Doris R., Karl L. Alexander, and Linda Steffel Olson ~1994!. The Gender Gap inMath: Its Possible Origins in Neighborhood Effects. American Sociological Review, 59~6!:822–838.
Feagin, Joe, Hernán Vera, and Nikitah Imani ~1996!. The Agony of Education: Black Students atWhite Colleges and Universities. New York: Routledge.
Ferguson, Ann Arnett ~2001!. Bad Boys: Public Schools in the Making of Black Masculinity. AnnArbor, MI: University of Michigan Press.
Hacker, Andrew ~2003!. Mismatch: The Growing Gulf between Men and Women. New York:Scribner.
Hanson, Sandra L. ~1994!. Lost Talent: Unrealized Educational Aspirations and Expectationsamong U.S. Youths. Sociology of Education, 67~3!: 159–183.
Hauser, Robert M., and Douglas K. Anderson ~1991!. Post–High School Plans and Aspira-tions of Black and White High School Seniors: 1976–86. Sociology of Education, 64~4!:263–277.
Hu, Shouping, and Edward P. St. John ~2001!. Student Persistence in a Public Higher Edu-cation System: Understanding Racial and Ethnic Differences. Journal of Higher Education,72~3!: 265–286.
Hudson, Lisa, Sally Aquilino, and Gregory Kienzl ~2005!. Postsecondary Participation Rates bySex and Race/Ethnicity: 1974–2003 ~NCES 2005-028!. Washington, DC: U.S. Departmentof Education, National Center of Education Statistics.
Jencks, Christopher, and Meredith Phillips ~Eds.! ~1998!. The Black White Test Score Gap.Washington, DC: Brookings Institution.
Kao, Grace, and Jennifer Thompson ~2003!. Racial and Ethnic Stratification in EducationalAchievement and Attainment. Annual Review of Sociology, 29~1!: 417–442.
Kao, Grace, and Marta Tienda ~1998!. Educational Aspirations of Minority Youth. AmericanJournal of Education, 106~3!: 349–384.
Karen, David ~1991!. The Politics of Class, Race, and Gender: Access to Higher Education inthe United States, 1960–1986. American Journal of Education, 99~2!: 208–237.
Where Are All the Boys?
DU BOIS REVIEW: SOCIAL SCIENCE RESEARCH ON RACE 5:1, 2008 159
Lopez, Nancy ~2003!. Hopeful Girls, Troubled Boys: Race and Gender Disparity in Urban Educa-tion. New York: Routledge.
MacLeod, Jay ~1995!. Ain’t No Makin’ It: Aspirations and Attainment in a Low-Income Neighbor-hood. Boulder, CO: Westview.
Massey, Douglas S., Camille Z. Charles, Garvey F. Lundy, and Mary J. Fischer ~2003!. TheSource of the River: The Social Origins of Freshmen at America’s Selective Colleges and Universi-ties. Princeton, NJ: Princeton University Press.
Massey, Douglas S., and Mary J. Fischer ~2005!. Stereotype Threat and Academic Perfor-mance: New Findings from a Racially Diverse Sample of College Freshmen. Du Bois Review,2~1!: 45–67.
Mickelson, Roslyn Arlin ~1990!. The Attitude-Achievement Paradox among Black Adoles-cents. Sociology of Education, 63~1!: 44–61.
Nettles, Michael T., and Laura W. Perna ~1997!. The African American Education Data Book:Volume I: Higher and Adult Education. Fairfax, VA: Frederick D. Patterson Research Institute.
Paulsen, Michael B., and Edward P. St. John ~2002!. Social Class and College Costs: Exam-ining the Financial Nexus between College Choice and Persistence. Journal of HigherEducation, 73~2!: 189–236.
Perna, Laura Walter ~2000!. Differences in the Decision to Attend College among AfricanAmericans, Hispanics, and Whites. Journal of Higher Education, 71~2!: 117–141.
Perna, Laura Walter, and Marvin A. Titus ~2005!. The Relationship between Parental Involve-ment as Social Capital and College Enrollment: An Examination of Racial0Ethnic GroupDifferences. Journal of Higher Education, 76~5!: 485–518.
Qian, Zhenchao, and Sampson Lee Blair ~1999!. Racial0Ethnic Differences in EducationalAspirations of High School Seniors. Sociological Perspectives, 42~4!: 605–625.
Sewell, William H., and Vimal P. Shah ~1968!. Social Class, Parental Encouragement, andEducational Aspirations. American Journal of Sociology, 73~5!: 559–572.
Snyder, Thomas ~2002!. Digest of Education Statistics 2002 ~NCES 2003–060!. Washington,DC: U.S. Department of Education, National Center for Education Statistics.
Snyder, Thomas D., Alexandra G. Tan, and Charlene M. Hoffman ~2006!. Digest of EducationStatistics 2005 ~NCES 2006-030!. Washington, DC: U.S. Department of Education, NationalCenter for Education Statistics.
St. John, Edward P., Michael B. Paulsen, and Deborah Faye Carter ~2005!. Diversity, CollegeCosts, and Postsecondary Opportunity: An Examination of the Financial Nexus betweenCollege Choice and Persistence for African Americans and Whites. Journal of HigherEducation, 76~5!: 545–569.
Tinto, Vincent ~1993!. Leaving College: Rethinking the Causes and Cures of Student Attrition, 2nded. Chicago, IL: University of Chicago Press.
Trent, William T. ~1984!. Equity Considerations in Higher Education: Race and Sex Differ-ences in Degree Attainment and Major Field from 1976 through 1981. American Journal ofEducation, 92~3!: 280–305.
Trent, William T. ~1991!. Focus on Equity: Race and Gender Differences in Degree Attain-ment, 1975–76; 1980–81. In Walter R. Allen, Edgar G. Epps, and Nesha Z. Haniff ~Eds.!,College in Black and White: African American Students in Predominantly White and in Histori-cally Black Public Universities, pp. 41–60. Albany, NY: State University of New York Press.
Trusty, Jerry ~2004!. The Effects of Students’ Middle-School and High-School Experiences on Com-pletion of the Bachelor’s Degree ~Research Monograph No. 1!. Amherst, MA: Center forSchool Counseling Outcome Research.
Trusty, Jerry, and Spencer G. Niles ~2004!. Realized Potential or Lost Talent: High SchoolVariables and Bachelor’s Degree Completion. Career Development Quarterly, 53~1!: 2–15.
Rachelle Brunn and Grace Kao
160 DU BOIS REVIEW: SOCIAL SCIENCE RESEARCH ON RACE 5:1, 2008
Related Documents