Journal of Personality and Social Psychology

Welcome message from author
This document is posted to help you gain knowledge. Please leave a comment to let me know what you think about it! Share it to your friends and learn new things together.
Transcript
Journal of Personality and Social Psychology
When Autocratic Leaders Become an Option�Uncertaintyand Self-Esteem Predict Implicit Leadership PreferencesChristiane Schoel, Matthias Bluemke, Patrick Mueller, and Dagmar Stahlberg
Online First Publication, May 2, 2011. doi: 10.1037/a0023393
CITATION
Schoel, C., Bluemke, M., Mueller, P., & Stahlberg, D. (2011, May 2). When Autocratic Leaders
Become an Option�Uncertainty and Self-Esteem Predict Implicit Leadership Preferences.
Journal of Personality and Social Psychology. Advance online publication. doi:
10.1037/a0023393
matthias.bluemke
Typewriter
matthias.bluemke
Typewriter
matthias.bluemke
Textbox
©APA 2011 Note: This article may not exactly replicate the final version published in the APA journal. It is not the copy of record. Schoel, C., Bluemke, M., Mueller, P., & Stahlberg, D. (2011). When autocratic leaders become an option—Uncertainty and self-esteem predict implicit leadership preferences. Journal of Personality and Social Psychology, 101(3), 521-540. doi: 10.1037/a0023393 On online version can be found at: http://psycnet.apa.org/journals/psp/101/3/521.pdf
matthias.bluemke
Accepted set by matthias.bluemke
When Autocratic Leaders Become an Option—Uncertainty andSelf-Esteem Predict Implicit Leadership Preferences
Christiane SchoelUniversity of Mannheim
Matthias BluemkeUniversity of Heidelberg
Patrick Mueller and Dagmar StahlbergUniversity of Mannheim
We investigated the impact of uncertainty on leadership preferences and propose that the conjunction of
self-esteem level and stability is an important moderator in this regard. Self-threatening uncertainty is
aversive and activates the motivation to regain control. People with high and stable self-esteem should
be confident of achieving this goal by self-determined amelioration of the situation and should therefore
show a stronger preference for democratic leadership under conditions of uncertainty. By contrast, people
with low and unstable self-esteem should place their trust and hope in the abilities of powerful others,
resulting in a preference for autocratic leadership. Studies 1a and 1b validate explicit and implicit
leadership measures and demonstrate a general prodemocratic default attitude under conditions of
certainty. Studies 2 and 3 reveal a democratic reaction for individuals with stable high self-esteem and
a submissive reaction for individuals with unstable low self-esteem under conditions of uncertainty. In
Study 4, this pattern is cancelled out when individuals evaluate leadership styles from a leader instead
of a follower perspective.
Keywords: uncertainty, leadership style, self-esteem level, self-esteem stability, Implicit Association Test
Groups are characterized by an internal structure that is more or
less hierarchic. Although some groups make shared decisions with
all members having an equal say in the process, in many groups
there are one or a few individuals who take on the leadership role
to achieve collective goals. How the group is led and who is held
accountable to what degree for the group’s decisions depends on
leadership style. A more democratic leadership style is character-
ized by a high degree of group members’ involvement and partic-
ipation, whereas an autocratic leader makes decisions without
asking the group members for their input (e.g., Van Vugt, Jepson,
Hart, & De Cremer, 2004). Leadership research has shown the
effects of different leadership styles with regard to two different
outcome variables: group satisfaction and group productivity.
Group member satisfaction was more strongly associated with
democratic than autocratic leadership; however, results were
mixed with regard to the group’s success (see Bass, 1990). In line
with contingency models of leadership and group effectiveness,
the success of a certain leadership style does not depend only on
the leader per se but also on the situational context (F. E. Fiedler,
1964; Vroom & Yetton, 1973). As normative models, they specify
those situations in which a democratic or autocratic leadership
style should be more successful and, hence, applied.
Our research focuses not on actual, but supposed, leadership
effectiveness. In our view, leadership emergence and behavior are
strongly influenced by the followers’ and leaders’ beliefs about
what constitutes effective leadership in a given situation. Because
strong democratic values prevail under normal circumstances in
most Western societies, democratic leadership is clearly preferred
over autocratic leadership. But when and why do individuals for-
sake democratic participation and prefer an autocratic leadership
style? The object of this article is to shed some light on the specific
factors that motivate people to submit to an autocratic leader.
Specifically, we are interested in the role of uncertainty and the
combined influence of self-esteem level and stability on leadership
preferences.
Leadership Styles
One of the primary perspectives on the study of leadership
emphasizes the behavior of leaders, that is, what leaders do and, in
particular, how they do it to attain group goals. Leadership styles
can differ in how power is distributed, whose needs are met, and
how decisions are made (Bass, 1990; Lewin, Lippitt, & White,
1939; Yukl, 1998). Although different terms such as employee and
production centered (Likert, 1961) or consideration and initiating
structure (e.g., Fleishman, 1973; Stogdill, 1974) are used, there
seems to be a general distinction between two clusters of leader-
ship styles, with democratic and autocratic leadership at the ex-
treme ends of the spectrum (Bass, 1990; Vroom & Yetton, 1973).
Democratic leaders, on the one hand, encourage group members to
Christiane Schoel, Patrick Mueller, and Dagmar Stahlberg, Department
of Social Psychology, School of Social Sciences, University of Mannheim,
Mannheim, Germany; Matthias Bluemke, Psychological Institute, Univer-
sity of Heidelberg, Heidelberg, Germany.
Correspondence concerning this article should be addressed to Chris-
tiane Schoel, Department of Social Psychology, School of Social Sciences,
University of Mannheim, 68131 Mannheim, Germany. E-mail:
Journal of Personality and Social Psychology © 2011 American Psychological Association2011, Vol. ●●, No. ●, 000–000 0022-3514/11/$12.00 DOI: 10.1037/a0023393
1
employ their own methods and policies and elicit equal input when
decisions are to be made. Autocratic leaders, by contrast, dictate
methods and stages of goal attainment and are unconcerned about
followers’ autonomy and personal development (Lippitt, 1940).
The primary difference between democratic and autocratic leader-
ship lies in the degree of participation granted to other people or,
on the other side of the coin, in the amount of control that group
members have over decision-making processes and courses of
action (Bass, 1990; Van Vugt et al., 2004). In the present studies,
we focus on the evaluation of these two opposing leadership styles.
Distinguishing Leadership Evaluations
Autocratic leadership is typically viewed with aversion (Nielsen
& Miller, 1997; Rutte & Wilke, 1985; Samuelson & Messick,
1986; Van Vugt & De Cremer, 1999), yet a number of studies have
reported divergent evaluations depending on the specific dimen-
sion to be judged. Studies contrasting democratic and autocratic
leadership have consistently shown a higher level of group morale
and work satisfaction under democratic leadership, but results have
been mixed with regard to group productivity (Bass, 1990; Lewin
et al., 1939; Miller & Monge, 1986; Neuberger, 1972). Therefore,
we deem it necessary to distinguish followers’ evaluations of
leadership valence (pleasant vs. unpleasant) from their evaluations
of success (success vs. failure; see also Hogg, 2007, p. 717).
Valence judgments can be seen as the affective, and success
ratings as the cognitive, attitude component of leadership evalua-
tions (multicomponent model of attitudes; Eagly & Chaiken,
1993). These two dimensions do not necessarily coincide. A well-
liked leader might be seen as quite ineffective, and a disliked
leader might be seen as very successful. Despite the differences
between satisfaction and productivity (i.e., valence and success),
the previous findings indicate a general aversion to autocratic
leadership. Therefore, we argue that the default attitude is
prodemocratic. In particular situations, however, we posit that
autocratic leadership becomes an option and that it is crucial to
differentiate between valence and success. Specifically, we inves-
tigated the way in which leader and follower characteristics relate
to perceived uncertainty.
Leader Characteristics and Situational Aspects
Normative leadership theories make predictions about which
leadership style is most effective in a given situation. For instance,
in his contingency theory, F. E. Fiedler (1964, 1967) argued that
autocratic leadership would be most effective in situations of either
very low or very high control. A low control situation would arise
when the structure of the task is unclear, the leader’s position
power is low, and/or leader–member relations are poor. The op-
posite is the case in situations of extremely high control. Demo-
cratic leadership, by contrast, should be most effective in contexts
where situational control lies in between these two extremes. In
their normative decision theory, Vroom and Yetton (1973) have
proposed that autocratic leadership is only effective in decision-
making situations when the task has a clear structure and when
follower commitment and support is high; otherwise, a democratic
leadership style should be more successful. Thus, both models
make different predictions about which leadership style—
democratic versus autocratic—is successful in an ambiguous sit-
uation. Whereas both normative theories predict objective out-
comes as dependent variables, we focus on subjective leadership
evaluations and argue that a person–situation interaction deter-
mines the preferred leadership style. Thus, a particular leadership
style may be seen as more successful, even if it is not.
Follower Characteristics and Situational Aspects
Empirical evidence that follower’s leadership attitudes are in-
fluenced by threatening situations and personality characteristics
comes from the authoritarianism literature and the terror manage-
ment approach. Submissiveness to an autocratic leader is related to
authoritarian submission (e.g., Altemeyer, 1996). Although there is
a long tradition of explaining authoritarianism by interindividual
differences (Adorno, Frenkel-Brunswik, Levinson, & Sanford,
1950; Allport, 1954; Rokeach, 1954; G. D. Wilson, 1973), empir-
ical evidence suggests that authoritarian attitudes and related be-
haviors are also induced by situational factors such as threats and
personal insecurity (e.g., Doty, Peterson, & Winter, 1991; Duckitt
& Fisher, 2003; Sales, 1972, 1973; Sales & Friend, 1973). For
instance, McCann (1997) found that during years of high threat,
presidential elections were more influenced by the perceived
strength and power of the candidates than during times of low
threat. Furthermore, there is support for the interplay of situational
threat and individual predispositions such as preauthoritarianism
(e.g., Feldman, 2003; Feldman & Stenner, 1997; Lavine et al.,
1999; McCann, 2008; Rickert, 1998; Stenner, 2005).
Taken to the extreme, terror management theory supposes that
people who are reminded of death or who perceive a deadly threat
(mortality salience) are the most likely to favor charismatic and
autocratic over relationship-oriented democratic leaders (e.g., Co-
hen, Solomon, Maxfield, Pyszczynski, & Greenberg, 2004). In-
creased support for former charismatic U.S. President George W.
Bush and his counterterrorism policies has been consistently found
under mortality salience and reminders of 9/11 (Cohen, Ogilvie,
Solomon, Greenberg, & Pyszczynski, 2005; Landau et al., 2004;
Nail & McGregor, 2009). More recently, individual difference
variables have also been found to moderate the link between
mortality salience and leadership preferences (Gillath & Hart,
2010; Kosloff, Greenberg, Weise, & Solomon, 2010; Vail, Arndt,
Motyl, & Pyszczynski, 2009; Weise et al., 2008).
Uncertainty and Its Reduction
One commonality that all these different situations share is that
they are ambiguous, unpredictable, and/or associated with loss of
control and potential harm, and thus, they may have a direct impact
on the individual by inducing personal feelings of uncertainty
(Kagan, 1972). Building on social identity theory, Hogg (2009)
argued that self-uncertainty arises from threats to one’s self-view
or to interpersonal relationships (personal self) on the one hand
and threats to one’s membership in social groups (social self) on
the other. We follow this broad definition. The uncertainty manip-
ulations we apply in our studies ask participants to think of
self-threatening uncertainty, but we leave it to the individual
whether he/she thinks of threats to his/her personal or social self.
Although uncertainty can be perceived as a challenge (e.g., Sor-
rentino, Short, & Raynor, 1984; T. D. Wilson, Centerbar, Kermer,
& Gilbert, 2005), we investigate uncertainty as a threat to the self
2 SCHOEL, BLUEMKE, MUELLER, AND STAHLBERG
(Loseman, Miedema, van den Bos, & Vermunt, 2009). Thus,
whether understood as a persistent individual trait (e.g., De Cremer
& Sedikides, 2005; Greco & Roger, 2001) or as a state induced by
contextual variations (van den Bos, 2001), uncertainty should be
extremely aversive and accompanied by feelings of reduced con-
trol over one’s life (e.g., Hogg, 2000; Sedikides, De Cremer, Hart,
& Brebels, 2010).
Consequently, reducing uncertainty has been claimed to be
among the most basic of human needs (e.g., Kagan, 1972; Maslow,
1954). Uncertainty can be reduced, for instance, by experiencing
social integration and group identification (Hogg, 2000), perceiv-
ing fairness (van den Bos & Lind, 2002), or establishing certainty
in unaffected domains such as political attitudes (McGregor,
Zanna, Holmes, & Spencer, 2001). Weary and Edwards (1996; see
also Weary, Tobin, & Edwards, 2010) argued that the choice of
coping strategy to overcome uncertainty depends on a deliberative
process of weighing success expectancies of different potential
resolution strategies. Whether a strategy is employed depends on
the expectation that it will be most successful in reducing uncer-
tainty. When the perceived uncertainty is self-relevant, most indi-
viduals will value uncertainty reduction. Individual differences,
however, should exist with regard to the expectancies associated
with uncertainty reduction strategies. In the following sections, we
explore the role of self-esteem level and self-esteem stability for
success expectancies, before we tie self-esteem back to evaluations
of democratic and autocratic leadership.
Level of Self-Esteem
The expectation of successfully performing an action plan
should be especially high (a) when a person is self-confident about
his/her performance of the behavior and (b) when a person is at the
same time optimistic that this behavior leads to the desired out-
come of reduced uncertainty. The crucial dispositional variable
that determines both components is level of self-esteem. Individ-
uals high in self-esteem (high SEs) have been found to hold a
positive self-view (Baumeister, Campbell, Krueger, & Vohs, 2003;
Ross & Wilson, 2002; A. E. Wilson & Ross, 2001), to believe they
are superior to others in many domains (Brown, 1986; Marsh,
1986), to be self-confident in their viewpoints and actions, and,
thus, to be willing to voice their opinion (Brockner et al., 1998;
LePine & Van Dyne, 1998). In contrast, individuals low in self-
esteem (low SEs) hold more negative attitudes toward themselves
(Baumeister, 1993; Rosenberg, 1979) and are less self-confident
(Brockner, 1983), especially after failure (McFarlin & Blascovich,
1981). In addition, high SEs have been shown to be more opti-
mistic (e.g., Scheier, Carver, & Bridges, 1994) and to hold more
positive illusions than low SEs (Aspinwall & Taylor, 1992;
Brown, Collins, & Schmidt, 1988; Taylor & Brown, 1988). There-
fore, high SEs should be more self-confident and optimistic about
successfully reducing uncertainty than low SEs, who should have
more doubts that their behavior would actually make a difference
in overcoming an uncertain situation.
Stability of Self-Esteem
In addition to absolute level of self-esteem, individuals differ in
the stability of their self-esteem (for an overview, see Kernis,
2005; Kernis & Lakey, 2010). Individuals with stable self-esteem
(stable SEs) have secure and enduring feelings of self-worth and a
clearly defined self-concept. They rely on internal more than on
external validation strategies, and their self-worth is not much
affected by situational short-term variations. Individuals with un-
stable self-esteem (unstable SEs), however, hold unsettled and
insecure feelings of self-worth, and their self-concept is character-
ized by confusion, conflict, and self-doubt. They experience sub-
stantial changes of self-esteem level in the presence of external
evaluative cues (e.g., interpersonal feedback) and internal self-
generated information (e.g., salience of specific self-aspects). Not
surprisingly, self-esteem stability affects the self-regulatory styles
of goal pursuit (Deci & Ryan, 1985). Whereas stable SEs are
agentic and self-determined, unstable SEs are more influenced by
external and internal pressures (Kernis, Paradise, Whitaker,
Wheatman, & Goldman, 2000). This pattern should extend to
uncertainty reduction, too: Stable SEs should be more self-
confident and self-determined when it comes to successfully re-
ducing uncertainty than unstable SEs, who should be more likely
to rely on others.
Impact of Level and Stability of Self-Esteemon Choice of Action Plan
During decision making, especially in (uncertain) group situa-
tions, one can generally try to maximize or minimize one’s input.
A democratic leadership style encourages greater input by follow-
ers than an autocratic leadership style. Whether people prefer
increasing or reducing their input should depend on the expecta-
tion that their chosen strategy is potentially successful in reducing
uncertainty. As high SEs are more confident and optimistic, their
process of weighing the alternative action plans should result in
higher expectations of successfully performing those behaviors
that make a difference in the situation, whereas low SEs would not
believe that they could successfully carry out action plans that
reduce uncertainty. In a comparable process, stable SEs should
prefer an agentic and self-determined way of uncertainty reduc-
tion, whereas unstable SEs should be more inclined to rely on
external sources. Therefore, both high and stable SEs should be
motivated to maximize their input, whereas low and unstable SEs
should prefer to minimize their input in decision-making situations
under uncertainty. Given the differences in self-concepts, stable
high SEs should strive for even more participation and input than
they normally would. This, in turn, is compatible only with dem-
ocratic leadership. Hence, their preference for democratic leader-
ship should be increased. We refer to this effect as the democratic
reaction. By contrast, unstable low SEs should place the respon-
sibility for the decision-making process on someone else. Not
trusting the effectiveness of raising their own voice, they look for
an autocratic leader to reduce uncertainty. Hence, their evaluation
of the autocratic leadership style will become more favorable. We
refer to this effect as the submissive reaction. As we assume that
level and stability of self-esteem operate in the same way, we
predict additive effects of the two variables on uncertainty reduc-
tion. This idea is in line with Kernis et al. (2000) who found
additive effects of SE level and SE stability on self-regulatory
styles and self-concept clarity.
3UNCERTAINTY AND LEADERSHIP PREFERENCES
Hypotheses on Valence and Success Evaluationsof Leadership
To develop a full-blown set of hypotheses, we return to the
question of how the different patterns of democratic and submis-
sive reactions can be observed—given that feelings and thoughts
do not necessarily coincide, and given that leadership valence and
leadership success are independent evaluation dimensions. Dem-
ocratic leadership communicates both appreciation and mutual
respect (Tyler & Lind, 1992), whereas autocratic leadership is
linked to strong negative emotions (Bass, 1990; De Cremer, 2007;
Judge, Piccolo, & Ilies, 2004). Therefore, we assume that stable
high SEs and unstable low SEs consensually like democratic
leadership more than autocratic leadership—regardless of the de-
gree of uncertainty. Yet, only stable high SEs should believe that
they can successfully reduce uncertainty by engaging in the prob-
lem solving process. As the outcomes of democratic leadership
depend on the group members’ input, stable high SEs should
associate democratic leadership with success, which is consistent
with their self-view. Such a link, however, is inconsistent with the
self-concept of unstable low SEs. They should expect uncertainty
reduction not from democratic, but from autocratic leaders who (to
them and only to them) promise a means of overcoming states of
uncertainty.
On the basis of these arguments, we claim that under conditions
of certainty, a prodemocratic default attitude prevails (Hypothesis
1). Conditions of uncertainty, however, should cause a democratic
reaction in individuals with high and stable self-esteem (Hypoth-
esis 2) and a submissive reaction in individuals with low and
unstable self-esteem (Hypothesis 3). Both reactions should be
evident mainly on cognitive measures of success but less so on
affective measures of valence. To unravel the differential reac-
tions, we developed explicit and implicit measures that discrimi-
nate valence from success evaluations. Because of strong demo-
cratic values, the expression of preferences for an autocratic leader
might conflict with motivations of social desirability. We therefore
expected the differences between stable high and unstable low
SEs—especially the submissive reaction—to be more pronounced
on implicit than on explicit measures.
Study Overview
Studies 1a and 1b were designed to test Hypothesis 1—that
under conditions of certainty, democratic leadership is clearly
preferred to autocratic leadership—and to validate the new mea-
sures of leadership evaluation. In Study 2, state (un)certainty was
manipulated to provide evidence for Hypotheses 2 and 3, that
stable high SEs show a democratic reaction and that unstable low
SEs show a submissive reaction to uncertainty. Study 3 aimed at
replicating the submissive reaction of unstable low SEs by merely
making trait uncertainty salient. Whereas in Studies 1a–3 we
focused on follower’s reactions to uncertainty, in Study 4, we also
investigated the influence of being in a leadership position com-
pared with being in a follower position.
Study 1a
To assess the initial, unadulterated valence and success associ-
ations linked to democratic and autocratic leadership, in addition to
explicit endorsement of leadership styles, we developed two Im-
plicit Association Tests (IATs; Greenwald, McGhee, & Schwartz,
1998): a valence IAT and a success IAT. Study 1a tested Hypoth-
esis 1 that under conditions of certainty individuals clearly prefer
democratic over autocratic leadership, and that this holds for both
valence and success evaluations as well as for implicit and explicit
measures.
Method
Pretest. To choose the stimuli for the valence and the success
IATs, we conducted a pretest with a set of potential leadership,
valence, and success items. The aim was to reduce the influence of
irrelevant associations between target and attribute dimensions as
far as possible (Bluemke & Friese, 2006; Steffens & Plewe, 2001).
Participants rated 70 leadership items on 7-point scales as more
authoritarian or more democratic (n1 5 16), pleasant or unpleasant
(n2 5 16), or associated with success or failure (n3 5 16). Note
that we used the word “authoritarian” instead of “autocratic,” as it
is much more common in German everyday speech. The adjectives
chosen for the IAT, however, describe an autocratic leadership
style.
We chose five autocratic words (e.g., dominant, directive), five
democratic words (e.g., liberal, team player), five pleasant words
(e.g., diamond, angel), five unpleasant words (e.g., dirt, slime),
five success-associated words (e.g., benefit, victory), and five
failure-associated words (e.g., loss, flop)—see the Appendix for a
complete list of German IAT stimuli and their English translations.
We selected items in such a way that average word length and
number of syllables of complementary target categories and com-
plementary attribute categories were kept constant. The aim was
that autocratic and democratic leadership items (a) could be clearly
distinguished (1 5 authoritarian, 7 5 democratic), Ms 5 2.68
versus 5.23, t(4) 5 –7.36, p 5 .002; (b) were equally strongly
related to positive and negative valence (1 5 pleasant, 7 5
unpleasant), Ms 5 3.97 versus 3.20, t(4) 5 1.38, p 5 .24; and (c)
were equally strongly related to success versus failure (1 5 suc-
cess, 7 5 failure), Ms 5 3.43 versus 3.48, t(4) 5 –0.08, p 5 .94.
In addition, all participants rated 42 valence and 40 success items
presented in mixed order on 7-point scales as more typical for
autocratic or democratic leadership (1 5 authoritarian, 7 5 dem-
ocratic). The tendency to evaluate democratic leadership more
positively than autocratic leadership prevented a full elimination of
cross-category associations for the attribute items: Positive (neg-
ative) items were perceived to be more in line with the democratic
(autocratic) side of the scale, Ms 5 4.45 versus 3.46, t(4) 5 6.15,
p 5 .004, just as success rather than failure items were related to
democratic leadership, Ms 5 4.50 versus 3.47, t(4) 5 4.37, p 5
.01. Although both tendencies already indicated a preexisting
preference for democratic leadership and an aversion to autocratic
leadership, we reduced these asymmetries as much as possible.
Participants and procedure. Forty students from a German
university (20 women; Mage 5 22.2 years) participated in a 15-min
study on “Leadership Attitudes” in return for 1 Euro and a choc-
olate bar. Up to six participants at a time were present in the
laboratory. After participants agreed to informed consent and
provided standard demographic information, we induced state
certainty via a priming procedure adapted from van den Bos
(2001) by asking participants to respond to the following two
4 SCHOEL, BLUEMKE, MUELLER, AND STAHLBERG

questions: “Please briefly describe the emotions that the thought of
you being certain of yourself arouses in you,” and “Please write
down what you think physically happens to you as you feel certain
of yourself.” Next, participants completed both the valence and the
success IATs in counterbalanced order. Finally, we assessed par-
ticipants’ explicit leadership valence and success evaluations.
Measures.Implicit leadership measures. Both valence and success IATs
required participants to categorize democratic and autocratic target
items jointly with either (a) pleasant and unpleasant or (b) success
and failure attribute stimuli as quickly and as accurately as possi-
ble (see Greenwald et al., 1998, for details). Aside from training
trials for the single discrimination of target and attribute items,
each IAT had two critical blocks. In the compatible block (i.e.,
consistent with democratic values), the same response key was
used for democratic and pleasant (success) stimuli, and the other
key was used for autocratic and unpleasant (failure) stimuli. In the
incompatible block (i.e., inconsistent with democratic values), key
assignments were switched so that responses to autocratic and
pleasant (success) stimuli shared a key, and democratic and un-
pleasant (failure) stimuli likewise.
The IATs were administered according to a seven-block struc-
ture (Greenwald, Nosek, & Banaji, 2003). For each IAT, partici-
pants worked on the following tasks: training the categorization of
leadership items (Block 1: 10 trials); training the sorting of valence
(success) attribute items (Block 2: 10 trials); practicing combined
trials with democratic 1 pleasant (success) stimuli and auto-
cratic 1 unpleasant (failure) stimuli sharing a response key (Block
3: 20 trials); the critical trials of the same combination (Block 4: 40
trials); practicing the reversed response-key assignment for lead-
ership stimuli (Block 5: 10 trials); practicing the incompatible
combination of autocratic 1 pleasant (success) and democratic 1
unpleasant (failure) stimuli (Block 6: 20 trials); and repeating these
trials as a critical test (Block 7: 40 trials). In the critical blocks,
each stimulus was presented twice, and target and attribute stimuli
alternated. IAT block orders were counterbalanced: Half of the
participants completed the compatible blocks first, the other half
started with the incompatible blocks.
IAT data preparation. Mean response latencies of correct
responses (in milliseconds) for each block as well as the proportion
of error rates were available. We excluded those participants
whose results indicated a lack of motivation as evident in error
rates of more than 30% in either the compatible or the incompat-
ible block (two participants for the valence IAT, three participants
for the success IAT). Prior to aggregation, IAT response latencies
lower than 300 ms or higher than 3,000 ms were recoded as 300 ms
and 3,000 ms, respectively. We dropped the first trial of each block
because they typically far exceeded the mean. Latencies for both
IATs were individually z-transformed by subtracting a partici-
pant’s latency grand mean and dividing the result by a participant’s
overall standard deviation (Bluemke & Friese, 2006). This proce-
dure of data trimming and preparation, which is similar to the
D-algorithm (Greenwald et al., 2003), was employed in all of the
following IAT studies.1
The crucial dependent variable, the IAT effect, was calculated
as the mean latency difference between the incompatible and
compatible conditions (Blocks 4 and 7, respectively). Whereas
positive difference scores reflected a tendency to more quickly
associate pleasantness (success) with democratic than with auto-
cratic leadership, negative scores can be interpreted as a stronger
association of pleasantness (success) with autocratic leadership.
The resulting valence and success IAT effects were reliable (as 5
.74 and .80, respectively).
General explicit leadership measures. The general valence
scale asked 3 (3 2) questions, “How positive/pleasant/enjoyable
do you think democratic (authoritarian) leadership is?” (1 5 not at
all, 7 5 extremely). Analogously, the general success scale asked
“How successful/efficient/profitable do you think democratic (au-
thoritarian) leadership is?” (1 5 not at all, 7 5 extremely). The
four subscales each consisted of three questions: general valence
of democratic leadership (a 5 .85) and autocratic leadership (a 5
.91) as well as general success of democratic leadership (a 5 .76)
and autocratic leadership (a 5 .75). To compare the explicit
evaluations with the IAT effects, a difference score of relative
favoritism was computed by subtracting autocratic from demo-
cratic scores such that positive values indicated a preference for
democratic leadership, and negative values indicated a preference
for autocratic leadership.
Results and Discussion
First, both the valence and success IAT effects were subjected to
2 (order of IATs: valence–success vs. success–valence) 3 2 (order
of blocks: compatible–incompatible vs. incompatible–compatible)
analyses of variance. As there were no significant main or inter-
action effects (all ps . .10), we conducted the further analyses
regardless of these order conditions. In line with Hypothesis 1,
two-sided t tests revealed that the valence and success IAT effects
were positive (M 5 0.44, SD 5 0.39, and M 5 0.38, SD 5 0.48,
respectively) and differed significantly from 0, t(37) 5 6.82, p ,
.001, and t(36) 5 4.84, p , .001, respectively, indicating prefer-
ences for democratic compared with autocratic leadership on both
the valence and the success dimensions.
The comparative explicit measures of general valence difference
(M 5 4.15, SD 5 1.75) and general success difference (M 5 1.25,
SD 5 2.34) mirrored these findings by converging on an explicit
democratic preference, t(38) 5 14.86, p , .001, and t(38) 5 3.33,
p 5 .002,2 respectively.
In sum, Study 1a introduced newly developed explicit and
implicit measures to assess valence and success evaluations of
democratic and autocratic leadership. As predicted, when primed
with certainty, participants clearly preferred democratic over au-
tocratic leadership on both explicit and implicit measures as well
as with regard to valence and success. Irrespective of the order of
IAT blocks, and independent from the order of measures, the
average default attitude was democratic (Hypothesis 1).
1 All of the reported results are also significant at least at p , .05 when
analyzed with a D5-algorithm (Greenwald et al., 2003), except for Study 3,
which yielded only a marginally significant beta-weight of .30 ( p 5 .09)
instead of .46 ( p 5 .01) for the interaction term. As the D-algorithms apply
error penalties and our experimental manipulations may have affected the
number or causes of erroneous trials, the D-algorithms run the risk of
introducing nuisance variance that does not reflect the associations prop-
erly, thus masking the hypothesized outcomes.2 Lower degrees of freedom stem from the fact that one participant failed
to complete the explicit measures.
5UNCERTAINTY AND LEADERSHIP PREFERENCES
Study 1b
Study 1b further validated the explicit and implicit measures of
leadership evaluation by examining their intercorrelations and
their links to related constructs such as political orientation (Jost et
al., 2007), right-wing authoritarianism (RWA; Altemeyer, 1996),
and social dominance orientation (SDO; Pratto, Sidanius, Stall-
worth, & Malle, 1994).
Method
Participants and procedure. One-hundred and fifty partic-
ipants (108 women; Mage 5 25.2 years), mainly students from
German universities, completed the 20-min online survey on “New
Measures of Attitudes and Personality.” Participants were re-
cruited through an online pool. In return, they received the chance
to win one of 10 book coupons (worth 10 Euros each). Study 1b
had a 2 (order of measures: explicit–implicit vs. implicit–
explicit) 3 2 (order of content: valence–success vs. success–
valence)3 factorial design, with participants randomly assigned to
conditions. After agreeing to informed consent, participants pro-
vided standard demographic information and stated their political
orientation on a rating scale (1 5 extremely liberal, 9 5 extremely
conservative; cf. Jost et al., 2007). The mean political orientation
for our sample, M 5 3.71 (SD 5 1.50), indicated a slightly more
liberal than conservative ideological position, if one takes the
midpoint of the scale as a reference point, t(149) 5 –10.59, p ,
.001. Next, participants completed the explicit and implicit mea-
sures assessing their attitudes toward democratic and autocratic
leadership in counterbalanced order. Within the block of implicit
and explicit measures, the valence and success IATs were also
balanced. Finally, the RWA and the SDO scales were assessed.
Measures.Implicit leadership measures. Participants completed the va-
lence IAT (a 5 .72) and the success IAT (a 5 .63) as described
in Study 1a in counterbalanced order. Diverging from Study 1a,
however, all participants completed the compatible blocks before
the incompatible blocks to reduce irrelevant error variance that
could obscure correlations.4
Item-based explicit leadership measures. As in the pretest
sample, participants evaluated each of the 10 democratic and
autocratic items used in the valence and the success IATs. Regard-
ing the valence dimension, participants were asked “How pleasant
or unpleasant do you think the following leadership characteristics
are?” (1 5 extremely pleasant, 7 5 extremely unpleasant). Re-
garding the success dimension, the question was “How strongly
are the following leadership characteristics connected to success or
failure?” (1 5 extreme success, 7 5 extreme failure). The ratings
for these items were aggregated to form four different subscales:
valence of democratic (a 5 .60) and autocratic (a 5 .72) items as
well as success attributed to democratic (a 5 .50) and autocratic
(a 5 .71) items. To compare the item-based evaluations with the
IAT effects, items were reverse coded, and a difference measure of
relative favoritism was computed by subtracting autocratic from
democratic item scores such that positive values indicated more
ascribed pleasantness or success for democratic leadership, and
negative values more ascribed pleasantness or success for auto-
cratic leadership.
Additionally, participants were asked to rate the 10 items on
bipolar scales to reflect the relative evaluation as it is prominent in
the IAT: “How democratic or authoritarian do you think the
following leadership characteristics are?” (1 5 extremely demo-
cratic, 7 5 extremely authoritarian; as 5 .54 and .61 for demo-
cratic and autocratic items, respectively).
General explicit leadership measures. General explicit va-
lence and success evaluations of democratic and autocratic lead-
ership were assessed with the four subscales introduced in Study
1a: general valence of democratic leadership (a 5 .93) and auto-
cratic leadership (a 5 .91) as well as general success of demo-
cratic leadership (a 5 .87) and autocratic leadership (a 5 .84).
Difference scores of relative preference were computed by sub-
tracting autocratic from democratic scores.
RWA. Subsequently, participants completed a German trans-
lation of Duckitt, Bizumic, Krauss, and Heled’s (2010) 36-item
scale on RWA (a 5 .92). Sample items were as follows: “It is
important that we preserve our traditional values and moral stan-
dards” (traditionalism, a 5 .82); “The real keys to the ‘good life’
are respect for authority and obedience to those who are in charge”
(authoritarian submission, a 5 .85); and “What our country really
needs is a tough, harsh dose of law and order” (authoritarian
aggression, a 5 .88). Responses were provided on 7-point rating
scales (1 5 strongly disagree, 7 5 strongly agree).
SDO. Finally, participants completed a German 14-item ver-
sion of the SDO scale (Pratto et al., 1994). A sample item (a 5
.87) was as follows: “Some groups of people are simply inferior to
other groups.” Responses were provided on 7-point rating scales
(1 5 strongly disagree, 7 5 strongly agree).
Results
Democratic default attitude. As in Study 1a, the IAT effects
were positive and in line with a democratic default attitude. With-
out counterbalancing the IAT block orders, however, the overall
positive mean scores of the IATs (cf. Table 1) are ambiguous and
should not be interpreted as clearly democratic or autocratic, as
block order was confounded with block compatibility, and mere
learning curves or fatigue effects could have influenced the out-
comes. Therefore, we focus on the results of the explicit leadership
measures.
As intended, two-sided t tests showed that democratic items
were actually seen as more democratic, and autocratic items were
seen as more autocratic, that is, sample means of democratic items
were all significantly lower than the scale midpoint of 4 (all ps ,
.001), and means of autocratic items were all significantly higher
than 4 (all ps , .001). Notably, the item-based valence difference
was significantly higher than 0, indicating a preference for dem-
ocratic leadership, t(149) 5 13.84, p , .001. The item-based
success difference just failed to reach a conventional level of
significance, t(149) 5 1.49, p 5 .13, but pointed in the same
direction. The comparative measures of general valence difference
and general success difference clearly reflected the democratic
3 Comparisons on Fischer’s r-to-z transformations showed no significant
differences between correlations because of order of implicit and explicit
measures, or valence and success measures. Therefore, only combined
correlations are reported.4 We applied this standardized block order in all of the following studies
(Studies 1b–4).
6 SCHOEL, BLUEMKE, MUELLER, AND STAHLBERG
default attitude, t(149) 5 19.06, p , .001, and t(149) 5 4.72, p ,
.001, respectively (cf. Table 1).
Correlations of explicit and implicit leadership measures.Although the valence and the success IATs were weakly related,
we found support for a specific relationship between implicit and
explicit leadership measures (cf. Table 1). First, the valence IAT
was specifically related to the item-based and the general valence
difference, but not to the corresponding explicit success measures.
Likewise, the success IAT correlated significantly with the item-
based and the general success difference scores, but not with the
corresponding explicit valence measures. This specific pattern of
implicit–explicit correlations indicates that both IATs tap into
different dimensions: valence and success.
Correlations with other explicit measures. No relationships
existed between the valence IAT and the RWA scale or one of its
subscales. The success IAT, however, was negatively related to the
overall RWA scale, driven mainly by the subscale of traditional-
ism, but not by authoritarian submission and aggression. Neither
the valence nor the success IAT correlated with SDO, which lends
support to the unique explanatory value of SDO. Item-based and
general valence differences showed negative correlations with
political orientation, the full RWA scale (including all of its
subscales), and the SDO scale. Item-based and general success
differences mainly replicated these findings, with the exceptions
that both explicit success measures were unrelated to political
orientation, and that the item-based success difference yielded no
significant correlation with RWA-traditionalism.
Thus, the correlations of implicit and explicit measures were
specific, whereas all explicit measures were highly interrelated and
did not show a distinct pattern (cf. Table 1).
Discussion
Study 1b replicated the finding that democratic leadership is
preferred to autocratic leadership on explicit measures and re-
vealed specific correlations between explicit and implicit mea-
sures. The size of the implicit–explicit correlations is in line with
previous meta-analyses across various domains (Greenwald,
Poehlman, Uhlmann, & Banaji, 2009; Hofmann, Gawronski,
Gschwendner, Le, & Schmitt, 2005; Nosek, Greenwald, & Banaji,
2005). Importantly, both IATs displayed characteristic correlations
with their respective explicit leadership evaluations. In addition,
the success IAT effects were significantly, and negatively, related
to RWA, and in particular to RWA-traditionalism. These findings
corroborate how important it is to distinguish between success
expectations and valence attributions associated with leadership.
That RWA-submission and RWA-aggression failed to turn up
similarly strong relationships may be due to stronger social desir-
ability effects, resulting in more pronounced implicit–explicit dis-
crepancies (Degner, Wentura, & Rothermund, 2006). Whereas
these results indicate that the success IAT displays convergent
validity, negligible relationships to SDO indicate divergent valid-
ity for the implicit measures, too. The new explicit leadership
scales, both item-based and general evaluations of leadership va-
lence and success, correlated less specifically with preexisting
dimensions such as political orientation, RWA and SDO, attesting
to the general conservative belief and value system as an under-
lying dimension.
Study 2
Whereas Study 1a demonstrated that, under certainty, most of
the participants clearly preferred democratic over autocratic
leadership, Study 2 aimed at providing empirical evidence for
the hypothesized difference in reactions to uncertainty of stable
high and unstable low SEs. We predicted that, compared with a
certainty condition, state uncertainty would increase stable high
SEs’ success expectations of democratic leadership because of
their confidence in overcoming the perceived uncertainty re-
sulting in a democratic reaction (Hypothesis 2). In contrast,
state uncertainty should reduce unstable low SEs’ success eval-
uations of democratic leadership because of doubts regarding
their own ability to amend the situation, resulting in a submis-
sive reaction (Hypothesis 3).
In other words, we postulated that level and stability of self-
esteem function conjointly in predicting leadership evaluations
under uncertainty. Consistently, in a recent meta-analysis, Okada
(2010) found that self-esteem level and instability were not inde-
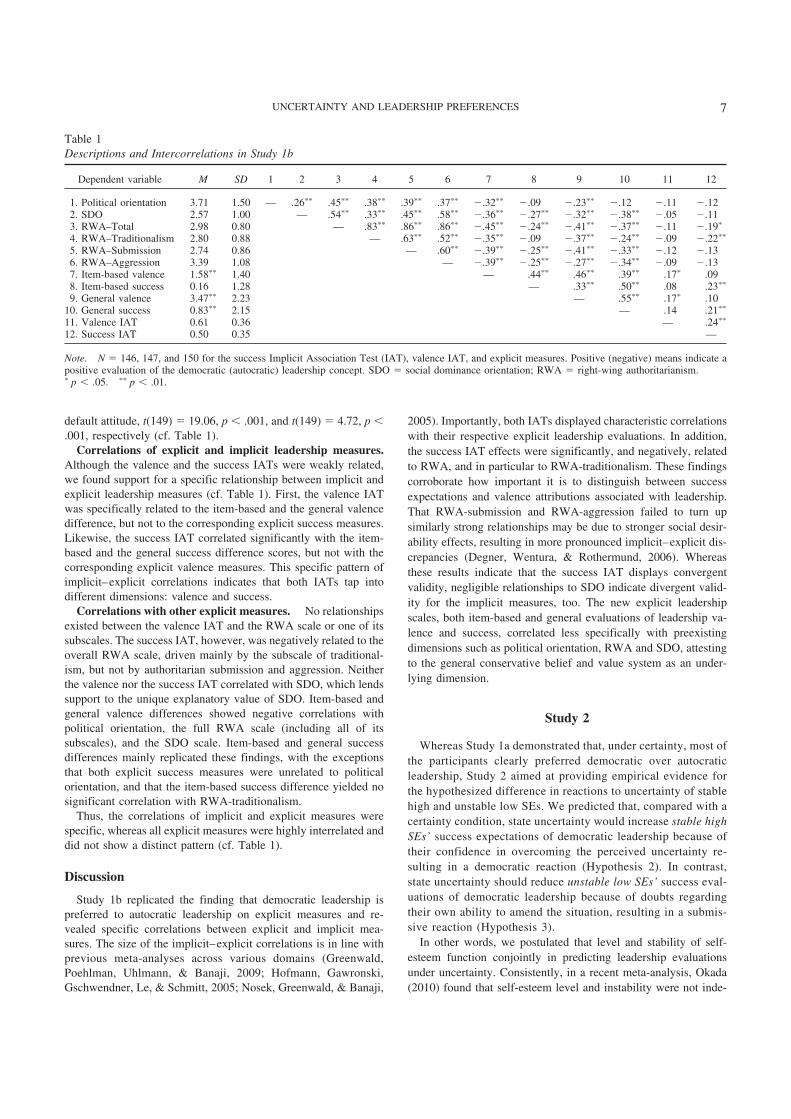
Table 1
Descriptions and Intercorrelations in Study 1b
Dependent variable M SD 1 2 3 4 5 6 7 8 9 10 11 12
1. Political orientation 3.71 1.50 — .26pp .45pp .38pp .39pp .37pp 2.32pp 2.09 2.23pp 2.12 2.11 2.122. SDO 2.57 1.00 — .54pp .33pp .45pp .58pp 2.36pp 2.27pp 2.32pp 2.38pp 2.05 2.113. RWA–Total 2.98 0.80 — .83pp .86pp .86pp 2.45pp 2.24pp 2.41pp 2.37pp 2.11 2.19p
4. RWA–Traditionalism 2.80 0.88 — .63pp .52pp 2.35pp 2.09 2.37pp 2.24pp 2.09 2.22pp
5. RWA–Submission 2.74 0.86 — .60pp 2.39pp 2.25pp 2.41pp 2.33pp 2.12 2.136. RWA–Aggression 3.39 1.08 — 2.39pp 2.25pp 2.27pp 2.34pp 2.09 2.137. Item-based valence 1.58pp 1.40 — .44pp .46pp .39pp .17p .098. Item-based success 0.16 1.28 — .33pp .50pp .08 .23pp
9. General valence 3.47pp 2.23 — .55pp .17p .1010. General success 0.83pp 2.15 — .14 .21pp
11. Valence IAT 0.61 0.36 — .24pp
12. Success IAT 0.50 0.35 —
Note. N 5 146, 147, and 150 for the success Implicit Association Test (IAT), valence IAT, and explicit measures. Positive (negative) means indicate apositive evaluation of the democratic (autocratic) leadership concept. SDO 5 social dominance orientation; RWA 5 right-wing authoritarianism.p p , .05. pp p , .01.
7UNCERTAINTY AND LEADERSHIP PREFERENCES

pendent from each other but were interrelated (r 5 –.31).5 We
created a new variable of conjoint self-esteem by aggregating both
(z-standardized) variables, and we investigated the interactional
effect with (un)certainty on leadership evaluations. On the other
hand, a number of studies have demonstrated a significant Self-
Esteem Level 3 Self-Esteem Stability interaction with regard to a
variety of phenomena (for an overview, see Kernis, 2005). To do
justice to both perspectives, we tested a 2 (state @un#certainty) 3 2
(self-esteem level) 3 2 (self-esteem stability) model as well as our
predicted 2 (state @un#certainty) 3 2 (conjoint of self-esteem level
and stability) model.
We particularly expected differential uncertainty reactions to be
evident in changes of cognitive success expectations, but not in
changes of affective valence judgments, as these rely by definition
on feelings toward the attitude object and are relatively indepen-
dent of cognitive processes, that is, the evaluation of success. In
addition, as a preference for autocratic leadership is inconsistent
with the predominant social norm of democratic values in Western
societies, we expected stronger effects on implicit than on explicit
success measures.
Method
Participants and design. One hundred and twenty-eight stu-
dents from a German university participated in a 15-min study on
“Self-Perception” in return for 1 Euro and a chocolate bar. Up to
six participants at a time were present in the laboratory. One
participant failed to complete the uncertainty manipulation and
was excluded from further analyses, resulting in a total sample size
of 127 participants (78 women; Mage 5 22.0 years). On average,
participants stated their political orientation to be slightly more
liberal than conservative (1 5 extremely liberal, 9 5 extremely
conservative), M 5 4.36 (SD 5 1.29). As a first step, we tested a
2 (state @un#certainty: certain vs. uncertain) 3 2 (self-esteem level:
high vs. low) 3 2 (self-esteem stability: high vs. low) factorial
design. Because we expected additive effects of self-esteem level
and stability, in a second step we tested a 2 (state @un#certainty:
certain vs. uncertain) 3 2 (conjoint self-esteem: high level 1 high
stability vs. low level 1 low stability) factorial design. Participants
were randomly assigned to (un)certainty conditions, whereas self-
esteem level and stability were measured.
Procedure. After signing informed consent and providing
standard demographic information, participants were primed with
state certainty versus state uncertainty. Second, we controlled for
potential mood effects. Third, participants completed the implicit
leadership measures. To prevent carryover effects, this study dif-
fered from Studies 1a and 1b in that implicit always preceded
explicit leadership measures and that participants were randomly
assigned to one of the two IATs (valence IAT vs. success IAT).
Fourth, the explicit general leadership measures were administered
to all participants. Fifth, participants completed personality ques-
tionnaires regarding level and stability of self-esteem as well as
emotional uncertainty (EU), the latter to control for the influence
of trait uncertainty. Finally, participants filled in a manipulation
check on uncertainty.
Independent variables.(Un)certainty priming. We manipulated (un)certainty by ask-
ing participants to respond to the following two questions (adapted
from van den Bos, 2001): “Please briefly describe the emotions
that the thought of you being (un)certain of yourself arouses in
you,” and “Please write down what you think physically happens
to you as you feel (un)certain of yourself.”
Self-esteem level. Level of self-esteem was assessed by a
German 10-item version of the Rosenberg’s (1965) Self-Esteem
Inventory. A sample item (a 5 .90) was as follows: “I feel that I
am a person of worth, at least on an equal basis with others.”
Responses were provided on 4-point rating scales (1 5 strongly
disagree, 4 5 strongly agree).
Self-esteem stability. Self-esteem stability was assessed by a
German 5-item version of the Labile Self-Esteem Scale (Dykman,
1998; see also De Cremer & Sedikides, 2005). A sample item (a 5
.91) was as follows: “Compared to most people, my self-esteem
shifts rapidly from feeling good about myself one day to feeling
bad about myself the next day.” Five-point Likert scales were used
(1 5 strongly disagree, 5 5 strongly agree). Items were reverse
coded so that higher values represented higher stability instead of
lability.
Conjoint self-esteem. We calculated conjoint self-esteem by
averaging z-standardized self-esteem level and self-esteem stabil-
ity scores. The correlation between self-esteem level and stability
was r(127) 5 .55, p , .001.6
Dependent variables.General explicit leadership measures. General explicit va-
lence and success evaluations of democratic and autocratic lead-
ership were assessed with the four subscales introduced in Study
1a: general valence of democratic leadership (a 5 .83) and auto-
cratic leadership (a 5 .90) as well as general success of demo-
cratic leadership (a 5 .78) and autocratic leadership (a 5 .75).
Difference scores of relative preference were computed by sub-
tracting autocratic from democratic scores. Because of their lower
reliability scores in Study 1b, item-based evaluations were not
assessed.
Implicit leadership measures. Participants completed either
the valence IAT (a 5 .70) or the success IAT (a 5 .77) as
described in Study 1b. As we were more interested in individual
differences than in the overall mean scores of the IATs, we kept a
standardized block order to reduce irrelevant error variance.
Control variables.Manipulation check on (un)certainty. We asked participants
to indicate whether they had thought more strongly of certainty or
uncertainty (1 5 certainty, 7 5 uncertainty) during the completion
of the (un)certainty manipulation.
Mood. Participants completed the Positive and Negative Af-
fect Schedule (PANAS-X; Watson, Clark, & Tellegen, 1988).
Twenty items assessed how they felt at the time by means of
5-point rating scales (1 5 strongly disagree, 5 5 strongly agree).
5 Note that we speak of self-esteem stability, that is, the opposite of
self-esteem instability, and therefore we predict a positive, and not a
negative, relation with self-esteem level.6 Note that our correlation was higher than that found in the meta-
analysis of Okada (2010), r 5 –.31. This finding can be explained by the
type of measurement applied. Whereas we assessed self-esteem stability
via a questionnaire, most of the studies in the meta-analysis used a repeated
measurement technique. Okada has already pointed out the differences
between different ways of assessing self-esteem stability.
8 SCHOEL, BLUEMKE, MUELLER, AND STAHLBERG
Half of the items measured Positive Affect (PA; a 5 .84), and the
other half assessed Negative Affect (NA; a 5 .88).
EU. EU was assessed by a German version of a subscale of
the Uncertainty Response Scale (Greco & Roger, 2001). The 15
items assess the extent to which participants experience uncer-
tainty as emotionally threatening (a 5 .88), for instance, “When
uncertain about what to do next, I tend to feel lost” (1 5 strongly
disagree, 7 5 strongly agree).7
Results
Control variables.Manipulation check on (un)certainty. The manipulation
check on uncertainty was subjected to a multiple regression anal-
ysis by including (un)certainty, self-esteem level, and self-esteem
stability as predictors in Step 1, the two-way interaction terms in
Step 2, and the three-way interaction term in Step 3.8 The pre-
dicted main effect of uncertainty was significant, b 5 .54,
t(122) 5 7.39, p , .001, showing that individuals in the uncer-
tainty condition reported more uncertainty (M 5 5.03, SD 5 1.86)
than individuals in the certainty condition (M 5 2.65, SD 5 1.73).
In addition, only a significant main effect of self-esteem level
occurred, b 5 –.22, t(122) 5 –2.48, p 5 .01 (all other ps . .22).
A multiple regression analysis with (un)certainty and conjoint
self-esteem as predictors in Step 1, and the two-way interaction
term in Step 2, revealed significant main effects for (un)certainty,
b 5 .54, t(123) 5 7.40, p , .001, and conjoint self-esteem, b 5
–.19, t(123) 5 –2.53, p 5 .01. The interaction was not significant
( p . .39).
Mood. We checked whether the uncertainty manipulation
affected PA and NA by conducting two independent multiple
regression analyses including (un)certainty, self-esteem level, and
self-esteem stability as predictors in Step 1, the two-way interac-
tion terms in Step 2, and the three-way interaction term in Step 3.
Regarding NA, only a significant main effect for self-esteem
level occurred, b 5 –.22, t(123) 5 –2.13, p 5 .04 (all other ps .
.20). Regarding PA, a significant main effect for (un)certainty,
b 5 –.19, t(123) 5 –2.25, p 5 .03, and marginally significant
main effects for self-esteem level and stability occurred, b 5 .17,
t(123) 5 1.68, p 5 .10, and b 5 .18, t(123) 5 1.75, p 5 .08,
respectively. The two-way interactions were not significant (all
ps . .50); however, the three-way interaction yielded significance,
b 5 .33, t(119) 5 2.53, p 5 .01.9
Two separate multiple regression analyses on NA and PA with
(un)certainty and conjoint self-esteem as predictors in Step 1, and
the two-way interaction term in Step 2, revealed for NA only a
significant main effect of conjoint self-esteem, b 5 –.28, t(124) 5
–3.30, p 5 .001 (all other ps . .23). Regarding PA, a significant
main effect for (un)certainty, b 5 –.19, t(124) 5 –2.26, p 5 .03,
and conjoint self-esteem, b 5 .30, t(124) 5 3.61, p , .001,
occurred. The interaction, however, was not significant ( p . .93).
Importantly, although unexpected mood effects emerged, control-
ling for PA and NA did not affect any of the central outcomes in
Study 2.
Dependent variables.Explicit leadership measures. First, we conducted two inde-
pendent multiple regressions on explicit valence and success eval-
uations including (un)certainty, self-esteem level, and self-esteem
stability as predictors in Step 1, the two-way interaction terms in
Step 2, and the three-way interaction term in Step 3. As can be
seen in the left part of Table 2, only the relation of self-esteem
level and explicit success evaluations was significant, indicating
that the higher the self-esteem, the more democratic the evalua-
tions were.
In our hypotheses, we predicted the effects of self-esteem level
and stability to be additive under conditions of uncertainty. We
therefore next conducted two multiple regression analyses with
(un)certainty, conjoint self-esteem, and their interaction as predic-
tors. For explicit valence and success judgments, however, no
main or interaction effects occurred (cf. Table 2).
Implicit leadership measures. First, two multiple regression
analyses were run with implicit leadership associations as depen-
dent variables and (un)certainty, self-esteem level, and self-esteem
stability as well as their interactions as predictors.10 As can be seen
in the right part of Table 2, only a significant Self-Esteem Level 3
Self-Esteem Stability interaction in regard of implicit success
evaluations occurred.11 Importantly, however, the three-way inter-
action with (un)certainty was nonsignificant.
To test our additive model, we conducted two multiple regres-
sion analyses with the valence and the success IATs as dependent
measures and (un)certainty, conjoint self-esteem, and their inter-
action as predictors (cf. Table 2). Regarding implicit valence, there
were no main effects and, as well, the two-way interaction was not
significant. More importantly, however, with regard to implicit
success, the predicted (Un)certainty 3 Conjoint Self-Esteem in-
teraction was significant. Simple slope analyses revealed that
under uncertainty, associations of democratic leadership with suc-
cess for stable high SEs (11 SD) became stronger, b 5 .35,
t(57) 5 2.01, p 5 .05, whereas for unstable low SEs (21 SD), they
substantially declined, b 5 –.38, t(57) 5 –2.23, p 5 .03. Simple
slopes are depicted in Figures 1A and 1B, for the valence IAT and
the success IAT, respectively.
7 We ran all analyses with EU as a covariate, however, as controlling for
EU did not affect any of the central outcomes, we dropped it from the
reported analyses.8 Note that throughout this article, and following Aiken and West
(1991), we centered continuous scores on their means prior to the regres-
sion analyses.9 Simple slope analyses revealed lower levels of PA under uncertainty
for high SEs with unstable self-esteem, b 5 –.50, t(119) 5 –2.31, p 5 .02,
and for low SEs with stable self-esteem, b 5 –.53, t(119) 5 –2.10, p 5 .04.
However, no difference between conditions was found for high SEs with
stable self-esteem ( p . .77) or for low SEs with unstable self-esteem ( p .
.29). Note that these results are similar to those reported by Kernis, Cornell,
Sun, Berry, and Harlow (1993), who found a three-way interaction of SE
level, SE stability, and (positive/negative) feedback.10 Different degrees of freedom for analogous analyses stem from the
fact that four participants had to be excluded because their error rates in
either the compatible or incompatible block were greater than 30%.11 Simple slope analyses revealed less democratic implicit success
evaluations by low SEs with unstable self-esteem than by low SEs with
stable self-esteem, b 5 .44, t(57) 5 2.65, p 5 .01. However, no
difference between high SEs with unstable versus stable self-esteem
occurred ( p . .15).
9UNCERTAINTY AND LEADERSHIP PREFERENCES
Discussion
Study 2 set out to extend our previous findings by experimen-
tally manipulating feelings of (un)certainty. Whereas we did not
expect differences between participants with stable high and un-
stable low SEs when primed with certainty, this difference should
become evident when primed with uncertainty. Specifically, we
tested a multiplicative against an additive model: (a) (Un)cer-
tainty 3 Self-Esteem Level 3 Self-Esteem Stability as opposed to
(b) (Un)certainty 3 (Self-Esteem Level 1 Self-Esteem Stability).
The three-way interaction in the first model was far from signifi-
cance regarding both explicit and implicit leadership evaluations,
contradicting the assumption of a multiplicative interplay between
self-esteem level and self-esteem stability under uncertainty. In
contrast, the additive model yielded the predicted (Un)certainty 3
(Self-Esteem Level 1 Self-Esteem Stability) interaction on im-
plicit success evaluations. In line with Hypothesis 2, priming
uncertainty for stable high SEs increased success IAT effects even
further (relative to the certainty condition), suggesting a demo-
cratic reaction. In line with Hypothesis 3, inducing the same
feelings of uncertainty in unstable low SEs resulted in a substantial
decrease of success IAT effects, indicating a submissive reaction.
Importantly, the democratic and submissive reactions in leader-
ship evaluation could only be observed for cognitive success
expectations of leadership styles, but not for affective valence, and
only if measured implicitly, but not explicitly. That the results
were specific to the success IAT rules out alternative explanations
in terms of demand effects (e.g., De Houwer, Beckers, & Moors,
2007), and it simultaneously indicates that observing the demo-
cratic and submissive reactions is difficult when targeting mere
affective reactions or when using explicit questionnaires.
Study 3
Study 2 provided initial empirical evidence for the hypothesized
democratic versus submissive reaction to uncertainty in stable high
SEs versus unstable low SEs. Study 3 aimed at replicating the
submissive reaction of unstable low SEs (Hypothesis 3) by making
trait uncertainty salient. Although individuals with low and unsta-
ble self-esteem should be dispositionally less certain of themselves
(e.g., Campbell & Lavallee, 1993; Kernis & Waschull, 1995), they
should not be chronically aware of their uncertainty because this
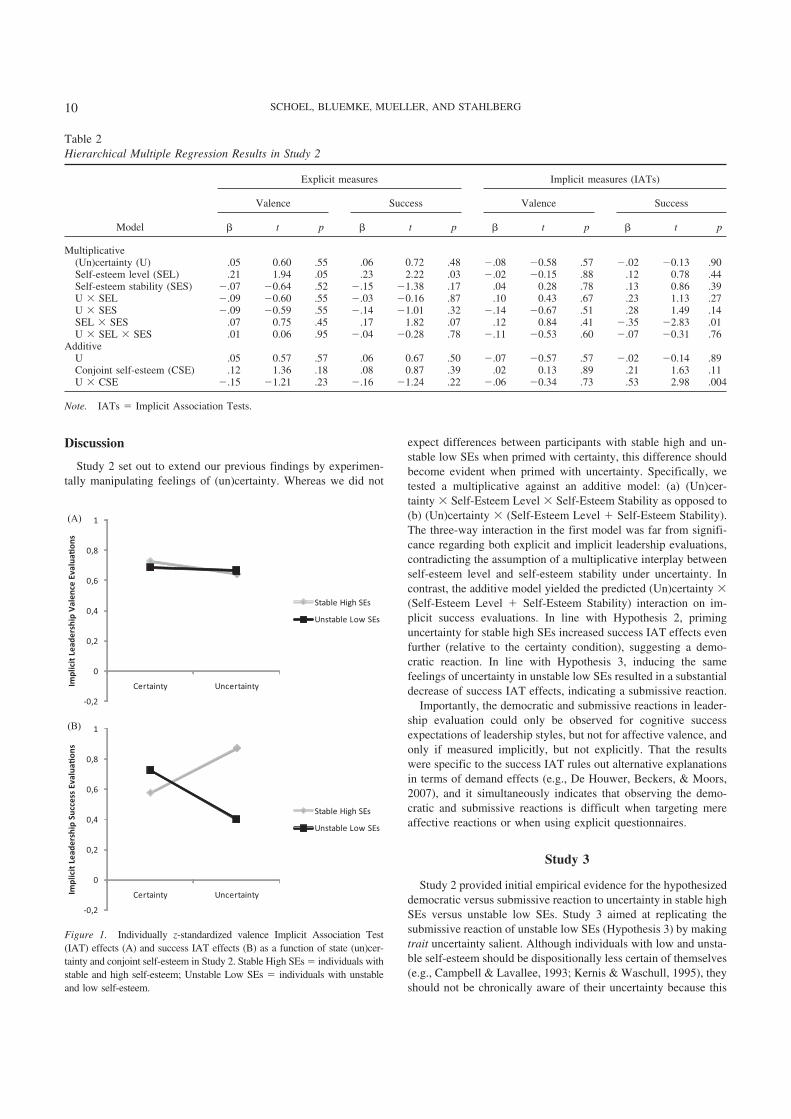
Table 2
Hierarchical Multiple Regression Results in Study 2
Model
Explicit measures Implicit measures (IATs)
Valence Success Valence Success
b t p b t p b t p b t p
Multiplicative(Un)certainty (U) .05 0.60 .55 .06 0.72 .48 2.08 20.58 .57 2.02 20.13 .90Self-esteem level (SEL) .21 1.94 .05 .23 2.22 .03 2.02 20.15 .88 .12 0.78 .44Self-esteem stability (SES) 2.07 20.64 .52 2.15 21.38 .17 .04 0.28 .78 .13 0.86 .39U 3 SEL 2.09 20.60 .55 2.03 20.16 .87 .10 0.43 .67 .23 1.13 .27U 3 SES 2.09 20.59 .55 2.14 21.01 .32 2.14 20.67 .51 .28 1.49 .14SEL 3 SES .07 0.75 .45 .17 1.82 .07 .12 0.84 .41 2.35 22.83 .01U 3 SEL 3 SES .01 0.06 .95 2.04 20.28 .78 2.11 20.53 .60 2.07 20.31 .76
AdditiveU .05 0.57 .57 .06 0.67 .50 2.07 20.57 .57 2.02 20.14 .89Conjoint self-esteem (CSE) .12 1.36 .18 .08 0.87 .39 .02 0.13 .89 .21 1.63 .11U 3 CSE 2.15 21.21 .23 2.16 21.24 .22 2.06 20.34 .73 .53 2.98 .004
Note. IATs 5 Implicit Association Tests.
(A)
-0,2
0
0,2
0,4
0,6
0,8
1
Certainty UncertaintyImp
lici
t Le
ad
ers
hip
Va
len
ce E
va
lua
�o
ns
Stable High SEs
Unstable Low SEs
(B)
-0,2
0
0,2
0,4
0,6
0,8
1
Certainty UncertaintyImp
lici
t Le
ad
ers
hip
Su
cce
ss E
va
lua
�o
ns
Stable High SEs
Unstable Low SEs
Figure 1. Individually z-standardized valence Implicit Association Test
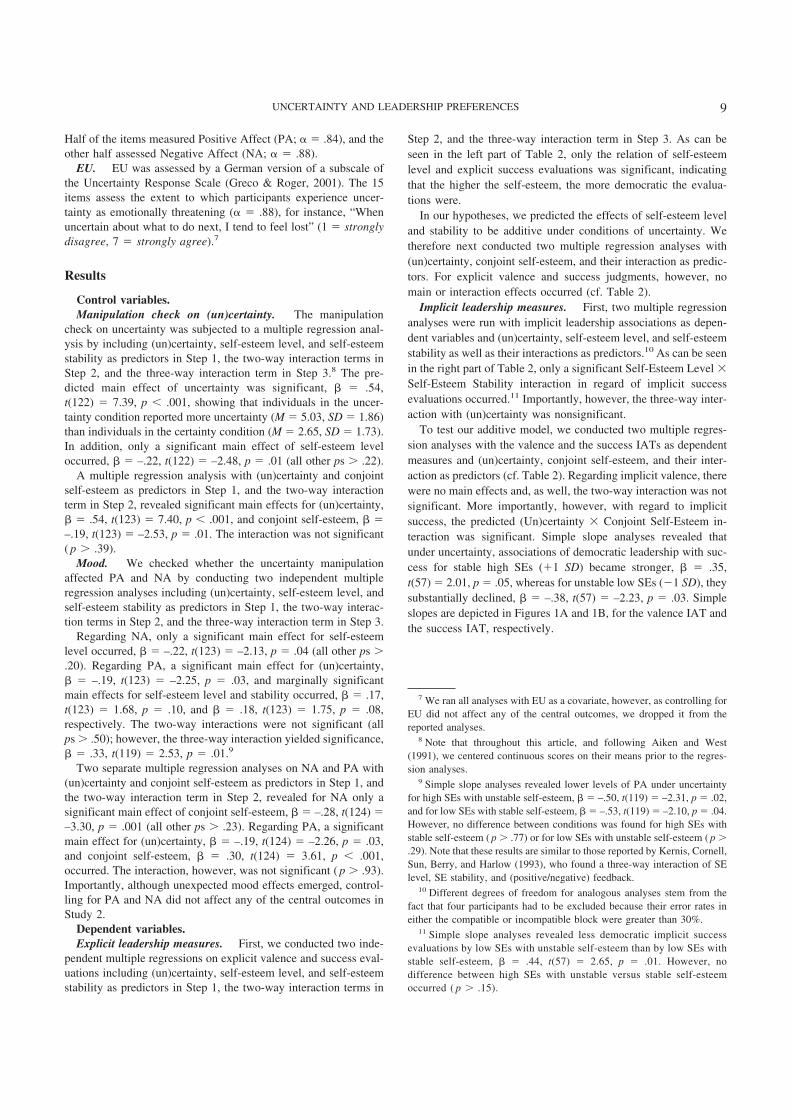
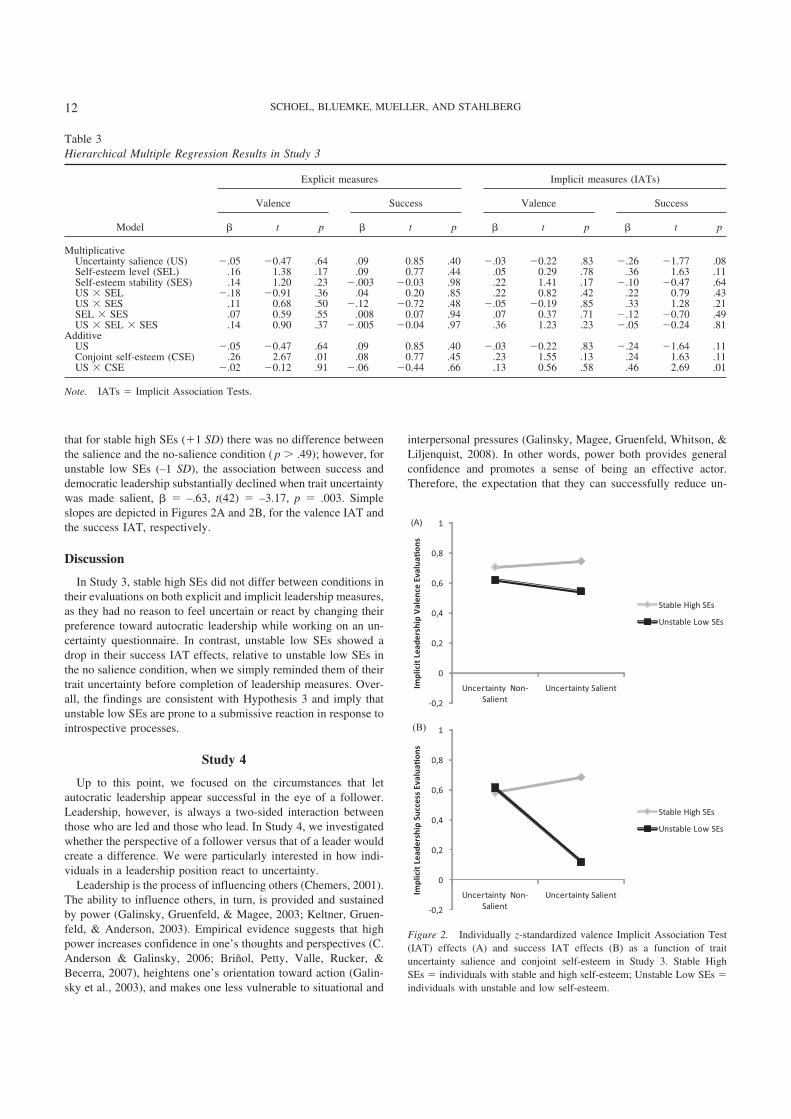
(IAT) effects (A) and success IAT effects (B) as a function of state (un)cer-
tainty and conjoint self-esteem in Study 2. Stable High SEs 5 individuals with
stable and high self-esteem; Unstable Low SEs 5 individuals with unstable
and low self-esteem.
10 SCHOEL, BLUEMKE, MUELLER, AND STAHLBERG

would be quite maladaptive, entailing the risk of depression (Ed-
wards & Weary, 1993). We therefore supposed that healthy un-
stable low SEs usually tend to suppress thoughts about their
uncertainty to prevent themselves from getting depressed. How-
ever, when trait uncertainty is made salient to them, they should be
highly motivated to reduce their feelings and cognitions of uncer-
tainty. We expected that simply assessing trait uncertainty on a
questionnaire should raise the awareness of uncertainty. Conse-
quently, unstable low SEs should strive for uncertainty reduction
and should exhibit a submissive reaction compared with unstable
low SEs whose trait uncertainty is not made salient. No such
effects were expected for stable high SEs, as they are assumed to
be certain of themselves by disposition (e.g., Campbell & La-
vallee, 1993; Kernis & Waschull, 1995). Working on a trait un-
certainty questionnaire should leave them, therefore, mostly unaf-
fected.
More specifically, as in Study 2, the expected submissive reac-
tion of unstable low SEs should be evident in changes in cognitive
success expectations. In contrast, we did not expect stable high and
unstable low SEs to differ on the valence measures of leadership.
As the submissive reaction is inconsistent with widely shared
democratic values, we again predicted stronger effects on implicit
than on explicit success measures.
Method
Participants and design. One hundred participants (59 women;
Mage 5 22.5 years), mainly German university students, completed
the 20-min online survey on “Attitudes and Personality Measures.”
Participants were recruited through an online pool. In return they
received the chance to win one of 10 book coupons (worth 10
Euros each). Participants were slightly more liberal than conser-
vative according to the mean political orientation score (1 5
extremely liberal, 9 5 extremely conservative), M 5 4.15 (SD 5
1.41). We again applied a multiplicative and an additive model.
First, we tested a 2 (trait uncertainty: nonsalient vs. salient) 3 2
(self-esteem level: high vs. low) 3 2 (self-esteem stability: high
vs. low) factorial design. In a second step, we tested a 2 (trait
uncertainty: nonsalient vs. salient) 3 2 (conjoint self-esteem: high
level 1 high stability vs. low level 1 low stability) factorial
design. Participants were randomly assigned to uncertainty sa-
lience conditions, while self-esteem level and stability were mea-
sured.
Procedure. In the trait uncertainty nonsalient condition (control
group), randomly chosen participants first completed the implicit and
explicit leadership measures, after which they completed the ques-
tionnaires on the moderator variables of self-esteem level and stabil-
ity. Finally, they completed the personality questionnaire on trait
uncertainty and answered two questions regarding their current
thoughts of uncertainty. In the trait uncertainty salient condition,
participants first filled in the questionnaires regarding self-esteem
level and stability. Then, just before they worked on implicit and
explicit leadership measures, they completed the uncertainty scale and
the questions regarding current thoughts of uncertainty to make trait
uncertainty salient. Overall, half of the participants encountered the
success IAT, whereas the other half completed the valence IAT.
Independent variables.Uncertainty salience. Participants completed a German 15-
item version of the EU subscale of the Uncertainty Response Scale
(a 5 .93) and the following two questions: “Have you just thought
about uncertainty?” (1 5 not at all, 9 5 definitely) and “How
intensely did you think about uncertainty?” (1 5 very moderately,
9 5 very strongly). Both items were highly interrelated (r 5 .85,
p , .001) and combined into a single index.
Self-esteem level. Absolute level of self-esteem was assessed
by the German 10-item version of Rosenberg’s Self-Esteem In-
ventory (a 5 .93).
Self-esteem stability. Self-esteem stability was assessed by
the reverse coded German 5-item version of the Labile Self-
Esteem Scale (a 5 .92).
Conjoint self-esteem. Conjoint self-esteem scores were cal-
culated by averaging z-standardized self-esteem level and stability
scores. The correlation between self-esteem level and stability was
r(100) 5 .53, p , .001.
Dependent variables.Explicit leadership measures. All participants indicated their
general valence and success evaluations of democratic and auto-
cratic leadership yielding four subscales: general valence of dem-
ocratic leadership (a 5 .87) and autocratic leadership (a 5 .82), as
well as general success of democratic leadership (a 5 .87) and
autocratic leadership (a 5 .85).
Implicit leadership measures. Participants either completed
the valence IAT (a 5 .73) or the success IAT (a 5 .75), as in
Study 2.
Results
Explicit leadership measures. First, we conducted two in-
dependent multiple regression analyses on explicit valence and
success evaluations including trait uncertainty salience, self-
esteem level, and self-esteem stability as predictors in Step 1, the
two-way interaction terms in Step 2, and the three-way interaction
term in Step 3. As can be seen in Table 3, no significant main or
interaction effects occurred.
For the additive model, trait uncertainty salience and conjoint
self-esteem were entered in Step 1, and their interaction was
entered in Step 2. However, only a significant main effect of
conjoint self-esteem on leadership valence evaluations emerged
(cf. Table 3).
Implicit leadership measures. First, two multiple regression
analyses were run with implicit leadership associations as depen-
dent variables and trait uncertainty salience, self-esteem level, and
self-esteem stability as well as their interactions as predictors.12 As
can be seen in Table 3, there were no significant main or interac-
tion effects in the multiplicative model.
To test our additive model, we conducted two multiple regres-
sion analyses with the valence IAT and the success IAT as depen-
dent measures. Trait uncertainty salience and conjoint self-esteem
were predictors in Step 1 and their interaction in Step 2. Results are
displayed in Table 3. With regard to implicit valence, there were
no main effects and, as well, the two-way interaction was not
significant. More importantly, however, with regard to implicit
success, the predicted Uncertainty Salience 3 Conjoint Self-
Esteem interaction was significant. Simple slope analyses revealed
12 Different degrees of freedom for analogous analyses stem from the
fact that five participants had to be excluded because their error rate in
either the compatible or incompatible block was greater than 30%.
11UNCERTAINTY AND LEADERSHIP PREFERENCES
that for stable high SEs (11 SD) there was no difference between
the salience and the no-salience condition ( p . .49); however, for
unstable low SEs (–1 SD), the association between success and
democratic leadership substantially declined when trait uncertainty
was made salient, b 5 –.63, t(42) 5 –3.17, p 5 .003. Simple
slopes are depicted in Figures 2A and 2B, for the valence IAT and
the success IAT, respectively.
Discussion
In Study 3, stable high SEs did not differ between conditions in
their evaluations on both explicit and implicit leadership measures,
as they had no reason to feel uncertain or react by changing their
preference toward autocratic leadership while working on an un-
certainty questionnaire. In contrast, unstable low SEs showed a
drop in their success IAT effects, relative to unstable low SEs in
the no salience condition, when we simply reminded them of their
trait uncertainty before completion of leadership measures. Over-
all, the findings are consistent with Hypothesis 3 and imply that
unstable low SEs are prone to a submissive reaction in response to
introspective processes.
Study 4
Up to this point, we focused on the circumstances that let
autocratic leadership appear successful in the eye of a follower.
Leadership, however, is always a two-sided interaction between
those who are led and those who lead. In Study 4, we investigated
whether the perspective of a follower versus that of a leader would
create a difference. We were particularly interested in how indi-
viduals in a leadership position react to uncertainty.
Leadership is the process of influencing others (Chemers, 2001).
The ability to influence others, in turn, is provided and sustained
by power (Galinsky, Gruenfeld, & Magee, 2003; Keltner, Gruen-
feld, & Anderson, 2003). Empirical evidence suggests that high
power increases confidence in one’s thoughts and perspectives (C.
Anderson & Galinsky, 2006; Brinol, Petty, Valle, Rucker, &
Becerra, 2007), heightens one’s orientation toward action (Galin-
sky et al., 2003), and makes one less vulnerable to situational and
interpersonal pressures (Galinsky, Magee, Gruenfeld, Whitson, &
Liljenquist, 2008). In other words, power both provides general
confidence and promotes a sense of being an effective actor.
Therefore, the expectation that they can successfully reduce un-
Table 3
Hierarchical Multiple Regression Results in Study 3
Model
Explicit measures Implicit measures (IATs)
Valence Success Valence Success
b t p b t p b t p b t p
MultiplicativeUncertainty salience (US) 2.05 20.47 .64 .09 0.85 .40 2.03 20.22 .83 2.26 21.77 .08Self-esteem level (SEL) .16 1.38 .17 .09 0.77 .44 .05 0.29 .78 .36 1.63 .11Self-esteem stability (SES) .14 1.20 .23 2.003 20.03 .98 .22 1.41 .17 2.10 20.47 .64US 3 SEL 2.18 20.91 .36 .04 0.20 .85 .22 0.82 .42 .22 0.79 .43US 3 SES .11 0.68 .50 2.12 20.72 .48 2.05 20.19 .85 .33 1.28 .21SEL 3 SES .07 0.59 .55 .008 0.07 .94 .07 0.37 .71 2.12 20.70 .49US 3 SEL 3 SES .14 0.90 .37 2.005 20.04 .97 .36 1.23 .23 2.05 20.24 .81
AdditiveUS 2.05 20.47 .64 .09 0.85 .40 2.03 20.22 .83 2.24 21.64 .11Conjoint self-esteem (CSE) .26 2.67 .01 .08 0.77 .45 .23 1.55 .13 .24 1.63 .11US 3 CSE 2.02 20.12 .91 2.06 20.44 .66 .13 0.56 .58 .46 2.69 .01
Note. IATs 5 Implicit Association Tests.
(A)
-0,2
0
0,2
0,4
0,6
0,8
1
Uncertainty Non-
Salient
Uncertainty SalientImp
lici
t Le
ad
ers
hip
Va
len
ce E
va
lua
�o
ns
Stable High SEs
Unstable Low SEs
(B)
-0,2
0
0,2
0,4
0,6
0,8
1
Uncertainty Non-
Salient
Uncertainty SalientImp
lici
t Le
ad
ers
hip
Su
cce
ss E
va
lua
�o
ns
Stable High SEs
Unstable Low SEs
Figure 2. Individually z-standardized valence Implicit Association Test
(IAT) effects (A) and success IAT effects (B) as a function of trait
uncertainty salience and conjoint self-esteem in Study 3. Stable High
SEs 5 individuals with stable and high self-esteem; Unstable Low SEs 5
individuals with unstable and low self-esteem.
12 SCHOEL, BLUEMKE, MUELLER, AND STAHLBERG
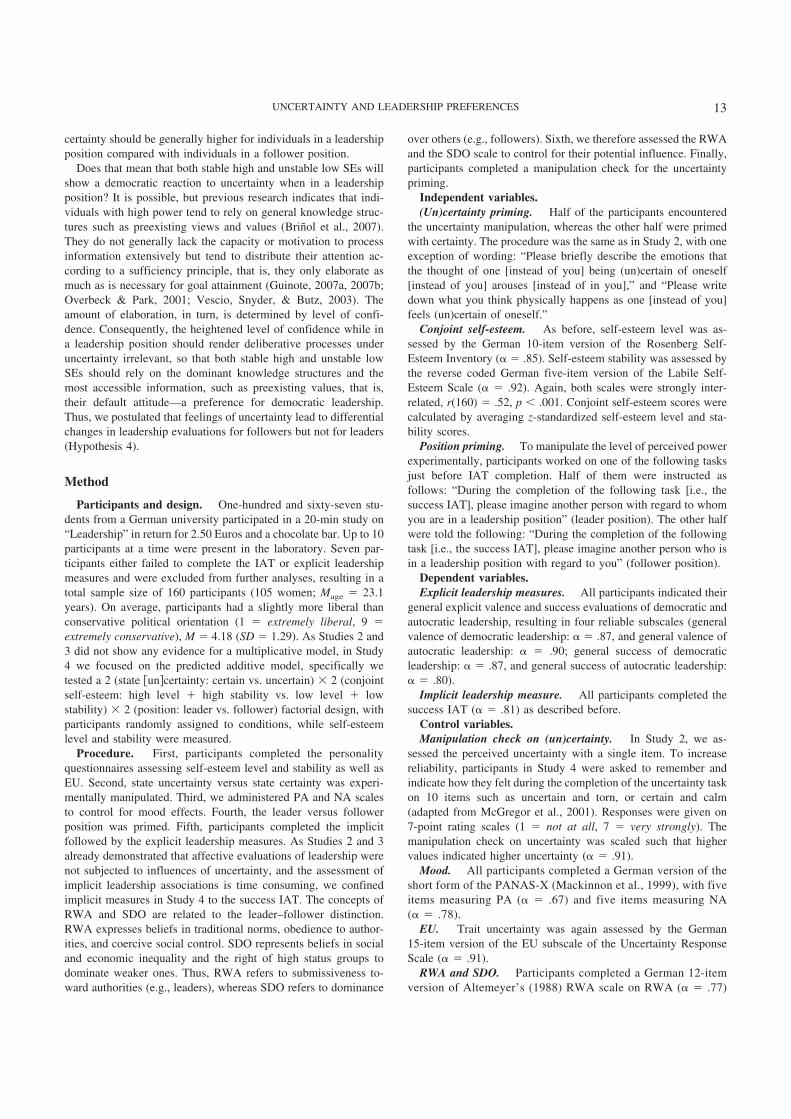
certainty should be generally higher for individuals in a leadership
position compared with individuals in a follower position.
Does that mean that both stable high and unstable low SEs will
show a democratic reaction to uncertainty when in a leadership
position? It is possible, but previous research indicates that indi-
viduals with high power tend to rely on general knowledge struc-
tures such as preexisting views and values (Brinol et al., 2007).
They do not generally lack the capacity or motivation to process
information extensively but tend to distribute their attention ac-
cording to a sufficiency principle, that is, they only elaborate as
much as is necessary for goal attainment (Guinote, 2007a, 2007b;
Overbeck & Park, 2001; Vescio, Snyder, & Butz, 2003). The
amount of elaboration, in turn, is determined by level of confi-
dence. Consequently, the heightened level of confidence while in
a leadership position should render deliberative processes under
uncertainty irrelevant, so that both stable high and unstable low
SEs should rely on the dominant knowledge structures and the
most accessible information, such as preexisting values, that is,
their default attitude—a preference for democratic leadership.
Thus, we postulated that feelings of uncertainty lead to differential
changes in leadership evaluations for followers but not for leaders
(Hypothesis 4).
Method
Participants and design. One-hundred and sixty-seven stu-
dents from a German university participated in a 20-min study on
“Leadership” in return for 2.50 Euros and a chocolate bar. Up to 10
participants at a time were present in the laboratory. Seven par-
ticipants either failed to complete the IAT or explicit leadership
measures and were excluded from further analyses, resulting in a
total sample size of 160 participants (105 women; Mage 5 23.1
years). On average, participants had a slightly more liberal than
conservative political orientation (1 5 extremely liberal, 9 5
extremely conservative), M 5 4.18 (SD 5 1.29). As Studies 2 and
3 did not show any evidence for a multiplicative model, in Study
4 we focused on the predicted additive model, specifically we
tested a 2 (state @un#certainty: certain vs. uncertain) 3 2 (conjoint
self-esteem: high level 1 high stability vs. low level 1 low
stability) 3 2 (position: leader vs. follower) factorial design, with
participants randomly assigned to conditions, while self-esteem
level and stability were measured.
Procedure. First, participants completed the personality
questionnaires assessing self-esteem level and stability as well as
EU. Second, state uncertainty versus state certainty was experi-
mentally manipulated. Third, we administered PA and NA scales
to control for mood effects. Fourth, the leader versus follower
position was primed. Fifth, participants completed the implicit
followed by the explicit leadership measures. As Studies 2 and 3
already demonstrated that affective evaluations of leadership were
not subjected to influences of uncertainty, and the assessment of
implicit leadership associations is time consuming, we confined
implicit measures in Study 4 to the success IAT. The concepts of
RWA and SDO are related to the leader–follower distinction.
RWA expresses beliefs in traditional norms, obedience to author-
ities, and coercive social control. SDO represents beliefs in social
and economic inequality and the right of high status groups to
dominate weaker ones. Thus, RWA refers to submissiveness to-
ward authorities (e.g., leaders), whereas SDO refers to dominance
over others (e.g., followers). Sixth, we therefore assessed the RWA
and the SDO scale to control for their potential influence. Finally,
participants completed a manipulation check for the uncertainty
priming.
Independent variables.(Un)certainty priming. Half of the participants encountered
the uncertainty manipulation, whereas the other half were primed
with certainty. The procedure was the same as in Study 2, with one
exception of wording: “Please briefly describe the emotions that
the thought of one [instead of you] being (un)certain of oneself
[instead of you] arouses [instead of in you],” and “Please write
down what you think physically happens as one [instead of you]
feels (un)certain of oneself.”
Conjoint self-esteem. As before, self-esteem level was as-
sessed by the German 10-item version of the Rosenberg Self-
Esteem Inventory (a 5 .85). Self-esteem stability was assessed by
the reverse coded German five-item version of the Labile Self-
Esteem Scale (a 5 .92). Again, both scales were strongly inter-
related, r(160) 5 .52, p , .001. Conjoint self-esteem scores were
calculated by averaging z-standardized self-esteem level and sta-
bility scores.
Position priming. To manipulate the level of perceived power
experimentally, participants worked on one of the following tasks
just before IAT completion. Half of them were instructed as
follows: “During the completion of the following task [i.e., the
success IAT], please imagine another person with regard to whom
you are in a leadership position” (leader position). The other half
were told the following: “During the completion of the following
task [i.e., the success IAT], please imagine another person who is
in a leadership position with regard to you” (follower position).
Dependent variables.Explicit leadership measures. All participants indicated their
general explicit valence and success evaluations of democratic and
autocratic leadership, resulting in four reliable subscales (general
valence of democratic leadership: a 5 .87, and general valence of
autocratic leadership: a 5 .90; general success of democratic
leadership: a 5 .87, and general success of autocratic leadership:
a 5 .80).
Implicit leadership measure. All participants completed the
success IAT (a 5 .81) as described before.
Control variables.Manipulation check on (un)certainty. In Study 2, we as-
sessed the perceived uncertainty with a single item. To increase
reliability, participants in Study 4 were asked to remember and
indicate how they felt during the completion of the uncertainty task
on 10 items such as uncertain and torn, or certain and calm
(adapted from McGregor et al., 2001). Responses were given on
7-point rating scales (1 5 not at all, 7 5 very strongly). The
manipulation check on uncertainty was scaled such that higher
values indicated higher uncertainty (a 5 .91).
Mood. All participants completed a German version of the
short form of the PANAS-X (Mackinnon et al., 1999), with five
items measuring PA (a 5 .67) and five items measuring NA
(a 5 .78).
EU. Trait uncertainty was again assessed by the German
15-item version of the EU subscale of the Uncertainty Response
Scale (a 5 .91).
RWA and SDO. Participants completed a German 12-item
version of Altemeyer’s (1988) RWA scale on RWA (a 5 .77)
13UNCERTAINTY AND LEADERSHIP PREFERENCES
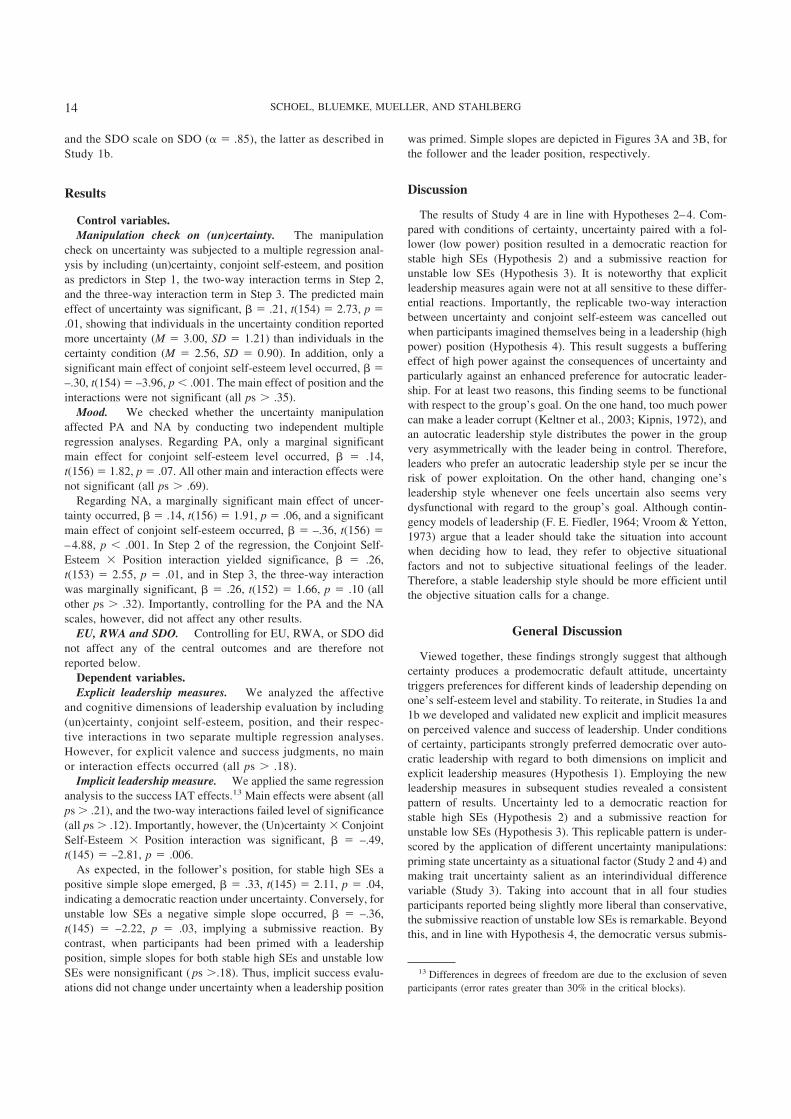
and the SDO scale on SDO (a 5 .85), the latter as described in
Study 1b.
Results
Control variables.Manipulation check on (un)certainty. The manipulation
check on uncertainty was subjected to a multiple regression anal-
ysis by including (un)certainty, conjoint self-esteem, and position
as predictors in Step 1, the two-way interaction terms in Step 2,
and the three-way interaction term in Step 3. The predicted main
effect of uncertainty was significant, b 5 .21, t(154) 5 2.73, p 5
.01, showing that individuals in the uncertainty condition reported
more uncertainty (M 5 3.00, SD 5 1.21) than individuals in the
certainty condition (M 5 2.56, SD 5 0.90). In addition, only a
significant main effect of conjoint self-esteem level occurred, b 5
–.30, t(154) 5 –3.96, p , .001. The main effect of position and the
interactions were not significant (all ps . .35).
Mood. We checked whether the uncertainty manipulation
affected PA and NA by conducting two independent multiple
regression analyses. Regarding PA, only a marginal significant
main effect for conjoint self-esteem level occurred, b 5 .14,
t(156) 5 1.82, p 5 .07. All other main and interaction effects were
not significant (all ps . .69).
Regarding NA, a marginally significant main effect of uncer-
tainty occurred, b 5 .14, t(156) 5 1.91, p 5 .06, and a significant
main effect of conjoint self-esteem occurred, b 5 –.36, t(156) 5
–4.88, p , .001. In Step 2 of the regression, the Conjoint Self-
Esteem 3 Position interaction yielded significance, b 5 .26,
t(153) 5 2.55, p 5 .01, and in Step 3, the three-way interaction
was marginally significant, b 5 .26, t(152) 5 1.66, p 5 .10 (all
other ps . .32). Importantly, controlling for the PA and the NA
scales, however, did not affect any other results.
EU, RWA and SDO. Controlling for EU, RWA, or SDO did
not affect any of the central outcomes and are therefore not
reported below.
Dependent variables.Explicit leadership measures. We analyzed the affective
and cognitive dimensions of leadership evaluation by including
(un)certainty, conjoint self-esteem, position, and their respec-
tive interactions in two separate multiple regression analyses.
However, for explicit valence and success judgments, no main
or interaction effects occurred (all ps . .18).
Implicit leadership measure. We applied the same regression
analysis to the success IAT effects.13 Main effects were absent (all
ps . .21), and the two-way interactions failed level of significance
(all ps . .12). Importantly, however, the (Un)certainty 3 Conjoint
Self-Esteem 3 Position interaction was significant, b 5 –.49,
t(145) 5 –2.81, p 5 .006.
As expected, in the follower’s position, for stable high SEs a
positive simple slope emerged, b 5 .33, t(145) 5 2.11, p 5 .04,
indicating a democratic reaction under uncertainty. Conversely, for
unstable low SEs a negative simple slope occurred, b 5 –.36,
t(145) 5 –2.22, p 5 .03, implying a submissive reaction. By
contrast, when participants had been primed with a leadership
position, simple slopes for both stable high SEs and unstable low
SEs were nonsignificant ( ps ..18). Thus, implicit success evalu-
ations did not change under uncertainty when a leadership position
was primed. Simple slopes are depicted in Figures 3A and 3B, for
the follower and the leader position, respectively.
Discussion
The results of Study 4 are in line with Hypotheses 2–4. Com-
pared with conditions of certainty, uncertainty paired with a fol-
lower (low power) position resulted in a democratic reaction for
stable high SEs (Hypothesis 2) and a submissive reaction for
unstable low SEs (Hypothesis 3). It is noteworthy that explicit
leadership measures again were not at all sensitive to these differ-
ential reactions. Importantly, the replicable two-way interaction
between uncertainty and conjoint self-esteem was cancelled out
when participants imagined themselves being in a leadership (high
power) position (Hypothesis 4). This result suggests a buffering
effect of high power against the consequences of uncertainty and
particularly against an enhanced preference for autocratic leader-
ship. For at least two reasons, this finding seems to be functional
with respect to the group’s goal. On the one hand, too much power
can make a leader corrupt (Keltner et al., 2003; Kipnis, 1972), and
an autocratic leadership style distributes the power in the group
very asymmetrically with the leader being in control. Therefore,
leaders who prefer an autocratic leadership style per se incur the
risk of power exploitation. On the other hand, changing one’s
leadership style whenever one feels uncertain also seems very
dysfunctional with regard to the group’s goal. Although contin-
gency models of leadership (F. E. Fiedler, 1964; Vroom & Yetton,
1973) argue that a leader should take the situation into account
when deciding how to lead, they refer to objective situational
factors and not to subjective situational feelings of the leader.
Therefore, a stable leadership style should be more efficient until
the objective situation calls for a change.
General Discussion
Viewed together, these findings strongly suggest that although
certainty produces a prodemocratic default attitude, uncertainty
triggers preferences for different kinds of leadership depending on
one’s self-esteem level and stability. To reiterate, in Studies 1a and
1b we developed and validated new explicit and implicit measures
on perceived valence and success of leadership. Under conditions
of certainty, participants strongly preferred democratic over auto-
cratic leadership with regard to both dimensions on implicit and
explicit leadership measures (Hypothesis 1). Employing the new
leadership measures in subsequent studies revealed a consistent
pattern of results. Uncertainty led to a democratic reaction for
stable high SEs (Hypothesis 2) and a submissive reaction for
unstable low SEs (Hypothesis 3). This replicable pattern is under-
scored by the application of different uncertainty manipulations:
priming state uncertainty as a situational factor (Study 2 and 4) and
making trait uncertainty salient as an interindividual difference
variable (Study 3). Taking into account that in all four studies
participants reported being slightly more liberal than conservative,
the submissive reaction of unstable low SEs is remarkable. Beyond
this, and in line with Hypothesis 4, the democratic versus submis-
13 Differences in degrees of freedom are due to the exclusion of seven
participants (error rates greater than 30% in the critical blocks).
14 SCHOEL, BLUEMKE, MUELLER, AND STAHLBERG
sive reactions were erased when individuals imagined being in a
leadership position compared with a follower position. Impor-
tantly, the democratic and submissive reactions to uncertainty were
specific to the cognitively based success evaluations but not to the
affect-related, valence dimension of leadership and were demon-
strated only through implicit and not explicit measures.
Deliberation and Automaticity—A Paradox?
The democratic and submissive reactions to uncertainty for
stable high SEs and unstable low SEs were found only on implicit
measures that are supposed to reflect predominantly associative
processes. They should, therefore, at least to a certain degree, be
automatic and sensitive to situational variations. The theoretical
framework of the current article, however, was based on deliber-
ative outcome expectancy considerations, produced by a motive of
uncertainty reduction (Weary & Edwards, 1996). At first sight,
automaticity and deliberate reasoning seem to be contradictory,
especially if regarded as mutually exclusive and opposite ends of
a continuum (Shiffrin & Schneider, 1977). Though they are often
considered conceptually different processes, automatic and con-
trolled processing interact to bring about behavior, and this is true
for almost any implicit measure to date (K. Fiedler, Bluemke, &
Unkelbach, 2009). In our studies, participants were always at first
confronted with an uncertainty manipulation, and they thought
about uncertainty for at least a few minutes. Drawing on Weary
and Edwards’s (1996) causal uncertainty model, during this time a
“comparator” identifies the discrepancy between the current state
of uncertainty and the desired state of certainty. It activates po-
tential action plans to reduce this discrepancy. Action plans are
then analyzed by the “outcome expectancy assessor.” The crucial
point that differentiates stable high SEs from unstable low SEs is
whether they believe that they can efficiently reduce uncertainty
themselves. Whereas stable high SEs are prepared to act, unstable
low SEs doubt their abilities. Confronted with two leadership
styles that offer different degrees of participation, differential
preactivation results in different outcome expectancies. Thus, the
outcomes of the implicit measure may show characteristics of
automaticity, but they reflect the consequences of a deliberative
process of weighing expectancies that changes the underlying
associations in memory (cf. Gawronski & Bodenhausen, 2006).
Why Is the Difference Between Implicit and ExplicitImportant?
We found across studies that uncertainty led stable high SEs to
more democratic and unstable low SEs to more autocratic implicit
evaluations of success compared with conditions of certainty.
Explicit evaluations of success, however, remained largely unaf-
fected. In their associative-propositional evaluation model,
Gawronski and Bodenhausen (2006) argued that associative (im-
plicit) evaluations are examined with respect to their consistency
with activated propositions and are rejected as invalid for explicit
judgments in the case of inconsistencies. Following this reasoning,
the associations between autocratic 1 success and democratic 1
failure conflict with propositions belonging to a general belief
system of democratic values. The submissive reaction to uncer-
tainty for unstable low SEs was found consistently only on implicit
measures assessing the automatic evaluations of leadership suc-
cess. In contrast, the associations between democratic 1 success
and autocratic 1 failure are in line with predominant democratic
values. Increased democratic preferences should therefore be re-
garded as valid and the democratic reaction of stable high SEs
should be expressed on implicit and explicit measures. However,
the democratic reaction was also found only on implicit and not on
explicit leadership measures.
To explain this result, we draw on Strack and Deutsch’s (2004)
reflective–impulsive model. The authors have distinguished be-
tween impulsive and reflective processes. The impulsive system is
conceived as a simple associative network (see also, J. R. Ander-
son & Bower, 1973) in which spreading activation is induced by
perceptual input or reflective processes. The activation of an
element spreads to other elements in proportion to the strength of
the links between them. Activation varies and information is only
retrieved for further elaboration if the activation level exceeds a
certain threshold. Thus, whether an element enters the reflective
system depends on its accessibility, that is, its excitation level.
Without frequent and recent activation, however, the activation
level decays (cf. Higgins, 1996) and in consequence the informa-
tion becomes less accessible for the reflective system.
In our studies, the democratic and submissive reactions may not
have reached the threshold for further processing and were, there-
fore, only exhibited on implicit but not on explicit measures. This
(A)
-0,2
0
0,2
0,4
0,6
0,8
1
Certainty UncertaintyImp
lici
t L
ea
de
rsh
ip S
ucc
ess
Ev
alu
a�
on
s
Stable High SEs
Unstable Low SEs
(B)
-0,2
0
0,2
0,4
0,6
0,8
1
Certainty UncertaintyImp
lici
t Le
ad
ers
hip
Su
cce
ss E
va
lua
�o
ns
Stable High SEs
Unstable Low SEs
Figure 3. Individually z-standardized success Implicit Association Test
(IAT) effects as a function of uncertainty and conjoint self-esteem for
participants in a follower position (A) and a leadership position (B) in
Study 4. Stable High SEs 5 individuals with stable and high self-esteem;
Unstable Low SEs 5 individuals with unstable and low self-esteem.
15UNCERTAINTY AND LEADERSHIP PREFERENCES
can be explained by the circumstance that awareness of uncertainty
is an exceptional state that occurs rarely in everyday life because
individuals avoid thoughts of uncertainty if possible. However,
more enduring and stronger states of uncertainty might heighten
the accessibility of matching associative patterns, that is, the
democratic reaction for stable high SEs and the submissive reac-
tion for unstable low SEs.
Future Research
Although our studies provide converging evidence in support of the
main hypotheses, some questions remain that call for further investi-
gation. First, these studies relied on two different methods of inducing
uncertainty: priming state uncertainty and making trait uncertainty
salient. However, it seems important to put the hypotheses to the test
with even broader manipulations of uncertainty such as, for example,
mortality salience. In line with terror management theory (e.g., Cohen
et al., 2005, 2004; Landau et al., 2004), even stronger effects on
leadership evaluations for more threatening stimuli might be postu-
lated. The democratic and submissive reactions found only on implicit
measures in the current studies might then enter the reflective system
and be expressed also on explicit measures. On the other hand, our
findings show that even mild cues of uncertainty can have important
effects that become visible only with the help of association-based
measurement procedures.
Second, in Study 4 we showed that assuming a leadership
perspective was an effective buffer against the reactions to uncer-
tainty. We pointed out that this is an important finding because a
leader who prefers an autocratic leadership style whenever he/she
feels uncertain might incur the risk of power exploitation. In a
recent study, Maner and Mead (2010) found that the combination
of high dominance motivation and instability of the group’s hier-
archy led to self-interested and group-damaging actions by the
leader. Though SDO and RWA did not affect our results in Study
4, it seems worthwhile to investigate the influence of dominance
motivation on a leader’s reaction to uncertainty.
Third, because of its comparative nature, the traditional IAT is
ambiguous in absolute evaluation of the respective target concepts
(Blanton, Jaccard, Gonzales, & Christie, 2006; K. Fiedler, Messner, &
Bluemke, 2006; Nosek et al., 2005). Therefore, it is difficult to infer
from the current findings whether the democratic and submissive
reactions are caused by changes in the evaluation of democratic or of
autocratic leadership or of both at the same time. Wigboldus, Holland,
and van Knippenberg (2004) introduced the Single-Target IAT, which
presents participants with only one of the target categories, while both
attribute categories remain. Given the reliability and validity of such
single-category procedures (e.g., Bluemke & Friese, 2008), it seems
to be a promising tool for disentangling the intricate pattern of the
democratic and submissive reactions.
Finally, although the relationship between attitudes and behav-
ior is complex and sometimes difficult to uncover, it seems worth-
while to investigate whether the democratic and submissive reac-
tions demonstrated on implicit measures can influence actual
behavior such as voting for political candidates, support and do-
nations for democratic institutions, or choice of an employer.
Concluding Comments
The goal of the current research was to determine the circum-
stances under which democratic leadership is judged as less suc-
cessful even if more pleasant, while autocratic leadership is judged
as more successful even if unpleasant. Viewed together, these
studies considerably extend the threat-uncertainty, self-esteem,
and leadership literatures by showing that uncertainty, self-esteem
level and stability, as well as leader versus follower perspective
have a moderating impact on individuals’ leadership evaluations.
References
Adorno, T. W., Frenkel-Brunswik, E., Levinson, D. J., & Sanford, R. N.
(1950). The authoritarian personality. New York, NY: Harper & Row.
Aiken, L. S., & West, S. G. (1991). Multiple regression: Testing and
interpreting interactions. New York, NY: Sage.
Allport, G. W. (1954). The nature of prejudice. Reading, MA: Addison-
Wesley.
Altemeyer, B. (1988). Enemies of freedom: Understanding right-wing
authoritarianism. San Francisco, CA: Jossey-Bass.
Altemeyer, B. (1996). The authoritarian specter. Cambridge, MA: Harvard
University Press.
Anderson, C., & Galinsky, A. D. (2006). Power, optimism, and risk-taking.
European Journal of Social Psychology, 36, 511–536. doi:10.1002/ejsp.324
Anderson, J. R., & Bower, G. H. (1973). Human associative memory.
Washington, DC: Winston & Sons.
Aspinwall, L. G., & Taylor, S. E. (1992). Modeling cognitive adaptation:
A longitudinal investigation of the impact of individual differences and
coping on college adjustment and performance. Journal of Personality
and Social Psychology, 63, 989–1003. doi:10.1037/0022-3514.63.6.989
Bass, B. M. (1990). Bass and Stogdill’s handbook of leadership: Theory,
research, and managerial applications (3rd ed.). New York, NY: Free
Press.
Baumeister, R. F. (1993). Self-esteem: The puzzle of low self-regard. New
York, NY: Plenum Press.
Baumeister, R. F., Campbell, J. D., Krueger, J. I., & Vohs, K. D. (2003).
Does high self-esteem cause better performance, interpersonal success,
happiness, or healthier lifestyles? Psychological Science in the Public
Interest, 4, 1–44. doi:10.1111/1529-1006.01431
Blanton, H., Jaccard, J., Gonzales, P. M., & Christie, C. (2006). Decoding
the Implicit Association Test: Implications for criterion prediction. Jour-
nal of Experimental Social Psychology, 42, 192–212. doi:10.1016/
j.jesp.2005.07.003
Bluemke, M., & Friese, M. (2006). Do features of stimuli influence IAT
effects? Journal of Experimental Social Psychology, 42, 163–176. doi:
10.1016/j.jesp.2005.03.004
Bluemke, M., & Friese, M. (2008). Reliability and validity of the Single-
Target IAT (ST-IAT): Assessing automatic affect towards multiple
attitude objects. European Journal of Social Psychology, 38, 977–997.
doi:10.1002/ejsp.487
Brinol, P., Petty, R. E., Valle, C., Rucker, D. D., & Becerra, A. (2007). The
effects of message recipients’ power before and after persuasion: A
self-validation analysis. Journal of Personality and Social Psychology,
93, 1040–1053. doi:10.1037/0022-3514.93.6.1040
Brockner, J. (1983). Low self-esteem and behavioral plasticity: Some
implications. In L. Wheeler & P. R. Shaver (Eds.), Review of personality
and social psychology (4th ed., pp. 237–271). Beverly Hills, CA: Sage.
Brockner, J., Heuer, L., Siegel, P. A., Wiesenfeld, B. M., Martin, C.,
Grover, S., . . . Bjorgvinsson, S. (1998). The moderating effect of self-
esteem in reaction to voice: Converging evidence from five studies.
Journal of Personality and Social Psychology, 75, 394–407. doi:
10.1037/0022-3514.75.2.394
Brown, J. D. (1986). Evaluations of self and others: Self-enhancement
biases in social judgments. Social Cognition, 4, 353–376. doi:10.1521/
soco.1986.4.4.353
Brown, J. D., Collins, R. L., & Schmidt, G. W. (1988). Self-esteem and
16 SCHOEL, BLUEMKE, MUELLER, AND STAHLBERG
direct versus indirect forms of self-enhancement. Journal of Personality
and Social Psychology, 55, 445–453. doi:10.1037/0022-3514.55.3.445
Campbell, J. D., & Lavallee, L. F. (1993). Who am I? The role of
self-concept confusion in understanding the behavior of people with low
self-esteem. In R. F. Baumeister (Ed.), Self-esteem: The puzzle of low
self-regard (pp. 3–20). New York, NY: Plenum Press.
Chemers, M. M. (2001). Leadership effectiveness: An integrative review.
In M. A. Hogg & R. S. Tindale (Eds.), Blackwell handbook of social
psychology: Group processes (pp. 376–399). Oxford, England: Black-
well. doi:10.1002/9780470998458.ch16
Cohen, F., Ogilvie, D. M., Solomon, S., Greenberg, J., & Pyszczynski, T.
(2005). American roulette: The effect of reminders of death on support
for George W. Bush in the 2004 presidential election. Analyses of Social
Issues and Public Policy (ASAP), 5, 177–187. doi:10.1111/j.1530-
2415.2005.00063.x
Cohen, F., Solomon, S., Maxfield, M., Pyszczynski, T., & Greenberg, J.
(2004). Fatal attraction: The effects of mortality salience on evaluations
of charismatic, task-oriented, and relationship-oriented leaders. Psycho-
logical Science, 15, 846–851. doi:10.1111/j.0956-7976.2004.00765.x
Deci, E. L., & Ryan, R. M. (1985). Intrinsic motivation and self-
determination in human behavior. New York, NY: Plenum Press.
De Cremer, D. (2007). Emotional effects of distributive justice as a
function of autocratic leader behavior. Journal of Applied Social Psy-
chology, 37, 1385–1404. doi:10.1111/j.1559-1816.2007.00217.x
De Cremer, D., & Sedikides, C. (2005). Self-uncertainty and responsive-
ness to procedural justice. Journal of Experimental Social Psychology,
41, 157–173. doi:10.1016/j.jesp.2004.06.010
Degner, J., Wentura, D., & Rothermund, K. (2006). Indirect assessment of
attitudes with response-time-based measures. Zeitschrift fur Sozialpsy-
chologie, 37, 131–139. doi:10.1024/0044-3514.37.3.131
De Houwer, J., Beckers, T., & Moors, A. (2007). Novel attitudes can be
faked on the Implicit Association Test. Journal of Experimental Social
Psychology, 43, 972–978. doi:10.1016/j.jesp.2006.10.007
Doty, R. M., Peterson, B. E., & Winter, D. G. (1991). Threat and author-
itarianism in the United States, 1978–1987. Journal of Personality and
Social Psychology, 61, 629–640. doi:10.1037/0022-3514.61.4.629
Duckitt, J., Bizumic, B., Krauss, S. W., & Heled, E. (2010). A tripartite
approach to right-wing authoritarianism: The authoritarianism-
conservatism-traditionalism model. Political Psychology, 31, 685–715.
doi:10.1111/j.1467-9221.2010.00781.x
Duckitt, J., & Fisher, K. (2003). The impact of social threat on world view
and ideological attitudes. Political Psychology, 24, 199 –222. doi:
10.1111/0162-895X.00322
Dykman, B. M. (1998). Integrating cognitive and motivational factors in
depression: Initial tests of a goal-orientation approach. Journal of Per-
sonality and Social Psychology, 74, 139 –158. doi:10.1037/0022-
3514.74.1.139
Eagly, A. H., & Chaiken, S. (1993). The psychology of attitudes. Fort
Worth, TX: Harcourt Brace Jovanovich.
Edwards, J. A., & Weary, G. (1993). Depression and the impression-
formation continuum: Piecemeal processing despite the availability of
category information. Journal of Personality and Social Psychology, 64,
636–645. doi:10.1037/0022-3514.64.4.636
Feldman, S. (2003). Enforcing social conformity: A theory of authoritari-
anism. Political Psychology, 24, 41–74. doi:10.1111/0162-895X.00316
Feldman, S., & Stenner, K. (1997). Perceived threat and authoritarianism.
Political Psychology, 18, 741–770. doi:10.1111/0162-895X.00077
Fiedler, F. E. (1964). A contingency theory of leadership effectiveness. In
L. Berkowitz (Ed.), Advances in experimental social psychology (pp.
149 –190). New York, NY: Academic Press. doi:10.1016/S0065-
2601(08)60051-9
Fiedler, F. E. (1967). Style of leadership and performance of coacting
groups. Zeitschrift fur Experimentelle und Angewandte Psychologie, 14,
200–217.
Fiedler, K., Bluemke, M., & Unkelbach, C. (2009). Exerting control over
allegedly automatic associative processes. In D. M. Tice (Ed.), Psychol-
ogy of self-regulation: Cognitive, affective, and motivational processes
(pp. 249–269). New York, NY: Psychology Press.
Fiedler, K., Messner, C., & Bluemke, M. (2006). Unresolved problems
with the “I,” the “A,” and the “T”: A logical and psychometric critique
of the Implicit Association Test (IAT). European Review of Social
Psychology, 17, 74–147. doi:10.1080/10463280600681248
Fleishman, E. A. (1973). Twenty years of consideration and structure. In E. A.
Fleishman & J. G. Hunt (Eds.), Current developments in the study of
leadership (pp. 1–37). Carbondale, IL: Southern Illinois University Press.
Galinsky, A. D., Gruenfeld, D. H., & Magee, J. C. (2003). From power to
action. Journal of Personality and Social Psychology, 85, 453–466.
doi:10.1037/0022-3514.85.3.453
Galinsky, A. D., Magee, J. C., Gruenfeld, D. H., Whitson, J. A., &
Liljenquist, K. A. (2008). Power reduces the press of the situation:
Implications for creativity, conformity, and dissonance. Journal of Per-
sonality and Social Psychology, 95, 1450–1466. doi:10.1037/a0012633
Gawronski, B., & Bodenhausen, G. V. (2006). Associative and proposi-
tional processes in evaluation: An integrative review of implicit and
explicit attitude change. Psychological Bulletin, 132, 692–731. doi:
10.1037/0033-2909.132.5.692
Gillath, O., & Hart, J. (2010). The effects of psychological security and
insecurity on political attitudes and leadership preferences. European
Journal of Social Psychology, 40, 122–134. doi:10.1002/ejsp.614
Greco, V., & Roger, D. (2001). Coping with uncertainty: The construction
and validation of a new measure. Personality and Individual Differ-
ences, 31, 519–534. doi:10.1016/S0191-8869(00)00156-2
Greenwald, A. G., McGhee, D. E., & Schwartz, J. L. K. (1998). Measuring
individual differences in implicit cognition: The Implicit Association
Test. Journal of Personality and Social Psychology, 74, 1464–1480.
doi:10.1037/0022-3514.74.6.1464
Greenwald, A. G., Nosek, B. A., & Banaji, M. R. (2003). Understanding
and using the Implicit Association Test: I. An improved scoring algo-
rithm. Journal of Personality and Social Psychology, 85, 197–216.
doi:10.1037/0022-3514.85.2.197
Greenwald, A. G., Poehlman, T. A., Uhlmann, E. L., & Banaji, M. R.
(2009). Understanding and using the Implicit Association Test: III.
Meta-analysis of predictive validity. Journal of Personality and Social
Psychology, 97, 17–41. doi:10.1037/a0015575
Guinote, A. (2007a). Power affects basic cognition: Increased attentional
inhibition and flexibility. Journal of Experimental Social Psychology,
43, 685–697. doi:10.1016/j.jesp.2006.06.008
Guinote, A. (2007b). Power and goal pursuit. Personality and Social
Psychology Bulletin, 33, 1076–1087. doi:10.1177/0146167207301011
Higgins, E. T. (1996). Knowledge activation: Accessibility, applicability,
and salience. In E. T. Higgins & A. W. Kruglanski (Eds.), Social
psychology: Handbook of basic principles (pp. 133–168). New York,
NY: Guilford Press.
Hofmann, W., Gawronski, B., Gschwendner, T., Le, H., & Schmitt, M.
(2005). A meta-analysis on the correlation between the Implicit Asso-
ciation Test and explicit self-report measures. Personality and Social
Psychology Bulletin, 31, 1369–1385. doi:10.1177/0146167205275613
Hogg, M. A. (2000). Subjective uncertainty reduction through self-
categorization: A motivational theory of social identity processes. Eu-
ropean Review of Social Psychology, 11, 223–255. doi:10.1080/
14792772043000040
Hogg, M. A. (2007). Social psychology of leadership. In A. W. Kruglanski
& E. T. Higgins (Eds.), Social psychology: Handbook of basic principles
(2nd ed., pp. 716–733). New York, NY: Guilford Press.
Hogg, M. A. (2009). Managing self-uncertainty through group identifica-
tion. Psychological Inquiry, 20, 221–224. doi:10.1080/
10478400903333452
Jost, J. T., Napier, J. L., Thorisdottir, H., Gosling, S. D., Palfai, T. P., &
17UNCERTAINTY AND LEADERSHIP PREFERENCES
Ostafin, B. (2007). Are needs to manage uncertainty and threat associ-
ated with political conservatism or ideological extremity? Personality
and Social Psychology Bulletin, 33, 989 –1007. doi:10.1177/
0146167207301028
Judge, T. A., Piccolo, R. F., & Ilies, R. (2004). The forgotten ones? The
validity of consideration and initiating structure in leadership research.
Journal of Applied Psychology, 89, 36 –51. doi:10.1037/0021-
9010.89.1.36
Kagan, J. (1972). Motives and development. Journal of Personality and
Social Psychology, 22, 51–66. doi:10.1037/h0032356
Keltner, D., Gruenfeld, D. H., & Anderson, C. (2003). Power, approach,
and inhibition. Psychological Review, 110, 265–284. doi:10.1037/0033-
295X.110.2.265
Kernis, M. H. (2005). Measuring self-esteem in context: The importance of
stability of self-esteem in psychological functioning. Journal of Person-
ality, 73, 1569–1605. doi:10.1111/j.1467-6494.2005.00359.x
Kernis, M. H., Cornell, D. P., Sun, C., Berry, A., & Harlow, T. (1993).
There’s more to self-esteem than whether it is high or low: The impor-
tance of stability of self-esteem. Journal of Personality and Social
Psychology, 65, 1190–1204.
Kernis, M. H., & Lakey, C. E. (2010). Fragile versus secure high self-
esteem: Implications for defensiveness and insecurity. In R. M. Arkin,
K. C. Oleson & P. J. Carroll (Eds.), Handbook of the uncertain self (pp.
360–378). New York, NY: Psychology Press.
Kernis, M. H., Paradise, A. W., Whitaker, D. J., Wheatman, S. R., &
Goldman, B. N. (2000). Master of one’s psychological domain? Not
likely if one’s self-esteem is unstable. Personality and Social Psychol-
ogy Bulletin, 26, 1297–1305. doi:10.1177/0146167200262010
Kernis, M. H., & Waschull, S. B. (1995). The interactive roles of stability
and level of self-esteem: Research and theory. In M. P. Zanna (Ed.),
Advances in experimental social psychology (Vol. 27, pp. 93–141). San
Diego, CA: Academic Press.
Kipnis, D. (1972). Does power corrupt? Journal of Personality and Social
Psychology, 24, 33–41. doi:10.1037/h0033390
Kosloff, S., Greenberg, J., Weise, D., & Solomon, S. (2010). Mortality
salience and political preferences: The roles of charisma and political
orientation. Journal of Experimental Social Psychology, 46, 139–145.
doi:10.1016/j.jesp.2009.09.002
Landau, M. J., Solomon, S., Greenberg, J., Cohen, F., Pyszczynski, T.,
Arndt, J., . . . Cook, A. (2004). Deliver us from evil: The effects of
mortality salience and reminders of 9/11 on support for President George
W. Bush. Personality and Social Psychology Bulletin, 30, 1136–1150.
doi:10.1177/0146167204267988
Lavine, H., Burgess, D., Snyder, M., Transue, J., Sullivan, J. L., Haney, B.,
& Wagner, S. H. (1999). Threat, authoritarianism, and voting: An
investigation of personality and persuasion. Personality and Social Psy-
chology Bulletin, 25, 337–347. doi:10.1177/0146167299025003006
LePine, J. A., & Van Dyne, L. (1998). Predicting voice behavior in work
groups. Journal of Applied Psychology, 83, 853–868. doi:10.1037/0021-
9010.83.6.853
Lewin, K., Lippitt, R., & White, R. K. (1939). Patterns of aggressive
behavior in experimentally created “social climates.” The Journal of
Social Psychology, 10, 269–299. doi:10.1080/00224545.1939.9713366
Likert, R. (1961). New patterns of management. New York, NY: McGraw-
Hill.
Lippitt, R. (1940). An experimental study of the effect of democratic and
authoritarian group atmospheres. University of Iowa Studies in Child
Welfare, 16, 43–195.
Loseman, A., Miedema, J., van den Bos, K., & Vermunt, R. (2009).
Exploring how people respond to conflicts between self-interest and
fairness: Influence of threats to the self on affective reactions to advan-
tageous inequity. Australian Journal of Psychology, 61, 13–21. doi:
10.1080/00049530802607605
Mackinnon, A., Jorm, A. F., Christensen, H., Korten, A. E., Jacomb, P. A.,
& Rodgers, B. (1999). A short form of the Positive and Negative Affect
Schedule: Evaluation of factorial validity and invariance across demo-
graphic variables in a community sample. Personality and Individual
Differences, 27, 405–416. doi:10.1016/S0191-8869(98)00251-7
Maner, J. K., & Mead, N. L. (2010). The essential tension between
leadership and power: When leaders sacrifice group goals for the sake of
self-interest. Journal of Personality and Social Psychology, 99, 482–
497. doi:10.1037/a0018559
Marsh, H. W. (1986). Self-serving effect (bias?) in academic attributions:
Its relation to academic achievement and self-concept. Journal of Edu-
cational Psychology, 78, 190–200. doi:10.1037/0022-0663.78.3.190
Maslow, A. H. (1954). The instinctoid nature of basic needs. Journal of
Personality, 22, 326–347. doi:10.1111/j.1467-6494.1954.tb01136.x
McCann, S. J. H. (1997). Threatening times, “strong” presidential popular
vote winners, and the victory margin, 1824–1964. Journal of Person-
ality and Social Psychology, 73, 160 –170. doi:10.1037/0022-
3514.73.1.160
McCann, S. J. H. (2008). Societal threat, authoritarianism, conservatism,
and U.S. state death penalty sentencing (1977–2004). Journal of Per-
sonality and Social Psychology, 94, 913–923. doi:10.1037/0022-
3514.94.5.913
McFarlin, D. B., & Blascovich, J. (1981). Effects of self-esteem and
performance feedback on future affective preferences and cognitive
expectations. Journal of Personality and Social Psychology, 40, 521–
531. doi:10.1037/0022-3514.40.3.521
McGregor, I., Zanna, M. P., Holmes, J. G., & Spencer, S. J. (2001).
Compensatory conviction in the face of personal uncertainty: Going to
extremes and being oneself. Journal of Personality and Social Psychol-
ogy, 80, 472–488. doi:10.1037/0022-3514.80.3.472
Miller, K. I., & Monge, P. R. (1986). Participation, satisfaction, and
productivity: A meta-analytic review. Academy of Management Journal,
29, 727–753. doi:10.2307/255942
Nail, P. R., & McGregor, I. (2009). Conservative shift among liberals and
conservatives following 9/11/01. Social Justice Research, 22, 231–240.
doi:10.1007/s11211-009-0098-z
Neuberger, O. (1972). Experimentelle Untersuchungen von Fuhrungsstilen
[Experimental study of leaderships]. Gruppendynamik, 3, 192–219.
Nielsen, M. E., & Miller, C. E. (1997). The transmission of norms regard-
ing group decision rules. Personality and Social Psychology Bulletin, 23,
516–525. doi:10.1177/0146167297235007
Nosek, B. A., Greenwald, A. G., & Banaji, M. R. (2005). Understanding
and using the Implicit Association Test: II. Method variables and con-
struct validity. Personality and Social Psychology Bulletin, 31, 166–
180. doi:10.1177/0146167204271418
Okada, R. (2010). A meta-analytic review of the relation between self-
esteem level and self-esteem instability. Personality and Individual
Differences, 48, 243–246.
Overbeck, J. R., & Park, B. (2001). When power does not corrupt: Superior
individuation processes among powerful perceivers. Journal of Person-
ality and Social Psychology, 81, 549 –565. doi:10.1037/0022-
3514.81.4.549
Pratto, F., Sidanius, J., Stallworth, L. M., & Malle, B. F. (1994). Social
dominance orientation: A personality variable predicting social and
political attitudes. Journal of Personality and Social Psychology, 67,
741–763. doi:10.1037/0022-3514.67.4.741
Rickert, E. J. (1998). Authoritarianism and economic threat: Implications
for political behavior. Political Psychology, 19, 707–720. doi:10.1111/
0162-895X.00128
Rokeach, M. (1954). The nature and meaning of dogmatism. Psychological
Review, 61, 194–204. doi:10.1037/h0060752
Rosenberg, M. (1965). Society and the adolescent self-image. Princeton,
NJ: Princeton University Press.
Rosenberg, M. (1979). Conceiving the self. New York, NY: Basic Books.
Ross, M., & Wilson, A. E. (2002). It feels like yesterday: Self-esteem,
18 SCHOEL, BLUEMKE, MUELLER, AND STAHLBERG
valence of personal past experiences, and judgments of subjective dis-
tance. Journal of Personality and Social Psychology, 82, 792–803.
doi:10.1037/0022-3514.82.5.792
Rutte, C. G., & Wilke, H. A. M. (1985). Preference for decision structures
in a social dilemma situation. European Journal of Social Psychology,
15, 367–370. doi:10.1002/ejsp.2420150311
Sales, S. M. (1972). Economic threat as a determinant of conversion rates
in authoritarian and nonauthoritarian churches. Journal of Personality
and Social Psychology, 23, 420–428. doi:10.1037/h0033157
Sales, S. M. (1973). Threat as a factor in authoritarianism: An analysis of
archival data. Journal of Personality and Social Psychology, 28, 44–57.
doi:10.1037/h0035588
Sales, S. M., & Friend, K. E. (1973). Success and failure as determinants
of level of authoritarianism. Behavioral Science, 18, 163–172. doi:
10.1002/bs.3830180304
Samuelson, C. D., & Messick, D. M. (1986). Inequities in access to and use
of shared resources in social dilemmas. Journal of Personality and
Social Psychology, 51, 960–967. doi:10.1037/0022-3514.51.5.960
Scheier, M. F., Carver, C. S., & Bridges, M. W. (1994). Distinguishing
optimism from neuroticism (and trait anxiety, self-mastery, and self-
esteem): A reevaluation of the Life Orientation Test. Journal of Person-
ality and Social Psychology, 67, 1063–1078. doi:10.1037/0022-
3514.67.6.1063
Sedikides, C., De Cremer, D., Hart, C., & Brebels, L. G. G. (2010).
Procedural fairness responses in the context of self-uncertainty. In R. M.
Arkin, K. C. Oleson, & P. J. Caroll (Eds.), Handbook of the uncertain
self (pp. 142–159). New York, NY: Psychology Press.
Shiffrin, R. M., & Schneider, W. (1977). Controlled and automatic human
information processing: II. Perceptual learning, automatic attending and
a general theory. Psychological Review, 84, 127–190. doi:10.1037/0033-
295X.84.2.127
Sorrentino, R. M., Short, J. C., & Raynor, J. O. (1984). Uncertainty
orientation: Implications for affective and cognitive views of achieve-
ment behavior. Journal of Personality and Social Psychology, 46, 189–
206. doi:10.1037/0022-3514.46.1.189
Steffens, M. C., & Plewe, I. (2001). Items’ cross-category associations as
a confounding factor in the Implicit Association Test. Zeitschrift fur
Experimentelle Psychologie, 48, 123–134. doi:10.1026//0949-
3946.48.2.123
Stenner, K. (2005). The authoritarian dynamic. New York, NY: Cam-
bridge University Press. doi:10.1017/CBO9780511614712
Stogdill, R. M. (1974). Handbook of leadership: A survey of theory and
research. New York, NY: Free Press.
Strack, F., & Deutsch, R. (2004). Reflective and impulsive determinants of
social behavior. Personality and Social Psychology Review, 8, 220–247.
doi:10.1207/s15327957pspr0803_1
Taylor, S. E., & Brown, J. D. (1988). Illusion and well-being: A social
psychological perspective on mental health. Psychological Bulletin, 103,
193–210. doi:10.1037/0033-2909.103.2.193
Tyler, T. R., & Lind, E. A. (1992). A relational model of authority in
groups. In M. P. Zanna (Ed.), Advances in experimental social psychol-
ogy (Vol. 25, pp. 115–191). San Diego, CA: Academic Press.
Vail, K. E., Arndt, J., Motyl, M., & Pyszczynski, T. (2009). Compassionate
values and presidential politics: Mortality salience, compassionate val-
ues, and support for Barack Obama and John McCain in the 2008
presidential election. Analyses of Social Issues and Public Policy, 9,
255–268. doi:10.1111/j.1530-2415.2009.01190.x
van den Bos, K. (2001). Uncertainty management: The influence of un-
certainty salience on reactions to perceived procedural fairness. Journal
of Personality and Social Psychology, 80, 931–941. doi:10.1037/0022-
3514.80.6.931
van den Bos, K., & Lind, E. A. (2002). Uncertainty management by means
of fairness judgments. In M. P. Zanna (Ed.), Advances in experimental
social psychology (Vol. 34, pp. 1–60). San Diego, CA: Academic Press.
Van Vugt, M., & De Cremer, D. (1999). Leadership in social dilemmas:
The effects of group identification on collective actions to provide public
goods. Journal of Personality and Social Psychology, 76, 587–599.
doi:10.1037/0022-3514.76.4.587
Van Vugt, M., Jepson, S. F., Hart, C. M., & De Cremer, D. (2004).
Autocratic leadership in social dilemmas: A threat to group stability.
Journal of Experimental Social Psychology, 40, 1–13. doi:10.1016/
S0022-1031(03)00061-1
Vescio, T. K., Snyder, M., & Butz, D. A. (2003). Power in stereotypically
masculine domains: A social influence strategy 3 stereotype match
model. Journal of Personality and Social Psychology, 85, 1062–1078.
doi:10.1037/0022-3514.85.6.1062
Vroom, V. H., & Yetton, P. W. (1973). Leadership and decisionmaking.
Pittsburgh, PA.: University of Pittsburgh Press.
Watson, D., Clark, L. A., & Tellegen, A. (1988). Development and vali-
dation of brief measures of positive and negative affect: The PANAS
scales. Journal of Personality and Social Psychology, 54, 1063–1070.
doi:10.1037/0022-3514.54.6.1063
Weary, G., & Edwards, J. A. (1996). Causal-uncertainty beliefs and related
goal structures. In R. M. Sorrentino & E. T. Higgins (Eds.), Handbook
of motivation and cognition: The interpersonal context (Vol. 3, pp.
148–181). New York, NY: Guilford Press.
Weary, G., Tobin, S. J., & Edwards, J. E. (2010). The causal uncertainty
model revisited. In R. M. Arkin, K. C. Oleson, & P. J. Carroll (Eds.),
Handbook of the uncertain self (pp. 78–100). New York, NY: Psychol-
ogy Press.
Weise, D. R., Pyszczynski, T., Cox, C. R., Arndt, J., Greenberg, J.,
Solomon, S., & Kosloff, S. (2008). Interpersonal politics: The role of
terror management and attachment processes in shaping political pref-
erences. Psychological Science, 19, 448 – 455. doi:10.1111/j.1467-
9280.2008.02108.x
Wigboldus, D. H. J., Holland, R. W., & van Knippenberg, A. (2004).
Single target implicit associations. Unpublished manuscript.
Wilson, A. E., & Ross, M. (2001). From chump to champ: People’s
appraisals of their earlier and present selves. Journal of Personality and
Social Psychology, 80, 572–584. doi:10.1037/0022-3514.80.4.572
Wilson, G. D. (1973). The psychology of conservatism. London, England:
Academic Press.
Wilson, T. D., Centerbar, D. B., Kermer, D. A., & Gilbert, D. T. (2005).
The pleasures of uncertainty: Prolonging positive moods in ways people
do not anticipate. Journal of Personality and Social Psychology, 88,
5–21. doi:10.1037/0022-3514.88.1.5
Yukl, G. A. (1998). Leadership in organizations (4th ed.). Englewood
Cliffs, NJ: Prentice-Hall.
(Appendix follows)
19UNCERTAINTY AND LEADERSHIP PREFERENCES

Appendix
German Implicit Association Test Stimuli Used in Studies 1–4 (Bold), Including TheirEnglish Translations
demokratisch autoritar ANGENEHM UNANGENEHM ERFOLG MISSERFOLGdemocratic authoritarian PLEASANT UNPLEASANT SUCCESS FAILURE
sensibel bestimmt JUWEL LÄUSE SIEG FEHLSCHLAGsensitive decisive JEWEL LICE VICTORY MISCARRIAGE
teamfahig direktiv DUFTE MASERN AUFSTIEG VERSAGENteam-player directive FRAGRANCES MEASLES RISE FAILING
liberal energisch ENGEL SCHLEIM TRIUMPH KRISEliberal resolute ANGEL SLIME TRIUMPH CRISIS
integrativ patriarchalisch MEER POCKEN GEWINN VERLUSTintegrative patriarchic SEA POCKS GAIN LOSS
kumpelhaft dominant DIAMANT DRECK GELINGEN FLOPcompanionable dominant DIAMOND DIRT ACHIEVEMENT FLOP
Received March 31, 2010
Revision received January 31, 2011
Accepted February 7, 2011 n
20 SCHOEL, BLUEMKE, MUELLER, AND STAHLBERG
Related Documents