When and How will the Global Economy Recover ? Philip Suttle IIF, Director of Global Macroeconomic Analysis Garanti Masters Private Banking Conference Istanbul, Turkey April 17, 2009

When and How will the Global Economy Recover ?
Jan 01, 2016
When and How will the Global Economy Recover ?. Philip Suttle IIF, Director of Global Macroeconomic Analysis Garanti Masters Private Banking Conference Istanbul, Turkey April 17, 2009. An Organizing Framework. - PowerPoint PPT Presentation
Welcome message from author
This document is posted to help you gain knowledge. Please leave a comment to let me know what you think about it! Share it to your friends and learn new things together.
Transcript

When and How will the Global Economy Recover ?
Philip SuttleIIF, Director of Global Macroeconomic Analysis
Garanti Masters Private Banking Conference Istanbul, Turkey
April 17, 2009

2
An Organizing Framework
A different kind of global business cycle, driven by private credit, not public (monetary and fiscal) policy
The private credit cycle is global in nature, albeit with some sector, country and regional concentration
The downleg of this cycle (“the de-leveraging phase”) has come in two parts: the “strains” phase (early 2007 – Sept 2008) and the “crisis” phase (Sept 2008 – Mar 2009)
The best way to characterize our global outlook is that we are projecting a return to conditions more consistent with the “strains” phase in the months ahead

3
Global Capital Flows and the Global Business Cycle
0
4
8
12
16
20
1969 1973 1977 1981 1985 1989 1993 1997 2001 2005 2009
-20
-15
-10
-5
0
5
10
15
20
Fed Funds Rate
Manufacturing Output
Pre-1992 Post-1992
Rates drive the cycle Rates driven by the cycle
percent percent change oya, inverted scale
4
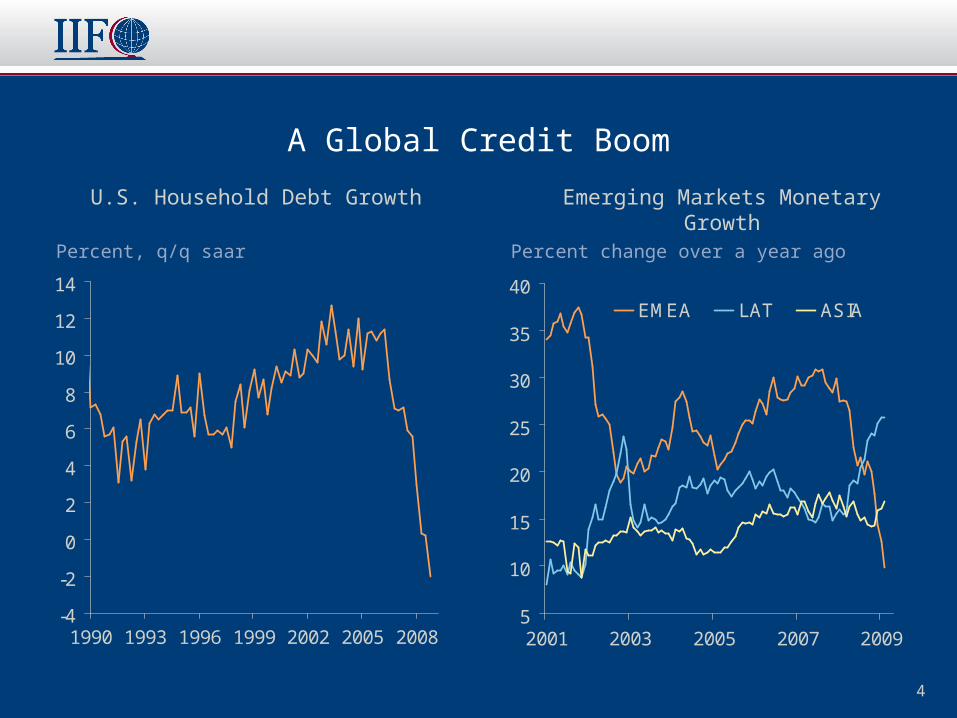
A Global Credit Boom
-4
-2
0
2
4
6
8
10
12
14
1990 1993 1996 1999 2002 2005 2008
Percent, q/q saar
U.S. Household Debt Growth Emerging Markets Monetary Growth
Percent change over a year ago
5
10
15
20
25
30
35
40
2001 2003 2005 2007 2009
EMEA LAT ASIA
5
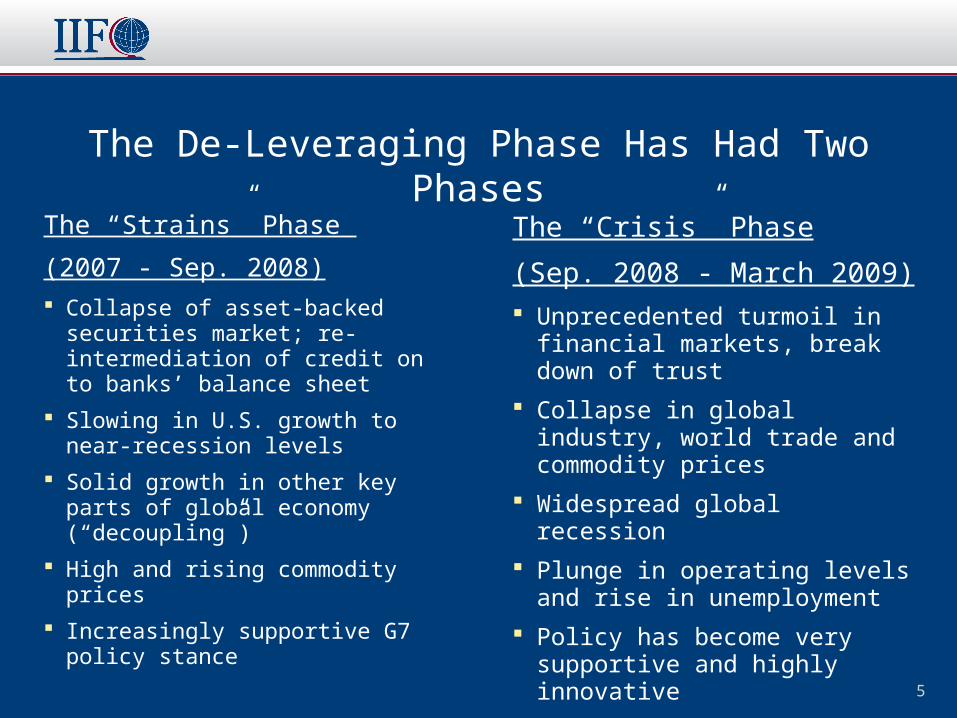
The De-Leveraging Phase Has Had Two Phases
The “Strains” Phase
(2007 - Sep. 2008) Collapse of asset-backed securities
market; re-intermediation of credit on to banks’ balance sheet
Slowing in U.S. growth to near-recession levels
Solid growth in other key parts of global economy (“decoupling”)
High and rising commodity prices
Increasingly supportive G7 policy stance
The “Crisis” Phase
(Sep. 2008 - March 2009) Unprecedented turmoil in financial
markets, break down of trust
Collapse in global industry, world trade and commodity prices
Widespread global recession
Plunge in operating levels and rise in unemployment
Policy has become very supportive and highly innovative

6
The Current Global Slump is Unprecedented: Deep and Synchronized
-30
-25
-20
-15
-10
-5
0
5
10
15
20
06 07 08 09-35
-30
-25
-20
-15
-10
-5
0
5
10
Emerging Markets (left axis)
G3 (right axis)
Percent, 3m/3m, saar (both axes)
Global Exports and Manufacturing Production
Percent, 3m/3m, saar (nominal terms)
-60
-50
-40
-30
-20
-10
0
10
20
30
40
2006 2007 2008 2009-35
-30
-25
-20
-15
-10
-5
0
5
10
Goods Exports(left axis)
Mfg. Production(right axis)
Manufacturing Production
Percent, 3m/3m, saar
7
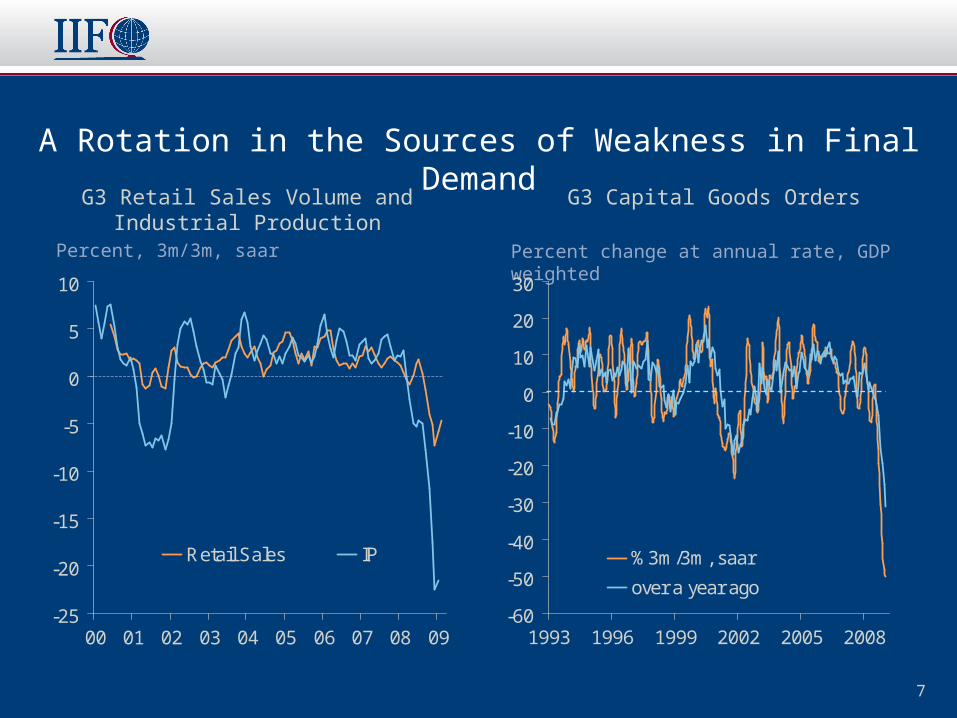
A Rotation in the Sources of Weakness in Final Demand
-25
-20
-15
-10
-5
0
5
10
00 01 02 03 04 05 06 07 08 09
Retail Sales IP
Percent, 3m/3m, saar
G3 Capital Goods Orders
Percent change at annual rate, GDP weighted
-60
-50
-40
-30
-20
-10
0
10
20
30
1993 1996 1999 2002 2005 2008
%3m/3m, saar
over a year ago
G3 Retail Sales Volume and Industrial Production
8
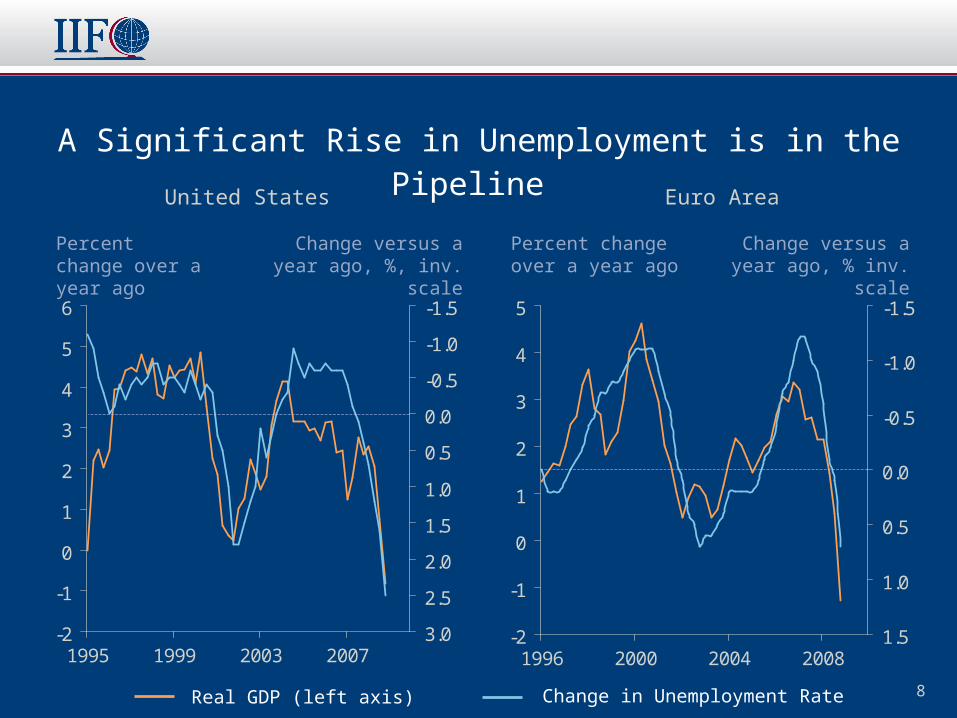
A Significant Rise in Unemployment is in the Pipeline
-2
-1
0
1
2
3
4
5
6
1995 1999 2003 2007
-1.5
-1.0
-0.5
0.0
0.5
1.0
1.5
2.0
2.5
3.0
Percent change over a year ago
Euro Area
Percent change over a year ago
-2
-1
0
1
2
3
4
5
1996 2000 2004 2008
-1.5
-1.0
-0.5
0.0
0.5
1.0
1.5
United States
Change versus a year ago, % inv. scale
Change versus a year ago, %, inv. scale
Real GDP (left axis) Change in Unemployment Rate

9
A Significant Rise in Unemployment is in the Pipeline (2)
-5
-4
-3
-2
-1
0
1
2
3
4
5
1995 1999 2003 2007
-0.8
-0.4
0.0
0.4
0.8
1.2
Percent change over a year ago
Emerging Asia
Percent change over a year ago
1
3
5
7
9
11
1996 2000 2004 2008
-0.4
-0.2
0.0
0.2
0.4
0.6
Japan
Change versus a year ago, % inv. scale
Change versus a year ago, %, inv. scale
Real GDP (left axis) Change in Unemployment Rate

10
A Significant Rise in Unemployment is in the Pipeline (3)
0
1
2
3
4
5
6
7
8
9
1996 2000 2004 2008
-0.8
-0.6
-0.4
-0.2
0.0
0.2
0.4
0.6
0.8
Percent change over a year ago
Latin America
Percent change over a year ago
-2
0
2
4
6
8
1996 2000 2004 2008
-2.0
-1.5
-1.0
-0.5
0.0
0.5
1.0
1.5
2.0
Emerging Markets
Change versus a year ago, % inv. scale
Change versus a year ago, %, inv. scale
Real GDP (left axis) Change in Unemployment Rate
11
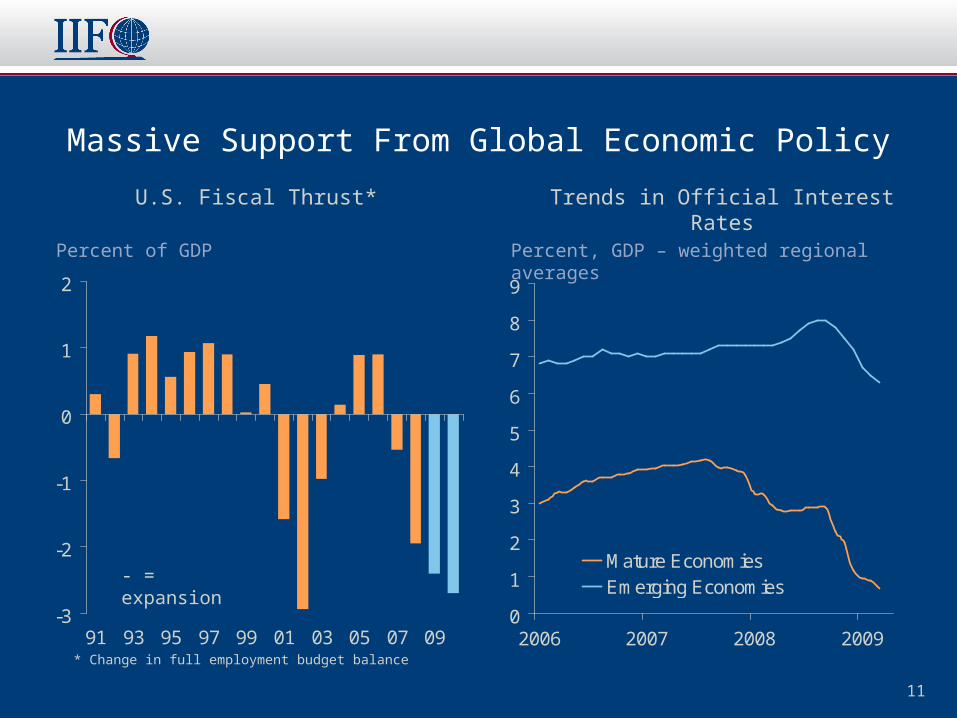
Massive Support From Global Economic Policy
-3
-2
-1
0
1
2
91 93 95 97 99 01 03 05 07 09
Percent of GDP
U.S. Fiscal Thrust* Trends in Official Interest Rates
Percent, GDP – weighted regional averages
0
1
2
3
4
5
6
7
8
9
2006 2007 2008 2009
Mature EconomiesEmerging Economies
* Change in full employment budget balance
- = expansion
12
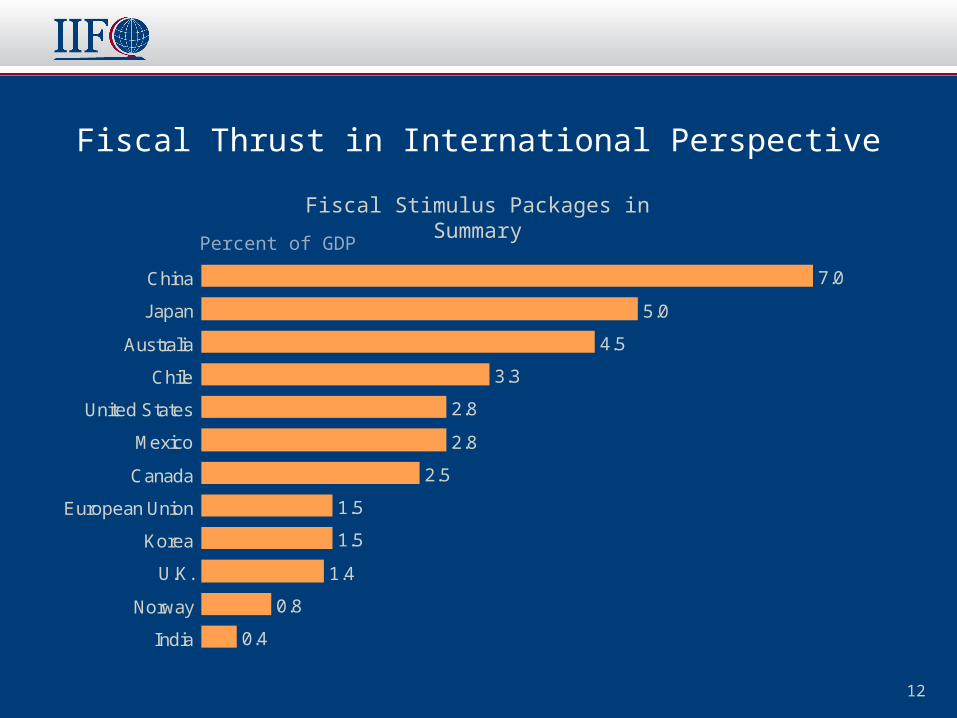
Fiscal Thrust in International Perspective
7.0
5.0
4.5
3.3
2.8
2.8
2.5
1.5
1.5
1.4
0.8
0.4
China
Japan
Australia
Chile
United States
Mexico
Canada
European Union
Korea
U.K.
Norway
India
Fiscal Stimulus Packages in Summary
Percent of GDP
13
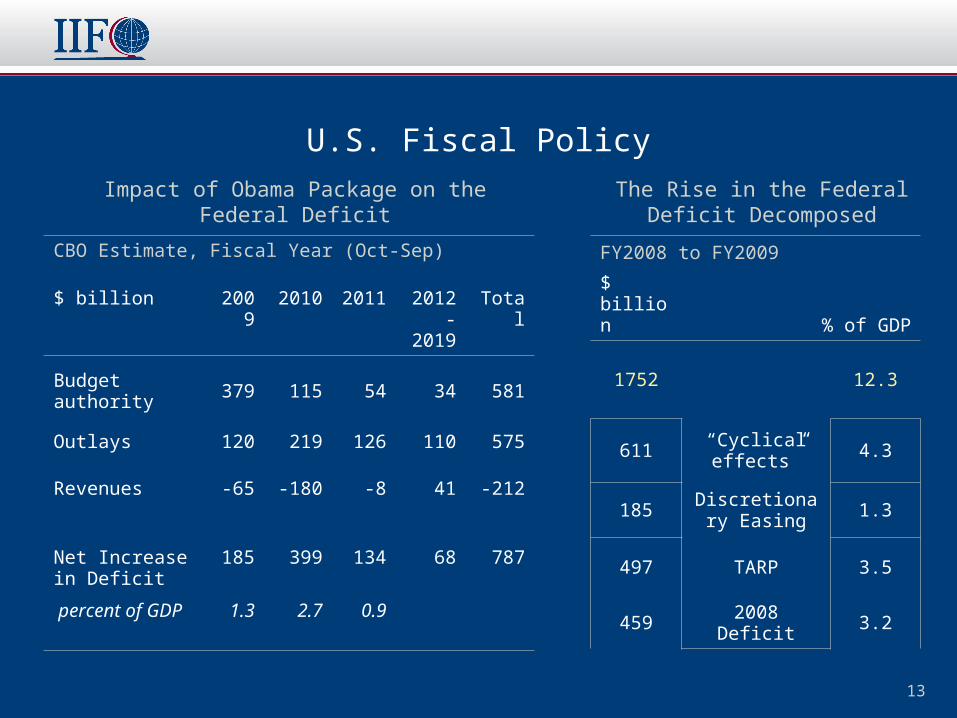
U.S. Fiscal Policy
Impact of Obama Package on the Federal Deficit
CBO Estimate, Fiscal Year (Oct-Sep)
$ billion 2009 2010 2011 2012-2019
Total
Budget authority 379 115 54 34 581
Outlays 120 219 126 110 575
Revenues -65 -180 -8 41 -212
Net Increase in Deficit
185 399 134 68 787
percent of GDP 1.3 2.7 0.9
FY2008 to FY2009
$ billion % of GDP
1752 12.3
611“Cyclical effects”
4.3
185Discretionary
Easing1.3
497 TARP 3.5
459 3.22008 Deficit
The Rise in the Federal Deficit Decomposed

14
Quantitative Easing is the New “New Thing”
50
100
150
200
250
300
350
Jul 07 Nov 07 Mar 08 Jul 08 Nov 08 Mar 09
Fed ECB
BoE BoJ
Central Bank Balance Sheets: Total Assets
Index, end-June 2007=100
BoE 12.6%
Fed 14.5%
ECB 19.7%
BoJ 24.1%
Current Level of Assets (% GDP)
15
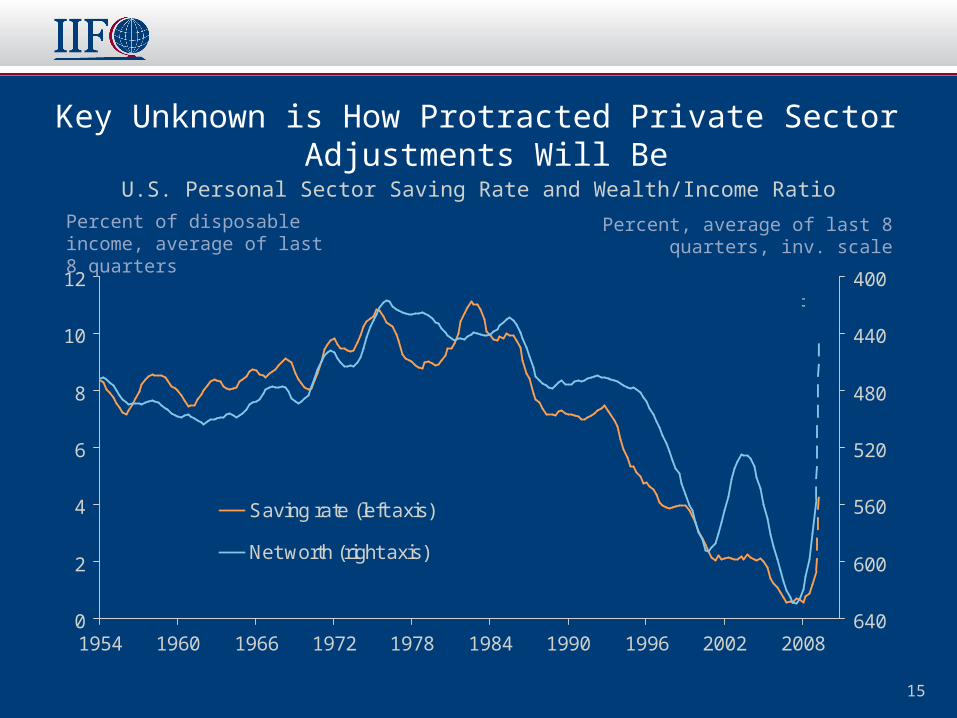
Key Unknown is How Protracted Private Sector Adjustments Will Be
0
2
4
6
8
10
12
1954 1960 1966 1972 1978 1984 1990 1996 2002 2008
400
440
480
520
560
600
640
Saving rate (left axis)
Net worth (right axis)
Dotted lines denote latest estimate (09Q1)
U.S. Personal Sector Saving Rate and Wealth/Income Ratio
Percent of disposable income, average of last 8 quarters
Percent, average of last 8 quarters, inv. scale
16
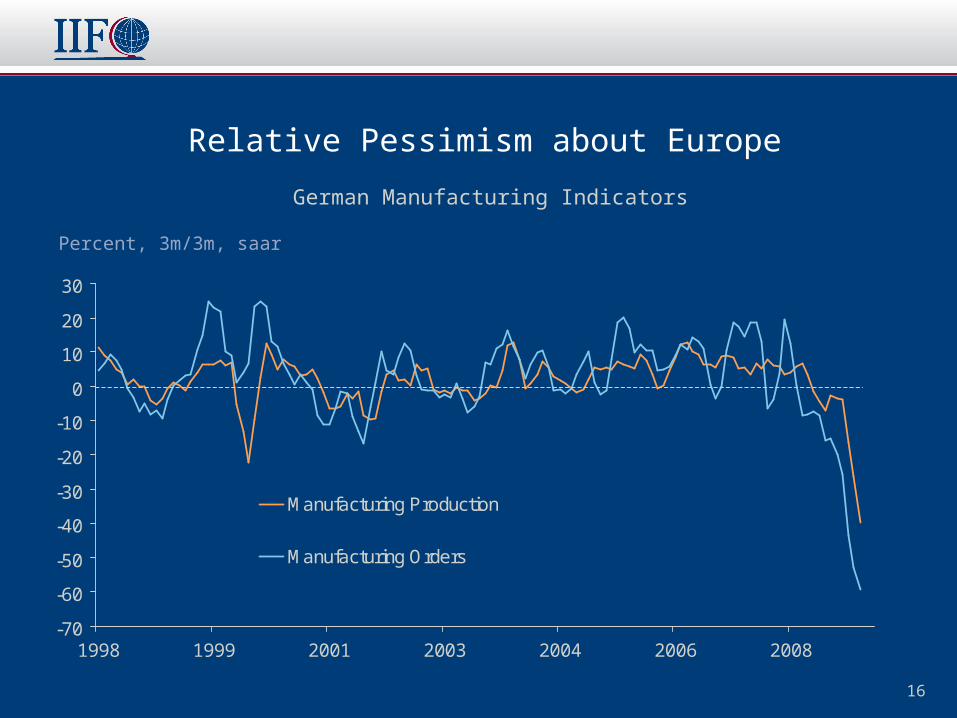
Relative Pessimism about Europe
-70
-60
-50
-40
-30
-20
-10
0
10
20
30
1998 1999 2001 2003 2004 2006 2008
Manufacturing Production
Manufacturing Orders
Percent, 3m/3m, saar
German Manufacturing Indicators

17
Areas of Concern in Europe
Lack of economic flexibility
Lack of policy coordination
Extent of deleveraging ahead in banking systems remains significant
Growing public debt problems in many countries
Over-extended housing markets
Difficulties in Emerging Europe

18
Emerging Europe: The Epicenter of the Third EM Capital Flows Slump since 1980
-1
0
1
2
3
4
5
6
7
1980 1985 1990 1995 2000 2005-2
0
2
4
6
8
10
12
14
Latin America Emerging Asia Emerging Europe (right axis)
Net Private Capital Flows by Major Region
Percent of emerging market GDP Percent of emerging market GDP
19
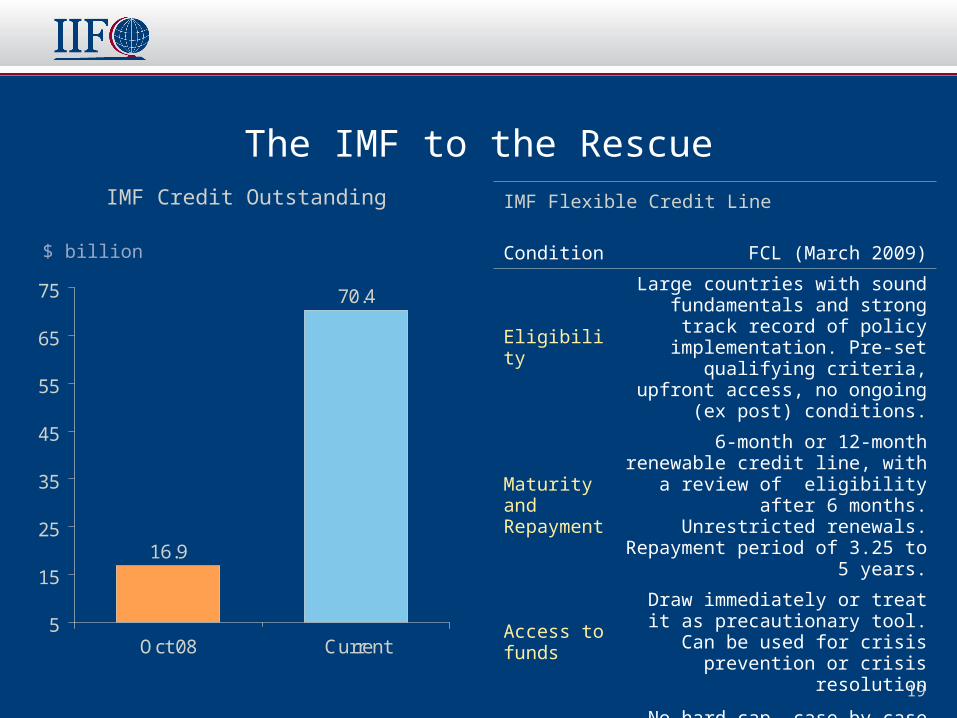
The IMF to the Rescue
16.9
70.4
5
15
25
35
45
55
65
75
Oct 08 Current
$ billion
IMF Credit Outstanding IMF Flexible Credit Line
Condition FCL (March 2009)
Eligibility
Large countries with sound fundamentals and strong track
record of policy implementation. Pre-set qualifying criteria, upfront
access, no ongoing (ex post) conditions.
Maturity and Repayment
6-month or 12-month renewable credit line, with a review of eligibility
after 6 months. Unrestricted renewals. Repayment period of 3.25
to 5 years.
Access to funds
Draw immediately or treat it as precautionary tool. Can be used for crisis prevention or crisis resolution
AmountNo hard cap, case-by-case
assessment

20
There Are Encouraging Signs from China
12
14
16
18
20
22
24
26
2005 2006 2007 2008 2009
Total Loans
M2
China: Monetary Growth
Percent change over a year ago
21
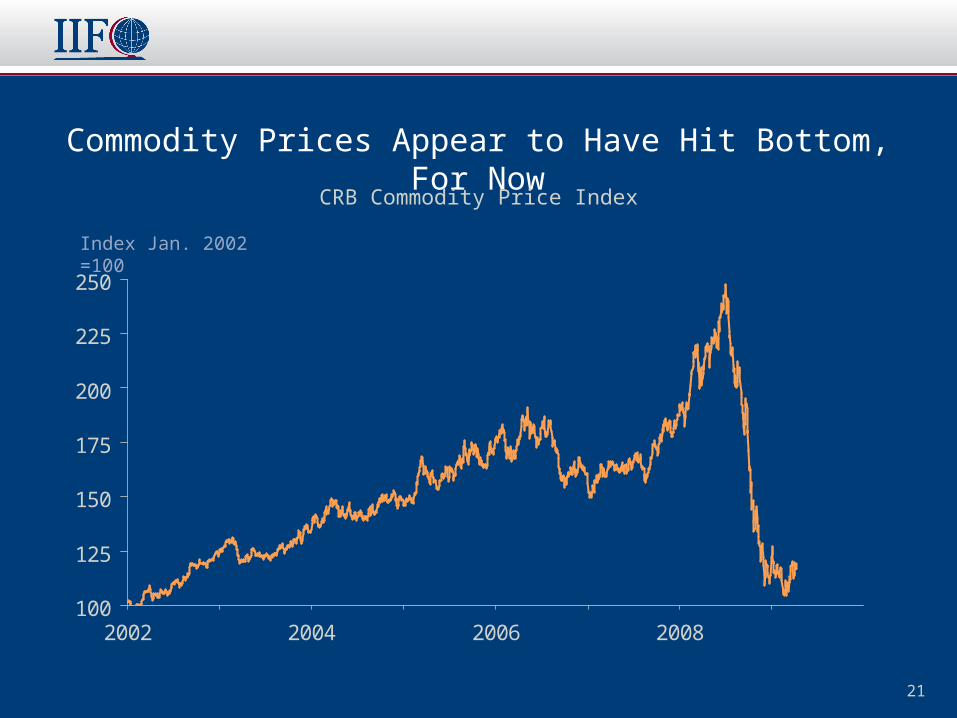
Commodity Prices Appear to Have Hit Bottom, For Now
100
125
150
175
200
225
250
2002 2004 2006 2008
CRB Commodity Price Index
Index Jan. 2002 =100
22
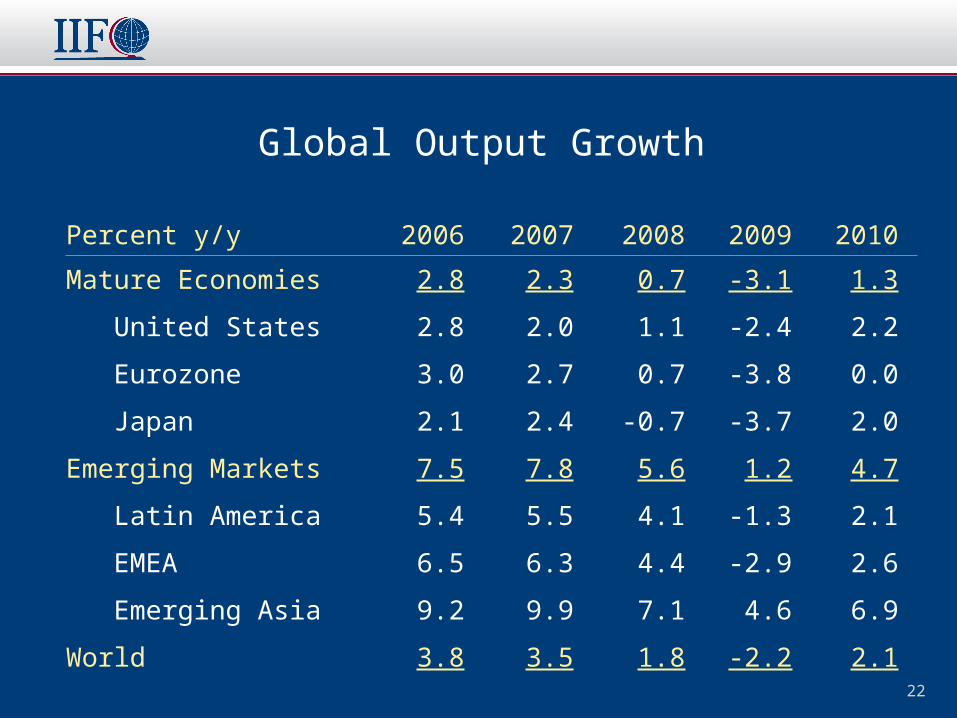
Global Output Growth
Percent y/y 2006 2007 2008 2009 2010
Mature Economies 2.8 2.3 0.7 -3.1 1.3
United States 2.8 2.0 1.1 -2.4 2.2
Eurozone 3.0 2.7 0.7 -3.8 0.0
Japan 2.1 2.4 -0.7 -3.7 2.0
Emerging Markets 7.5 7.8 5.6 1.2 4.7
Latin America 5.4 5.5 4.1 -1.3 2.1
EMEA 6.5 6.3 4.4 -2.9 2.6
Emerging Asia 9.2 9.9 7.1 4.6 6.9
World 3.8 3.5 1.8 -2.2 2.1
23
Concluding Messages
The global economy has been in free-fall for six months, but there are some tentative signs that this is moderating.
In the months ahead, a return to a desynchronized global economy is likely.
A significant increase in global unemployment is now underway, however.
Massive, unprecedented, global policy easing is now underway, the long-term implications of which are somewhat unclear.
Major challenges lie ahead in Europe.
The global backdrop for Asia and Latin America remains very tough, but has improved slightly in the past few months.

When and How will the Global Economy Recover ?
Philip SuttleIIF, Director of Global Macroeconomic Analysis
Garanti Masters Private Banking Conference Istanbul, Turkey
April 17, 2009
Related Documents