Short Range Transit Plan FY2012-2021 Livermore Amador Valley Transit Authority Adopted November 2012

Welcome message from author
This document is posted to help you gain knowledge. Please leave a comment to let me know what you think about it! Share it to your friends and learn new things together.
Transcript

Short Range Transit PlanFY2012-2021
Livermore Amador Valley Transit Authority
Adopted November 2012


LAVTA Short Range Transit Plan FY2012-FY2021 i
Livermore Amador Valley Transit Authority
Short Range Transit Plan
Fiscal Years 2012 to 2021
Adoption Date: November 5, 2012
Federal transportation statutes require that the Metropolitan Transportation Commission (MTC), in partnership with state and local agencies, develop and periodically update a long‐range Regional Transportation Plan (RTP), and a Transportation Improvement Program (TIP) which implements the RTP by programming federal funds to transportation projects contained in the RTP. In order to effectively execute these planning and programming responsibilities, MTC requires that each transit operator in its region which receives federal funding through the TIP, prepare, adopt and submit a Short Range Transit Plan (SRTP). The preparation of this report has been funded in part by a grant from the U.S. Department of Transportation through section 5303 of the Federal Transit Act. The contents of this SRTP reflect the views of the Livermore Amador Valley Transit Authority (LAVTA), and not necessarily those of the Federal Transit Administration (FTA) or MTC. LAVTA is solely responsible for the accuracy of the information presented in this SRTP.

LAVTA Short Range Transit Plan FY2012-FY2021 ii
This page intentionally left blank.
LAVTA Short Range Transit Plan FY2012-FY2021 iii
ACKNOWLEGEMENTS
Board of Directors Laureen Turner, Chair City of Livermore Jerry Thorne, Vice-Chair City of Pleasanton Don Biddle City of Dublin Scott Haggerty Alameda County Cindy McGovern City of Pleasanton Tim Sbranti City of Dublin Bob Woerner City of Livermore Executive Director Paul Matsuoka Department Directors Beverly Adamo Administrative Services Sylvia Cox Planning and Communications Project Staff
Tamara Edwards Finance and Grants Manager Viona Hioe Transit Planner Intern Kadri Kulm Paratransit Planner David Massa Fleet/Technology Analyst Cyrus Sheik Transit Planner Consultant Support – Nelson Nygaard Joey Goldman, Project Manager Richard Weiner Paul Jewel
Livermore Amador Valley Transit Authority 1362 Rutan Court, Suite 100
Livermore, CA 94551

LAVTA Short Range Transit Plan FY2012-FY2021 iv
This page intentionally left blank.

LAVTA Short Range Transit Plan FY2012-FY2021 v
TABLE OF CONTENTS
Description Page
Chapter 1 Introduction and Overview of LAVTA
Governance and Administration ……………………… 1 Chapter 2 Demographic Analysis ………………………………….…. 7 Chapter 3 Existing Transit Services ………………………..………. 17 Chapter 4 Goals, Objectives, and Standards …..……………… 33 Chapter 5 Service Evaluation …………………………………………… 41 Chapter 6 Operations Plan ……………………………………………..… 105 Chapter 7 Financial Plan, Operations Budget, and Capital Plan …………………………………………………..…. 119 Appendix Title VI Report

LAVTA Short Range Transit Plan FY2012-FY2021 vi
This page intentionally left blank.

LAVTA Short Range Transit Plan FY2012-FY2021
Amador Valley Transit Authority
1
Introduction and Overview of LAVTA Governance and Administration
The purpose of the Short Range Transit Plan (SRTP) is to serve as a management and policy document for the Livermore Amador Valley Transit Authority (LAVTA) over a ten year timeframe. Since the last SRTP update, LAVTA has been proactive in responding to changes in the economy and coordinating transit services with growth and developments in the Tri Valley area.
In response to the Great Recession, LAVTA was forced to cut fixed route service by 25% in 2009 and increase fares. In the past three years, LAVTA has been reinstating and growing its service in an effort to restore service to pre-Recession levels.
A Bus Rapid Transit (BRT) line, named the Rapid, was implemented in January 2011 to connect East Livermore and West Pleasanton with points in-between, as well as provide a feeder service to the BART stations in the Dublin/Pleasanton area.
The American Logistics Company (ALC) was awarded a contract, starting July 1, 2011, to deliver high quality, on demand paratransit service. Under the ALC business model, a flexible mobile fleet is owned and operated by independent subcontractors, eliminating fleet maintenance costs to LAVTA. Additional efficiencies include a streamlined call center which takes reservations, dispatches trips, and provides customer service.
The Atlantis Operating and Maintenance (O&M) facility began construction in 2008 to meet LAVTA’s need for a maintenance facility with a larger storage capacity. Phase I, the construction of a parking and storage area, was completed in 2008. Phase II, the construction of a bus fuel and wash facility, is scheduled to be completed in January 2013.
1.1 AGENCY HISTORY
LAVTA was established in May 1985 when the Cities of Dublin, Livermore, Pleasanton and Alameda County executed a Joint Powers Agreement (JPA) that created the independent authority. LAVTA’s charter mission was to develop and operate local and intercity public transportation in the Tri-Valley operating under the brand name, Wheels. The following year, LAVTA began transit service on four fixed routes in the cities of Dublin and Pleasanton with nine leased buses. By July 1, 1987, the City of Livermore’s Rideo system fully merged with LAVTA, providing seamless connections between all three cities and unincorporated portions of Alameda County.
Chapter 1

LAVTA Short Range Transit Plan FY2012-FY2021
Chapter 1
2
The LAVTA Maintenance, Operations and Administration (MOA) facility was built in 1991 on Rutan Court. This facility acts as the central base of operations for all Wheels service. All maintenance and operation functions are dispatched from this location. The Wheels administration, including the agency and contracted operations staff, also operate out of this facility. In 1996, LAVTA became fully compliant with the provisions of the Americans with Disabilities Act (ADA), requiring a fully wheelchair accessible fixed-route and paratransit fleet. Paratransit service was provided on a demand response basis. The opening of the San Francisco Bay Area Rapid Transit (BART) Dublin/Pleasanton extension in 1997 reoriented Wheels service eastward to the new hub. Another major service change that year was the establishment of the Direct Access Responsive Transit (DART). DART is a hybrid of a deviated fixed route system and a demand responsive system that was open to the general public. Midday and Saturday service for local routes were also discontinued. In 1999, LAVTA started regional express service, routes 70X and 20X, and a subscription service to Silicon Valley, named the Prime Time Express. Also that year, the Transit Center1 was completed at the Railroad and Old First Street intersection in downtown Livermore. This center provides Wheels patrons direct access to the Altamont Commuter Express (ACE) platform which is adjacent to the Transit Center. LAVTA began shuttle services also to the Vasco Road and Pleasanton ACE Stations. The Bay Area economy entered a depression as the dot com era boomed and busted in the early 2000s. Service levels were decreased in response to declining revenues and budgets. LAVTA shifted resources away from pure coverage routes towards more of a demand based service model. By mid-decade, LAVTA was poised to meet the needs of the recovering economy. New service was established in 2006 to serve the newly constructed, high density, and transit oriented neighborhoods of East Dublin. The initiation of the Bay Area’s new All Nighter transit network, which linked several activity centers in the region with 24 hour bus service, was also started this year. LAVTA transitioned the successful route 10 into an All Nighter route dubbed the route 810. A second ACE shuttle route, route 53, from the Pleasanton ACE to Stoneridge Mall, was added to facilitate the growing number of ACE commuters to jobs in Pleasanton. Offsetting the new service was the discontinuation of the Prime Time subscription service to Silicon Valley. DART service hours in Pleasanton and Dublin were converted back into regular, fixed route services on routes 1, 3, 7, 8, and 50. This growing trend continued, where the economy rebounded and Wheels revenues resulted in more service on the street.
1 In 2006, the City of Livermore developed a large parking structure on the ACE site that provides over 500 spaces, with
designated spots for transit users.

LAVTA Short Range Transit Plan FY2012-FY2021
Chapter 1
3
In 2008, ground was broken for a new bus operations and maintenance facility on Atlantis Court in Livermore. The Atlantis O&M Facility, Phase I, completed the construction of a parking and storage area in June 2008. Phase II, the bus fuel and wash plant and supporting maintenance facilities, is currently under construction and is anticipated to be completed in January 2013. Responding to federal, state and local funding shortfalls caused by the Great Recession of 2008, LAVTA consolidated routes and discontinued the All Nighter route and many midday services in 2009. Overall, the service change resulted in a 25% reduction in revenue hours of service. Fare policy was restructured, resulting in a fare increase and policy changes discontinuing free services. A Bus Rapid Transit (BRT) line, named the Rapid, was implemented in January 2011. The Rapid serves as a mainline east-west corridor serving Livermore, Dublin, and Pleasanton as well as provide a feeder service to the BART stations in the Dublin/Pleasanton area. The addition of this new service increased ridership and started LAVTA’s recovery from the Great Recession. In July 2011, ALC began its operation of the paratransit demand response services. The ALC business model utilizes independent subcontractors who own, operate, and maintain their vehicles, eliminating the need for a standalone paratransit fleet and the associated maintenance costs. LAVTA continued growing in 2012, expanding services to the Dublin Ranch area and adding more frequent commuter services. A three year growth trend has effectively restored two-thirds of services to pre-Recession levels. 1.2 GOVERNANCE
The governing body for LAVTA is the Board of Directors (BOD). The BOD establishes policy for the agency. Two representatives from Livermore, Dublin, and Pleasanton and one member representing Alameda County compose the BOD. The mayors of each municipality appoint elected city council members to terms on the LAVTA BOD, with each mayor having sole appointment authority. Board authority is based on a Joint Exercise of Powers Agreement that was approved by all member jurisdictions in 1985. The current members of the LAVTA BOD, in no particular order, are:
Alameda County representative Supervisor Scott Haggerty Term expires 11/12
City of Dublin representative Mayor Tim Sbranti Term expires 11/12
City of Dublin representative Councilmember Don Biddle Term expires 11/14

LAVTA Short Range Transit Plan FY2012-FY2021
Chapter 1
4
City of Pleasanton representative Councilmember Cindy McGovern Term expires11/12
City of Pleasanton representative Councilmember Jerry Thorne Term expires 11/14
City of Livermore representative Councilmember Bob Woerner Term expires 11/13
City of Livermore representative Councilmember Laureen Turner Term expires 11/15 LAVTA’s BOD is divided into two committees that meet regularly to consider items within each committee’s purview. The current members of the Finance and Administration Committee are:
Don Biddle (Dublin)
Jerry Thorne (Pleasanton)
Laureen Turner (Livermore)
The current members of the Projects and Services Committee are:
Scott Haggerty (Alameda County)
Tim Sbranti (Dublin)
Cindy McGovern (Pleasanton)
Bob Woerner (Livermore) 1.3 ORGANIZATIONAL STRUCTURE
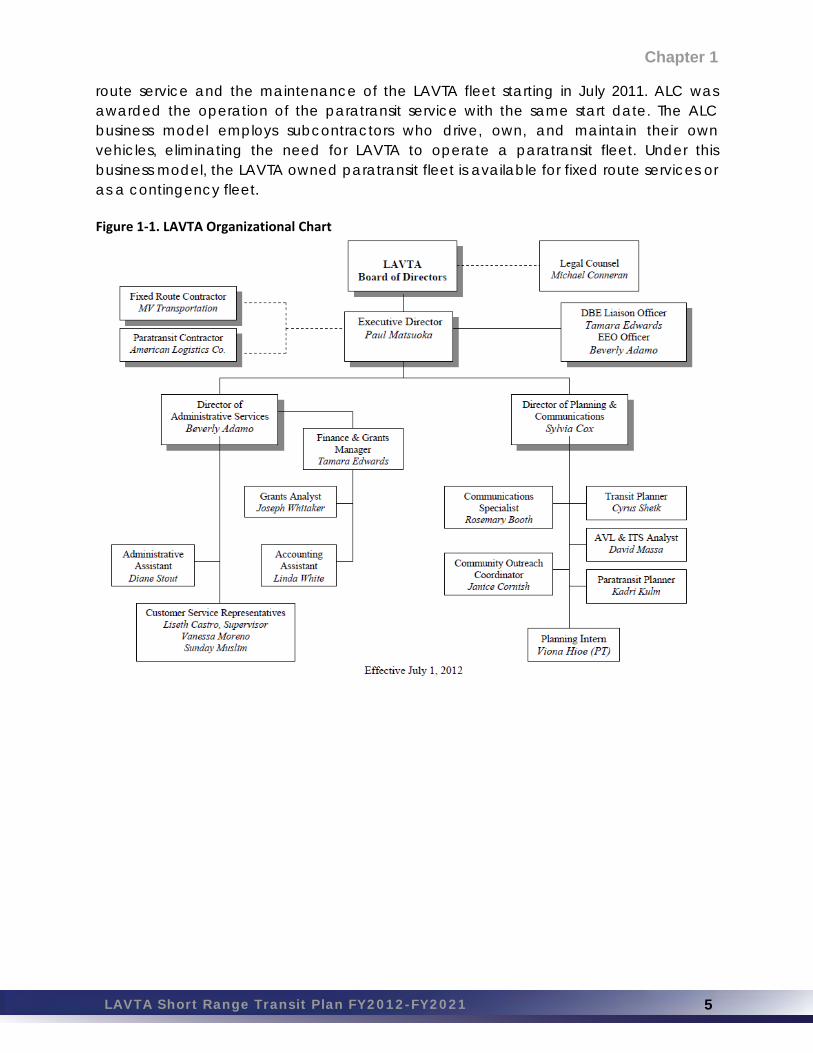
The LAVTA organization structure has remained relatively the same since last full SRTP update in 2008. Operating under the direction of the Executive Officer, the agency is divided into two departments, Administrative Services and Planning and Communications. Staffing levels have remained steady at approximately 15 full time employees (FTE). Figure 1 is a graphical representation of the LAVTA organization chart. LAVTA contracts out the Operations and Maintenance for fixed route and paratransit services. From 2002 through 2011, MV Transportation provided operations and maintenance for the fixed route and paratransit services. MV Transportation employs drivers, mechanics, supervisors, and its own management staff at the LAVTA property. All non-management MV Transportation employees are represented by Teamsters Local #70. After a thorough procurement process, MV Transportation was committed to a contract term of three years plus four, one year options for the operation of the fixed
LAVTA Short Range Transit Plan FY2012-FY2021
Chapter 1
5
route service and the maintenance of the LAVTA fleet starting in July 2011. ALC was awarded the operation of the paratransit service with the same start date. The ALC business model employs subcontractors who drive, own, and maintain their own vehicles, eliminating the need for LAVTA to operate a paratransit fleet. Under this business model, the LAVTA owned paratransit fleet is available for fixed route services or as a contingency fleet. Figure 1‐1. LAVTA Organizational Chart

LAVTA Short Range Transit Plan FY2012-FY2021
Chapter 1
6
This page intentionally left blank.

LAVTA Short Range Transit Plan FY2012-FY2021 7
Demographic Analysis
2.1 OVERVIEW
The Wheels service area covers 40 square miles and consists of the jurisdictions of Dublin (pop. 46,036), Livermore (pop. 80,968), and Pleasanton (pop. 70,285) and some unincorporated areas of Alameda County. The area is sometimes called the Livermore Valley or Amador Valley and is commonly known as the Tri-Valley Area. The three cities in the Tri-Valley area have grown, developing from a primarily agricultural area with two small agriculturally-based cities into largely low-density, auto-oriented, mostly affluent suburban development. Dublin, in particular, has been one of the fastest growing cities in Alameda County. High population growth in the area led to rapid development in many undeveloped areas until limited by Measure D. Measure D passed in 2000 and established growth boundaries around the three cities and limited development in unincorporated areas. The Tri-Valley area’s demographic data provides background for the transit planning process. Travel patterns, the distribution of the population, and the locations of transit-dependent populations are key factors to understanding the area’s transit needs. The most successful transit routes, in terms of productivity and ridership, link areas of high density and mixed uses. Thereby, identifying areas of population and employment density are also important in route planning. This section reviews existing densities in the Wheels service area based on 2010 US Census data. 2.2 POPULATION AND INCOME DISTRIBUTION
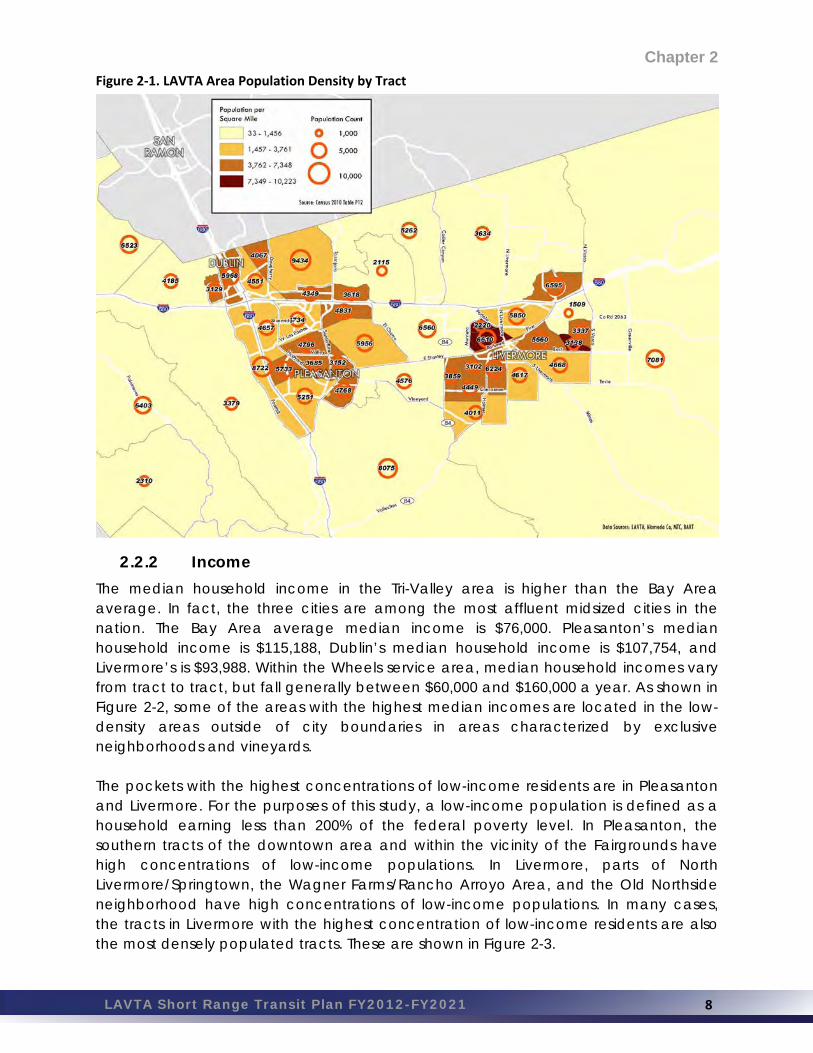
2.2.1 Population Densities The cities of Livermore, Pleasanton, and Dublin overall have similar residential densities classified as suburban. The residential densities are 2,896, 3,155, and 3,216 people per square mile in Pleasanton, Dublin, and Livermore, respectively. The distribution of residential densities is not even throughout the communities with some very sparsely populated census tracts and some very concentrated. The highest areas of population density, as high as 7,000 to 10,000 people per square mile, are located in Livermore. One area is the central/western section of Livermore and is served by Wheels Routes 12 and 14. Another is adjacent to and just west of the Lawrence Livermore National Laboratory (LLNL)/Sandia transit hub at East Avenue and Vasco Road where Routes 10, 20X, and the Rapid terminate. Areas of low density are in the outlying agricultural areas of the Tri-Valley and between Livermore and Pleasanton where a large quarry dominates the landscape. Population density is shown in Figure 2-1.
Chapter 2
LAVTA Short Range Transit Plan FY2012-FY2021
Chapter 2
8
Figure 2‐1. LAVTA Area Population Density by Tract
2.2.2 Income
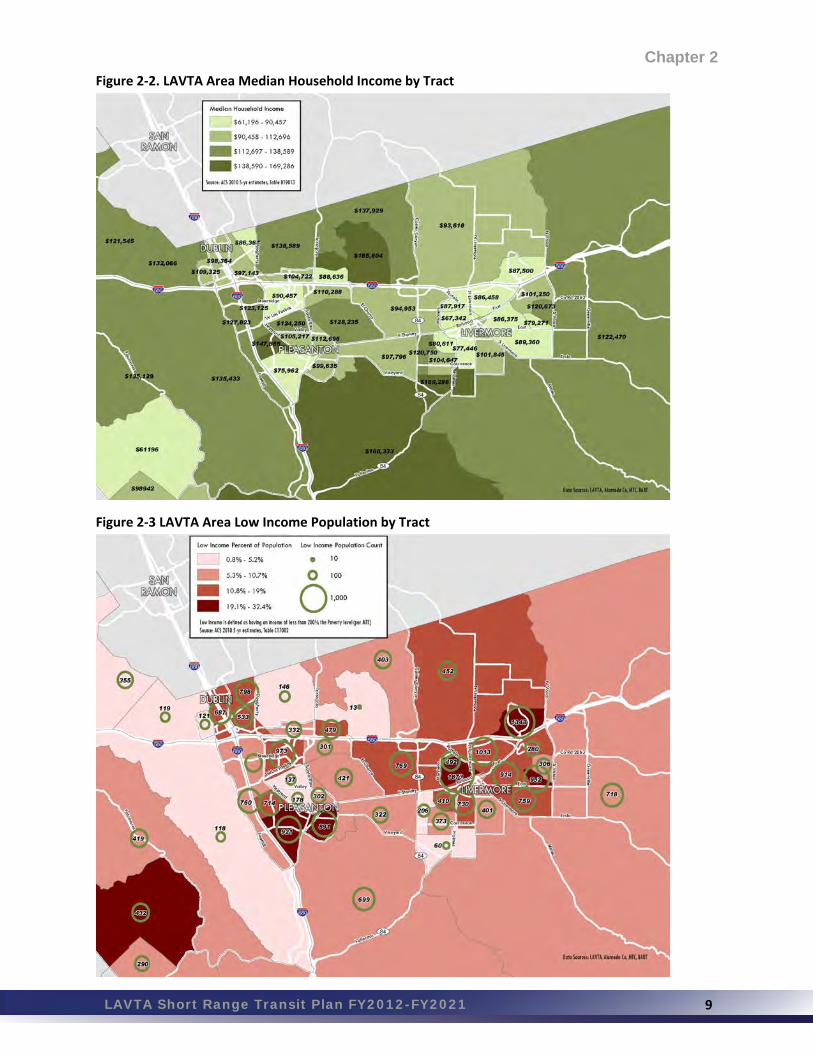
The median household income in the Tri-Valley area is higher than the Bay Area average. In fact, the three cities are among the most affluent midsized cities in the nation. The Bay Area average median income is $76,000. Pleasanton’s median household income is $115,188, Dublin’s median household income is $107,754, and Livermore’s is $93,988. Within the Wheels service area, median household incomes vary from tract to tract, but fall generally between $60,000 and $160,000 a year. As shown in Figure 2-2, some of the areas with the highest median incomes are located in the low-density areas outside of city boundaries in areas characterized by exclusive neighborhoods and vineyards. The pockets with the highest concentrations of low-income residents are in Pleasanton and Livermore. For the purposes of this study, a low-income population is defined as a household earning less than 200% of the federal poverty level. In Pleasanton, the southern tracts of the downtown area and within the vicinity of the Fairgrounds have high concentrations of low-income populations. In Livermore, parts of North Livermore/Springtown, the Wagner Farms/Rancho Arroyo Area, and the Old Northside neighborhood have high concentrations of low-income populations. In many cases, the tracts in Livermore with the highest concentration of low-income residents are also the most densely populated tracts. These are shown in Figure 2-3.
LAVTA Short Range Transit Plan FY2012-FY2021
Chapter 2
9
Figure 2‐2. LAVTA Area Median Household Income by Tract
Figure 2‐3 LAVTA Area Low Income Population by Tract

LAVTA Short Range Transit Plan FY2012-FY2021 10
2.3 TRANSIT DEPENDENT POPULATIONS
Many seniors, young people, and people with disabilities depend on transit as their primary means of transportation as many cannot drive. In order to better serve these market groups, it is important to identify where there are concentrations of these groups.
2.3.1 Seniors
Livermore and Pleasanton have senior populations that total about 10.3% and 11%, respectively, of their total populations. This is about average for the Bay Area. Dublin’s proportion of seniors is lower at 7.3%. As shown in Figure 2-4, seniors are somewhat evenly dispersed throughout the Tri-Valley area. One tract in central Livermore has a higher density of seniors than the rest of the Tri-Valley. South of downtown and in the older Sunset East neighborhood, the density is between 15 and 20%.
Figure 2‐4. LAVTA Area Senior Population by Tract

LAVTA Short Range Transit Plan FY2012-FY2021
Chapter 2
11
2.3.2 Youth
As shown in Figure 2-5, the youth population is distributed somewhat evenly throughout the three cities. Dublin has the lowest proportion of youth aged 5 to 19 with 17.2%. Pleasanton and Livermore have 23.6% and 21.3%, respectively. The tracts with the largest proportion of young residents (28.5% to 33% of the population) are also areas with the lowest population densities. As transit is most likely planned in areas of high density, the youth in these areas of low population density are unlikely to be served by transit. The youth within the LAVTA service area are served by school tripper and fixed routes that run throughout the communities to middle and high schools. Corridor routes also connect youth to popular destinations, such as the Stoneridge Mall, parks, and libraries. Figure 2‐5. LAVTA Area Youth Population by Tract

LAVTA Short Range Transit Plan FY2012-FY2021
Chapter 2
12
2.3.3 Zero-Vehicle Households
Zero-vehicle households are households that do no own or have access to a vehicle. People in zero-vehicle households tend to be dependent on transit as a primary mode of transportation. In the Tri-Valley Area, the percentage of zero-vehicle households is less than the Bay Area average. Most census tracts have between 0% and 7% of households without vehicles while in the Bay Area average is 10%. This reflects the general affluence of the Tri-Valley area. Figure 2-6 shows the density of households that are without access to a vehicle. There are two tracts in Livermore, two tracts in Pleasanton, and one tract in Dublin with the highest proportion of zero-vehicle households, in the 7-12 % range. These areas generally coincide with the areas of low income. Figure 2‐6. LAVTA Area Households with Zero Vehicles by Tract

LAVTA Short Range Transit Plan FY2012-FY2021
Chapter 2
13
2.4 EMPLOYMENT
2.4.1 Major Employers in the Tri-Valley
Table 2-1 lists the largest employers in the Tri-Valley area, indicating the number of employees by employer and the city where the job is located. Table 2‐1. Major Employers
Name City Number of Employees
Lawrence Livermore National Laboratory (LLNL) Livermore 8,750
Kaiser Permanente Pleasanton 4,255
Safeway Pleasanton 3,300
United States Government (including Federal Correctional Institution)
Dublin 2,100
Oracle Pleasanton 1,488
Valley Care Health System, Lifestyle Rx Fitness Center Livermore 1,300
Livermore Valley Joint Unified School District Livermore 1,120
Pleasanton Unified School District Pleasanton 1,114
Valley Care Medical Center Pleasanton 1,075
Comcast Livermore 1,000
Workday Incorporated Pleasanton 970
Sandia National Laboratory Livermore 910
FormFactor, Inc. Livermore 850
Carl Zeiss Meditec Dublin 830
SAP Dublin 730
Ross Dress for Less Incorporated Pleasanton 678
Wente Vineyards Livermore 676
Kaiser Permanente Regional Distribution Center Livermore 675
City of Livermore Livermore 656
State Fund ‐ Compensation Insurance Pleasanton 650
Macy's Pleasanton 616
Dublin Unified School District Dublin 580
E M C Corporation Pleasanton 566
DTI | Dental Technologies Inc. Dublin 550
Livermore Area Recreation and Park District Livermore 508
County of Alameda Dublin 480
Hendrick Automotive Pleasanton 478
Thoratec Corporation Pleasanton 470
City of Pleasanton Pleasanton 457
Roche Molecular Systems Inc. Pleasanton 441
Blackhawk Network Pleasanton 414
AT&T Pleasanton 404
Safeway Dublin 400
Topcon Positioning Systems Livermore 394
Activant Solutions Livermore 363
Clorox Service Company Pleasanton 3481
Nordstrom Pleasanton 304
Wal‐Mart Pleasanton 289
ADP Inc. Pleasanton 283
Johnson Controls, Inc. Livermore 279
1 The number of employees is anticipated to increase by 600 when staff is relocated from the Oakland office in September 2012.

LAVTA Short Range Transit Plan FY2012-FY2021
Chapter 2
14
Name City Number of Employees
J C Penny Co Pleasanton 265
WalMart Stores Livermore 265
Pro Business Pleasanton 262
Nellcor Puritan Bennett Pleasanton 256
Costco Wholesale Livermore 245
Clubsport of Pleasanton Pleasanton 242
Veeva Systems Pleasanton 241
Cisco Systems Incorporated Pleasanton 221
The Cheesecake Factory Pleasanton 218
City of Dublin Dublin 217
Patelco Credit Union Pleasanton 216
Shaklee Corporation Pleasanton 214
Prestige Protection Pleasanton 212
Applied Biosystems/Life Technologies Pleasanton 210
Pleasanton Nursing & Rehabilitation Center Pleasanton 205
Franklin Templeton Investments Dublin 200
The data supports that Pleasanton is a job-rich community, with more jobs than residents. Most of those jobs are concentrated around the intersection of Interstates 580 and 680, close to the Dublin BART station and in the Hacienda Business Park. In this area, there are between 13,000 and 20,000 jobs per square mile (see Figure 2-7). High job densities in Livermore include downtown and at Lawrence Livermore National Laboratory, the largest employer in the Tri-Valley. Employment data around the LAVTA service area is mapped in the figures and includes a portion of San Ramon, north of Dublin, where there is a concentration of jobs along I-680.

LAVTA Short Range Transit Plan FY2012-FY2021
Chapter 2
15
Figure 2‐7. LAVTA Service Area Employment Density2
2.4.2. Commute Patterns Comparing maps of where residents work and where workers live in the Tri-Valley area, commute patterns are determined. Large concentrations of worksites between 2,500 and 4,000 jobs per square mile within each city provide the ability to live and work within the same community. The highest concentrations of Tri-Valley employees also reside in Dublin, Pleasanton, and Livermore. Some concentrations of employees live further east in Tracy and Manteca. Concentrations of jobs also exist in major local employment centers like San Francisco and Oakland. Figure 2-8 shows that Tri-Valley residents are likely to commute all over the Bay Area. Figure 2-9 shows that people from all over the Bay Area are also commute to the jobs in the Tri-Valley area. 2 A portion of San Ramon is included to show the nearby concentrations of employment just outside of the core LAVTA service area.

LAVTA Short Range Transit Plan FY2012-FY2021
Chapter 2
16
Figure 2‐8. Employment Locations of LAVTA Service Area Residents3
Figure 2‐9. Residence Locations of LAVTA Service Area Workers4
3,4 A portion of San Ramon is included to show the nearby concentration of employment just outside of the core service area.

LAVTA Short Range Transit Plan FY2012-FY2021
17
Existing Transit Services
3.1 OVERVIEW
The current fixed route service levels reflect a service level still recovering from the Great Recession, but benefiting from the implementation of the Rapid BRT line in 2011 and recent improvements in the economy. A high level of service hours is allocated to the east-west corridor that connects the three cities in the LAVTA service area and the San Francisco BART network. The LAVTA service area comprises the three suburban municipalities of Dublin, Pleasanton, and Livermore and some unincorporated areas within Alameda County. With a few exceptions, most fixed routes and demand response services start and end within the LAVTA service area. The agency contracts out fixed route operations and maintenance to MV Transportation Inc, but owns the facilities and bus fleets. As of fall 2012, the peak vehicle requirement was 46 buses for the fixed route service. Considerable interlining is applied whenever feasible, most notably in the afternoon when vehicle demand is higher due to school trippers and commute hour services. LAVTA provides ADA-mandated paratransit service for individuals who have a certified disability or heath-related condition that prevents them from using regular fixed-routes. The operation of the Dial-A-Ride paratransit service is contracted to ALC. The peak vehicle requirement for paratransit service is approximately 12 vehicles. LAVTA does not own the fleet currently being used for its paratransit operations. 3.2 FIXED ROUTE SYSTEM
Under its Wheels brand, LAVTA operates 16 mainline routes and 15 school tripper routes. Local routes are generally numbered by a single digit in the Dublin/Pleasanton area and in the teen digits in the Livermore area. Intermunicipal routes generally are assigned even numbers, such as 10, 20, and 30. Routes focused to serve schools, called “school trippers”, are generally assigned three-digit route numbers. Table 3-1 provides a summary of the Wheels fixed routes and the principal areas they serve. Ridership is heavily focused on a few core routes with relatively robust levels of service. The remaining routes are primarily coverage-based community routes or routes that provide feeder service into other modes of transit. Route 10 experiences the highest level of ridership and carried approximately 35% of the total Wheels ridership in FY2012.
Chapter 3

LAVTA Short Range Transit Plan FY2012-FY2021
Chapter 3
18
Routes 12, 15, and 30 also experience high ridership and together account for 35% of the sytem’s ridership. Table 3‐1. Wheels Fixed Routes as of July 2012
1 East Dublin 16 Big Trees Park2 Dublin Ranch 201 East Dublin3 West Dublin 202 East Dublin8 Hopyard 203 West Dublin9 Hacienda 601 Ruby Hill10 Intermunicipal 602 Del Prado Park11 Northeast Livermore 603 Muirwood Park12 Intermunicipal 604 Fairlands14 Central Livermore 605 Fairlands15 Springtown 606 Vintage Hills18 Granada 607 Laguna Oaks20 Intermunicipal 608 Amaral Park30 Intermunicipal (Rapid) 609 Del Prado Park53 Stoneridge 610 Fairlands54 Hacienda 611 Vintage Hills70 Walnut Creek
Mainline Routes School Focused Routes
One of the intermunicipal routes, route 30, is operated and marketed as the Rapid, utilizing branded vehicles entirely separate from the general Wheels brand and color scheme. The Rapid incorporates some basic “bus rapid transit light” applications such as skip-stop operation, enhanced bus stops, low floor buses, high frequencies, next bus arrival, and traffic signal priority.
3.2.1 Service Span and Frequency
Routes are generally designed to be peak only or all day services. Peak only routes targeting to serve commuters are generally scheduled to meet other modes of transit, such as ACE or BART. These routes are either picking up residents and connecting them to the regional transit network to get them to work outside the Tri-Valley area or picking up commuters coming from outside the area and delivering them to work. School focused routes can also be considered peak only since they are scheduled to meet school bell times in the morning and afternoon. Peak Only Routes
Routes serving ACE
Routes 53 and 54 meet ACE trains at the Pleasanton ACE station, from 6 am to 9 am in the morning and from 4 pm to 5 pm in the afternoon. These routes operate on a 60 minute frequency.

LAVTA Short Range Transit Plan FY2012-FY2021
Chapter 3
19
Routes serving BART
Many routes are designed to serve the Dublin/Pleasanton BART station. Route 9 shuttles commuters between the Dublin/Pleasanton BART station and the Hacienda Business Park on a 15 minutes frequency from 7 am to 9 am and from 4 pm to 6 pm. Route 2 also connects residential areas in Dublin, including high density housing on Central Parkway and suburban developments in Dublin Ranch, to the BART station on a 45 minute frequency. Route 3 connects to two BART stations, West Dublin/Pleasanton and Dublin/Pleasanton, to community services and schools in Dublin and a business park in Pleasanton. Running from 6 am to 9 am and from 4 pm to 9 pm on a 60 minute frequency, this route is designed for commuters. Route 20 is an express service from the downtown Livermore Transit Center to the BART station and runs from 6 am to 10 am in the morning and from 4 pm to 7 pm in the afternoon with a 45 minute frequency. Route 70 is an express service that travels into Contra Costa. This route serves four BART stations, Dublin/Pleasanton, West Dublin/Pleasanton, Pleasant Hill, and Walnut Creek. Route 70 operates from 6 am to 9 am and from 4 pm to 6 pm on a 30 minute frequency.
Routes serving the Transit Center
The downtown Transit Center is adjacent to the Livermore ACE station and acts as an intermodal connection for Route 18. Route 18 connects many residential neighborhoods, schools, and community services to the Transit Center from 7 am to 9 am and 2 pm to 7 pm on a 45 minute frequency.
Routes Focused on Schools
School focused routes meet bell times in the morning and the afternoon. These routes are generally less than an hour long and only run one or two trips in each peak period. All Day Routes
Routes running the span of the day have different characteristics depending on the markets they serve. All day local routes have frequencies ranging between 30 to 60 minutes in the peak periods and 30 to 120 minutes in the midday. They generally span continuously from 6 am to 9 pm. One exception is the Route 15, which runs from 5 am to midnight. This route is designed to link the Springtown community with downtown Livermore with stops at Target, Wal-Mart, and Kaiser along the way. This route is successful as a quick trip between shopping centers and the downtown area as well as a link between a large residential area and the Transit Center.

LAVTA Short Range Transit Plan FY2012-FY2021
Chapter 3
20
Intermunicipal routes that run all day have frequencies ranging between 10 to 60 minutes. The Rapid has the highest frequencies with 10 minutes in the peak period and 15 minutes the rest of the day. The Rapid runs from 5 am to 8 pm. The Route 10 is the most successful route, running 30 minute service from 5 am to 8 pm, and then 40 minute service from 8 pm to 2 am. This route is the backbone of the community routes, making connections with the Transit Center, the LLNL and Sandia, schools, medical facilities, residential neighborhoods, three downtown areas, the Stoneridge Mall, two BART stations, employment parks, and all stops in between. Similarly, the Route 12 also provides many of the same functions as the 10, but along a northern alignment. Route 12 runs 30 minute service in the afternoon peak period and 60 minutes the rest of the day. From 6 am to 11 pm, Route 12 makes connections with the Transit Center, Park and Rides, schools and Las Positas Community College, libraries, shopping centers, housing developments, and the Dublin/Pleasanton BART station. Table 3-2 summarizes the weekday hours of operation by route. Route frequencies are shown inside the bars.
3.2.2 Weekend and Holiday Service
The 10 line is the core service on weekends, operating both Saturdays and Sundays during approximately the same time span as on weekdays. Frequencies vary from 20 to 40 minutes. Saturdays see a relatively complementary local/feeder service, with routes 1, 3, 8, 12, and 15 operating hourly throughout most of the day. On Sundays, service is limited to routes 1, 10 and 15 only. Holidays are usually defined as those recognized on the federal calendar. On most major holidays, a Sunday service is operated. On other holidays, an enhanced Saturday schedule is operated. On Thanksgiving Day and Christmas Day, a special, limited service is provided, with only the 10 and 15 lines running, both running hourly. With weekday, weekend, and holiday service, Wheels operates 365 days a year.

LA
VTA
Sh
ort
Ran
ge T
ran
sit
Pla
n F
Y2
01
2-F
Y2
02
1
LA
VTA
Sh
ort
Ran
ge T
ran
sit
Pla
n F
Y2
01
2-F
Y2
02
1
C
hapt
er 3
21
Table 3‐2. W
eekday Block

LAVTA Short Range Transit Plan FY2012-FY2021
Chapter 3
22
3.3 PARATRANSIT SERVICE
LAVTA provides a complementary door to door paratransit service for those unable to utilize the fixed route system as mandated by the 1990 Americans with Disabilities Act (ADA). The ADA requires a minimum provision of on demand curb to curb paratransit services to any origin and destination within 0.75 miles on either side of a fixed route bus, during the times of fixed route service. The ADA also requires riders must have an “ADA qualifying disability” that would keep them from using the fixed route bus. LAVTA provides a more user friendly, premium paratransit service called Wheels “Dial-A-Ride” (DAR). LAVTA provides DAR to eligible patrons in the entire LAVTA service area, regardless of whether a fixed route bus is within 0.75 miles. LAVTA provides door to door service whereby Wheels DAR bus drivers will assist passengers from the bus to the door of their destination if assistance is requested. In addition, LAVTA does not limit the length of trips, only enforces that it is within the service area. Eligibility for LAVTA’s DAR program requires certification under ADA requirements. Eligibility is determined based on a paper application with a licensed medical care professional’s verification. Passengers must call ahead to make reservations, which can be made one to seven days in advance. There are no limits on the number of rides a person may take. Fares are currently $3.50 per ride. ADA registered passengers may also ride the Wheels fixed route network for a $1.00. The Alameda County Transportation Commission (ACTC) sponsors a scholarship program funded by Measure B for low income riders. The program will provide up to 20 paratransit tickets per fiscal year to an eligible low income rider. LAVTA also participates in a para-taxi program which provides same day service for its ADA eligible riders. Riders submit their taxi receipts to LAVTA and are reimbursed 85% of the cost, up to $20 per trip and up to $200 per month.
3.3.1 Pleasanton Paratransit Service
LAVTA provides an ADA mandated DAR service for the entire service area. However, LAVTA has a cooperative service relationship with Pleasanton Paratransit in which Pleasanton Paratransit provides door to door service for their residents. Pleasanton Paratransit provides local trips for eligible residents that start and begin in Pleasanton. The hours of operation are general business hours on weekdays and Saturdays. LAVTA covers the overflow from Pleasanton Paratransit’s operations as well as provides the services when Pleasanton Paratransit is not operating.

LAVTA Short Range Transit Plan FY2012-FY2021
Chapter 3
23
3.3.2 Dublin and Livermore Service
LAVTA provides paratransit in the rest of the Tri-Valley, as well as in Pleasanton when its paratransit system does not operate. LAVTA serves complementary service to Dublin and Livermore and some areas of unincorporated Alameda County. 3.4 CONNECTING SERVICES
3.4.1 Other Operators within the LAVTA service area
Altamont Commuter Express
The Altamont Commuter Express (ACE) operates commuter rail service between Stockton and San José with three stations en route in the LAVTA service area – Vasco Road, Downtown Livermore, and Pleasanton. Four weekday trains travel in the direction of San José in the morning, and then return in the direction of Stockton in the afternoon. LAVTA receives funding from ACE to provide routes that meet the ACE trains at the Pleasanton ACE station. In exchange for the funding, LAVTA requires no fare payment from ACE riders to and from the ACE station. Route 53 serves the Stoneridge Mall area and the West Dublin/Pleasanton BART station. Route 54 serves the Bernal and Hacienda business parks and the Dublin/Pleasanton BART station. While LAVTA has routes that also serve the Vasco Road and Downtown Livermore ACE stations, these routes are not underwritten by ACE and are not tailored to meet the ACE train schedules. Bay Area Rapid Transit
There are two Bay Area Rapid Transit (BART) stations within the LAVTA service area – Dublin/Pleasanton, the eastern terminal for the Blue Line, and the West Dublin/Pleasanton stations. BART trains arrive on a 15 minute pulse. Other Bus Operators
Central Contra Costa Transit Authority (County Connection), AMTRAK, the Modesto Area Express, and the San Joaquin Regional Transit District (RTD) provide limited service between points in the Tri-Valley and these BART stations.
Central Contra Costa Transit Authority
County Connection has four services within the LAVTA service area. Three of these services connect San Ramon Transit Center to the Dublin/Pleasanton BART station. County Connection also connects riders from Mitchell Drive/Park in Walnut Creek to the ACE station in Pleasanton. Descriptions of the routes and the destinations they serve are below.
Route 35 – San Ramon Transit Center – Bollinger Canyon Road/Market Place – Bollinger Canyon/Main Branch Road – E. Branch

LAVTA Short Range Transit Plan FY2012-FY2021
Chapter 3
24
Parkway/Windemere Parkway – Bollinger Canyon Road/Watermill Road - Dublin/Pleasanton BART Station
Route 36 – San Ramon Transit Center – Bollinger Canyon Road/Talavera Drive – Firecrest Lane/Craydon Circle – Village Parkway/Elmwood Drive – Dublin/Pleasanton BART station
Route 92X - Mitchell Drive/Park (Walnut Creek) – Danville Park and Ride – Crow Canyon Road/Crow Canyon Place - Bishop Ranch 15 – San Ramon Transit Center – ATT – Chevron San Ramon - ACE Train Station
Route 97X – San Ramon Transit Center –Bishop Ranch 15 – Annabel Lane/End – Bishop Ranch 8 – Marriott – Sunset Drive/Bishop Drive – Chevron San Ramon – Bishop Ranch 1 - Dublin/Pleasanton BART Station
MAX express
The Modesto BART express connects riders from the Modesto Downtown Transportation Center to the Dublin/Pleasanton BART Station with one stop at Sisk Road, Modesto.
San Joaquin RTD Commuter
The San Joaquin RTD Commuter has three routes within the LAVTA service area. The commuter route 155 connects riders from Stockton/Manteca to Livermore at the LLNL and the Dublin/Pleasanton BART station. Route 152 connects riders from Stockton to Livermore at the LLNL. Route 155 connects riders from Mountain House to the Dublin/Pleasanton BART station. Descriptions of the routes and the destinations they serve are below.
Route 150- Stockton/Manteca – Lathrop – Tracy – Mountain House –LLNL – Dublin/Pleasanton BART Station
Route 152 – Stockton – Lathrop –LLNL
Route 155 – Mountain House – Dublin/Pleasanton BART Station
AMTRAK
AMTRAK provides a thruway bus that connects San Francisco to Stockton, supporting the AMTRAK San Joaquin line. The thruway bus has four stops within the LAVTA service area; one stop at the Dublin/Pleasanton BART station, one stop at the Pleasanton ACE Station, one stop at the Livermore Transit Center, and one stop at the Vasco Road ACE station in Livermore. Paratransit Services
Interagency Paratransit transfers with the East Bay Paratransit (a consortium between AC Transit and BART) and Links (County Connection) are at the Dublin/Pleasanton BART station.

LAVTA Short Range Transit Plan FY2012-FY2021
Chapter 3
25
3.4.2 Hubs and Transfer Points
Hubs
There are two primary hubs in the Wheels system, the Dublin/Pleasanton BART station and the Transit Center. The Dublin/Pleasanton BART station is located in the I-580 freeway median between Dublin and Pleasanton. The Transit Center is located at the northeastern area of downtown Livermore and is integrated with the downtown Livermore ACE station. The majority of Wheels fixed routes serve one or both of these hubs. Schedules are set up to coincide with the BART train arrivals and departures to the extent possible, banking departures to the pulse of the train departures; this pulse then flows downstream to the Transit Center where routes are banked in a similar way. This setup maximizes transfer opportunities for bus to bus, bus to train, and train to bus connections while minimizing transfer wait times. Transfer Points
There are several transfer points within the Wheels service area. Bus to rail transfers may be made at the West Dublin/Pleasanton BART station, the Pleasanton and Vasco Road ACE stations, and the Transit Center which is adjacent to the Livermore ACE station. s Bus to Bus transfers may be made at East & Vasco at the LLNL, the intersection of Neal & First in downtown Pleasanton, the Transit Center, and the Stoneridge Mall. Wheels routes are not specifically timed for transfers at these locations. 3.5 FARES
3.5.1 Wheels Fares Fixed Route Fares
Cash continues be the primary method of payment in the Wheels system. This can mainly be attributed to the socio-economic character of the ridership base. Regular fare is $2.00. Children, aged 5 and under, ride free. No special youth or student discounts are provided. The fare for persons with disabilities or aged 65 or older is $1.00, a 50% discount from the full fare cost. Table 3-3 summarizes the current Wheels fares. Tickets are sold at the agency’s customer service center at the Transit Center facility, at the Administration office, and at select area grocery retail stores. A 20% discount is available for tickets when they are bought in increments of 10. A regular monthly pass is available at $60 and a Senior/Disabled monthly pass is available at $18.

LAVTA Short Range Transit Plan FY2012-FY2021
Chapter 3
26
Paratransit Fare
The ticket fare for paratransit service is $3.50 and no discounts are available. Tickets can be pre-purchased either individually at $3.50 or in books of 10 at $35.00. Transfers are free on inbound (Wheels receiving) interagency paratransit trips. Table 3‐3. Wheels Fares as of July 2012
Recent Changes in Fares
The last fare change took place in 2009 when the regular fare was raised from $1.75 to $2.00 and most other fares raised proportionately. Policies which allowed senior passengers to ride free on weekdays between 9 am and 2 pm, ADA certified clients to ride free on all fixed route service, and all passengers to ride free on Route 50 between the Koll Center Park and Ride and the Dublin/Pleasanton BART station were rescinded as part of the fare change.
3.5.2 Employer Pass Program
The Hacienda Business Park participates in an employer commuter club program called the Hacienda Eco Pass Program to encourage transit use and to reduce congestion. The Hacienda Business Park administration pays an annualized cost per employee to Wheels to provide pass holders with free service. Employees and residents are eligible to use the Wheels system seven days a week, 365 days a year for free while employed or residing within the Park. Riders flash their pass to the driver when boarding a Wheels bus. The ECO Pass Program is actively managed by the Hacienda Business Park administration.
Cash FaresRegular $2.00Senior 65+ $1.00Disabled / Medicare Card $1.00Transfers Free
Tickets and Passes10-Ride Tickets $16.00Monthly Pass, Regular $60.00Monthly Pass, Sen/Disabled $18.00
Paratransit FaresCash $3.50Single-Ride Ticket $3.5010-Ride Tickets $35.00
Wheels Fares
LAVTA Short Range Transit Plan FY2012-FY2021
Chapter 3
27
3.5.3 Transfers
Fixed Route Transfers
Transfers are issued at no extra charge and are good for two hours following the first boarding payment. There are no restrictions on which route the transfer may be used on or on how many transfers can be made within the two-hour period. The transfers are traditional newspaper-print style slips with a letter code for the day. Upon issue, the bus operator tears off the slip at a time mark corresponding to the valid time window of the transfer. Inter-Operator Transfer Agreements
LAVTA has a reciprocal transfer agreement with the County Connection in which the two agencies accept each other’s transfer slips. It also participates in the East Bay Value Pass program, a joint monthly pass, which includes the County Connection, Western Contra Costa Transit Authority (WestCat), and Eastern Contra Costa Transit Authority (Tri-Delta Transit). For passengers exiting BART and boarding a Wheels bus, the transfer fare is $1.00 to ride the Wheels bus.
3.5.4 Clipper Card
The Metropolitan Transportation Commission (MTC), the region’s Metropolitan Planning Organization (MPO), is the lead agency on the region-wide transit fare card Clipper, the deployment of which LAVTA is in support of. All the large transit operators in the San Francisco Bay Area, including BART, have integrated and implemented Clipper as part of their fare payment system, with the approval and support of the MTC. However, the MTC has informed the remaining operators, including LAVTA, that the deployment of Clipper is on hold while it works on upgrading the system’s hardware backbone. Once the new version is ready, the remaining operators will be asked to adopt Clipper. After the implementation of Clipper on the Wheels system, is likely that LAVTA will continue to accept onboard cash payments. However, all other Wheels payment media, including tickets and monthly passes, may be discontinued. 3.6 FLEET
3.6.1 Revenue Vehicle Fleet and Types
The last major fleet-wide revamping of the LAVTA revenue vehicle fleet took place in 2003 when a total of 34 Gillig low-floor buses were acquired. These vehicles form the backbone of the Wheels system and are augmented by smaller subfleets. Seven 1996 New Flyer, the first low-floor buses in the agency’s fleet, remains in service. Nine Gillig Phantom coaches from 2000 and 2002 are equipped with high-back seats. These fleets have standard clean-burning diesel engines outfitted with particulate-matter traps.

LAVTA Short Range Transit Plan FY2012-FY2021
Chapter 3
28
The agency purchased its first diesel-electric hybrid bus in 2007 and has been buying this technology exclusively since 2009. That year, 2009, a fleet of 14 buses were acquired and specially branded with the Rapid theme used on Rapid route. The latest revenue vehicle acquisition took place in 2011 with four 29’ hybrid buses, two of which were branded for use on the Rapid. Table 3-4 shows a summary of the agency’s fleet as of fall 2012. Table 3‐4. Revenue Vehicle Fleet as of Fall 2012
Year Mfg Length Capacity # Vehicles
1996 New Flyer 40ft/12m 39+17 72000 Gillig 40ft/12m 43+28 52002 Gillig 40ft/12m 39+28 42002 Gillig 40ft/12m 39+21 42003 Gillig 40ft/12m 39+21 242003 Gillig 30ft/9m 21+21 102006 Ford 22ft/7m 13+1 92007 Gillig 30ft/9m 21+21 22008 Ford 22ft/7m 13+1 62009 Gillig 30ft/9m 21+21 22009 Gillig 40ft/12m 39+21 122011 Gillig 30ft/9m 21+21 4
Revenue Vehicle Fleet
All full-size coaches in the fleet feature 2 or 3 slot bike rack and two wheelchair positions. The 2003 Gillig 40-foot buses also have a designated area for strollers. LAVTA also has a subfleet of 15 Ford cutaway vans that were used as the agency’s paratransit fleet until 2011. Most of these vehicles are fixed-route ready, with such features as headsigns and bicycle racks, but are rarely utilized in revenue service. MV Transportation is contracted for fixed route operations, including the maintenance of the fleet. The paratransit contractor, ALC, operate their own fleets resulting in a cost savings to Wheels.
3.6.2 Subfleet Deployments
The overall capacity utilization, defined as a straight average percentage of available seat-miles, is relatively low in the Wheels system. However, due to the fact that certain route segments get busy during certain trips or certain times of the day on many routes, a 40-foot bus is the typical deployment in the system. Because this size of vehicle is quite accommodating with regard to capacity, this also enables more interlining flexibility and efficiency. For example, the Gillig Phantom model subfleet is deployed on blocks that contain trips on the express route 70.
LAVTA Short Range Transit Plan FY2012-FY2021
Chapter 3
29
School tripper routes almost always require the largest vehicle type available. The afternoon peak load on school focused routes requires overflow vehicles to cover the demand. The 30-foot buses are deployed on some local lines having loads that are small and/or evenly distributed, including routes 1, 2, 3, 14, and 18. As also indicated above, the 22-foot cutaway fleet is a leftover from the previous model of paratransit delivery and is not extensively used for the current fixed route service.
3.7 FACILITIES
The LAVTA maintenance, operations, and administration (MOA) facility on Rutan Court was built in 1991 and is located in a light industrial/office park area near the Livermore general aviation airfield. The facility is well situated within the overall Wheels service area and is near the I-580/Isabel Avenue interchange as well as Stanley Boulevard. A second property on Atlantis Drive, also near the airfield, provides overflow vehicle parking but has not completed the construction of any on-site facilities. LAVTA owns all fixed facilities and makes them available to MV Transportation for use in the operation and maintenance of the Wheels service.
3.7.1 Administration
All administrative services of the agency are housed within the Rutan MOA facility, including those for executive, planning, finance, and administrative functions. This location also provides office space for the contractor’s management and operations functions, such as those for site manager offices, dispatch work stations, and driver break room facilities. Board meetings and other public meetings are held in the Administration building. The Front Desk sells tickets and assists customers with applying for regional transit passes or Clipper cards.
3.7.2 Maintenance and Fueling
The Rutan MOA facility contains a workshop with a total of six indoor vehicle bays as follows:
1 steam bay
1 lubricant bay
2 rack lift bays
2 general bays A canopied outdoor area provides two lanes for fueling incoming buses that have returned to the yard from their runs. At that location, the vehicle fareboxes are emptied

LAVTA Short Range Transit Plan FY2012-FY2021
Chapter 3
30
and the bus interiors are cleaned. Adjacent to the fuel island is an automated bus washer for daily bus washes.
3.7.3 Vehicle Storage and Staging
Having a theoretical maximum capacity of 70 vehicles; the Rutan MOA facility is insufficient for the current daily staging and operation of the entire LAVTA revenue and support fleet. Therefore, some vehicles are stored at and staged from the Atlantis location. This requires the shuttling of equipment and drivers as the Atlantis facility does not currently contain any on-site facilities. As of the fall 2012 schedule, only the afternoon peak pull on school days requires a secondary pull from the Atlantis location. Staging at all other times can be handled from the Rutan MOA facility.
3.7.4 Park and Ride Lots
There are five park and ride (PnR) locations within the Wheels service area that provide all day parking for the purposes of carpooling or taking transit. The downtown Livermore parking structure is the largest facility and is located adjacent to the Transit Center. It is a dual-purpose facility in the sense that it also serves as parking for downtown shoppers or other general trips that terminate in the vicinity of the garage. The California Department of Transportation (CalTrans) operates two surface lots, one on Portola Avenue in Livermore, which is lightly used, and one on Johnson Drive in Pleasanton, which is highly used. In addition, the BART District owns and maintains a PnR on Airway Boulevard that is little used. Finally, there is a PnR designated portion of the parking lot at the Dublin Center office complex off Tassajara Road. All these facilities have lighting and passenger shelter areas. Table 3-6 summarizes these locations and their respective car parking capacities. Table 3‐6. Description of Park‐n‐Ride Lots in the LAVTA service area
Area Park-n-Ride LotsLocation # SpacesTransit Center / Livermore Downtown 500Dublin Center / Tassajara & Dublin Blvd 200Bart PnR / Airway & Rutan 150CalTrans / Portola & P 100CalTrans / Johnson & Stoneridge Dr 100
Although the LAVTA service is not focused on serving PnR, most of these PnRs are served directly or are in the vicinity of Wheels routes. But, most of these PnRs are currently used by carpoolers and not Wheels riders.
3.7.5 Transit Stops and Stations Transit Stops
There are close to a thousand active bus stops in the LAVTA service area. Of these, approximately half are located on mainline routes while the other half are located in

LAVTA Short Range Transit Plan FY2012-FY2021
Chapter 3
31
areas only served by school tripper routes. The signage and amenities at each individual stop vary widely depending on the service levels and patronage and on right-of-way constraints. At the lowest end of the scale, school tripper-only stops are simply a red-and-white stencil marking on the curb, while highly-patronized stops in backbone service corridors typically feature seating, sheltering, and full signage including route numbers, schedules, and vicinity maps. Approximately 50 bus stops feature digital displays showing real-time arrival information generated by the agency’s automatic vehicle locator (AVL) system. En-route bus stops located within public right-of-way are subject to the features and improvements completed by the municipality that these are located in. Not all bus stops have the same level of improvement. For example, bus stops are not equally well-lit at night or wheelchair accessible, and may have other site-specific or contextual deficiencies. Similarly, a stop may be safe in its immediate spot, but a crosswalk may not be available nearby. The agency provides cleaning and maintenance of its owned bus stop facilities. The remaining locations are the responsibility of their respective owner, typically an apartment complex or a business park. Maintenance for shelters, benches, and signs at the agency-owned locations is performed by LAVTA’s operations contractor. Periodic cleaning, such as emptying trash receptacles and power washing, is performed by a separate contractor. LAVTA has been conducting an inventory of its bus stops approximately every five years. The last such effort was completed in 2010 and included updating an amenities and attributes database as well as digital imagery of each stop. An assessment was also done for each location with regard to accessibility and condition of all stops. School tripper-only stop locations were included for the first time in the 2010 inventory. GPS-satellite based surveys to geocode the bus stop locations are inputted into the AVL system. This information is used for passenger counts and to track on time performance. Transit Center
The only facility owned by LAVTA classified as a “station” is the Transit Center in downtown Livermore. The Transit Center features eleven bus bays, restroom facilities, bike racks, and the agency’s customer services which sells tickets on site. BART stations
The Dublin/Pleasanton BART station, owned and operated by the BART District, features a total of seventeen bus bays and enables bus-exclusive through operation via a tunnel under the freeway. One elevator and three escalators link the fare gate area on the ground level with the train platform above. Prior to the beginning of recent housing

LAVTA Short Range Transit Plan FY2012-FY2021
Chapter 3
32
construction activity, a mix of structured and open parking spaces provided close to 3,000 parking spaces at this station exclusively for use by train patrons. However, this number will be gradually reduced and confined to the structured parking area as the immediate vicinity continues to develop. The new West Dublin/Pleasanton BART station, opened in February 2011, provides a total of six bus dwelling locations and approximately 1,150 parking spaces. Bus operation at this station is constrained by the lack of vehicle through access between the Dublin and Pleasanton sides of the station. One elevator and two escalators link the fare gate area on the mezzanine level with the train platform below.
3.7.6 Right of Way, Track or Guideway
LAVTA does not operate rail or fixed guideway service, nor does it operate in exclusive rights-of-way. Smaller priority treatments, such as intersection signal queue-jumps, were implemented at two locations as part of the Rapid program in 2011. The locations of the queue jumps are westbound on Stanley Boulevard at Murietta Avenue in Livermore and eastbound on Dublin Boulevard at Dougherty Road in Dublin.
3.7.7 Bicycle Facilities
Bicycles are accommodated on Wheels buses when available capacity and space permit. For this purpose, all vehicles in the fleet are equipped with a 2- or 3-slot bicycle rack that is mounted on the front outside of the bus. Stationary bicycle storage is limited; LAVTA does provide bike racks at a few of its Rapid branded bus stops and at the Transit Center. Wheels passengers may also use the bike lockers provided at BART and ACE stations.

LAVTA Short Range Transit Plan FY2012-FY2021
Livermore Amador Valley Transit Authority
33
Goals, Objectives, and Standards
4.1 BACKGROUND
In 2009, the Board of Directors for the LAVTA adopted a new LAVTA Strategic Plan. This Plan established an overall mission, vision, and values for Wheels, and developed a series of goals and strategies to guide the future development of Wheels’ services, programs, and organization. The Plan provides a framework through which Wheels’ administrative, operational, and communication processes can be reexamined. At the core of ensuring the Strategic Plan continues to be a “living” document, is the relationship between the Strategic Plan, Budget, and Annual Work Plans, using a top down approach moving from large general goals at the top to more specific actions at the bottom. This relationship is part of a larger ongoing and iterative planning cycle, which will result in future updates of the Strategic Plan based on agency performance and use of the Plan. 4.2 VISION
The Strategic Plan provides the Mission and Vision of the agency as well as a set of general goals and specific objectives. The Mission stated:
“The Mission of the Livermore Amador Valley Transit Authority (Wheels) is to provide equal access to a variety of safe, customer oriented, reliable, and affordable public transportation choices, increasing the mobility and improving the quality of life of those who live or work in and visit the Tri-Valley area.”
The Vision stated:
“An essential link in the regional transportation system, Wheels strives to be a well-recognized, highly respected, integrated public agency utilizing appropriate tools and technologies to provide cost-effective, exceptional transit service in response to the needs and priorities of those who live or work in or visit the Tri-Valley area.”
Chapter 4

LAVTA Short Range Transit Plan FY2012-FY2021
Chapter 4
34
4.3 GOALS AND STANDARDS
The LAVTA Strategic Plan outlines all goals that apply to the agency functions, ranging from Administration to Finance to Planning to Maintenance. For the purposes of this document, goals relevant to the planning and delivery of service, as well as those that pertain directly to the metrics required to monitor the health of the service from the 2009 Strategic Plan are used. The Strategic Plan Goals and Strategies are listed in the next sections.
4.3.1 Service Development
Service-relevant objectives revolve around the parameters of service, such as time span and frequency, as well as standards for performance and safety. Goal
Provide effective transit services that increase the accessibility to community, services, and jobs.
Strategies
A1) Provide routes and services to meet current and future demand for timely and reliable transit service subject to fiscal restraints
A2) Increase accessibility to community, services and jobs
A3) Optimize existing routes and services to increase productivity
A4) Improve connectivity with regional transit systems
A5) Explore innovative fare policies and pricing options
A6) Provide routes and services to promote mode shift from personal car to public transit
4.3.2 Marketing and Public Awareness
The objectives here lie in the areas of customer information and feedback.
Goal
Marketing and Public Awareness: Improve visibility, image, and awareness of Wheels
Strategies
B1) Continue to build the Wheels brand image, identity and value for customers
B2) Improve the public image and awareness of Wheels
B3) Increase two-way communication between Wheels and its customers

LAVTA Short Range Transit Plan FY2012-FY2021
Chapter 4
35
B4) Increase ridership to fully attain community benefits achieved through optimum utilization of our transit system
B5) Promote Wheels to new businesses and residents
4.3.3 Community and Economic Development
The main objective is this area is to improve communication with local jurisdictions regarding land-use and site plans and to develop partnerships with other agencies to meet common goals. Goal
Utilize transit as an essential community and economic development tool for local communities
Strategies
C1) Integrate transit into local economic development plans
C2) Advocate for increased transit friendly and transit oriented developments in the Cities’ planning departments and in the site development processes
C3) Partner with employers in the use of transit to meet transportation demand management requirements
4.3.4 Regional Leadership
The objectives under this goal focus on establishing partnerships with other agencies and jurisdictions to advocate for transit.
Goal
Strengthen Wheels’ leadership position within the region to enhance opportunities for development and maintenance of quality transit service
Strategies
D1) Advocate for local, regional, state, and federal policies that support Wheels’ goals
D2) Support Staff involvement in leadership roles representing the agency at regional, state, and federal forums
D3) Promote transit priority and improvements initiatives with city and county governments
D4) Develop regional initiatives that support riders mobility through more seamless passenger use

LAVTA Short Range Transit Plan FY2012-FY2021
Chapter 4
36
4.3.4 Organizational Effectiveness
The objectives and standards under this goal relate primarily to administrative and human resources aspects of the agency. Goals
Strengthen organization wide capabilities and resources to improve overall performance and customer satisfaction
Strategies
E1) Promote system wide continuous quality improvement initiatives
E2) Continue to expand the partnership with contract staff to strengthen teamwork and morale and enhance the quality of service
E3) Establish performance based metrics with action plans for improvement
E4) Strengthen human resources through staff development and a focus on employee quality of life and strengthen technical resources throughout the organization
E5) Enhance and improve organizational structures, processes and procedures to increase system effectiveness
E6) Develop policies that hold Board and Staff accountable, providing clear direction through sound policy making decisions
4.3.5 Financial Management
The objectives and standards under this goal relate primarily to financial management. Goal
Maintain fiscal responsibility to ensure financial sustainability of existing and new transit services
Strategies
F1) Develop budget in accordance with the Strategic Plan, integrating fiscal review processes into all decisions
F2) explore and develop revenue generating opportunities
F3) Maintain fiscally responsible long range capital and operating plans 4.4 PERFORMANCE STANDARDS
Elements from the 2009 SRTP were updated and incorporated with the FY11 Strategic Goals to develop LAVTA’s performance standards. The performance standards for each strategic goal are shown in Table 4-1.

LAVTA Short Range Transit Plan FY2012-FY2021
Chapter 4
37
Table 4‐1. Objectives and Standards for the 2009 Strategic Plan
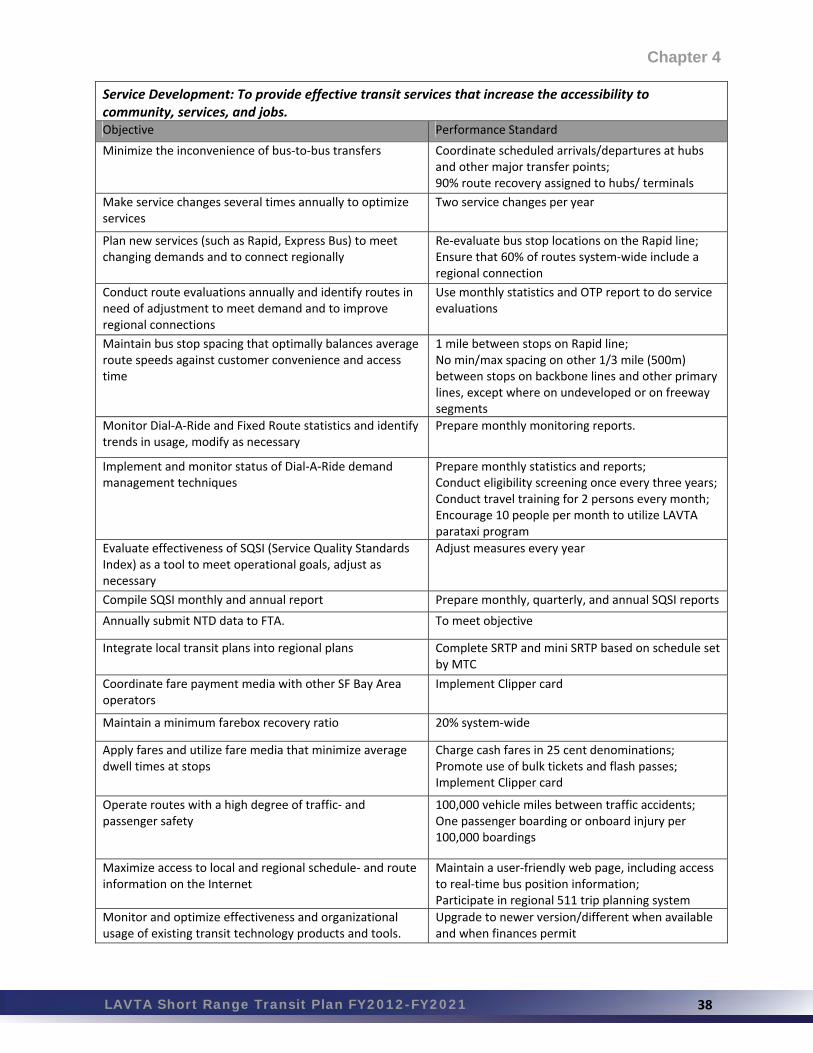
Service Development: To provide effective transit services that increase the accessibility to community, services, and jobs. Objective Performance Standard
Provide service hours that are reasonably distributed relative to the population in each of the agency's three member municipalities
Stay within +/‐ 15% joint powers agreement formula
Provide service with a time span that is sufficient to effectively serve the primary target markets for each route
0400 ‐0100 h/day on backbone lines(s); 0500‐0000 on other primary lines; 0600‐0900 and 1600‐1900 on neighborhood, local feeder, and regional express lines; and one daily round trip for school tripper lines
Provide trip frequencies that effectively serve the primary target markets for each route
15/30 min on backbone lines, 10 min peaks if demand warrants; 30/60 min on other primary lines; 60/0 min on neighborhood, local feeder, and regional express lines; Single daily round trip for school tripper lines (peak/base)
Create and maintain services/routes that are productive, based on unlinked passenger boardings per vehicle revenue hour
20/10 pax/h on backbone lines, other primary lines and regional express lines; 8/5 pax/h neighborhood and local feeder lines; and 40/‐‐ pax/h on school tripper lines (peak/base)
Provide fixed route service to all middle and high school students who attend the main bell at a public school, subject to the agency's global route performance standards
20/10 pax/h on backbone lines, other primary lines and regional express lines; 8/5 pax/h neighborhood and local feeder lines; and 40/‐‐ pax/h on school tripper lines (peak/base)
Provide service coverage to large residential clusters and major employment centers in the Wheels service area
Provide fixed route service within a quarter‐mile radius of medium‐ to high density residential areas and to 80% of 100+ employee locations
Provide basic fixed route service to areas that might not meet transit‐oriented land‐use practices but that house and/or employ a significant socio‐economically disadvantaged population
Conduct a service evaluation prior to every major service change
Coordinate, to maximum feasible extent, services and schedules to optimize transfer opportunities with other transit systems
Pulse bus departures at the Dublin/Pleasanton Bart station with train arrivals, departures, or both
Provide continuous fixed route service to all new and existing developments or re‐developments that meet best transit‐oriented land‐use practices
Meet standard MTC "4d": Developments/redevelopments that incorporate density, diversity (mixed land‐uses), design (safe, pleasing pedestrian network), and distance (close proximity to transit)
Operate routes on their scheduled times 90% as defined by departing a timepoint zero minutes early and zero to five minutes late
Minimize service redundancies Stagger schedules and/or disperse routes geographically
Minimize fleet deadhead hours Use interlining and other supportive scheduling approaches
Minimize fleet peak requirement Use interlining and other supportive scheduling approaches
LAVTA Short Range Transit Plan FY2012-FY2021
Chapter 4
38
Service Development: To provide effective transit services that increase the accessibility to community, services, and jobs. Objective Performance Standard
Minimize the inconvenience of bus‐to‐bus transfers Coordinate scheduled arrivals/departures at hubs and other major transfer points; 90% route recovery assigned to hubs/ terminals
Make service changes several times annually to optimize services
Two service changes per year
Plan new services (such as Rapid, Express Bus) to meet changing demands and to connect regionally
Re‐evaluate bus stop locations on the Rapid line; Ensure that 60% of routes system‐wide include a regional connection
Conduct route evaluations annually and identify routes in need of adjustment to meet demand and to improve regional connections
Use monthly statistics and OTP report to do service evaluations
Maintain bus stop spacing that optimally balances average route speeds against customer convenience and access time
1 mile between stops on Rapid line; No min/max spacing on other 1/3 mile (500m) between stops on backbone lines and other primary lines, except where on undeveloped or on freeway segments
Monitor Dial‐A‐Ride and Fixed Route statistics and identify trends in usage, modify as necessary
Prepare monthly monitoring reports.
Implement and monitor status of Dial‐A‐Ride demand management techniques
Prepare monthly statistics and reports; Conduct eligibility screening once every three years; Conduct travel training for 2 persons every month; Encourage 10 people per month to utilize LAVTA parataxi program
Evaluate effectiveness of SQSI (Service Quality Standards Index) as a tool to meet operational goals, adjust as necessary
Adjust measures every year
Compile SQSI monthly and annual report Prepare monthly, quarterly, and annual SQSI reports
Annually submit NTD data to FTA. To meet objective
Integrate local transit plans into regional plans Complete SRTP and mini SRTP based on schedule set by MTC
Coordinate fare payment media with other SF Bay Area operators
Implement Clipper card
Maintain a minimum farebox recovery ratio 20% system‐wide
Apply fares and utilize fare media that minimize average dwell times at stops
Charge cash fares in 25 cent denominations; Promote use of bulk tickets and flash passes; Implement Clipper card
Operate routes with a high degree of traffic‐ and passenger safety
100,000 vehicle miles between traffic accidents; One passenger boarding or onboard injury per 100,000 boardings
Maximize access to local and regional schedule‐ and route information on the Internet
Maintain a user‐friendly web page, including access to real‐time bus position information; Participate in regional 511 trip planning system
Monitor and optimize effectiveness and organizational usage of existing transit technology products and tools.
Upgrade to newer version/different when available and when finances permit

LAVTA Short Range Transit Plan FY2012-FY2021
Chapter 4
39
Service Development: To provide effective transit services that increase the accessibility to community, services, and jobs. Objective Performance Standard
Evaluate new transit technology products and recommend those most appropriate for LAVTA to pursue.
Attend transit technology/vendors conferences to identify newest technology
Operate routes with vehicles that are quiet and offer a comfortable environment for all passengers
Use newest transit technology for quieter vehicles and comfortable amenities as finances permit
Offer a safe and secure passenger environment Install cameras in the buses and at transit center; seek funding for safety improvements at transit center and at transit stops
Receive and respond to customer suggestions and complaints, including research and analysis of operational challenges
Take action on customers’ comments within 3 days; Resolve customers' complaint within 1 month; Resolve action on customers' suggestions within 12 months
Complete full Short Range Transit Plan (SRTP) and get Board adoption every 4 years
To meet objective
Complete annual Mini SRTP in years when no full SRTP is required, and get Board adoption
To meet objective
Ensure all capital projects are accurately portrayed in terms of scope, schedule and budget.
Perform 2 levels of QA/QC
Develop and implement capital projects that enhance LAVTA’s operations, marketing, and maintenance capacities.
Prepare a capital improvement plan assessing LAVTA needs
Maximize LAVTA resources by identifying, applying for, and obtaining an optimal level of regional, state, and federal funding
Attend regional funding meeting to identify funding opportunities
Marketing and Public Awareness: Improve visibility, image, and awareness of Wheels Objective Performance Standard
Maintain high levels of customer satisfaction ratings 75% of Wheels riders rating the service as good to excellent on satisfaction surveys
Use directional signage to increase visibility of major boarding locations
Install wayfinding signage at hubs and transfer points and vicinity maps at major transit stops
Continue to make the electronic customer comment card available on the Wheels website
Maintain customer complaint system; Respond to all requests in a timely manner
Utilize electronic communications to enhance rider experience
Integrate Clipper card; create smart phone applications for Wheels schedule and information
Provide presentations before civic organizations and human service groups to build support for LAVTA
Attend regular meeting with civic organizations and human services groups, including Hispanic Business Council, Livermore Chamber of Commerce, Tri‐Valley Senior Centers, Tri Valley Senior Support group, Tri‐Valley Cities Economic Departments, Local Businesses and Apartment complexes that join LAVTA new outreach program, Livermore Needs Committee, Tri‐Valley Spare the Air and School Districts; Provide orientation to teachers to promote the Class Pass Program for school field trips
LAVTA Short Range Transit Plan FY2012-FY2021
Chapter 4
40
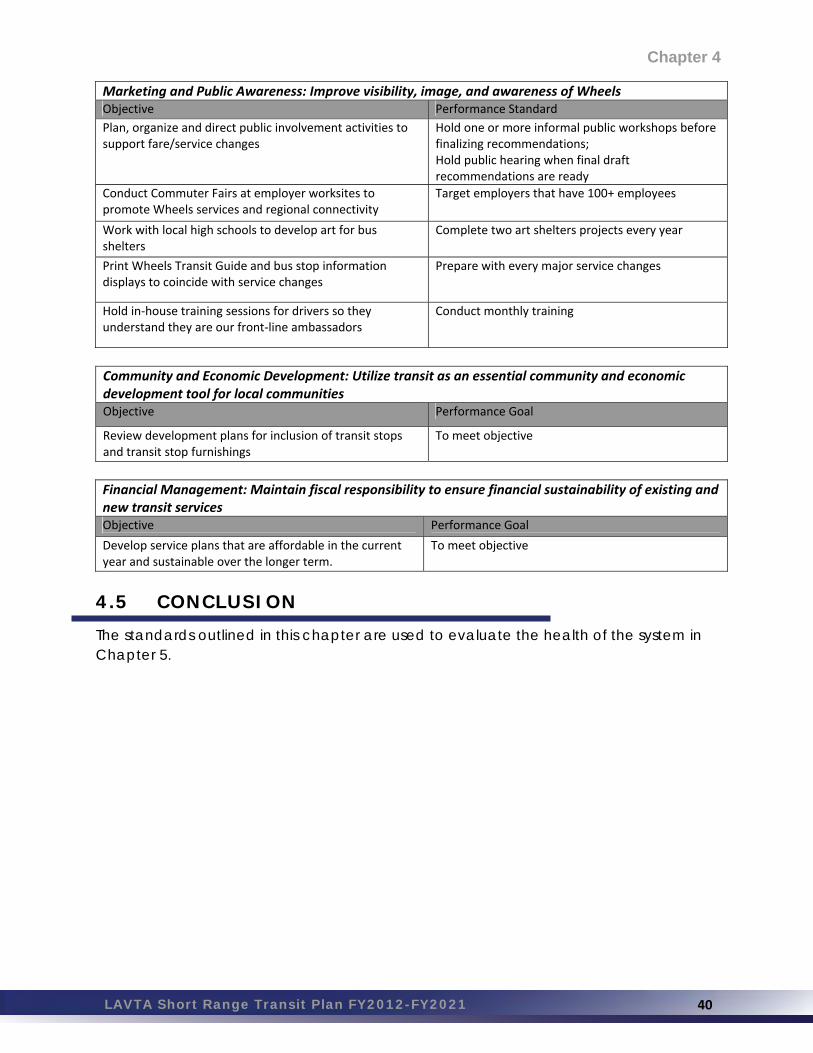
Marketing and Public Awareness: Improve visibility, image, and awareness of Wheels Objective Performance Standard
Plan, organize and direct public involvement activities to support fare/service changes
Hold one or more informal public workshops before finalizing recommendations; Hold public hearing when final draft recommendations are ready
Conduct Commuter Fairs at employer worksites to promote Wheels services and regional connectivity
Target employers that have 100+ employees
Work with local high schools to develop art for bus shelters
Complete two art shelters projects every year
Print Wheels Transit Guide and bus stop information displays to coincide with service changes
Prepare with every major service changes
Hold in‐house training sessions for drivers so they understand they are our front‐line ambassadors
Conduct monthly training
Community and Economic Development: Utilize transit as an essential community and economic development tool for local communities Objective Performance Goal
Review development plans for inclusion of transit stops and transit stop furnishings
To meet objective
Financial Management: Maintain fiscal responsibility to ensure financial sustainability of existing and new transit services Objective Performance Goal
Develop service plans that are affordable in the current year and sustainable over the longer term.
To meet objective
4.5 CONCLUSION
The standards outlined in this chapter are used to evaluate the health of the system in Chapter 5.

LAVTA Short Range Transit Plan FY2012-FY2021 41
Service Evaluation
5.1 OVERVIEW
LAVTA provides both fixed-route bus service and paratransit service within Dublin, Pleasanton, Livermore, and the surrounding unincorporated areas of Alameda County. The LAVTA service areas is also provided with regional service by BART, AMTRAK, Greyhound, San Joaquin Regional Transit, ACE, Tri Delta Transit, County Connection, and Modesto Area Express (MAX).
This chapter presents an analysis of both fixed routes and Dial-A-Ride performance between fiscal year (FY) 2009 and FY 2011. Fixed-route performance is presented first, in Section 5.2, followed by Dial-A-Ride services in Section 5.4. The financial and operating statistics presented are based on NTD data.
The purpose of this chapter is to:
Demonstrate how LAVTA services are performing relative to current standards.
Outline the need to refine these standards.
Establish the foundation for the short and near-term service changes that are outlined in Chapter 6.
5.2 FIXED ROUTE SYSTEM PERFORMANCE
Fixed-route service performance over the last three years, FY 2009 through FY 2011, was evaluated by looking at operating costs, revenue service hours and miles, ridership, farebox revenues and associated performance indicators.
Table 5-1 below presents key operating statistics for LAVTA fixed-route service. Service indicators were used to analyze data for trends which are shown in Graphs 1 through 7.
5.2.1 Annual Ridership
Ridership declined in the last three fiscal years, as shown in Figure 5-1. Ridership grew steadily between 2005 and 2008 but fell slightly in 2009 and more dramatically in 2010. Between FY 2009 and FY 2011, ridership has declined by 22%. This decline in ridership could largely be explained by the economic downturn and service cuts in FY 2010. LAVTA’s two major revenues, Transportation Development Act (TDA) monies and State Transit Assistance (STA) funds, were both reduced: STA monies were cut by 50% in FY 2009.1
In FY 2010, LAVTA implemented a 25% reduction in service hours coupled with a fare increase. These measures were necessary to respond to significant losses in revenues.
1 LAVTA CAFR 2009
Chapter 5

LAVTA Short Range Transit Plan FY2012-FY2021 42
Ridership trends also show some correlation with gasoline prices, with the highest annual ridership in 2008, when gasoline prices were highest. Table 5‐1. Fixed‐Route Operating Statistics
Indicator FY 2009 FY 2010 FY 2011
Operating Cost $12,764,264 $11,143,305 $11,564,234
Annual Change ‐12.7% 3.8%
Vehicle Service Hours 139,304 102,047 111,484
Annual Change ‐26.7% 9.2%
Vehicle Service Miles 2,017,218 1,500,165 1,637,604
Annual Change ‐25.6% 9.2%
Annual Ridership 2,195,408 1,740,297 1,712,879
Annual Change ‐20.7% ‐1.6%
Farebox Revenue $2,318,883 $2,118,803 $2,051,489
Annual Change ‐8.6% ‐3.2%
Operating Cost per Service Hour $91.63 $109.20 $103.73
Annual Change 19.2% ‐5.0%
Operating Cost per Passenger $5.81 $6.40 $6.75
Annual Change 10.1% 5.4%
Passengers per Service Hour 15.8 17.1 15.4
Annual Change 8.2% ‐9.9%
Subsidy per passenger $4.76 $5.19 $5.55
Annual Change 9.0% 7.1%
Average Fare per Passenger $1.06 $1.22 $1.20
Annual Change 15.3% ‐1.6%
Farebox Recovery Ratio 18.2% 19.0% 17.7%
Annual Change 4.7% ‐6.7%
* Operating data for FY 2009, FY 2010, and FY 2011 provided by LAVTA and CAFR Reports; Operating Cost excludes depreciation and Farebox Revenue includes Special Contract Revenue
This time period reflects the years hardest hit by the Great Recession. While outside of the data range of this document, it is important to note that LAVTA’s performance improved in FY2012 as the economy recovered. Annual ridership increased 3.3% in FY2012 and the operating revenue to operating expense ratio (OR/ER) was over 20%.
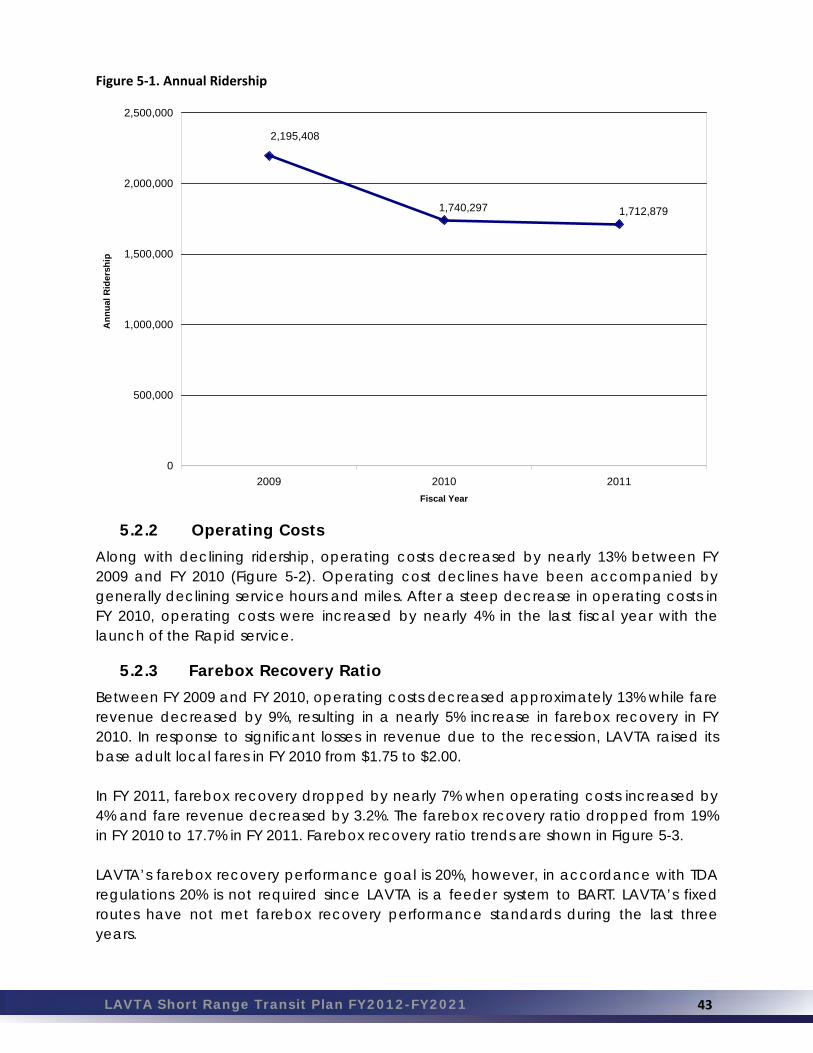
LAVTA Short Range Transit Plan FY2012-FY2021 43
Figure 5‐1. Annual Ridership
1,712,8791,740,297
2,195,408
0
500,000
1,000,000
1,500,000
2,000,000
2,500,000
2009 2010 2011
Fiscal Year
An
nu
al R
ider
ship
5.2.2 Operating Costs
Along with declining ridership, operating costs decreased by nearly 13% between FY 2009 and FY 2010 (Figure 5-2). Operating cost declines have been accompanied by generally declining service hours and miles. After a steep decrease in operating costs in FY 2010, operating costs were increased by nearly 4% in the last fiscal year with the launch of the Rapid service.
5.2.3 Farebox Recovery Ratio
Between FY 2009 and FY 2010, operating costs decreased approximately 13% while fare revenue decreased by 9%, resulting in a nearly 5% increase in farebox recovery in FY 2010. In response to significant losses in revenue due to the recession, LAVTA raised its base adult local fares in FY 2010 from $1.75 to $2.00. In FY 2011, farebox recovery dropped by nearly 7% when operating costs increased by 4% and fare revenue decreased by 3.2%. The farebox recovery ratio dropped from 19% in FY 2010 to 17.7% in FY 2011. Farebox recovery ratio trends are shown in Figure 5-3. LAVTA’s farebox recovery performance goal is 20%, however, in accordance with TDA regulations 20% is not required since LAVTA is a feeder system to BART. LAVTA’s fixed routes have not met farebox recovery performance standards during the last three years.

LAVTA Short Range Transit Plan FY2012-FY2021 44
Figure 5‐2. Operating Costs
$12,764,264
$11,143,305
$11,564,234
$10,000,000
$10,500,000
$11,000,000
$11,500,000
$12,000,000
$12,500,000
$13,000,000
2009 2010 2011Fiscal Year
Op
era
tin
g C
ost
Figure 5‐3. Farebox Recovery Ratio
$2,318,883
$2,118,803
$2,051,489
$0
$1,000,000
$2,000,000
$3,000,000
$4,000,000
2009 2010 2011Fiscal Year
Far
ebo
x R
even
ue

LAVTA Short Range Transit Plan FY2012-FY2021 45
5.2.4 Passengers Per Revenue Hour
LAVTA’s performance standard for primary and regional express lines is 20/10 (peak/non-peak) passengers per hour, while the standard for neighborhood and local feeder lines is 8/5 passengers per hour. Based on 2011 data, only two primary routes had more than 20 passengers per hour, with most generally meeting the agency’s lower off peak threshold standards. In the last fiscal year, LAVTA experienced a 10% decrease in passenger productivity, reversing the upward trend in FY 2010 (see Figure 5-4). In FY 2010, productivity increased by over 8% to 17.1 passengers per hour due to a 27% reduction in service hours and only a 21% drop in ridership. In FY 2011, ridership decreased by nearly 2% while vehicle service hours increased by over 9%. As a result, productivity dropped to 15.4 passengers per hour in FY 2011, the lowest of the three-year period examined.
5.2.5 Operating Cost Per Passenger
Although operating costs have declined over the past three years, ridership has declined at a faster rate, resulting in the operating cost per passenger increasing from a low of $5.81 in FY 2009 to $6.74 per passenger in FY 2011 (Figure 5-5). The largest increase in operating costs per passenger occurred between FY 2009 and FY 2010 with a 10% increase. This increase was due to a 13% decrease in costs while ridership dropped by 21% during the same time period.
5.2.6 Operating Cost Per Revenue Hour
Hourly costs fluctuated over the last three years, ranging from a low of $91.63 in FY 2009 to a high of $109.20 in FY 2010 (Figure 5-6). Between FY 2009 and FY 2010, operating costs per revenue hour increased by 19%. As previously mentioned, operating costs decreased by 13% in FY 2010 while service hours decreased by nearly 27%. Vehicle service hours increased by 9% in FY 2011 and corresponded with a less than 4% increase in operating costs. In FY 2011, hourly costs declined by 5% from $109.20 to $103.73.
5.2.7 Subsidy Per Passenger
An increase in the subsidy per passenger represents a negative performance trend, as shown in Figure 5-7. The subsidy paid per passenger has increased nearly 17% between FY 2009 and FY 2011. The subsidy per passenger was lowest in FY 2009 at $4.76. In FY 2011, the subsidy was $5.55 per passenger.

LAVTA Short Range Transit Plan FY2012-FY2021 46
Figure 5‐4. Passengers per Revenue Hour
15.8
17.1
15.4
14.5
15.0
15.5
16.0
16.5
17.0
17.5
2009 2010 2011Fiscal year
Pas
sen
ger
s p
er R
even
ue
Ho
ur
Figure 5‐5. Operating Cost per Passenger
$5.81
$6.40
$6.75
$5.20
$5.40
$5.60
$5.80
$6.00
$6.20
$6.40
$6.60
$6.80
$7.00
2009 2010 2011Fiscal Year
Op
erat
ing
Co
st p
er P
asse
ng
er

LAVTA Short Range Transit Plan FY2012-FY2021 47
Figure 5‐6. Operating Cost per Revenue Hour
$91.63
$109.20
$103.73
$80.00
$85.00
$90.00
$95.00
$100.00
$105.00
$110.00
$115.00
2009 2010 2011Fiscal year
Op
erat
ing
Co
st p
er R
even
ue
Ho
ur
Figure 5‐7. Subsidy per Passenger
$5.55
$5.19$4.76
$0.00
$1.00
$2.00
$3.00
$4.00
$5.00
$6.00
$7.00
$8.00
2009 2010 2011Fiscal Year
Su
bsi
dy
per
Pas
sen
ger
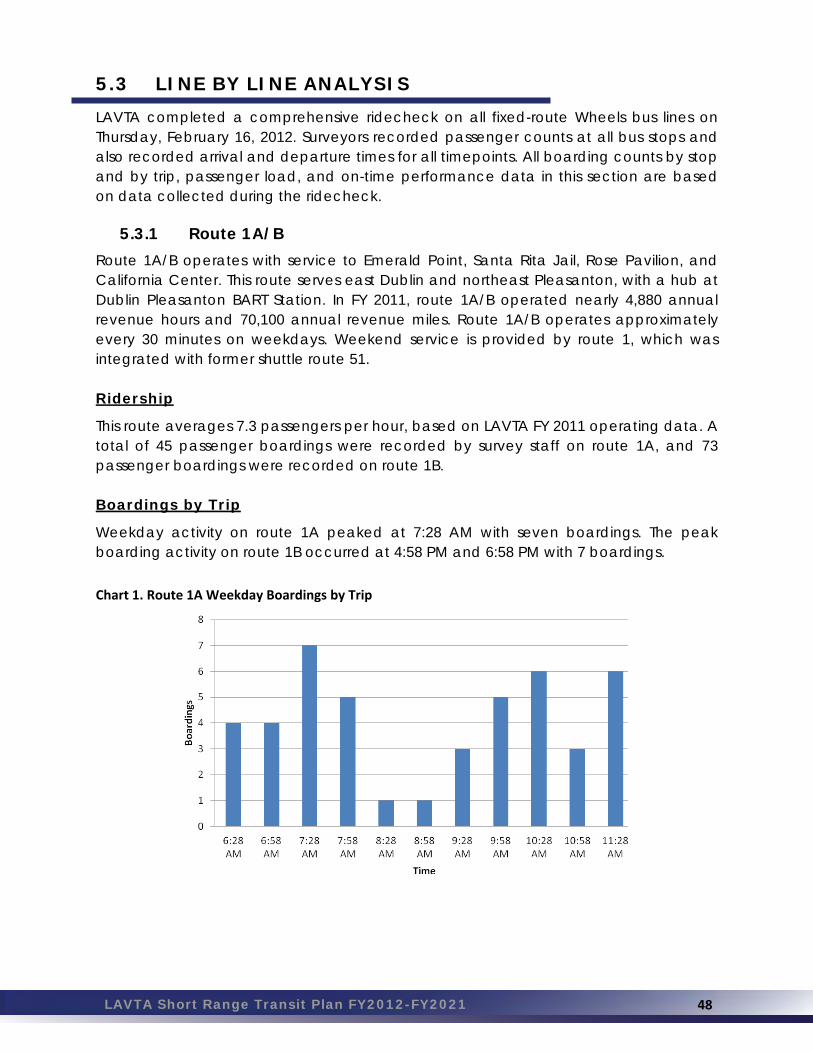
LAVTA Short Range Transit Plan FY2012-FY2021 48
5.3 LINE BY LINE ANALYSIS
LAVTA completed a comprehensive ridecheck on all fixed-route Wheels bus lines on Thursday, February 16, 2012. Surveyors recorded passenger counts at all bus stops and also recorded arrival and departure times for all timepoints. All boarding counts by stop and by trip, passenger load, and on-time performance data in this section are based on data collected during the ridecheck.
5.3.1 Route 1A/B
Route 1A/B operates with service to Emerald Point, Santa Rita Jail, Rose Pavilion, and California Center. This route serves east Dublin and northeast Pleasanton, with a hub at Dublin Pleasanton BART Station. In FY 2011, route 1A/B operated nearly 4,880 annual revenue hours and 70,100 annual revenue miles. Route 1A/B operates approximately every 30 minutes on weekdays. Weekend service is provided by route 1, which was integrated with former shuttle route 51. Ridership
This route averages 7.3 passengers per hour, based on LAVTA FY 2011 operating data. A total of 45 passenger boardings were recorded by survey staff on route 1A, and 73 passenger boardings were recorded on route 1B. Boardings by Trip
Weekday activity on route 1A peaked at 7:28 AM with seven boardings. The peak boarding activity on route 1B occurred at 4:58 PM and 6:58 PM with 7 boardings.
Chart 1. Route 1A Weekday Boardings by Trip

LAVTA Short Range Transit Plan FY2012-FY2021 49
Chart 2. Route 1B Weekday Boardings by Trip
Top Boarding & Alighting Locations
Top boarding and alighting locations on route 1A/B were at Dublin/ Pleasanton BART station and Broder Boulevard/Santa Rita Jail. Other stops with activity included Hacienda Business Park (Oracle, Walmart, Rose Pavilion, Koll Center) and Waterfront Plaza. Weekday boardings and alightings by stop are shown in Figure 5-8 and 5-9. Table 5‐2. Route 1A Weekday Top Boarding & Alighting Locations
Street Cross Street Total Activity
East Dublin/Pleasanton BART 20
Broder Boulevard Santa Rita Jail 16
Rose Pavilion Inbound 10
Owens Rosewood 9
Owens Hacienda 4
Table 5‐3. Route 1B Weekday Top Boarding & Alighting Locations
Street Cross Street Total Activity
East Dublin/Pleasanton BART 84
Broder Boulevard Santa Rita Jail 35
Dublin Boulevard Hacienda Drive 5
Dublin Boulevard Tassajara WB 3

LAVTA Short Range Transit Plan FY2012-FY2021 50
Figure 5‐8. Route 1A Weekday Boarding & Alighting by Stop
Figure 5‐9. Route 1B Weekday Boarding & Alighting by Stop

LAVTA Short Range Transit Plan FY2012-FY2021 51
5.3.2 Route 2
Route 2 serves east Dublin, including the north Dublin Ranch development and Dublin/Pleasanton BART station. Service is peak periods only, at 30-minute headways. Route 2 was renamed from 1E in 2009. In FY 2011, route 2 operated nearly 1,620 annual revenue hours and 19,900 annual revenue miles. Ridership
This route averages 11.6 passengers per hour, based on LAVTA FY 2011 operating data. A total of 97 passenger boardings were recorded by survey staff on route 2. Boardings by Trip
The highest number of boardings was on the 7:58 AM trip, with 16 boardings, and the 3:04 PM trip, with 19 boardings. Chart 3. Route 2 Weekday Boardings by Trip
Top Boarding & Alighting Locations
Top boarding and alighting locations on route 2 were mostly at the Dublin/ Pleasanton BART station and at Fallon Middle School. Other stops with activity included Central Parkway stops at Glynnis Rose and at Aspen. Table 5‐4. Route 2 Weekday Top Boarding & Alighting Locations
Street Cross Street Total Activity
East Dublin/Pleasanton BART 98
Fallon Middle School 46
Central Pkwy Glynnis Rose 13
Central Pkwy Aspen 12
Weekday boarding and alighting by stop are shown in Figure 5-10.
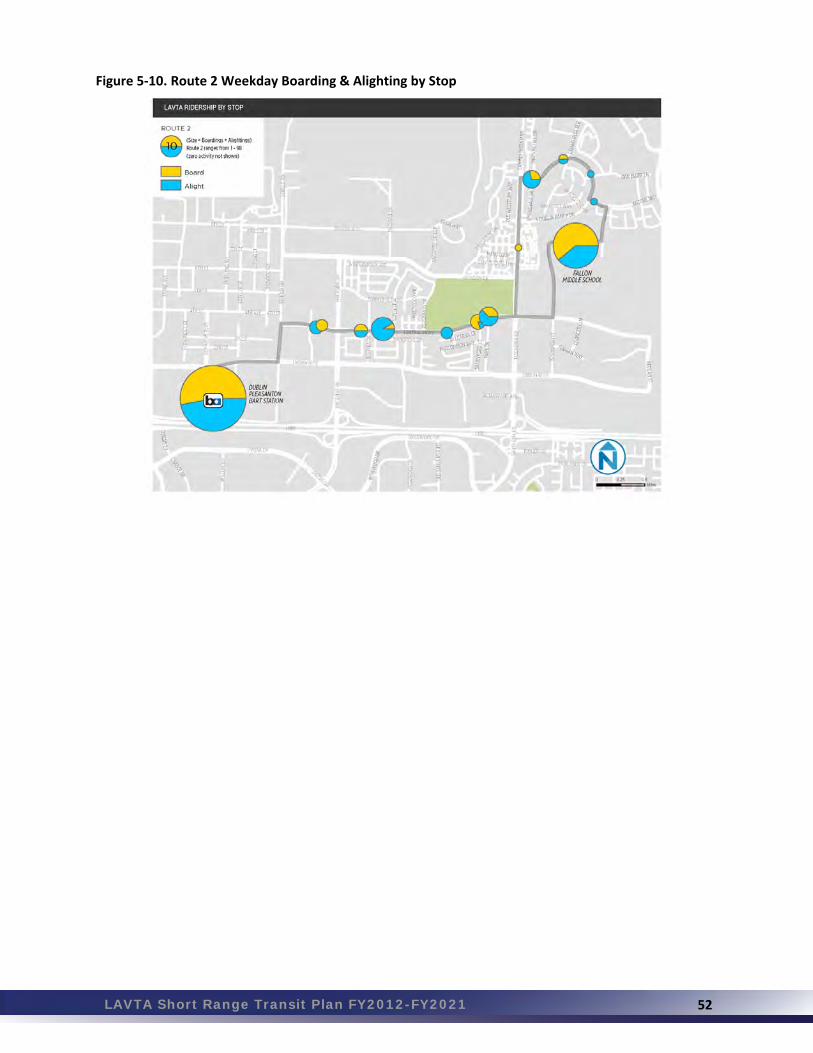
LAVTA Short Range Transit Plan FY2012-FY2021 52
Figure 5‐10. Route 2 Weekday Boarding & Alighting by Stop

LAVTA Short Range Transit Plan FY2012-FY2021 53
5.3.3 Route 3, 3V
Route 3 covers a large area of west Dublin, including most residential areas east of I-680. Route 3 also serves northwest Pleasanton and includes Stoneridge Mall. Land-uses are primarily residential on the Dublin side, but mostly employment and commercial on the Pleasanton side. As part of the spring 2009 service reductions, service on this line was drastically reduced, from operating all day on 15-60 minute frequencies to hourly only during the peak period in the peak direction. Route 3V complements the base route 3 by extending its coverage to the residential areas west of I- 680 on the Dublin side; its coverage in other parts of west Dublin and on the Pleasanton side is abbreviated relative to the regular route 3. Service is peak period only, and was reduced from a 60-minute headway to three trips as part of the spring 2009 service reductions. Route 3-3V runs clockwise in the morning and counterclockwise in the afternoon. In FY 2011, route 3-3V operated nearly 3,280 annual revenue hours and 56,400 annual revenue miles. Ridership
This route averages 8.0 passengers per hour, based on LAVTA FY 2011 operating data. A total of 20 passenger boardings were recorded by survey staff on route 3-3V Clockwise and 27 passenger boardings on route 3-3V Counter Clockwise. Boardings by Trip
Weekday activity for route 3-3V in the clockwise direction peaked at 7:22 AM with 11 boardings and at 2:58 PM with 17 boardings in the counterclockwise direction. Chart 4. Route 3‐3V Clockwise Weekday Boardings by Trip

LAVTA Short Range Transit Plan FY2012-FY2021 54
Chart 5. Route 3‐3V Counter Clockwise Weekday Boardings by Trip
Top Boarding & Alighting Locations
Top boarding and alighting locations on route 3-3V occurred at West and Dublin/Pleasanton BART station and Wells Middle School. The other stop with significant activity included Village Parkway at Brighton.
Table 5‐5. Route 3‐3V Clockwise and Counter Clockwise Weekday Top Boarding & Alighting Locations
Street Cross Street Total Activity
West Dublin/Pleasanton BART 14
East Dublin/Pleasanton BART 12
Wells Middle School 12
Village Pkwy Brighton 8
Weekday boarding and alighting by stop are shown in Figures 5-11 and 5-12.

LAVTA Short Range Transit Plan FY2012-FY2021 55
Figure 5‐11. Route 3‐3V Clockwise Weekday Boarding & Alighting by Stop
Figure 5‐12. Route 3‐3V Counter Clockwise Weekday Boarding & Alighting by Stop
WELLS MIDDLE
WELLS MIDDLE SCHOOL

LAVTA Short Range Transit Plan FY2012-FY2021 56
5.3.4 Route 8A/B
Route 8A/B serves a parallel north-south corridor to the 10 line in the Pleasanton area, with primary service areas being the Hopyard Road area, downtown Pleasanton, and Vintage Hills. Frequencies were reduced in the spring of 2009. Route 8A/B operates all day on an hourly frequency. Land-uses are mainly commercial and residential, with some office uses, primarily within the Bernal Business Park. On morning runs, buses serve Bernal Business Park from BART and in afternoons, buses pick up at Bernal Business Park en route to BART. In Downtown Pleasanton, the route operates as follows:
Route 8A: BART → Civic Center → First & Neal → Kottinger Park → Senior Center → Ridgeview Commons → BART Route 8B: BART → Ridgeview Commons → Senior Center → First & Neal → Kottinger Park → Civic Center → BART
In FY 2011, route 8A/B operated nearly 4,750 annual revenue hours and 73,800 annual revenue miles. Ridership
This route averages 10.3 passengers per hour, based on LAVTA FY 2011 operating data. A total of 145 passenger boardings were recorded by survey staff on route 8A (Clockwise) and 108 passenger boardings were recorded on route 8B (Counter Clockwise). Boardings by Trip
Passenger boarding activity on route 8A spiked at 3:58 PM with 24 boardings. On route 8B, passenger activity peaked in the morning with 18 passenger boardings at 8:28 AM and 9:58 AM. During the remainder of the day, boarding activity fluctuated, but was highest in the afternoon on route 8A.
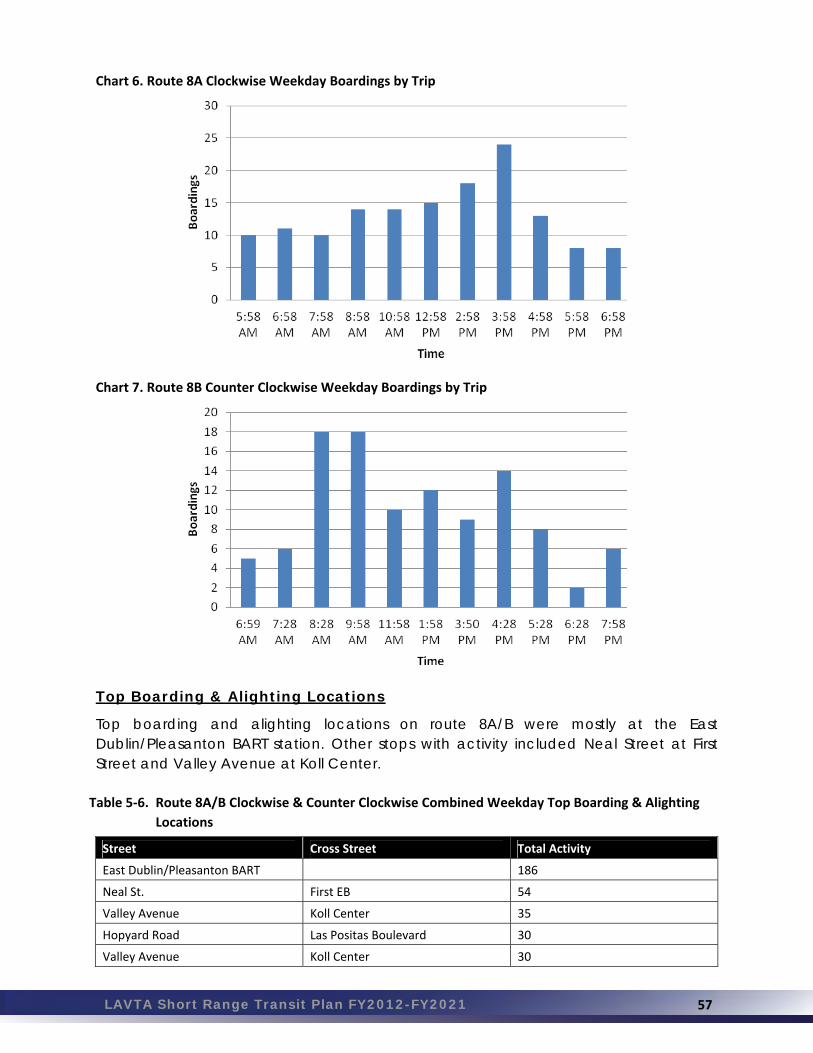
LAVTA Short Range Transit Plan FY2012-FY2021 57
Chart 6. Route 8A Clockwise Weekday Boardings by Trip
Chart 7. Route 8B Counter Clockwise Weekday Boardings by Trip
Top Boarding & Alighting Locations
Top boarding and alighting locations on route 8A/B were mostly at the East Dublin/Pleasanton BART station. Other stops with activity included Neal Street at First Street and Valley Avenue at Koll Center.
Table 5‐6. Route 8A/B Clockwise & Counter Clockwise Combined Weekday Top Boarding & Alighting
Locations
Street Cross Street Total Activity
East Dublin/Pleasanton BART 186
Neal St. First EB 54
Valley Avenue Koll Center 35
Hopyard Road Las Positas Boulevard 30
Valley Avenue Koll Center 30

LAVTA Short Range Transit Plan FY2012-FY2021 58
Weekday boardings and alightings by stop are shown in Figures 5-13 and 5-13.
Figure 5‐13. Route 8A Weekday Boarding & Alighting by Stop
Figure 5‐14. Route 8B Weekday Boarding & Alighting by Stop
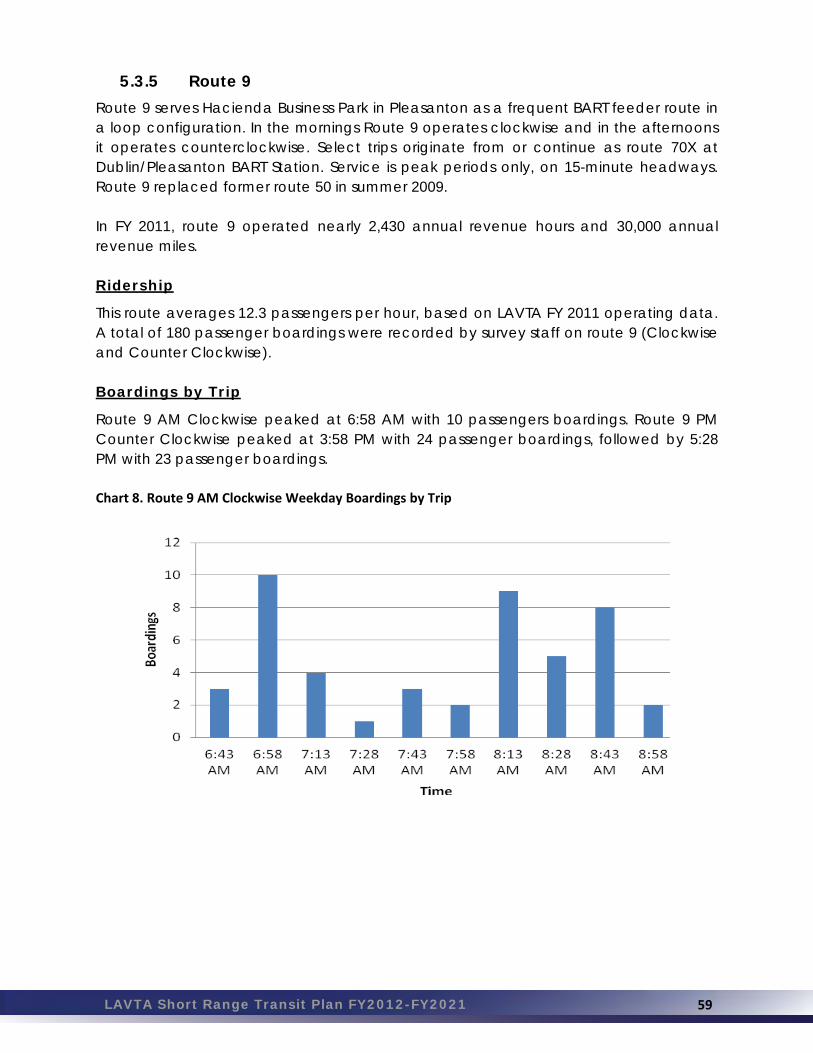
LAVTA Short Range Transit Plan FY2012-FY2021 59
5.3.5 Route 9
Route 9 serves Hacienda Business Park in Pleasanton as a frequent BART feeder route in a loop configuration. In the mornings Route 9 operates clockwise and in the afternoons it operates counterclockwise. Select trips originate from or continue as route 70X at Dublin/Pleasanton BART Station. Service is peak periods only, on 15-minute headways. Route 9 replaced former route 50 in summer 2009. In FY 2011, route 9 operated nearly 2,430 annual revenue hours and 30,000 annual revenue miles. Ridership
This route averages 12.3 passengers per hour, based on LAVTA FY 2011 operating data. A total of 180 passenger boardings were recorded by survey staff on route 9 (Clockwise and Counter Clockwise). Boardings by Trip
Route 9 AM Clockwise peaked at 6:58 AM with 10 passengers boardings. Route 9 PM Counter Clockwise peaked at 3:58 PM with 24 passenger boardings, followed by 5:28 PM with 23 passenger boardings. Chart 8. Route 9 AM Clockwise Weekday Boardings by Trip

LAVTA Short Range Transit Plan FY2012-FY2021 60
Chart 9. Route 9 PM Counter Clockwise Weekday Boardings by Trip
Top Boarding & Alighting Locations
Top boarding and alighting locations on route 9 occurred at East Dublin/ Pleasanton BART station, Kaiser, and California Center. Other stops with activity included Chabot Drive at Inglewood Drive and Stoneridge at Courthouse. Table 5‐7. Route 9 Clockwise & Counter Clockwise Combined Weekday Top Boarding & Alighting Locations
Street Cross Street Total Activity
East Dublin/Pleasanton BART 117
Kaiser NB 65
California Center 52
Chabot Drive. Inglewood Drive. 14
Stoneridge Courthouse 13
Weekday boardings and alightings by stop are shown in Figures 5-15 and 5-16.
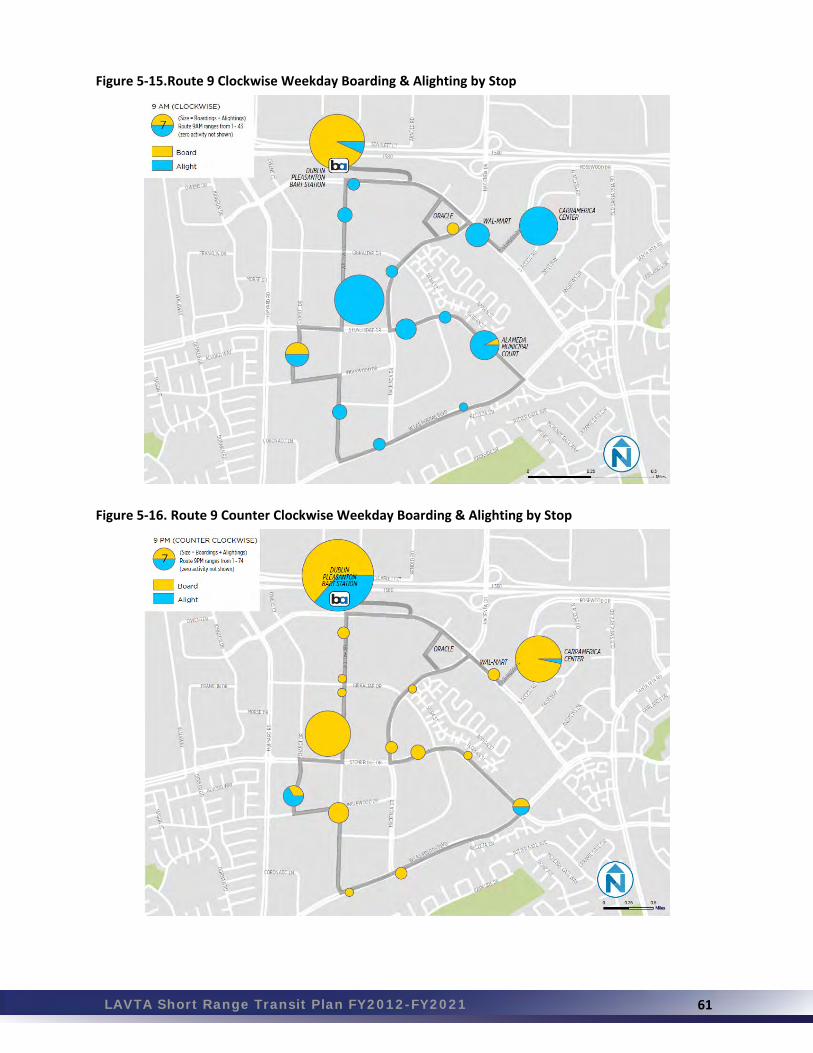
LAVTA Short Range Transit Plan FY2012-FY2021 61
Figure 5‐15.Route 9 Clockwise Weekday Boarding & Alighting by Stop
Figure 5‐16. Route 9 Counter Clockwise Weekday Boarding & Alighting by Stop
LAVTA Short Range Transit Plan FY2012-FY2021 62
5.3.6 Route 10
Route 10 serves as the backbone of the Wheels fixed-route system, providing east-west trunk service, crossing through the three downtowns of Livermore, Pleasanton, and Dublin, and carrying half of LAVTA’s total fixed route ridership. The nearly 24-hour service, which was implemented in 2005 as part of the regional AllNighter program, was suspended as part of the spring 2009 service reduction, along with implementing frequency reductions during off-peak times. Current frequencies vary from 15 to 40 minutes. In FY 2011, service hours were reduced on route 10 where they duplicated the Rapid’s new hours. Route 10 serves Lawrence Livermore National Laboratory, the Livermore Transit Center, Dublin/Pleasanton BART, and Stoneridge Mall. In FY 2011, route 10 operated nearly 39,080 annual revenue hours and 509,000 annual revenue miles. Trip 2 is used in the following analysis. Ridership
This route averages 20.7 passengers per hour, based on LAVTA FY 2011 operating data, making it LAVTA's most productive regular fixed route. A total of 902 passenger boardings were recorded on route 10 Westbound and 959 passenger boardings were recorded on route 10 Eastbound. Boardings
Route 10 has some clear commute-hour peaks. Weekday boarding activity is highest between 4:00 PM and 5:00 PM with 545 boardings. Route ridership is also high between 7:00 AM and 8:00 AM with 487 boardings.

LAVTA Short Range Transit Plan FY2012-FY2021 63
Chart 10. Route 10 Weekday Boarding Activity (08/18/2010 & 08/25/2010)
0
100
200
300
400
500
600
Boardings
Time Top Boarding & Alighting Locations
Top boarding and alighting locations on route 10 centered mostly on East Dublin/Pleasanton BART and Livermore Transit Center. Other stops with activity included Neal Street and First Street. Weekday boardings and alightings by stop are shown in Figures 5-17 and 5-18. Table 5‐8. Route 10 Westbound Weekday Top Boarding & Alighting Locations
Street Cross Street Total Activity
East Dublin/Pleasanton BART 257
Livermore Transit Center 234
Neal St First NB 121
First St. Ray 118
Owens Hacienda 105
Table 5‐9. Route 10 Eastbound Weekday Top Boarding & Alighting Locations
Street Cross Street Total Activity
East Dublin/Pleasanton BART 350
Livermore Transit Center 226
Neal St First NB 108
First St. Kottinger NB 107
Railroad P St. 104

LAVTA Short Range Transit Plan FY2012-FY2021 64
Figure 5‐17. Route 10 Westbound Weekday Boarding & Alighting by Stop West Half
East Half

LAVTA Short Range Transit Plan FY2012-FY2021 65
Figure 5‐18. Route 10 Eastbound Weekday Boarding & Alighting by Stop West Half
East Half
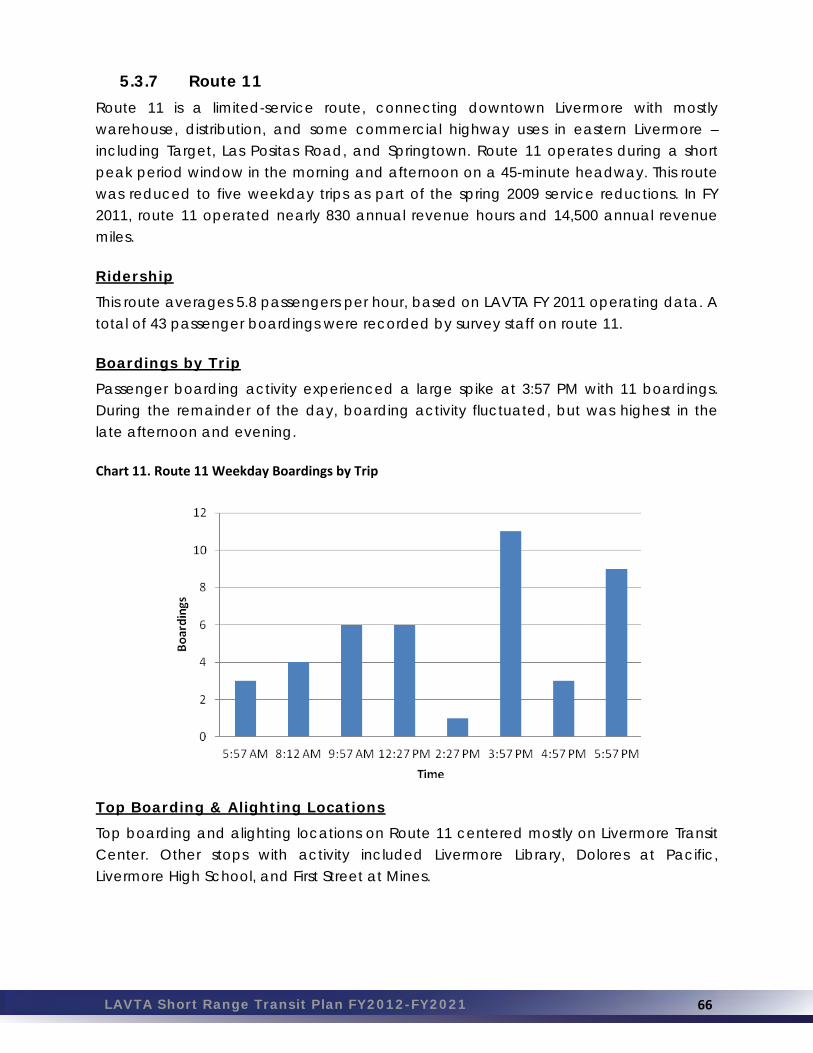
LAVTA Short Range Transit Plan FY2012-FY2021 66
5.3.7 Route 11
Route 11 is a limited-service route, connecting downtown Livermore with mostly warehouse, distribution, and some commercial highway uses in eastern Livermore – including Target, Las Positas Road, and Springtown. Route 11 operates during a short peak period window in the morning and afternoon on a 45-minute headway. This route was reduced to five weekday trips as part of the spring 2009 service reductions. In FY 2011, route 11 operated nearly 830 annual revenue hours and 14,500 annual revenue miles. Ridership
This route averages 5.8 passengers per hour, based on LAVTA FY 2011 operating data. A total of 43 passenger boardings were recorded by survey staff on route 11. Boardings by Trip
Passenger boarding activity experienced a large spike at 3:57 PM with 11 boardings. During the remainder of the day, boarding activity fluctuated, but was highest in the late afternoon and evening. Chart 11. Route 11 Weekday Boardings by Trip
Top Boarding & Alighting Locations
Top boarding and alighting locations on Route 11 centered mostly on Livermore Transit Center. Other stops with activity included Livermore Library, Dolores at Pacific, Livermore High School, and First Street at Mines.

LAVTA Short Range Transit Plan FY2012-FY2021 67
Table 5‐10. Route 11 Westbound Weekday Top Boarding & Alighting Locations
Street Cross Street Total Activity
Livermore Transit Center 46
Livermore Library 7
Dolores Pacific 5
Livermore High School 4
First St. Mines 4
Figure 5-19 show weekday boarding and alighting activity by stop. Figure 5‐19. Route 11 Weekday Boarding & Alighting by Stop

LAVTA Short Range Transit Plan FY2012-FY2021 68
5.3.8 Route 12-12V
Route 12 is an inter-municipal line serving northwest Livermore – including Las Positas College – and east Dublin. An express pattern (12V) bypasses the North Canyons Parkway loop and the College; a special pattern also serves the Hagemann Park neighborhood for Junction Avenue Middle School. Route 12 operates all day with service frequencies of 30-60 minutes. This route received frequency and cycle time reductions as part of the spring 2009 budget-driven cutbacks. It is the second-highest route in terms of raw ridership. In FY 2011, route 12-12V operated nearly 13,220 annual revenue hours and 216,700 annual revenue miles. Ridership
This route averages 13.5 passengers per hour, based on LAVTA FY 2011 operating data. A total of 407 passenger boardings were recorded by survey staff on route 12-12V Eastbound and 382 passenger boardings were recorded on route 12-12V Westbound. Boardings by Trip
Weekday boardings on Eastbound route 12-12V were highest in the morning and peaked at 7:38 AM and 11:28 AM with 36 boardings. Boardings on the Westbound route 12-12V were highest in the late morning and early afternoon, peaking at 2:48 PM with 44 boardings. Chart 12. Route 12‐12V Eastbound Weekday Boardings by Trip

LAVTA Short Range Transit Plan FY2012-FY2021 69
Chart 13. Route 12‐12V Westbound Weekday Boardings by Trip
Top Boarding & Alighting Locations
Top boarding and alighting locations on route 12-12V were mostly at Las Positas College, Dublin/Pleasanton BART station, and Livermore Transit Center. Table 5‐11. Route 12‐12V Eastbound Weekday Top Boarding & Alighting Locations
Street Cross Street Total Activity
Las Positas College 208
East Dublin/Pleasanton BART 182
Livermore Transit Center 72
Murietta Portola 31
Table 5‐12. Route 12‐12V Westbound Weekday Top Boarding & Alighting Locations
Street Cross Street Total Activity
Las Positas College 191
East Dublin/Pleasanton BART 187
Livermore Transit Center 109
Murietta Portola 28
Figures 5-20 and 5-21 show the boarding and alighting by stop for route 12.

LAVTA Short Range Transit Plan FY2012-FY2021 70
Figure 5‐20. Route 12‐12V Eastbound Weekday Boarding & Alighting by Stop West Half
East Half
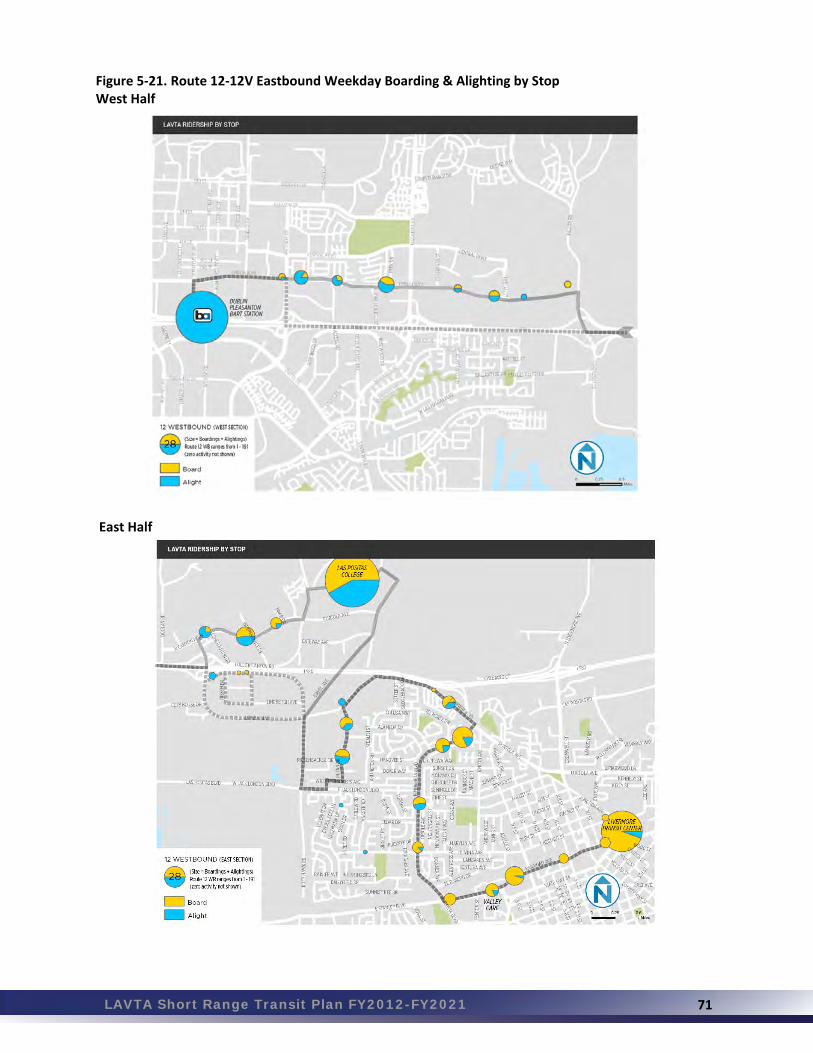
LAVTA Short Range Transit Plan FY2012-FY2021 71
Figure 5‐21. Route 12‐12V Eastbound Weekday Boarding & Alighting by Stop West Half
East Half

LAVTA Short Range Transit Plan FY2012-FY2021 72
5.3.8 Route 14
Route 14 serves near-downtown areas of Livermore, connecting residential blocks to the north with commercial and civic uses to the south. Shaped in the form of a figure “8”, it operates every 30 minutes throughout the day. In FY 2011, route 14 operated nearly 3,360 annual revenue hours and 37,700 annual revenue miles. Ridership
This route averages 8.0 passengers per hour, based on LAVTA FY 2011 operating data. A total of 221 passenger boardings were recorded by survey staff on route 14. Boardings by Trip
Route 14 boardings peaked at 7:42 AM with 17 boardings. Boarding activity decreased in the midmorning and increased again in the afternoon with 13 passenger boardings at 1:12 PM and 3:12 PM. Chart 5‐14. Route 14 Weekday Boardings by Trip
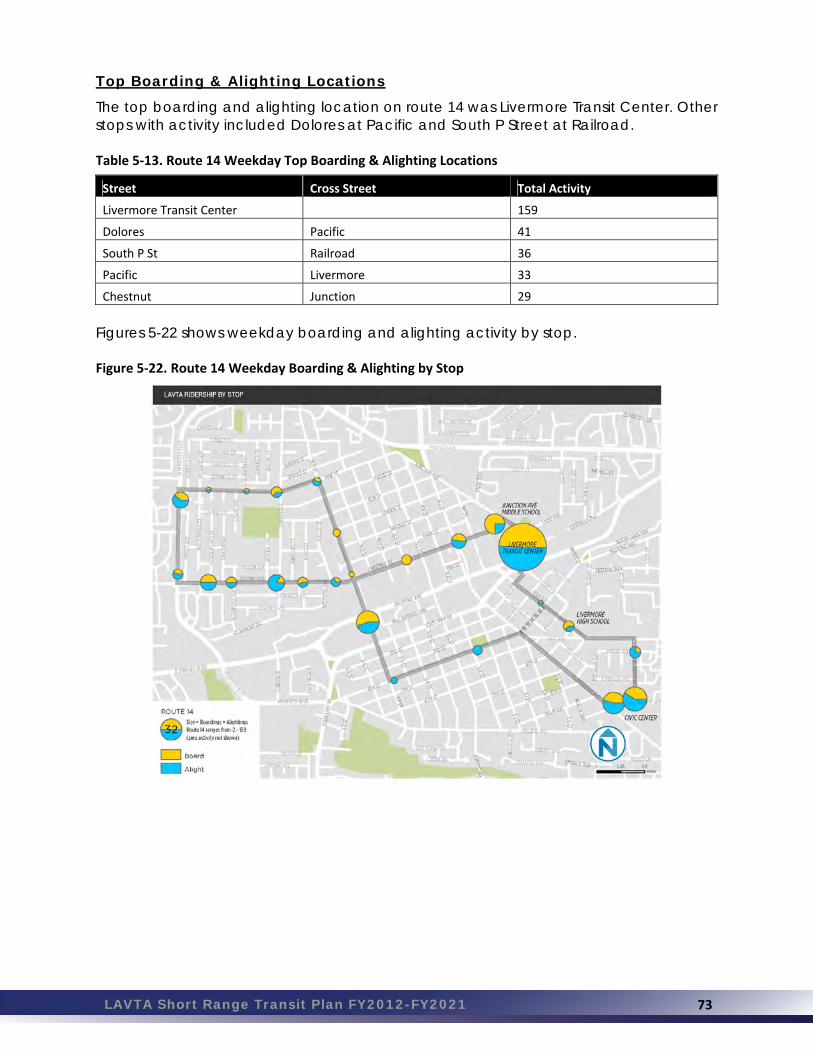
LAVTA Short Range Transit Plan FY2012-FY2021 73
Top Boarding & Alighting Locations
The top boarding and alighting location on route 14 was Livermore Transit Center. Other stops with activity included Dolores at Pacific and South P Street at Railroad. Table 5‐13. Route 14 Weekday Top Boarding & Alighting Locations
Street Cross Street Total Activity
Livermore Transit Center 159
Dolores Pacific 41
South P St Railroad 36
Pacific Livermore 33
Chestnut Junction 29
Figures 5-22 shows weekday boarding and alighting activity by stop. Figure 5‐22. Route 14 Weekday Boarding & Alighting by Stop
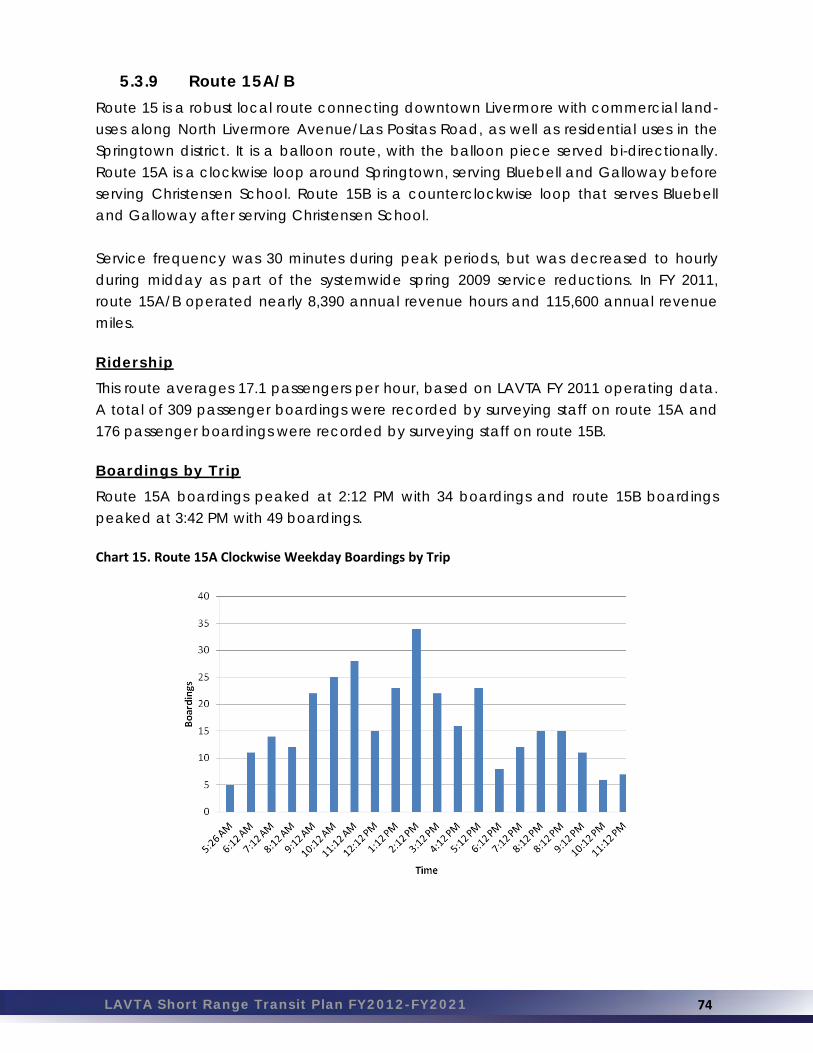
LAVTA Short Range Transit Plan FY2012-FY2021 74
5.3.9 Route 15A/B
Route 15 is a robust local route connecting downtown Livermore with commercial land-uses along North Livermore Avenue/Las Positas Road, as well as residential uses in the Springtown district. It is a balloon route, with the balloon piece served bi-directionally. Route 15A is a clockwise loop around Springtown, serving Bluebell and Galloway before serving Christensen School. Route 15B is a counterclockwise loop that serves Bluebell and Galloway after serving Christensen School. Service frequency was 30 minutes during peak periods, but was decreased to hourly during midday as part of the systemwide spring 2009 service reductions. In FY 2011, route 15A/B operated nearly 8,390 annual revenue hours and 115,600 annual revenue miles. Ridership
This route averages 17.1 passengers per hour, based on LAVTA FY 2011 operating data. A total of 309 passenger boardings were recorded by surveying staff on route 15A and 176 passenger boardings were recorded by surveying staff on route 15B. Boardings by Trip
Route 15A boardings peaked at 2:12 PM with 34 boardings and route 15B boardings peaked at 3:42 PM with 49 boardings. Chart 15. Route 15A Clockwise Weekday Boardings by Trip

LAVTA Short Range Transit Plan FY2012-FY2021 75
Chart 16. Route 15A Counter Clockwise Weekday Boardings by Trip
Top Boarding & Alighting Locations
Top boarding and alighting locations on route 15A/B occurred at Livermore Transit Center and Livermore Walmart. Table 5‐14. Route 15A Clockwise Weekday Top Boarding & Alighting Locations
Street Cross Street Total Activity
Livermore Transit Center 256
Livermore Walmart 48
Springtown Boulevard. Bluebell 35
Las Positas Plaza Drive. 26
Scenic Avenue. Vasco Road. 23
Table 5‐15. Route 15B Counter Clockwise Weekday Top Boarding & Alighting Locations
Street Cross Street Total Activity
Livermore Transit Center 154
Livermore Walmart 20
Bluebell Las Flores 19
Broadmoor St. Greenwich St 15
First St. Las Positas 14
Weekday boarding and alighting activity by stop is shown in Figures 5-23 and 5-24.

LAVTA Short Range Transit Plan FY2012-FY2021 76
Figure 5‐23. Route 15A Clockwise Weekday Boarding & Alighting by Stop
Figure 5‐24. Route 15B Counter Clockwise Weekday Boarding & Alighting by Stop

LAVTA Short Range Transit Plan FY2012-FY2021 77
5.3.9 Route 18A/B
Route 18 is a loop route with a clockwise and a counterclockwise pattern, serving the Granada neighborhood of Livermore, including a middle school and a high school. A few daily trips extend to Ravenswood Park, primarily to accommodate students. Route 18A is the clockwise loop and route 18B is the counter clockwise loop. Route 18A/B serves Concannon, Arroyo, Superior, Lexington, and Holmes. and-uses along the route outside the immediate downtown area are almost exclusively low-density residential. Frequencies are 30 to 45 minutes during peak periods, midday service was discontinued as part of the spring 2009 systemwide service reductions. In FY 2011, route 18A/B operated nearly 1,890 annual revenue hours and 21,800 annual revenue miles. Ridership
This route averages only 4.6 passengers per hour, based on LAVTA FY 2011 operating data. A total of 16 passenger boardings were recorded by survey staff on route 18A and 34 passenger boardings were recorded by survey staff on route 18B. Boardings by Trip
Boardings on route 18A/B were fairly consistent throughout the day, with a peak of 5 boardings in the morning at 7:42 AM and in the afternoon/evening (2:27 PM, 3:12 PM and 6:12 PM). Chart 17. Route 18A Clockwise Weekday Boardings by Trip
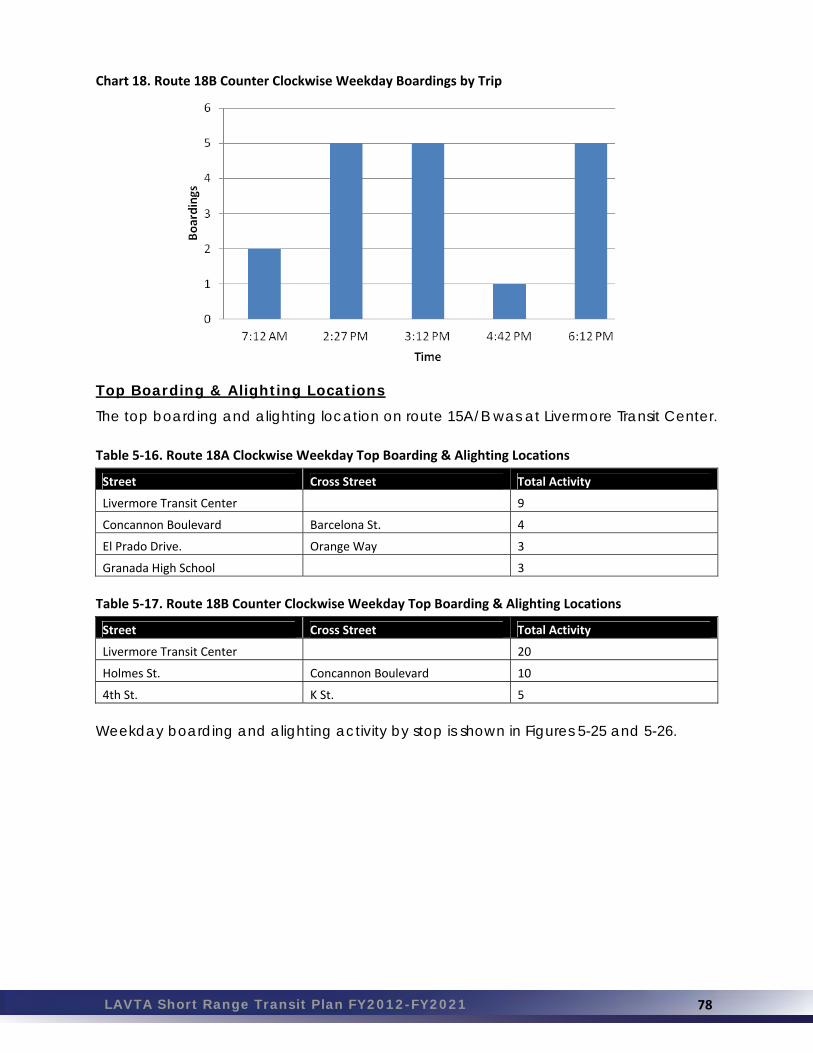
LAVTA Short Range Transit Plan FY2012-FY2021 78
Chart 18. Route 18B Counter Clockwise Weekday Boardings by Trip
Top Boarding & Alighting Locations
The top boarding and alighting location on route 15A/B was at Livermore Transit Center. Table 5‐16. Route 18A Clockwise Weekday Top Boarding & Alighting Locations
Street Cross Street Total Activity
Livermore Transit Center 9
Concannon Boulevard Barcelona St. 4
El Prado Drive. Orange Way 3
Granada High School 3
Table 5‐17. Route 18B Counter Clockwise Weekday Top Boarding & Alighting Locations
Street Cross Street Total Activity
Livermore Transit Center 20
Holmes St. Concannon Boulevard 10
4th St. K St. 5
Weekday boarding and alighting activity by stop is shown in Figures 5-25 and 5-26.

LAVTA Short Range Transit Plan FY2012-FY2021 79
Figure 5‐25. Route 18A Clockwise Weekday Boarding & Alighting by Stop
Figure 5‐26. Route 18B Counter Clockwise Weekday Boarding & Alighting by Stop

LAVTA Short Range Transit Plan FY2012-FY2021 80
5.3.10 Route 20X
Route 20X is a semi-express route serving a niche market of reverse-direction commuters between Dublin/Pleasanton BART and employment areas in east Livermore, including LLNL. Route 20X serves the area between Hacienda Road/I-580 (Pleasanton) and Greenville Road/I-580 (Livermore). Service is every 45 minutes, peak periods only. In FY 2011, route 20X operated nearly 1,580 annual revenue hours and 38,900 annual revenue miles. Ridership
This route averages 8.3 passengers per hour, based on LAVTA FY 2011 operating data. A total of 75 passenger boardings were recorded by survey staff on route 20X. Boardings by Trip
Boardings on route 20X peaked at 6:58 AM with 19 boardings. Chart 19. Route 20X AM and PM Weekday Boardings by Trip
Top Boarding & Alighting Locations
Top boarding and alighting locations on route 20X occurred mostly at West Dublin/Pleasanton BART station and East Avenue at South Vasco Road. See Figures 5-27 and 5-28 for boardings and alighting by stop information for route 20X. Table 5‐18. Route 20X Weekday Top Boarding & Alighting Locations
Street Cross Street Total Activity
West Dublin/Pleasanton BART 72
East Avenue South Vasco Road 26
Vasco Daphne 12
Vasco Brisa 10
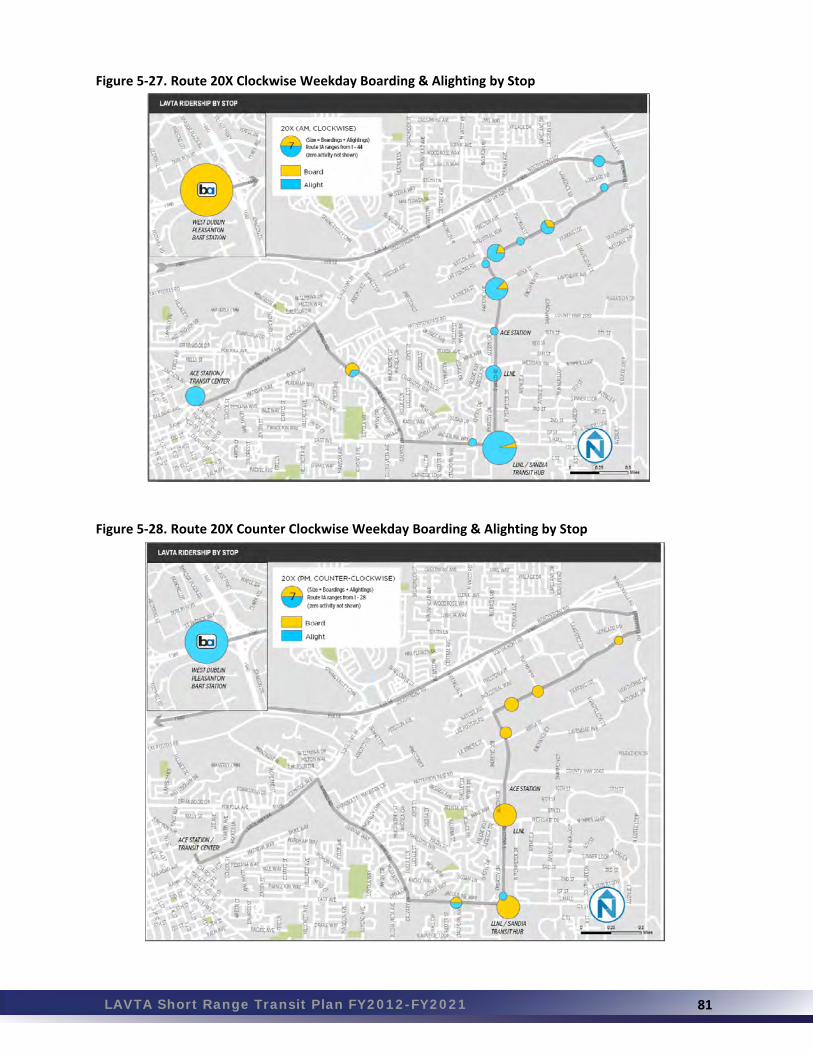
LAVTA Short Range Transit Plan FY2012-FY2021 81
Figure 5‐27. Route 20X Clockwise Weekday Boarding & Alighting by Stop
Figure 5‐28. Route 20X Counter Clockwise Weekday Boarding & Alighting by Stop

LAVTA Short Range Transit Plan FY2012-FY2021 82
5.3.11 Tri-Valley Rapid (Route 30)
The Rapid is a high-capacity transit system that operates in the Tri-Valley from East Livermore to West Pleasanton and points in between, including two BART stations. The LAVTA Rapid was built upon the already-successful route 10 which provides both intra-valley trips and serves regional destination points. Destinations on the Rapid include:
Stoneridge Shopping Center Dublin/Pleasanton BART Station Downtown Dublin Hacienda Crossings Valley Care Medical Center (Livermore Campus) Downtown Livermore Business District Livermore High School Lawrence Livermore National Laboratories
In FY 2011, the Rapid operated nearly 15,490 annual revenue hours and 239,300 annual revenue miles. Ridership
This route averages 9.5 passengers per hour, based on LAVTA FY 2011 operating data. A total of 776 passenger boardings were recorded by survey staff on the Westbound Rapid and 706 passenger boardings were recorded on the Eastbound Rapid. Boardings by Trip
Boardings on route 30/R have very clear peaks during commute hours. Boardings peaked at the 3:00 PM hour with 121 boardings. Ridership was also high during the 7:00 AM hour with 108 boardings. Chart 20. Rapid Weekday Boardings by Time of Day
0
20
40
60
80
100
120
140
Boardings
Time

LAVTA Short Range Transit Plan FY2012-FY2021 83
Top Boarding & Alighting Locations
Top boarding and alighting locations on the Rapid occurred at Dublin/Pleasanton BART station and Railroad Avenue at Maple Signature Stop/Bankhead Theater. Table 19. Route 30/R Westbound Weekday Top Boarding & Alighting Locations
Street Cross Street Total Activity
East Dublin/Pleasanton BART 431
Railroad Avenue Maple Signature Stop 168
Dublin Boulevard Golden Gate WB 104
Stanley Valley Med WB 101
Table 20. Route 30/R Eastbound Weekday Top Boarding & Alighting Locations
Street Cross Street Total Activity
East Dublin/Pleasanton BART 386
Railroad Avenue Bankhead Theater 147
Dublin Boulevard Regional St. 102
Stoneridge Mall 88
Figures 5-29 and 5-20 show the boarding and alighting by stop for the Rapid.

LAVTA Short Range Transit Plan FY2012-FY2021 84
Figure 5‐29. Rapid Weekday Boarding & Alighting by Stop West Half
Figure 5‐30. Rapid Weekday Boarding & Alighting by Stop East Half

LAVTA Short Range Transit Plan FY2012-FY2021 85
5.3.12 Route 53
Route 53 provides a link between the West Dublin/Pleasanton BART Station and the Alameda County Fairgrounds/ACE Train Station traveling primarily an express routing via I-680. The service operates three AM trips and three PM trips designed to meet the ACE Train. In FY 2011, route 53 operated nearly 1,290 annual revenue hours and 13,500 annual revenue miles. Ridership
This route averages 11.1 passengers per hour, based on LAVTA FY 2011 operating data. A total of 150 passenger boardings were recorded by survey staff on route 53 during the AM and PM service hours. Boardings by Trip
Boardings on route 53 AM were highest on the first trip, at 5:34 AM with 35 passengers. Route 53 PM ridership was fairly consistent, with between 21 and 24 passenger boardings per run. Chart 21. Route 53 Weekday Boardings by Time of Day
Top Boarding & Alighting Locations Top boarding and alighting locations on route 53 were primarily at the Pleasanton and Walnut Creek BART stations. See Figures 5-31 and 5-32 for boarding and alighting information by stop for route 53. Table 5‐21. Route 53 AM and PM Weekday Top Boarding & Alighting Locations
Street Cross Street Total Activity
West Dublin/Pleasanton BART 104
ACE Rail Station 153
Stoneridge Mall 33

LAVTA Short Range Transit Plan FY2012-FY2021 86
Figure 5‐31. Route 53 Weekday Boarding & Alighting by Stop (AM)
Figure 5‐32 Route 53 Weekday Boarding & Alighting by Stop (PM)

LAVTA Short Range Transit Plan FY2012-FY2021 87
5.3.13 Route 54 Route 54 provides a connection from the ACE Train Station to the Dublin/Pleasanton BART Station via Hacienda Business Park, where it circulates. The service operates three AM trips and three PM trips designed to meet the ACE Train. In FY 2011, route 54 operated nearly 1,340 annual revenue hours and 18,700 annual revenue miles. Ridership
This route averages 24.7 passengers per hour, based on LAVTA FY 2011 operating data, making it the best performing route designed to serve the general public. A total of 95 passenger boardings were recorded by survey staff on route 54 during the AM and PM service hours. Boardings by Trip
Boardings on route 54 AM were highest on the second trip, at 6:49 AM with 25 passengers. Route 54 PM ridership was fairly consistent, with between 16 and 20 passenger per run.
Chart 22. Route 54 Weekday Boardings by Trip
Top Boarding & Alighting Locations
The single location with the highest number of boardings and alightings was the ACE Rail Station. See Figures 5-33 and 5-34 for boarding and alighting data by stop. Table 22. Route 54 AM and PM Weekday Top Boarding & Alighting Locations
Street Cross Street Total Activity
ACE Rail Station 153
Dublin/Pleasanton BART 13
Gibraltar Willow 12
Las Positas Willow 11

LAVTA Short Range Transit Plan FY2012-FY2021 88
Figure 5‐33. Route 54 Weekday Boarding & Alighting by Stop (AM)
Figure 5‐34. Route 54 Weekday Boarding & Alighting by Stop (PM)

LAVTA Short Range Transit Plan FY2012-FY2021 89
5.3.14 Route 70 Route 70 is an express route operating between BART stations at Pleasant Hill, Walnut Creek, and Dublin/Pleasanton. It interlines to/from route 9, effectively serving local streets in the Hacienda Business Park in Pleasanton. Service is peak-period only, on 30-minute headways. A “V” pattern was introduced in the summer of 2009, providing two daily trips directly to/from the Stoneridge Mall area. In FY 2011, route 70 operated nearly 4,460 annual revenue hours and 115,400 annual revenue miles. Ridership
This route averages 9.5 passengers per hour, based on LAVTA FY 2011 operating data. A total of 178 passenger boardings were recorded by survey staff on route 70 during the AM and PM service hours.
Boardings by Trip
Boardings on route 70 AM were highest at 6:47 AM with 33 passengers. Route 70 PM peaked at 4:28 PM and 4:58 PM with 17 passenger boardings on both runs. Chart 23. Route 70AM Weekday Boardings by Trip
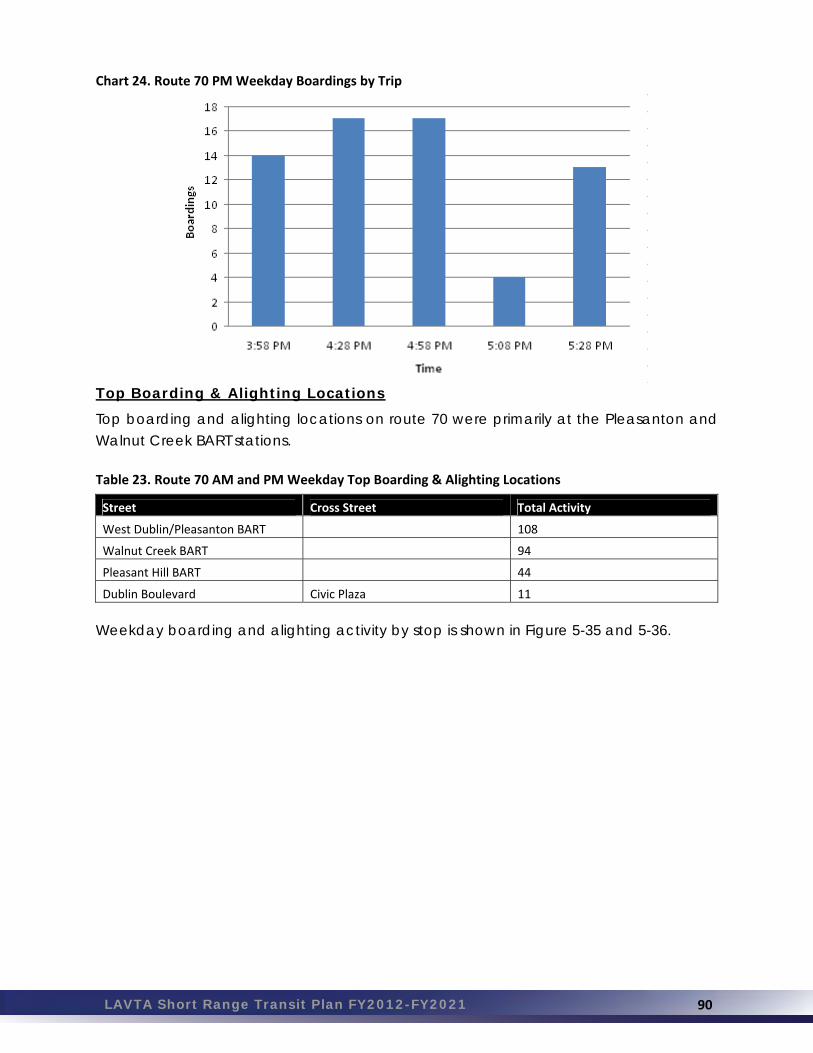
LAVTA Short Range Transit Plan FY2012-FY2021 90
Chart 24. Route 70 PM Weekday Boardings by Trip
Top Boarding & Alighting Locations
Top boarding and alighting locations on route 70 were primarily at the Pleasanton and Walnut Creek BART stations. Table 23. Route 70 AM and PM Weekday Top Boarding & Alighting Locations
Street Cross Street Total Activity
West Dublin/Pleasanton BART 108
Walnut Creek BART 94
Pleasant Hill BART 44
Dublin Boulevard Civic Plaza 11
Weekday boarding and alighting activity by stop is shown in Figure 5-35 and 5-36.

LAVTA Short Range Transit Plan FY2012-FY2021 91
Figure 5‐35. Route 70 AM Weekday Boarding & Alighting by Stop
Figure 5‐36. Route 70 PM Clockwise Weekday Boarding & Alighting by Stop

LAVTA Short Range Transit Plan FY2012-FY2021 92
5.3.14 Summary Wheels ridership declined in each of the past three fiscal years, leading to an increased cost per passenger and an overall declining number of passengers per hour. The farebox recovery ratio decreased from 18.2% to 17.7% and the average fare per passenger increased from $1.06 in FY 2009 to $1.20 in FY 2011 due to a fare increase in FY 2010. Overall ridership increased since 2007, but dipped significantly in FY 2010 due to service cuts, a fare increase, and the general state of the economy. Vehicle service hours declined in 2010, but were up slightly in 2011 with the introduction of the new Rapid service. 5.4 DIAL A RIDE SYSTEM PERFORMANCE
Operating statistics such as operating cost, ridership, and service hours were compiled over the last three fiscal years to assess the performance of LAVTA’s Dial-A-Ride service. Dial-A-Ride operations have generally experienced declining ridership and increased costs since the Great Recession. Table 5‐24. Dial‐A‐Ride Operating Statistics
FY 2009 FY 2010 FY 2011
Operating Cost $1,882,773 $1,766,628 $1,719,889
Annual Change ‐6.2% ‐2.6%
Vehicle Service Hours 29,742 24,551 22,350
Annual Change ‐17.5% ‐9.0%
Vehicle Service Miles 382,848 347,357 312,903
Annual Change ‐9.3% ‐9.9%
Annual Ridership 67,070 61,619 56,795
Annual Change ‐8.1% ‐7.8%
Farebox Revenue $245,054 $222,500 $187,426
Annual Change ‐9.2% ‐15.8%
Operating Cost per Service Hour $63.30 $71.96 $76.95
Annual Change 13.7% 6.9%
Operating Cost per Passenger $28.07 $28.67 $30.28
Annual Change 2.1% 5.6%
Passengers per Service Hour 2.3 2.5 2.5
Annual Change 11.3% 1.2%
Subsidy per passenger $24.42 $25.06 $26.98
Annual Change 2.6% 7.7%
Average Fare per Passenger $3.65 $3.61 $3.30
Annual Change ‐1.2% ‐8.6%
Farebox Recovery Ratio 13.0% 12.6% 10.9%
Annual Change ‐3.2% ‐13.5% * Operating data for FY 2009, FY 2010, and FY 2011 provided by LAVTA and CAFR Reports; Operating Cost excludes
depreciation and Farebox Revenue includes Special Contract Revenue

LAVTA Short Range Transit Plan FY2012-FY2021 93
The operating statistics reported in Table 5-24 represent the service performance under MV Transportation in FY2009-2011. Starting July 1, 2011, ALC began operating the Dial-A-Ride service. In the first year of operation, the operating cost per trip was $25.00, a 17.4% reduction when compared to FY2011’s $30.28. The performance results of the Dial-A-Ride service under ALC are much anticipated over the next three years.
5.4.1 On Time Performance The current contract agreement between LAVTA and ALC includes an on-time performance standard of 95% or greater. On-time performance is based on drivers indicating via their GPS devices when they arrive at a designated location. According to ALC’s records, the most recent on-time performance data, for FY2012, is shown in Table 5-25. Table 5‐25. FY2012 Dial‐A‐Ride On‐Time Performance Data
Month On Time
Performance
July 91.6%
August 94.1%
September 92.7%
October 96.6%
November 96.1%
December 95.6%
January 94.1%
February 93.5%
March 94.3%
April 92.0%
May 91.0%
June 90.0%
FY11 Average 93.5%
While these percentages indicate the ALC only met the performance standard during three months in the past year, overall the percentages are reasonable based on industry standards.

LAVTA Short Range Transit Plan FY2012-FY2021 94
5.4.2 Annual Ridership Dial-A-Ride ridership decreased steadily during the period of FY2009 to FY2011, from approximately 67,000 to 57,000 annual passenger trips. Between FY2009 to FY2012, the number of trips taken by registrants fell from 55,000 to 41,000, or a decline of 25%. These trends follow the same declining trend as shown with the fixed route service and can partially be explained as fallout from the Great Recession. Dial-A-Ride service is significantly more expensive per passenger than fixed-route service, any decrease in Dial-A-Ride ridership is viewed positively from an operations perspective. While the number of passengers decreased in the last three years, historically, looking at the last ten years, paratransit ridership has increased by more than 100%. Potential explanation for this decline could be due to a number of factors, such as:
Prior to FY2012, ridership from the Livermore Senior Housing Shopping Shuttles was included (about 2,000 annual trips).
Tri-Valley Senior Support Services Volunteer Driver Program ridership has been increasing (but, in fact, the increase has been very minimal, from 1,913 to 2,013 between FY2011 and FY2012).
Para-Taxi program ridership has been increasing (from 609 trips in FY2011 to 1,236 rides in FY2012).
There has been a decrease in day programs provided by social service agencies, resulting in less demand.
The Dial-A-Ride ticket price has increased (the fare increased from $3 to $3.50 in March 2009, so likely did not have a significant impact in the past two years).
While it is likely that these factors have influenced the decrease in ridership during the past four years, determining by how much is unknown. Figure 5-37 shows the annual paratransit ridership over the past three fiscal years and Figure 5-38 demonstrates the historical ridership since 1989.

LAVTA Short Range Transit Plan FY2012-FY2021 95
Figure 5‐37. Three Year Annual Ridership
67,070
61,61956,795
0
10,000
20,000
30,000
40,000
50,000
60,000
70,000
80,000
90,000
100,000
2009 2010 2011Fiscal Year
An
nu
al R
ider
ship
Figure 5‐38. Annual Paratransit Ridership 1989‐2012
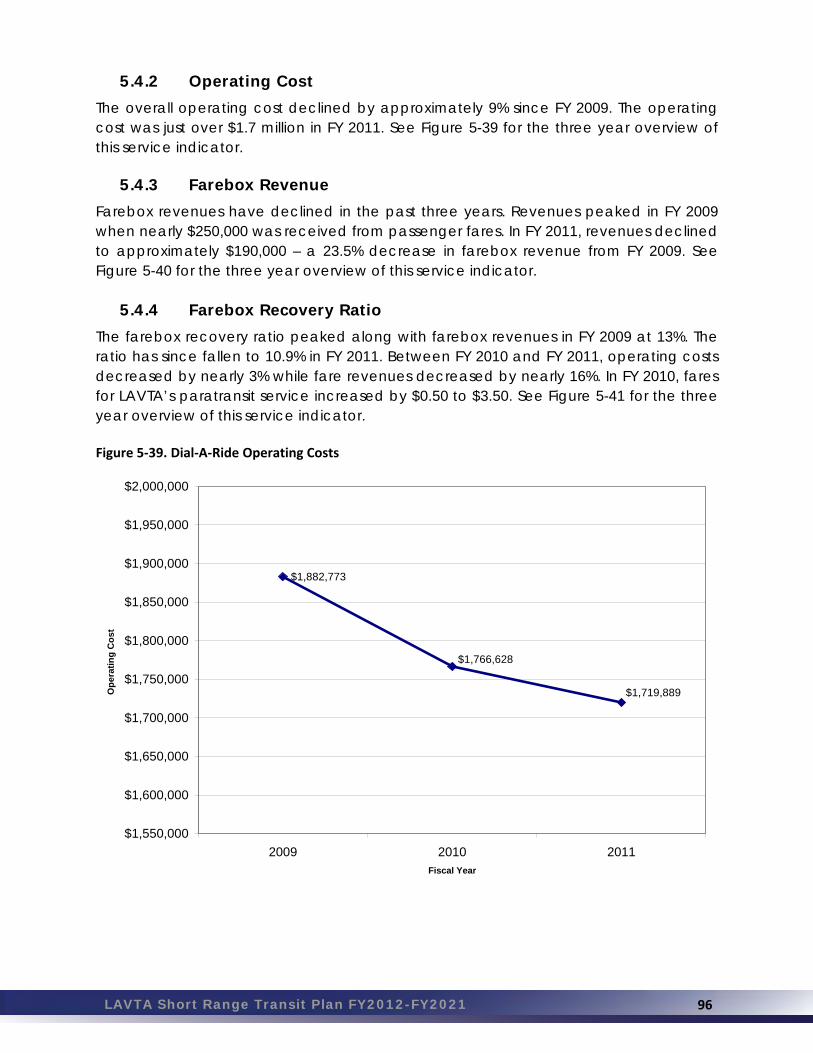
LAVTA Short Range Transit Plan FY2012-FY2021 96
5.4.2 Operating Cost
The overall operating cost declined by approximately 9% since FY 2009. The operating cost was just over $1.7 million in FY 2011. See Figure 5-39 for the three year overview of this service indicator.
5.4.3 Farebox Revenue
Farebox revenues have declined in the past three years. Revenues peaked in FY 2009 when nearly $250,000 was received from passenger fares. In FY 2011, revenues declined to approximately $190,000 – a 23.5% decrease in farebox revenue from FY 2009. See Figure 5-40 for the three year overview of this service indicator.
5.4.4 Farebox Recovery Ratio
The farebox recovery ratio peaked along with farebox revenues in FY 2009 at 13%. The ratio has since fallen to 10.9% in FY 2011. Between FY 2010 and FY 2011, operating costs decreased by nearly 3% while fare revenues decreased by nearly 16%. In FY 2010, fares for LAVTA’s paratransit service increased by $0.50 to $3.50. See Figure 5-41 for the three year overview of this service indicator. Figure 5‐39. Dial‐A‐Ride Operating Costs
$1,882,773
$1,766,628
$1,719,889
$1,550,000
$1,600,000
$1,650,000
$1,700,000
$1,750,000
$1,800,000
$1,850,000
$1,900,000
$1,950,000
$2,000,000
2009 2010 2011Fiscal Year
Op
erat
ing
Co
st

LAVTA Short Range Transit Plan FY2012-FY2021 97
Figure 5‐40. Dial‐A‐Ride Farebox Revenue
$245,054
$222,500
$187,426
$0
$50,000
$100,000
$150,000
$200,000
$250,000
$300,000
$350,000
$400,000
2009 2010 2011Fiscal Year
Far
ebo
x R
even
ue
Figure 5‐41. Dial‐A‐Ride Farebox Recovery Ratio
13.0% 12.6%
10.9%
0.0%
2.0%
4.0%
6.0%
8.0%
10.0%
12.0%
14.0%
16.0%
18.0%
20.0%
2009 2010 2011Fiscal Year
Far
ebo
x R
eco
very
Rat
io

LAVTA Short Range Transit Plan FY2012-FY2021 98
5.4.5 Passengers per Revenue Hour
The number of passengers carried per revenue hour has increased each of the last three years. This is partially due to service hours decreasing at a faster rate than ridership has increased. In FY 2010, vehicle service hours decreased by 17.5% while ridership declined by only 8%. This resulted in an 11% increase in passengers per hour to 2.51 in FY 2010. In FY 2011, Dial-A-Ride averaged 2.54 passengers per revenue hour. See Figure 5-42 for the three year overview of this service indicator.
5.4.6 Operating Cost Per Passenger
Operating cost per passenger is up 8% since FY 2009. Operating costs per passenger increased by nearly 6% during FY 2011, due to a nearly 3% drop in costs and an 8% ridership decline (with a corresponding reduction in service levels). In FY 2011, operating costs were more than $30 per passenger. The current operating cost per trip is approximately $28.50 under the ALC business model. Additionally, the reduction in fleet maintenance costs is not reflected in the operational cost. See Figure 5-43 for the three year overview of this service indicator.
5.4.7 Operating Cost Per Service Hour
Operating cost per service hour has been increasing steadily over the past three years. Operating cost per revenue service hour increased by 22%, from $63.30 to nearly $77.00 between FY 2009 and FY 2011. This large increase is due mostly to a 25% decrease in vehicle service hours, while operating costs decreased by only 9% during the same period. See Figure 5-44 for the three year overview of this service indicator. The cost per hour is no longer relevant for the current contract in FY12 due to the different operating model, as service hours are not dedicated to the program and no meaningful comparison can be made.
5.4.8 Subsidy per Passenger
The subsidy per passenger has increased slightly in the last three fiscal years. The measure increased at its greatest rate in FY 2011, by 7.7% to $26.98 per passenger. See Figure 5-45 for the three year overview of this service indicator.
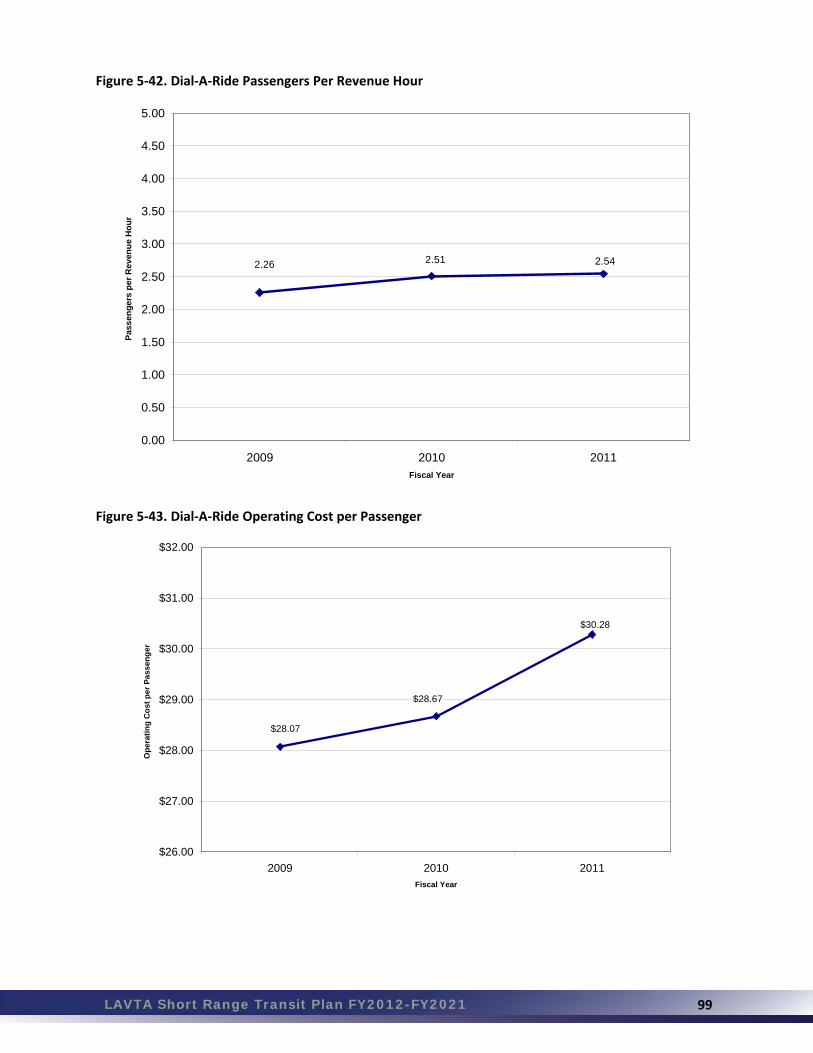
LAVTA Short Range Transit Plan FY2012-FY2021 99
Figure 5‐42. Dial‐A‐Ride Passengers Per Revenue Hour
2.26 2.51 2.54
0.00
0.50
1.00
1.50
2.00
2.50
3.00
3.50
4.00
4.50
5.00
2009 2010 2011Fiscal Year
Pas
sen
ge
rs p
er
Rev
enu
e H
ou
r
Figure 5‐43. Dial‐A‐Ride Operating Cost per Passenger
$28.07
$28.67
$30.28
$26.00
$27.00
$28.00
$29.00
$30.00
$31.00
$32.00
2009 2010 2011Fiscal Year
Op
erat
ing
Co
st p
er P
ass
eng
er

LAVTA Short Range Transit Plan FY2012-FY2021 100
Figure 5‐44. Dial‐A‐Ride Operating Cost per Service Hour
$63.30
$71.96
$76.95
$0.00
$10.00
$20.00
$30.00
$40.00
$50.00
$60.00
$70.00
$80.00
$90.00
$100.00
2009 2010 2011Fiscal Year
Op
erat
ing
Co
st p
er R
even
ue
Ho
ur
Figure 5‐45. Dial‐A‐Ride Subsidy Per Passenger
$24.42 $25.06
$26.98
$0.00
$5.00
$10.00
$15.00
$20.00
$25.00
$30.00
$35.00
$40.00
2009 2010 2011Fiscal Year
Su
bsi
dy
per
Pas
sen
ger

LAVTA Short Range Transit Plan FY2012-FY2021 101
5.4.9 Trip Origins and Destinations
Figure 5-46 illustrates the most frequent trip origins and destinations, based on a sample of Dial-A-Ride trips taken during one week, between June 11 and June 17. To give a sense of trips taken on a single weekday, trips for Wednesday, June 13 are highlighted in orange. The top five destinations are the Dublin/Pleasanton BART Station, Vocational Development services for ARC of Alameda County on Rutan Drive; 3201 Doolan Road., Livermore; Stoneridge Mall; and the VA Medical Center. Other key destinations include community centers, shopping centers, and apartment complexes. It should be noted that many of the boardings and alightings are at locations that are either on or are adjacent to fixed routes. Figure 5‐46. Dial‐A‐Ride Trip Origins and Destinations
5.4.10 Summary
In the last three years there were major reductions in vehicle service hours and vehicle service miles; however Dial-A-Ride costs have not decreased proportionally. These factors led to the decision for LAVTA to try a new business model or contractor for the paratransit service. Starting July 1, 2011, ALC began operating the Dial-A-Ride service.
LAVTA Short Range Transit Plan FY2012-FY2021 102
In the first year of operation, the operating cost per trip was $25.00 and in the second year of operation, the operating cost per trip was $25.50. The performance results of the Dial-A-Ride service under ALC are much anticipated over the next three years. 5.5 GENERAL ISSUES
Other service evaluation considerations are discussed in the following sections, including LAVTA’s involvement in MTC’s Community Based Transportation Planning (CBTP) program, a review of the most recent Title VI report, and the FY 20102 FTA Triennial Review.
5.5.1 Community-Based Transportation Planning Program
MTC’s Lifeline Transportation Program supports projects that address mobility and accessibility needs in low-income communities throughout the region. The program is funded by a combination of federal and state operating and capital funding sources, including the Federal Transit Administration’s Jobs Access and Reverse Commute Program, and state Proposition 1B Transit Capital and State Transit Assistance programs. LAVTA currently does not have any local CBTP or welfare-to-work programs. The Dial-A-Ride scholarship is funded by 1B GAP funds; all the other low-income projects receive lifeline funding. Lifeline funded projects include Bus Stop Improvements, route 14, and Civic Center Driveway Improvements.
5.5.2 Title VI
LAVTA operates its services without regard to race, color, and national origin in accordance with Title VI of the Civil Rights Act. LAVTA’s June 2012 Title VI Report was updated to be consistent with the guidelines set forth in FTA Circular 4702.1A (dated May 13, 2007). LAVTA’s Title VI compliance describes the activities specifically undertaken to ensure broad participation and access to the process by minority, low-income, non-English speaking and other underrepresented populations. LAVTA has had one Title VI complaint since the last title VI submission. The complaint was filed by a woman who resides in Oakland CA. She filed a Title VI complaint on March 28, 2012 alleging she was the victim of discrimination based on her color/race on March 27, 2012. After performing an investigation into her complaint, LAVTA concluded that there was no evidence of any racial discrimination directed against the passenger. The driver had followed standard operating procedures. The passenger is currently preparing an appeal to the final investigations report. This Title VI complaint is still in the process of settlement.
5.5.3 FTA Triennial Review
The FTA Triennial Review of LAVTA’s compliance with federal requirements was determined by the examination of grant management practices and program implementation. The last triennial review for LAVTA's transit services considered fiscal years 2009, 2010, and 2011. The Triennial Review determined that there were no deficiencies in accordance with FTA requirements in 21 of the 24 areas reviewed.
LAVTA Short Range Transit Plan FY2012-FY2021 103
Deficiencies were identified in Disadvantaged Business Enterprise and the Drug and Alcohol Program. In addition, one advisory comment was made in the Safety and Security area. In response to the review, the following corrective actions have been taken:
LAVTA submitted to FTA Reviewer and received approval of procedures to evaluation good faith efforts and to maintain documentation of evaluation in procurement files.
LAVTA submitted to FTA Reviewer and received approval of revised contract clause addressing prompt return of retainage.
LAVTA submitted to FTA Reviewer and received approval of analysis of why DBE awards were less than overall goal.
LAVTA submitted to FTA Reviewer and received approval of badge procedure for visitors to control access to facilities. Employees and contractors are issued permanent badges.
LAVTA submitted to FTA Reviewer and received approval of revised American Logistics Company (ALC) Drug and Alcohol Policy with documentation that it has been approved by the ALC governing board. ALC also confirmed via email that this policy has been communicated to all affected employees.
5.5.4 Environmental Justice
To ensure that service and fare changes are not disproportionately impacting and populations of people within the LAVTA service area, extensive public outreach is performed prior to any major service change or fare increase. In addition, an equity analysis is performed to ensure that there are no disproportionate impacts to any populations of concern. As an example of LAVTA’s commitment to ensuring that there no environmental justice impacts due to their actions, the outreach and involvement process for the last service change, effective August 25, 2012, is provided. LAVTA’s public outreach and involvement process included four workshops at various locations in the Tri‐Valley area and a public meeting at a LAVTA Board meeting. All venues were ADA accessible and translators were available with advance notification. To advertise these events, flyers were posted in the communities and overhead car cards were displayed in the buses the weeks before the meetings. Information for the service changes was available in English and Spanish on the LAVTA website and via press releases. LAVTA received input regarding the proposed service changes from the community, including riders and other community stakeholders. In addition, comments from the Wheels bus drivers were also received. Taking into consideration the input received as well as operational and cost impacts, LAVTA proposed the service route changes. A service equity analysis was performed ensuring that the route changes did not disproportionately impact or favor any group. It was found that the changes within
LAVTA Short Range Transit Plan FY2012-FY2021 104
areas of concern had positive benefits or were operational efficiencies that had no net impact on the surrounding community. In addition, an analysis under the California Environmental Quality Act (CEQA) also ensures that there are no impacts on the grounds of environmental justice. The service changes were presented to the Board of Directors on June 4, 2012. As a public meeting, public comment on the service changes could again be taken before vote and adoption. Once approved, extensive outreach to notify the community of the change was implemented to ensure a smooth transition.

LAVTA Short Range Transit Plan FY2012-FY2021 105
Operations Plans
6.1 FIXED ROUTE SERVICE DESIGN GUIDELINES
It is important to consider for a moment some of the basic design guidelines that serve as the foundation for almost every transit service plan, whether for a small rural town with 10,000 people or major city with over 8 million. LAVTA strives to serve as many residents, workers, and visitors as it can within the confines of the resources it has available. At the same time, it needs to serve a wide variety of riders, trip types, and demands, many of which conflict with each other. For example, most riders want fast service, but many also want lots of bus stops so that the distance they have to walk to/from a destination is minimized. Having lots of stops improves access to the transit system but it also slows down the routes. These two desires are in direct conflict with each other. Service elements that might attract one type of rider to transit can drive other riders away. LAVTA must balance these types of competing demands. As the Wheels system grows over the next twenty years, it is possible that LAVTA will use different types of services, such as Rapid Bus, Local Bus, Limited Stop, and Deviated Fixed Route. These services are intended to meet the basic needs of residents who cannot drive as well as to provide compellingly options to those who can drive. For both types of riders—and those in between—there are certain service design principles that will improve service for nearly all riders.
6.1.1 Service Should Be Simple
Service should be designed so that it is easy to understand. In this way, potential riders can learn about the options that are available to take them where and when they want to go without experiencing frustration and problems. At the core of the transit planner’s tool box is an approach that seeks to make all services intuitive, logical, and easy to understand.
6.1.2 Routes Should Operate Along a Direct Path
The fewer directional changes a route makes, the easier it is to understand. Conversely, circuitous alignments are disorienting and difficult to remember. Routes should not deviate from the most direct alignment unless there is a compelling reason.
6.1.3 Route Deviations Should be Minimized
The use of route deviations—the deviation of service off of the most direct route—should be minimized. However, there are many instances when the deviation of service off of the most direct route is appropriate. For example, a route may deviate off a straight corridor to provide service to major shopping centers, employment sites, and schools. In these cases, the benefits of operating the route off of the main route must be
Chapter 6

LAVTA Short Range Transit Plan FY2012-FY2021
Chapter 6
106
weighed against the inconvenience caused to passengers already on board who do not want to do to those activity centers. In most cases, where route deviations are provided, they should be provided on an all-day basis. Exceptions are during times when the sites that the route deviations serve have no activity. For example, route deviations to shopping centers do not need to serve those locations before the commute time for the employees working there.
6.1.4 Routes Should be Symmetrical
Routes should operate along the same alignment in both directions, making it easy for riders to know how to get back to where they came from.
6.1.5 Routes Should Serve Well-Defined Markets
Service should be developed to serve clearly defined markets. Ideally, major corridors should be served by only one route of each route type. For example, one radial route and one express route would suffice;.multiple radial routes and multiple express routes would be redundant. However, exceptions can and should be made when multiple routes should logically operate through the same corridor to unique destinations.
6.1.6 Major Transit Routes Should Operate Along Arterials
Potential transit users have at least a basic knowledge of an area’s arterial road system and use that knowledge as points of reference. The operation of bus service along arterials therefore makes transit service easier to figure out and to use. It also makes service faster.
6.1.7 Service Should be Consistent
People can easily remember repeating patterns but have difficulty remembering irregular sequences. For this reason, routes should operate along consistent alignments and at regular intervals (headways).
6.1.8 Stops Should be Spaced Appropriately
Transit stops are the access and egress points for transit services and should be conveniently located. However, transit stops are also the major reason that transit service is slower than automobile trips. Since most riders want service that balances convenience and speed, the number and location of stops is a key component of determining that balance. Services that emphasize speed (for example, Rapid Service routes) should have fewer stops, while service that emphasizes accessibility (for example, Lifeline routes) should have more frequent stops.
6.1.9 Transit Options Should Match Land Use
In thinking about the long term options for transit in the Tri-Valley, it is important to be realistic. In many communities, public transit advocates can become nostalgic about rail service and enamored with certain modes like Streetcars or Light Rail, even if these modes are not good choices given the land use patterns. The type of transit service

LAVTA Short Range Transit Plan FY2012-FY2021
Chapter 6
107
implemented by an agency should be directly related to the type of development it will serve. Experience has repeatedly demonstrated that there is a direct correlation between the density of development (residential, retail, commercial and industrial) and the willingness of people in those areas to use transit service. Transit must be designed to address the realistic demand in each area and it must do so in a manner which is cost effective. For example, it is certainly possible to build a Light Rail Line in a small city of 40,000 people and then use it to connect neighborhoods or districts with 2,000 people per area, but most planning agencies would not consider this scenario because the service would never be cost effective given the operating and capital cost per passenger per mile. It simply would not make sense. Figure 6-1 presents the generally accepted relationship between land use density and transit service type. Figure 6‐1. Relationship Between Land Use and Type of Service
6.2 FIXED ROUTE SERVICE PLAN
6.2.1 Imminently Anticipated Service Changes
As of July 2012, a round of schedule and service revisions had been approved for implementation in August as part of the fall 2012 signup and school starts. Although quite a few revisions were made, the implementation was close to cost neutral, with less than a one-percent increase in overall service hours. Among the items approved were:
Mainline and school tripper geographic expansion in east Dublin
Direction reversal for route 3
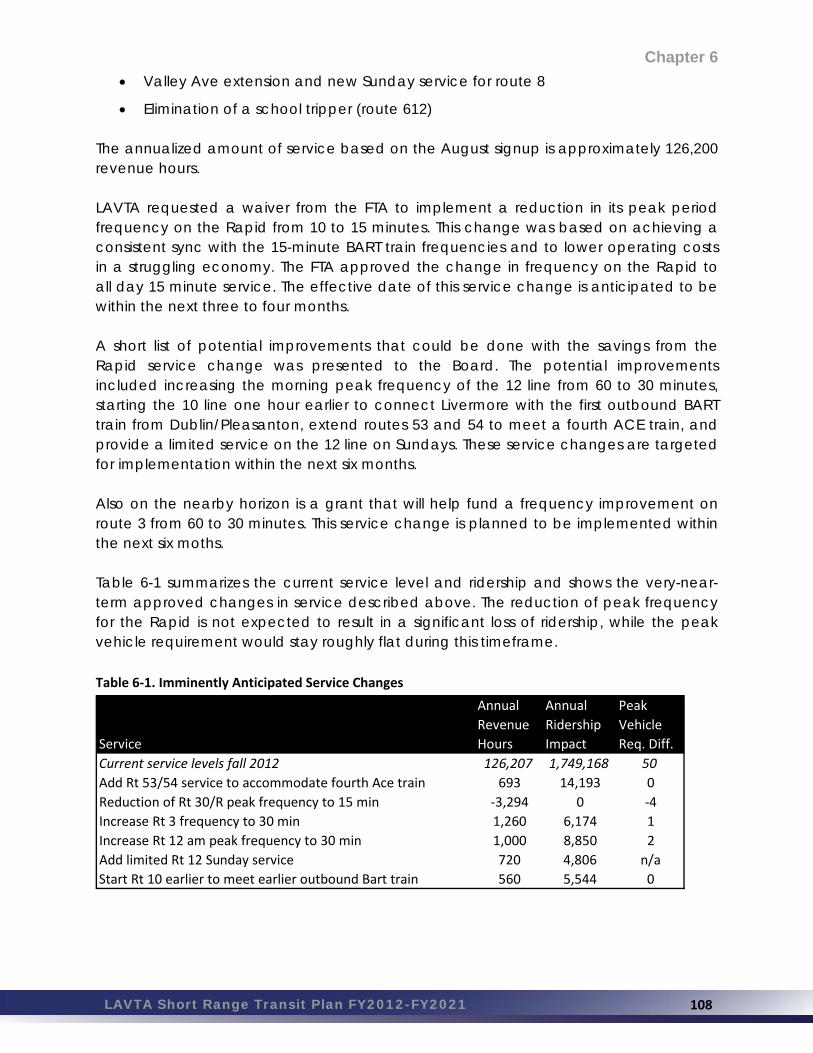
LAVTA Short Range Transit Plan FY2012-FY2021
Chapter 6
108
Valley Ave extension and new Sunday service for route 8
Elimination of a school tripper (route 612) The annualized amount of service based on the August signup is approximately 126,200 revenue hours. LAVTA requested a waiver from the FTA to implement a reduction in its peak period frequency on the Rapid from 10 to 15 minutes. This change was based on achieving a consistent sync with the 15-minute BART train frequencies and to lower operating costs in a struggling economy. The FTA approved the change in frequency on the Rapid to all day 15 minute service. The effective date of this service change is anticipated to be within the next three to four months. A short list of potential improvements that could be done with the savings from the Rapid service change was presented to the Board. The potential improvements included increasing the morning peak frequency of the 12 line from 60 to 30 minutes, starting the 10 line one hour earlier to connect Livermore with the first outbound BART train from Dublin/Pleasanton, extend routes 53 and 54 to meet a fourth ACE train, and provide a limited service on the 12 line on Sundays. These service changes are targeted for implementation within the next six months. Also on the nearby horizon is a grant that will help fund a frequency improvement on route 3 from 60 to 30 minutes. This service change is planned to be implemented within the next six moths. Table 6-1 summarizes the current service level and ridership and shows the very-near-term approved changes in service described above. The reduction of peak frequency for the Rapid is not expected to result in a significant loss of ridership, while the peak vehicle requirement would stay roughly flat during this timeframe. Table 6‐1. Imminently Anticipated Service Changes
Service
Annual
Revenue
Hours
Annual
Ridership
Impact
Peak
Vehicle
Req. Diff.
Current service levels fall 2012 126,207 1,749,168 50
Add Rt 53/54 service to accommodate fourth Ace train 693 14,193 0
Reduction of Rt 30/R peak frequency to 15 min ‐3,294 0 ‐4
Increase Rt 3 frequency to 30 min 1,260 6,174 1
Increase Rt 12 am peak frequency to 30 min 1,000 8,850 2
Add limited Rt 12 Sunday service 720 4,806 n/a
Start Rt 10 earlier to meet earlier outbound Bart train 560 5,544 0

LAVTA Short Range Transit Plan FY2012-FY2021
Chapter 6
109
6.2.2 Intermunicipal Service Plan
The spine of the Wheels service network consists of the east-west intermunicipal trunk routes that connect the three suburban municipalities of Dublin, Pleasanton, and Livermore, the 10, Rapid, and 12. The most recent major change this corridor was the addition of the new skip-stop Rapid line that serves primarily Livermore and Dublin. The backbone route 10 continues to be of major importance in the corridor, providing local underlay service along portions of the Rapid alignment, as well as supplementing service to the corridor when the Rapid is not operating. The 12 line also carries substantial ridership traveling between Livermore and Dublin via Las Positas College. The Rapid has struggled to meet the ridership levels expected from a route with a high level of service. In the near term, LAVTA has focused on marketing the benefits of the route and optimizing Rapid stop locations. In the medium- to long term, a number of options may exist that would allow the agency to better align the Rapid line or its hours to yield higher ridership opportunities. Intermunicipal Service Alternatives
Re-alignment of the Rapid to Las Positas College (Alternative 1)
One alternative would be to modify the Rapid’s existing alignment to include Las Positas College, a ridership generator that is expected to continue growing over the next several years. In this scenario, the bus would travel from the Transit Center to Livermore Avenue and Portola Avenue instead of Railroad Avenue, and vice versa. At the same time, the local route 12 service to Las Positas College would be reduced to an hourly frequency all day, including during peak hours. This alternative would be estimated to, at the least, save about 2,500 revenue hours annually.
Re-alignment of the Rapid to Pleasanton/Integration with Route 10 (Alternative 2)
Another option would be to route the Rapid service more closely to the 10 alignment. This would require seeking a consensus with the City of Pleasanton regarding any option that would in deviate from the 10 alignment. At the conceptual level, if the new merged service would entail a minor reduction of bus stops in the corridor, a savings of approximately 13,000 revenue hours annually could be achieved.
Discussion
Under both alternatives, the 10 line would continue to be the local and trunk workhorse in its corridor. In the second alternative, more or full integration opportunities would exist. The efficiencies stemming from integration could be used to boost frequencies and/or use the savings to make other enhancements in the same corridor or in other productive corridors. Due to the high capital costs associated with making changes to the Rapid’s alignment, these alternatives would not be feasible in the near term. A short-term

LAVTA Short Range Transit Plan FY2012-FY2021
Chapter 6
110
consideration would be to make enhancements to route 10 depending on ridership trends and the agency’s finances.
Rapid Service Expansion
In the event that the Rapid’s ridership would start to show a substantial and sustained trend of increased ridership, 10-minute peak period frequency would be restored to the peak period, followed by adding Saturday and Sunday service. A phased build out could potentially include an eight-hour service span on Saturdays on a 15-20 minute frequency and a six-hour service span on Sundays on a similar frequency. In this scenario, weekend service on route 10 westbound would be terminated at the Dublin/Pleasanton BART station and not continue to the Stoneridge Mall during the operating hours of Rapid.
Route 10 Enhancements
Enhancements could include headway improvements on segments and at times that currently are on 30 minutes or less frequencies, as well as service span extensions. For the purposes of this plan, it is assumed that 5,000 annual revenue hours would be used toward route 10 improvements. Table 6-2 summarizes the items above for intermunicipal service. No changes in ridership and revenue hours have been estimated for the Rapid as a preferred alternative has not yet been identified. Options for route 12 are discussed under the Livermore Service heading.
Table 6‐2. Intermunicipal Service Plan
Service
Annual
Revenue
Hours
Annual
Ridership
Impact
Peak
Vehicle
Req. Diff.
Rt 30 / Rapid peak 10‐min frequency restoration 3,294 32,940 4
Rt 30 / Rapid Saturday service implementation 3,248 32,480 n/a
Rt 30 / Rapid Sunday service implementation 2,592 25,920 n/a
Rt 30 / Rapid alignment revision via College area (alt 1) ‐2,500 Unknown ‐2
Rt 30 / Rapid realignment via Pleasanton (Alt 2) ‐13,104 Unknown ‐6
Rt 10 Enhancements 5,000 50,000 2
6.2.3 Dublin Service Plan
Dublin is distinctly divided into an east and a west part, with an Army base situated in its middle. The western side is an older portion developed prior to the City’s incorporation in 1982, and consists mainly of low to medium-low density residential subdivisions with limited street network connectivity. The southern end of this area features automobile-oriented retail uses, with a mix of big-box stores, strip malls, and drive-thru restaurants. The best core transit opportunities in both eastern and western Dublin are in the commercial corridor along Dublin Boulevard which runs near the south perimeter of the

LAVTA Short Range Transit Plan FY2012-FY2021
Chapter 6
111
municipality. Other areas of the City are more suitable for local feeder routes providing low to moderate levels of service. Student ridership within the Wheels service in Dublin is moderate, but growing concurrent with new developments on the western side.
Dublin Alternatives
No major changes are envisioned for Dublin as the western half of the city is already largely “built out” and as LAVTA has recently expanded its service considerably in the western half.
Restructure Service to Santa Rita Jail
The City of Dublin considers service to the Santa Rita Correctional Facility (Jail) an important service to the community; hence the 1 line runs seven days a week on generous service spans and medium/high frequencies. Opportunities may exist to disconnect service to the Jail from the rest of the route 1 coverage into Pleasanton and possibly provide a shuttle or small bus service connection to BART for service to the Jail. Given the size of the vehicle, a contracted shuttle provider or a social service agency could be considered for the operation of this route. For the purposes of this plan, a modest saving of 1,300 revenue hours is assumed.
Expansion of Tripper Service to Shäfer Ranch
Since development of the previous SRTP, a new subdivision, Schäfer Ranch, has opened far to the western limits of LAVTA’s service area. It is unclear at this time what the student ridership potential there might be and is shown only as a placeholder item at this point. Table 6-3 summarizes the few items that are, or could be, planned for Dublin in the medium- to long term. Table 6‐3. Dublin Service Plan
Service
Annual
Revenue
Hours
Annual
Ridership
Impact
Peak
Vehicle
Req. Diff.
Restructure service to Santa Rita Jail ‐1,300 Unknown ‐1
Expand tripper service to Shäfer Ranch 250 5,000 1
6.2.4 Pleasanton Service Plan
Pleasanton is a suburban/metropolitan city with large office parks, regional retail, and low to medium density housing. A well-maintained, but small, historical downtown with a grid street network is surrounded by an auto oriented hierarchy of cul-de-sacs that feed into collector streets and arterial highways. Many areas within Pleasanton are not expected to substantially change in density or roadway circulation in any near future. Instead, development in Pleasanton is expected to occur in enclaves of opportunity
LAVTA Short Range Transit Plan FY2012-FY2021
Chapter 6
112
where there is either undeveloped land or existing land-uses that are economically and politically feasible to redevelop. There does not appear to be a need for any major route restructuring within the City of Pleasanton, but rather to optimize the existing service to ensure that productive corridors receive high levels of service and that other areas receive service to provide coverage and feed into the mainlines. Also, Pleasanton is expected to continue to be a big generator for middle and high school student ridership, a demand that is met largely with supplemental (school tripper) routes. Alternatives
Reduction of Service to Johnson Drive
The Johnson Drive area, which contains a mix of office, commercial, and hospitality uses has struggled to yield ridership for many years. If ridership does not recover in this area, Johnson Drive could be considered for a reduction in the number of total trips or even elimination of service altogether. A withdrawal of service on the Johnson loop would still leave its denser eastern portions accessible to route 8 along Hopyard Road, although the western would effectively be placed out of reach of transit service.
Simplify Vineyard - Kottinger Loop
The current service setup along the Vineyard - Kottinger loop is currently served by a variant of the 10 line, the 10V, during commute hours and by the 8 line at other times. There is a potential benefit to serve this area with a simple, direct route.
Linking Hacienda and Dublin Routes
In the Hacienda Business Park area, opportunities may exist to link or interline the existing route 9 with route 1.
Limited School Tripper Expansion
Most of the middle and high schools in Pleasanton are on Wheels mainlines; however, many of the neighborhoods where students live are not. As such, the current extensive network of eleven supplemental tripper lines will likely need to be maintained or expanded over the plan’s period. Currently, very few Pleasanton neighborhoods are without either mainline or school tripper coverage.
Eastern Pleasanton Specific Plan Development
Starting with the 2004 SRTP, the LAVTA short-range plans have contained a reference to service to eastern Pleasanton developments. This area is only now starting to develop, along with the roadway network in the area where Stoneridge Drive will connect with Jack London Boulevard at the widened I-580 interchange at El Charro Road. The type of land-uses on the Pleasanton side of this development area may not necessarily create a large new market for transit ridership. For budgeting purposes, a service with either two buses during peak periods or one bus running all-day service is assumed. A specific route design has not yet been developed, but could entail either a local or

LAVTA Short Range Transit Plan FY2012-FY2021
Chapter 6
113
intermunicipal setup; either should connect to other Wheels routes at the Dublin/Pleasanton BART station. LAVTA will work with City staff as this Plan develops. Table 6-4 summarizes the planned items for Pleasanton mentioned above. Table 6‐4. Pleasanton Service Plan
Service
Annual
Revenue
Hours
Annual
Ridership
Impact
Peak
Vehicle
Req. Diff.
Reduction of service to Johnson Dr area ‐1,170 ‐5,850 0
Simplification of service to Kottinger Park 0 Unknown 0
Connect / link Hacienda line with east Dublin line 0 Unknown 0
Limited school tripper expansion 250 5,000 0
Eastern Pleasanton Specifc Plan development 2,500 12,600 1
6.2.5 Livermore Service Plan
Although similar in density and street layout to Dublin and Pleasanton, Livermore is characterized less by employment and high-end retail than the other two cities in the LAVTA service area. A new terminal BART station is planned at the Isabel Avenue crossing of I-580 crossing. The BART to Livermore project will change the dynamics of the transit network in the region as well as provide development opportunities for housing and employment. Alternatives
Route 11 Coverage Optimization
Performance along First Street and the Livermore Industrial Park is extremely limited by the development patterns and levels of density. The role of this route should be determined and optimized accordingly. An alignment modification should be considered whereby the current routing north of I-580 is deleted in favor of expanding coverage to National Drive and/or Patterson Pass Road, using the route’s existing vehicle hours to do so.
Route 15 Alignment Adjustment Away From Springtown Boulevard
Route 15 a workhorse route and good performer in the Wheels route system. The bus stop-specific boarding data shown in Chapter 5 indicates Springtown Boulevard as a weak ridership segment of the 15 line. Given this fact, the route could likely be aligned away from that portion, and instead travel as a linear route on the Bluebell Drive/Heather Lane section.
Route 18 Service Level Adjustment
In the Granada area, route 18 is a legacy neighborhood route that has seen a substantial decline in ridership in recent years, and is currently one of the poorest performing routes in the Wheels system, despite being located along both Granada High School and Mendenhall Middle The role of the 18 line should be reconsidered and,

LAVTA Short Range Transit Plan FY2012-FY2021
Chapter 6
114
corresponding service modifications, ranging from adjusting the route’s geography and/or terminus to reducing its status and service levels to that of a school tripper, should be pursued. Another option would be to combine it with other local community routes to provide coverage of residential areas and the downtown.
Route 20 Potential Reallocation of Service to Springtown
On the eastern end of Livermore, route 11 provides a downtown connection, while route 20 offers an express service to/from the Dublin/Pleasanton BART station. These two routes serve primarily the modest-density light industrial and warehouse land uses in the area and carry relatively low ridership numbers. The utility of serving the LLNL has also diminished since September 11. These routes should be monitored and considered for revision in response to ridership levels and demand. The agency may want to explore the option of adding or re-routing trips to make them more direct. One option is to facilitate a more expeditious trip between the Springtown area and BART. A second option would be to re-purpose the route to serve the industrial area and BART more directly.
Realignment of Service Downtown to College
Prior to the recently implemented alignment revision for route 12 across the new I-580/Isabel interchange, various other options for further route restructuring were studied. Such options included, among others, routings away from Railroad Avenue and instead using Junction Avenue to and from the Transit Center, bypassing the Airway Business Park (where the LAVTA MOA facility is located), and having a new terminus at the new Paragon Outlets.
Review/Adjustment of Service Duplication Along Railroad Avenue
Due to the fact that so many of the retail and other activities in central Livermore are located along Railroad Avenue, all trunk routes that travel west of the Transit Center currently ply at least a few blocks of this road before branching out in their respective directions. Coverage differentiation or route combination opportunities may exist for some of the local service, including those of the 12 and 14 lines.
Springtown Service Frequency Improvements
Route 15 has been a consistent performer in the Wheels route network, with high loads on many of its trips throughout the day. As such, an improvement in frequencies on this route could benefit a large number of existing riders as well as stimulate additional ridership. Previous plans have outlined a desire to increase the peak period frequency to 15 minutes, up from the current 30 minutes. Other options may include restoring the midday and Saturday frequency from 60 to 30 minutes from the reduction that took place in 2009. Table 6-5 summarizes the planned and optional items for Livermore service.

LAVTA Short Range Transit Plan FY2012-FY2021
Chapter 6
115
Table 6‐5. Livermore Service Plan
Service
Annual
Revenue
Hours
Annual
Ridership
Impact
Peak
Vehicle
Req. Diff.
Rt 11 coverage optimization 0 0 0
Rt 15 alignment adjustment away from Springtown Blvd 0 Unknown 0
Rt 18 service level adjustment ‐1,300 ‐5,070 0
Rt 20 potential reallocation of service to Springtown 0 Unknown 0
Realignment of service downtown‐to‐College 0 Unknown 0
Review / adjust service duplication along Railroad Ave 0 Unknown ‐
Springtown service frequency improvements 2,500 25,000 2
6.2.6 Regional Service Plan
The LAVTA service area – although part of the nine-county San Francisco Bay Area and to a large extent functionally integrated with it – is geographically separated from many of its urban and suburban neighbors by the Dublin grade to the west of the Tri-Valley. On the north end, Dublin borders with San Ramon, which is a low-density, high-income community with somewhat similar characteristics to the Tri-Valley, while the areas to the south are largely mountainous and undeveloped. On the eastern end lies the Altamont ridge beyond which exurban bedroom communities are located, containing low development densities and few local concentrations of employment. The municipalities to the east of the Tri-Valley are located in San Joaquin County, which is outside of the nine-county MTC Bay Area defined region, and vary in development character, from bedroom communities such as Tracy to more established and urban cities such as Stockton. Some of the San Joaquin communities have an exurban relationship with the Bay Area, and have some limited existing transit services available that serve or pass through the LAVTA service area, including the ACE train line and a few bus routes offered by the San Joaquin RTD. These services, however, are limited. Alternatives
BART to Livermore Restructuring
A new terminal station at the Isabel Avenue crossing of I-580 will require a system-wide redesign of commuter services. Feeder routes to the Dublin/Pleasanton station would need to be redesigned to meet the new Livermore station. Community and corridor services would also need to be reevaluated to determine if their alignments and frequencies meet the travel demand patterns created by the new BART station. As a second phase, the BART to Livermore project provides an opportunity for the Wheels service to expand eastward.

LAVTA Short Range Transit Plan FY2012-FY2021
Chapter 6
116
Park and Ride Express
Early morning commuters drive in from the Central Valley and transfer to BART at the Dublin/Pleasanton BART stations. As demand for parking spaces increases, local residents are finding it hard to find available parking at the stations when they start their morning commute. Nearby park and ride lots provide additional parking resources, but need an efficient and reliable connection to the BART stations. One alternative in the near term could be a Park and Ride Express service between the Dublin/Pleasanton BART station, Tassajara Road Park and Ride lot, and Airway Boulevard Park and Ride lot. This service would utilize I-580 and on-ramp priority to quickly move commuters from their cars to BART. For estimation purposes, it is assumed that an express service would be started using a single bus, operating four roundtrips in the morning and four roundtrips in the afternoon commute periods. To increase the service to higher frequencies, a funding partnership would need to be identified as the service will benefit many transit operators. After the BART to Livermore extension is completed, this service could be restructured to stop at new park and ride locations to the east. Potential locations of new park and rides lots include Greenville Road and Vasco Road. Table 6-6 summarizes the regional route possibilities outlined above.
Table 6‐6. Regional Service Plan
Service
Annual
Revenue
Hours
Annual
Ridership
Impact
Peak
Vehicle
Req. Diff.
BART to Livermore Restructuring 1500‐3000 Unknown N/A
Park and Ride Express 1,250 12,500 1 6.2.7 Other Considerations
In addition to the specific local and regional services outlined above, LAVTA may want to implement miscellaneous additional improvements to the Wheels fixed route network, should its revenue outlook improve and ridership demand increase significantly at a future point. For the purposes of this planning document, 8,000 additional annual revenue hours are carried over illustratively for the potential use toward extending the hours and number of trips on select local and feeder routes, should ridership and development trends so warrant. Examples of possible uses of additional hours may include, but not be limited to:
15-minute peak frequency on route 12 Restoring midday service on routes 2 and/or 3 Expanding the operating hours of route 20 Improving weekend services
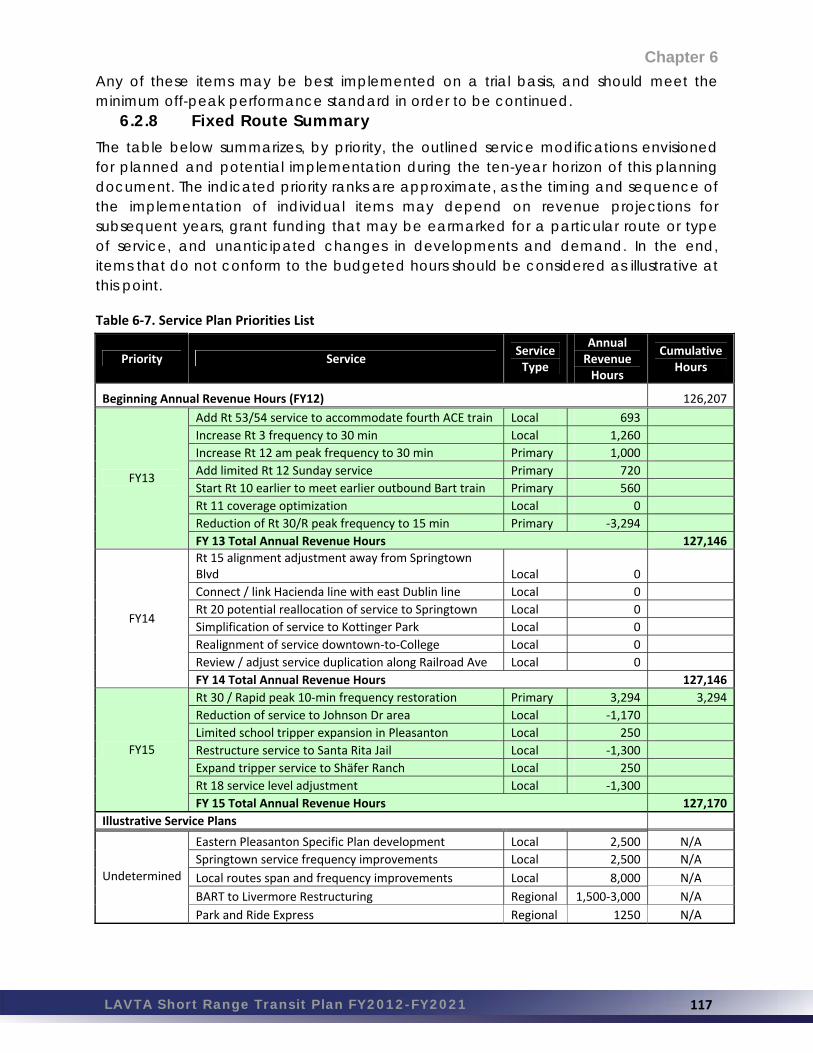
LAVTA Short Range Transit Plan FY2012-FY2021
Chapter 6
117
Any of these items may be best implemented on a trial basis, and should meet the minimum off-peak performance standard in order to be continued.
6.2.8 Fixed Route Summary
The table below summarizes, by priority, the outlined service modifications envisioned for planned and potential implementation during the ten-year horizon of this planning document. The indicated priority ranks are approximate, as the timing and sequence of the implementation of individual items may depend on revenue projections for subsequent years, grant funding that may be earmarked for a particular route or type of service, and unanticipated changes in developments and demand. In the end, items that do not conform to the budgeted hours should be considered as illustrative at this point.
Table 6‐7. Service Plan Priorities List
Priority Service Service Type
Annual Revenue Hours
Cumulative Hours
Beginning Annual Revenue Hours (FY12) 126,207
Add Rt 53/54 service to accommodate fourth ACE train Local 693
Increase Rt 3 frequency to 30 min Local 1,260
Increase Rt 12 am peak frequency to 30 min Primary 1,000
Add limited Rt 12 Sunday service Primary 720
Start Rt 10 earlier to meet earlier outbound Bart train Primary 560
Rt 11 coverage optimization Local 0
Reduction of Rt 30/R peak frequency to 15 min Primary ‐3,294
FY13
FY 13 Total Annual Revenue Hours 127,146
Rt 15 alignment adjustment away from Springtown Blvd Local 0
Connect / link Hacienda line with east Dublin line Local 0
Rt 20 potential reallocation of service to Springtown Local 0
Simplification of service to Kottinger Park Local 0
Realignment of service downtown‐to‐College Local 0
Review / adjust service duplication along Railroad Ave Local 0
FY14
FY 14 Total Annual Revenue Hours 127,146
Rt 30 / Rapid peak 10‐min frequency restoration Primary 3,294 3,294
Reduction of service to Johnson Dr area Local ‐1,170
Limited school tripper expansion in Pleasanton Local 250
Restructure service to Santa Rita Jail Local ‐1,300
Expand tripper service to Shäfer Ranch Local 250
Rt 18 service level adjustment Local ‐1,300
FY15
FY 15 Total Annual Revenue Hours 127,170
Illustrative Service Plans
Eastern Pleasanton Specific Plan development Local 2,500 N/A
Springtown service frequency improvements Local 2,500 N/A
Local routes span and frequency improvements Local 8,000 N/A
BART to Livermore Restructuring Regional 1,500‐3,000 N/A
Undetermined
Park and Ride Express Regional 1250 N/A
LAVTA Short Range Transit Plan FY2012-FY2021
Chapter 6
118
In the perspective of both current and past service levels, this plan is relatively conservative and plans for expansions in services to be offset by service efficiencies and re-alignments. Implementation of the entire plan list would bring the total revenue hours level to just above 148,500 annually from the current fall 2012 baseline of 126,000 hours. To place this in perspective, in the recent past, LAVTA operated 139,300 hours in FY2009, and as many as 140,600 hours in FY2002. 6.3 PARATRANSIT PLAN
6.3.1 Short – Term Dial-A-Ride Recommendations
Recommendations for Wheels Dial-A-Ride service are as follows:
An evaluation of the ALC model should be undertaken annually using measureable performance metrics that can be compared to the service under MV Transportation.
Evaluation of the ALC model should take into account the level of responsiveness of ALC management and the ability to have service issues addressed in a timely manner.
Opportunities for cost sharing with dialysis clinics whose patients receive ADA premium service should be explored. The basis for these negotiations can be the areas in which the service provided exceeds the ADA minimums in order to meet the needs of the clinics, such as provision of subscription service, narrower window for trip time negotiation, and narrower on-time performance parameters.
Add an online format and approval process in addition to the written application process for the Eligibility determination process.
Establish agreements with neighboring paratransit providers to provide one seat rides to medical facilities. For example, explore one seat rides to Kaiser in Walnut Creek or to Stanford Hospital in Palo Alto.
Improve the modes of gathering of feedback from customers.
Educate customers about LAVTA Dial-A-Ride policies.
Increase the marketing of Para-taxi, Scholarship, and Travel Training programs. 6.4 CONCLUSIONS
LAVTA has long provided an emphasis in its short- and long-range plans toward its transit-dependent population, something that is reflected in its extensive network of local and supplemental service, as well as off-peak service. Prior to implementing the items described above, LAVTA will conduct a service analysis in accordance with FTA regulations.

LAVTA Short Range Transit Plan FY2012-FY2021
Livermore Amador Valley Transit Authority
119
Financial Plan, Operations Budget and Capital Plan
7.1 OVERVIEW
This chapter takes the information provided in the previous sections to create a comprehensive ten year capital and operating financial plan. The two plans are shown in detail in Exhibits 1 through 4 at the end of the chapter. The financial plan presented in these exhibits is financially constrained based on known revenue sources. Given the prospect of emerging new revenue sources, the final section of this chapter summary identifies new projects that can be added as new revenues emerge. 7.2 OPERATIONS BUDGET
7.2.1 Operating Expenditures
The operating expenses shown in Exhibit 1 are comprised of the following line categories: Salaries and Wages, Personnel Benefits, Professional Services, Non-Vehicle Maintenance, Communications, Fuel and Lubricants, Office/Operating Supplies, Printing, Utilities, Insurance, Taxes and Fees, Purchased Transportation Service, Miscellaneous, Professional Development, and Advertising.
7.2.2 Financial Assumptions
Revenue
LAVTA’s primary operating revenue sources: TDA, STA, Federal 5307 Capitalized Preventive Maintenance and ADA set aside, and BART feeder bus subsidy are all based on MTC’s “Plan Bay Area Forecasts for revenue trends using LAVTA’s FY11 actuals and FY12 budget.
Fares are assumed to increase by $.25 every five years, in FY15 and FY20. While the agency may prefer to do more frequent smaller increases, the total
over the ten year period is representative. STA is distributed to jurisdictions for fixed route service in two ways – as a revenue-
based and a population-based subsidy for transit capital and operating needs. The source of this funding is not entirely stable therefore LAVTA budgets STA revenues on a year lag. Additional STA comes to LAVTA in the form of a paratransit allocation and as part of the feeder bus agreement with BART. These amounts are not carried over if LAVTA does not use them and therefore are included in the operating budget. If the STA revenue for these two programs are lost LAVTA will request additional TDA from the reserves to fill the gap.
Lifeline is shown as being stable over the life of the forecast, and only available for funding the existing route 14 service. This is conservative (see opportunities below).
Chapter 7

LAVTA Short Range Transit Plan FY2012-FY2021
Chapter 7
120
Expenses
Fixed Route Contract operations costs, LAVTA’s most significant cost element, are based on the recently signed contract with MV through FY2018. The final three years assume a 3% annual cost increase.
The Paratransit costs are based on the recently signed contract with ALC through FY2018 and then increase 3% each year for the remaining three years.
Administrative costs also are assumed to increase by 3%.
7.2.3 Financial Results
The plan includes adding additional revenue hours for fixed route in Fiscal Years 15 and 16. The demand for paratransit also increases over this period at a higher rate than the paratransit revenues, therefore paratransit costs are offset by fixed route revenues. The result is a deficit in TDA reserves at the end of the ten year period. However, LAVTA is confident that either new funding sources will be made available during this period or that LAVTA will be able to make the necessary cuts to ensure financial stability.
7.2.4 Financial Risks and Opportunities
As stated above, this forecast is based on known available and committed revenues. High on the opportunity list are new revenues, changes to existing revenue policy, and possible grant opportunities. These include:
New lifeline funds and programs Measure B Express bus funds and the passage of Measure B1 The addition of revenues through the CARB Cap and Trade The addition of revenues from the addition of an HOV lane Other grant programs such as BAAQMD grants
While these and other heretofore unknown revenue sources are opportunities, they also represent risk in that to compete for new sources of revenue, it requires relatively well developed projects, and often extensive grant applications. This work is done with no assurance that the revenues will ultimately materialize. In both the operating and capital arena, grants may be given for project development with no assurance that the follow-on project construction or operating funds will materialize. From LAVTA’s vantage point, the most valuable funding sources are those that are allocated annually to the agency by formula and are completely fundable. These funding sources are, however, dwindling. Another possible financial upside not included in this forecast is increases in TDA revenues. TDA is sensitive to environmental factors that affect the overall economy. Additionally the forecasts used for the TDA estimates are not adjusted for inflation and only include a minimal economic turn around. Other risks are higher than anticipated cost increases, and changes in the economic and political environment.
LAVTA Short Range Transit Plan FY2012-FY2021
Chapter 7
121
7.3 FUNDING
7.3.1 Planned increases
LAVTA has fare increases planned for fiscal years 15 and 20. Additionally, as the economy recovers LAVTA anticipates an increase in ridership which will result in an increase in farebox revenues. The ridership increases will be affected by the changes in revenue hours and increased efficiency in bus routing. These changes will have a positive impact on the farebox revenues and may qualify LAVTA for additional grant funding.
7.3.2 Sources of Operating Revenue
LAVTA services are supported by two primary types of operating revenues: Revenues generated by the agency either through the provision of transit service
(farebox and contract fares) or through supplementary activities such as advertising and ticket concessions.
Federal, State and Local transportation funding assistance programs including Transportation Development Act (TDA), State Transit Assistance (STA), Federal Transit Administration grants, and Measure B sales tax revenue.
A brief description of each budget line item follows: Passenger Fares
Revenues derived from the farebox are forecast to increase over the budgeted rate for both fixed route and paratransit. These forecasts are based on the current running rate for FY 2012, plus additions based on fare increases and route changes. Revenue is also generated from an agreement with Hacienda Business Park This revenue is expected to increase based on CPI. Contract Services
LAVTA receives revenues from both the San Joaquin Regional Rail Commission (SJRRC), and the Alameda County Transportation Commission to subsidize the ACE shuttle service (ACE passengers then ride free). Revenue from an agreement with BART to supply paratransit services to the BART station for connections with East Bay Paratransit are also included as is the revenue from BART Plus. Concessions, Advertising, Interest and T-Mobile Agreement
LAVTA receives revenues from and agreement with T-mobile for the use of LAVTA land for a cell phone tower. LAVTA also receives funds from the San Joaquin Regional Rail Commission (SJRRC) to sell ACE train tickets at the transit center, and receives a portion of the ticket sales for BART tickets sold by LAVTA. The advertising revenues show a decrease based on a new contract signed for advertising on the exterior of LAVTA’s buses. Interest is also expected to decrease based on the current economic conditions and then slowly increase over the period.

LAVTA Short Range Transit Plan FY2012-FY2021
Chapter 7
122
Transportation Development Act Funds (TDA)
These funds are derived from a ¼ cent sales tax and distributed by the Metropolitan Transportation Commission (MTC) to Alameda County and all of its incorporated cities. LAVTA is eligible for two different programs within this funding source: TDA 4.0 which provides general transit assistance and can be used for capital and operating expenses for both fixed route and paratransit and TDA 4.5 which is exclusively for paratransit services. LAVTA also receives a portion of BART’s TDA 4.0 apportionment to help support feeder service to the Dublin/Pleasanton station. These funds help subsidize Wheels’ route 20 to the LLNL, and Wheels’ route 12 which serves Las Positas College and the Livermore Transit Center. Regional Measure 2 (RM2)
Regional Measure 2 increased the toll on Bay Area bridges by $1. Funds from this increase were designated to fund projects to improve transit in the Bay Area. LAVTA has received RM2 funding for the Rapid service. State Transit Assistance Funds (STA)
STA is distributed to jurisdictions for fixed route service in two ways – as a revenue-based and a population-based subsidy for transit capital and operating needs. The source of this funding is not entirely stable therefore LAVTA budgets these monies on a year lag. Additional STA comes to LAVTA in the form of a paratransit allocation and as part of the feeder bus agreement with BART. These amounts are not carried over if LAVTA does not use them and therefore are included in the operating budget. If the STA revenue for these two programs are lost LAVTA will request additional TDA from the reserves to fill the gap. Federal Transit Administration (FTA) Section 5307
FTA Section 5307 funds are distributed by MTC to transit operators in the region. These funds are available to LAVTA to fund bus replacement projects, ADA paratransit (see below) and any remaining funds from the Livermore UA may be used for other projects. LAVTA is choosing to use this money to fund preventative maintenance which is the only eligible fixed route operating use for these monies. These funds are budgeted on a fiscal year lag to account for the difference between the state and federal fiscal year’s and the grant processing cycle time. In addition to the flexible set aside funds LAVTA has some additional flexible funds provided by the deferral of our purchase of fixed route buses. This deferral was made possible because of the agencies efforts to “right size” our fleet. In addition, another source of funds was the deferral of purchasing

LAVTA Short Range Transit Plan FY2012-FY2021
Chapter 7
123
paratransit buses. The flexible amount netted from these two deferrals will be spread out over the next three operating budgets. Additional FTA regional capital funds are used for ADA paratransit operating purposes. These funds are also budgeted on a year lag. Measure B
Voters in Alameda County re-authorized a one-half cent sales tax dedicated to funding transportation projects. This measure was originally passed in 1992. A portion of the revenues from this measure is dedicated to supporting paratransit services throughout the County. Funds are distributed to eligible recipients based on a population formula that includes the number of elderly and disabled persons in the jurisdiction, as well as the number of low income persons. The revenue projections include the anticipated passage of measure B1 with would increase the revenues received by LAVTA in both “pass through” and express bus money. 7.4 CAPITAL IMPROVEMENT PROGRAM
7.4.1 Revenue Source Descriptions
The capital plan involves five categories, fixed route vehicles, service vehicles, major components which includes items such as engine replacements, and miscellaneous. The recent change in the paratransit service model has allowed LAVTA to eliminate the paratransit capital expense budget is split into two sections, specialized projects and ongoing/routine projects.
7.4.2 Revenue Source Descriptions
FTA Section 5307 Funds
These funds are distributed by the Federal Transit Administration to the various urbanized areas (UA), based on a formula that considers population, population density and passenger miles. Beginning in FY 2003, LAVTA received FTA Section 5307 funds from two urbanized areas: Livermore and Concord. Based on the Regional Transit Capital Priorities process, this plan assumes that Livermore UA funds will be utilized first, and then any remaining major capital expenditure left unfunded will be allocated resources from the Concord UA. On the other hand, if the funds from the Livermore UA are not required entirely to fund vehicle replacements and rehabilitations, the excess funds will be used to fund capital needs. State and Regional Funds
Five and one half million dollars is currently programmed from the State Transportation Improvement Program for LAVTA’s Atlantis Satellite Facility. The recently enacted Proposition 1B provides a new source of capital funds for transit operators. LAVTA intends to designate all of these funds to the purchase of fixed route vehicles in FY15 and 16.
LAVTA Short Range Transit Plan FY2012-FY2021
Chapter 7
124
Bridge Tolls
These funds come from the base toll on state-owned bridges and are available to transit operators in the Bay Area. This money is used primarily to match FTA Section 5307 grants. This plan assumes that all vehicle replacements and rehabilitations will have a Bridge Toll match. TDA Article 4.0
This is LAVTA’s primary source of revenue for both operating and small capital projects. It comes from a ¼ cent sales tax levied throughout California. This is LAVTA’s most flexible funding source; it is used to fund all projects that cannot be funded from another source. 7.5 VEHICLE REPLACEMENTS, REHABILITATION,
AND EXPANSION
7.5.1 Basis for Revenue Vehicle Projects - Fixed Route
The fixed route fleet consists of 74 vehicles ranging in size from 29 to 40 feet, designed to provide local, intra-city transit services. This fleet also includes a sub-fleet of nine coaches with upgraded interiors (high-back passenger seating with tray tables and footrests, luggage racks with individual lights and fans) to provide inter-city commute service between Walnut Creek and the Tri-Valley. Revenue Vehicle Replacement, Rehabilitation, and Expansion
Life Cycle
These vehicles have a 12-year useful lifespan as stipulated by the Department of Transportation through its Altoona Testing Program.
Passenger Amenities
These include a fully functional and ADA-compliant wheelchair lift/ramp and two securement locations, ergonomic passenger seating, digital surveillance systems (for security and safety), electronic farebox, automatic vehicle location system, voice annunciation system, automatic passenger counters, front-mounted bicycle (2 and 3) racks, and head, side and rear destination signs. Since Fall 2003, the majority of LAVTA’s fixed route fleet consists of low-floor coaches to enable easier and more efficient access/egress.
Mode of Power and Emissions Considerations
The LAVTA Board of Directors elected to place the agency on the diesel fuel path in 2000 citing infrastructure costs considerations. Additionally, LAVTA has placed diesel-emissions control units on more than 1/3 of its fleet. These units greatly reduce the harmful emissions from diesel fuel, yet the overall fuel economy of the vehicle is reduced due to these technologies. Finally, starting in 2007 and continuing in 2008, LAVTA is purchasing 16 Diesel/Electric hybrid coaches as replacements to its RTS fleet.

LAVTA Short Range Transit Plan FY2012-FY2021
Chapter 7
125
Fleet Expansion
A decrease in the fleet is included in this plan to match the fleet to agency need. The current fleet consists of 67 active fixed route vehicles and 22 contingency for a total of 89 vehicles. Current Peak Pull Requirements LAVTA’s peak pull fluctuates by time of day with the larger peak occurring in the morning. Afternoon school tripper routes easily interline with the commuter focused afternoon peak services. In the morning, the school peak and the commuter peak period coincide and as a result, interlining is not possible. The current morning peak period requires 46 buses and the afternoon peak period requires 43 buses1. This results in a 93% spare ratio (43/46), a high spare ratio and well above FTA’s guidance recommending a spare ratio of 20%. LAVTA is currently planning conservatively for growth and no large service expansions are planned at this time. With the current fleet, LAVTA has an ample number of vehicles if vehicles are maintained properly and rehabilitated at mid-life. As a result of the excess spare ratio, LAVTA is in active fleet reduction mode. In FY 2011, four 1996 fixed-route vehicles and three former paratransit cutaways vehicles were retired and disposed of without replacement. The seven remaining 1996 buses are in the contingency fleet. To become compliant with FTA spare ratio guidance, LAVTA must shed or place into contingency 21 additional vehicles which will be done over time as vehicles reach their useful life. Because all vehicles in the active fleet are within their useful life, the Authority still operates all current revenue vehicles in regular revenue service. The Authority plans to continue to operate all active vehicles in normal service to maintain them in good operating condition and to best utilize the public dollars expended to purchase these vehicles.
Major Component Rehabilitation Program
In addition to purchasing new vehicles, LAVTA has an aggressive rehabilitation schedule for the vehicles in the fixed route fleet. Engines and transmissions are replaced as needed, but generally at the half-life of the vehicle (six years), to meet current and anticipated emissions standards. LAVTA has a policy of only replacing these two components at a mid-life rehabilitation, and replaces seats and other passenger amenities as needed. As LAVTA does not use regional funds for this rehabilitation effort, there is no extension of useful life beyond the regionally programmed useful life of equipment. 1 As of November 5, 2012 service change

LAVTA Short Range Transit Plan FY2012-FY2021
Chapter 7
126
Non-Revenue Vehicle Replacement and Expansion
Replacement
LAVTA has an ongoing program of non-revenue vehicle replacement. LAVTA has five types of non-revenue vehicles in its active fleet: three low-floor, ADA accessible supervision vans; two pickup trucks used by the maintenance department; one eight-passenger van used by LAVTA; two light duty vans for operator shift change; and one sedan car. Each of these vehicles has a four-year useful life expectancy per the MTC’. No rehabilitation of these vehicles has been performed. Funding is expected to come from local sources. 7.6 MAJOR FACILITIES REPLACEMENT,
REHABILITATION, UPGRADE AND EXPANSION PROJECTS
7.6.1 Planned Projects Bus Stop and Shelter Program
In FY2006, LAVTA conducted a detailed and high-level analysis of all bus stop locations in the LAVTA service area. This study was completed by a team from the University of California, Berkeley Transportation Institute and highlighted deficiencies in certain locations. The deficiencies included safety concerns, ADA concerns, accessibility concerns, pedestrian crossing concerns, as well as vehicle movement considerations. LAVTA has begun a systematic process to correct the identified deficiencies on an annual basis. Improvements required range from simple solutions up to and including actual stop re-location. This project is ideally suited to new proposition 1B lifeline funds. Office/Facility Equipment/Miscellaneous Capital
Each year LAVTA allocates funds to acquire new and replacement office and facility equipment. Approximately $100,000 has been programmed annually for these routine replacements. From time to time, larger improvements and replacements are required, such as replacing the bus washer, upgrading the GFI farebox system, and implementing a local area network.
7.6.2 Future Projects
Given the requirement that forecasts be financially constrained, not all projects, including some that are currently under development, are included in this forecast. It is important to note that funding is constantly changing and one of goal of the long range planning process is to be prepared to compete for emerging fund sources with viable projects. Concurrent with the development of the Short Range Transit Plan, Alameda County and MTC are developing their own regional and sub-regional long range (25 year) plans. As part of their planning processes, they issue calls for projects from potential sponsors. Inclusion in these programs is a necessary step to receiving state, federal and regional funds.

LAVTA Short Range Transit Plan FY2012-FY2021
Chapter 7
127
Atlantis O&M Facility
Not included in the ten-year capital plan is the construction of an additional Operations and Maintenance (O&M) facility. The facility is planned to provide for additional capacity for LAVTA future growth. LAVTA will continue to seek federal funding support for the Atlantis O&M Facility, however it may become imperative to identify other methods of assembling the funding for this project. LAVTA recently completed the 30% design phase of the entire project. Phase I was completed in June 2008 and Phase 2 is anticipated to be completed in January 2013. Final Design and Construction of the final phases are on hold pending new funding. The current phasing strategy is as follows:
Phase 1: Construct Secured Bus Parking (completed) Phase 2: Bus Wash and Fueling Center Phase 3: Construct Operations Building Phase 4: Construct Rutan Facility Improvements Phase 5: Construct Maintenance Building
LAVTA may find mechanisms for obtaining all or portions of the needed funding for the Facility in the upcoming Federal Transportation Bill reauthorization, through additional STIP funding, or through some other as-yet-unidentified funding sources. Because funding for this project is anticipated to be federal discretionary, LAVTA has not included funding or expenses for this project in the SRTP. New AVL System
The current AVL system is almost ten years old and many features are outdated. In FY 2016, when the 2003 Gillig fleet retires, the Authority may want to consider implementation of a new, modern AVL system including software and hardware upgrades for the entire fleet. With the 2016 vehicle purchase, the AVL system will be included in the purchase price however the remainder of the revenue and support fleet will need to be updated.
Trapeze Blockbuster
LAVTA currently performs scheduling, blocking, and runcutting the old fashioned way. The agency relies on the fixed-route transit planner to write schedules in Microsoft Excel and then block the routes using the same program. The Operations Manager must then take this information and turn it into driver paddles. This process is very time consuming and is subject to human error. LAVTA typically allots 2-3 months for this process for major schedule changes. Trapeze Blockbuster can do this task at the touch of a button and have efficient blocks and runcuts created without the burden on staff.

LAVTA Short Range Transit Plan FY2012-FY2021
Chapter 7
128
This page intentionally left blank.

LAVTA Short Range Transit Plan FY2012-FY2021
Livermore Amador Valley Transit Authority
E1‐A
Operating Financial Plans - Fixed Route, Paratransit, Systemwide
EXHIBIT 1

LAVTA Short Range Transit Plan FY2012-FY2021
This page intentionally left blank.

Exhibit 1A -FIXED ROUTE FINANCIAL PLAN AND OPERATING CHARACTERISTICS FY 2012-2021
FY2011 FY2012 FY2013 FY2014 FY2015 FY2016 FY2017 FY2018 FY2019 FY2020 FY2021Actual Budget
EXPENSESOperating Expenses(1) $11,564,234 $12,711,118 $13,910,050 $14,209,297 $14,612,983 $15,263,178 $15,718,890 $16,243,258 $16,747,632 $17,267,736 $17,804,061Capital Expenses (fixed route and paratransit) 998,006 2,267,734 1,478,090 2,423,681 8,152,198 8,162,025 967,827 498,863 19,895,791 1,301,721 Total Fixed Route Expenses 11,564,234$ 13,709,124$ 16,177,784$ 15,687,387$ 17,036,664$ 23,415,376$ 23,880,915$ 17,211,085$ 17,246,495$ 37,163,527$ 19,105,782$
REVENUESPassenger Fares (2) 1,658,856 1,603,894 1,700,128 1,802,135 2,018,392 2,159,679 2,289,260 2,426,615 2,547,946 2,996,385 3,146,204Business Parks (3) 151,155 141,504 145,749 150,122 154,625 159,264 164,042 168,963 174,032 179,253 184,631Special Contract Fares 241,479 263,044 270,935 279,063 287,435 296,058 304,940 314,088 323,511 333,216 343,213Concessions 27,584 35,400 35,400 35,400 35,400 35,400 35,400 35,400 35,400 35,400 35,400Bus Lease/Miscellaneous 0 0 0Advertising Revenue 332,274 310,000 125,000 125,000 115,000 95,000 95,000 97,850 100,786 103,809 106,923Interest (4) 12,445 8,000 9,034 8,587 8,818 9,056 9,301 9,552 9,810 10,075 10,307Subtotal 2,423,792 2,361,842 2,286,246 2,400,307 2,619,670 2,754,458 2,897,943 3,052,469 3,191,485 3,658,138 3,826,677
STA (Population Based)(5)(6) 1,226,941 0 945,542 816,967 887,137 963,334 1,046,075 1,135,923 1,233,489 1,339,434 1,454,479STA (Revenue Based)(5)(6) 201,728 0 215,503 183,196 198,931 215,017 234,571 254,719 276,597 300,354 326,151TFCA 758,038 489,960 0 310,000 341,000 375,100 412,610 453,871 499,258 549,184 604,102Regional Measure 2 (7) 686,001 580,836 580,836 0 0 0 0 0 0 0 0Measure B Express Bus (8) 958,401 1,049,667 500,000 807,870 829,682 852,084 875,090 898,717 922,983 947,903 969,705Pop 1B PTMISEA 24,785 0 0 0 0 0 0 0 0 0FTA 5311 - 193,203 40,520 40,520 0 7,637,517 0 0 19,454,534 0FTA 5307 - Formula(9) 1,912,799 1,745,816 1,392,236 1,364,400 -6,147,117 1,535,400 1,581,300 -17,825,534 1,677,600Lifeline(10) 144,000 179,409 166,154 283,000 291,490 300,235 309,242 318,519 328,075 337,917 348,054BART Subsidy(11) 369,126 468,132 508,243 516,375 524,637 533,031 541,560 550,225 559,028 567,973 577,060Measure B(12) 693,940 684,763 617,755 1,174,272 1,205,978 1,238,539 1,271,980 1,306,323 1,341,594 1,377,817 1,409,507Subtotal 7,168,962 5,239,103 4,966,789 5,456,080 4,278,855 4,477,340 6,181,527 6,453,697 6,742,323 7,049,582 7,366,659
TDA 4.0 Funds needed to balance budget 1,971,480 5,110,173 6,657,014 6,352,911 7,714,458 8,031,381 6,639,420 6,737,091 6,813,824 6,560,016 6,610,725
Total Operating Revenues 11,564,234$ 12,711,118$ 13,910,050$ 14,209,297$ 14,612,983$ 15,263,178$ 15,718,890$ 16,243,258$ 16,747,632$ 17,267,736$ 17,804,061$
CAPITAL REVENUES FTA Section 5307 - Livermore UA 0 0 0 0 1,447,200 1,490,400 0 0 0 0 FTA Section 5307 -Concord UA 0 0 0 0 4,838,291 0 0 0 0 0 State Funds 0 0 0 0 0 0 0 0 0 0 Bridge Tolls 0 0 0 0 226,260 0 0 0 0 0 TDA Article 4.0 866,877 0 0 0 0 0 0 0 0 0 0 Proposition 1B PTMISEA 0 0 0 0 991,163 0 0 0 0 0 Funding Not Secured 998,006 2,267,734 1,478,090 2,423,681 649,283 524,508 967,827 498,863 441,258 1,301,721Total Capital Revenue 866,877$ 998,006$ 2,267,734$ 1,478,090$ 2,423,681$ 8,152,198$ 2,014,908$ 967,827$ 498,863$ 441,258$ 1,301,721$
Total Fixed Route Revenue 12,431,111$ 13,709,124$ 16,177,784$ 15,687,387$ 17,036,664$ 23,415,376$ 17,733,798$ 17,211,085$ 17,246,495$ 17,708,993$ 19,105,782$
OPERATING CHARACTERISTICSRevenue Hours(13) 111,484 124,702 127,146 127,146 127,170 131,760 131,760 131,760 131,760 131,760 131,760change in revenue hours 13,218 2,444 0 24 4,590 0 0 0 0 0Ridership(14) 1,712,879 1,749,168 1,748,466 1,835,889 1,890,966 1,947,695 2,064,557 2,126,493 2,190,288 2,255,997 2,323,677 % Ridership Increase 2% 0% 5.0% 3.0% 3.0% 6.0% 3.0% 3.0% 3.0% 3.0%Average Fare Per Passenger $1.06 $1.00 $1.06 $1.06 $1.12 $1.19 $1.19 $1.22 $1.24 $1.41 $1.43Passenger per Revenue Hour 15.4 14.0 13.8 14.4 14.9 14.8 15.7 16.1 16.6 17.1 17.6Farebox Recovery Ratio (W/ B Parks & Special) 18% 16% 15% 16% 17% 17% 18% 18% 18% 20% 21%Cost Per Hour $103.73 $101.93 $109.40 $111.76 $114.91 $115.84 $119.30 $123.28 $127.11 $131.05 $135.12
(1) Operating cost per revenue hour increases 3% annually starting in FY 2012. Costs increase 5% in every third year.(2) Assumes a fare increase in FY15(3) Business Parks- Assumes 3% increase(4) Interest calculation: TDA/12 times average interest(5) Assumes STA program per MTC projections with a one year budgeting lag(6) Assumes STA program per MTC projections with a one year budgeting lag(7) RM2 funds for BRT service approved through FY14(8) Forecasts based on FY13 projections and increased based on the passage of Measure B1 base amount projections and escalated at the same rate as TDA.(9) Annual excess 5307 from the Livermore UA is used for preventative maintenance.(10) Lifeline is through CMA. These funds cover some of the cost of Route 14.(11) BART's TDA/STA/Bridge Toll payments to LAVTA for providing feeder bus service to BART. Assumes contributions increase by 1.6% annually.(12) Forecasts based on FY13 projections and increased based on the passage of Measure B1 base amount projections and escalated at the same rate as TDA.(13) Estimated annual hours increase/decrease based on available funding levels(14) Estimated annual fixed-route ridership based on ridership/revenue hour
E1-C


Exhibit 1B - PARATRANSIT FINANCIAL PLAN AND OPERATING CHARACTERISTICS
FY2011 FY2012 FY2013 FY2014 FY2015 FY2016 FY2017 FY2018 FY2019 FY2020 FY2021Actual Budget
EXPENSESOperating Expenses(1) 1,719,889 1,397,413 1,510,698 1,555,961 1,650,719 1,785,252 1,893,974 2,009,317 2,173,076 2,305,417 2,445,817
REVENUESPassenger Fares (2) 133,168 121,404 144,692 149,032 175,433 180,695 186,116 191,700 197,451 228,796 235,660Special Contract Fares 54,258 60,000 30,000 30,000 30,000 30,000 30,000 30,000 30,000 30,000 30,000InterestSubtotal 187,426 181,404 174,692 179,032 205,433 210,695 216,116 221,700 227,451 258,796 265,660
TDA 4.5 (15) 86,712 94,547 87,244 89,600 92,019 94,504 97,055 99,676 102,367 105,131 107,549STA Regional Paratransit (15) 98,821 66,624 61,478 63,138 64,843 66,594 68,391 70,238 72,134 74,082 75,786Measure B Paratransit (12) 130,424 128,699 122,804 233,434 239,736 246,209 252,857 259,684 266,695 273,896 280,196FTA Secions 5316 and 5317 10,000FTA Section 5307 ADA Paratransit 397,781 320,433 320,433 322,250 332,009 341,920 352,191 362,736 373,649 384,837 396,414Subtotal 713,738 620,303 591,958 708,421 728,607 749,227 770,494 792,335 814,846 837,946 859,945
TDA 4.0 Funds needed to balance budget 818,725 595,706 744,048 668,507 716,679 825,330 907,364 995,283 1,130,779 1,208,674 1,320,211
Total Operating Revenues 1,719,889$ 1,397,413$ 1,510,698$ 1,555,961$ 1,650,719$ 1,785,252$ 1,893,974$ 2,009,317$ 2,173,076$ 2,305,417$ 2,445,817$
OPERATING CHARACTERISTICSRevenue Hours 22,350 24,218 24,945 25,693 26,464 27,258 28,075 28,918 29,785 30,679 31,599Passenger Trips 40,932 41,341 41,755 42,590 43,442 44,745 46,087 47,470 48,894 50,361Ridership 56,795 44,596 45,934 47,312 48,731 50,193 51,699 53,250 54,847 56,493 58,188 % Ridership Increase 0% -21% 3% 3.0% 3.0% 3.0% 3.0% 3.0% 3.0% 3.0% 3.0%Average Fare Per Passenger $2.34 $2.72 $3.15 $3.15 $3.60 $3.60 $3.60 $3.60 $3.60 $4.05 $4.05Passenger per Revenue Hour 2.5 1.8 1.8 1.8 1.8 1.8 1.8 1.8 1.8 1.8 1.8Farebox Recovery Ratio (W/ Special Contract) 11% 13% 12% 12% 12% 12% 11% 11% 10% 11% 11%Cost Per Hour $76.95 $57.70 $60.56 $60.56 $62.38 $65.50 $67.46 $69.48 $72.96 $75.15 $77.40
(1) Operating cost per revenue hour increases 3% annually starting in FY 2012. Costs increase 5% in every third year.(2) Assumes a fare increase in FY15(12) Forecasts based on FY13 projections and increased based on the passage of Measure B1 base amount projections and escalated at the same rate as TDA(15) Assumed continuation of STA program
E1-E


Exhibit 1C - OPERATING CHARACTERISTICSRevenue Hours 22,350 24,218 24,945 25,693 26,464 27,258 28,075 28,918 29,785 30,679 31,599Passenger Trips 40,932 41,341 41,755 42,590 43,442 44,745 46,087 47,470 48,894 50,361Ridership 56,795 44,596 45,934 47,312 48,731 50,193 51,699 53,250 54,847 56,493 58,188 % Ridership Increase 0% -21% 3% 3.0% 3.0% 3.0% 3.0% 3.0% 3.0% 3.0% 3.0%Average Fare Per Passenger $2.34 $2.72 $3.15 $3.15 $3.60 $3.60 $3.60 $3.60 $3.60 $4.05 $4.05Passenger per Revenue Hour 2.5 1.8 1.8 1.8 1.8 1.8 1.8 1.8 1.8 1.8 1.8Farebox Recovery Ratio (W/ Special Contract) 11% 13% 12% 12% 12% 12% 11% 11% 10% 11% 11%Cost Per Hour $76.95 $57.70 $60.56 $60.56 $62.38 $65.50 $67.46 $69.48 $72.96 $75.15 $77.40
(1) Operating cost per revenue hour increases 3% annually starting in FY 2012. Costs increase 5% in every third year.(2) Assumes a fare increase in FY15(12) Forecasts based on FY13 projections and increased based on the passage of Measure B1 base amount projections and escalated at the same rate as TDA(15) Assumed continuation of STA program
SYSTEMWIDE OPERATING INFORMATION AND NOTES
FY2011 FY2012 FY2013 FY2014 FY2015 FY2016 FY2017 FY2018 FY2019 FY2020 FY2021TDA 4.0 RESERVE BALANCEPrior Year TDA Carryover 9,060,363 4,982,109 3,610,695 6,423,864 6,035,075 4,398,781 2,466,397 1,969,362 1,460,172 916,906 731,910 TDA 4.0 Interest earned on reserves (Alameda Cty) 12,094 108,321 192,716 181,052 131,963 73,992 59,081 43,805 27,507 21,957 TDA 4.0 Revenue Forecast 2,935,687 7,510,718 6,775,753 6,439,913 6,613,791 6,792,363 6,975,757 7,164,103 7,357,533 7,556,187 7,729,979TDA 4.0 Usage: Operations 2,790,205 5,705,879 7,401,062 7,021,418 8,431,137 8,856,711 7,546,784 7,732,374 7,944,604 7,768,691 7,930,937 Capital (excludes prior year allocations) 3,336,152 3,188,347 0 0 0 0 0 0 0 0 0Reserve Balance 4,982,109$ 3,610,695$ 3,093,707$ 6,035,075$ 4,398,781$ 2,466,397$ 1,969,362$ 1,460,172$ 916,906$ 731,910$ 552,909$
OPERATING CHARACTERISTICS - SystemwideRevenue Hours 133,834 148,920 152,091 152,839 153,634 159,018 159,835 160,678 161,545 162,439 163,359Total Operating Expense 13,284,123 14,108,531 15,420,748 15,765,258 16,263,702 17,048,430 17,612,864 18,252,575 18,920,709 19,573,152 20,249,878Ridership (16) 1,769,674 1,793,764 1,794,400 1,883,201 1,939,697 1,997,888 2,116,256 2,179,743 2,245,136 2,312,490 2,381,865 % Ridership Change 1% 0% 5% 3% 3% 6% 3% 3% 3% 3%Average Fare Per Passenger $1.10 $0.96 $1.03 $1.04 $1.13 $1.17 $1.17 $1.20 $1.22 $1.39 $1.42Passenger per Revenue Hour 13.2 12.0 11.8 12.3 12.6 12.6 13.2 13.6 13.9 14.2 14.6Farebox Recovery Ratio (W/ Special Contract) 0.17 16% 15% 15% 16% 17% 17% 17% 17% 19% 19%Cost per Hour $99.26 $94.74 $101.39 $103.15 $105.86 $107.21 $110.19 $113.60 $117.12 $120.50 $123.96 % Change in Cost per Hour 4% -5% 7% 2% 3% 1% 3% 3% 3% 3% 3%
(16) Dial-A-Ride ridership based on revenue hour and a passenger productivity of 2.5 passengers per revenue hou
(1) OPERATING COSTS Fixed Route Purchased Transportation (Contract Operator)(a) $6,909,950 $7,749,706 $8,277,708 $8,407,985 $8,637,631 $9,108,566 $9,379,639 $9,713,829 $10,022,321 $10,340,665 $10,669,179 LAVTA Administration/Operations(b) $4,654,284 $4,961,412 $5,632,342 $5,801,312 $5,975,352 $6,154,612 $6,339,251 $6,529,428 $6,725,311 $6,927,070 $7,134,882 TOTAL OPERATING COSTS $11,564,234 $12,711,118 $13,910,050 $14,209,297 $14,612,983 $15,263,178 $15,718,890 $16,243,258 $16,747,632 $17,267,736 $17,804,061 (a) Assume 3.5% annual increase in contract costs except in years were new contract may be in place- Assume 5% increase in thse years(every third year) based on prior experience that contract costs may increase at that time then assumes 3.5% the following years. (b) Assume 3% annual increase per year. (d) Assume 2% annual increase in contract costs through the current contract (2016) then in years were new contract may be in place- Assume 5% increase in thse years(every third year) based on prior experience that contract costs may increase at that time then assumes 3% the following years. Paratransit Purchased Transportation (Contract Operator) (d) $1,176,966 $954,215 $1,054,204 $668,272 $702,086 $737,612 $774,935 $814,147 $863,728 $916,329 $972,134 LAVTA Administration/Operations (b) $542,923 $443,198 $456,494 $470,189 $484,294 $498,823 $513,788 $529,202 $545,078 $561,430 $578,273 TOTAL OPERATING COSTS $1,719,889 $1,397,413 $1,510,698 $1,138,460 $1,186,381 $1,236,435 $1,288,723 $1,343,348 $1,408,806 $1,477,759 $1,550,407
E1-G


LAVTA Short Range Transit Plan FY2012-FY2021
Livermore Amador Valley Transit Authority
E2‐A
Ten Year Capital Plan
EXHIBIT 2

LAVTA Short Range Transit Plan FY2012-FY2021
This page intentionally left blank.

LAVTA Ten-Year Capital Plan FY 2012-21Summary
EXPENSES FY2012 FY2013 FY2014 FY2015 FY2016 FY2017 FY2018 FY2019 FY2020 FY2021 10 Year TotalFixed-Route Vehicle Program - Fleet Reduction and Smaller Vehicle Procu $0 $0 $0 $0 $7,635,964 $1,527,503 $0 $0 $19,454,534 $0 $28,618,001
# of Vehicles 0 0 0 0 10 10 0 0 22 0 42
Support Vehicle Replacement $0 $0 $151,944 $62,601 $0 $0 $68,406 $176,144 $108,857 $74,749 $642,700# of Vehicles 0 0 5 2 0 0 2 5 3 2 19
Major Components Rehab $818,006 $1,285,733 $1,135,184 $2,164,389 $92,742 $278,728 $604,492 $101,342 $104,382 $992,114 $7,577,113Miscellaneous Needs $180,000 $982,001 $190,962 $196,691 $202,592 $245,780 $294,929 $221,377 $228,019 $234,859 $2,977,210
Total Capital Expenses $998,006 $2,267,734 $1,478,090 $2,423,681 $7,931,298 $2,052,012 $967,827 $498,863 $19,895,791 $1,301,721 $39,815,024
REVENUESFTA Section 5307 -$ -$ -$ -$ 6,108,772$ 1,222,003$ -$ -$ 15,563,627$ -$ 22,894,401$
FTA Section 5307 Livermore $0 $0 $0 $0 $1,447,200 $1,490,400 $0 $0 $1,629,000 $0 4,566,600$ FTA Section 5307 Concord $0 $0 $0 $0 $4,661,572 -$268,397 $0 $0 $13,934,627 $0 18,327,801$
State/Regional Funds -$ Bridge Tolls -$ -$ -$ -$ 226,260$ 76,375$ -$ -$ 972,727$ -$ 1,275,362$ TDA Article 4.0 -$ -$ -$ -$ -$ -$ -$ -$ -$ -$ -$ Proposition 1B PTMISEA -$ -$ -$ -$ 991,163$ -$ -$ -$ -$ -$ 991,163$ Funding Not Secured 998,006$ 2,267,734$ 1,478,090$ 2,423,681$ 605,103$ 753,634$ 967,827$ 498,863$ 3,359,438$ 1,301,721$ 14,654,099$ Total Capital Revenues $998,006 $2,267,734 $1,478,090 $2,423,681 $7,931,298 $2,052,012 $967,827 $498,863 $19,895,791 $1,301,721 $39,815,024
(1) All vehicle replacement program costs based on MTC's replacement vehicle cost estimates for vehicles funded with FTA Section 5307. (3) TDA Article 4.0 funds needed to balance the capital budget
E2-C


LAVTA Short Range Transit Plan FY2012-FY2021
Livermore Amador Valley Transit Authority
E3‐A
Capital Projects
EXHIBIT 3
EXHIBIT 3

LAVTA Short Range Transit Plan FY2012-FY2021
This page intentionally left blank.
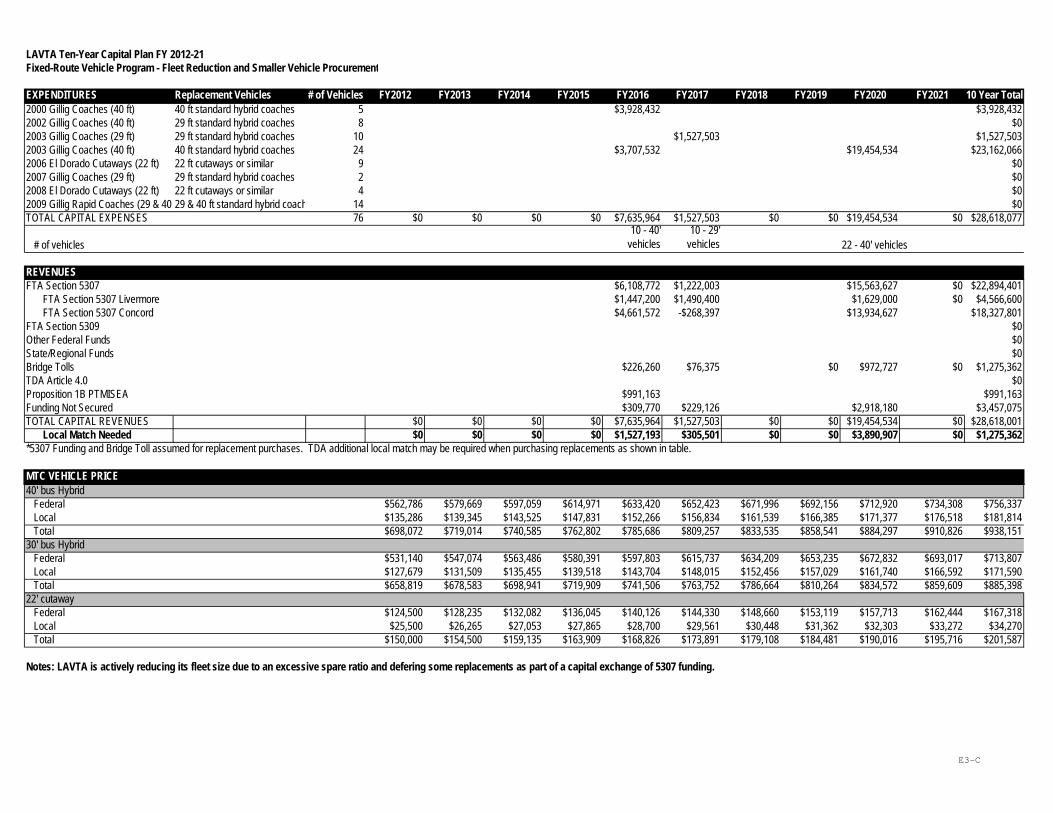
LAVTA Ten-Year Capital Plan FY 2012-21Fixed-Route Vehicle Program - Fleet Reduction and Smaller Vehicle Procurement
EXPENDITURES Replacement Vehicles # of Vehicles FY2012 FY2013 FY2014 FY2015 FY2016 FY2017 FY2018 FY2019 FY2020 FY2021 10 Year Total2000 Gillig Coaches (40 ft) 40 ft standard hybrid coaches 5 $3,928,432 $3,928,4322002 Gillig Coaches (40 ft) 29 ft standard hybrid coaches 8 $02003 Gillig Coaches (29 ft) 29 ft standard hybrid coaches 10 $1,527,503 $1,527,5032003 Gillig Coaches (40 ft) 40 ft standard hybrid coaches 24 $3,707,532 $19,454,534 $23,162,0662006 El Dorado Cutaways (22 ft) 22 ft cutaways or similar 9 $02007 Gillig Coaches (29 ft) 29 ft standard hybrid coaches 2 $02008 El Dorado Cutaways (22 ft) 22 ft cutaways or similar 4 $02009 Gillig Rapid Coaches (29 & 40 29 & 40 ft standard hybrid coach 14 $0TOTAL CAPITAL EXPENSES 76 $0 $0 $0 $0 $7,635,964 $1,527,503 $0 $0 $19,454,534 $0 $28,618,077
# of vehicles10 - 40'
vehicles10 - 29'
vehicles 22 - 40' vehicles
REVENUESFTA Section 5307 $6,108,772 $1,222,003 $15,563,627 $0 $22,894,401
FTA Section 5307 Livermore $1,447,200 $1,490,400 $1,629,000 $0 $4,566,600FTA Section 5307 Concord $4,661,572 -$268,397 $13,934,627 $18,327,801
FTA Section 5309 $0Other Federal Funds $0State/Regional Funds $0Bridge Tolls $226,260 $76,375 $0 $972,727 $0 $1,275,362TDA Article 4.0 $0Proposition 1B PTMISEA $991,163 $991,163Funding Not Secured $309,770 $229,126 $2,918,180 $3,457,075TOTAL CAPITAL REVENUES $0 $0 $0 $0 $7,635,964 $1,527,503 $0 $0 $19,454,534 $0 $28,618,001
Local Match Needed $0 $0 $0 $0 $1,527,193 $305,501 $0 $0 $3,890,907 $0 $1,275,362*5307 Funding and Bridge Toll assumed for replacement purchases. TDA additional local match may be required when purchasing replacements as shown in table.
MTC VEHICLE PRICE40' bus Hybrid Federal $562,786 $579,669 $597,059 $614,971 $633,420 $652,423 $671,996 $692,156 $712,920 $734,308 $756,337 Local $135,286 $139,345 $143,525 $147,831 $152,266 $156,834 $161,539 $166,385 $171,377 $176,518 $181,814 Total $698,072 $719,014 $740,585 $762,802 $785,686 $809,257 $833,535 $858,541 $884,297 $910,826 $938,15130' bus Hybrid Federal $531,140 $547,074 $563,486 $580,391 $597,803 $615,737 $634,209 $653,235 $672,832 $693,017 $713,807 Local $127,679 $131,509 $135,455 $139,518 $143,704 $148,015 $152,456 $157,029 $161,740 $166,592 $171,590 Total $658,819 $678,583 $698,941 $719,909 $741,506 $763,752 $786,664 $810,264 $834,572 $859,609 $885,39822' cutaway Federal $124,500 $128,235 $132,082 $136,045 $140,126 $144,330 $148,660 $153,119 $157,713 $162,444 $167,318 Local $25,500 $26,265 $27,053 $27,865 $28,700 $29,561 $30,448 $31,362 $32,303 $33,272 $34,270 Total $150,000 $154,500 $159,135 $163,909 $168,826 $173,891 $179,108 $184,481 $190,016 $195,716 $201,587
Notes: LAVTA is actively reducing its fleet size due to an excessive spare ratio and defering some replacements as part of a capital exchange of 5307 funding.
E3-C


LAVTA Ten-Year Capital Plan FY 2012-21Major Components Rehab
Engines FY2010 FY2011 FY2012 FY2013 FY2014 FY2015 FY2016 FY2017 FY2018 FY2019 FY2020 FY2021 10 Year Total2003 Gillig Coaches (29 & 40 ft) $735,606 $921,537 $1,047,766 $2,704,9092007 Gillig Coaches (29 ft) $197,937 $197,9372009 Gillig BRT Coaches $1,469,943 $1,469,9432011 Gillig Coaches (29ft) $458,9272000 Gillig Commuter Replacements $626,853 $626,8532002 Gillig Commuter Replacements $02003 Gillig Replacements $0TOTAL ENGINES EXPENSES $0 $735,606 $1,119,474 $1,047,766 $1,469,943 $0 $0 $458,927 $0 $0 $626,853 $5,458,570 # of vehicles 8 12 12 14 4 5 55
Other Major Components FY2010 FY2011 FY2012 FY2013 FY2014 FY2015 FY2016 FY2017 FY2018 FY2019 FY2020 FY2021 10 Year TotalTransmissions $82,400 $84,872 $87,418 $90,041 $92,742 $95,524 $98,390 $101,342 $104,382 $107,513 $944,624
Quantity 4 4 4 4 4 4 4 4 4 4 40 Batteries for Hybrids $81,387 $604,406 $183,204 $47,175 $257,747 $1,173,919
Quantity 2 14 4 1 5 26 TOTAL OTHER EXPENSES $0 $82,400 $166,259 $87,418 $694,447 $92,742 $278,728 $145,565 $101,342 $104,382 $365,261 $2,118,543
TOTAL MAJOR COMPONENTS $0 $818,006 $1,285,733 $1,135,184 $2,164,389 $92,742 $278,728 $604,492 $101,342 $104,382 $992,114 $7,577,113
Major Components Cost escalating at 3% annuallyEngine Price from RFPs
Price with Tax FY 2011 FY 2012 FY 2013 FY 2014 FY 2015 FY 2016 FY 2017 FY 2018 FY 2019 FY 2020 FY 2021 10 Year Total
Engine Replacement (2002 Fleet [8] $ 55,734 61,168$ 63,003$ 64,894$ 66,840$ 68,846$ 70,911$ 73,038$ 75,229$ 77,486$ 79,811$ 82,205$ $783,432Engine Repower (2003 40' Fleet [24] 85,000$ 93,288$ 96,086$ 98,969$ 101,938$ 104,996$ 108,146$ 111,390$ 114,732$ 118,174$ 121,719$ 125,371$ 1,194,807 Transmissions 20,000$ 20,600$ 21,218$ 21,855$ 22,510$ 23,185$ 23,881$ 24,597$ 25,335$ 26,095$ 26,878$ $256,156Hybrid Batteries (6 year replacement)* 38,358$ 39,508$ 40,694$ 41,914$ 43,172$ 44,467$ 45,801$ 47,175$ 48,590$ 50,048$ 51,549$ 491,277
Prices inflated at 3% annually*Battery price based on a quote of $34,950 provided by Gillig in October 2010 plus sales tax of 9.75%REVENUESFTA Section 5307 $0 $0 $0 $0 $0 $0 $0 $0 $0 $0 $0 $0 $0
FTA Section 5307 Livermore $0FTA Section 5307 Concord $0
State/Regional Funds $0Bridge Tolls $0TDA Article 4.0 $0Proposition 1B PTMISEA $147,511 $546,377 $0Funding Not Secured $0 $0 $818,006 $1,285,733 $1,135,184 $2,164,389 $92,742 $278,728 $604,492 $101,342 $104,382 $992,114 $7,577,113TOTAL CAPITAL REVENUES $147,511 $546,377 $818,006 $1,285,733 $1,135,184 $2,164,389 $92,742 $278,728 $604,492 $101,342 $104,382 $992,114 $7,577,113
Estimated Rebuild/Rehab Cost escalating at 3.5% annually Federal $39,336 $40,713 $42,138 $43,613 $45,139 $46,719 $48,354 $50,047 $51,798 $53,611 Local $9,834 $10,178 $10,534 $10,903 $11,285 $11,680 $12,089 $12,512 $12,950 $13,403 Total $49,170 $50,891 $52,672 $54,516 $56,424 $58,399 $60,443 $62,558 $64,748 $67,014
E3-E


LAVTA Ten-Year Capital Plan FY 2012-21Support Vehicle Replacement
EXPENDITURESSupport Vehicle Replacement
EXPENDITURES FY2012 FY2013 FY2014 FY2015 FY2016 FY2017 FY2018 FY2019 FY2020 FY2021 10 Year Total Vehicles2008 Chrysler Town & Country (6306) $30,389 $35,229 $65,618 31999 Dodge Ram (6317) $35,229 $35,229 21999 Dodge Caravan (6318) $30,389 $35,229 $65,618 32002 Low Floor Activan (6401) Disposed $35,229 $35,229 32002 Low Floor Activan (6402) Disposed $35,229 $35,229 32003 Ford F550 Truck (6403) $34,203 $34,203 22007 Chrysler Town & Country (6404) $30,389 $36,286 $66,674 32007 Chrysler Town & Country (6405) $30,389 $36,286 $66,674 32008 Chevy Uplander (6406) $31,300 $37,374 $68,675 32007 Honda Civic Hybrid (6407) $30,389 $36,286 $66,674 32008 Chevy Truck (6408) $34,203 $34,203 22005 Prius Hybrid (6420) $31,300 $37,374 $68,675 3TOTAL VEHICLE EXPENSES $0 $0 $151,944 $62,601 $0 $0 $68,406 $176,144 $108,857 $74,749 $642,700 # of vehicles 0 0 5 2 0 0 2 5 3 2 19
FTA Section 5307 Livermore $0FTA Section 5307 Concord $0
State/Regional Funds $0Bridge Tolls $0TDA Article 4.0 $0 $0Proposition 1B PTMISEA $0Funding Not Secured $0 $0 $151,944 $62,601 $0 $0 $68,406 $176,144 $108,857 $74,749 $642,700TOTAL CAPITAL REVENUES $0 $0 $151,944 $62,601 $0 $0 $68,406 $176,144 $108,857 $74,749 $642,700
General Auto Federal $23,901 $24,618 $25,356 $26,117 $26,901 $27,708 $28,539 $29,395 $30,277 $31,185 $32,121 Local $4,743 $4,886 $5,032 $5,183 $5,339 $5,499 $5,664 $5,834 $6,009 $6,189 $6,375 Total $28,644 $29,504 $30,389 $31,300 $32,239 $33,207 $34,203 $35,229 $36,286 $37,374 $38,496
MTC VEHICLE PRICE
E3-G


LAVTA Ten-Year Capital Plan (includes first year budgeted and 9 years projected)Maintenance and Operations Facility Project
Facility FY2022 FY2008 FY2009 FY2010 FY2011 FY2012 FY2013 FY2014 FY2015 FY2016 10 Year TotalAdministration, Operations $0Maintenance Facility
REVENUES FTA Section 5307 $0 FTA Section 5307 Livermore $0 FTA Section 5307 Concord $0 FTA Section 5309 $0 Other Federal Funds $0 State/Regional Funds $0 Bridge Tolls $0 TDA Article 4.0 $0 Sale of Existing Facility $0TOTAL CAPITAL REVENUES 0 0 0 0 0 0 0 0 0 0 0Unfunded/overfunded Amount $0 $0 $0 $0 $0 $0 $0 $0 $0 $0 $0
Analysis does not include purchase of additional land or sale of existing facility.Analysis does not include any additional operating costs associated with operating a larger facility.Analysis does not include potential lease revenue received from CCCTA (this could offset higher operating costs).
E3-I


LAVTA Ten-Year Capital Plan FY 2012-21Miscellaneous Needs
Facilities Needs FY2012 FY2013 FY2014 FY2015 FY2016 FY2017 FY2018 FY2019 FY2020 FY2021 10 Year TotalNew Shop Floor $105,000 $105,000Lift Replacement $40,000 $40,000Shop Door Motor Replacement $10,000 $10,000Miscellaneous Facility/Office Equipment $80,000 $82,400 $84,872 $87,418 $90,041 $129,853 $95,524 $98,390 $101,342 $104,382 $954,221
Other Facility Needs $51,160 $54,169 $71,759 $46,900 $66,855 $20,000 $62,855 $62,920 $85,684 $88,255 $610,558Computers $12,360 $12,731 $13,113 $13,506 $13,911 $14,329 $14,758 $15,201 $15,657 $16,127 $141,694Servers $16,480 $27,012 $9,274 $95,524 $20,268 $168,559Windows 7 and Office Upgrade $15,500 $17,911 $33,411
Bus Stop Improvements $100,000 $103,000 $106,090 $109,273 $112,551 $115,927 $119,405 $122,987 $126,677 $130,477 $1,146,388TOTAL FACILITY NEEDS $180,000 $340,400 $190,962 $196,691 $202,592 $245,780 $214,929 $221,377 $228,019 $234,859 $2,255,609
Vehicle Needs FY2012 FY2013 FY2014 FY2015 FY2016 FY2017 FY2018 FY2019 FY2020 FY2021 10 Year TotalRadio Vehicle Upgrades
Radios $424,362 $424,362Start Up Fee (EBRCS) $140,000 $140,000Trapeze Upgrade $77,239 $77,239
Vehicle Replacement Rigging for Shop & Shelter replacement trucks $80,000 $80,000
TOTAL VEHICLE NEEDS $0 $641,601 $0 $0 $0 $0 $80,000 $0 $0 $0 $721,601
TOTAL MISCELLANEOUS NEEDS $180,000 $982,001 $190,962 $196,691 $202,592 $245,780 $294,929 $221,377 $228,019 $234,859 $2,977,210
Components Cost escalating at 3% annuallyFY 2012 FY 2013 FY 2014 FY 2015 FY 2016 FY 2017 FY 2018 FY 2019 FY 2020 FY 2021
Computer 1,545$ 1,591$ 1,639$ 1,688$ 1,739$ 1,791$ 1,845$ 1,900$ 1,957$ 2,016$ Server 8,240$ 8,487$ 8,742$ 9,004$ 9,274$ 9,552$ 9,839$ 10,134$ 10,438$ 10,751$
Prices inflated at 3% annually*Radio information from Trapeze and EBRCS* Replacement Shop and Shelter vehicles will need to be outfitted with specialized equipment not included in MTC's pricing schedule. Rigging cost extrapolated from original vehicle purchases (6403 & 6408)
REVENUESFTA Section 5307 $0 $0 $0 $0 $0 $0 $0 $0 $0 $0 $0
FTA Section 5307 Livermore $0FTA Section 5307 Concord $0
State/Regional Funds $0Bridge Tolls $0TDA Article 4.0 $0Proposition 1B PTMISEA $0Funding Not Secured $180,000 $982,001 $190,962 $196,691 $202,592 $245,780 $294,929 $221,377 $228,019 $234,859 $2,977,210TOTAL CAPITAL REVENUES $180,000 $982,001 $190,962 $196,691 $202,592 $245,780 $294,929 $221,377 $228,019 $234,859 $2,977,210
Estimated Rebuild/Rehab Cost escalating at 3.5% annually Federal $40,713 $42,138 $43,613 $45,139 $46,719 $48,354 $50,047 $51,798 $53,611 Local $10,178 $10,534 $10,903 $11,285 $11,680 $12,089 $12,512 $12,950 $13,403 Total $50,891 $52,672 $54,516 $56,424 $58,399 $60,443 $62,558 $64,748 $67,014
E3-K


LAVTA Short Range Transit Plan FY2012-FY2021
Livermore Amador Valley Transit Authority
E4‐A
Fleet Inventory and Replacement Schedule
EXHIBIT 4

LAVTA Short Range Transit Plan FY2012-FY2021
This page intentionally left blank.

Exhibit 4‐1. Fixed Route Fleet
Num
ber o
f Ve
hicle
sMa
nufa
ctur
erYe
ar M
fg.
Leng
th (f
t)Ve
hicle
Typ
eSe
atin
g Ca
pacit
yW
heelc
hair
Capa
city
Powe
r Mod
e
Reha
bilit
atio
n Pe
rform
ed?
Life
Ext
ende
d?Ye
ar to
be
Retir
ed?
Typi
cal S
ervic
e
7Ne
w Fly
er19
9640
Low
Floor
Mo
torbu
s39
2Di
esel
Yes (
No)
--Co
nting
ency
/Loca
l Fix
ed-R
oute
5Gi
llig20
0040
Stan
dard
Mo
torbu
s41
2Di
esel
No20
12Lo
cal F
ixed-
Route
4Gi
llig20
0240
Stan
dard
Mo
torbu
s37
2Di
esel
No20
14Re
giona
l Exp
ress
4Gi
llig20
0240
Low
Floor
Mo
torbu
s40
2Di
esel
No20
14Lo
cal F
ixed-
Route
24Gi
llig20
0340
Low
Floor
Mo
torbu
s39
2Di
esel
No20
16Lo
cal F
ixed-
Route
10Gi
llig20
0329
Low
Floor
Mo
torbu
s23
2Di
esel
No20
16Lo
cal F
ixed-
Route
9El
Dor
ado
2006
22Cu
taway
Van
122
Dies
elNo
2013
Loca
l Fixe
d-Ro
ute
2Gi
llig20
0729
Low
Floor
Mo
torbu
s23
2Di
esel
Elec
tric
Hybr
idNo
2019
Loca
l Fixe
d-Ro
ute
6El
Dor
ado
2008
22Cu
taway
Van
122
Dies
elNo
2015
Loca
l Fixe
d-Ro
ute
2Gi
llig20
0929
Low
Floor
Mo
torbu
s23
2Di
esel
Elec
tric
Hybr
idNo
2021
Bus R
apid
Tran
sit
12Gi
llig20
0940
Low
Floor
Mo
torbu
s39
2Di
esel
Elec
tric
Hybr
idNo
2021
Bus R
apid
Tran
sit
2Gi
llig20
1129
Low
Floor
Mo
torbu
s22
2Di
esel
Elec
tric
Hybr
idNo
2023
Loca
l Fixe
d-Ro
ute
2Gi
llig20
1129
Low
Floor
Mo
torbu
s22
2Di
esel
Elec
tric
Hybr
idNo
2023
Bus R
apid
Tran
sit
73Ac
tive R
egula
r Fixe
d Rou
te16
Activ
e Bus
Rap
id Tr
ansit
0De
mand
Res
pons
e89
Total
Acti
ve F
leet
E4-
A
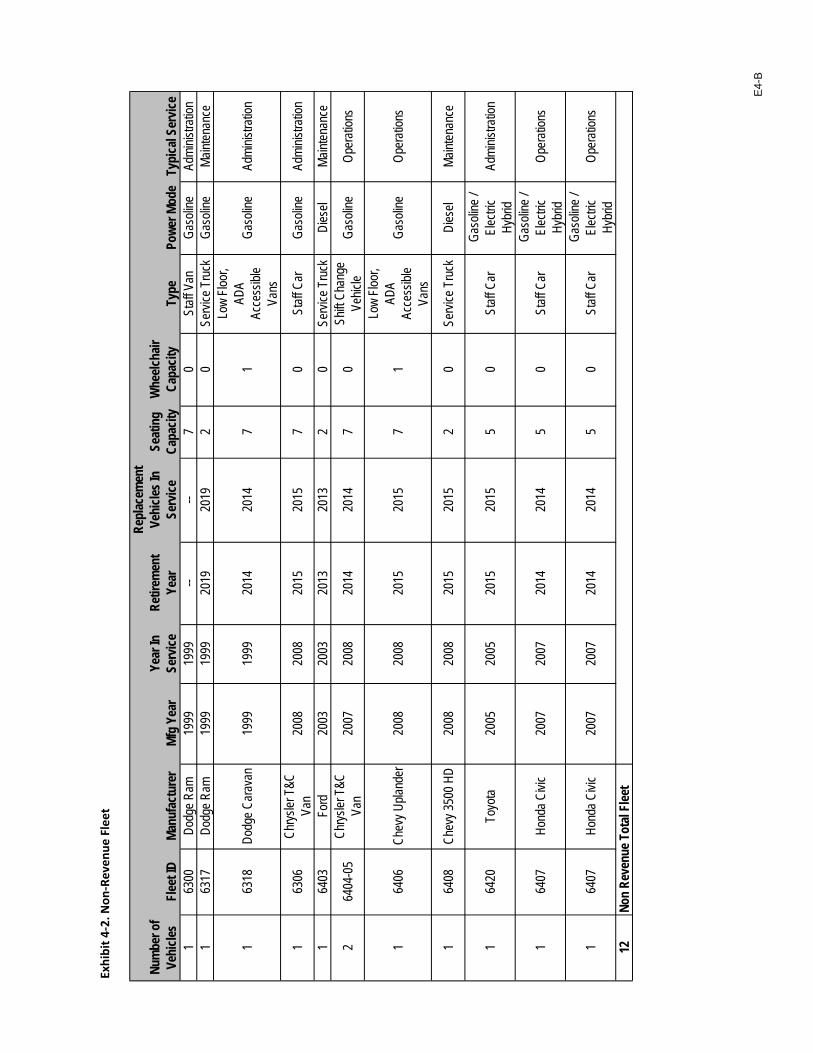
Exhibit 4‐2. N
on‐Revenue Fleet
Num
ber o
f Ve
hicle
sFl
eet I
DMa
nufa
ctur
erMf
g Ye
arYe
ar In
Se
rvice
Retir
emen
t Ye
ar
Repl
acem
ent
Vehi
cles I
n Se
rvice
Seat
ing
Capa
city
Whe
elcha
ir Ca
pacit
yTy
pePo
wer M
ode
Typi
cal S
ervic
e1
6300
Dodg
e Ram
1999
1999
----
70
Staff
Van
Gaso
line
Admi
nistra
tion
163
17Do
dge R
am19
9919
9920
1920
192
0Se
rvice
Tru
ckGa
solin
eMa
inten
ance
163
18Do
dge C
arav
an19
9919
9920
1420
147
1
Low
Floor
, AD
A Ac
cess
ible
Vans
Gaso
line
Admi
nistra
tion
163
06Ch
rysler
T&C
Va
n20
0820
0820
1520
157
0St
aff C
arGa
solin
eAd
minis
tratio
n
164
03Fo
rd20
0320
0320
1320
132
0Se
rvice
Tru
ckDi
esel
Maint
enan
ce
264
04-0
5Ch
rysler
T&C
Va
n20
0720
0820
1420
147
0Sh
ift Ch
ange
Ve
hicle
Gaso
line
Oper
ation
s
164
06Ch
evy U
pland
er20
0820
0820
1520
157
1
Low
Floor
, AD
A Ac
cess
ible
Vans
Gaso
line
Oper
ation
s
164
08Ch
evy 3
500 H
D20
0820
0820
1520
152
0Se
rvice
Tru
ckDi
esel
Maint
enan
ce
164
20To
yota
2005
2005
2015
2015
50
Staff
Car
Gaso
line /
El
ectric
Hy
brid
Admi
nistra
tion
164
07Ho
nda C
ivic
2007
2007
2014
2014
50
Staff
Car
Gaso
line /
El
ectric
Hy
brid
Oper
ation
s
164
07Ho
nda C
ivic
2007
2007
2014
2014
50
Staff
Car
Gaso
line /
El
ectric
Hy
brid
Oper
ation
s
12No
n Re
venu
e Tot
al Fl
eet
E4-
B

Exhi
bit 4
-3. R
eplac
emen
t Fixe
d Ro
ute F
leet S
ched
ule
Num
ber o
f Ve
hicle
sAn
ticip
ated
Mf
g Ye
arVe
hicle
Le
ngth
Antic
ipat
ed
Year
In
Serv
iceVe
hicle
Typ
eSe
atin
g Ca
pacit
yW
heelc
hair
Capa
city
Powe
r Mo
deFu
nd
Sour
ces
Typi
cal S
ervic
e
1020
1640
'20
16Lo
w Flo
or
Motor
bus
402
Dies
el El
ectric
Hy
brid
Secti
on
5307
Regio
nal F
ixed-
Route
1020
1729
'20
17Lo
w Flo
or
Motor
bus
232
Dies
el El
ectric
Hy
brid
Secti
on
5307
Loca
l Fixe
d-Ro
ute
2220
2040
2016
Low
Floor
Mo
torbu
s40
2Di
esel
Elec
tric
Hybr
id
Secti
on
5307
Loca
l Fixe
d-Ro
ute
10To
tal 29
' Rep
lacem
ents
32To
tal 40
' Rep
lacem
ents
42To
tal R
eplac
emen
ts
E4-
C


LAVTA Short Range Transit Plan FY2012-FY2021
Livermore Amador Valley Transit Authority
A
APPENDIX A
Title VI Report
APPENDIX A

LAVTA Short Range Transit Plan FY2012-FY2021
This page intentionally left blank.

Livermore Amador Valley Transit Authority (LAVTA) Title IV Update / June 2012
TITLE VI PROGRAM 1. TITLE VI ANNUAL CERTIFICATIONS AND ASSURANCES LAVTA shall submit its annual Title VI assurance as part of our annual Certifications and Assurance submission to FTA. 2. TITLE VI COMPLAINT PROCEDURES Background LAVTA has a file established for all title VI complaints. This file is stored at the Agency’s office at 1362 Rutan Drive Suite 100 Livermore, Ca 94551. The file is available for review by anyone making such a request. All complaints will be investigated by LAVTA’s third party claims adjuster or legal counsel. A record of the investigation will accompany a copy of the original complaint in the file. Additionally any notification of legal action as well as the results of any legal action will be filed with the original complaint and investigation documents. Procedure Upon receipt of a complaint regarding a violation of civil rights a copy must be made and placed in a folder labeled with the name of the filer and date of filing. This folder shall be filed in the Title VI folder. The original will be submitted to LAVTA’s third party claims adjuster or legal counsel for an investigation. Any additional correspondence from the filer will be handled in the same manner with a copy being filed with the copy of the claim in the Title VI claim folder. Any correspondence from the third party claims adjuster or legal counsel pertaining to the claim will also be filed with the copy of the original claim. If the third party claims adjuster determines it necessary, they will forward the claim onto legal counsel, and any correspondence received from them will be handled in the manner described above.
3. REQUIREMENT TO RECORD TITLE VI INVESTIGATIONS, COMPLAINTS, AND LAWSUITS LAVTA has had one Title VI complaints since the last title VI submission. The complaint was filed by Mrs. Essie Smith who reside who resides at 890 A 69th Ave., Oakland, CA 94621. Mrs. Smith, an African American woman, filed a Title VI complaint on March 28, 2012 alleging she was the victim of discrimination based on her color/race on March 27, 2012. After performing an investigation into her complaint, LAVTA concluded that there was no evidence of any racial discrimination directed against Mrs. Smith. The driver, Lakhvir Singh Sandhu, had followed standard operating procedures. Mrs. Smith currently is preparing an appeal to the final investigations report. This Title VI complaint is still in the process of settlement. 4. REQUIREMENT TO PROVIDE MEANINGFUL ACCESS TO LEP (LIMITED ENGLISH PROFICIENCY) PERSONS See Attachment 1 for LAVTA’s LEP Plan. 5. REQUIREMENT TO NOTIFY BENEFICIARIES OF PROTECTION UNDER TITLE VI The LAVTA’s notice to the public with instructions on how to find out additional information on LAVTA’s Title VI Program, and how to file a claim of discrimination, is below. This notice is posted on the LAVTA website, in public areas at LAVTA’s Administration & Operations Facility on Rutan Court, and at LAVTA’s Livermore Transit Center.
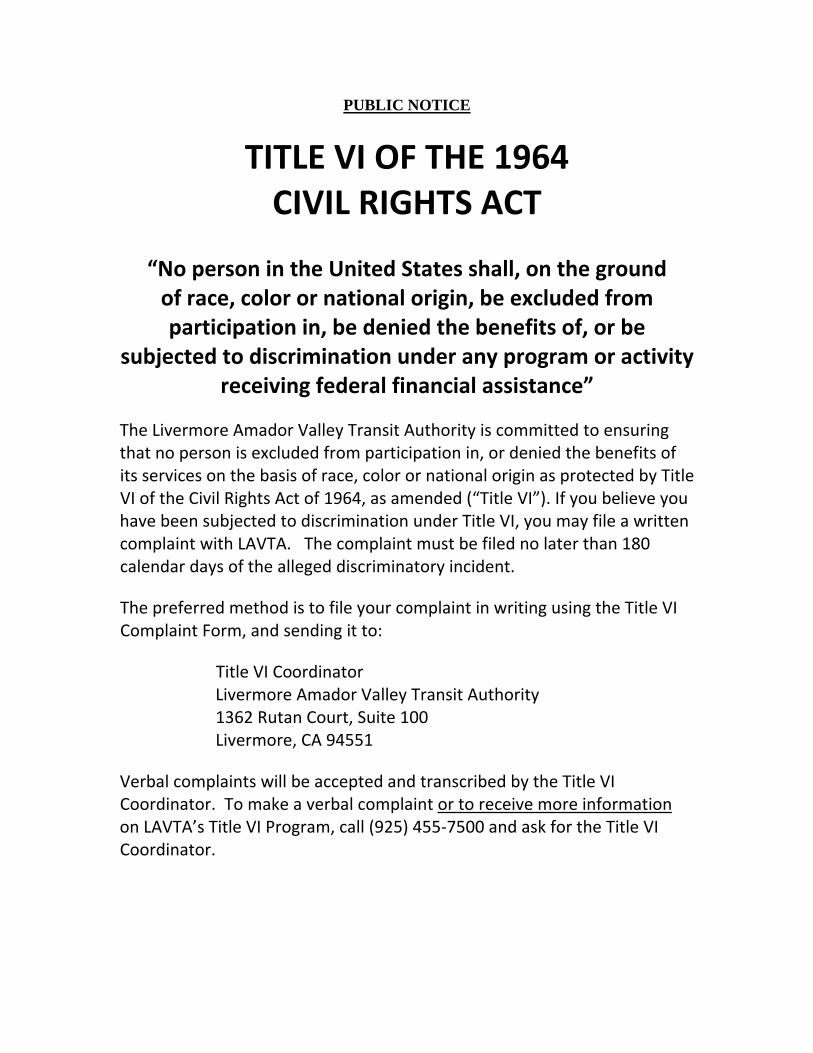
PUBLIC NOTICE
TITLE VI OF THE 1964 CIVIL RIGHTS ACT
“No person in the United States shall, on the ground of race, color or national origin, be excluded from participation in, be denied the benefits of, or be
subjected to discrimination under any program or activity receiving federal financial assistance”
The Livermore Amador Valley Transit Authority is committed to ensuring that no person is excluded from participation in, or denied the benefits of its services on the basis of race, color or national origin as protected by Title VI of the Civil Rights Act of 1964, as amended (“Title VI”). If you believe you have been subjected to discrimination under Title VI, you may file a written complaint with LAVTA. The complaint must be filed no later than 180 calendar days of the alleged discriminatory incident.
The preferred method is to file your complaint in writing using the Title VI Complaint Form, and sending it to:
Title VI Coordinator Livermore Amador Valley Transit Authority 1362 Rutan Court, Suite 100 Livermore, CA 94551
Verbal complaints will be accepted and transcribed by the Title VI Coordinator. To make a verbal complaint or to receive more information on LAVTA’s Title VI Program, call (925) 455‐7500 and ask for the Title VI Coordinator.

The notice is also posted on the LAVTA website as follows:
LAVTA Title VI Complaint Process
The Livermore Amador Valley Transit Authority (LAVTA) operates its services without regard to race, color, and national origin in accordance with Title VI of the Civil Rights Act. Any person who believes she or he has been aggrieved by any unlawful discriminatory practice under Title VI may file a complaint with LAVTA.
For more information on LAVTA's civil rights program, and the procedures to file a complaint, contact 925‐455‐7555 or visit our administrative office at 1362 Rutan Court, Suite 100, Livermore CA 94551.
Title VI Complaint Procedures
If you believe that you have received discriminatory treatment based on race, color or national origin with regard to transit services delivery, you have the right to file a Title VI complaint with the Authority’s Title VI Coordinator. Federal and State laws require complaints to be filed within one‐hundred and eighty (180) calendar days of the last alleged incident. You may download a complaint form below or you may also call customer service and ask for a Title VI Complaint Form to be mailed to you. You may also submit a written statement that contains all the information listed below. Complaints should be mailed or delivered to: Title VI Coordinator Livermore Amador Valley Transit Authority 1362 Rutan Drive, Suite 100 Livermore, CA 9455
All complaints should include the following information:
1. Name, address, and telephone number of the complainant. 2. The basis of the complaint; (e.g, race, color, or national origin). 3. The date(s) on which the alleged discriminatory event occurred. 4. The nature of the incident that led the complainant to feel discrimination was a
factor. 5. Names, addresses and telephone numbers of persons who may have knowledge
of the event. 6. Other agencies or courts where complaint may have been filed and a contact
name.
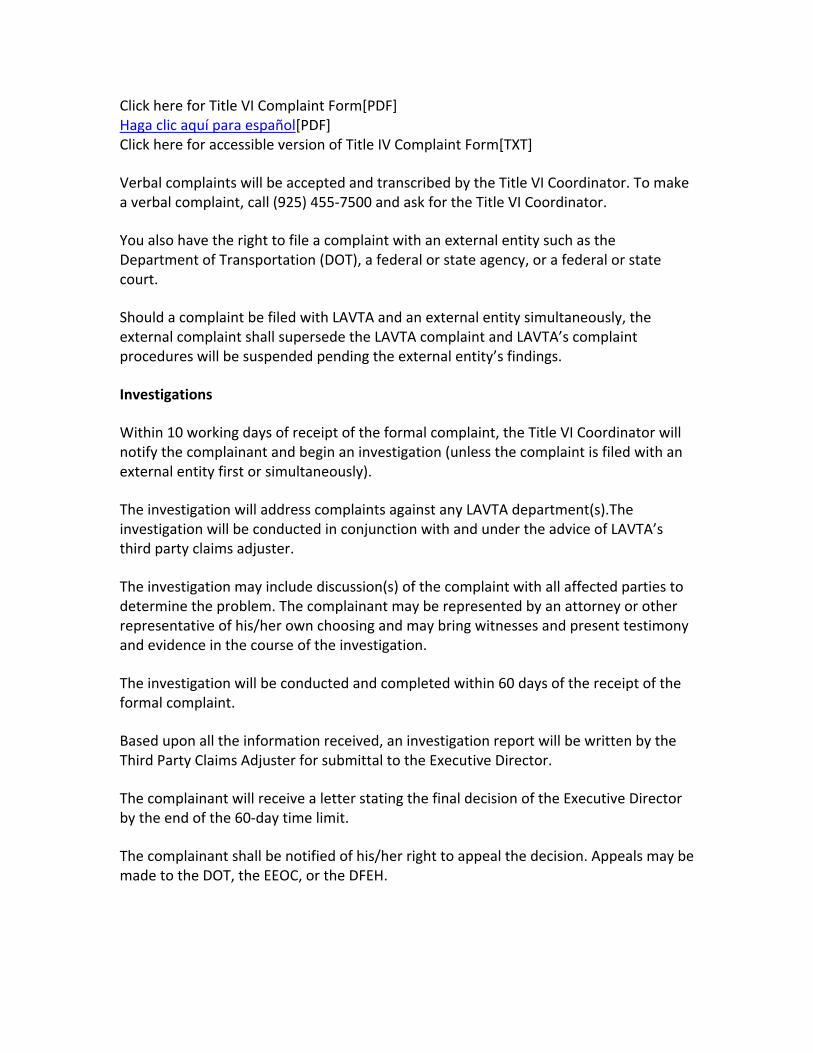
Click here for Title VI Complaint Form[PDF] Haga clic aquí para español[PDF] Click here for accessible version of Title IV Complaint Form[TXT]
Verbal complaints will be accepted and transcribed by the Title VI Coordinator. To make a verbal complaint, call (925) 455‐7500 and ask for the Title VI Coordinator.
You also have the right to file a complaint with an external entity such as the Department of Transportation (DOT), a federal or state agency, or a federal or state court.
Should a complaint be filed with LAVTA and an external entity simultaneously, the external complaint shall supersede the LAVTA complaint and LAVTA’s complaint procedures will be suspended pending the external entity’s findings.
Investigations
Within 10 working days of receipt of the formal complaint, the Title VI Coordinator will notify the complainant and begin an investigation (unless the complaint is filed with an external entity first or simultaneously).
The investigation will address complaints against any LAVTA department(s).The investigation will be conducted in conjunction with and under the advice of LAVTA’s third party claims adjuster.
The investigation may include discussion(s) of the complaint with all affected parties to determine the problem. The complainant may be represented by an attorney or other representative of his/her own choosing and may bring witnesses and present testimony and evidence in the course of the investigation.
The investigation will be conducted and completed within 60 days of the receipt of the formal complaint.
Based upon all the information received, an investigation report will be written by the Third Party Claims Adjuster for submittal to the Executive Director.
The complainant will receive a letter stating the final decision of the Executive Director by the end of the 60‐day time limit.
The complainant shall be notified of his/her right to appeal the decision. Appeals may be made to the DOT, the EEOC, or the DFEH.
6. REQUIREMENT TO PROVIDE ADDITIONAL INFORMATION UPON REQUEST. LAVTA is prepared to provide additional information upon request to aid in the investigation of complaints of discrimination or to resolve concerns about possible non‐compliance with Title VI. 7. REQUIREMENT TO PREPARE AND SUBMIT A TITLE VI PROGRAM. The FTA requires LAVTA to report certain general information to determine compliance with Title VI. The collection and reporting of this program (and this report) constitute LAVTA’s Title VI Program. 8. CONDUCTING AN ANALYSIS OF CONSTRUCTION PROJECTS The only construction project in FY 12 which required compliance with the National Environmental Policy Act has been the development of Atlantis project, a bus wash and fuel facility located at Atlantis Court, Livermore CA. LAVTA was granted a Categorical Exclusion (CE) for the project, which included a section on community disruption and environmental justice. 9. GUIDANCE ON PROMOTING INCLUSIVE PUBLIC PARTICIPATION PUBLIC OUTREACH ACTIVITIES SINCE LAST TITLE VI SUBMISSION All of the following public outreach events were held in locations easily accessible by public transit: August 2011:
• Wells Middle School Registration Day
• Dollar Store Service Change Outreach
• Livermore Farmers Market
• Livermore Senior Center Clipper Card Outreach
• Livermore School District Health Fair
September 2011:
• Pleasanton Wednesday Night Street Party
• Safeway Corporation Benefits Fair
• Wheels Transit Center 25th Anniversary* October 2011:
• Hacienda Green Scene & Transportation Fair
• Cape Head Start Presentation

November 2011:
• Ridgeview Commons Senior Housing Travel Training Presentation December 2011:
• Wheels Holiday Food Drive January 2012:
• Employer New Rider Mass Mailing
• Large Apartment Complexes Mass Mailing
• Ridgeview Commons Clipper Card Outreach February 2012:
• Pleasanton Farmer’s Market – New Stroller Policy Outreach March 2012:
• Dublin St. Patrick’s Day Celebration – New Stroller Policy Outreach April 2012
• Wells Middle School Latino Parent Night
• Dublin Library Transit Workshop
• Pleasanton Library Transit Workshop
• LAVTA Administration Office Transit Workshop May 2012:
• Livermore Wine Festival
• Clorox Transportation Fair
• Dublin Farmer’s Market
• LAVTA Public Hearing on Proposed Service Changes for Fall 2012 All events, with the exception of the Dublin Farmers Market, were attended by a Spanish speaking staff member.

This page intentionally left blank.

ATTACHMENT 1:
Livermore Amador Valley Transit Authority
Limited English Proficiency Plan

This page intentionally left blank.

Limited English Proficiency (LEP) Plan
Improving Access to Services for Persons with Limited English Proficiency
June 2012
Livermore Amador Valley Transit Authority 1362 Rutan Court, Suite 100
Livermore, CA 94551
(925) 455‐7555 Fax (925) 443‐1374 www.wheelsbus.com

This page intentionally left blank.

‐ i ‐
Table of Contents
1. Introduction 1 2. Plan Summary 1 3. LEP Four Factor Analysis 1
3.1 The number or proportion of LEP persons in the service area who may be served or are likely to encounter a LAVTA program, activity or service. 2
3.2 The frequency with which LEP persons come in contact with LAVTA
programs, activities or services. 4 3.3 The nature and importance of programs, activities or services
provided by LAVTA to the LEP population. 4 3.4 The resources available to LAVTA and overall cost to provide LEP
assistance. 4 4. LEP Plan 5
4.1 Identifying LEP individuals who need language assistance 5 4.2 Language Assistance Measures 5 4.3 Staff Training 6 4.4 Providing Notice to LEP Persons 7 4.5 Monitoring and Updating the LEP plan 8
5. Contact Information 9

‐ ii ‐
This page intentionally left blank.
Limited English Proficiency Plan ‐ 1 ‐ Livermore Amador Valley Transit Authority June 2012
1. Introduction This Limited English Proficiency (LEP) Plan has been prepared to address the responsibilities of the Livermore Amador Valley Transit Authority (LAVTA) as a recipient of federal financial assistance as they relate to the needs of individuals with limited English language skills. The plan has been prepared in accordance with Title VI of the Civil Rights Act of 1964, 42 U.S.C. 2000d, et se, and its implementing regulations, which state that no person shall be subjected to discrimination on the basis of race, color or national origin. Executive Order 13166, titled Improving Access to Services for Persons with Limited English Proficiency, indicates that differing treatment based upon a person’s inability to speak, read, write or understands English is a type of national origin discrimination. It directs each federal agency to publish guidance for its’ respective recipients clarifying their obligation to ensure that such discrimination does not take place. This order applies to all state and local agencies which receive federal funds, including the LAVTA which receives federal assistance through the U.S. Department of Transportation (U.S. DOT).
2. Plan Summary LAVTA has developed this LEP Plan to help identify reasonable steps for providing language assistance to persons with limited English proficiency who wish to access services provided by the transit authority. As defined in Executive Order 13166, LEP persons are those who do not speak English as their primary language and have limited ability to read, speak, write or understand English. This plan outlines how to identify a person who may need language assistance, the ways in which assistance may be provided, staff training that may be required, and how to notify LEP persons that assistance is available.
3. LEP Four Factor Analysis In order to prepare this plan, LAVTA undertook the U.S. DOT four‐factor LEP analysis which considers the following factors:
1. The number or proportion of LEP persons in the service area who may be served or are likely to encounter a LAVTA program, activity or service.
2. The frequency with which LEP persons come in contact with LAVTA programs, activities or services.
3. The nature and importance of programs, activities or services provided by LAVTA to the LEP population.
4. The resources available to LAVTA and overall cost to provide LEP assistance.
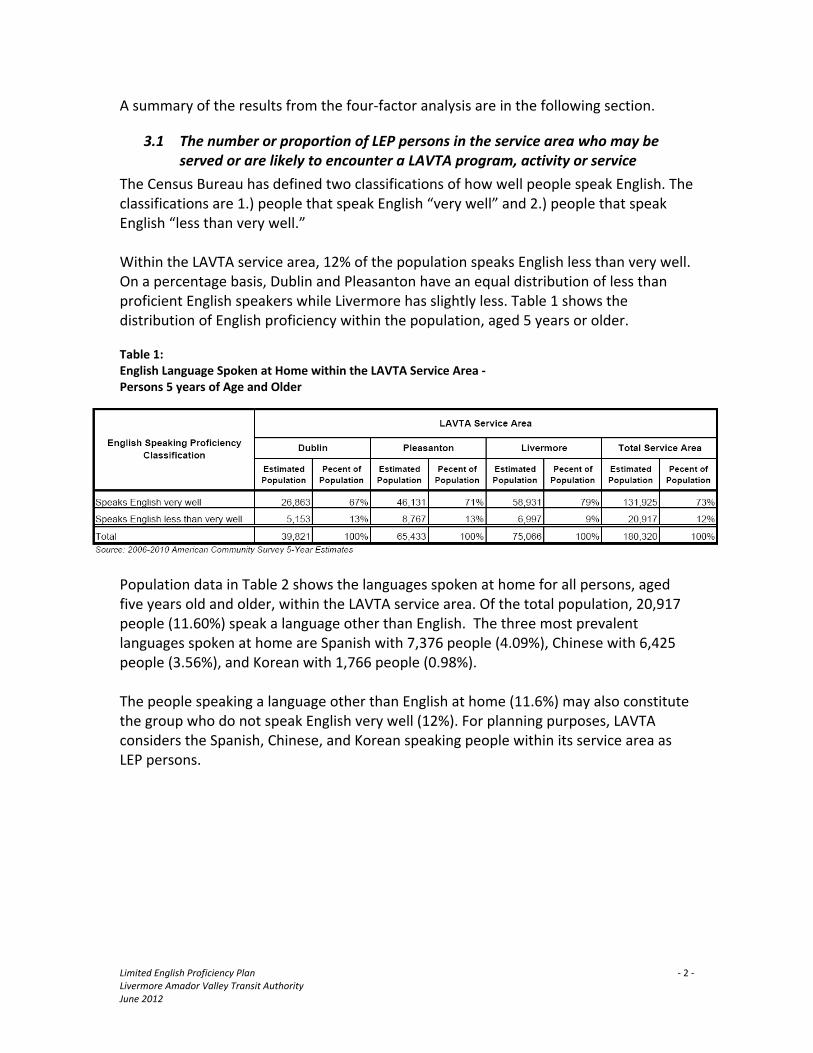
Limited English Proficiency Plan ‐ 2 ‐ Livermore Amador Valley Transit Authority June 2012
A summary of the results from the four‐factor analysis are in the following section.
3.1 The number or proportion of LEP persons in the service area who may be served or are likely to encounter a LAVTA program, activity or service
The Census Bureau has defined two classifications of how well people speak English. The classifications are 1.) people that speak English “very well” and 2.) people that speak English “less than very well.” Within the LAVTA service area, 12% of the population speaks English less than very well. On a percentage basis, Dublin and Pleasanton have an equal distribution of less than proficient English speakers while Livermore has slightly less. Table 1 shows the distribution of English proficiency within the population, aged 5 years or older. Table 1: English Language Spoken at Home within the LAVTA Service Area ‐ Persons 5 years of Age and Older
Population data in Table 2 shows the languages spoken at home for all persons, aged five years old and older, within the LAVTA service area. Of the total population, 20,917 people (11.60%) speak a language other than English. The three most prevalent languages spoken at home are Spanish with 7,376 people (4.09%), Chinese with 6,425 people (3.56%), and Korean with 1,766 people (0.98%). The people speaking a language other than English at home (11.6%) may also constitute the group who do not speak English very well (12%). For planning purposes, LAVTA considers the Spanish, Chinese, and Korean speaking people within its service area as LEP persons.

Limited English Proficiency Plan ‐ 3 ‐ Livermore Amador Valley Transit Authority June 2012
Table 2: Language Spoken at Home for the Population within the LAVTA Service Area ‐ Persons 5 Years of Age and Older

Limited English Proficiency Plan ‐ 4 ‐ Livermore Amador Valley Transit Authority June 2012
3.2 The frequency with which LEP persons come in contact with LAVTA programs, activities or services
LAVTA assessed the frequency with which staff and drivers have, or could have, contact with LEP persons. The following “touch points” and frequencies have been identified:
PRIMARY TOUCH POINTS FREQUENCY Bus Frequently Drivers Frequently Transit Center information line Occasionally – Often Transit Guide Often – frequently Dispatchers (after‐hours customer service) Occasionally DAR reservationists Occasionally Interior car cards Frequently On‐street signage Frequently Website Occasionally Interior fare car cards Frequently
SECONDARY TOUCH POINTS Receptionist Occasionally Ticket vendors Occasionally – often Road Supervisors Occasionally Print media Occasionally Broadcast media Occasionally Public relations media Occasionally Transit fairs Occasionally
3.3 The nature and importance of programs, activities or services provided by LAVTA to the LEP population
The largest concentrations of LEP individuals in the LAVTA service area are people who speak Spanish, Chinese, and Korean. Services provided by LAVTA that are most likely to encounter LEP individuals are the fixed route system which serves the general public and the demand‐response (Dial‐A‐Ride) system which serves primarily senior and disabled persons. It is also likely that LAVTA will encounter LEP individuals at the Livermore Transit Center where discount tickets are sold and community outreach events.
3.4 The resources available to LAVTA and overall cost to provide LEP assistance
LAVTA assessed the available resources that could be used to provide LEP assistance including determining the costs of professional interpreters and translation and taking an inventory of available organizations with whom resources could be shared. LAVTA used this information to determine which of its documents and materials would be the most valuable to be available in multiple languages.

Limited English Proficiency Plan ‐ 5 ‐ Livermore Amador Valley Transit Authority June 2012
4. LEP Plan Based on the four‐factor analysis, LAVTA developed its LEP Plan into five areas as follows:
1. Identifying LEP individuals who need language assistance 2. Language assistance measures 3. Training Staff 4. Providing Notice to LEP persons 5. Monitoring and updating the LEP Plan
4.1 Identifying LEP individuals who need language assistance
How LAVTA may identify an LEP person who needs language assistance
• Examine customer service records for language assistance have been received in the past, either at meetings or over the phone, to determine whether language assistance might be needed at future events;
• When LAVTA sponsors an event, have a staff person greet participants as they arrive. By informally engaging participants in conversation it is possible to informally gauge each attendee’s ability to speak and understand English;
• Have Census Bureau Language Identification Flashcards available at LAVTA events near the registration table. Individuals self‐identifying as persons not proficient in English may not be able to be accommodated with translation assistance at the event, but it will assist in identifying language assistance needs for future events;
• Have Language Identification Flashcards on all transit vehicles to assist coach operators in identifying specific language assistance needs of passengers. If such individuals are encountered, vehicle operators will be instructed to try to obtain contact information to give to the transit system manager for follow‐up. Dispatchers and schedulers will also be instructed to obtain contact information from LEP individuals they encounter, either in person or over the phone, recording passengers request for language assistance in customer service database.
4.2 Language Assistance Measures
There are numerous language assistance measures available to LEP persons, including both oral and written language services. There are also various ways in which LAVTA staff responds to LEP persons, whether in person, by telephone or in writing).

Limited English Proficiency Plan ‐ 6 ‐ Livermore Amador Valley Transit Authority June 2012
How LAVTA will assist an LEP person who needs language assistance
• LAVTA Hispanic Outreach Program will continue to provide vital information to LEP groups on LAVTA programs and services;
• LAVTA will work with local senior centers to provide vital information to LEP groups on LAVTA programs and services;
• Network with local human service organizations that provide services to LEP individuals and seek opportunities to provide information on LAVTA programs and services;
• Provide a statement in notices and publications that interpreter services are available for public hearings and Board of Director meetings, with seven day advance notice;
• When an interpreter is needed, for a language other than Spanish, in person or on the telephone, staff will attempt to access language assistance services from a professional translation service or qualified community volunteers;
• Survey coach operators and other front‐line staff, like dispatchers, dial‐a‐ride schedulers, and service development planners, annually on their experience concerning any contacts with LEP persons during the previous year;
• Provide Language Identification Flashcards at the Transit Center, onboard the LAVTA fleet, in Road Supervisor vehicles and at transit systems administrative offices;
• Post the LAVTA Title VI Policy and LEP Plan on the agency website, www.wheelsbus.com;
• Provide group travel training to LEP persons with the assistance of Spanish speaking staff;
• Encourage the skill to speak multiple languages in the recruitment of customer service representative and bus drivers;
• Host an online translation service on the LAVTA website, which includes the Spanish, Chinese, and Korean languages.
4.3 Staff Training
How LAVTA will train staff on its role and responsibilities in providing meaningful access to services for LEP persons
• Develop curriculum and a corresponding PowerPoint to educate LAVTA staff on the Title VI LEP requirements for providing meaningful access to services for LEP persons;

Limited English Proficiency Plan ‐ 7 ‐ Livermore Amador Valley Transit Authority June 2012
• Provide staff with a description of language assistance services offered by LAVTA;
• Provide staff with specific procedures to be followed when encountering an LEP person, including how to handle a potential Title VI/LEP;
• Instruct staff on the use of FTA Language Identification Flashcards.
4.4 Providing Notice to LEP Persons
How LAVTA will provide Notice to LEP Persons, both oral and written communications
Oral communications:
• Offer general information, such as operation hours of the Transit Center/ Administrative Offices, fares, Lost and Found, etc., on the LAVTA customer service line in English and Spanish;
• Provide a statement affirming that LAVTA will make reasonable accommodations to provide an interpreter at public hearings and meetings with advance notice.
• Implement the use an automated greeting in both Spanish and English, directing callers to select which language they prefer;
• Use the services of a professional translation provider to ensure that vital documents are accurate (vital documents are defined as those documents without which a person would be unable to access services).
Written communications:
• Information about LAVTA’s non‐discrimination policies and information on the local/federal complaint process are provided in Spanish, Chinese, and Korean;
• The introduction section of the Wheels Bus Book which contains information on fares, accessibility, locations where discount tickets and passes are sold and general riding information is included in all Bus Books in Spanish and available upon request in Chinese and Korean;
• The www.lavta.org website can be viewed in Spanish, Chinese and Korean;
• Onboard “take one” flyers containing information about route changes, rider alerts, fare increases and public hearings are provided in Spanish, Chinese, and Korean;
• Temporary signs at bus stops and transit centers informing customers of any detours or route changes include Spanish;
• Interior bus cards displaying cash fare, cost of monthly discount passes and special promotions/campaigns include Spanish;

Limited English Proficiency Plan ‐ 8 ‐ Livermore Amador Valley Transit Authority June 2012
• Interior bus stickers and posters at Transit Center that display safety or system policy information are provided in Spanish;
• Onboard surveys are provided in Spanish.
4.5 Monitoring and Updating the LEP plan
This plan is designed to be flexible, and should be viewed as a work in progress. As such, it is important to consider whether new documents and services need to be made accessible for LEP persons, and also to monitor changes in demo‐graphics and types of services. How LAVTA will examine and update its’ LEP Plan LAVTA will update the LEP as required by U.S. DOT. At a minimum, the plan will be reviewed and updated when it is clear that higher concentrations of LEP individuals are present in the LAVTA service area. The following details the methodology that will be used:
• Record and report how on the number of LEP persons were encountered annually through LAVTA’s Hispanic Education and Outreach Program and working with local Senior Centers;
• Determine how the needs of LEP persons have been addressed;
• Determine the current LEP population in the service area and whether the need for translation services has changed;
• Determine whether local language assistance programs have been effective and sufficient to meet the need;
• Determine whether transit system’s financial resources are sufficient to fund language assistance resources needed;
• Determine whether the LAVTA and its Contractor have fully complied with the goals of this LEP Plan;
• Determine whether complaints have been received concerning the agency’s failure to meet the needs of LEP individuals;
• Obtain input from customers and the general community via LAVTA’s Market Segmentation Study which is conducted every 3 years.
Dissemination of the LAVTA LEP Plan The LAVTA LEP Plan will be disseminated to customers and the community as follows:
• A link to the LAVTA LEP Plan and the Title VI Plan will be included on the LAVTA website, www.lavta.org.

Limited English Proficiency Plan ‐ 9 ‐ Livermore Amador Valley Transit Authority June 2012
• LAVTA’s LEP Plan will also be shared with human service organizations in its service area.
• Any person or agency with internet access will be able to access and download the plan from the LAVTA website. Alternatively, any person or agency may request a copy of the plan via telephone, fax, mail, or in person, and shall be provided a copy of the plan at no cost. LEP individuals may request copies of the plan in translation which LAVTA will provide, if feasible.
5. Contact Information Questions or comments regarding the LEP Plan may be submitted to the LAVTA Executive Director as follows:
Paul Matsuoka, Executive Director Livermore Amador Valley Transit Authority 1362 Rutan Court, Suite 100 Livermore, CA 94551 Phone: (925) 455‐7555 Fax: (925) 443‐1375
Related Documents