Projected U.S. wheat supplies for 2013/14 are raised 10 million bushels with higher expected imports from a larger wheat crop in Canada. U.S. trade and food use changes by class largely reflect higher projected exports by Canada. Hard red spring (HRS) wheat imports are raised 10 million bushels and durum imports are raised 5 million bushels. Partly offsetting is a 5-million-bushel reduction in projected soft red winter wheat imports. Food use is raised 10 million bushels for HRS wheat and lowered 10 million bushels for hard red winter (HRW) wheat. HRS wheat exports are lowered 10 million bushels reflecting increased competition from Canadian spring wheat. HRW wheat exports are raised an offsetting 10 million bushels on the strong pace of sales and shipments in recent weeks. Projected all wheat ending stocks are raised 10 million bushels. The projected range for the 2013/14 season-average farm price is narrowed 10 cents on each end of the range to $6.50 to $7.50 per bushel, well below the 2012/13 record of $7.77 per bushel. Increased foreign production forecast for 2013/14 boosts world wheat supplies this month. The increase in world wheat supplies and slightly lower consumption raise projected world ending stocks. U.S. wheat export prospects are unchanged, while European Union (EU-27) and Canadian exports are on the rise. Wheat Outlook Gary Vocke [email protected] Olga Liefert [email protected] Higher Projected Imports Raise 2013/14 Ending Stocks Economic Research Service Situation and Outlook WHS-13i Sept.16, 2013 Wheat Chart Gallery will be updated on Sept. 16, 2013 The next release is October 16, 2013 -------------- Approved by the World Agricultural Outlook Board.

Welcome message from author
This document is posted to help you gain knowledge. Please leave a comment to let me know what you think about it! Share it to your friends and learn new things together.
Transcript


9 Wheat Outlook/WHS-13i/Sept. 16, 2013
Economic Research Service, USDA
0.00
1.00
2.00
3.00
4.00
5.00
6.00
7.00
8.00
9.00
June July Aug. Sept. Oct. Nov. Dec. Jan. Feb. Mar. Apr. May
Market year
2011/12 2012/13 2013/14
Source: USDA, National Agricultural Statistics Service, Agricultural Prices.
Figure 1All wheat average prices received by farmers
Dollars per bushel
0.00
1.00
2.00
3.00
4.00
5.00
6.00
7.00
8.00
9.00
June July Aug. Sept. Oct. Nov. Dec. Jan. Feb. Mar. Apr. May
Market year
2011/12 2012/13 2013/14
Figure 2Hard red winter wheat average prices received by farmers
Source: USDA, National Agricultural Statistics Service, Agricultural Prices.
Dollars per bushel
0.00
1.00
2.00
3.00
4.00
5.00
6.00
7.00
8.00
9.00
10.00
June July Aug. Sept. Oct. Nov. Dec. Jan. Feb. Mar. Apr. May
Market year
2011/12 2012/13 2013/14
Figure 3Hard red spring wheat average prices received by farmers
Source: USDA, National Agricultural Statistics Service, Agricultural Prices.
Dollars per bushel

10 Wheat Outlook/WHS-13i/Sept 16, 2013
Economic Research Service, USDA
0.00
1.00
2.00
3.00
4.00
5.00
6.00
7.00
8.00
9.00
June July Aug. Sept. Oct. Nov. Dec. Jan. Feb. Mar. Apr. May
Market year
2011/12 2012/13 2013/14
Figure 4Soft red winter wheat average prices received by farmers
Source: USDA, National Agricultural Statistics Service, Agricultural Prices.
Dollars per bushel
0.00
1.00
2.00
3.00
4.00
5.00
6.00
7.00
8.00
9.00
June July Aug. Sept. Oct. Nov. Dec. Jan. Feb. Mar. Apr. May
Market year
2011/12 2012/13 2013/14
Figure 5Soft white wheat average prices received by farmers
Source: USDA, National Agricultural Statistics Service, Agricultural Prices.
Dollars per bushel
0.00
2.00
4.00
6.00
8.00
10.00
12.00
June July Aug. Sept. Oct. Nov. Dec. Jan. Feb. Mar. Apr. May
Market year
2011/12 2012/13 2013/14
Figure 6Durum wheat average prices received by farmers
Dollars per bushel
Source: USDA, National Agricultural Statistics Service, Agricultural Prices.

11 Wheat Outlook/WHS-13i/Sept. 16, 2013
Economic Research Service, USDA
-200 -150 -100 -50 0 50 100 150
Figure 7All wheat: U.S. supply and disappearance change from prior market year
Beginning stocks
Imports
Production
Supply
Domestic use
Exports
Ending stocks
Total disappearance
Million bushels
Source: USDA, World Agricultural Outlook Board, World Agricultural Supply and Demand Estimates.
-250 -200 -150 -100 -50 0 50
Figure 8Hard red winter wheat: U.S. supply and disappearance change from prior market year
Million bushels
Source: USDA, World Agricultural Outlook Board, World Agricultural Supply and Demand Estimates.
Beginning stocks
Imports
Production
Supply
Domestic use
Exports
Total disappearance
Ending stocks
-40 -30 -20 -10 0 10 20
Figure 9Hard red spring wheat: U.S. supply and disappearance change from prior market year
Beginning stocks
Imports
Production
Supply
Domestic use
Exports
Ending stocks
Total disappearance
Million bushels
Source: USDA, World Agricultural Outlook Board, World Agricultural Supply and Demand Estimates.
12 Wheat Outlook/WHS-13i/Sept. 16, 2013
Economic Research Service, USDA
-100 -50 0 50 100 150
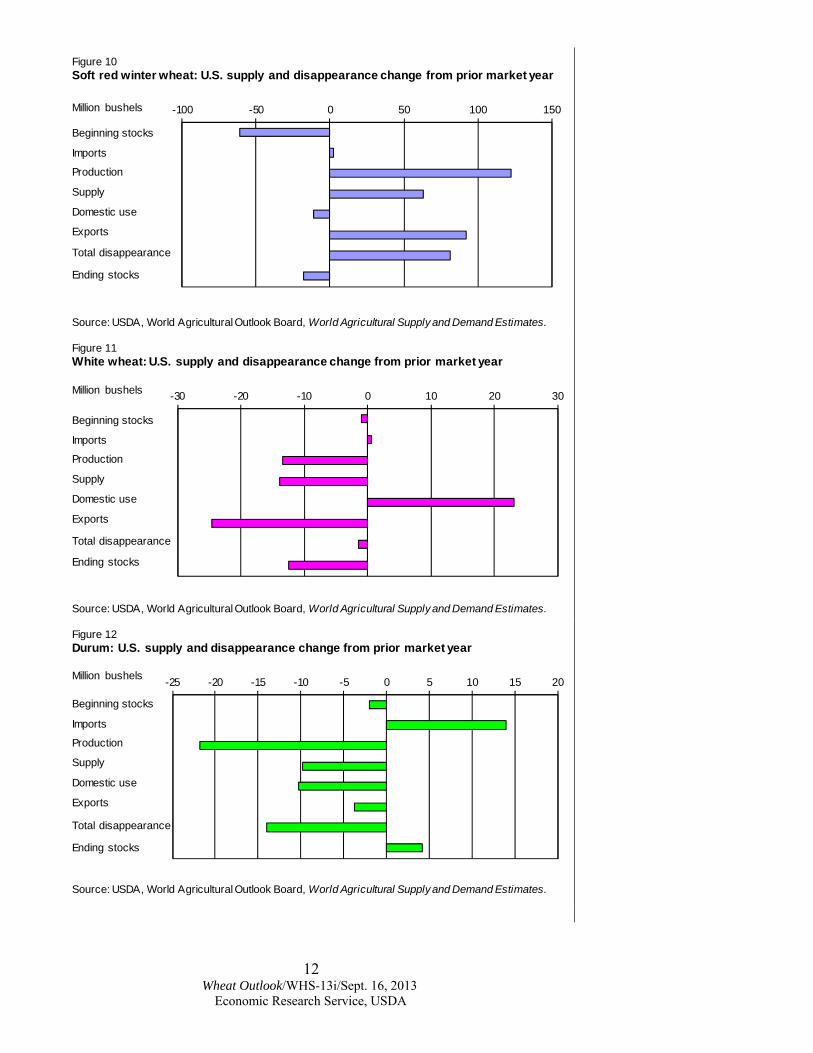
Figure 10Soft red winter wheat: U.S. supply and disappearance change from prior market year
Beginning stocks
Imports
Production
Supply
Domestic use
Exports
Ending stocks
Total disappearance
Million bushels
Source: USDA, World Agricultural Outlook Board, World Agricultural Supply and Demand Estimates.
-30 -20 -10 0 10 20 30
Figure 11White wheat: U.S. supply and disappearance change from prior market year
Beginning stocks
Imports
Production
Supply
Domestic use
Exports
Ending stocks
Total disappearance
Million bushels
Source: USDA, World Agricultural Outlook Board, World Agricultural Supply and Demand Estimates.
-25 -20 -15 -10 -5 0 5 10 15 20
Figure 12Durum: U.S. supply and disappearance change from prior market year
Beginning stocks
Imports
Production
Supply
Domestic use
Exports
Ending stocks
Total disappearance
Million bushels
Source: USDA, World Agricultural Outlook Board, World Agricultural Supply and Demand Estimates.

Contacts and Links
13 Wheat Outlook/WHS-13i/September 16, 2013
Economic Research Service, USDA
Data Wheat Monthly Tables http://www.ers.usda.gov/publications/whs-wheat-outlook Wheat Chart Gallery http://www.ers.usda.gov/data-products/wheat-chart-gallery.aspx Related Websites Wheat Outlook http://www.ers.usda.gov/publications/whs-wheat-outlook/ WASDE http://usda.mannlib.cornell.edu/MannUsda/viewDocumentInfo.do?documentID=1194 Grain Circular, http://www.fas.usda.gov/grain_arc.asp Wheat Topic, http://www.ers.usda.gov/topics/crops/wheat.aspx
Contact Information Gary Vocke (domestic), (202) 694-5285, [email protected] Olga Liefert (international), (202) 694-5155, [email protected] Beverly Payton (Web Publishing), (202) 694-5165, [email protected] Subscription Information Subscribe to ERS e-mail notification service at http://www.ers.usda.gov/subscribe-to-ers-e-newsletters.aspx to receive timely notification of newsletter availability. Printed copies can be purchased from the USDA Order Desk by calling 1-800-363-2068 (specify the issue number) To order printed copies of the five field crop newsletters—cotton and wool, feed, rice, oil crops, and wheat—as a series, specify series SUB-COR-4043
The U.S. Department of Agriculture (USDA) prohibits discrimination in all its programs and activities on the basis of race, color, national origin, age, disability, and, where applicable, sex, marital status, familial status, parental status, religion, sexual orientation, genetic information, political beliefs, reprisal, or because all or a part of an individual’s income is derived from any public assistance program. (Not all prohibited bases apply to all programs.) Persons with disabilities who require alternative means for communication of program information (Braille, large print, audiotape, etc.) should contact USDA’s TARGET Center at (202) 720-2600 (voice and TDD). To file a complaint of discrimination write to USDA, Director, Office of Civil Rights, 1400 Independence Avenue, S.W., Washington, D.C. 20250-9410 or call (800) 795-3272 (voice) or (202) 720-6382 (TDD). USDA is an equal opportunity provider and employer.
E mail Notification Readers of ERS outlook reports have two ways they can receive an e-mail notice about release of reports and associated data. • Receive timely notification (soon after the report is posted on the web) via USDA’s Economics, Statistics and Market Information System (which is housed at Cornell University’s Mann Library). Go to http://usda.mannlib.cornell.edu/MannUsda/aboutEmailService.do and follow the instructions to receive e-mail notices about ERS, Agricultural Marketing Service, National Agricultural Statistics Service, and World Agricultural Outlook Board products. • Receive weekly notification (on Friday afternoon) via the ERS website. Go to http://www.ers.usda.gov/subscribe-to-ers-e-newsletters.aspx and follow the instructions to receive notices about ERS outlook reports, Amber Waves magazine, and other reports and data products on specific topics. ERS also offers RSS (really simple syndication) feeds for all ERS products. Go to http://www.ers.usda.gov/rss/ to get started.

Item and unit 2007/08 2008/09 2009/10 2010/11 2011/12 2012/13 2013/14Area:Planted Million acres 60.5 63.2 59.2 53.6 54.4 55.7 56.5Harvested Million acres 51.0 55.7 49.9 47.6 45.7 49.0 45.7
Yield Bushels per acre 40.2 44.9 44.5 46.3 43.7 46.3 46.2
Supply:Beginning stocks Million bushels 456.2 305.8 656.5 975.6 862.2 742.6 718.3Production Million bushels 2,051.1 2,499.2 2,218.1 2,206.9 1,999.3 2,269.1 2,114.1Imports 1/ Million bushels 112.6 127.0 118.6 96.9 112.1 122.8 140.0Total supply Million bushels 2,619.9 2,932.0 2,993.2 3,279.5 2,973.7 3,134.5 2,972.4
Disappearance:Food use Million bushels 947.9 926.8 918.9 925.6 941.4 945.0 958.0Seed use Million bushels 87.6 78.0 69.5 70.9 76.3 73.4 73.0Feed and residual use Million bushels 16.0 255.2 149.8 129.3 162.3 390.4 280.0Total domestic use Million bushels 1,051.4 1,260.0 1,138.2 1,125.8 1,180.0 1,408.8 1,311.0Exports 1/ Million bushels 1,262.6 1,015.4 879.3 1,291.4 1,051.1 1,007.4 1,100.0Total disappearance Million bushels 2,314.1 2,275.4 2,017.5 2,417.2 2,231.0 2,416.2 2,411.0
Ending stocks Million bushels 305.8 656.5 975.6 862.2 742.6 718.3 561.4
Stocks-to-use ratio 13.2 28.9 48.4 35.7 33.3 29.7 23.3
Loan rate Dollars per bushel 2.75 2.75 2.75 2.94 2.94 2.94 2.94Contract/direct payment rate Dollars per bushel 0.52 0.52 0.52 0.52 0.52 0.52 0.52Farm price 3/ Dollars per bushel 6.48 6.78 4.87 5.70 7.24 7.77 6.50-7.50
Government payments Million dollars 1,118Market value of production Million dollars 13,289 16,626 10,654 12,827 14,323 17,631 14,799
Table 1--Wheat: U.S. market year supply and disappearance, 9/16/2013
Latest market year is projected; previous market year is estimated. Totals may not add due to rounding.1/ Includes flour and selected other products expressed in grain-equivalent bushels.2/ Stocks owned by USDA's Commodity Credit Corporation (CCC). Most CCC-owned inventory is in the Bill Emerson Humanitarian Trust.
Date run: 9/13/2013
3/ U.S. season-average price based on monthly prices weighted by monthly marketings. Prices do not include an allowance for loans outstanding and government purchases.Source: USDA, World Agricultural Outlook Board, World Agricultural Supply and Demand Estimates and supporting materials.
14 Wheat Outlook/WHS-13i/September 16, 2013
Economic Research Service, USDA

Table 2--Wheat by class: U.S. market year supply and disappearance, 9/16/2013
Latest market year is projected; previous market year is estimated. Totals may not add due to rounding.1/ Area and yield data are unpublished National Agricultural Statistics Service data. Supply and disappearance data, except production, are approximations.
Date run: 9/13/2013
Market year, item, and unit All wheatHard red winter 1/
Hard red spring 1/
Soft red winter 1/ White 1/ Durum
2012/13 Area:Planted acreage Million acres 55.74 29.86 11.69 8.12 3.94 2.12Harvested acreage Million acres 48.99 24.67 11.48 6.97 3.78 2.10
Yield Bushels per acre 46.32 40.69 43.95 60.27 68.61 38.99
Supply:Beginning stocks Million bushels 742.62 317.15 151.00 185.00 64.00 25.47Production Million bushels 2,269.12 1,003.86 504.52 419.80 258.98 81.96Imports 2/ Million bushels 122.76 17.67 43.85 17.86 7.40 35.97Total supply Million bushels 3,134.49 1,338.68 699.37 622.67 330.39 143.40
Disappearance:Food use Million bushels 945.03 400.03 228.00 152.00 85.00 80.00Seed use Million bushels 73.40 33.01 14.05 18.97 5.33 2.04Feed and residual use Million bushels 390.36 182.82 60.71 135.05 2.57 9.21Total domestic use Million bushels 1,408.79 615.86 302.76 306.02 92.90 91.25Exports 2/ Million bushels 1,007.36 379.94 231.61 192.64 174.49 28.69Total disappearance Million bushels 2,416.15 995.80 534.37 498.67 267.39 119.94
Ending stocks Million bushels 718.34 342.88 165.00 124.00 63.00 23.46
2013/14 Area:Planted acreage Million acres 56.53 29.36 11.71 9.96 3.97 1.54Harvested acreage Million acres 45.73 20.33 11.39 8.73 3.78 1.50
Yield Bushels per acre 46.23 38.93 41.68 62.09 65.01 40.08
Supply:Beginning stocks Million bushels 718.34 342.88 165.00 124.00 63.00 23.46Production Million bushels 2,114.09 791.36 474.82 542.15 245.55 60.20Imports 2/ Million bushels 140.00 10.00 52.00 20.00 8.00 50.00Total supply Million bushels 2,972.43 1,144.24 691.82 686.15 316.55 133.66
Disappearance:Food use Million bushels 958.00 390.00 250.00 155.00 85.00 78.00Seed use Million bushels 73.00 32.00 17.00 15.00 6.00 3.00Feed and residual use Million bushels 280.00 110.00 20.00 125.00 25.00 .00Total domestic use Million bushels 1,311.00 532.00 287.00 295.00 116.00 81.00Exports 2/ Million bushels 1,100.00 415.00 225.00 285.00 150.00 25.00Total disappearance Million bushels 2,411.00 947.00 512.00 580.00 266.00 106.00
Ending stocks Million bushels 561.43 197.24 179.82 106.15 50.55 27.66
2/ Includes flour and selected other products expressed in grain-equivalent bushels.Source: USDA, National Agricultural Statistics Service, Crop Production and unpublished data; and USDA, World Agricultural Outlook Board, World Agricultural Supply and Demand Estimates and supporting materials.
15 Wheat Outlook/WHS-13i/September 16, 2013
Economic Research Service, USDA

Table 3--Wheat: U.S. quarterly supply and disappearance (million bushels), 9/16/2013
Latest market year is projected; previous market year is estimated. Totals may not add due to rounding.1/ Includes flour and selected other products expressed in grain-equivalent bushels.Source: USDA, World Agricultural Outlook Board, World Agricultural Supply and Demand Estimates and supporting materials.
Date run: 9/13/2013
Market year and quarter Production Imports 1/ Total supply Food use Seed useFeed and
residual use Exports 1/Ending
stocks2005/06 Jun-Aug 2,103 19 2,662 231 2 261 244 1,923
Sep-Nov 20 1,944 238 50 -61 286 1,429Dec-Feb 20 1,450 219 1 4 252 972Mar-May 22 995 228 24 -49 220 571Mkt. year 2,103 81 2,725 917 77 157 1,003 571
2006/07 Jun-Aug 1,808 26 2,406 235 2 205 214 1,751Sep-Nov 29 1,780 243 56 -47 212 1,315Dec-Feb 32 1,346 225 1 28 235 857Mar-May 34 891 234 22 -69 247 456Mkt. year 1,808 122 2,501 938 82 117 908 456
2007/08 Jun-Aug 2,051 30 2,538 240 1 257 323 1,717Sep-Nov 21 1,738 245 60 -120 421 1,132Dec-Feb 24 1,156 227 2 -44 261 709Mar-May 37 746 236 25 -77 257 306Mkt. year 2,051 113 2,620 948 88 16 1,263 306
2008/09 Jun-Aug 2,499 28 2,833 236 2 393 345 1,858Sep-Nov 28 1,886 238 54 -124 295 1,422Dec-Feb 36 1,458 219 1 28 170 1,040Mar-May 35 1,075 233 21 -41 206 657Mkt. year 2,499 127 2,932 927 78 255 1,015 657
2009/10 Jun-Aug 2,218 28 2,902 231 1 261 200 2,209Sep-Nov 24 2,234 237 45 -83 252 1,782Dec-Feb 30 1,812 222 1 31 201 1,356Mar-May 37 1,393 229 21 -59 227 976Mkt. year 2,218 119 2,993 919 69 150 879 976
2010/11 Jun-Aug 2,207 27 3,210 235 2 259 265 2,450Sep-Nov 24 2,473 242 52 -63 311 1,933Dec-Feb 23 1,956 221 1 308 1,425Mar-May 22 1,448 228 16 -67 407 862Mkt. year 2,207 97 3,279 926 71 129 1,291 862
2011/12 Jun-Aug 1,999 21 2,882 230 5 206 295 2,147Sep-Nov 32 2,179 244 52 -17 238 1,663Dec-Feb 30 1,693 231 1 43 217 1,199Mar-May 29 1,228 236 19 -70 301 743Mkt. year 1,999 112 2,974 941 76 162 1,051 743
2012/13 Jun-Aug 2,269 25 3,037 238 1 429 264 2,105Sep-Nov 33 2,137 247 55 -31 197 1,671Dec-Feb 35 1,705 225 1 10 234 1,235Mar-May 30 1,265 236 16 -17 312 718Mkt. year 2,269 123 3,134 945 73 390 1,007 718
2013/14 Mkt. year 2,114 140 2,972 958 73 280 1,100 561
16 Wheat Outlook/WHS-13i/September 16, 2013
Economic Research Service, USDA

1/ Current year is preliminary. Previous year is preliminary through August of current year, estimated afterwards.2/ Food imports and exports used to calculate total food use. Includes all categories of wheat flour, semolina, bulgur, and couscous and selected categories of pasta.3/ Wheat prepared for food use by processes other than milling.
Table 4--Wheat: Monthly food disappearance estimates (1,000 grain-equivalent bushels), 9/16/2013
Date run: 9/13/2013
Mkt year and month 1/
Wheat ground for flour
+ Food imports 2/ + Nonmilled food use 3/
- Food exports 2/ = Food use 4/
2011/12 Jun 70,554 2,237 2,000 1,743 73,048Jul 72,573 2,098 2,000 1,327 75,344Aug 79,317 2,308 2,000 2,390 81,235Sep 76,269 2,245 2,000 1,652 78,863Oct 81,402 2,247 2,000 1,487 84,162Nov 77,915 2,568 2,000 1,763 80,720Dec 73,135 2,464 2,000 1,291 76,308Jan 74,522 2,579 2,000 1,233 77,868Feb 73,931 2,057 2,000 1,330 76,658Mar 78,437 2,555 2,000 1,843 81,149Apr 74,497 2,622 2,000 1,513 77,606May 76,171 2,530 2,000 2,310 78,390
2012/13 Jun 72,876 2,173 2,000 1,760 75,290Jul 75,861 2,296 2,000 2,912 77,245Aug 82,910 2,345 2,000 2,193 85,063Sep 79,725 2,069 2,000 2,283 81,511Oct 81,567 2,462 2,000 1,840 84,189Nov 78,073 2,438 2,000 1,613 80,897Dec 73,283 2,369 2,000 1,442 76,210Jan 72,290 2,191 2,000 1,550 74,931Feb 71,716 2,101 2,000 1,674 74,143Mar 76,088 2,391 2,000 1,744 78,734Apr 74,750 2,581 2,000 1,432 77,899May 76,429 2,530 2,000 2,042 78,917
2013/14 Jun 73,123 2,277 2,000 2,430 74,970Jul 2,519 1,474 1,044
4/ Estimated food use equals wheat ground for flour plus food imports plus nonmilled food use minus food exports. See http://www.ers.usda.gov/topics/crops/wheat/estimating-wheat-supply-and-use/food-use-estimates.aspx for more information.Source: Data through the 2nd quarter of 2011 was calculated using data from U.S. Department of Commerce, Bureau of the Census’ Flour Milling Products (MQ311A) and U.S. Department of Commerce, Bureau of Economic Analysis’ Foreign Trade Statistics. Subsequent flour milling calculations are based on data from the North American Millers Association.
17 Wheat Outlook/WHS-13i/September 16, 2013
Economic Research Service, USDA

Table 5--Wheat: National average price received by farmers (dollars per bushel) 1/, 9/16/2013
1/ Preliminary mid-month, weighted-average price for current month.Source: USDA, National Agricultural Statistics Service, Agricultural Prices.
Month All wheat Winter Durum Other spring2012/13 2013/14 2012/13 2013/14 2012/13 2013/14 2012/13 2013/14
June 6.70 7.32 6.55 7.18 8.31 8.26 7.78 7.72July 7.89 6.93 7.76 6.85 8.67 8.17 8.39 7.29August 8.04 6.91 7.92 6.78 7.76 8.07 8.27 7.00September 8.27 8.25 7.77 8.38October 8.38 8.33 7.61 8.56November 8.47 8.38 8.11 8.65December 8.30 8.15 8.31 8.48January 8.12 8.01 8.24 8.34February 7.97 7.85 8.19 8.11March 7.79 7.63 8.12 7.95April 7.71 7.52 8.01 7.90May 7.68 7.49 8.06 7.84
Table 6--Wheat: National average prices received by farmers by class (dollars per bushel), 9/16/2013
Source: USDA, National Agricultural Statistics Service, Agricultural Prices.Date run: 9/13/2013
Month Hard red winter Soft red winter Hard red spring White
2012/13 2013/14 2012/13 2013/14 2012/13 2013/14 2012/13 2013/14June 6.53 7.35 6.59 6.92 7.81 7.73 6.61 7.29July 7.74 7.04 7.84 6.55 8.41 7.29 7.76 7.19August 7.97 8.30 8.32 7.66September 8.36 8.38 8.42 7.99October 8.43 8.35 8.60 8.10November 8.49 8.34 8.69 8.14December 8.20 8.19 8.50 7.99January 8.02 7.90 8.38 8.03February 7.75 7.78 8.11 8.05March 7.50 7.46 7.94 8.05April 7.49 7.42 7.91 7.71May 7.56 7.31 7.86 7.42
18 Wheat Outlook/WHS-13i/September 16, 2013
Economic Research Service, USDA

Date run: 9/13/2013
Table 7--Wheat: Average cash grain bids at principal markets, 9/16/2013
-- = Not available or no quote.1/ Free on board.Source: USDA, Agricultural Marketing Service, State Grain Reports, http://www.ams.usda.gov/AMSv1.0/ams.fetchTemplateData.do?template=TemplateS&navID=MarketNewsAndTransportationData&leftNav=MarketNewsAndTransportationData&page=LSMarketNewsPageStateGrainReports.
Month
No. 1 hard red winter (ordinary protein)Kansas City, MO
(dollars per bushel)
No. 1 hard red winter (13% protein)
Kansas City, MO(dollars per bushel)
No. 1 hard red winter (ordinary protein)
Portland, OR(dollars per bushel)
No. 1 hard red winter (ordinary protein)Texas Gulf, TX 1/
(dollars per metric ton)
2012/13 2013/14 2012/13 2013/14 2012/13 2013/14 2012/13 2013/14June
7.61 8.32 8.13 8.65 6.75 8.44 276.31 313.42July
9.13 8.14 9.73 8.36 8.66 7.96 345.76 304.79August
9.43 8.12 9.77 8.16 9.07 7.99 349.07 305.52September
9.56 -- 9.86 -- 9.27 -- 353.29 --October
9.62 -- 9.97 -- 9.39 -- 358.07 --November
9.73 -- 10.04 -- 9.62 -- 360.64 --December
9.36 -- 9.71 -- 9.26 -- 347.78 --January
9.09 -- 9.41 -- 8.91 -- 335.47 --February
8.70 -- 9.04 -- 8.66 -- 318.94 --March
8.35 -- 8.72 -- 8.62 -- 309.75 --April
8.30 -- 8.75 -- 8.59 -- 308.28 --May
8.53 -- 8.90 -- 8.79 -- 319.12 --No. 1 dark northern spring
(13% protein)Chicago, IL
(dollars per bushel)
No. 1 dark northern spring (14% protein)Chicago, IL
(dollars per bushel)
No. 1 dark northern spring (14% protein)Portland, OR
(dollars per bushel)
No. 1 hard amber durumMinneapolis, MN
(dollars per bushel)
2012/13 2013/14 2012/13 2013/14 2012/13 2013/14 2012/13 2013/14June
9.02 9.08 9.31 9.18 9.08 9.13 -- --July
10.06 8.56 10.12 8.57 9.17 8.59 -- --August
9.70 8.10 9.71 8.37 9.79 8.39 -- --September
9.81 -- 9.82 -- 9.86 -- -- --October
10.22 -- 10.17 -- 9.66 -- -- --November
10.12 -- 10.15 -- 10.21 -- -- --December
9.82 -- 9.83 -- 9.85 -- -- --January
9.34 -- 9.43 -- 9.48 -- -- --February
9.24 -- 9.33 -- 9.34 -- -- --March
9.08 -- 9.17 -- 9.45 -- -- --April
8.77 -- 9.11 -- 9.30 -- -- --May
-- -- 9.15 -- 9.30 -- -- --
No. 2 soft red winterSt. Louis, MO
(dollars per bushel)
No. 2 soft red winterChicago, IL
(dollars per bushel)
No. 2 soft red winterToledo, OH
(dollars per bushel)
No. 1 soft whitePortland, OR
(dollars per bushel)
2012/13 2013/14 2012/13 2013/14 2012/13 2013/14 2012/13 2013/14June
6.64 7.22 6.56 6.94 6.62 6.75 6.97 --July
8.46 6.72 8.57 6.60 8.70 6.50 8.53 7.23August
8.60 -- 8.70 6.26 8.69 6.32 8.69 7.32September
8.60 -- 8.62 -- 8.59 -- 8.77 --October
8.41 -- 8.49 -- 8.40 -- 8.75 --November
8.52 -- 8.58 -- 8.38 -- 8.87 --December
8.04 -- 8.03 -- 7.91 -- 8.56 --January
7.88 -- 7.69 -- 7.40 -- 8.53 --February
7.70 -- 7.40 -- 7.10 -- 8.59 --March
7.41 -- 7.18 -- 7.00 -- 8.16 --April
7.41 -- 6.97 -- 6.87 -- 7.93 --May
7.22 -- 7.01 -- 6.91 -- 7.71 --
19 Wheat Outlook/WHS-13i/September 16, 2013
Economic Research Service, USDA

Date run: 9/13/2013
Table 8--Wheat: U.S. exports and imports for last 6 months (1,000 bushels), 9/16/2013
Totals may not add due to rounding.1/ Expressed in grain-equivalent bushels. Includes meal, groats, and durum.2/ Expressed in grain-equivalent bushels. Includes bulgur, couscous, and selected categories of pasta.Source: U.S. Department of Commerce, U.S. Census Bureau, Foreign Trade Statistics; and ERS calculations using Census trade statistics.
ItemFeb Mar Apr May Jun Jul
2013 2013 2013 2013 2013 2013Exports All wheat grain 91,025 101,785 108,878 96,400 98,174 113,731
All wheat flour 1/ 1,112 928 785 1,506 1,623 986All wheat products 2/ 597 851 656 704 927 533Total all wheat 92,734 103,564 110,318 98,610 100,724 115,250
Imports All wheat grain 9,121 6,464 8,629 7,689 8,104 9,516All wheat flour 1/ 847 848 914 1,019 875 927All wheat products 2/ 1,279 1,563 1,680 1,534 1,416 1,612Total all wheat 11,248 8,875 11,223 10,241 10,396 12,055
20 Wheat Outlook/WHS-13i/September 16, 2013
Economic Research Service, USDA

Table 9--Wheat: U.S. exports, Census and export sales comparison (1,000 metric tons),10/10/13 2011/12 2012/13 2013/14 (as of 8/29/13)
Importing Out-country Shipments standing Total Data Export Export Export source Census 1/ sales 2/ Census 1/ sales 2/ sales 2/
Country:China 542 534 883 743 2,021 1,746 3,768Japan 3,513 3,512 3,639 3,544 674 517 1,191Mexico 3,794 3,496 2,907 2,760 1,014 573 1,587Nigeria 3,228 3,248 3,031 3,002 802 330 1,132Philippines 2,050 2,039 1,850 1,965 469 309 778Korean Rep. 2,133 1,983 1,311 1,385 326 174 500Egypt 916 950 1,737 1,678 58 0 58Taiwan 893 888 1,065 1,038 271 92 189Indonesia 794 830 488 534 185 160 345Venezuela 642 594 632 631 88 184 272Iraq 571.8 572 209 209 0 0 0EU-27 1,186 1,228 1,323 971 148 52 200Total grain 27,951 26,627 26,837 26,348 9,845 6,522 16,367Total (including products) 28,563 26,813 27,116 26,410 9,857 6,528 16,385USDA forecast of Census 27,416 29,9371/ Source: U.S. Department of Commerce, U.S. Census Bureau2/ Source: USDA, Foreign Agricultural Service, U.S. Export Sales .Source: USDA, Foreign Agricultural Service, U.S. Export Sales .
21 Wheat Outlook/WHS-13i/September 16, 2013
Economic Research Service, USDA
Related Documents