Funct Integr Genomics (2006) 6: 71–80 DOI 10.1007/s10142-005-0001-4 ORIGINAL PAPER Elena A. Salina . Irina N. Leonova . Tatyana T. Efremova . Marion S. Röder Wheat genome structure: translocations during the course of polyploidization Received: 20 December 2004 / Revised: 20 April 2005 / Accepted: 21 April 2005 / Published online: 28 June 2005 # Springer-Verlag 2005 Abstract The genomic organization of Triticum timophee- vii (2n=28, A t A t GG) was compared with hexaploid wheat T. aestivum (2n=42, AABBDD) by comparative mapping using microsatellites derived from bread wheat. Genetic maps for the two crosses T. timopheevii var. timopheevii × T. timopheevii var. typica and T. timopheevii K-38555× T. militinae were constructed. On the first population, 121 loci were mapped, and on the second population 103 loci. The transferability of the wheat markers to T. timopheevii was generally better for the A genome-specific markers (76–78% produced amplification products; 26 and 29% were polymorphic) than for B genome-specific markers (54% produced amplification products; 14 and 16% were polymorphic). Of the D genome-specific markers, one third produced amplification products in T. timopheevii, but only 5 and 2% were polymorphic in the corresponding mapping populations. The maps constructed confirmed the previ- ously described translocation between chromosome arms 6A t S and 1GS and revealed at least two yet unknown re- arrangements on chromosomes 4A t and 6A t . The presence of other translocations and rearrangements between T. timo- pheevii and T. aestivum was demonstrated by a variety of markers mapping to nonhomoeologous positions. Keywords Microsatellite maps . Triticum timopheevii . Wheat . Black glume (Bg) Introduction The genus Triticum includes wheat species with various ploidy levels ranging from diploids to hexaploids. Common wheat Triticum aestivum is a natural allopolyploid with the genomic formula AABBDD, which had evolved through hybridization of a wild emmer wheat (T. dicoccoides; geno- mic formula AABB) and Aegilops tauschii (D genome). Tetraploid wheats from the Timopheevi group (T. araraticum, T. timopheevii, and T. militinae) were not involved in the formation of the genome of common wheat (T. aestivum) and have the genomic formula A t A t GG. The wild-growing species T. araraticum displays a high level of intraspecies divergence related to chromosome rearrangements, mainly translocations. T. militinae is a naked analogue of the cul- tured species T. timopheevii. The Timopheevi wheats form a separate group within the tetraploid wheats with reference to a set of morphological traits, genetic compatibility during hybridization, and natural habitat (reviewed in Goncharov 2002). The amount of data favoring the opinion that the wheats of the Emmer and Timopheevi groups originated in- dependently from the cross of Aegilops speltoides ancestors as a maternal plant and T. urartu ancestors as a paternal plant is increasing. The Emmer group is more ancient than the Timopheevi group (reviewed in Levy and Feldman 2002). The degree of divergence between the genomes of the Em- mer and Timopheevi wheat groups is high, as demonstrated by a limited chromosome pairing and sterility of hybrids (Wagenaar 1961; Feldman 1966). Biochemical, immuno- logical, and molecular assays also demonstrated distinc- tions between these species (reviewed in Feldman 2001; Huang et al. 2002). Cytological studies of T. turgidum and T. timopheevii chromosome structure by N-/C-banding and FISH/GISH as well as analysis of meiotic configurations in interspecific hybrids revealed species-specific chromosome rearrangements in these species. The formation of the Em- mer group species was accompanied by the species-specific translocation involving chromosome arms 4AL, 5AL, and 7BS (Naranjo et al. 1987). Characteristics of the genome of E. A. Salina (*) . I. N. Leonova . T. T. Efremova Institute of Cytology and Genetics, Lavrentiev ave. 10, Novosibirsk, 630090, Russia e-mail: [email protected] Tel.: +7-3832-333719 Fax: +7-3832-331278 M. S. Röder Institute of Plant Genetics and Crop Plant Research (IPK), Corrensstrasse 3, 06466 Gatersleben, Germany

Welcome message from author
This document is posted to help you gain knowledge. Please leave a comment to let me know what you think about it! Share it to your friends and learn new things together.
Transcript
Funct Integr Genomics (2006) 6: 71–80DOI 10.1007/s10142-005-0001-4
ORIGINAL PAPER
Elena A. Salina . Irina N. Leonova .Tatyana T. Efremova . Marion S. Röder
Wheat genome structure: translocations during thecourse of polyploidization
Received: 20 December 2004 / Revised: 20 April 2005 / Accepted: 21 April 2005 / Published online: 28 June 2005# Springer-Verlag 2005
Abstract The genomic organization of Triticum timophee-vii (2n=28, AtAtGG) was compared with hexaploid wheatT. aestivum (2n=42, AABBDD) by comparative mappingusing microsatellites derived from bread wheat. Geneticmaps for the two crosses T. timopheevii var. timopheevii ×T. timopheevii var. typica and T. timopheevii K-38555×T. militinae were constructed. On the first population, 121loci were mapped, and on the second population 103 loci.The transferability of the wheat markers to T. timopheeviiwas generally better for the A genome-specific markers(76–78% produced amplification products; 26 and 29%were polymorphic) than for B genome-specific markers(54% produced amplification products; 14 and 16% werepolymorphic). Of the D genome-specific markers, one thirdproduced amplification products in T. timopheevii, but only5 and 2% were polymorphic in the corresponding mappingpopulations. The maps constructed confirmed the previ-ously described translocation between chromosome arms6AtS and 1GS and revealed at least two yet unknown re-arrangements on chromosomes 4At and 6At. The presenceof other translocations and rearrangements between T. timo-pheevii and T. aestivum was demonstrated by a variety ofmarkers mapping to nonhomoeologous positions.
Keywords Microsatellite maps . Triticum timopheevii .Wheat . Black glume (Bg)
Introduction
The genus Triticum includes wheat species with variousploidy levels ranging from diploids to hexaploids. Commonwheat Triticum aestivum is a natural allopolyploid with thegenomic formula AABBDD, which had evolved throughhybridization of a wild emmer wheat (T. dicoccoides; geno-mic formula AABB) and Aegilops tauschii (D genome).Tetraploidwheats from the Timopheevi group (T. araraticum,T. timopheevii, and T. militinae) were not involved in theformation of the genome of common wheat (T. aestivum)and have the genomic formula AtAtGG. The wild-growingspecies T. araraticum displays a high level of intraspeciesdivergence related to chromosome rearrangements, mainlytranslocations. T. militinae is a naked analogue of the cul-tured species T. timopheevii. The Timopheevi wheats forma separate group within the tetraploid wheats with referenceto a set of morphological traits, genetic compatibility duringhybridization, and natural habitat (reviewed in Goncharov2002). The amount of data favoring the opinion that thewheats of the Emmer and Timopheevi groups originated in-dependently from the cross of Aegilops speltoides ancestorsas a maternal plant and T. urartu ancestors as a paternal plantis increasing. The Emmer group is more ancient than theTimopheevi group (reviewed in Levy and Feldman 2002).The degree of divergence between the genomes of the Em-mer and Timopheevi wheat groups is high, as demonstratedby a limited chromosome pairing and sterility of hybrids(Wagenaar 1961; Feldman 1966). Biochemical, immuno-logical, and molecular assays also demonstrated distinc-tions between these species (reviewed in Feldman 2001;Huang et al. 2002). Cytological studies of T. turgidum andT. timopheevii chromosome structure by N-/C-banding andFISH/GISH as well as analysis of meiotic configurations ininterspecific hybrids revealed species-specific chromosomerearrangements in these species. The formation of the Em-mer group species was accompanied by the species-specifictranslocation involving chromosome arms 4AL, 5AL, and7BS (Naranjo et al. 1987). Characteristics of the genome of
E. A. Salina (*) . I. N. Leonova . T. T. EfremovaInstitute of Cytology and Genetics,Lavrentiev ave. 10,Novosibirsk, 630090, Russiae-mail: [email protected].: +7-3832-333719Fax: +7-3832-331278
M. S. RöderInstitute of Plant Genetics and CropPlant Research (IPK),Corrensstrasse 3,06466 Gatersleben, Germany
Timopheevi wheats are the species-specific translocations6AtS/1GS, 1GS/4GS, and 4GS/4AtL (Jiang and Gill 1994;Rodriguez et al. 2000). Of the three tetraploid species be-longing to the Timopheevi group, a high level of intra-species divergence related to chromosomal rearrangementswas shown only for T. araraticum (Badaeva et al. 1994).
The construction ofmolecular geneticmaps for T. aestivumconfirmed the presence of the translocation 4AL/5AL/7BSin the genome of common wheat and identified pericentricand paracentric inversions of chromosome 4A (Liu et al.1992; Devos et al. 1995a; Nelson et al. 1995). Moleculargenetic maps were also constructed for tetraploid wheats ofthe Emmer group (Blanco et al. 1998; Korzun et al. 1999;Peng et al. 2000). Genomic mapping of commercial plantsis a necessary step in both the study of the structure–func-tion organization and evolution of the plant genome andsolution of a number of tasks related to biotechnology andbreeding. Specific for Timopheevi wheat is a combined re-sistance to many plant diseases; that was the reason forintroducing this wheat species as an initial material in breed-ing. Despite this fact, molecular geneticmaps for the AtAtGGgenomes have not yet been constructed.
In this work, we applied microsatellite markers of T.aestivum for mapping wheats from the Timopheevi group.The mapping involved two populations produced by cross-ing (1) two samples ofT. timopheevii and (2) T. timopheevii×T. militinae. The constructed maps were compared withthe results obtained by mapping the International TriticeaeMapping Initiative (ITMI) population of common wheat(Röder et al. 1998, unpublished data).
Materials and methods
Plant material and DNA isolation
Five accessions of T. timopheevii and T. militinae wereused to develop seven different F1 hybrid combinations.Based on the results for 15 microsatellite markers, theparental forms of crosses T. timopheevii var. timopheevii ×T. timopheevii var. typica and T. timopheevii K-38555×T. militinae displayed the highest level of polymorphism.These populations were selected in the further work formap construction. Mapping was performed on 74 F2 indi-vidual plants in each population. Plant DNAwas extractedfrom young leaves as described in Plaschke et al. (1995).
Morphological markers
Genetic polymorphism was analysed for one morpholog-ical marker, black glumes (Bg) (see catalogue by McIntoshet al. 2000).
Microsatellite analysis and genetic mapping
Different sources of wheat microsatellites were used: Xgwm(Röder et al. 1998, unpublished), Xgdm (Pestsova et al.2000),Xwmc (Gupta et al. 2002),Xbarc (http://www.scabusa.org/research_bio.html), and Taglgap and Taglut (Devos et al.1995b). Polymerase chain reactions (PCRs) and gel elec-trophoresis were performed as described by Röder et al.(1998). PCR fragments in the range 70–300 bpwere detectedand analysed on automated laser fluorescence sequencers(ALFexpress, Amersham Biosciences). The fragment sizeswere calculated using the computer program Fragment Anal-yser 1.02 (Amersham Biosciences) by comparison with in-ternal size standards. The significance of deviations of theobserved allelic frequencies of the marker loci from theexpected ratios (1:2:1 or 3:1) was tested by the chi-squaretest. Genetic mapping was carried out according to Röderet al. (1998) usingMAPMAKER v. 2.0 (Lander et al. 1987).The linkage groups were established with a minimum LODscore of 3.0 and a recombination fraction of 0.4. Recom-bination frequencies were converted into map distances bythe Kosambi mapping function (Kosambi 1944).
Results
Surveying of the T. aestivum microsatellites for theirapplicability to T. timopheevii
Overall, 743 microsatellite markers of the bread wheat ge-nome were tested for their applicability to study the wheatswith the genomic formula AtAtGG. Eventually, 647 Xgwmmarkers, 54Xgdmmarkers, 15Xwmcmarkers, and 25Xbarcmarkers, as well as Xtaglgap and Xtaglut, were used in theanalysis. Of all tested markers, 59.5% amplified in thegenomes of four parental accessions and 23% detectedpolymorphism. The efficiencies of transfer of microsatellitemarkers specific for the individual A, B, and D genomesinto the genome of T. timopheevii were assessed using
Table 1 Amplification of mi-crosatellites in parental genomesof the crosses T. timopheevii var.timopheevii × T. timopheevii var.typica (population I) and T.timopheevii K-38555×T.militinae (population II)
Genomespecificity
No. ofmicrosatellitestested
Amplification inpopulation I
Amplification inpopulation II
Polymorphic inpopulation I
Polymorphic inpopulation II
A genome 159 124 (78%) 121 (76%) 46 (29%) 41 (26%)B genome 198 107 (54%) 104 (53%) 31 (16%) 27 (14%)D genome 171 65 (38%) 59 (35%) 9 (5%) 3 (2%)Total 528 296 (56%) 284 (54%) 86 (16%) 71 (13%)
72
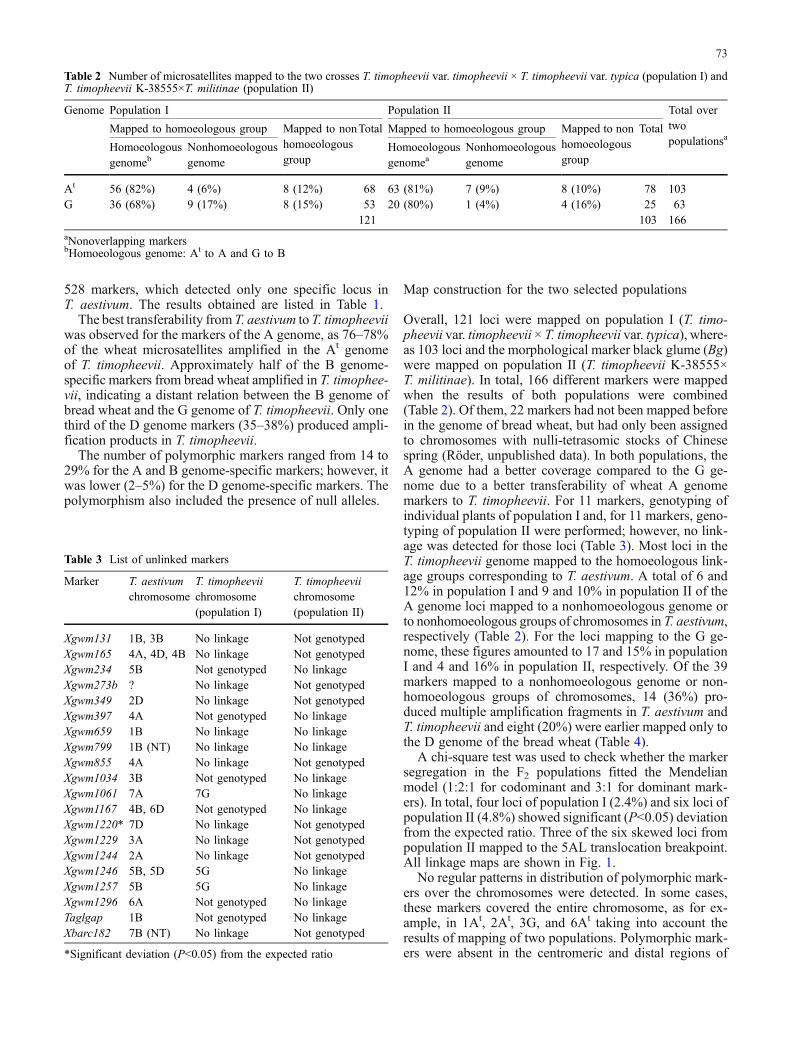
528 markers, which detected only one specific locus inT. aestivum. The results obtained are listed in Table 1.
The best transferability from T. aestivum to T. timopheeviiwas observed for the markers of the A genome, as 76–78%of the wheat microsatellites amplified in the At genomeof T. timopheevii. Approximately half of the B genome-specific markers from bread wheat amplified in T. timophee-vii, indicating a distant relation between the B genome ofbread wheat and the G genome of T. timopheevii. Only onethird of the D genome markers (35–38%) produced ampli-fication products in T. timopheevii.
The number of polymorphic markers ranged from 14 to29% for the A and B genome-specific markers; however, itwas lower (2–5%) for the D genome-specific markers. Thepolymorphism also included the presence of null alleles.
Map construction for the two selected populations
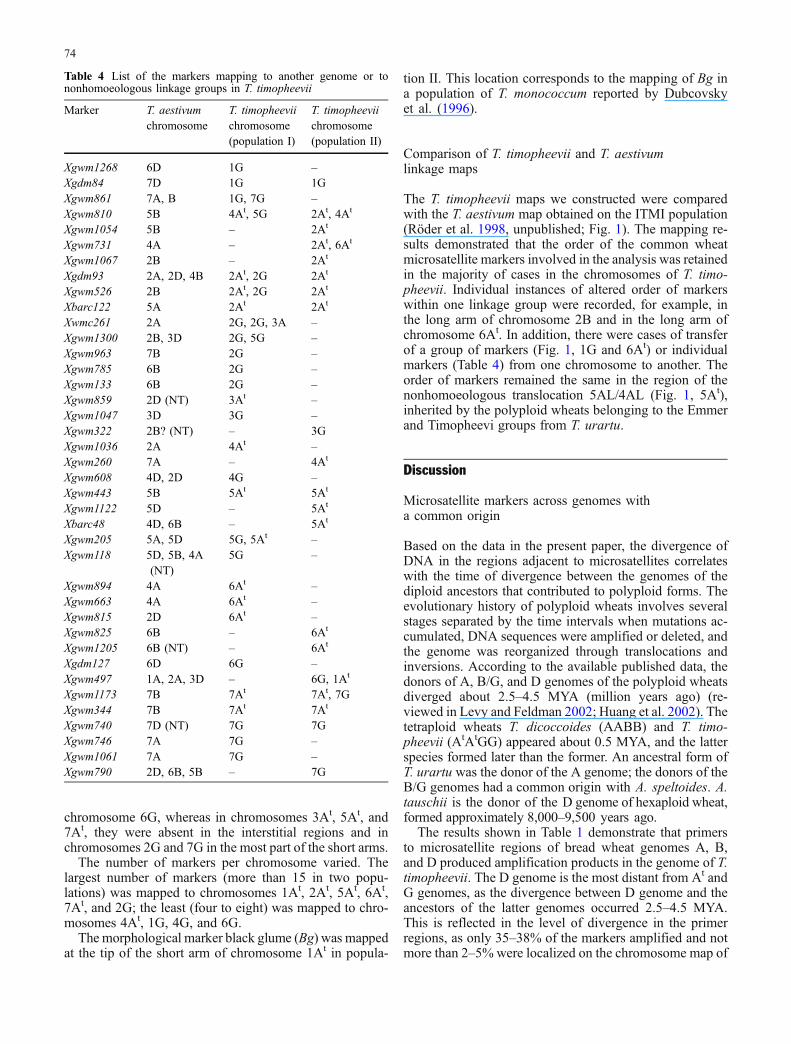
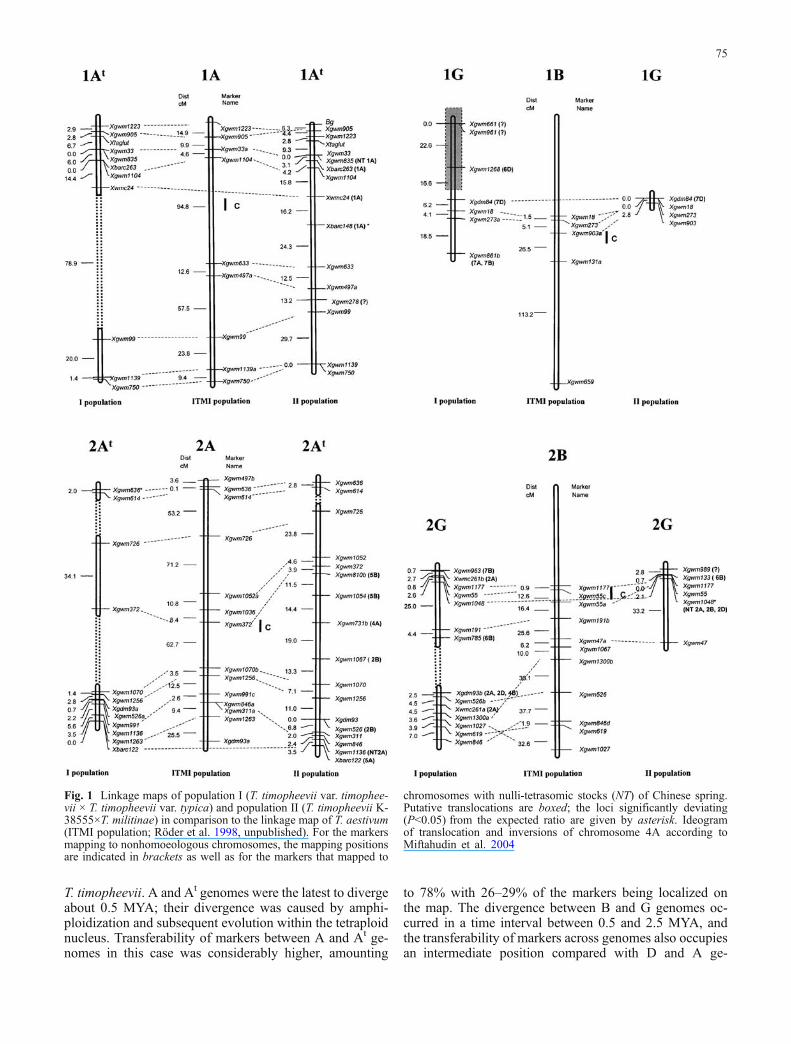
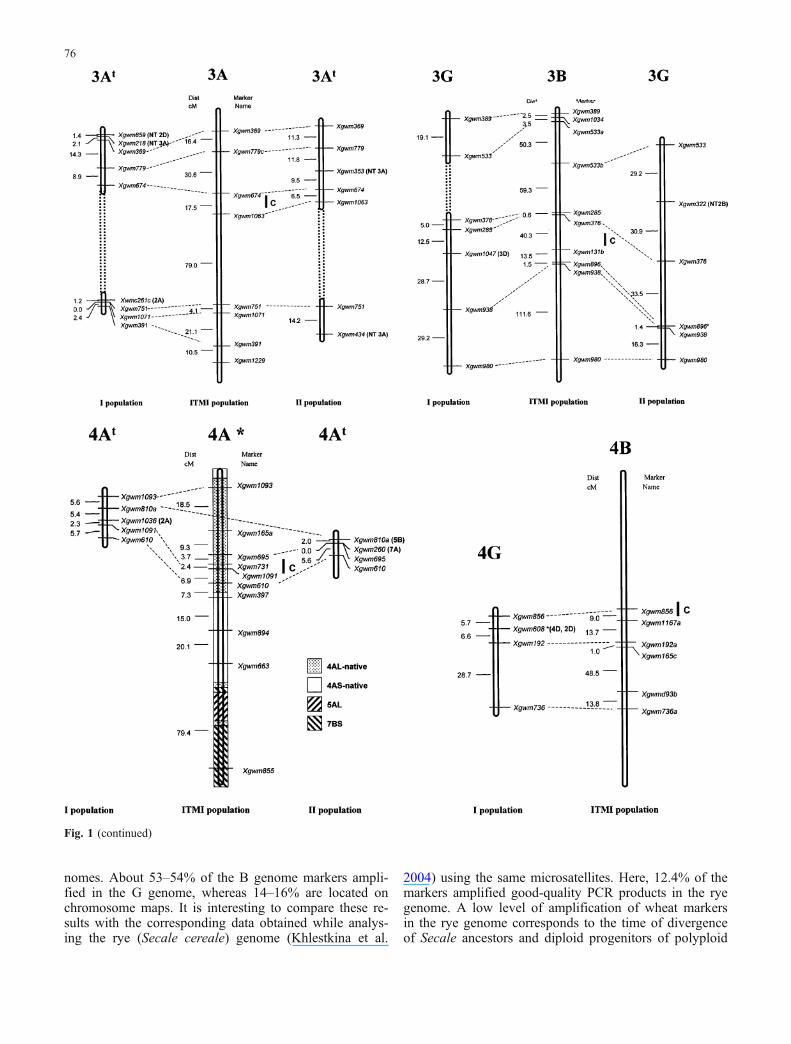
Overall, 121 loci were mapped on population I (T. timo-pheevii var. timopheevii × T. timopheevii var. typica), where-as 103 loci and the morphological marker black glume (Bg)were mapped on population II (T. timopheevii K-38555×T. militinae). In total, 166 different markers were mappedwhen the results of both populations were combined(Table 2). Of them, 22 markers had not been mapped beforein the genome of bread wheat, but had only been assignedto chromosomes with nulli-tetrasomic stocks of Chinesespring (Röder, unpublished data). In both populations, theA genome had a better coverage compared to the G ge-nome due to a better transferability of wheat A genomemarkers to T. timopheevii. For 11 markers, genotyping ofindividual plants of population I and, for 11 markers, geno-typing of population II were performed; however, no link-age was detected for those loci (Table 3). Most loci in theT. timopheevii genome mapped to the homoeologous link-age groups corresponding to T. aestivum. A total of 6 and12% in population I and 9 and 10% in population II of theA genome loci mapped to a nonhomoeologous genome orto nonhomoeologous groups of chromosomes in T. aestivum,respectively (Table 2). For the loci mapping to the G ge-nome, these figures amounted to 17 and 15% in populationI and 4 and 16% in population II, respectively. Of the 39markers mapped to a nonhomoeologous genome or non-homoeologous groups of chromosomes, 14 (36%) pro-duced multiple amplification fragments in T. aestivum andT. timopheevii and eight (20%) were earlier mapped only tothe D genome of the bread wheat (Table 4).
A chi-square test was used to check whether the markersegregation in the F2 populations fitted the Mendelianmodel (1:2:1 for codominant and 3:1 for dominant mark-ers). In total, four loci of population I (2.4%) and six loci ofpopulation II (4.8%) showed significant (P<0.05) deviationfrom the expected ratio. Three of the six skewed loci frompopulation II mapped to the 5AL translocation breakpoint.All linkage maps are shown in Fig. 1.
No regular patterns in distribution of polymorphic mark-ers over the chromosomes were detected. In some cases,these markers covered the entire chromosome, as for ex-ample, in 1At, 2At, 3G, and 6At taking into account theresults of mapping of two populations. Polymorphic mark-ers were absent in the centromeric and distal regions of
Table 2 Number of microsatellites mapped to the two crosses T. timopheevii var. timopheevii × T. timopheevii var. typica (population I) andT. timopheevii K-38555×T. militinae (population II)
Genome Population I Population II Total overtwopopulationsa
Mapped to homoeologous group Mapped to nonhomoeologousgroup
Total Mapped to homoeologous group Mapped to nonhomoeologousgroup
Total
Homoeologousgenomeb
Nonhomoeologousgenome
Homoeologousgenomea
Nonhomoeologousgenome
At 56 (82%) 4 (6%) 8 (12%) 68 63 (81%) 7 (9%) 8 (10%) 78 103G 36 (68%) 9 (17%) 8 (15%) 53 20 (80%) 1 (4%) 4 (16%) 25 63
121 103 166aNonoverlapping markersbHomoeologous genome: At to A and G to B
Table 3 List of unlinked markers
Marker T. aestivumchromosome
T. timopheeviichromosome(population I)
T. timopheeviichromosome(population II)
Xgwm131 1B, 3B No linkage Not genotypedXgwm165 4A, 4D, 4B No linkage Not genotypedXgwm234 5B Not genotyped No linkageXgwm273b ? No linkage Not genotypedXgwm349 2D No linkage Not genotypedXgwm397 4A Not genotyped No linkageXgwm659 1B No linkage No linkageXgwm799 1B (NT) No linkage No linkageXgwm855 4A No linkage Not genotypedXgwm1034 3B Not genotyped No linkageXgwm1061 7A 7G No linkageXgwm1167 4B, 6D Not genotyped No linkageXgwm1220* 7D No linkage Not genotypedXgwm1229 3A No linkage Not genotypedXgwm1244 2A No linkage Not genotypedXgwm1246 5B, 5D 5G No linkageXgwm1257 5B 5G No linkageXgwm1296 6A Not genotyped No linkageTaglgap 1B Not genotyped No linkageXbarc182 7B (NT) No linkage Not genotyped
*Significant deviation (P<0.05) from the expected ratio
73
chromosome 6G, whereas in chromosomes 3At, 5At, and7At, they were absent in the interstitial regions and inchromosomes 2G and 7G in the most part of the short arms.
The number of markers per chromosome varied. Thelargest number of markers (more than 15 in two popu-lations) was mapped to chromosomes 1At, 2At, 5At, 6At,7At, and 2G; the least (four to eight) was mapped to chro-mosomes 4At, 1G, 4G, and 6G.
The morphological marker black glume (Bg) was mappedat the tip of the short arm of chromosome 1At in popula-
tion II. This location corresponds to the mapping of Bg ina population of T. monococcum reported by Dubcovskyet al. (1996).
Comparison of T. timopheevii and T. aestivumlinkage maps
The T. timopheevii maps we constructed were comparedwith the T. aestivum map obtained on the ITMI population(Röder et al. 1998, unpublished; Fig. 1). The mapping re-sults demonstrated that the order of the common wheatmicrosatellite markers involved in the analysis was retainedin the majority of cases in the chromosomes of T. timo-pheevii. Individual instances of altered order of markerswithin one linkage group were recorded, for example, inthe long arm of chromosome 2B and in the long arm ofchromosome 6At. In addition, there were cases of transferof a group of markers (Fig. 1, 1G and 6At) or individualmarkers (Table 4) from one chromosome to another. Theorder of markers remained the same in the region of thenonhomoeologous translocation 5AL/4AL (Fig. 1, 5At),inherited by the polyploid wheats belonging to the Emmerand Timopheevi groups from T. urartu.
Discussion
Microsatellite markers across genomes witha common origin
Based on the data in the present paper, the divergence ofDNA in the regions adjacent to microsatellites correlateswith the time of divergence between the genomes of thediploid ancestors that contributed to polyploid forms. Theevolutionary history of polyploid wheats involves severalstages separated by the time intervals when mutations ac-cumulated, DNA sequences were amplified or deleted, andthe genome was reorganized through translocations andinversions. According to the available published data, thedonors of A, B/G, and D genomes of the polyploid wheatsdiverged about 2.5–4.5 MYA (million years ago) (re-viewed in Levy and Feldman 2002; Huang et al. 2002). Thetetraploid wheats T. dicoccoides (AABB) and T. timo-pheevii (AtAtGG) appeared about 0.5 MYA, and the latterspecies formed later than the former. An ancestral form ofT. urartu was the donor of the A genome; the donors of theB/G genomes had a common origin with A. speltoides. A.tauschii is the donor of the D genome of hexaploid wheat,formed approximately 8,000–9,500 years ago.
The results shown in Table 1 demonstrate that primersto microsatellite regions of bread wheat genomes A, B,and D produced amplification products in the genome of T.timopheevii. The D genome is the most distant from At andG genomes, as the divergence between D genome and theancestors of the latter genomes occurred 2.5–4.5 MYA.This is reflected in the level of divergence in the primerregions, as only 35–38% of the markers amplified and notmore than 2–5% were localized on the chromosome map of
Table 4 List of the markers mapping to another genome or tononhomoeologous linkage groups in T. timopheevii
Marker T. aestivumchromosome
T. timopheeviichromosome(population I)
T. timopheeviichromosome(population II)
Xgwm1268 6D 1G –Xgdm84 7D 1G 1GXgwm861 7A, B 1G, 7G –Xgwm810 5B 4At, 5G 2At, 4At
Xgwm1054 5B – 2At
Xgwm731 4A – 2At, 6At
Xgwm1067 2B – 2At
Xgdm93 2A, 2D, 4B 2At, 2G 2At
Xgwm526 2B 2At, 2G 2At
Xbarc122 5A 2At 2At
Xwmc261 2A 2G, 2G, 3A –Xgwm1300 2B, 3D 2G, 5G –Xgwm963 7B 2G –Xgwm785 6B 2G –Xgwm133 6B 2G –Xgwm859 2D (NT) 3At –Xgwm1047 3D 3G –Xgwm322 2B? (NT) – 3GXgwm1036 2A 4At –Xgwm260 7A – 4At
Xgwm608 4D, 2D 4G –Xgwm443 5B 5At 5At
Xgwm1122 5D – 5At
Xbarc48 4D, 6B – 5At
Xgwm205 5A, 5D 5G, 5At –Xgwm118 5D, 5B, 4A
(NT)5G –
Xgwm894 4A 6At –Xgwm663 4A 6At –Xgwm815 2D 6At –Xgwm825 6B – 6At
Xgwm1205 6B (NT) – 6At
Xgdm127 6D 6G –Xgwm497 1A, 2A, 3D – 6G, 1At
Xgwm1173 7B 7At 7At, 7GXgwm344 7B 7At 7At
Xgwm740 7D (NT) 7G 7GXgwm746 7A 7G –Xgwm1061 7A 7G –Xgwm790 2D, 6B, 5B – 7G
74
T. timopheevii. A and At genomes were the latest to divergeabout 0.5 MYA; their divergence was caused by amphi-ploidization and subsequent evolution within the tetraploidnucleus. Transferability of markers between A and At ge-nomes in this case was considerably higher, amounting
to 78% with 26–29% of the markers being localized onthe map. The divergence between B and G genomes oc-curred in a time interval between 0.5 and 2.5 MYA, andthe transferability of markers across genomes also occupiesan intermediate position compared with D and A ge-
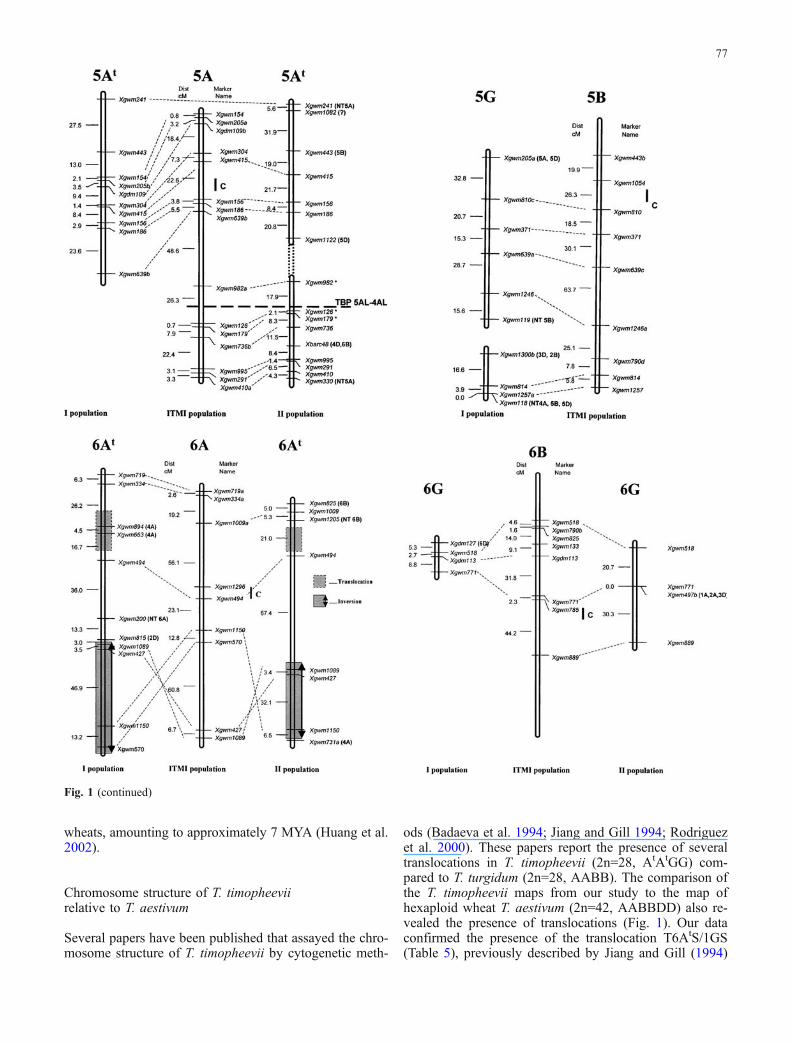
Fig. 1 Linkage maps of population I (T. timopheevii var. timophee-vii × T. timopheevii var. typica) and population II (T. timopheevii K-38555×T. militinae) in comparison to the linkage map of T. aestivum(ITMI population; Röder et al. 1998, unpublished). For the markersmapping to nonhomoeologous chromosomes, the mapping positionsare indicated in brackets as well as for the markers that mapped to
chromosomes with nulli-tetrasomic stocks (NT) of Chinese spring.Putative translocations are boxed; the loci significantly deviating(P<0.05) from the expected ratio are given by asterisk. Ideogramof translocation and inversions of chromosome 4A according toMiftahudin et al. 2004
75
nomes. About 53–54% of the B genome markers ampli-fied in the G genome, whereas 14–16% are located onchromosome maps. It is interesting to compare these re-sults with the corresponding data obtained while analys-ing the rye (Secale cereale) genome (Khlestkina et al.
2004) using the same microsatellites. Here, 12.4% of themarkers amplified good-quality PCR products in the ryegenome. A low level of amplification of wheat markersin the rye genome corresponds to the time of divergenceof Secale ancestors and diploid progenitors of polyploid
Fig. 1 (continued)
76
wheats, amounting to approximately 7 MYA (Huang et al.2002).
Chromosome structure of T. timopheeviirelative to T. aestivum
Several papers have been published that assayed the chro-mosome structure of T. timopheevii by cytogenetic meth-
ods (Badaeva et al. 1994; Jiang and Gill 1994; Rodriguezet al. 2000). These papers report the presence of severaltranslocations in T. timopheevii (2n=28, AtAtGG) com-pared to T. turgidum (2n=28, AABB). The comparison ofthe T. timopheevii maps from our study to the map ofhexaploid wheat T. aestivum (2n=42, AABBDD) also re-vealed the presence of translocations (Fig. 1). Our dataconfirmed the presence of the translocation T6AtS/1GS(Table 5), previously described by Jiang and Gill (1994)
Fig. 1 (continued)
77
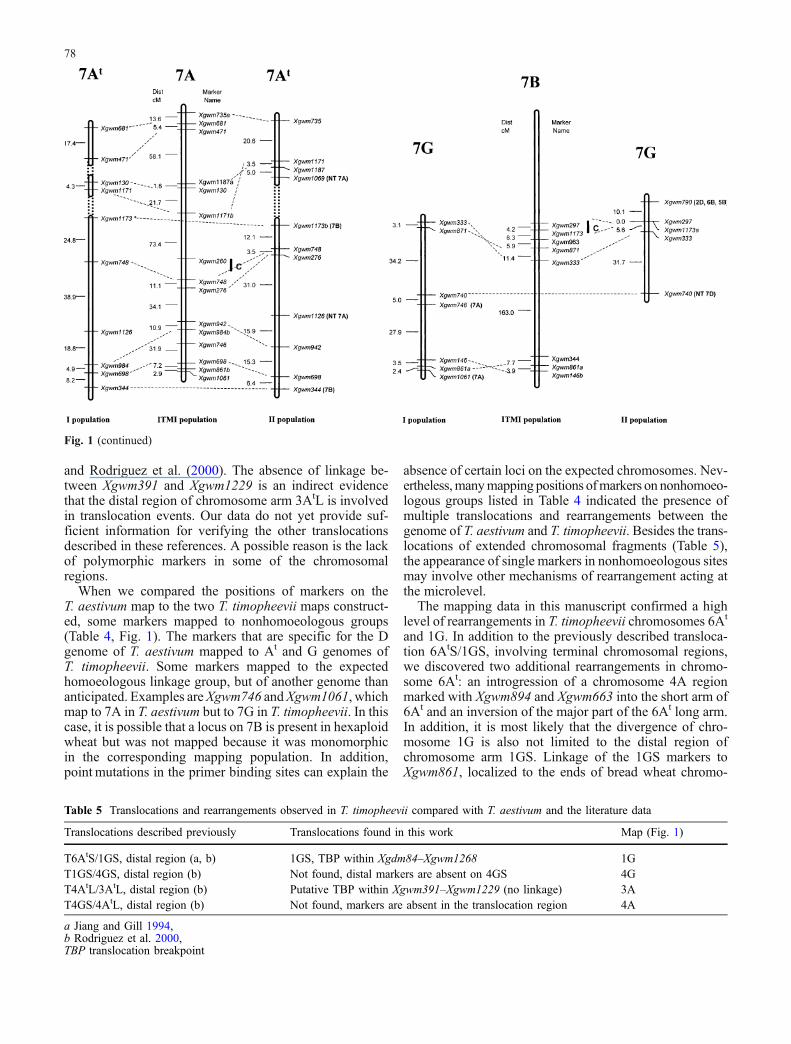
and Rodriguez et al. (2000). The absence of linkage be-tween Xgwm391 and Xgwm1229 is an indirect evidencethat the distal region of chromosome arm 3AtL is involvedin translocation events. Our data do not yet provide suf-ficient information for verifying the other translocationsdescribed in these references. A possible reason is the lackof polymorphic markers in some of the chromosomalregions.
When we compared the positions of markers on theT. aestivum map to the two T. timopheevii maps construct-ed, some markers mapped to nonhomoeologous groups(Table 4, Fig. 1). The markers that are specific for the Dgenome of T. aestivum mapped to At and G genomes ofT. timopheevii. Some markers mapped to the expectedhomoeologous linkage group, but of another genome thananticipated. Examples areXgwm746 andXgwm1061, whichmap to 7A in T. aestivum but to 7G in T. timopheevii. In thiscase, it is possible that a locus on 7B is present in hexaploidwheat but was not mapped because it was monomorphicin the corresponding mapping population. In addition,point mutations in the primer binding sites can explain the
absence of certain loci on the expected chromosomes. Nev-ertheless,manymapping positions ofmarkers on nonhomoeo-logous groups listed in Table 4 indicated the presence ofmultiple translocations and rearrangements between thegenome of T. aestivum and T. timopheevii. Besides the trans-locations of extended chromosomal fragments (Table 5),the appearance of single markers in nonhomoeologous sitesmay involve other mechanisms of rearrangement acting atthe microlevel.
The mapping data in this manuscript confirmed a highlevel of rearrangements in T. timopheevii chromosomes 6At
and 1G. In addition to the previously described transloca-tion 6AtS/1GS, involving terminal chromosomal regions,we discovered two additional rearrangements in chromo-some 6At: an introgression of a chromosome 4A regionmarked with Xgwm894 and Xgwm663 into the short arm of6At and an inversion of the major part of the 6At long arm.In addition, it is most likely that the divergence of chro-mosome 1G is also not limited to the distal region ofchromosome arm 1GS. Linkage of the 1GS markers toXgwm861, localized to the ends of bread wheat chromo-
Fig. 1 (continued)
Table 5 Translocations and rearrangements observed in T. timopheevii compared with T. aestivum and the literature data
Translocations described previously Translocations found in this work Map (Fig. 1)
T6AtS/1GS, distal region (a, b) 1GS, TBP within Xgdm84–Xgwm1268 1GT1GS/4GS, distal region (b) Not found, distal markers are absent on 4GS 4GT4AtL/3AtL, distal region (b) Putative TBP within Xgwm391–Xgwm1229 (no linkage) 3AT4GS/4AtL, distal region (b) Not found, markers are absent in the translocation region 4A
a Jiang and Gill 1994,b Rodriguez et al. 2000,TBP translocation breakpoint
78
some arms 7AL and 7BL, and the absence of linkagebetween Xgwm273 and Xgwm131 suggest potential trans-locations in the long arm of this chromosome as well. Thelimited number of four markers mapped to chromosome 4Gprevented from drawing conclusions on the level of rear-rangements of this chromosome. Cytological examinationsof hybrid forms detected only a small translocation in thedistal region of the short arm (Table 5). The species-spe-cific translocation 4AL/5AL/7BS in the Emmer group andone paracentric inversion and two pericentric inversions ofchromosome 4A are the major events underlying the dis-tinctions between chromosomes 4At and 4A as well as 7Gand 7B. The results of mapping chromosomes 4At and 7Gare yet insufficient to provide a comprehensive character-ization of the chromosomes in question.
Evolutionary origin of 4At, 5At, and 6At
structural rearrangements
Comparisons of the chromosome maps of diploid and poly-ploid species allow for specifying the time points whenthe translocations and inversions resulting in synteny per-turbations between cereal homoeologous chromosomesoccurred. Earlier, analysis of meiotic configurations in inter-specific hybrids demonstrated the presence of intragenometranslocation between arms 5AL and 4AL in the genome ofT. timopheevii (Maestra and Naranjo 1999). This transloca-tion is also present in the genome of T. aestivum and wasacquired by polyploid wheats from the diploid ancestor ofthe A genome (Devos et al. 1995a; Dubcovsky et al. 1996;Rodriguez et al. 2000). The conserved order of markers onchromosomes 5A and 5At of T. aestivum and T. timophe-evii (Fig. 1, 5A) confirms the similarity of these chro-mosomes and the presence of 4AtL/5AtL translocation,analogous to 4AL/5AL. Data about the presence and ab-sence of 4AL/ 5AL translocation in a range of Triticeaespecies yet fail to provide an unambiguous answer to thequestion on which state is more primitive (Devos et al.1995a).
The paracentric inversion resulting in synteny perturba-tions between 6AtL and 6AL occurred most likely at thetetraploid level, as it was not found in the genome ofT. monococcum (Dubcovsky et al. 1996). On the other hand,the presence of this inversion in the genome of a directdonor of the At genome cannot be excluded.
Recently published results about the physical mappingof ESTs in wheat by using deletion lines allowed the com-parison to the rice genome (Sorrels et al. 2003; Qi et al.2003; Sourdille et al. 2004; Rota and Sorrells 2004; Singhet al. 2004; Li et al. 2004; Peng et al. 2004; Conley et al.2004; Munkvold et al. 2004; Miftahudin et al. 2004;Linkiewicz et al. 2004; Randhawa et al. 2004; Hossainet al. 2004). While earlier comparative mapping effortssupported the view that the cereal genomes are composedof conserved chromosomal fragments like a ‘lego’ system(Ahn et al. 1993; Gale and Devos 1998), the recent re-
sults of wheat mapping draw a more complicated picture.Basically, for all wheat–rice comparisons, ESTs were foundwith homology to non-syntenic rice chromosomes. As anexample of wheat group 4, only 78% of the ESTs withhomology to rice were collinear with the genes from theexpected rice group 3 (Miftahudin et al. 2004), and of thewheat group 6 ESTs, only 58% identified homologs ofsyntenic rice chromosome 2 (Randhawa et al. 2004). There-fore, a more complicated mode of genome evolution canbe also expected for the wheats of the Timopheevi groupwith additional mechanisms besides translocations and in-versions. A more precise description of the synteny ofthe genomes of the Timopheevi group wheats with othercereal species will require integration of new molecularmarkers and possibly ESTs into the available chromo-some maps of the AtAtGG genomes.
Acknowledgements This work was supported by grants from DFG(436RUS113/653/0-1, Ro1055/2-1) and the Russian State Founda-tion for Basic Research (projects 02-04-04004-HHИO and 05-04-48735). We thank Dr. E. Pestsova for assistance in choosing thepolymorphic parental forms.
References
Ahn S, Anderson JA, Sorrels ME, Tanksley SD (1993) Homoeo-logous relationships of rice, wheat and maize chromosomes.Mol Gen Genet 241:483–490
Badaeva ED, Badaev NS, Gill BS, Filatenko AA (1994) Intraspe-cific karyotype divergence in Triticum araraticum. Plant SystEvol 192:117–145
Blanco A, Bellomo MP, Cenci A, De Giovanni C, D’Ovidio R et al(1998)A genetic map of durumwheat. Theor Appl Genet 97:721–728
Conley J, Nduati V, Gonzalez-Hernandez JL, Mesfin A, Trudeau-Spanjers M et al (2004) A 2600-locus chromosome bin map ofwheat homoeologous group 2 reveals interstitial gene-rich is-lands and colinearity with rice. Genetics 168:625–637
Devos KM, Dubkovsky J, Dvorak J, Chinoy CN, Gale MD (1995a)Structural evolution of wheat chromosomes 4A, 5A, and 7Band its impact on recombination. Theor Appl Genet 91:282–288
Devos KM, Bryan GJ, Collins AJ, Gale MD (1995b) Application oftwo microsatellite sequences in wheat storage proteins asmolecular markers. Theor Appl Genet 90:247–252
Dubcovsky J, Luo M-C, Zhong G-Y, Bransteitter R, Desai A, KilianA, Kleinhofs A, Dvorak J (1996) Genetic map of diploid wheat,Triticum monococcum L., and its comparison with maps ofHordeum vulgare L. Genetics 143:983–999
Feldman M (1966) Identification of unpaired chromosomes in F1hybrids involving T. aestivum and T. timopheevii. Can J GenetCytol 8:144–151
Feldman M (2001) Origin of cultivated wheat. In: Bonjean AP,Angus WJ (eds) The world wheat book. Lavoisier Publishing,Paris, France
Gale MD, Devos KM (1998) Comparative genetics in the grasses.Proc Natl Acad Sci 95:1971–1974
Goncharov NP (2002) Comparative genetics of wheat and theirrelated species. Siberian University Press, Novosibirsk
Gupta PK, Balyan HS, Edwards KJ, Isaac P, Korzun V et al (2002)Genetic mapping of 66 new microsatellite (SSR) loci in breadwheat. Theor Appl Genet 105:413–422
Hossain KG, Kalavacharla V, Lazo GR, Hegstad J, Wentz MJ et al(2004) A Chromosome bin map of 2148 expressed sequence tagloci of wheat homoeologous group 7. Genetics 168:687–699
79
Huang S, Sirikhachornkit A, Su X, Faris J, Gill B, Haselkorn R,Gornicki P (2002) Genes encoding plastid acetyl-CoA carbox-ylase and 3-phosphoglycerate kinase of the Triticum/Aegilopscomplex and the evolutionary history of polyploids wheat. ProcNatl Acad Sci U S A 99:8133–8138
Jiang J, Gill BS (1994) Different species-specific chromosome trans-location in Triticum timopheevii and T. turgidum support di-phyletic origin of polyploid wheats. Chromosome Res 2:59–64
Khlestkina EK, Than MHM, Pestsova EG, Röder MS, MalyshevSV, Korzun V, Börner A (2004) Mapping of new 99 new mi-crosatellite loci in rye (Secale cereale L.) including 39 ex-pressed sequence tags. Theor Appl Genet 109:725–732
Korzun V, Röder MS, Wendehake K, Pasqualone A, Lotti C, GanalMW, Blanco A (1999) Integration of dinucleotide microsatel-lites from hexaploid bread wheat into a genetic linkage map ofdurum wheat. Theor Appl Genet 98:1202–1207
Kosambi DD (1944) The estimation of map distances from re-combination values. Ann Eugen 12:172–175
Lander ES, Green P, Abrahamson J, Barlow A, Daly MJ, LincolnSE, Newburg I (1987) MAPMAKER: an interactive computerpackage for constructing primary genetic linkage maps of ex-perimental and natural populations. Genomics 1:174–181
Levy AV, Feldman M (2002) The impact of polyploidy on grassgenome evolution. Plant Physiol 130:1587–1593
Li C, Ni P, Francki M, Hunter A, Zhang Y et al (2004) Genescontrolling seed dormancy and pre-harvest sprouting in a rice–wheat–barley comparison. Funct Integr Genomics 4:84–93
Linkiewicz M, Qi LL, Gill BS, Ratnasiri A, Echalier B et al (2004)A 2500-locus bin map of wheat homoeologous group 5 pro-vides insights on gene distribution and colinearity with rice.Genetics 168:665–676
Liu CJ, Atkinson MD, Chinoy CN, Devos KM, Gale MD (1992)Nonhomoeologous translocations between group 4, 5 and 7chromosomes within wheat and rye. Theor Appl Genet 83:305–312
Maestra B, Naranjo T (1999) Structural chromosome differentiationbetween Triticum timopheevii and T. turgidum and T. aestivum.Theor Appl Genet 98:744–750
McIntosh RA, Devos KM, Dubkovsky J, Rogers WJ (2000) Cat-alogue of gene symbols for wheat: 2000 supplement. Wheat InfServ 91:33–70
Miftahudin, Ross K, Ma XF, Mahmoud AA, Layton J et al (2004)Analysis of expressed sequence tag loci on wheat chromosomegroup 4. Genetics 168:651–663
Munkvold JD, Greene RA, Bermudez-Kandianis CE, La Rota CM,Edwards H et al (2004) Group 3 chromosome bin maps ofwheat and their relationship to rice chromosome 1. Genetics168:639–650
Naranjo T, Roca A, Goicoecha PG, Giraldez R (1987) Arm homoeo-logy of wheat and rye chromosomes. Genome 29:873–882
Nelson JC, Sorrells ME, Van Deynze AE, Lu YH, Atkinson M,Bernard M, Leroy P, Faris JD, Anderson JA (1995) Molecularmapping of wheat. Major genes and rearrangements in homoeo-logous groups 4, 5, and 7. Genetics 141:721–731
Peng J, Korol AB, Fahima T, Röder MS, Ronin YI, Li YC, Nevo E(2000) Molecular genetic maps in wild Emmer wheat, Triticumdicoccoides: genome-wide coverage, massive negative inter-ference, and putative quasi-linkage. Genome Res 10:1509–1531
Peng H, Zadeh H, Lazo GR, Gustafson JP, Chao S et al (2004)Chromosome bin map of expressed sequence tags in homoeo-logous group 1 of hexaploid wheat and homoeology with riceand arabidopsis. Genetics 168:609–623
Pestsova E, Ganal MW, Röder MS (2000) Isolation and mappingof microsatellite markers specific for the D genome of breadwheat. Genome 43:689–697
Plaschke J, Ganal MW, Röder MS (1995) Detection of genetic di-versity in closely related bread wheat using microsatellite mark-ers. Theor Appl Genet 91:1001–1007
Qi L, Echalier B, Friebe B, Gill BS (2003) Molecular characteriza-tion of a set of wheat deletion stocks for use in chromosome binmapping of ESTs. Funct Integr Genomics 3:39–55
Randhawa HS, Dilbirligi M, Sidhu D, Erayman M, Sandhu D et al(2004) Deletion mapping of homoeologous group 6-specificwheat expressed sequence tags. Genetics 168:677–686
Röder MS, Korzun V, Wendehake K, Plaschke J, Tixier M-H, LeroyP, Ganal MW (1998) A microsatellite map of wheat. Genetics149:2007–2023
Rodriguez S, Perera E, Maestra B, Diez M, Naranjo T (2000) Chro-mosome structure of Triticum timopheevii relative to T. turgidum.Genome 43:923–930
Rota M, Sorrells ME (2004) Comparative DNA sequence analysisof mapped wheat ESTs reveals the complexity of genome rela-tionships between rice and wheat. Funct Integr Genomics 4:34–46
Singh NK, Raghuvanshi S, Srivastava SK, Gaur A, Pal AK et al(2004) Sequence analysis of the long arm of rice chromosome11 for rice–wheat synteny. Funct Integr Genomics 4:102–117
Sorrels ME, La Rota M, Bermudez-Kandianis CE, Greene RA,Kantety R et al (2003) Comparative DNA sequence analysis ofwheat and rice genomes. Genome Res 13:1818–1827
Sourdille P, Singh S, Cadalen T, Brown-Guedira GL, Gay G et al(2004) Microsatellite-based deletion bin system for the estab-lishment of genetic-physical map relationships in wheat (Trit-icum aestivum L.). Funct Integr Genomics 4:12–25
Wagenaar EB (1961) Studies on the genome composition of Triticumtimopheevii Zhuk. I. Evidence for genetic control of meioticirregularities in tetraploid hybrids. Can J Genet Cytol 3:47–60
80
Related Documents