What’s Behind Africa’s Turnaround? Continent-wide Trends in Rural Demography and Farm Technology Will Masters Professor and Chair, Department of Food and Nutrition Policy Tufts University http://nutrition.tufts.edu http://sites.tufts.edu/willmasters NBER African Successes Conference Zanzibar, 4 August 2011 Policy Discussion: Agriculture and Economic Development

What’s Behind Africa’s Turnaround? Continent-wide Trends in Rural Demography and Farm Technology Will Masters Professor and Chair, Department of Food and.
Jan 03, 2016
Welcome message from author
This document is posted to help you gain knowledge. Please leave a comment to let me know what you think about it! Share it to your friends and learn new things together.
Transcript

What’s Behind Africa’s Turnaround?Continent-wide Trends in
Rural Demography and Farm Technology
Will MastersProfessor and Chair, Department of Food and Nutrition Policy
Tufts University
http://nutrition.tufts.edu http://sites.tufts.edu/willmasters
NBER African Successes Conference Zanzibar, 4 August 2011
Policy Discussion: Agriculture and Economic Development

Africa’s poverty rates rose only recently, and turned down over the past decade
Source: Author’s calculation from World Bank (2011), PovcalNet (http://iresearch.worldbank.org/PovcalNet/), updated 11 April 2011. Estimates are based on over 700 household surveys from more than 120 countries, and refer to per-capita expenditure at purchasing-power parity prices for 2005.

Despite weak data and wide variation many observers see a turnaround
Source: Author’s calculation from World Bank (2011), PovcalNet (http://iresearch.worldbank.org/PovcalNet/), updated 11 April 2011. Estimates are based on over 700 household surveys from more than 120 countries, and refer to per-capita expenditure at purchasing-power parity prices for 2005.

Despite the recent turnaround, Africa is the last frontier of ultra poverty
(<$0.625/day)
Source: Author’s calculation from World Bank (2011), PovcalNet (http://iresearch.worldbank.org/PovcalNet/), updated 11 April 2011. Estimates are based on over 700 household surveys from more than 120 countries, and refer to per-capita expenditure at purchasing-power parity prices for 2005.

Africa now has 1/8th of the world’s people,but 2/3rds of the ultra-poor
Source: Author’s calculation from World Bank (2011), PovcalNet (http://iresearch.worldbank.org/PovcalNet/), updated 11 April 2011. Estimates are based on over 700 household surveys from more than 120 countries, and refer to per-capita expenditure at purchasing-power parity prices for 2005.
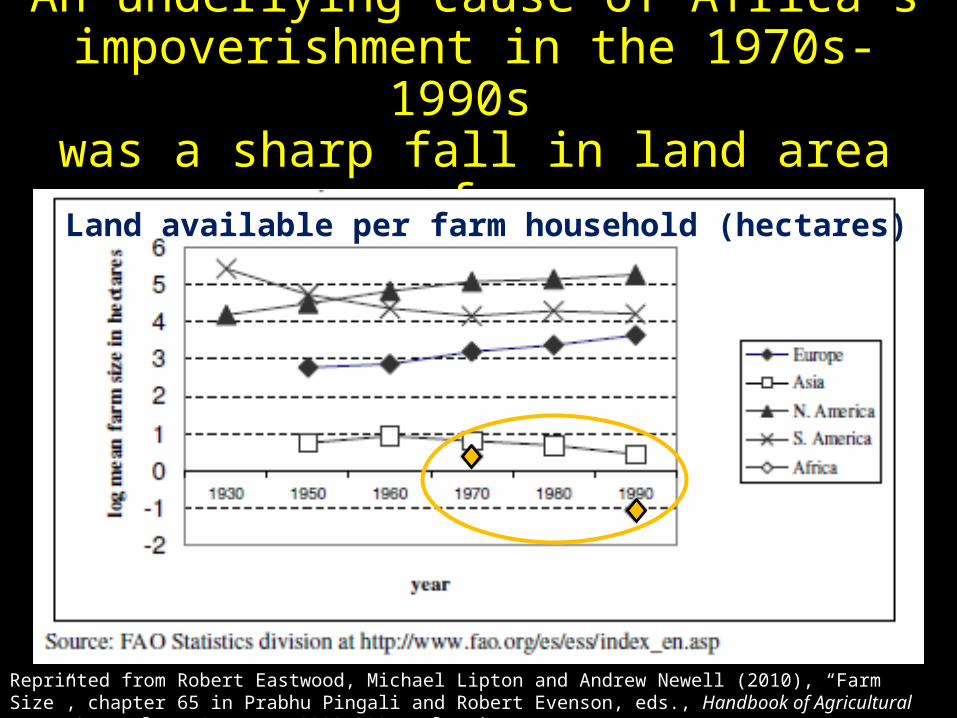
An underlying cause of Africa’s impoverishment in the 1970s-1990s
was a sharp fall in land area per farmer
Reprinted from Robert Eastwood, Michael Lipton and Andrew Newell (2010), “Farm Size”, chapter 65 in Prabhu Pingali and Robert Evenson, eds., Handbook of Agricultural Economics, Volume 4, Pages 3323-3397. Elsevier.
Land available per farm household (hectares)

Falling land per farmer is due to Africa’s fast (but now slowing) rural population growth
-1.5%
-1.0%
-0.5%
0.0%
0.5%
1.0%
1.5%
2.0%
2.5%
SS Africa
S Asia
SE Asia
Rest of World
Rural population growth (decade averages), 1950-2030
Source: Calculated from FAOStat (downloaded 17 March 2009). Population estimates and projections are based on UN Population Projections (2006 revision) and UN Urbanization Prospects (2001 revision).
Growth rates by region, 1950-2030
0.0%
1.0%
2.0%
3.0%
4.0%
5.0%
6.0%
SS Africa
S Asia
SE Asia
Rest of World
Urban population growth (decade averages), 1950-2030 Rural population Urban population
Africa has long had the world’s fastest growing rural and urban population!
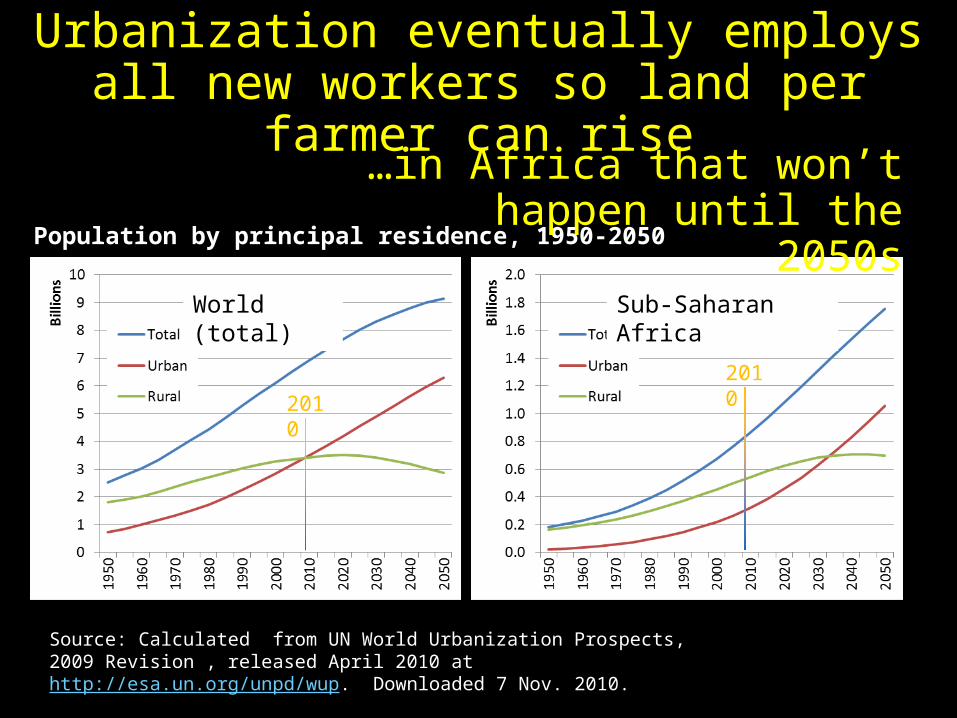
Population by principal residence, 1950-2050
World (total) Sub-Saharan Africa
Source: Calculated from UN World Urbanization Prospects, 2009 Revision , released April 2010 at http://esa.un.org/unpd/wup. Downloaded 7 Nov. 2010.
2010
2010
Urbanization eventually employs all new workers so land per farmer can rise
…in Africa that won’t happen until the 2050s

USDA estimates of average cereal grain yields (mt/ha), 1960-2010
Source: Calculated from USDA , PS&D data (www.fas.usda.gov/psdonline), downloaded 7 Nov 2010. Results shown are each region’s total production per harvested area in barley, corn, millet, mixed grains, oats, rice, rye, sorghum and wheat.
Africa’s green revolution has just begun

African agriculture is really distinctive
Source: Reprinted from W.A. Masters, “Paying for Prosperity: How and Why to Invest in Agricultural Research and Development in Africa” (2005), Journal of International Affairs, 58(2): 35-64.

Appropriate new technologies have only recently been developed and disseminated
Source: Reprinted from W.A. Masters, “Paying for Prosperity: How and Why to Invest in Agricultural Research and Development in Africa” (2005), Journal of International Affairs, 58(2): 35-64.

Foreign aid for agriculture has just begun to recover after being sharply cut in 1985-99
Source: Author's calculations from OECD (2011), Official Bilateral Commitments by Sector, updated 6 April 2011 (http://stats.oecd.org/qwids).

The wake-up of aid for agriculture has been led by the Bill & Melinda Gates Foundation
Note: Exact amounts for BMGF have been obscured because methodology differs from that used by the DAC. Source: P. Pingali, G. Traxler and T. Nguyen (2011), “Changing Trends in the Demand and Supply of Aid for Agriculture Development and the Quest for Coordination.” Annual Meetings of the AAEA, July 24–26, 2011.
Rank
1 IDA 300.72 IDA 538.88 United States 463.07 IDA 867.01
2 AfDF 152.04 AfDF 226.81 IDA 399.16 BMGF 367.23
3 Denmark 114.98 France 141.80 BMGF 391.77 United States 323.58
4 United States 102.30 EU Institutions 114.79 France 342.42 EU Institutions 181.73
5 IFAD 80.72 BMGF 99.03 AfDF 235.65 Canada 155.20
6 Germany 66.88 IFAD 87.50 EU Institutions 186.30 IFAD 129.49
7 Belgium 66.43 United States 84.78 IFAD 122.76 France 95.13
8 EU Institutions 65.75 J apan 66.12 J apan 73.36 Germany 87.25
9 J apan 58.42 Sweden 60.58 Korea 56.63 Belgium 77.42
10 United Kingdom 45.06 Germany 54.31 Germany 56.33 J apan 75.13
11 Canada 43.48 Belgium 53.48 Belgium 53.20 Ireland 41.81
12 Netherlands 36.19 Norway 50.34 Canada 41.40 Norway 35.39
13 France 32.14 United Kingdom 30.70 Norway 40.64 Italy 32.36
14 BMGF 24.80 Ireland 22.56 Denmark 31.46 Denmark 29.17
15 Norway 20.80 Netherlands 19.01 Ireland 24.79 Spain 19.31
20082005 2006 2007
Top 15 donors’ foreign aid commitments to African agriculture, 2005-2008

Many African governments are now focusing more on agriculture
Slide is courtesy of Prabhu Pingali, Greg Traxler and Tuu-Van Nguyen (2011), “Changing Trends in the Demand and Supply of Aid for Agriculture Development and the Quest for Coordination,” at the AAEA, July 24–26, 2011.
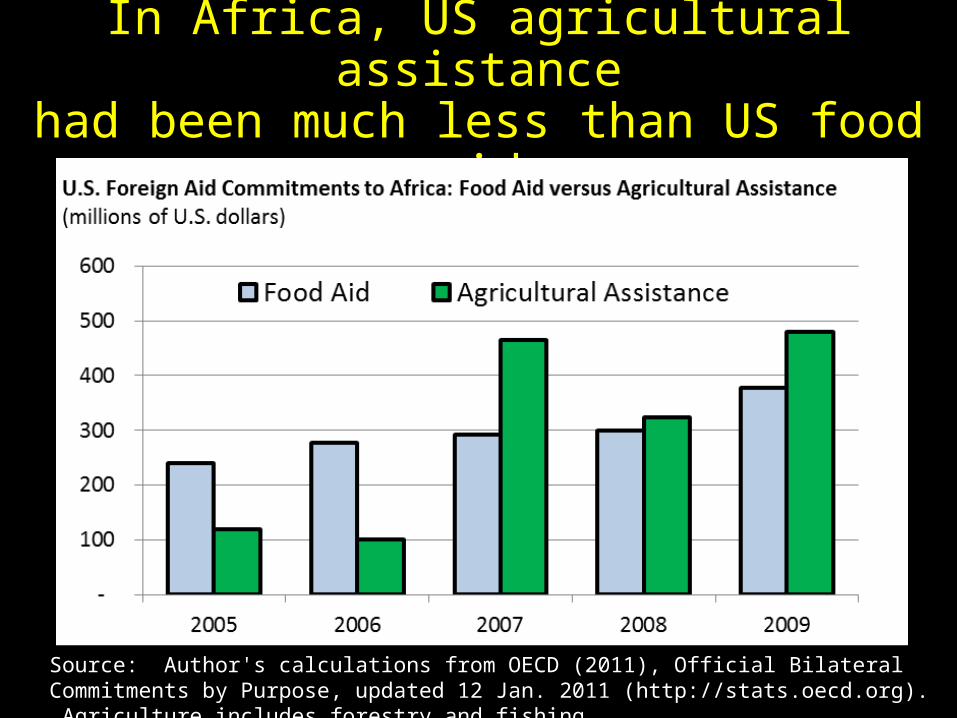
In Africa, US agricultural assistancehad been much less than US food aid
Source: Author's calculations from OECD (2011), Official Bilateral Commitments by Purpose, updated 12 Jan. 2011 (http://stats.oecd.org). Agriculture includes forestry and fishing.

Conclusions: Towards sustainable growth
in African agriculture
• African poverty worsened from 1980 through 2000, but is now improving– A major underlying cause is land available per farmer, driven
down by rural population growth which is now slowing
– Appropriate new farm technologies are finally arriving, so crop yields, output and input use are now rising
• The international agricultural R&D needed for crop improvement had shrunk to near zero, but is now being restored– Aid for farm productivity was key to cutting Asian poverty,
then seen as no longer needed in the 1980s and 1990s;
– Africa is now poised for rapid uptake and sustained growth

Additional Slides

Extreme poverty is being eradicatedWorld Bank estimates of global poverty, 1981-2005
Source: Author’s calculation from World Bank (2011), PovcalNet (http://iresearch.worldbank.org/PovcalNet/), updated 11 April 2011. Estimates are based on over 700 household surveys from more than 120 countries, and refer to per-capita expenditure at purchasing-power parity prices for 2005.

US aid for agriculture has begun to recover, after 20 years of decline to near zero
Source: Author's calculations from OECD (2011), Official Bilateral Commitments by Sector, updated 6 April 2011 (http://stats.oecd.org/qwids).

The most recent data show continued poverty reduction across Asia,
but not in all countries
Source: Author’s calculation from World Bank (2011), PovcalNet (http://iresearch.worldbank.org/PovcalNet/), updated 11 April 2011. Estimates are based on over 700 household surveys from more than 120 countries, and refer to per-capita expenditure at purchasing-power parity prices for 2005.
Related Documents