What We Know of the Youth Market Analysis of Core Tourism Statistics Produced by Tourism New Zealand, Insights – March 2012

What We Know of the Youth Market Analysis of Core Tourism Statistics Produced by Tourism New Zealand, Insights – March 2012.
Dec 17, 2015
Welcome message from author
This document is posted to help you gain knowledge. Please leave a comment to let me know what you think about it! Share it to your friends and learn new things together.
Transcript

What We Know of the Youth Market
Analysis of Core Tourism Statistics
Produced by Tourism New Zealand, Insights – March 2012

Key FindingsThe youth sector generates $1.8 billion in tourism expenditure
60 per cent of the NZs youth market originate from Australia as either Australians or visitors to Australia.
Youth travellers do more activities in New Zealand than all tourists
Over half of all youth tourists do some form of adventure tourism while in New Zealand
Youth tourists stay for longer periods of time in New Zealand than other tourists
Almost 80 per cent of youth are not backpackers

The Value of the Youth Market

Total ExpenditureTotal Expenditure
For the year ended March 2012 the youth market* generated $1.8 billion in tourism expenditure. This represents 32% of total international tourism expenditure in New Zealand.
Average Expenditure
In the year ended March 2012 the youth market* spent an average of $2,877 per trip to New Zealand. The average for all tourists is $2,360 or $517 less per trip than the youth market.
Length of Stay
For the year ended June 2012 the youth market* stayed for an average of 29.2 days in New Zealand. The average for allvisitors to New Zealand is 19.4 days.
*Includes 15 to 29 year olds1International Visitor Survey – YE Mar 20122International Travel and Migration Statistics – YE Jun 2012
$1.8 billion1 Sample: 1,708
$2,877 per trip1 Sample: 1,708
29.2 days2

Holiday ExpenditureAverage Expenditure
Over the last three years the youth holiday market* spent an average of $2,593 per trip to New Zealand. The average for all tourists over this period of time is $2,846, or $253 more per trip than the youth holiday segment.
Length of Stay
For the year ended June 2012 the youth holiday market* stayed for an average of 25.3 days in New Zealand. The average for allholiday visitors to New Zealand is 16.1 days.
Length of Stay – Less Working Holiday Visa Tourists
For the year ended June 2012 the youth holiday market* less working holiday visa tourists stayed for an average of 21 days in New Zealand. The average for all holiday visitors less working holiday visas is 16 days.
*Includes 15 to 29 year olds1International Visitor Survey – Average of YE Mar 2010 to 20122International Travel and Migration Statistics – YE Jun 2012
$2,593 per trip1 Sample:
2,758
25.3 days2
21 days2

Holiday InteractionAverage Number of Regions VisitedYouth 4.9All 4.2
Average Number of Activities DoneYouth 11.9All 10.5
International Visitor Survey – YE Dec 2009 - 2011 (15 – 29 year olds)

Which Youth Markets Are The Most Valuable?

Youth Arrivals
International Travel and Migration Statistics – YE Dec 2011 (18 – 29 year olds)
0
50,000
100,000
150,000
200,000
250,000
Aust
ralia UK
USA
Ger
man
yCh
ina
Fran
ceJa
pan
Cana
daIn
dia
Kore
aM
alay
sia
Net
herla
nds
Irela
ndSi
ngap
ore
Switz
erla
ndSw
eden
Braz
ilTa
iwan
Sout
h Af
rica
Arge
ntina
Arriv
als
Youth Arrivals - YE Jun 2012
020,00040,00060,00080,000
100,000120,000
Aust
ralia UK
USA
Ger
man
yCh
ina
Fran
ceJa
pan
Cana
daIn
dia
Net
herla
nds
Mal
aysi
aSi
ngap
ore
Irela
ndKo
rea
Swed
enSw
itzer
land
Taiw
anD
enm
ark
Arge
ntina
Aust
ria
Arriv
als
Youth Arrivals 2011 - HolidayYE Jun 12

Youth Total Stay Days
International Travel and Migration Statistics – YE Jun 2012 (18 – 29 year olds)
0500,000
1,000,0001,500,0002,000,0002,500,0003,000,000
Aust
ralia UK
Ger
man
yU
SAFr
ance
Chin
aCa
nada
Japa
nN
ethe
rland
sKo
rea
Indi
aSw
itzer
land
Mal
aysi
aIre
land
Swed
enBr
azil
Vanu
atu
Phili
ppin
es Fiji
Arge
ntina
Tota
l Sta
y D
ays
Youth Total Stay Days
0200,000400,000600,000800,000
1,000,0001,200,0001,400,000
Aust
ralia
Ger
man
yU
KU
SAFr
ance
Net
herla
nds
Cana
daSw
itzer
land
Irela
ndSw
eden
Mal
aysi
aCh
ina
Japa
nIs
rael
Kore
aDe
nmar
kAr
genti
naCz
ech
Repu
blic
Aust
riaSi
ngap
ore
Tota
l Sta
y D
ays
Youth Stay Days - Holiday

Pure Holiday Visitors
The graph above shows total stay days for the youth segment for pure holiday visitors. This is holiday visitors with all those arriving on a work visa removed from the data series.
*Australians do not need a visa to enter New Zealand so are not included within this segment
International Travel and Migration Statistics – YE Jun 2012 (18 – 29 year olds)
0
100,000
200,000
300,000
400,000
500,000
600,000
700,000
Aust
ralia UK
Ger
man
y
USA
Fran
ce
Net
herla
nds
Switz
erla
nd
Cana
da
Isra
el
Irela
nd
Swed
en
Chin
a
Japa
n
Denm
ark
Kore
a
Aust
ria
Indi
a
Mal
aysi
a
Sing
apor
e
Tota
l Sta
y D
ays
Total Stay Days - Holiday (Visitor Only)
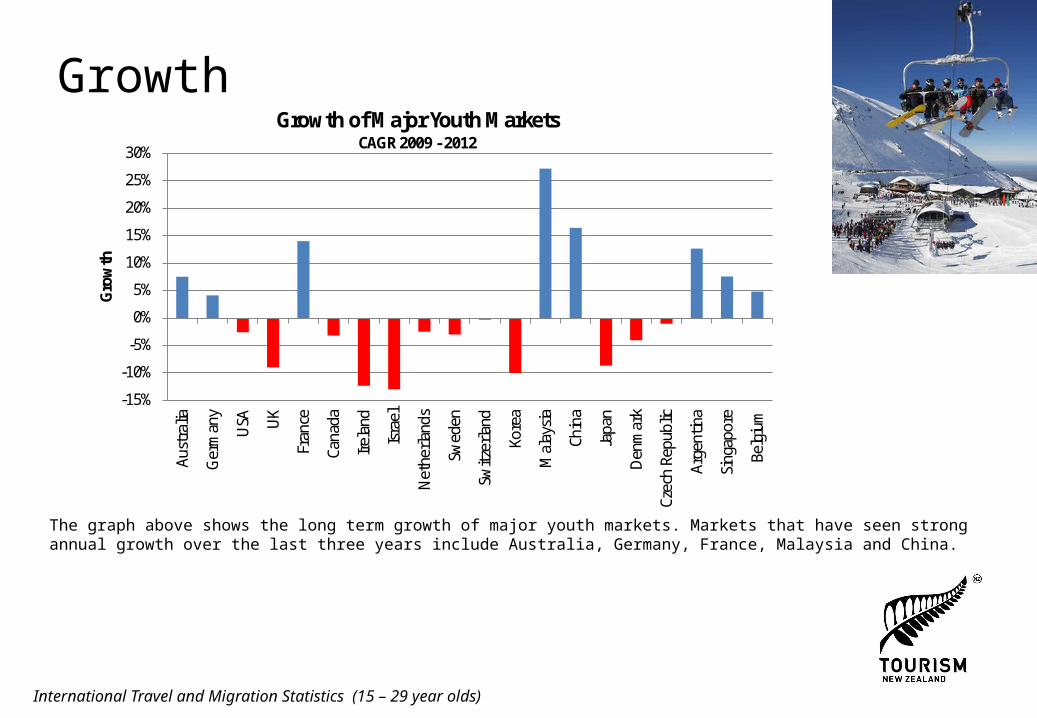
Growth
The graph above shows the long term growth of major youth markets. Markets that have seen strong annual growth over the last three years include Australia, Germany, France, Malaysia and China.
International Travel and Migration Statistics (15 – 29 year olds)
-15%
-10%
-5%
0%
5%
10%
15%
20%
25%
30%
Aust
ralia
Ger
man
y
USA U
K
Fran
ce
Cana
da
Irela
nd
Isra
el
Net
herla
nds
Swed
en
Switz
erla
nd
Kore
a
Mal
aysi
a
Chin
a
Japa
n
Den
mar
k
Czec
h Re
publ
ic
Arge
ntina
Sing
apor
e
Belg
ium
Gro
wth
Growth of Major Youth MarketsCAGR 2009 - 2012

Major Youth Markets
The top four youth markets based on arrivals and total stay days include:
#1 Australia#2 UK#3 Germany#4 USA
Following this are:
FranceNetherlandsSwitzerlandCanadaIsraelIrelandSweden

Youth Profile

Purpose of Visit - Arrivals
The Youth segment has a higher share of holiday visitors than New Zealand’s average. Not surprisingly the youth segment is made up of less business and conference arrivals than average and more education arrivals.
Taking holiday arrivals only, the youth segment makes up 23% of New Zealand’s holiday arrivals.
International Travel and Migration Statistics – YE Jun 2012 (18 – 29 year olds)
47%
32%
10%
2%2%
4%
3%
Purpose of Visit - All
Holiday
VFR
Business
Conferences
Education
52%
28%
5%
1%5%
6%
3%
Purpose of Visit - Youth
Holiday
VFR
Business
Conferences
Education

Purpose of Visit – Total Stay Days
Holiday accounts for 45% of the youth segments days spent in New Zealand, which is more than the New Zealand average (39%).
The youth segment makes up 36% of New Zealand’s holiday total stay days. The youth holiday segment generates 7.1 million total stay days, which as a comparison is more than Australia which generates 5.1 million holiday total stay days.
International Travel and Migration Statistics – YE Jun 2012 (18 – 29 year olds)
45%
18%5%0%
18%
11%
3%
Purpose of Visit - Youth
Holiday
VFR
Business
Conferences
Education
Other
39%
35%
5%1%
9%
8%
3%
Purpose of Visit - All
Holiday
VFR
Business
Conferences
Education
Other
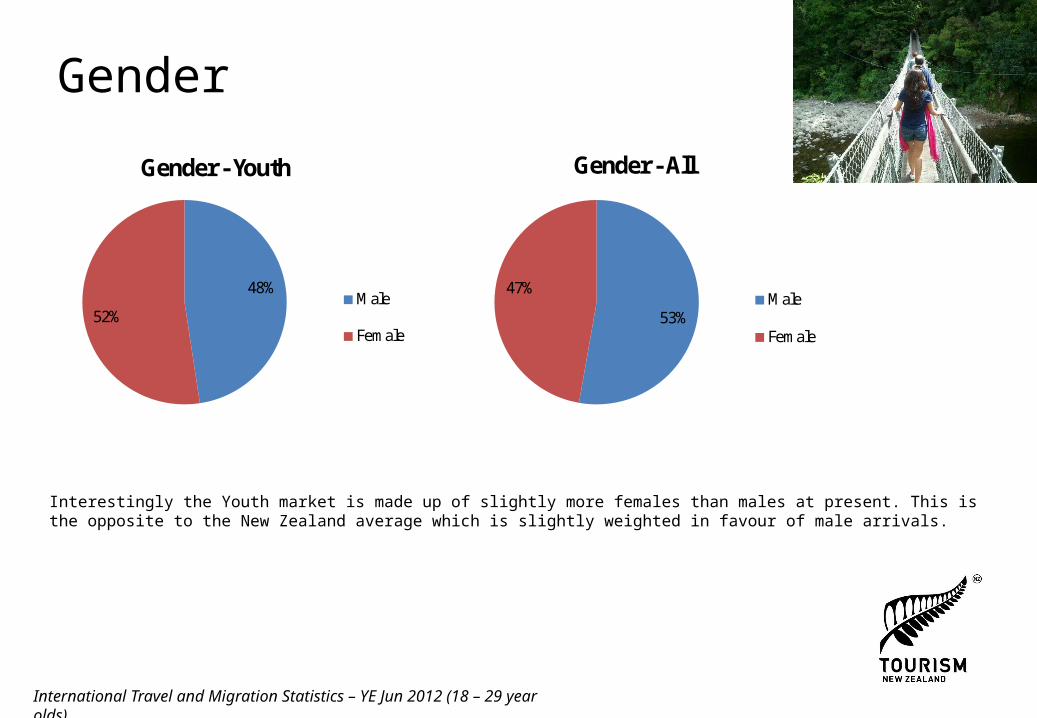
Gender
Interestingly the Youth market is made up of slightly more females than males at present. This is the opposite to the New Zealand average which is slightly weighted in favour of male arrivals.
International Travel and Migration Statistics – YE Jun 2012 (18 – 29 year olds)
48%
52%
Gender - Youth
Male
Female53%
47%
Gender - All
Male
Female
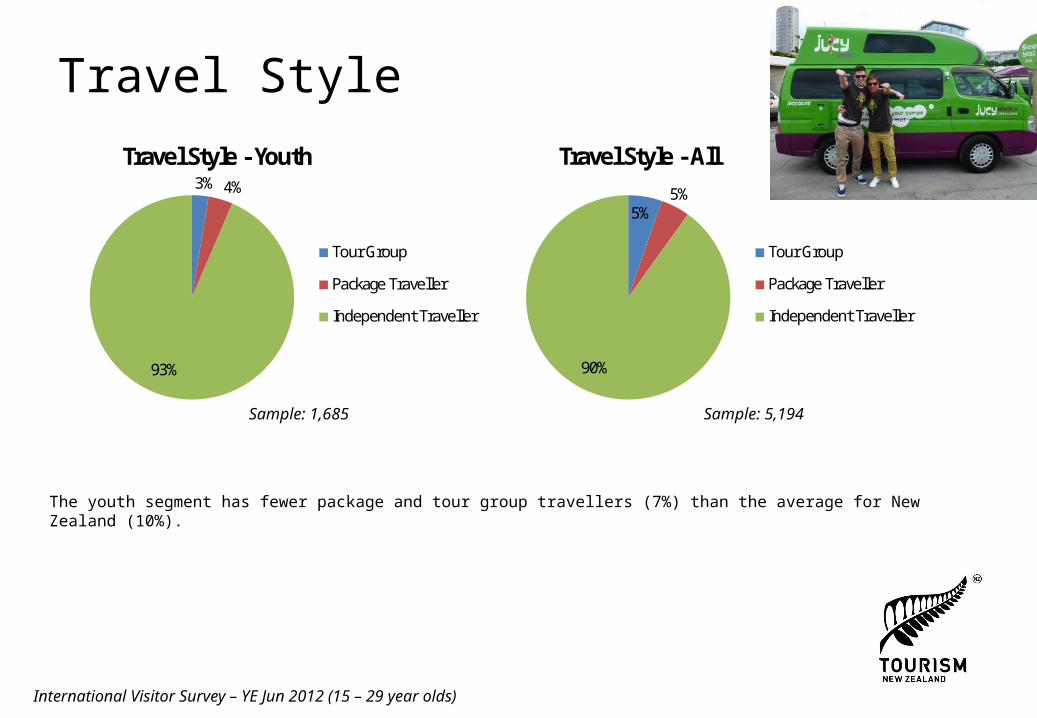
Travel Style
The youth segment has fewer package and tour group travellers (7%) than the average for New Zealand (10%).
International Visitor Survey – YE Jun 2012 (15 – 29 year olds)
Sample: 1,685 Sample: 5,194
3% 4%
93%
Travel Style - Youth
Tour Group
Package Traveller
Independent Traveller
5%5%
90%
Travel Style - All
Tour Group
Package Traveller
Independent Traveller

i-SITE
Youth travellers (40%) are more likely to visit an i-SITE than the average for New Zealand (34%).
International Visitor Survey – YE Jun 2012 (15 – 29 year olds)
Sample: 1,685 Sample: 5,194
40%
59%
1%Visited an i-SITE - Youth
Yes
No
Don't Know
34%
65%
1%Visited an i-SITE - All
Yes
No
Don't Know

Backpackers
Not surprisingly the youth segment has a higher ratio of backpackers (19%) than the average for New Zealand (8%).
Despite this difference between the groups, non-backpackers still make up the vast majority (81%) of the youth segment.
International Visitor Survey – YE Jun 2012 (15 – 29 year olds)
Sample: 1,685 Sample: 5,194
19%
81%
Backpacker - Youth
Backpacker
Non-Backpacker
8%
92%
Backpacker - All
Backpacker
Non-Backpacker
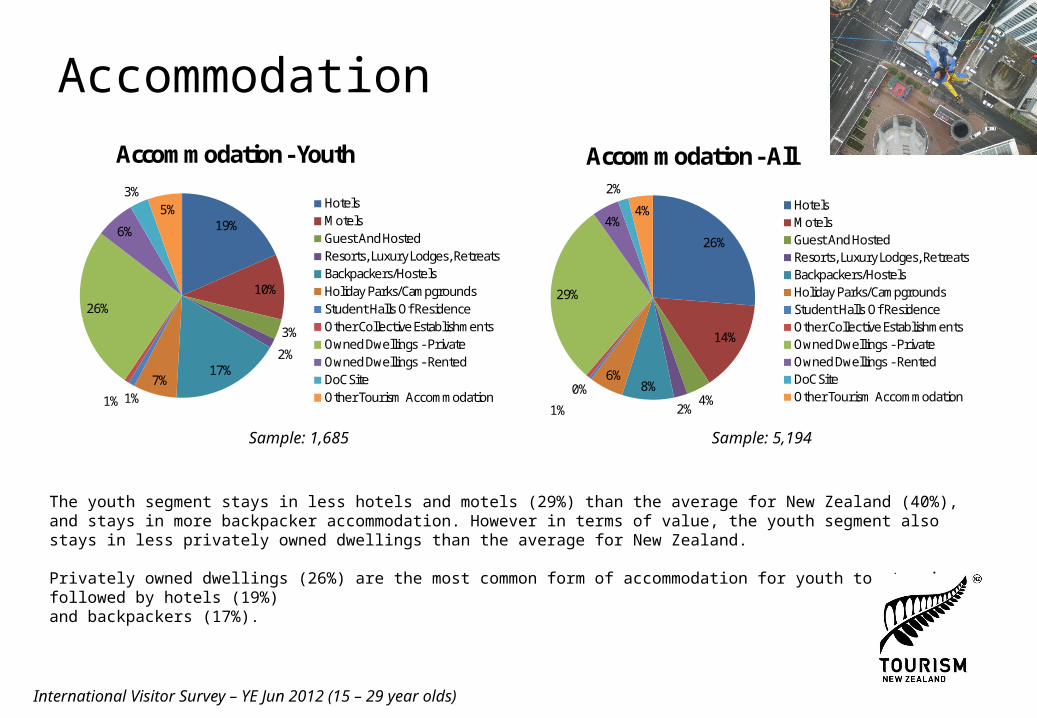
Accommodation
The youth segment stays in less hotels and motels (29%) than the average for New Zealand (40%), and stays in more backpacker accommodation. However in terms of value, the youth segment also stays in less privately owned dwellings than the average for New Zealand.
Privately owned dwellings (26%) are the most common form of accommodation for youth to stay in, followed by hotels (19%)and backpackers (17%).
International Visitor Survey – YE Jun 2012 (15 – 29 year olds)
19%
10%
3%
2%17%
7%1%1%
26%
6%
3%5%
Accommodation - Youth
HotelsMotelsGuest And HostedResorts, Luxury Lodges, RetreatsBackpackers/HostelsHoliday Parks/CampgroundsStudent Halls Of ResidenceOther Collective EstablishmentsOwned Dwellings - PrivateOwned Dwellings - RentedDoC SiteOther Tourism Accommodation
26%
14%
4%2%
8%6%
0%
1%
29%
4%
2%
4%
Accommodation - All
HotelsMotelsGuest And HostedResorts, Luxury Lodges, RetreatsBackpackers/HostelsHoliday Parks/CampgroundsStudent Halls Of ResidenceOther Collective EstablishmentsOwned Dwellings - PrivateOwned Dwellings - RentedDoC SiteOther Tourism Accommodation
Sample: 1,685 Sample: 5,194

Dual Destination
The youth segment has a very similar number of dual destination arrivals as the New Zealand average.
International Visitor Survey – YE Mar 2012 (15 – 29 year olds)
Sample: 1,685 Sample: 5,194
36%
64%
Dual Destination - Youth
Visited Another Country
No Other Countries Visited
35%
65%
Dual Destination - All
Visited Another Country
No Other Countries Visited

People Travelled With
Slightly more youth travel by themselves than the New Zealand average. Also youth are much more likely to travel with friends than the New Zealand average.
Half of all youth travellers travel by themselves, with the addition of 14 per cent that are travelling with friends this mean around 64 percent of youth are singles.
International Visitor Survey – YE Mar 2012 (15 – 29 year olds)
50%
18%
11%
14%
2%1%
0%3%
1%
0%0%
Travelled With - Youth
Travelled AlonePartner/SpouseFamily/WhanauFriendsBusiness AssociatesFamily And FriendsOther CouplesTour GroupSchool Group/Student GroupSpecial Interest GroupOther
46%
22%
13%
7%
4% 1%0%
5%
1%
1% 0%
Travelled With - All
Travelled AlonePartner/SpouseFamily/WhanauFriendsBusiness AssociatesFamily And FriendsOther CouplesTour GroupSchool Group/Student GroupSpecial Interest GroupOther
Sample: 1,685 Sample: 5,194

Activities and Attractions
This index shows firstly which activities youth travellers over index on compared to all tourists, and secondly the percent of youth travellers that undertake particular activities (see percent in brackets on y axis).
Youth travellers over index on a wide range of activities due to their propensity to do more activities while in New Zealand compared to all tourists. Youth travellers do 14.1 activities on average while in New Zealand vs. 13.7 activities on average for all tourists.
Of particular interest is the fact that youth travellers over index on adventure activities. Youth are almost three times more likely to go sky diving and bungy jumping than regular tourists, and are twice as likely to do snow sports, caving, rafting, horse trekking and climbing. 50.3 per cent of youth travellers do some form of adventure tourism while in New Zealand where only 32.9 per cent of all tourists do some form of adventure tourism.
International Visitor Survey – YE Mar 2010 - 2012 (15 – 29 year olds)
100% 150% 200% 250% 300% 350%
Working Holiday (5%)Sky Diving/Parachuting (9%)
Education/Language School (9%)Bungy Jumping (11%)
Snow Sports (11%)Caving (1%)
Canoeing, Kayaking, Rafting (14%)Horse Trekking/Riding (4%)
Climbing (2%)Hunting/Shooting (1%)
Entertainment (47%)Nth Is National Parks (1%)
Paraponting (1%)Motor Sports (3%)
Cycle Sports (5%)Sporting Event (5%)
Theme And Leisure Parks (8%)Swimming (10%)
Performing Arts (3%)Food And Wine Festival (1%)
Whale Watching (4%)Fishing (6%)
Dolphin Watching (7%)Other Scenic/Natural Attractions (59%)
Golf (3%)Volcanic/Geothermal Attractions (31%)
Boating (30%)Other Wildlife Encounters (9%)
Walking And Trekking (80%)Museums And Galleries (28%)
Zoos/Wildlife/Marine Parks (11%)Other Major Events (4%)
Shopping (81%)
Youth Activity Index
Sample: 5,350

Regional Visitation
The youth market generally has a similar regional visitation profile as all visitors. Two clear differences are that youth generally visit more regions than average and also youth are slightly less likely to visit Auckland than all visitors.
International Visitor Survey – YE Mar 2012 (15 – 29 year olds)
Sample: 1,685
0%10%20%30%40%50%60%70%80%90%
Perc
ent o
f Tou
rists
Regional Visitation
Youth
Total

Queenstown
As part of a separate analysis it was found international tourists that visit Queenstown were highly over-represented by youth travellers.
International Visitor Survey – YE Dec 2011International Travel and Migration Survey – YE Dec 2011
1%4%
35%
17%
10%14% 13%
4%0% 0%
0%
5%
10%
15%
20%
25%
30%
35%
40%
Under 10 Years
10 - 19 Years
20 - 29 Years
30 - 39 Years
40 - 49 Years
50 - 59 Years
60 - 69 Years
70 - 79 Years
80 - 89 Years
90 Years and
Over
Arr
ival
sAge Profile of Queenstown International Tourists

Age of Australian Ski MarketThe ski market is much younger than the total of all Australian holiday tourists. Almost two thirds of the Australian ski market are aged between 15 and 34.
0%
5%
10%
15%
20%
25%
30%
35%
15 to 24 25 to 34 35 to 44 45 to 54 55 to 64 65+
Perc
ent o
f Arr
ival
s
Ski Australia All Australia
Source: International Visitor Survey: YE March 09 to 12

Australia as a Source Market

Australia As A Source Market
532,869
311,223
Total Youth Arrivals - 2011
Non Australian Residents
221,646Australian
Residents*
*Australian Residents are classed in NZ arrivals as people that have lived in Australia for 12 months or more
95,234Arrive in New Zealand
after visiting and spending time in
Australia
60% of the youth market originate from Australia as either Australians or visitors to Australia.

Australia as a Source Market
532,869221,646
Total Youth Arrivals - 2011
Australian Residents*42% of total
youth
*Australian Residents are classed in NZ arrivals as people that have lived in Australia for 12 months or more
123,645Australian Residents
and Australian Citizens
23% of total
youth
70,320Australian Residents
but NZ Citizens
13% of total
youth
28,061Australian Residents
but not Aust or NZ Citizens5% of total
youth
Australia as a Source Market
*Australian Residents are classed in NZ arrivals as people that have lived in Australia for 12 months or more
0
20,000
40,000
60,000
80,000
100,000
120,000
140,000
2005 2006 2007 2008 2009 2010 2011
Arr
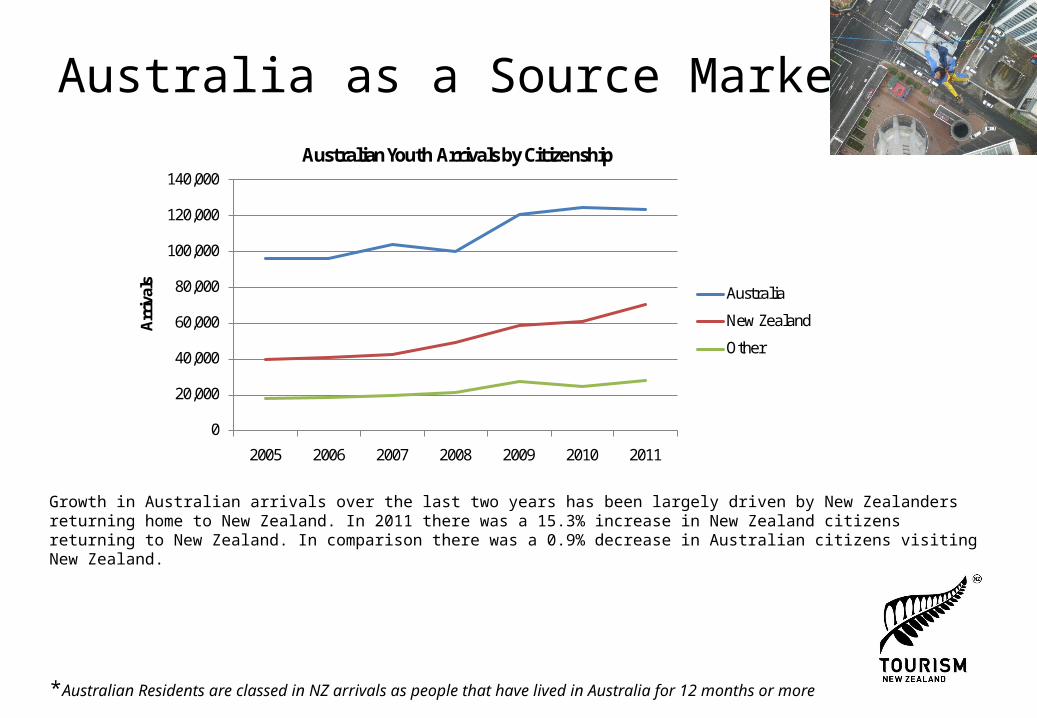
ival
sAustralian Youth Arrivals by Citizenship
Australia
New Zealand
Other
Growth in Australian arrivals over the last two years has been largely driven by New Zealanders returning home to New Zealand. In 2011 there was a 15.3% increase in New Zealand citizens returning to New Zealand. In comparison there was a 0.9% decrease in Australian citizens visiting New Zealand.
Related Documents