What Type of Puts Did Warren Buffett Sell? Pablo Triana 2 February 2014 The title of this piece may look outlandishly puzzling to many. After all, the issue of what type of derivatives Berkshire Hathaway sold during the 2004-2008 period appeared irrefutably settled. Many commentators, including this author, have repeatedly told an identical story. The company itself had been and continues to be painstakingly disclosing the nature of these products, which at first sight appeared simple and easy to understand. That is particularly true when it comes to the equities side of the derivatives play: Berkshire, no one could doubt, chose to sell plain vanilla put options on each of four international stock indices (once more, S&P-FTSE-Nikkei- Eurostoxx). The contracts, admittedly, had some non-common characteristics (big size, long tenor) but they were pretty common in terms of their payout formula and risk parameters. Vanilla equity index options are as familiar to financial markets as the underlying indices themselves. In that sense, then, Berkshire had made a very large and very lengthy stock market bet but a very conventional one, and thus a bet that could be very easily understood and dissected. Or did it? What if Warren Buffett (Berkshire´s chairman initiated the trades and looks after them personally) had sold exotic, not vanilla, puts? Could this even be possible? All the information shared by the firm through its regulatory filings certainly seems to indicate that the puts are nothing if not vanilla. After all, that is why we outsiders have all thought so for so many years. This appeared irrefutable. Well, allow me to venture into contrarian waters. A January 16 th 2008 internal Lehman Brothers report details a transaction that could drastically alter our view of Berkshire´s 1 Forthcoming, Corporate Finance Review March-April 2014 2 ESADE Business School

Welcome message from author
This document is posted to help you gain knowledge. Please leave a comment to let me know what you think about it! Share it to your friends and learn new things together.
Transcript
8/10/2019 What-Type-of-Puts-Did-Buffett-Sell.pdf
http://slidepdf.com/reader/full/what-type-of-puts-did-buffett-sellpdf 1/13
What Type of Puts Did Warren Buffett Sell?
Pablo Triana2
February 2014
The title of this piece may look outlandishly puzzling to many. After all, the issue of
what type of derivatives Berkshire Hathaway sold during the 2004-2008 period
appeared irrefutably settled. Many commentators, including this author, have
repeatedly told an identical story. The company itself had been and continues to be
painstakingly disclosing the nature of these products, which at first sight appeared
simple and easy to understand. That is particularly true when it comes to the equities
side of the derivatives play: Berkshire, no one could doubt, chose to sell plain vanilla
put options on each of four international stock indices (once more, S&P-FTSE-Nikkei-
Eurostoxx). The contracts, admittedly, had some non-common characteristics (big size,
long tenor) but they were pretty common in terms of their payout formula and risk
parameters. Vanilla equity index options are as familiar to financial markets as the
underlying indices themselves. In that sense, then, Berkshire had made a very large
and very lengthy stock market bet but a very conventional one, and thus a bet that
could be very easily understood and dissected.
Or did it? What if Warren Buffett (Berkshire´s chairman initiated the trades and looks
after them personally) had sold exotic, not vanilla, puts? Could this even be possible?
All the information shared by the firm through its regulatory filings certainly seems to
indicate that the puts are nothing if not vanilla. After all, that is why we outsiders have
all thought so for so many years. This appeared irrefutable.
Well, allow me to venture into contrarian waters. A January 16 th 2008 internal Lehman
Brothers report details a transaction that could drastically alter our view of Berkshire´s
1 Forthcoming, Corporate Finance Review March-April 2014
2 ESADE Business School
8/10/2019 What-Type-of-Puts-Did-Buffett-Sell.pdf
http://slidepdf.com/reader/full/what-type-of-puts-did-buffett-sellpdf 2/13
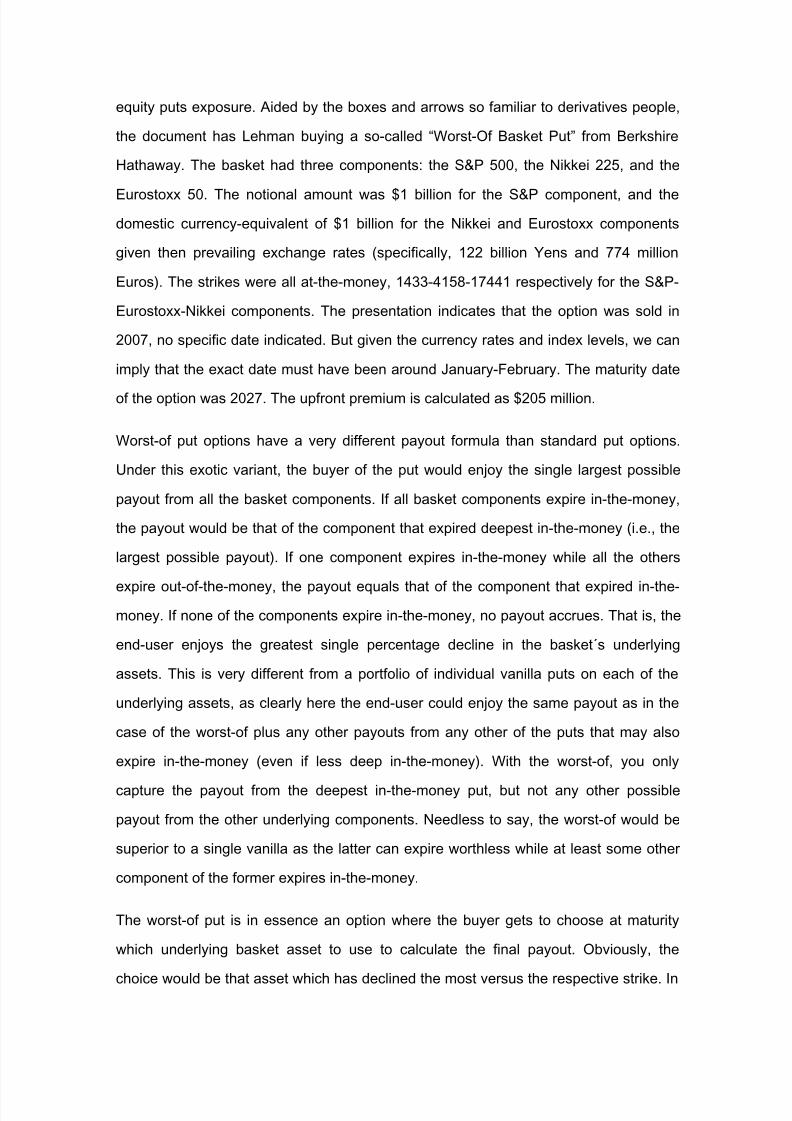
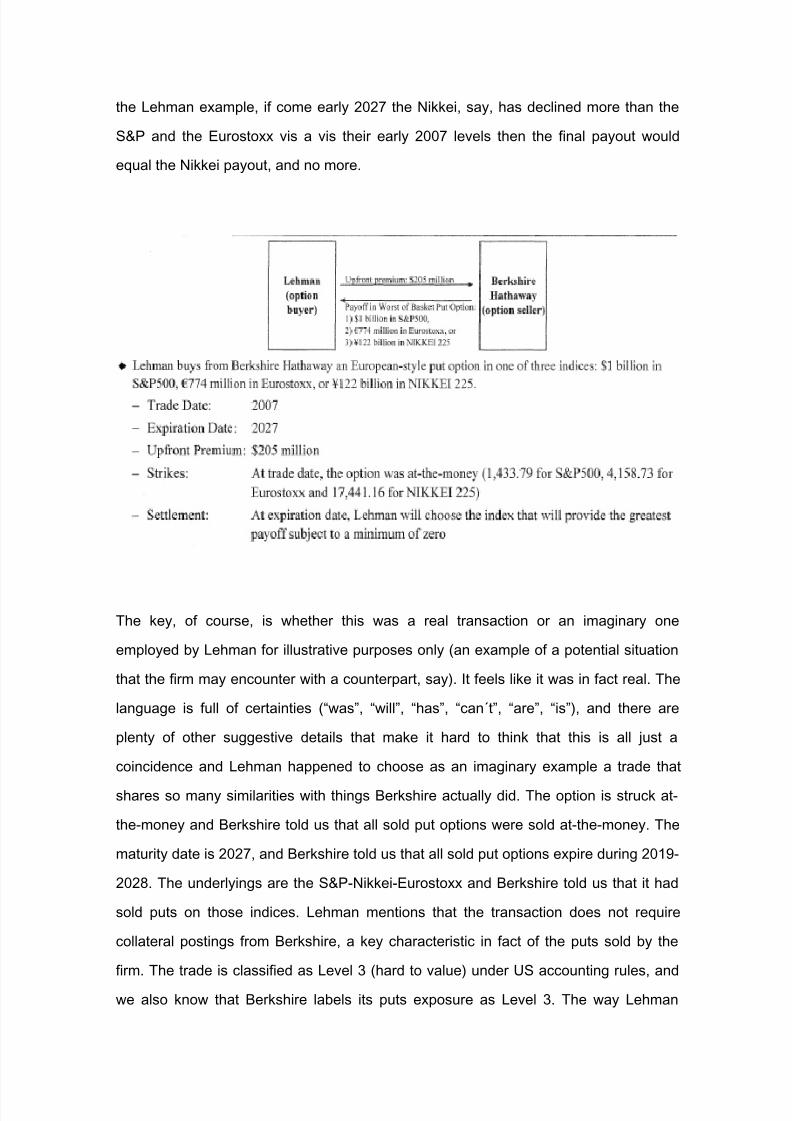
equity puts exposure. Aided by the boxes and arrows so familiar to derivatives people,
the document has Lehman buying a so-called “Worst-Of Basket Put” from Berkshire
Hathaway. The basket had three components: the S&P 500, the Nikkei 225, and the
Eurostoxx 50. The notional amount was $1 billion for the S&P component, and the
domestic currency-equivalent of $1 billion for the Nikkei and Eurostoxx components
given then prevailing exchange rates (specifically, 122 billion Yens and 774 million
Euros). The strikes were all at-the-money, 1433-4158-17441 respectively for the S&P-
Eurostoxx-Nikkei components. The presentation indicates that the option was sold in
2007, no specific date indicated. But given the currency rates and index levels, we can
imply that the exact date must have been around January-February. The maturity date
of the option was 2027. The upfront premium is calculated as $205 million.
Worst-of put options have a very different payout formula than standard put options.
Under this exotic variant, the buyer of the put would enjoy the single largest possible
payout from all the basket components. If all basket components expire in-the-money,
the payout would be that of the component that expired deepest in-the-money (i.e., the
largest possible payout). If one component expires in-the-money while all the others
expire out-of-the-money, the payout equals that of the component that expired in-the-
money. If none of the components expire in-the-money, no payout accrues. That is, the
end-user enjoys the greatest single percentage decline in the basket´s underlying
assets. This is very different from a portfolio of individual vanilla puts on each of the
underlying assets, as clearly here the end-user could enjoy the same payout as in the
case of the worst-of plus any other payouts from any other of the puts that may also
expire in-the-money (even if less deep in-the-money). With the worst-of, you only
capture the payout from the deepest in-the-money put, but not any other possible
payout from the other underlying components. Needless to say, the worst-of would be
superior to a single vanilla as the latter can expire worthless while at least some other
component of the former expires in-the-money.
The worst-of put is in essence an option where the buyer gets to choose at maturity
which underlying basket asset to use to calculate the final payout. Obviously, the
choice would be that asset which has declined the most versus the respective strike. In
8/10/2019 What-Type-of-Puts-Did-Buffett-Sell.pdf
http://slidepdf.com/reader/full/what-type-of-puts-did-buffett-sellpdf 3/13
the Lehman example, if come early 2027 the Nikkei, say, has declined more than the
S&P and the Eurostoxx vis a vis their early 2007 levels then the final payout would
equal the Nikkei payout, and no more.
The key, of course, is whether this was a real transaction or an imaginary one
employed by Lehman for illustrative purposes only (an example of a potential situation
that the firm may encounter with a counterpart, say). It feels like it was in fact real. The
language is full of certainties (“was”, “will”, “has”, “can´t”, “are”, “is”), and there are
plenty of other suggestive details that make it hard to think that this is all just a
coincidence and Lehman happened to choose as an imaginary example a trade that
shares so many similarities with things Berkshire actually did. The option is struck at-
the-money and Berkshire told us that all sold put options were sold at-the-money. The
maturity date is 2027, and Berkshire told us that all sold put options expire during 2019-
2028. The underlyings are the S&P-Nikkei-Eurostoxx and Berkshire told us that it had
sold puts on those indices. Lehman mentions that the transaction does not require
collateral postings from Berkshire, a key characteristic in fact of the puts sold by the
firm. The trade is classified as Level 3 (hard to value) under US accounting rules, and
we also know that Berkshire labels its puts exposure as Level 3. The way Lehman

8/10/2019 What-Type-of-Puts-Did-Buffett-Sell.pdf
http://slidepdf.com/reader/full/what-type-of-puts-did-buffett-sellpdf 4/13
traders attempted to hedge their position (using 10-year over-the-counter options) is
actually described. And, most telling, Lehman provides an actual description of the
mark-to-market evolution of the trade since inception (the position was worth $380
million at the time, an unrealized gain of $175 million for the bank; increases in volatility
in the three indices and a sharp 17% decline in the Nikkei are shared as factors behind
such positive evolution). Lehman was using the presentation to internally highlight how
its complex derivatives valuation and control process operated, and as such it makes
sense that they would actually illustrate things with a high-profile, real-life transaction.
So did Berkshire sell worst-of basket puts? It seems that it did, at least to Lehman and
at least for $1 bn. But the entire equity puts exposure has been around $30-40 billion.
Maybe a $1 billion here and there indulging in some exotic variant would not be
something to write home about. The really interesting question, thus, is whether this
would have been a one-off or rather just one sample of many similar trades.
Vanilla or Tutti Frutti?
It may be quite hard for outsiders to confirm whether or not Buffett´s equity derivatives
forays have the taste of plain simple vanilla or a more colorful exotic flavor. Again, the
public disclosures inevitably lead us to the former (I haven´t read anyone ever even
suggesting that the contracts may be exotic). Perhaps it is possible to work backwards
from the put portfolio data, such as quarterly changes in liabilities or intrinsic values or
premiums collected, and ascertain the precise nature of the contracts, but that is
beyond the immediate purposes of this paper. Maybe this kind of analysis can be
thoroughly conducted at a later date.
But hypothesizing for now that Berkshire sold worst-of options, can we get an idea as
to the possible performance of those contracts? Is it possible to indicate which of the
basket assets, if any, would have clearly outperformed and thus dominated the option´s
market value? Can we identify such episodes in the life of the trades?
Recall that here the option´s expected payout (and thus market value) is not the result
of aggregating expected payouts from individual contracts on different indices, but is

8/10/2019 What-Type-of-Puts-Did-Buffett-Sell.pdf
http://slidepdf.com/reader/full/what-type-of-puts-did-buffett-sellpdf 5/13
entirely dominated by the largest single expected payout. The worst-of put buyer would
get the payout from the best performing individual put, but nothing else from the other
individual puts (even if they would have expired in-the-money themselves). Thus, if one
of the individual basket components “takes off” and begins to outshine the others, the
option´s value would start getting dominated more and more by that component and
less and less by the other components. The relative outperformance can get so drastic
that the underperforming components stop having any noticeable influence over the
put´s value, which in essence becomes equivalent to the worth of an individual put on
the outperforming component. In the Berkshire case, the worst-of put would have a
value equal to that of the individual S&P put, or the individual Nikkei put, or the
individual Eurostoxx put, or the individual FTSE put were the S&P, Nikkei, Eurostoxx,
or FTSE respectively to drastically outperform (i.e., decline much more than the others
in this case). Any combination that results in the S&P drastically underperforming (e.g.,
not declining nearly as much as at least one of the other indexes) could effectively lead
to an option which value becomes insensitive to what happens in S&P land. Worst-of
options completely neglect underperforming assets and worship only outperforming
ones, as the option´s payout is linked exclusively to the best performing basket
component.
We witnessed such a scenario by year-end 2007, for instance. One of the four indexes
did take off from the pack and suffered quite impressive relative declines versus the
other three. During 2007, the Nikkei dropped 14% while the S&P-FTSE-Eurostoxx
actually experienced (minor) increases. The Japanese index opened the year at 17090
and closed it at 14690, while the S&P opened at 1410 and closed at 1470. Given that
all the indexes had experienced a consistent upward trend in the 2004-2006 period and
that the S&P-FTSE-Eurostoxx closed the year higher (i.e., at very few points during the
period did the indexes quote above year-end 2007 levels; basically only during the final
months of that year), and that the Nikkei had quoted above 14690 since late 2005
(having reached a period high of around 18000 in mid-2007) and, again, that the puts
were written at-the-money (at the index spot level prevalent when the options were
being transacted), the conclusion is that while the Nikkei trade must have at that point
been on average deeply in-the-money, while the S&P-FTSE-Eurostoxx trades must
8/10/2019 What-Type-of-Puts-Did-Buffett-Sell.pdf
http://slidepdf.com/reader/full/what-type-of-puts-did-buffett-sellpdf 6/13
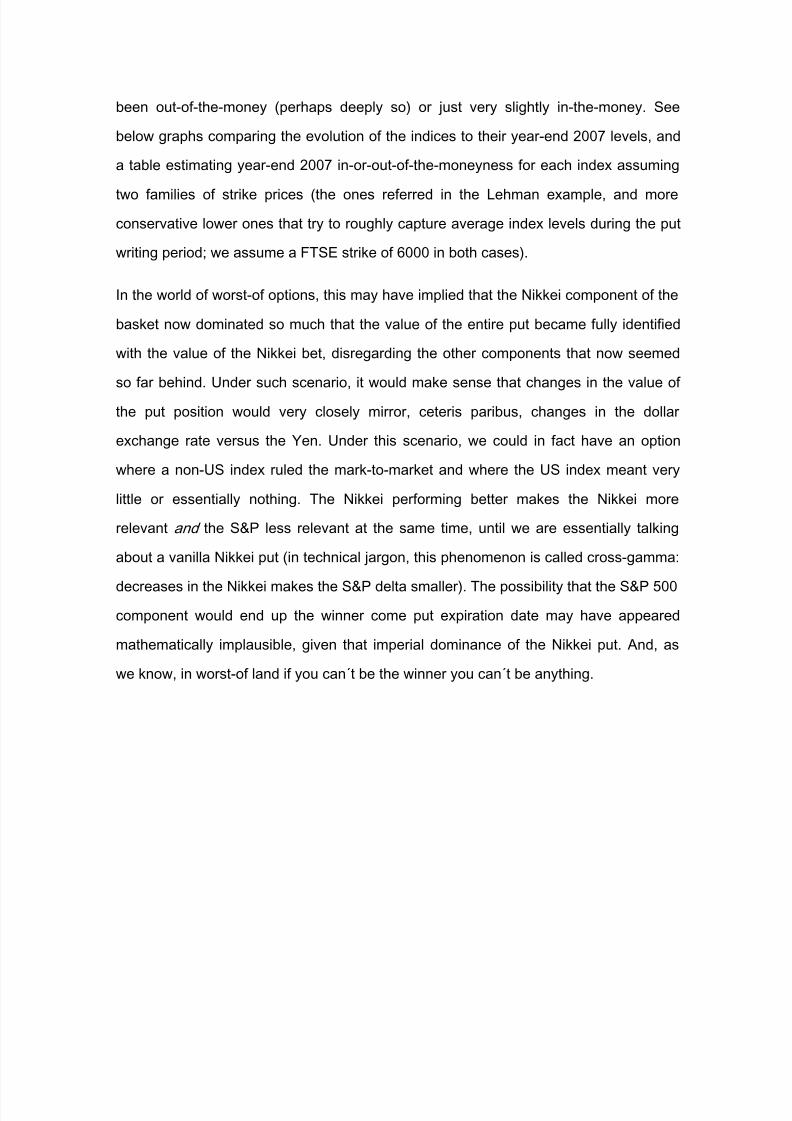
been out-of-the-money (perhaps deeply so) or just very slightly in-the-money. See
below graphs comparing the evolution of the indices to their year-end 2007 levels, and
a table estimating year-end 2007 in-or-out-of-the-moneyness for each index assuming
two families of strike prices (the ones referred in the Lehman example, and more
conservative lower ones that try to roughly capture average index levels during the put
writing period; we assume a FTSE strike of 6000 in both cases).
In the world of worst-of options, this may have implied that the Nikkei component of the
basket now dominated so much that the value of the entire put became fully identified
with the value of the Nikkei bet, disregarding the other components that now seemed
so far behind. Under such scenario, it would make sense that changes in the value of
the put position would very closely mirror, ceteris paribus, changes in the dollar
exchange rate versus the Yen. Under this scenario, we could in fact have an option
where a non-US index ruled the mark-to-market and where the US index meant very
little or essentially nothing. The Nikkei performing better makes the Nikkei more
relevant and the S&P less relevant at the same time, until we are essentially talking
about a vanilla Nikkei put (in technical jargon, this phenomenon is called cross-gamma:
decreases in the Nikkei makes the S&P delta smaller). The possibility that the S&P 500
component would end up the winner come put expiration date may have appeared
mathematically implausible, given that imperial dominance of the Nikkei put. And, as
we know, in worst-of land if you can´t be the winner you can´t be anything.

8/10/2019 What-Type-of-Puts-Did-Buffett-Sell.pdf
http://slidepdf.com/reader/full/what-type-of-puts-did-buffett-sellpdf 7/13
10.000,00
11.000,00
12.000,00
13.000,00
14.000,00
15.000,00
16.000,00
17.000,00
18.000,00
19.000,00
3
d e
d i c
d e
2 0 0 7
1
d e
o c t d e
2 0 0 7
1
d e
a g o
d e
2 0 0 7
1
d e
j u n
d e
2 0 0 7
2
d e
a b r d e
2 0 0 7
1
d e
f e b
d e
2 0 0 7
1
d e
d i c
d e
2 0 0 6
2
d e
o c t d e
2 0 0 6
1
d e
a g o
d e
2 0 0 6
1
d e
j u n
d e
2 0 0 6
3
d e
a b r d e
2 0 0 6
1
d e
f e b
d e
2 0 0 6
1
d e
d i c
d e
2 0 0 5
3
d e
o c t d e
2 0 0 5
1
d e
a g o
d e
2 0 0 5
1
d e
j u n
d e
2 0 0 5
1
d e
a b r d e
2 0 0 5
1
d e
f e b
d e
2 0 0 5
1
d e
d i c
d e
2 0 0 4
1
d e
o c t d e
2 0 0 4
2
d e
a g o
d e
2 0 0 4
1
d e
j u n
d e
2 0 0 4
1
d e
a b r d e
2 0 0 4
2
d e
f e b
d e
2 0 0 4
Nikkei
4.000,00
4.500,00
5.000,00
5.500,00
6.000,00
6.500,00
7.000,00
3
d e
d i c
d e
2 0 0 7
1
d e
o c t d e
2 0 0 7
1
d e
a g o
d e
2 0 0 7
1
d e
j u n
d e
2 0 0 7
2
d e
a b r d e
2 0 0 7
1
d e
f e b
d e
2 0 0 7
1
d e
d i c
d e
2 0 0 6
2
d e
o c t d e
2 0 0 6
1
d e
a g o
d e
2 0 0 6
1
d e
j u n
d e
2 0 0 6
3
d e
a b r d e
2 0 0 6
1
d e
f e b
d e
2 0 0 6
1
d e
d i c
d e
2 0 0 5
3
d e
o c t d e
2 0 0 5
1
d e
a g o
d e
2 0 0 5
1
d e
j u n
d e
2 0 0 5
1
d e
a b r d e
2 0 0 5
1
d e
f e b
d e
2 0 0 5
1
d e
d i c
d e
2 0 0 4
1
d e
o c t d e
2 0 0 4
2
d e
a g o
d e
2 0 0 4
1
d e
j u n
d e
2 0 0 4
1
d e
a b r d e
2 0 0 4
2
d e
f e b
d e
2 0 0 4
FTSE

8/10/2019 What-Type-of-Puts-Did-Buffett-Sell.pdf
http://slidepdf.com/reader/full/what-type-of-puts-did-buffett-sellpdf 8/13
2.500,00
3.000,00
3.500,00
4.000,00
4.500,00
5.000,00
3
d e
d i c
d e
2 0 0
7
1
d e
o c t d e
2 0 0
7
1
d e
a g o
d e
2 0 0
7
1
d e
j u n
d e
2 0 0
7
2
d e
a b r d e
2 0 0
7
1
d e
f e b
d e
2 0 0
7
1
d e
d i c
d e
2 0 0
6
2
d e
o c t d e
2 0 0
6
1
d e
a g o
d e
2 0 0
6
1
d e
j u n
d e
2 0 0
6
3
d e
a b r d e
2 0 0
6
1
d e
f e b
d e
2 0 0
6
1
d e
d i c
d e
2 0 0
5
3
d e
o c t d e
2 0 0
5
1
d e
a g o
d e
2 0 0
5
1
d e
j u n
d e
2 0 0
5
1
d e
a b r d e
2 0 0
5
1
d e
f e b
d e
2 0 0
5
1
d e
d i c
d e
2 0 0
4
1
d e
o c t d e
2 0 0
4
2
d e
a g o
d e
2 0 0
4
1
d e
j u n
d e
2 0 0
4
1
d e
a b r d e
2 0 0
4
2
d e
f e b
d e
2 0 0
4
Eurostoxx
1000,00
1100,00
1200,00
1300,00
1400,00
1500,00
1600,00
S&P
8/10/2019 What-Type-of-Puts-Did-Buffett-Sell.pdf
http://slidepdf.com/reader/full/what-type-of-puts-did-buffett-sellpdf 9/13
year‐end 2007 s pot Lehma n strikes moneyness Conservative strikes moneyness
S&P 1468 ‐2,44% ‐8,74%
Nikkei 14691 15,77% 8,18%
Eurostoxx 4270 ‐2,69% ‐12,37%
FTSE 6348 ‐5,80% ‐5,80%
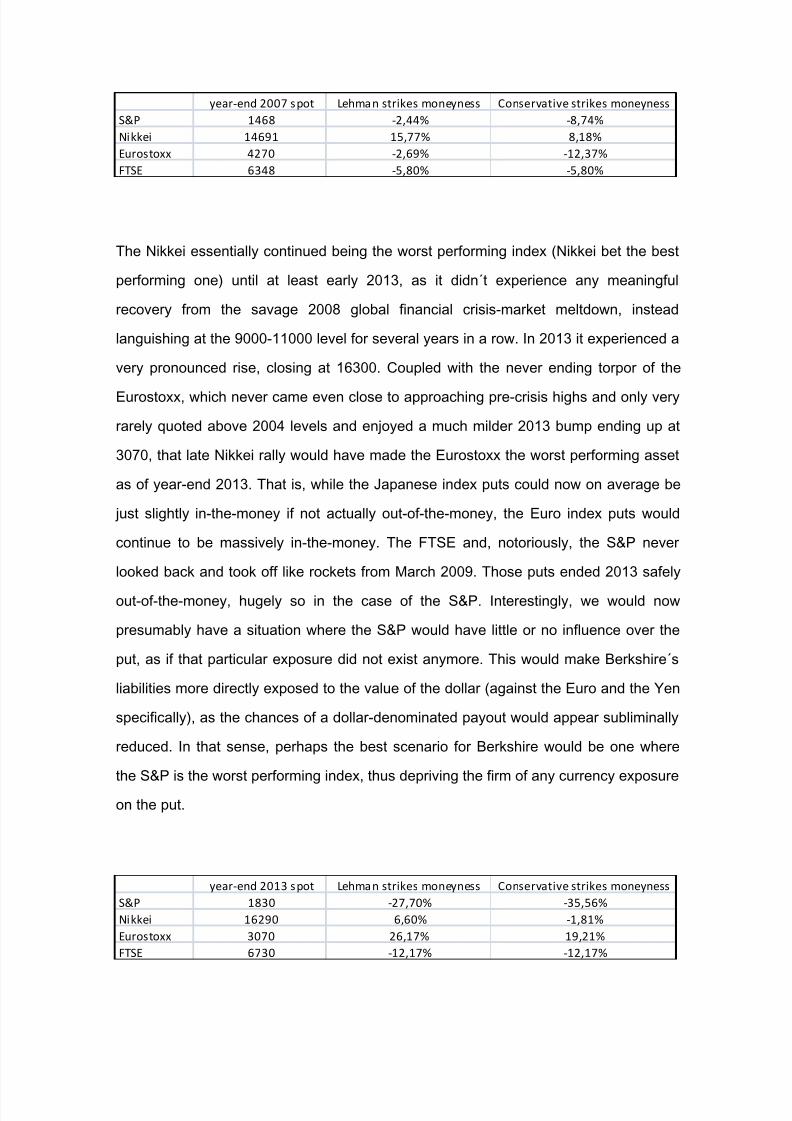
The Nikkei essentially continued being the worst performing index (Nikkei bet the best
performing one) until at least early 2013, as it didn´t experience any meaningful
recovery from the savage 2008 global financial crisis-market meltdown, instead
languishing at the 9000-11000 level for several years in a row. In 2013 it experienced a
very pronounced rise, closing at 16300. Coupled with the never ending torpor of the
Eurostoxx, which never came even close to approaching pre-crisis highs and only very
rarely quoted above 2004 levels and enjoyed a much milder 2013 bump ending up at
3070, that late Nikkei rally would have made the Eurostoxx the worst performing asset
as of year-end 2013. That is, while the Japanese index puts could now on average be
just slightly in-the-money if not actually out-of-the-money, the Euro index puts would
continue to be massively in-the-money. The FTSE and, notoriously, the S&P never
looked back and took off like rockets from March 2009. Those puts ended 2013 safely
out-of-the-money, hugely so in the case of the S&P. Interestingly, we would now
presumably have a situation where the S&P would have little or no influence over the
put, as if that particular exposure did not exist anymore. This would make Berkshire´s
liabilities more directly exposed to the value of the dollar (against the Euro and the Yen
specifically), as the chances of a dollar-denominated payout would appear subliminally
reduced. In that sense, perhaps the best scenario for Berkshire would be one where
the S&P is the worst performing index, thus depriving the firm of any currency exposure
on the put.
year‐end 2013 s pot Lehma n strikes moneyness Conservative strikes moneyness
S&P 1830 ‐27,70% ‐35,56%
Nikkei 16290 6,60% ‐1,81%
Eurostoxx 3070 26,17% 19,21%
FTSE 6730 ‐12,17% ‐12,17%
8/10/2019 What-Type-of-Puts-Did-Buffett-Sell.pdf
http://slidepdf.com/reader/full/what-type-of-puts-did-buffett-sellpdf 10/13
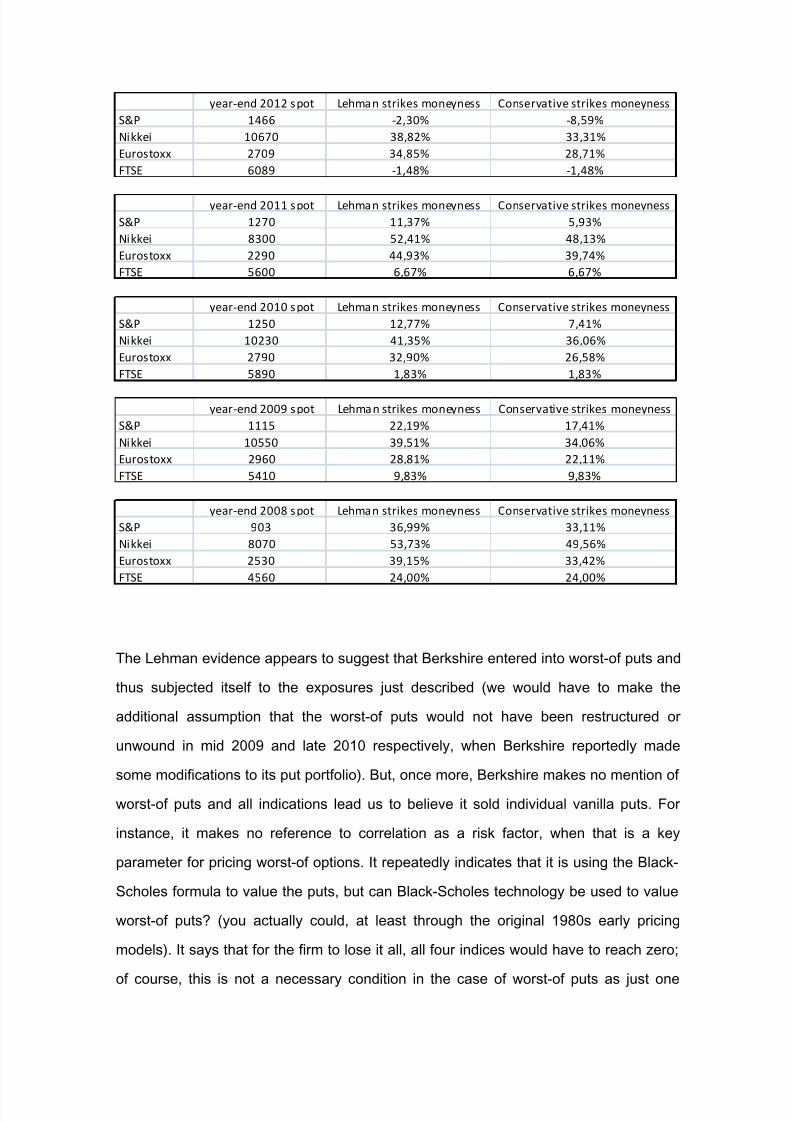
year‐end 2012 s pot Lehma n strikes moneyness Conservative strikes moneyness
S&P 1466 ‐2,30% ‐8,59%
Nikkei 10670 38,82% 33,31%
Eurostoxx 2709 34,85% 28,71%
FTSE 6089 ‐1,48% ‐1,48%
year‐end 2011 s pot Lehma n strikes moneyness Conservative strikes moneyness
S&P 1270 11,37% 5,93%
Nikkei 8300 52,41% 48,13%
Eurostoxx 2290 44,93% 39,74%
FTSE 5600 6,67% 6,67%
year‐end 2010 s pot Lehma n strikes moneyness Conservative strikes moneyness
S&P 1250 12,77% 7,41%
Nikkei 10230 41,35% 36,06%
Eurostoxx 2790 32,90% 26,58%
FTSE 5890 1,83% 1,83%
year‐end 2009 s pot Lehma n strikes moneyness Conservative strikes moneyness
S&P 1115 22,19% 17,41%
Nikkei 10550 39,51% 34,06%
Eurostoxx 2960 28,81% 22,11%
FTSE 5410 9,83% 9,83%
year‐end 2008 s pot Lehma n strikes moneyness Conservative strikes moneyness
S&P 903 36,99% 33,11%
Nikkei 8070 53,73% 49,56%
Eurostoxx 2530 39,15% 33,42%
FTSE 4560 24,00% 24,00%
The Lehman evidence appears to suggest that Berkshire entered into worst-of puts and
thus subjected itself to the exposures just described (we would have to make the
additional assumption that the worst-of puts would not have been restructured or
unwound in mid 2009 and late 2010 respectively, when Berkshire reportedly made
some modifications to its put portfolio). But, once more, Berkshire makes no mention of
worst-of puts and all indications lead us to believe it sold individual vanilla puts. For
instance, it makes no reference to correlation as a risk factor, when that is a key
parameter for pricing worst-of options. It repeatedly indicates that it is using the Black-
Scholes formula to value the puts, but can Black-Scholes technology be used to value
worst-of puts? (you actually could, at least through the original 1980s early pricing
models). It says that for the firm to lose it all, all four indices would have to reach zero;
of course, this is not a necessary condition in the case of worst-of puts as just one
8/10/2019 What-Type-of-Puts-Did-Buffett-Sell.pdf
http://slidepdf.com/reader/full/what-type-of-puts-did-buffett-sellpdf 11/13
index going to zero would be enough (though technically Berkshire wouldn´t be telling a
complete inaccuracy as you don´t know beforehand which index would perform the
worst and so you should assume that any of the four would have to go to zero). On the
other hand, the labeling of the puts as convoluted Level 3 assets would seem to make
much more sense if those were worst-of puts.
Why would Berkshire sell worst-of puts instead of individual vanilla puts? Worst-of puts
are cheaper than a portfolio of individual vanillas (with same notional amounts on each
of the underlyings) but more expensive than one single individual vanilla. Maybe the
market was demanding that type of product, perhaps as a back-to-back hedge on
accumulated risk. Maybe Buffett began with the idea of betting on the S&P alone, and
the counterparts told him he could raise more premium by selling a worst-of. Maybe he
didn´t want to face the larger exposure from selling a group of individual puts (including
larger potential loss payouts, larger liabilities, more pronounced risk factors). Or
maybe, at the end of the day, he never sold a single worst-of put.
Somewhere Over the Rainbow
The seller of worst-of puts (members of the “multifactor” or “rainbow” options family,
referring to those products which payoff is linked to the performance of several, not just
one, underlying assets) is exposed to mark-to-market risks in a different manner than
the seller of plain vanilla puts. This means that now the liabilities number, and thus the
quarterly gains or losses, generated by the trade would change for different reasons
and with different intensity. In essence, by deciding to sell worst-of puts rather than
vanilla the seller becomes exposed to new risks.
For example, correlation risks. The worst-of put benefits from dispersion, as a large
range of possible outcomes for the basket components increases the probability not
only that at least one will expire in-the-money but that at least one will expire really
deep in-the-money. Since you are entitled to the very best payout, you appreciate the
chance of the option generating a very large payout. Also, the only way this option
doesn´t pay out is if none of the underlying basket assets ends up in-the-money, and
8/10/2019 What-Type-of-Puts-Did-Buffett-Sell.pdf
http://slidepdf.com/reader/full/what-type-of-puts-did-buffett-sellpdf 12/13
for this to happen the components would have to be positively correlated (move all in
the same direction, which of course includes all moving upwards above the respective
strikes). Negative correlation or lack of correlation could deliver at least one in-the-
money component. Thus, the buyer or a worst-of put is short correlation (long
dispersion), making the seller long correlation (short dispersion). As opposed to
standard basket option structures, where payout is based on the average performance
of the basket components including in-the-money and out-of-the-money ones,
increases in correlation diminish the value of the worst-of. Dispersion makes it easier
for at least one of the basket components to be in-the-money and for a very large
payout to take place, the opposite being true for lack of dispersion. In contrast, best-of-
puts (where the payout would be that of the worst performing put, or best performing
underlying asset) gain with correlation as now you need all the components in-the-
money in order to enjoy a payout, and dispersion is an enemy of that while very high
positive correlation includes such scenario (all assets moving down below their
respective strikes).
Worst-of puts have “negative cross-gamma”. This means that when one of the assets
underperforms relative to another, the sensitivity of the option´s value with respect to
the latter asset is reduced. In other words, the relative strength of one asset leads to
relative weakness in the other asset: as the overperforming asset matters more, the
underperforming asset matters less (its delta becomes smaller in absolute value, even
if that asset has improved its individual in-the-moneyness; what matters is relative not
absolute performance). Of course, this is a marked change with regards to a portfolio of
vanilla puts, where the deltas of every single option can matter a lot at the same time
and do not have to cancel each other out. In a worst-of put the deltas of
underperforming assets can diminish all the way into oblivion, with that basket
component now effectively having no impact whatsoever in the option´s total value. In
the case of a portfolio of vanillas, it is unlikely for single delta to stop having an impact,
even if that component would be quite out-of-the-money and notwithstanding the
relative performance of the other components. In vanilla land the individual relevance
of a single underlying asset is independent of the relevance of the other underlyings:
an underlying can still matter even if at least one of the other underlyings matters
8/10/2019 What-Type-of-Puts-Did-Buffett-Sell.pdf
http://slidepdf.com/reader/full/what-type-of-puts-did-buffett-sellpdf 13/13
subliminally more. In worst-of land that´s not the case: superstar underlyings erase the
influence of the others, essentially killing their deltas. For a vanilla portfolio the total
value will always be the sum of the values of the independent components, and all
deltas will change that total value. For a worst-of, the value can be determined uniquely
by one of the components, its particular delta now the option´s delta.
A similar “Greek extermination” process can apply to the vega of a worst-of. As the
underperforming component takes off, its vega becomes relative weightier and the
other vegas lose shine, until potentially they may not matter at all. The volatility/ies of
an underlying asset/s can end up having no impact on the option´s value, a clear
departure from vanilla land. Rho and theta can also end up dominated by one or two
underlying basket components.
It follows that a worst-of put would be less exposed from a mark-to-market point of view
than a portfolio of vanillas. The standard Greeks can be quite smaller, as they would
likely not equal the sum of the individual Greeks. The worst-of delta, vega, and rho
figures would be subdued. The liabilities incurred by the seller could thus be much less
severe than under the cumulative vanilla portfolio scenario.
How would Berkshire have fared? Well, it seems from our previous analysis that the
Nikkei Greeks would have dominated almost throughout. And the S&P and FTSE
Greeks would have been progressively exterminated, their relative contribution having
been exorcised, especially in the case of the US index. What happens in Japan and in
Europe would now drive the entire option´s market value. As for correlation, the option
would have certainly experienced a highly correlated event in late 2008 and early 2009,
with all indexes tanking and all volatilities exploding. The worst-of put´s accounting
worth would have suffered from such lack of dispersion. Interestingly, the put liabilities
reported by Berkshire for those dates feel, at $10 billion out of a $35 billion notional
exposure, somewhat low under the assumption that those are individual single-index
vanilla puts.
Related Documents