What should a modern Mathematical Statistics course look like? Randall Pruim Calvin College May 7, 2010

Welcome message from author
This document is posted to help you gain knowledge. Please leave a comment to let me know what you think about it! Share it to your friends and learn new things together.
Transcript

What should amodern Mathematical Statistics
course look like?
Randall Pruim
Calvin College
May 7, 2010

What Course(s) am I Talking About?
• 2-semester
• but some students only take first semester
• post-calculus
• ≥ 4 semesters of mathematics• NOT primarily mathematics majors
• Math, economics, chemistry, biology, engineering, psychology,computer science
• introduction
• some students have not seen any statistics before• some have had AP Stats or Stats in another discipline
(econometrics, for example)
The “prob and stats” sequence

What Course(s) am I Talking About?
• 2-semester• but some students only take first semester
• post-calculus• ≥ 4 semesters of mathematics• NOT primarily mathematics majors
• Math, economics, chemistry, biology, engineering, psychology,computer science
• introduction• some students have not seen any statistics before• some have had AP Stats or Stats in another discipline
(econometrics, for example)
The “prob and stats” sequence

Truth in Advertizing
Coming soonto a bookstorenear you . . .
!"#$%&'("$)*&$%*+,,-(.&'("$)*"/*0'&'()'(.)+$*1$'2"%#.'("$*3)($4*!
!"#$"%%&'()*+
+562(.&$*7&'865&'(.&-*0".(6'9
!"#$%&'("$)*&$%*+
,,-(.&'("$)*"/*0'&'()'(.)***'
()*+
,-./!0!1.,12/&&&&&&2/324
154
&&&&&&&267&!"##$&&&&&4/!8/4
%&'()"*+),--#.(+9:
1542/32
9:
154&;#&<67&=7>&&???@"+A@;(B+70:;<:=>?
!"2*&%%('("$&-*($/"25&'("$*&$%*#,%&'6)*"$*'8()*@""AB*C()('
???@"+A@;(BC>;;DE"B7AC"+A<7F<G9:
2-color cover: PMS 432 (Gray) and PMS 1805 (Red) ??? pages • Backspace 1 1/8" • Trim Size: 7" x 10"
&&&&&&&267&!"##$&&&&&4/!8/4
!is series was founded by the highly respectedmathematician and educator, Paul J. Sally, Jr.

Some Ingredients
1. Computation
2. Statistics
3. Probability
4. Linear Algebra
5. Students

The Recipe
1. Computation
Computational FormulasStatistical Software (R)
2. Statistics
Emphasize practical, conceptual statistical thinking,and start early
3. Probability
Probability then StatisticsProbability for Statistics
4. Linear Algebra
Take the Middle Road (Geometry and Projections)
5. Season liberally with flavorful data

A Hockey Problem
After a 2010 NHL play-off win in which Detroit Redwings wingmanHenrik Zetterberg scored two gaols in a 3-0 win over the PhoenixCoyotes, Detroit coach Mike Babcock said, “He’s been real goodat playoff time each and every year. He seems to score at a higherrate.”
Do the data support this claim?
season playoffs
goals 206 44games 506 89
Solution (R code)
1 - ppois(43, 206/506 * 89)
[1] 0.1156876

Golfballs in Allan’s Yard
Data:
1 2 3 4
137 138 107 104
Question:
Are the numbers (1,2,3,4) on golf balls equally common?
(amonggolfers who drive about 150-200 yards and tend to slice)
How do we test this hypothesis?
1. State null and alternative hypothesesH0 : π1 = π2 = π3 = π4
2. Compute a test statistic
(but what test statistic?)
3. Determine the p-value (from null distrubution of test stat)
4. Draw a conclusion
[golfballs1]

Golfballs in Allan’s Yard
Data:
1 2 3 4
137 138 107 104
Question:
Are the numbers (1,2,3,4) on golf balls equally common? (amonggolfers who drive about 150-200 yards
and tend to slice)
How do we test this hypothesis?
1. State null and alternative hypothesesH0 : π1 = π2 = π3 = π4
2. Compute a test statistic
(but what test statistic?)
3. Determine the p-value (from null distrubution of test stat)
4. Draw a conclusion
[golfballs1]

Golfballs in Allan’s Yard
Data:
1 2 3 4
137 138 107 104
Question:
Are the numbers (1,2,3,4) on golf balls equally common? (amonggolfers who drive about 150-200 yards and tend to slice)
How do we test this hypothesis?
1. State null and alternative hypothesesH0 : π1 = π2 = π3 = π4
2. Compute a test statistic (but what test statistic?)
3. Determine the p-value (from null distrubution of test stat)
4. Draw a conclusion
[golfballs1]
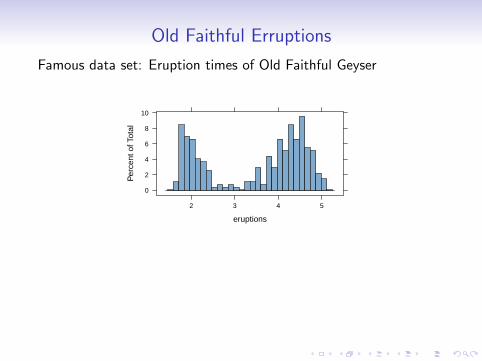
Old Faithful Erruptions
Famous data set: Eruption times of Old Faithful Geyser
eruptions
Per
cent
of T
otal
0
2
4
6
8
10
2 3 4 5
# density function for mixture of normals
> dmix <- function(x, alpha,mu1,mu2,sigma1,sigma2) {+ if (alpha < 0) return (dnorm(x,mu2,sigma2));
+ if (alpha > 1) return (dnorm(x,mu1,sigma1));
+ alpha * dnorm(x,mu1,sigma1) + (1-alpha) * dnorm(x,mu2,sigma2);
+ }# define log-likelihood function
> loglik <- function(theta, x) {+ alpha <- theta[1];
+ mu1 <- theta[2]; mu2 <- theta[3];
+ sigma1 <- theta[4]; sigma2 <- theta[5];
+ density <- function (x) {+ if (alpha < 0) return (Inf); if (alpha > 1) return (Inf);
+ if (sigma1<= 0) return (Inf); if (sigma2<= 0) return (Inf);
+ dmix(x,alpha,mu1,mu2,sigma1,sigma2);
+ }+ sum( log ( sapply( x, density) ) )
+ }# maximize the log likelihood
> m <- mean(faithful$eruptions); s <- sd(faithful$eruptions);
> mle <- nlmax(loglik,p=c(.5,m-1,m+1,s,s),x=faithful$eruptions)$estimate;
> mle;
[1] 0.3484040 2.0186065 4.2733410 0.2356208 0.4370633

Old Faithful Erruptions
Famous data set: Eruption times of Old Faithful Geyser
# density function for mixture of normals
> dmix <- function(x, alpha,mu1,mu2,sigma1,sigma2) {+ if (alpha < 0) return (dnorm(x,mu2,sigma2));
+ if (alpha > 1) return (dnorm(x,mu1,sigma1));
+ alpha * dnorm(x,mu1,sigma1) + (1-alpha) * dnorm(x,mu2,sigma2);
+ }# define log-likelihood function
> loglik <- function(theta, x) {+ alpha <- theta[1];
+ mu1 <- theta[2]; mu2 <- theta[3];
+ sigma1 <- theta[4]; sigma2 <- theta[5];
+ density <- function (x) {+ if (alpha < 0) return (Inf); if (alpha > 1) return (Inf);
+ if (sigma1<= 0) return (Inf); if (sigma2<= 0) return (Inf);
+ dmix(x,alpha,mu1,mu2,sigma1,sigma2);
+ }+ sum( log ( sapply( x, density) ) )
+ }# maximize the log likelihood
> m <- mean(faithful$eruptions); s <- sd(faithful$eruptions);
> mle <- nlmax(loglik,p=c(.5,m-1,m+1,s,s),x=faithful$eruptions)$estimate;
> mle;
[1] 0.3484040 2.0186065 4.2733410 0.2356208 0.4370633

Old Faithful Erruptions
The resulting fit:
eruptions
Den
sity
0.0
0.2
0.4
0.6
2 3 4 5

Kernel Density Estimation
Focus on role of kernels, and dependence on choice of kernels
K2
x
dens
ity
0.0
0.1
0.2
0.3
2 4 6 8 10
K4
x
dens
ity
0.0
0.1
0.2
0.3
2 4 6 8 10
Applied to Old Faithful in R:
Normal kernel
times
Den
sity
0.0
0.1
0.2
0.3
0.4
0.5
1 2 3 4 5 6
●● ●● ●● ●●● ●● ● ●● ●●● ●● ●●● ●● ●●● ●● ●● ●● ●●●● ●● ●●● ●● ●● ●● ●● ●●● ●● ●●● ●●● ●● ●● ●● ●● ●●● ●●● ●● ●●● ● ●●● ● ●● ●● ●● ●● ●● ● ●●● ●● ●● ●●● ●● ●● ●● ●●● ●● ●● ●● ● ●● ●●● ●● ●● ●● ●● ●● ●● ● ●● ● ●●● ●● ●● ●●● ●● ● ●●● ●● ●● ●● ●● ●● ●● ● ●● ● ● ●● ● ●● ●●●● ●●● ●● ●● ●●● ●● ●● ●● ●●● ●● ●●● ●● ●● ●● ●● ●● ●● ●● ●●●● ●● ●●● ●● ●●● ●●● ●● ●● ●●● ●● ●● ●● ●●●● ●● ● ●●● ●● ● ●●● ●● ●
Normal kernel; adjust=0.25
times
Den
sity
0.0
0.2
0.4
0.6
2 3 4 5
●● ●● ●● ●●● ●● ● ●● ●●● ●● ●●● ●● ●●● ●● ●● ●● ●●●● ●● ●●● ●● ●● ●● ●● ●●● ●● ●●● ●●● ●● ●● ●● ●● ●●● ●●● ●● ●●● ● ●●● ● ●● ●● ●● ●● ●● ● ●●● ●● ●● ●●● ●● ●● ●● ●●● ●● ●● ●● ● ●● ●●● ●● ●● ●● ●● ●● ●● ● ●● ● ●●● ●● ●● ●●● ●● ● ●●● ●● ●● ●● ●● ●● ●● ● ●● ● ● ●● ● ●● ●●●● ●●● ●● ●● ●●● ●● ●● ●● ●●● ●● ●●● ●● ●● ●● ●● ●● ●● ●● ●● ●● ●● ●●● ●● ●●● ●●● ●● ●● ●●● ●● ●● ●● ●●●● ●● ● ●●● ●● ● ●●● ●● ●

Ranking NCAA Basketball teams
Goals:
• Estimate π(x , y) = P(Team x defeats Team y)
• Rank the teams (choose top 65)
Data:
• Outcomes of each Divsion I basketball game
• Location of game (optionally used) and score (not used)
Problems:
• Too many parameters• Number of pairs of teams much larger than number of games
• Unclear how to get from π(x , y) to rankings

Ranking NCAA Basketball teams
Ideas:
• We need to reparameterize(to reduce number of parameters)
• Rx = rating for team x
• New Goal: Estimate Rx
• π(x , y) now a function of Rx and Ry
• Need to estimate the values of Rx and Ry and any parametersin the function.
Models:
• Linear model: π(x , y) = β0 + β1(Rx − Ry )
• Better model: log( π(x ,y)1−π(x ,y)) = β0 + β1(Rx − Ry )
• Fit using BradleyTerry package in R

2009-10 NCAA Results
# fit a Bradley-Terry model
> BTm( ncaa2010 ~ .. ) -> ncaa2010.model;
# look at top teams
> ratings <- BTabilities(ncaa2010.model);
> ratings[rev(order(ratings[,1]))[1:30],]
ability s.e.
Kansas 5.856908 0.9770697
Syracuse 5.502109 0.8949338
Kentucky 5.390957 0.9849255
West.Virginia 4.884033 0.8017172
Villanova 4.788624 0.8095992
Purdue 4.779373 0.8642392
Duke 4.720885 0.8028116
New.Mexico 4.675544 0.8846900
Kansas.St. 4.441391 0.8129761
Pittsburgh 4.371426 0.7968199
Baylor 4.352448 0.8103320...

Linear Models
Focus on:
• expressing models (and unsderstanding what they say)
• diagnostics (check model assumptions)
• model comparision tests
Linear Algebra:
• Don’t need much• dot products• length• projections• orthogonality
• Focus on visual/geometric• Formulas less mysterious• Degrees of freedom less mysterious

Linear Models
model space
y
observation: y
fit: yeffect: y − y
residual: e = y − y
variance: y − y
[geolm]

Linear Models
Related Documents
![[PPT]PowerPoint Presentation - ANOVA: Analysis of Variationrpruim/courses/m243/F03/overheads... · Web viewANOVA: Analysis of Variation Math 243 Lecture R. Pruim The basic ANOVA situation](https://static.cupdf.com/doc/110x72/5ae47dc57f8b9a495c8e9ed4/pptpowerpoint-presentation-anova-analysis-of-rpruimcoursesm243f03overheadsweb.jpg)


