1 Engaging Elementary Students with Mathematical Processes During Assessment: What Opportunities Exist in Tests Accompanying Published Curricula? Patricia D. Hunsader Denisse R. Thompson Barbara Zorin University of South Florida, University of South Florida MATHBones Pro Sarasota-Manatee, FL USA Tampa, FL USA Consultant [email protected] [email protected] [email protected] In this paper, we present a framework used to analyze the extent to which assessments (i.e., chapter tests) accompanying three published elementary grades 3-5 curricula in the United States provide students with opportunities to engage with key mathematical processes. The framework uses indicators for five criteria to assess the processes of reasoning, communication, connections, and representation. The results from coding over 100 tests indicate that students had the most opportunities to engage with connections, and the fewest opportunities to engage with reasoning. The results suggest the need for more efforts to ensure that assessments focus not only on what students learn (i.e., the content) but also on how they learn (i.e., mathematical processes). Keywords: primary mathematics curriculum, assessment, mathematical processes In the Assessment Standards for School Mathematics, the National Council of Teachers of Mathematics (NCTM, 1995) describes assessment as “the process of gathering evidence about a student’s knowledge of, ability to use, and dispositions toward, mathematics and making inferences from that evidence for a variety of purposes” (p. 3). Any method used to assess children’s mathematics learning should reflect meaningful goals and objectives (Lin, 2006) so the assessment results can be used to make appropriate instructional decisions (Romagnano, 2001) and help educators identify ways to improve mathematics teaching and learning (NCTM, 1989). Indeed, the National Research Council, in its report Everybody Counts (1989), asserts: “We must ensure that tests measure what is of value, not just what is easy to test” (p. 70). Thus, assessment should be a “bridge between teaching and learning, helping teachers collect evidence about student achievement in order to adjust instruction to better meet student learning needs” (Wiliam, 2007, p. 1054). Mathematics educators have indicated that how students learn (i.e., the mathematical processes through which they learn) is as important as what they learn (i.e., the specific mathematical content) (Kilpatrick, Swafford, & Findell, 2001; Ma, 1999; NCTM, 1989, 2000, 2006). As students engage in the process of doing mathematics, they make meaning of mathematics concepts for themselves, relating conceptual and procedural understanding. To further instruction, teachers need to gain insight into their students’ thinking, a task that can be accomplished by engaging students in important mathematical processes (NCTM, 2000). Examples of this engagement include having students record their reasoning, communicate mathematically, connect to real world contexts, make connections within and between mathematical concepts, interpret and create graphics, and translate mathematical ideas between representational forms. Assessment, both formal and informal, is one strategy, albeit not the only strategy, by which teachers can engage students in these important processes and gain critical insights into students’ thinking. One question for consideration is whether the assessments (i.e., chapter tests) that accompany published elementary curricula provide opportunities for students to engage with these mathematical processes.

Welcome message from author
This document is posted to help you gain knowledge. Please leave a comment to let me know what you think about it! Share it to your friends and learn new things together.
Transcript

1
Engaging Elementary Students with Mathematical Processes During Assessment: What Opportunities Exist in Tests Accompanying Published Curricula?
Patricia D. Hunsader Denisse R. Thompson Barbara Zorin University of South Florida, University of South Florida MATHBones Pro Sarasota-Manatee, FL USA Tampa, FL USA Consultant [email protected] [email protected] [email protected]
In this paper, we present a framework used to analyze the extent to which assessments (i.e., chapter tests) accompanying three published elementary grades 3-5 curricula in the United States provide students with opportunities to engage with key mathematical processes. The framework uses indicators for five criteria to assess the processes of reasoning, communication, connections, and representation. The results from coding over 100 tests indicate that students had the most opportunities to engage with connections, and the fewest opportunities to engage with reasoning. The results suggest the need for more efforts to ensure that assessments focus not only on what students learn (i.e., the content) but also on how they learn (i.e., mathematical processes).
Keywords: primary mathematics curriculum, assessment, mathematical processes
In the Assessment Standards for School Mathematics, the National Council of Teachers of Mathematics (NCTM, 1995) describes assessment as “the process of gathering evidence about a student’s knowledge of, ability to use, and dispositions toward, mathematics and making inferences from that evidence for a variety of purposes” (p. 3). Any method used to assess children’s mathematics learning should reflect meaningful goals and objectives (Lin, 2006) so the assessment results can be used to make appropriate instructional decisions (Romagnano, 2001) and help educators identify ways to improve mathematics teaching and learning (NCTM, 1989). Indeed, the National Research Council, in its report Everybody Counts (1989), asserts: “We must ensure that tests measure what is of value, not just what is easy to test” (p. 70). Thus, assessment should be a “bridge between teaching and learning, helping teachers collect evidence about student achievement in order to adjust instruction to better meet student learning needs” (Wiliam, 2007, p. 1054).
Mathematics educators have indicated that how students learn (i.e., the mathematical processes through which they learn) is as important as what they learn (i.e., the specific mathematical content) (Kilpatrick, Swafford, & Findell, 2001; Ma, 1999; NCTM, 1989, 2000, 2006). As students engage in the process of doing mathematics, they make meaning of mathematics concepts for themselves, relating conceptual and procedural understanding. To further instruction, teachers need to gain insight into their students’ thinking, a task that can be accomplished by engaging students in important mathematical processes (NCTM, 2000). Examples of this engagement include having students record their reasoning, communicate mathematically, connect to real world contexts, make connections within and between mathematical concepts, interpret and create graphics, and translate mathematical ideas between representational forms. Assessment, both formal and informal, is one strategy, albeit not the only strategy, by which teachers can engage students in these important processes and gain critical insights into students’ thinking. One question for consideration is whether the assessments (i.e., chapter tests) that accompany published elementary curricula provide opportunities for students to engage with these mathematical processes.

2
Researchers interested in curriculum often identify several layers of curriculum to determine the focus of interest: intended, written, implemented, assessed, or attained (Stein, Remillard, & Smith, 2007; Valverde, Bianchi, Wolfe, Schmidt, & Houang, 2002). The intended curriculum refers to the curriculum teachers are expected to deliver in keeping with the policies of the state, district, or nation in which they teach. The written curriculum is the curriculum outlined in textbooks interpreting for teachers how the intended curriculum should play out during instruction, which gives rise to the implemented curriculum (Valverde et al., 2002). The assessed curriculum refers to the curriculum that is assessed and the assessment methods; it includes classroom assessments, such as the tests publishers provide to accompany their curricular materials as well as alternative assessments that teachers might use to determine dispositions, attitudes, or the ability to work in groups. The attained curriculum refers to what students actually learn, both from the assessed curriculum as well as from aspects of the curriculum that are not assessed. No one research study can reasonably consider all these levels of curriculum at one time. So, in this study, we focus only on the assessed curriculum, specifically the assessed curriculum as articulated in tests accompanying published elementary curricula that have been written to explicate for teachers the important learning objectives of the written curriculum.
Why Focus on the Assessed Curriculum?
The assessed curriculum is critical to teachers’ understanding of what knowledge and skills their students have and have not mastered. Numerous educators recommend that mathematics assessments address more than just knowledge of content, but also help teachers evaluate students’ higher-order thinking, reasoning, problem solving, communication, and conceptual understanding of the subject matter (e.g., Borko, Mayfield, Marion, Flexer, & Cumbo, 1997; NCTM, 1989, 1995, 2000). “Assessments that match the current vision of school mathematics involve activities that … provide all students with opportunities to formulate problems, reason mathematically, make connections among mathematical ideas, and communicate about mathematics” (NCTM, 1995, p. 11).
With the advent of the Standards era, many educators and researchers focused on generating and studying the written curriculum because, as noted by Begle (1973), “The textbook has a powerful influence on what students learn. ... The evidence indicates that most student learning is directed by the text rather than the teacher. … the text is a variable that we can manipulate” (p. 209). We believe that the assessments accompanying the textbook also exert a powerful influence on student learning. Just as the textbook helps translate the intended curriculum of standards into the written curriculum that guides instruction (Valverde et al., 2002), the chapter tests included in teacher resources accompanying a textbook help translate for the teacher what the textbook authors or curriculum developers believe is important for students to master, both in terms of what and how.
Although the tests that accompany published curricula do not likely constitute teachers’ entire classroom-based assessment program, we believe they are worthy of analysis because evidence exists that many teachers depend on them as a primary form of assessment. For example, Delandshere and Jones’ (1999) study of elementary teachers’ assessment beliefs and practices found that teachers relied on quizzes, homework assignments, and chapter tests, either those taken directly from the textbook or modeled after them, as their only forms of formal assessment. A study of assessment practices in 200 elementary schools in the Netherlands found that teachers preferred the tests accompanying the curriculum for their value in reporting to parents and supporting teaching and learning (Blok, Otter, & Roeleveld, 2002). Likewise, when

3
Senk, Beckmann, and Thompson (1997) investigated the assessment practices of 19 mathematics teachers in five U. S. high schools in three states, they found that over half of the teachers used the tests provided as part of their curriculum's ancillary materials as their primary assessments. Even those teachers who created their own tests typically consulted the published test accompanying their curriculum materials while writing their own test items. Other studies of classroom assessment practices have documented that teachers rely heavily on the assessments that accompany published curriculum materials (Cooney, 1992; Garet & Mills, 1995; Madaus, West, Harmon, Lomax, & Viator, 1992; Taylor, 1992), and often use them with little or no modification. More recently, Suurtamm, Koch, and Arden (2010) surveyed Canadian mathematics teachers in grades 7-10 and found that they used numerous assessment practices, including tests and quizzes, to provide insight into students’ learning that could inform instruction and help improve student learning.
Communications between the authors of this paper and mathematics curriculum leaders in three large U.S. school districts with over 40,000 students confirmed that nearly all teachers use the chapter tests that accompany their adopted curriculum as a primary means of student assessment, especially at the elementary level. Furthermore, when the authors surveyed 43 teachers, coaches, and mathematics curriculum supervisors in their state, 81% reported using the assessments accompanying their curricula, with 68% justifying their use on the basis of perceived alignment with the textbook curriculum (Hunsader, Thompson, & Zorin, 2012b).
Just as much can be learned about curriculum from a detailed content analysis (National Research Council, 2004), we believe much can be learned about students’ opportunities to demonstrate their thinking by undertaking a detailed analysis of the assessments accompanying published curricula. Similar to the suggestion by Begle (1973) that textbooks are a variable to be manipulated to enhance learning, we believe the nature of tests can be manipulated so that assessments embody the spirit of recommended reforms in mathematics and provide valuable insight into student thinking and reasoning.
Thus, our research was designed to provide a detailed analysis of the publishers’ tests accompanying elementary curricula. In particular, we were interested in how students’ thinking was assessed on test items, rather than what content was assessed. We focused on the mathematical processes students were expected to use when engaging with the content, such as reasoning, explaining one’s thinking, or expressing understandings in various representations. Because some educators involved in evaluating curriculum materials found no criteria for examining assessments accompanying curricula despite calls for more authentic assessment practices (Bernhard, Lernhardt, & Miranda-Decker, 1999), we believed that developing and applying a framework to analyze the nature of the mathematical processes on these tests had potential. Throughout our work we were guided by the following overall research questions:
• To what extent do the tests that accompany published primary grades (grades 3-5) curricula provide students opportunities to engage in the mathematical processes of reasoning and proof, communication, connections, and representations?
• To what extent do opportunities to engage with the mathematical processes of reasoning and proof, communication, connections, and representations vary by grade level or content area (number and operations, algebraic thinking, geometry, measurement, and data analysis/probability)?
In this paper, we share the framework we developed to analyze the assessed curriculum as well as the results from applying the framework to the chapter tests accompanying the elementary curricula from three U.S. publishers.

4
Research Framework
Frameworks Used by Other Researchers Focusing on Assessment Much of the research about assessment addresses issues of alignment. Specifically, Porter
(2002), Porter, Polikoff, Zeidner, and Smithson (2008), Porter and Smithson (2001a, 2001b), and Webb (1997, 1999, 2002, 2007) have developed tools for aligning assessments with standards, particularly a state’s high-stakes assessments with its objectives.1 Their research has shown that the degree of alignment varies from state to state and across content domains and processes. But high-stakes tests are beyond the control of teachers to change, and security issues often limit the detailed analysis of results that might influence future instruction. Hence, we chose to analyze assessments that teachers are able to edit or modify before administering.
Others (Kitchen & Wilson, 2004) conducted a narrow, focused study to determine the alignment of a single fourth-grade test item with one of the NCTM (2000) content standards. They determined that although the item addressed the content, it did not elicit the kind of thinking suggested by the standards’ learning goals, concluding that alignment of assessment items with content learning goals was “necessary but not sufficient to ensure that the task is of high quality” (Kitchen & Wilson, 2004, p. 398). Their study had a limited scope and required looking at actual student work. Hence, their approach did not provide a means for teachers to obtain an overview of the nature of the processes expected of students across the items on an entire test prior to administering the assessment.
Kitchen and Wilson’s (2004) work highlighted the need to evaluate assessment items for more than just content alignment, but they did not attempt to provide a means to accomplish that goal. The objective of our work was to develop and apply a framework to analyze the mathematical processes incorporated in the items on chapter tests in the teacher resources accompanying published elementary curricula. Such a framework would have the potential to be useful to researchers, as well as teachers, to determine strengths and weaknesses in the tests likely used in many classrooms on a regular basis.
Huntley, Engelbrecht, and Harding (2009) developed the mathematics assessment component taxonomy to apply to alternative assessment formats. Their taxonomy incorporates the cognitive level and perceived difficulty of tasks along seven dimensions: technical aspects of manipulation and calculation, disciplinary aspects related to recall, conceptual aspects focused on comprehension, logical components focused on ordering and proofs, modeling involving translating words to symbols, problem solving, and consolidation in which students analyze and synthesize. Because we were interested in analyzing the nature of the assessed curriculum of written tests, without considering classroom instruction or how concepts were introduced in the textbook, cognitive level is difficult to evaluate. For example, an item may involve problem solving if students have not studied an algorithm for the item but be an exercise if they have previously worked similar problems. Likewise, an item may be at a high or low cognitive level depending on previous knowledge and instructional experiences.
Assumptions Underlying Our Framework Development The focus of our research is on mathematical processes, specifically those outlined in the
Principles and Standards for School Mathematics (NCTM, 2000). We assumed that the assessments accompanying the curriculum would align with the content of the assessed unit, and 1 In the U. S., the term high stakes is used to denote tests for which the results impact both students’ promotion to
the next grade level and/or the evaluation of classroom teachers.

5
we acknowledge that it is a relatively straightforward task to check that specific content is assessed because it is explicitly visible. However, determining whether students have an opportunity to engage with mathematical processes on assessment items is more difficult because evidence that the processes are assessed is implicit. Although our thinking about a framework to use as a basis for determining potential engagement with processes evolved over time as discussed later in this paper, several fundamental assumptions undergirded our work:
1. The framework should identify the mathematical processes and proficiencies embodied in assessments that accompany published curricula. That is, the framework would identify the potential for students to engage with mathematical processes based solely on reviewing the written assessed curriculum, without referring to student responses, classroom instruction, or the curriculum of the textbook itself.
2. The framework should be applicable to assessments accompanying a range of curricula from typical publisher-generated curricula to more alternative curricula developed by curriculum projects in response to the Standards.
3. The framework should be applicable across all content strands in elementary school mathematics identified in major policy documents, such as number sense and operations, algebraic thinking, geometry, measurement, and data analysis/probability.
4. The framework should be able to capture nuances among test items with regard to the processes students are expected to employ while answering the items.
5. The framework should build upon existing related research and the indicators for the processes identified in the Principles and Standards for School Mathematics (NCTM, 2000).
These assumptions had immediate implications for the development of our framework. In particular, we determined that problem solving, although an important mathematical process, would not be part of the framework. As previously discussed, whether an item engages students in problem solving depends largely on their prior experiences with similar items, which would imply relating the item to classroom instruction (the implemented curriculum) or to what is present in the textbook (the written curriculum). Because we were interested in analyzing the written assessments, without aligning to instruction or the textbook, problem solving was not feasible to include.
Pilot Study In 2003 the authors and some additional researchers analyzed a set of elementary
assessments. For that work, the group began with the framework developed by Senk et al. (1997) for use with high school tests. As the group began to apply the framework, it became evident that some important characteristics of elementary assessments were missing, and others were not applicable to assessments at the elementary level. The Senk et al. framework was used as a starting point for creating a new framework; modifications were made to the language of existing criteria, and some additions and deletions to the criteria were made.
The coding was applied to the grades 3-5 tests (copyrights 1998 to 2002) from two publishers, for a total of 106 tests and more than 2700 items. Analysis of the coding indicated that students had to explain their thinking on about 5% of the items, had to write about mathematics on about 7%, engage with a context on about 25%, and make a graphic on about 4% of items. Thus, this initial work on analyzing elementary assessments suggested that the typical assessments accompanying published elementary curricula provided limited opportunities

6
for students to engage with the mathematical processes (Hunsader, Platt, Thompson, Kellogg, Pickle, Petkova, & Zorin, 2006).
Our Framework Over the decade of the 2000s, many U.S. states enhanced their curriculum frameworks to
align with recommendations from the Principles and Standards for School Mathematics (NCTM, 2000), and publishers modified their textbooks and ancillary materials (e.g., assessment resources) accordingly. In addition, the Common Core State Standards for Mathematics [CCSSM] (Council of Chief State School Officers, 2010) have led to a new era in mathematics education in the United States with a set of common standards currently adopted by over 45 states and territories.
During this time, the three authors of this paper maintained their interest in studying classroom assessments, and concluded that a review of tests from more currently published curricula might be a worthwhile endeavor. As we began to apply the framework used previously in our pilot work to these new assessments, we observed what appeared to be major differences in the extent to which the assessments accompanying currently published curricula (i.e., copyright 2011) provided opportunities for students to engage with mathematical processes, at least on a cursory level. But it was not clear that the framework used in the pilot work was nuanced enough to capture these opportunities, particularly in strands other than number and operations. Hence, we revisited the criteria in our original framework, and streamlined the framework to focus solely on those criteria relative to mathematical processes that could be determined by a simple reading of the item, without knowledge of the elementary curriculum, instruction, or students’ prerequisite knowledge.
Figure 1 contains the Mathematical Processes Assessment Coding Framework (MPAC) (Hunsader, Thompson, & Zorin, 2012a) we developed to analyze the assessments in this research. Note that the framework addresses the process standards from the Principles and Standards for School Mathematics (NCTM, 2000) except for problem solving, with problem solving omitted for reasons discussed previously.

7
Reasoning and Proof N The item does not direct students to provide or show a justification or argument for why
they gave that response. Y The item directs students to provide or show a justification or argument for why they gave
that response. (‘Check your work’ by itself is not justification.) Opportunity for Mathematical Communication N The item does not direct students to communicate what they are thinking through symbols
(beyond a numeral answer), graphics/pictures, or words. Y The item directs students to communicate what they are thinking through symbols,
graphics/pictures, or words. V The item only directs students to record a vocabulary term or interpret/create a
representation of vocabulary. Connections N The item is not set in a real-world context and does not explicitly interconnect two or more
mathematical concepts (e.g., multiplication and repeated addition, perimeter and area). R The item is set in a real-world context outside of mathematics. I The item is not set in a real-world context, but explicitly interconnects two or more
mathematical concepts (e.g., multiplication and repeated addition, perimeter and area). Representation: Role of Graphics N No graphic (graph, picture, or table) is given or needed. S A graphic is given but no interpretation is needed for the response, and the graphic does not
explicitly illustrate the mathematics inherent in the problem. (superfluous) R A graphic is given and no interpretation is needed for the response, but the graphic
explicitly illustrates the mathematics inherent in the problem. I A graphic is given and must be interpreted to answer the question. M The item directs students to make a graphic or add to an existing graphic. Representation: Translation of Representational Forms (codes are bi-directional as appropriate) N Students are not expected to record a translation between different representational forms
of the problem. SW Students are expected to record a translation from a verbal representation to a symbolic
representation of the problem or vice versa. GS Students are expected to record a translation from a symbolic representation to a graphical
(graphs, tables, or pictures) representation of the problem or vice versa. WG Students are expected to record a translation from a verbal representation to a graphical
representation of the problem or vice versa. TG Students are expected to record a translation from one graphical representation of the
problem to another graphical representation. A Students are expected to record two or more translations among symbolic, verbal, and
graphical representations of the problem.
Fig 1. MPAC Framework (role of graphics and translation of representation from Hunsader, Thompson, & Zorin, 2012a)

8
We highlight here some of the issues we faced in refining the framework and how we resolved them. We needed to be able to distinguish communication from reasoning and proof. While we believe that reasoning and proof requires communication, we also believe it is possible to communicate about mathematics without necessarily engaging in reasoning. As Stylianou, Blanton, & Knuth indicate, proof can be defined as a “logical argument that one makes to justify a claim in mathematics and to convince oneself and others” (2009, p. 12); this seemed an appropriate perspective on reasoning at the elementary level when students explain why they made particular decisions. Hence, to distinguish between communication and reasoning/proof we focused on whether the item only required students to communicate what they were thinking or whether it required reasoning about why they made that response.
In addition, during initial perusing of assessments, we noticed that items often expected students simply to indicate mathematical vocabulary. Because we recognize that language can communicate what one is thinking and the precise use of language falls within the communication standard of the Principles and Standards, we created a code to capture vocabulary expectations. This enabled us to distinguish between communication solely in the form of vocabulary versus more substantive communication about mathematical thinking.
Figure 2 shares items we developed that are clones of those on elementary assessments and that highlight how we distinguished reasoning and proof from communication. These items, in two different content strands (number and operations; geometry), can be used as anchor items for purposes of helping teachers or other researchers use the framework.

9
Reasoning – N Communication – N Students are only asked for a numerical answer, not what they are thinking to obtain that answer, or why that answer is correct.
Reasoning – N Communication – Y The number sentence tells what students are thinking, but there is no sense of why that number sentence works.
Reasoning – Y Communication – Y The number sentence tells what the students are thinking; the picture gives a justification for why that number sentence is correct.
Five friends have 20 pieces of candy to share equally. How many pieces of candy will each friend get?
Five friends have 20 pieces of candy to share equally. Write a number sentence to show how many pieces of candy each friend will get.
Five friends have 20 pieces of candy to share equally. Write a number sentence to show how many pieces of candy each friend will get. Use the picture to show why your number sentence is correct.
Reasoning – N Communication – N Students are asked for a drawing, but without labels, they have not communicated what they are thinking about vocabulary, or why their drawing is correct.
Reasoning – N Communication – V By labeling the angles, students are communicating their knowledge of vocabulary rather than leaving the teacher to make assumptions based on the drawing; however, labels alone do not provide a justification for why those labels were assigned.
Reasoning – Y Communication – V The angle labels communicate what students know about angle sizes; the explanation for why those labels were assigned is a justification.
Draw a polygon that has two acute angles and two obtuse angles.
Draw a polygon that has two acute angles and two obtuse angles. Label the acute and obtuse angles.
Draw a polygon that has two acute angles and two obtuse angles. Label the acute and obtuse angles. Explain why you have given the angles those names.
Fig 2. Sample items to illustrate differences in the coding criteria between the Reasoning/Proof and Communication process standards (reasoning items adapted from Hunsader, Thompson, & Zorin, 2012b)

10
Real-world contexts as mathematical connections are relatively straightforward to identify. However, during our initial review of current assessments, we observed a number of items that were not set in a real-world context but that aimed to help students make connections among concepts. The interconnection of mathematical concepts is clearly included as a subset of the Connections process standard (NCTM, 2000), and we wanted to capture such connections. Hence, we developed the I code found under Connections in the framework (see Figure 1) to identify such connections that were not in a real-world context. Figure 3 illustrates sample items and codes within the Connections criterion.
Connections - N There is no real world context and no explicit interconnection of two or more mathematical concepts.
Connections – R The item is set in a real world context outside of mathematics.
Connections – I The item is not set in a real world context outside of mathematics, but it explicitly interconnects the mathematical concepts of subtraction and division.
20 ÷ 5=___ Sarah has 20 marbles to put equally into 5 containers. How many marbles will she put into each container?
20 − 5 = 15 15 − 5 = 10 10 − 5 = 5 5 − 5 = 0
Write a division sentence to match the repeated subtraction above.
Connections - N There is no real world context and no explicit interconnection of two or more mathematical concepts.
Connections – R The item is set in a real world context outside of mathematics.
Connections – I The item is not set in a real world context outside of mathematics, but it explicitly interconnects the mathematical concepts of perimeter and area.
Find the area and perimeter of a rectangle that is 5 feet wide and 7 feet long.
Billy’s dad wanted to build him a sandbox that is 5 feet wide and 7 feet long. Find the area in which he can play and the number of feet of wood his dad needs to build a border for the sandbox.
A rectangle has a perimeter of 24 feet. What are the dimensions of the rectangle with the largest area?
Fig 3. Sample items to illustrate the coding criterion for the Connections process standard
For the process standard of representation, we developed two criteria, one focusing on the role of graphics and the other on the translation of the essence of a problem from one form to another. Numerous researchers have commented on the importance of representation as a means for students to express their mathematical thinking (Diezmann & McCosker, 2011; Heritage &
11
Niemi, 2007; Lowrie, Diezmann, & Logan, 2011). Indeed, graphicacy is increasingly important in curriculum, and hence in assessment. Our framework attempts to distinguish different uses of graphics as recommended by Berends and van Lieshout (2009) and to identify graphics that are superfluous and mainly used as decoration (Shuard & Rothery, 1984). Further, the ability to translate representations and map one mathematical representation onto another is related to students’ acquisition of mathematical concepts (Bossé, Adu-Gyamfi, & Cheetham, 2011; Gagatsis & Shiakalli, 2004; Janvier, 1987; Lesh, Post, & Behr, 1987). Therefore, our framework includes a separate criterion to distinguish among various forms of translation.
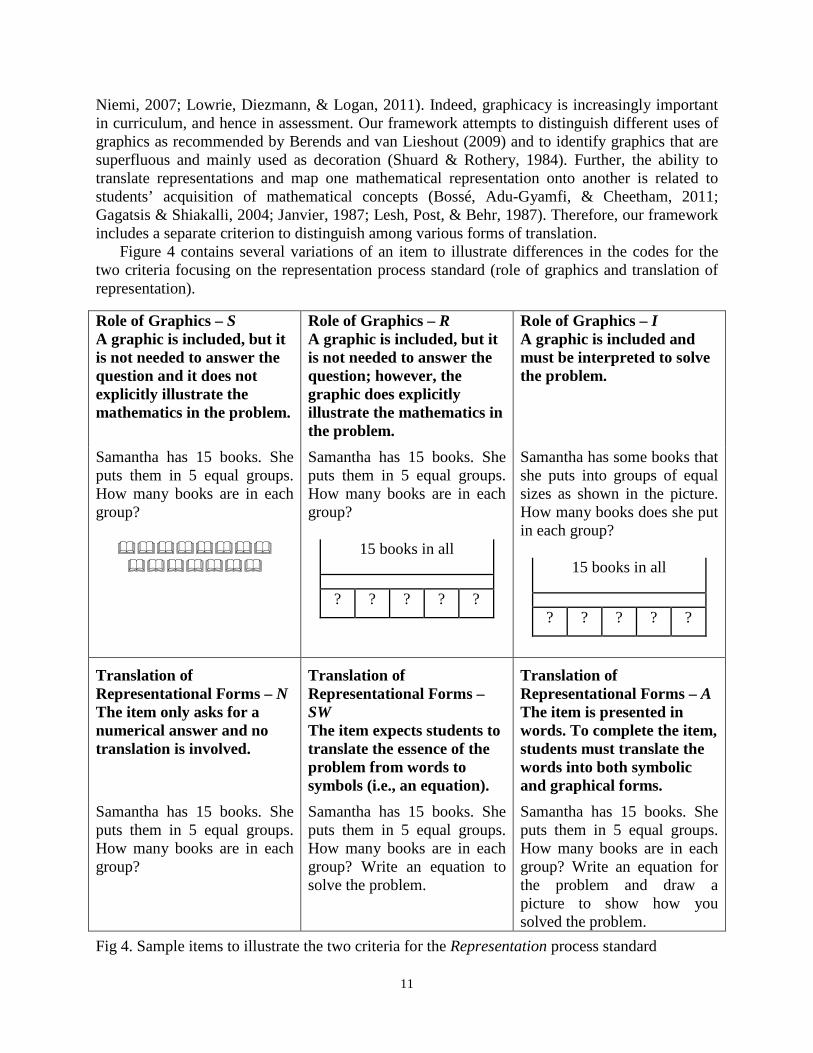
Figure 4 contains several variations of an item to illustrate differences in the codes for the two criteria focusing on the representation process standard (role of graphics and translation of representation).
Role of Graphics – S A graphic is included, but it is not needed to answer the question and it does not explicitly illustrate the mathematics in the problem.
Role of Graphics – R A graphic is included, but it is not needed to answer the question; however, the graphic does explicitly illustrate the mathematics in the problem.
Role of Graphics – I A graphic is included and must be interpreted to solve the problem.
Samantha has 15 books. She puts them in 5 equal groups. How many books are in each group?
Samantha has 15 books. She puts them in 5 equal groups. How many books are in each group?
15 books in all
? ? ? ? ?
Samantha has some books that she puts into groups of equal sizes as shown in the picture. How many books does she put in each group?
15 books in all
? ? ? ? ?
Translation of Representational Forms – N The item only asks for a numerical answer and no translation is involved.
Translation of Representational Forms – SW The item expects students to translate the essence of the problem from words to symbols (i.e., an equation).
Translation of Representational Forms – A The item is presented in words. To complete the item, students must translate the words into both symbolic and graphical forms.
Samantha has 15 books. She puts them in 5 equal groups. How many books are in each group?
Samantha has 15 books. She puts them in 5 equal groups. How many books are in each group? Write an equation to solve the problem.
Samantha has 15 books. She puts them in 5 equal groups. How many books are in each group? Write an equation for the problem and draw a picture to show how you solved the problem.
Fig 4. Sample items to illustrate the two criteria for the Representation process standard
12
Methods
Sample In the United States, three main textbook publishing companies provide the majority of
textbooks for use in schools (Dossey, Halvorson, & McCrone, 2008, 2012). Hence, we focused on the grades 3-5 published curricula that had been adopted in our state and were likely to be widely used throughout the country: Go Math! (GM) from Houghton Mifflin Harcourt (Adams, Dixon, Larson, McLeod, & Leiva, 2011); Math Connects (MC) from Macmillan/McGraw-Hill (Altieri et al, 2011); and enVisionMATH (EV) from Scott Foresman-Addison Wesley (Charles et al., 2011).
For each textbook series, we obtained the unit/chapter tests found in the ancillaries accompanying the teacher materials. All three publishers included multiple forms of chapter tests, including both multiple-choice and constructed-response formats. Because we were interested in opportunities that assessments provided for students to engage with the process standards, we only considered assessments formatted for constructed responses so that students had an opportunity to provide more than a selected choice; when multiple test forms existed, we chose the first free-response form for each unit/chapter.
Table 1 reports the number of tests and items for each of the three publishers by grade level.
Table 1. Number of Tests and Items by Grade for Each of Three Elementary Textbook Series Grade 3 Grade 4 Grade 5 Overall Publisher No.
Tests No.
Items No.
Tests No.
Items No.
Tests No.
Items No.
Tests No.
Items enVisionMATH (EV) 16 216 16 330 16 349 48 895
Go Math! (GM) 12 180 13 195 11 173 36 548
Math Connects (MC) 12 186 11 195 12 225 35 606
TOTAL 119 2049
Procedures
After discussing the framework and the anchor items (see Figures 2-4), we coded two tests from each of the three publishers, randomly selecting tests to ensure representation from each grade and content strand. Any discrepancies were discussed and resolved through consensus among the three authors. Some researchers claim that the use of consensus is more accurate than independent coding (Macgillivray & Jennings, 2008) and is particularly appropriate in analyses of textbooks (e.g., Charalambous, Delaney, Hsu, & Mesa, 2010; Ding & Li, 2010; Roseman, Stern, & Koppal, 2010). The first two authors then coded all tests independently; the third author reviewed discrepancies which were resolved through consensus.2
Codes for all items on each test were recorded in an Excel spreadsheet for purposes of analysis. As each test was coded, we also recorded the grade level and the content domain
2 Even though we resolved discrepancies through consensus, a single percent agreement between the ratings of the
first two authors resulted in agreement of better than 92% for each of the criteria.

13
(number and operations, geometry, measurement, algebraic thinking, statistics and probability) that was the focus of the test so we could look for trends across content and grade level.
Results
It is neither feasible nor practical for all test items to engage students in all mathematical processes. Given that tests are usually administered in their entirety and that we were interested in the extent to which tests provide opportunities for students to engage with the mathematical processes, we used the test, rather than the item, as the unit of analysis in all discussion of the results. The data were analyzed using primarily simple descriptive statistical measures.
Opportunities to Engage with the Process Standards To gain a sense of the extent to which the processes were evident on tests across the entire
sample, Table 2 reports descriptive statistics for the five criteria indicated in the framework (see Figure 1). Given the variation in the processes across tests, we also use box-and-whisker plots to highlight the variability for each of the criteria (see Figure 5).
Table 2. Minimum, Maximum, and Mean (Standard Deviation) Percent of Items Per Test Providing Opportunities for Students to Engage with the Mathematical Processes: Overall Sample
Framework Criteria Minimum Maximum Mean (s.d.)
Reasoning (Y) 0 23.1 2.9 (4.4)
Communication (Y and V) 0 100 27.6 (25.6)
Connections (R and I) 0 100 53.0 (32.3)
Role of Graphics (R, M, and I) 0 100 37.7 (30.3)
Translation of Representation (SW, GS, WG, TG, A) 0 66.7 15.8 (17.5)
Note: Percents are based on n = 119 tests, with results based on using the percent of the items on each test as the data points.

14
______________________________
Fig 5. Box plots illustrating the minimum, quartiles, and maximum percent of items per test providing opportunities for students to engage with the framework criteria for the overall sample (Criteria included for each process are identical to those indicated in Table 2.)
Table 2 and Figure 5 suggest substantial differences in the extent to which specific processes are evident on chapter tests. The shaded regions in the box plots indicate the range of the second and third quartiles. The median percent of items per test that engage students in each process, as marked by the horizontal bar within each shaded region on the box plot, illustrates that the typical proportion of items involving each process varies widely. Further, the large standard deviations for all framework criteria other than reasoning indicate that students have widely different opportunities to engage with the processes across different tests. This is further illustrated by the vertical ‘whiskers’ on the box plot, with a range of 100% of items per test for three of the criteria (communication, connections, role of graphics) and 67% for one of the criteria (translation of representation).
Despite the fact that reasoning is a crucial component of mathematics, this process is rarely included on chapter tests, with a median at 0% of items per test, and a mean only slightly higher (roughly 3% of items per test). Expecting students to translate a problem from one representational form to another is the second least likely framework criteria to be present on tests, with a median of 9% of items per test and a mean of roughly 16% of items per test.
In contrast, connections is relatively common, with a median of 44% of the items per test and a mean of 53% of the items per test. This process is relatively easy to integrate into assessment. Simply by placing an item in a real-world context, even if that context is somewhat contrived, brings this process to the fore. Graphics are also quite evident on items; half of the tests had
100
90
80
70
60
50
40
30
20
10
10
translation ofrepresentation
role of graphicsconnectionscommunicationreasoning

15
more than 27% of the items for which students were expected to interpret or make a graphic, or possibly reference a graphic that illustrates the problem. On half of the tests, between 6 and 38% of the items required students to explain what they were thinking or to indicate understanding of vocabulary (process of communication).
Opportunities to Engage with the Process Standards by Publisher, Grade, and Content Domain
Given the variation in the extent to which chapter tests provide opportunities for students to engage with the process standards for the entire sample, we were interested in the extent to which the various criteria for each standard varied across grades, publishers, and content domains (number and operations, geometry, measurement, algebra, and data analysis).
Figure 6 illustrates how opportunities to engage with reasoning vary across grades, publishers, and content domains. As evident in the figure, reasoning is much more prominent in the tests that accompany enVisionMATH (mean between 4% and 7% of items on the test) than in the tests accompanying the textbooks from the other two publishers. For enVisionMATH, reasoning occurs most frequently on the tests dealing with algebra, measurement, and geometry, with a mean of roughly 7% of the items on the tests in these domains integrating reasoning into the item.
______________________________
Fig 6. Mean percent of items per test providing opportunities to engage with Reasoning by grade, publisher, and content domain
0%
10%
20%
30%
40%
50%
60%
70%
80%
90%
100%
G
rade
3
Gra
de 4
Gra
de 5
Gra
de 3
Gra
de 4
Gra
de 5
Gra
de 3
Gra
de 4
Gra
de 5
EV GM MC
Reasoning: Publisher by Grade
0%
10%
20%
30%
40%
50%
60%
70%
80%
90%
100%
Num
ber
Alg
ebra
Geo
met
ry
Mea
sure
Dat
a
Num
ber
Alg
ebra
Geo
met
ry
Mea
sure
Dat
a
Num
ber
Alg
ebra
Geo
met
ry
Mea
sure
Dat
a
EV GM MC
Reasoning: Publisher by Content
16
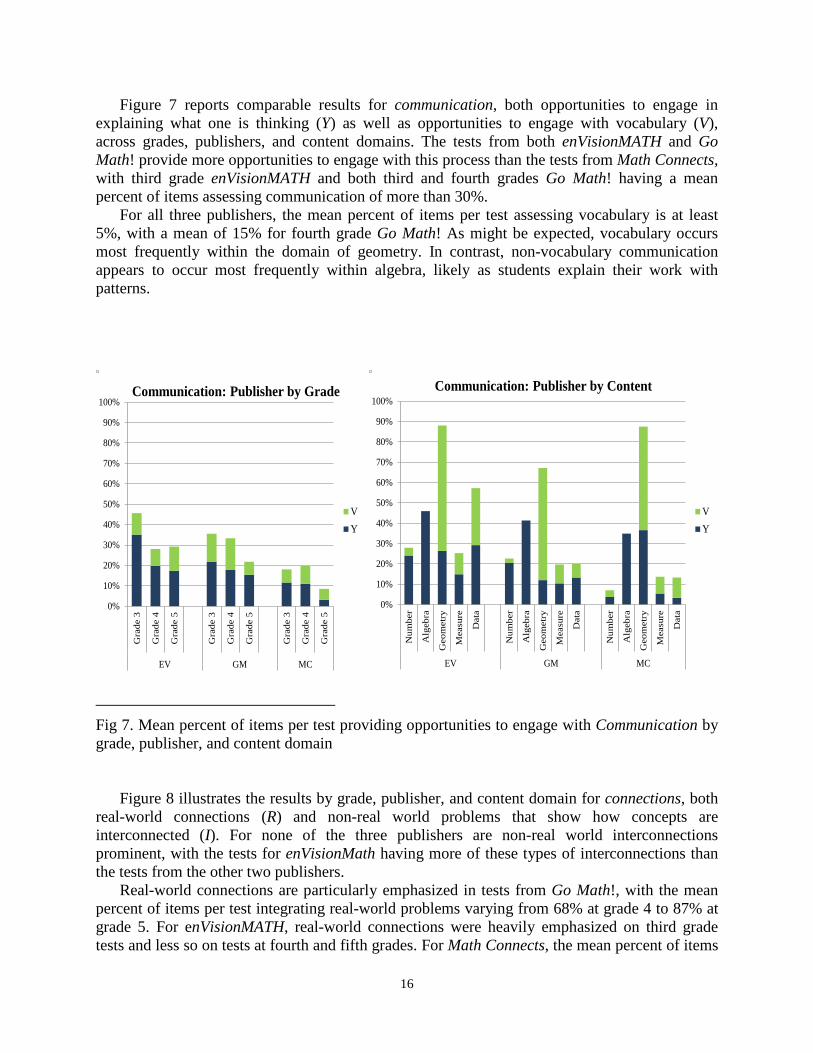
Figure 7 reports comparable results for communication, both opportunities to engage in explaining what one is thinking (Y) as well as opportunities to engage with vocabulary (V), across grades, publishers, and content domains. The tests from both enVisionMATH and Go Math! provide more opportunities to engage with this process than the tests from Math Connects, with third grade enVisionMATH and both third and fourth grades Go Math! having a mean percent of items assessing communication of more than 30%.
For all three publishers, the mean percent of items per test assessing vocabulary is at least 5%, with a mean of 15% for fourth grade Go Math! As might be expected, vocabulary occurs most frequently within the domain of geometry. In contrast, non-vocabulary communication appears to occur most frequently within algebra, likely as students explain their work with patterns.
______________________________
Fig 7. Mean percent of items per test providing opportunities to engage with Communication by grade, publisher, and content domain
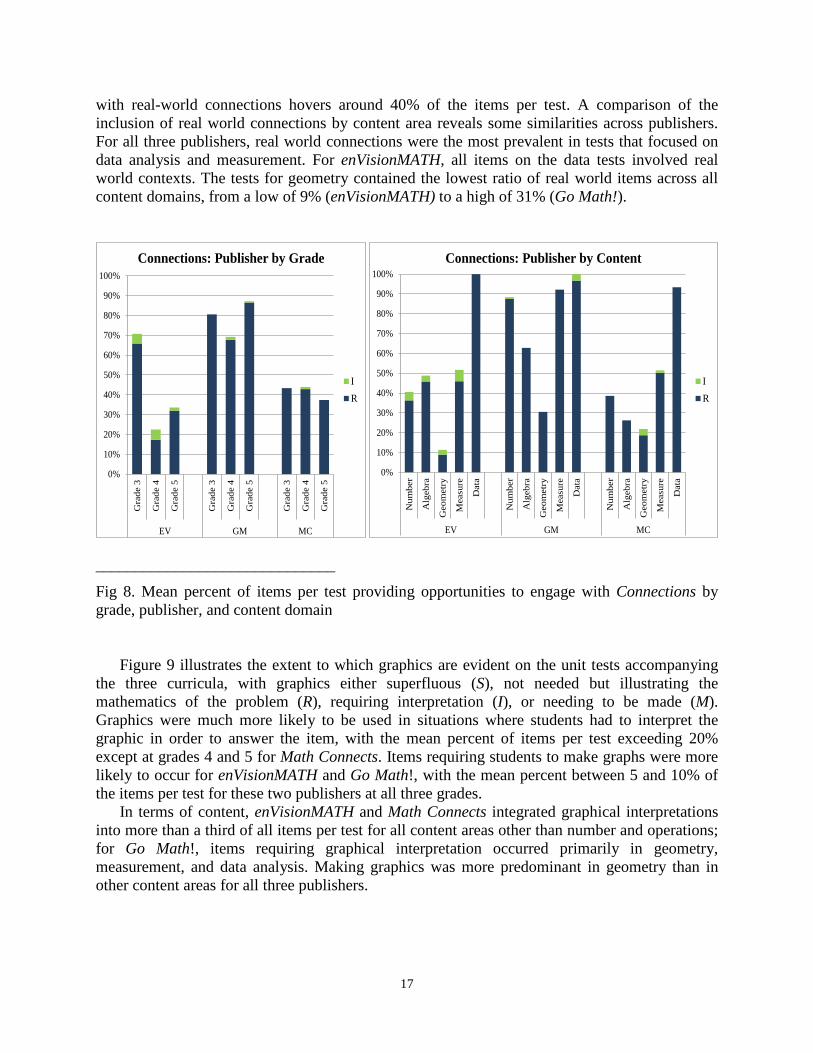
Figure 8 illustrates the results by grade, publisher, and content domain for connections, both
real-world connections (R) and non-real world problems that show how concepts are interconnected (I). For none of the three publishers are non-real world interconnections prominent, with the tests for enVisionMath having more of these types of interconnections than the tests from the other two publishers.
Real-world connections are particularly emphasized in tests from Go Math!, with the mean percent of items per test integrating real-world problems varying from 68% at grade 4 to 87% at grade 5. For enVisionMATH, real-world connections were heavily emphasized on third grade tests and less so on tests at fourth and fifth grades. For Math Connects, the mean percent of items
0%
10%
20%
30%
40%
50%
60%
70%
80%
90%
100%
G
rade
3
Gra
de 4
Gra
de 5
Gra
de 3
Gra
de 4
Gra
de 5
Gra
de 3
Gra
de 4
Gra
de 5
EV GM MC
Communication: Publisher by Grade
VY
0%
10%
20%
30%
40%
50%
60%
70%
80%
90%
100%N
umbe
r
Alg
ebra
Geo
met
ry
Mea
sure
Dat
a
Num
ber
Alg
ebra
Geo
met
ry
Mea
sure
Dat
a
Num
ber
Alg
ebra
Geo
met
ry
Mea
sure
Dat
aEV GM MC
Communication: Publisher by Content
VY
17
with real-world connections hovers around 40% of the items per test. A comparison of the inclusion of real world connections by content area reveals some similarities across publishers. For all three publishers, real world connections were the most prevalent in tests that focused on data analysis and measurement. For enVisionMATH, all items on the data tests involved real world contexts. The tests for geometry contained the lowest ratio of real world items across all content domains, from a low of 9% (enVisionMATH) to a high of 31% (Go Math!).
______________________________
Fig 8. Mean percent of items per test providing opportunities to engage with Connections by grade, publisher, and content domain
Figure 9 illustrates the extent to which graphics are evident on the unit tests accompanying the three curricula, with graphics either superfluous (S), not needed but illustrating the mathematics of the problem (R), requiring interpretation (I), or needing to be made (M). Graphics were much more likely to be used in situations where students had to interpret the graphic in order to answer the item, with the mean percent of items per test exceeding 20% except at grades 4 and 5 for Math Connects. Items requiring students to make graphs were more likely to occur for enVisionMATH and Go Math!, with the mean percent between 5 and 10% of the items per test for these two publishers at all three grades.
In terms of content, enVisionMATH and Math Connects integrated graphical interpretations into more than a third of all items per test for all content areas other than number and operations; for Go Math!, items requiring graphical interpretation occurred primarily in geometry, measurement, and data analysis. Making graphics was more predominant in geometry than in other content areas for all three publishers.
0%
10%
20%
30%
40%
50%
60%
70%
80%
90%
100%
Num
ber
Alg
ebra
Geo
met
ry
Mea
sure
Dat
a
Num
ber
Alg
ebra
Geo
met
ry
Mea
sure
Dat
a
Num
ber
Alg
ebra
Geo
met
ry
Mea
sure
Dat
a
EV GM MC
Connections: Publisher by Content
IR
0%
10%
20%
30%
40%
50%
60%
70%
80%
90%
100%
G
rade
3
Gra
de 4
Gra
de 5
Gra
de 3
Gra
de 4
Gra
de 5
Gra
de 3
Gra
de 4
Gra
de 5
EV GM MC
Connections: Publisher by Grade
IR

18
______________________________
Fig 9. Mean percent of items per test providing opportunities to engage with Role of Graphics by grade, publisher, and content domain
Figure 10 illustrates the extent to which the test items expect students to translate from one representational form to another, between symbols and words (SW), between symbols and graphics (SG), between graphics and words (GW), or between two or more representational forms (TG and A). The mean percent of items per test for translation among representational forms was at least 20% for three grades: grade 3 enVisionMATH and grades 3 and 4 for Go Math!. Very little translation was expected for the tests in grade 5 of Math Connects.
For all three publishers, translation between words and graphics was more prevalent in tests for geometry than in other content areas. In contrast, for algebra envisionMATH was more likely to involve translation between graphics and symbols, Go Math! between symbols and words, and Math Connects between symbols and either words or graphics. Very little translation was included for tests assessing measurement or data analysis.
0%
10%
20%
30%
40%
50%
60%
70%
80%
90%
100% G
rade
3
Gra
de 4
Gra
de 5
Gra
de 3
Gra
de 4
Gra
de 5
Gra
de 3
Gra
de 4
Gra
de 5
EV GM MC
Graphics: Publisher by Grade
SRMI
0%
10%
20%
30%
40%
50%
60%
70%
80%
90%
100%
Num
ber
Alg
ebra
Geo
met
ry
Mea
sure
Dat
a
Num
ber
Alg
ebra
Geo
met
ry
Mea
sure
Dat
a
Num
ber
Alg
ebra
Geo
met
ry
Mea
sure
Dat
a
EV GM MC
Graphics: Publisher by Content
SRMI

19
______________________________
Fig 10. Mean percent of items per test providing opportunities to engage with Translation of Representation by grade, publisher, and content domain
Situating this Work within a Broader Context
In this paper, we described and then applied a framework to analyze the mathematical processes embedded in assessments accompanying published elementary mathematics curricula. Although researchers have focused on the alignment of high-stakes assessments and standards (e.g., Porter, 2002; Porter, et al., 2008; Porter & Smithson, 2001a, 2001b; Webb, 1997, 1999, 2002, 2007; Webb, Herman, & Webb, 2007), less research seems to be available about the assessments that accompany the curriculum implemented in the classroom. If textbooks are one means for teachers to interpret the intent of standards (Valverde et al., 2002), then we believe the assessments accompanying the published curricula are one means by which curriculum developers indicate to teachers both what is important for students to master (i.e., the content) and how they should master it (i.e., the mathematical processes).
The literature suggests the need for a set of criteria to thoroughly evaluate publishers’ assessments (Bernhard et al., 1999). Our framework is one means to provide a reliable and objective look at the extent to which an assessment reflects important mathematical processes, whether the assessment is provided by the curriculum publisher or is generated by the teacher.
Discussion about standards typically seems to focus on content, particularly issues surrounding depth rather than breadth of understanding. Mathematical processes as reflected by the NCTM process standards, and mathematical practices as noted in the Common Core State Standards for Mathematics (CCSSM), are often discussed only within the context of instruction. Although we believe it is appropriate to discuss mathematical processes in relation to instruction, it seems crucial to also discuss them within the context of assessment.
Teachers generally have no control over the high-stakes assessments that their students are required to take. However, they typically have a fair amount of control over the end-of-chapter
0%
10%
20%
30%
40%
50%
60%
70%
80%
90%
100% G
rade
3
Gra
de 4
Gra
de 5
Gra
de 3
Gra
de 4
Gra
de 5
Gra
de 3
Gra
de 4
Gra
de 5
EV GM MC
Translation: Publisher by Grade
TG & AWGGSSW
0%
10%
20%
30%
40%
50%
60%
70%
80%
90%
100%
Num
ber
Alg
ebra
Geo
met
ryM
easu
reD
ata
Num
ber
Alg
ebra
Geo
met
ryM
easu
reD
ata
Num
ber
Alg
ebra
Geo
met
ryM
easu
reD
ata
EV GM MC
Translation: Publisher by Content
TG & AWGGSSW

20
assessments they administer to evaluate their students and drive instructional decisions. Generally, there is a strong connection between identified content standards and the content addressed in the textbook chapters, but the link between the processes identified as important to mathematical learning and the processes that are actually embedded in the assessments is not as clear.
Summary, Limitations, Implications, and Future Direction
Summary of Results
As our results show, mathematical processes other than connections are not heavily emphasized in the tests accompanying the published curricula from these three major publishers. Furthermore, there is enormous variability across tests, grades, publishers, and content domains. On some tests, students had many opportunities to engage with the processes; on others, they had few opportunities. Our framework was not applied as a means to make value judgments, but to provide an objective, reliable, and practical means of gathering information about the assessed curriculum as represented by the assessments accompanying the published curriculum. If applying the framework to the analysis of a test indicates a focus on the mathematical processes that does not align with a teacher’s beliefs or intended instructional emphasis, then modifications can be made to the assessment before it is administered. With the information provided through application of the framework, teachers can also make informed decisions about the role of a test in their overall assessment plan. Some processes, such as reasoning or mathematical communication, may not be best assessed through a chapter test. However, if teachers believe these processes are important, and analysis with the framework indicates that they are not present in the assessed curricula of classroom tests, then teachers can use that information to find other avenues for assessing students’ proficiency with these processes.
Implications for Curriculum Developers and Leaders Assessments often receive less attention than the development of the curriculum itself and
are sometimes not written by the authors of the text (S. Rasmussen, personal communication, 2008; Stiggins, 1992). Therefore, users of the curriculum bear the responsibility for analyzing the accompanying assessments carefully rather than assuming that curriculum assessments emphasize what is perceived as important based on the text lessons or the users’ own values. Our framework, or an alternative framework developed and validated locally, can help ensure that such analysis is done as objectively as possible.
When curricular decisions are made, the curriculum itself is often carefully analyzed to determine whether it meets the standards that a district or state has established. However, our research suggests that additional attention should be directed toward the assessments accompanying those materials. If, as prior research indicates (Cooney, 1992; Madaus et al., 1992; Senk et al., 1997; Taylor, 1992), teachers use curriculum-provided assessments as their primary means of formal assessment, and those assessments fail to reflect the processes important to the learning of mathematics, students may not learn to value what educators consider important. By taking an objective look at such assessments, teachers and curriculum specialists can determine both the strengths and weaknesses of assessments and make necessary adjustments.
Nevertheless, our analysis suggests that curriculum developers should, perhaps, focus more attention on the assessments accompanying their materials to ensure that assessments align with the materials themselves and that assessments reinforce the message in the textbook. If

21
developers design materials to integrate the processes but include assessments that do not, then teachers and students receive a mixed message. If time becomes limited, then teachers may feel that focusing on processes can be minimized or omitted. If students rarely engage in mathematical processes through the assessments used to calculate their grade, they may learn to devalue those processes and develop a narrow view of what it means to be mathematically competent. We suspect that the textbooks from which we analyzed the assessments actually do provide opportunities for students to engage with the mathematical processes, or they would not have been adopted for use. If our suspicions are correct, then there is an alignment problem between instruction as outlined in the textbook and assessment.
Curriculum developers, researchers, and teachers might also engage in a discussion about the appropriate venues for assessing students’ ability to demonstrate their fluency with mathematical processes. It may be that tests which are often given in timed, on-demand formats are not the place for assessing students’ ability to use some of the processes. Rather, some processes might be better assessed through projects over an extended period of time. Our point is that if such processes are never assessed, then students, and possibly teachers, may believe they are less important. Objective analyses of tests, as we have done here, provide educators a means to consider where assessment changes might be needed.
Limitations Our work started with the adaptation of an existing framework (Senk, Beckmann, &
Thompson, 1997). Had we started with the process standards, or possibly the mathematical practices of the CCSSM, the framework might have been somewhat different. Although the developed framework is able to detect differences and nuances among items embedded within assessments (e.g., role of graphics), the framework nevertheless reflects what processes we believed were important to utilize. Different researchers might choose to focus on different indicators.
Furthermore, our results are based solely on analyzing the assessed curriculum as reflected in chapter tests accompanying the published curriculum, without considering the written curriculum of the textbook or classroom instruction. It may be that students have many opportunities to engage with the processes as part of regular exercises provided within the textbook or as part of the work with which students engage during classroom instruction. Indeed, teachers may provide many opportunities for students to work collaboratively with others or to communicate about mathematics, for example. However, our work suggests that, even if such opportunities exist, they may not be reflected on assessments, particularly if teachers use the assessments that accompany their curriculum materials.
Additionally, our work was conducted in the context of the U.S. educational system. Although we believe issues related to assessing the process standards are applicable across countries, we make no claims that the results for other countries would mirror those in the U.S. Direction for Future Research
Given the interest in curriculum and curriculum effectiveness that has been stirred by publications in the United States, such as On Evaluating Curricular Effectiveness (NRC, 2004) and the No Child Left Behind legislation with its mandate for curricula that demonstrate effectiveness, it is surprising that so little research related to classroom assessments has been published. Our framework fills a needed gap in the curriculum-instruction-assessment cycle and suggests that more analysis of assessment at the actual classroom level is needed to ensure that students have the necessary experiences to advance their mathematical learning.
22
The work in this study represents one aspect of classroom assessment analysis, both with formative and formal assessments. Implications for future research might include the application of this developed framework to other published curricula, as well as to assessments that accompany other grade-band curricula, including those from middle and high school. We suspect that adjustments to the criteria descriptors for the analysis at different grade bands may be necessary. Further, because this study focused primarily on constructed-response test forms, additional focus might include the application of this framework for analysis of assessments in multiple-choice formats.
Because the framework was developed for use with curricula from the United States, it would be interesting to apply the framework to curricula from other countries. The mathematical processes incorporated into our framework are processes that are fundamental to mathematics. Perhaps, however, there are additional processes that would be particularly salient for analysis in other countries. A broader discussion among researchers about the ease of use of such a framework across curricula with potentially different objectives would be beneficial.
References
Adams, T. L., Dixon, J. K., Larson, M., McLeod, J. C., & Leiva, M. A. (2011). Houghton Mifflin Harcourt Go Math! Florida. Grades 3-5. Orlando, FL: Houghton Mifflin Harcourt.
Altieri, M. B., Balka, D. S., Gonsalves, P. D., Grace, E. C., Prulik, S., Molix-Bailey, R. J., Mosely, L. G., Mowry, B., Myren, C. L., Price, J., Reynosa, M. E., Santa Cruz, R. M., Silbey, R., & Vielhaber, K. (2011). Math Connects: Grades 3, 4, 5. Columbus, OH: MacMillan/McGraw-Hill.
Begle, E. G. (1973). Some lessons learned by SMSG. Mathematics Teacher, 66, 207-214. Berends, I. E., & van Lieshout, E. C. (2009). The effect of illustrations in arithmetic problem-
solving: Effects of increased cognitive load. Learning and Instruction, 19(4), 345-353. Bernhard, J., Lernhardt, M. M., & Miranda-Decker, R. (1999). Evaluating instructional
materials. Mathematics Teaching in the Middle School, 5(3), 174-178. Blok, H., Otter, M. E., & Roeleveld, J. (2002). Coping with conflicting demands: Student
assessment in Dutch primary schools. Studies in Educational Evaluation, 28, 177-188. Borko, H., Mayfield, V., Marion, S., Flexer, R., & Cumbo, K. (1997). Teachers’ developing
ideas and practices about mathematics performance assessment: Successes, stumbling blocks, and implications for professional development. Teaching and Teacher Education, 13(3), 259-278.
Bossé, M. J., Adu-Gyamfi, K., & Cheetham, M. (June 15, 2011). Translations among representations: Teacher beliefs and practices. International Journal for Mathematics
Charalambous, C. Y., Delaney, S., Hsu, H.-Y., & Mesa, V. (2010). A comparative analysis of the addition and subtraction of fractions in textbooks from three countries. Mathematical Thinking and Learning, 12, 117-151.
Charles, R. I., Caldwell, J. H., Cavanagh, M., Chancellor, D., Copley, J. V., Crown, W. D., Fennell, F., Ramirez, A. B., Sammons, K. B., Shielack, J. F., Tate, W., & Van de Walle, J. A. (2011). Scott Foresman-Addison Wesley enVisionMATH Florida. Grades 3-5. Glenview, IL: Pearson Education, Inc.
Cooney, T. (1992). A survey of secondary teachers’ evaluation practices in the State of Georgia. Unpublished manuscript, College of Education, University of Georgia, Athens.
Council of Chief State School Officers. (2010). Common core state standards for mathematics.
Teaching and Learning, 1-23. (http://www.cimt.org.uk/journal/index.htm)
23
Washington, D.C.: Author. (http://www.corestandards.org/) Delandshere, G., & Jones, J. (1999). Elementary teachers’ beliefs about assessment in
mathematics: A case of assessment paralysis. Journal of Curriculum and Supervision, 14, 216-240.
Diezmann, C. M., & McCosker, N. T. (2011). Reading students’ representations. Teaching Children Mathematics, 18(3), 162-169.
Ding, M., & Li, X. (2010). A comparative analysis of the distributive property in U.S. and Chinese elementary mathematics textbooks. Cognition and Instruction, 28, 146-180.
Dossey, J., Halvorsen, K., & McCrone, S. (2008). Mathematics education in the United States 2008: A capsule summary fact book written for the Eleventh International Congress on Mathematical Education (ICME-11). Reston, VA: National Council of Teachers of Mathematics.
Dossey, J. A., Halvorsen, K. T., & McCrone, S. S. (2012). Mathematics education in the United States 2012: A capsule summary fact book written for the Twelfth International Congress on Mathematical Education. Reston, VA: National Council of Teachers of Mathematics.
Gagatsis, A., & Shiakalli, M. (2004). Ability to translate from one representation of the concept of function to another and mathematical problem solving. Educational Psychology: An International Journal of Experimental Educational Psychology, 24(5), 645-657.
Garet, M. S., & Mills, V. L. (1995). Changes in teaching practices: The effects of the Curriculum and Evaluation Standards. Mathematics Teacher, 88, 380-389.
Heritage, M., & Niemi, D. (2007). Toward a framework for using student mathematical representations as formative assessment. Educational Assessment, 11(3-4), 265-282.
Hunsader, P. D., Platt, M., Thompson, D. R., Kellogg, M., Pickle, M., Petkova, M., & Zorin, B. (2006, April). Extent to which the NCTM process standards are reflected in mathematics publishers’ assessments. Paper delivered at the American Educational Research Association Annual Meeting, San Francisco, CA.
Hunsader, P. D., Thompson, D. R., & Zorin, B. (2012a, July). The extent to which primary assessments in the U. S. engage students in representation. Paper presented in Topic Study Group 33 on Assessment at the Twelfth International Congress on Mathematical Education, Seoul, Korea.
Hunsader, P. D., Thompson, D. R., & Zorin, B. (2012b). Unit tests that accompany published curricula: How well do they inform future instruction? Dimensions in Mathematics, 32(2), 6-11.
Huntley, B., Engelbrecht, J., & Harding, A. (November 2009). An assessment component taxonomy for alternative mathematics assessment formats. Proceedings of Southern Right Delta ’09. Conference on the Teaching and Learning of Undergraduate Mathematics and Statistics. Gordons Bay. (as cited in Huntley, B. (July 2012). What is a “good” mathematics test item? Paper presented at the Twelfth International Congress on Mathematical Education, Topic Study Group 33, Seoul, Korea.)
Janvier, C. (1987). Translation processes in mathematics education. In C. Janvier (Ed.), Problems of representation in the teaching and learning of mathematics (pp. 27-32). Hillsdale, NJ: Lawrence Erlbaum.
Kilpatrick, J., Swafford, J., & Findell, B. (Eds.). (2001). Adding it up: Helping children learn mathematics. Washington, D.C.: National Academies Press.
Kitchen, R. S., & Wilson, L. D. (2004). Lessons learned from students about assessment and instruction. Teaching Children Mathematics, 10, 394-399.
24
Landis, J. R., & Koch, G. C. (1977). The measurement of observer agreement for categorical data. Biometrics, 33, 159-174.
Lesh, R., Post, T., & Behr, M. (1987). Representation and translations among representations in mathematics learning and problem solving. In C. Janvier (Ed.), Problems of representation in the teaching and learning of mathematics (pp. 33-40). Hillsdale, NJ: Lawrence Erlbaum.
Lin, P. (2006). Conceptualizing teachers’ understanding of students’ mathematical learning by using assessment tasks. International Journal of Science and Mathematics Education, 4(3), 545-580.
Lowrie, T., Diezmann, C. M., & Logan, T. (September 21, 2011). Understanding graphicacy: Students’ making sense of graphics in mathematics assessment tasks. International Journal for Mathematics Teaching and Learning, 1-21. (http://www.cimt.org.uk/journal/index.htm)
Ma, L. (1999). Knowing and teaching elementary mathematics. Mahwah, NJ: Lawrence Erlbaum.
Macgillivray, I. K., & Jennings, T. (2008). A content analysis exploring lesbian, gay, bisexual, and transgender topics in foundations of education textbooks. Journal of Teacher Education, 59, 170-188.
Madaus, G. F., West, M. M., Harmon, M. C., Lomax. R. G., & Viator, K. A. (1992). The influence of testing on teaching math and science in grades 4-12, Executive summary. Chestnut Hill, MA: Boston College, Center for the Study of Testing, Evaluation, and Educational Policy.
National Council of Teachers of Mathematics. (1989). Curriculum and evaluation standards for school mathematics. Reston, VA: Author.
National Council of Teachers of Mathematics. (1995). Assessment standards for school mathematics. Reston, VA: Author.
National Council of Teachers of Mathematics. (2000). Principles and standards for school mathematics. Reston, VA: Author.
National Council of Teachers of Mathematics. (2006). Curriculum focal points for prekindergarten through grade 8 mathematics: A quest for coherence. Reston, VA: Author.
National Research Council. (1989). Everybody counts: A report to the nation on the future of mathematics education. Washington, D.C.: National Academies Press.
National Research Council. (2004). On evaluating curricular effectiveness: Judging the quality of K-12 mathematics evaluations. Committee for a Review of the Evaluation Data on the Effectiveness of NSF-Supported and Commercially Generated Mathematics Curriculum Materials. Mathematical Sciences Education Board, Center for Education, Division of Behavioral and Social Sciences and Education. Washington, D.C.: National Academies Press.
Porter, A. C. (2002). Measuring the content of instruction: Uses in research and practice. Educational Researcher, 31(7), 3-14.
Porter, A. C., Polikoff, M. S., Zeidner, T., & Smithson, J. (2008). The quality of content analyses of state student achievement tests and content standards. Educational Measurement: Issues and Practice, Winter, 2-14.
Porter, A. C., & Smithson, J. L. (2001a). Defining, developing, and using curriculum indicators. (CPRE Research report series, RR-048). Philadelphia: Consortium for Policy Research in Education.
Porter, A. C., & Smithson, J. L. (2001b). Are content standards being implemented in the

25
classroom? A methodology and some tentative answers. In S. H. Fuhrman (Ed.), From the Capitol to the classroom. Standards-based reform in the states (pp. 60-80). Chicago: National Society for the Study of Education, University of Chicago Press.
Romagnano, L. (2001). The myth of objectivity in mathematics assessment. Mathematics Teacher, 94, 31-37.
Roseman, J. E., Stern, L., & Koppal, M. (2010). A method for analyzing the coherence of high school biology textbooks. Journal of Research in Science Teaching, 47, 47-70.
Senk, S. L., Beckmann, C. E., & Thompson, D. R. (1997). Assessment and grading in high school mathematics classrooms. Journal for Research in Mathematics Education, 28, 187-215.
Shuard, H., & Rothery, A. (1984). Children reading mathematics. London: John Murray. Stein, M. K., Remillard, J., & Smith, M. S. (2007). How curriculum influences student learning.
In F. K. Lester (Ed.), Second handbook of research on mathematics teaching and learning (Vol. 1, pp. 319-370). Charlotte, NC: Information Age Publishing.
Stiggins, R. J. (1992). In teachers’ hands: Investigating the practices of classroom assessment. Albany: State University of New York Press.
Stylianou, D. A., Blanton, M. L., & Knuth, E. J. (Eds.). (2009). Teaching and learning proof across the grades: A K-16 perspective. New York, NY: Routledge.
Suurtamm, C., Koch, M., & Arden, A. (2010). Teachers’ assessment practices in mathematics. Assessment in Education: Principles, Policy, & Practice, 17(4), 399-417.
Taylor, L. T. (1992). Survey of algebra and geometry teachers’ assessment practices, and an investigation of publisher-provided testing materials. Dissertation Abstracts International, 52, 11. (University Microfilms No. AAC9211232).
Valverde, G. A., Bianchi, L. J., Wolfe, R. G., Schmidt, W. H., & Houang, R. T. (2002). According to the book: Using TIMSS to investigate the translation of policy into practice through the world of textbooks. Norwell, MA: Kluwer Academic Publishers.
Webb, N. L. (1997). Criteria for alignment of expectations and assessments in mathematics and science education. (Research Monograph No. 6.) Madison: National Institute for Science Education.
Webb, N. L. (1999). Alignment of science and mathematics standards and assessments in four states. (Research Monograph No. 18). Madison: National Institute for Science Education.
Webb, N. L. (2002). An analysis of the alignment between mathematics standards and assessments for three states. Wisconsin Center for Education Research, University of Wisconsin-Madison, WI.
Webb, N. L. (2007). Issues related to judging the alignment of curriculum standards and assessments. Applied Measurement in Education, 20(1), 7–25.
Webb, N. M., Herman, J. L., & Webb, N. L. (2007). Alignment of mathematics state level standards and assessments: The role of reviewer agreement. Educational Measurement: Issues and Practice, 26(2), 17–29.
Wiliam, D. (2007). Keeping learning on track: Classroom assessment and the regulation of learning. In F. K. Lester, Jr. (Ed.), Second handbook of research on mathematics teaching and learning (pp. 1053-1098). Charlotte, NC: Information Age Publishing.
Related Documents