INTRODUCTION In marking Medicare's 30th year in operation, it is fitting to focus on the program's successes. The fiscal pressures facing Medicare on both its own financing base and that of the Federal Government as a whole, and the rapid changes occur- ring elsewhere in the health care system, have led to a raft of criticisms of the pro- gram in recent years. Although Medicare could certainly be improved, pausing to re- flect on the positive aspects of the program can offer some balance to the current debate on Medicare's future. Medicare is the largest public health program in the United States, providing the major source of insurance for the acute medical care needs of elderly and disabled persons. Its administrative costs are low, and it is popular with both its beneficiaries and the population as a whole. It has deliv- ered on its promises. The success of Medi- care from the perspective of older Americans can be summarized in four broad areas. UNIVERSAL COVERAGE The Medicare program has achieved nearly universal coverage for persons 65 years of age or over-a major achievement on behalf of older Americans. When Medi- care was introduced in 1965, only a little more than one-half of older persons had even hospital insurance, and elderly per- sons were considerably less well insured than younger families. For example, in What Medicare Has Meant To Older Americans Marilyn Moon, Ph.D. Marilyn Moon is a Senior Fellow at The Urban Institute. The opinions expressed are those of the author and do not necessar- ily reflect those of The Urban Institute or the Health Care Financing Administration (HCFA). 1963, just 56 percent of all persons 65 years of age or over had insurance against the costs of hospital care, compared with 75 percent of those 35-44 years of age and 71 percent of those 45-54 years of age (Andersen, Lion, and Anderson, 1976). But that share of the population covered rose immediately for those 65 years of age or over upon the introduction of Medicare. As shown in Figure 1, by 1970, the proportion of the population covered by insurance had increased to 97 percent of older Ameri- cans, while rising only modestly for younger persons. Since then, Medicare has steadily remained at around 97 percent of persons 65 years of age or over, while private coverage of younger persons has actually declined.' Although attention is now focusing ap- propriately on future growth in the benefi- ciary population, Medicare has already successfully absorbed a doubling of the number of people it serves in its first 30 years. That is, Medicare has expanded from 19.1 million elderly beneficiaries in 1966 to 33.4 million elderly and 4.8 million disabled persons in 1996 (Health Care Fi- nancing Administration, 1996). The share of the U.S. population now covered by Medicare stands at 14.3 percent, up from 9.7 percent in 1966 (U.S. Bureau of the Census, 1994). And by 2020, Medicare's share of the population will reach 18.4 per- cent. Thus, each year since its inception, Medicare has played an ever-more-impor- tant role in the overall system of health ' Not only is this an important issue in itself, but it also reminds us that comparisons between the costs of Medicare and private health insurance should always be undertaken on a per capita basis, because the number of beneficiaries under Medicare is rising each year at a rate much faster than that for private insurance. HEALTH CARE FINANCING REVIEW/Winter 1996/volume 18, Number2 49

Welcome message from author
This document is posted to help you gain knowledge. Please leave a comment to let me know what you think about it! Share it to your friends and learn new things together.
Transcript
INTRODUCTION
In marking Medicare's 30th year inoperation, it is fitting to focus on theprogram's successes. The fiscal pressuresfacing Medicare on both its own financingbase and that of the Federal Governmentas a whole, and the rapid changes occur-ring elsewhere in the health care system,have led to a raft of criticisms of the pro-gram in recent years. Although Medicarecould certainly be improved, pausing to re-flect on the positive aspects of the programcan offer some balance to the currentdebate on Medicare's future.
Medicare is the largest public healthprogram in the United States, providingthe major source of insurance for the acutemedical care needs of elderly and disabledpersons. Its administrative costs are low,and it is popular with both its beneficiariesand the population as a whole. It has deliv-ered on its promises. The success of Medi-care from the perspective of older Americanscan be summarized in four broad areas.
UNIVERSAL COVERAGE
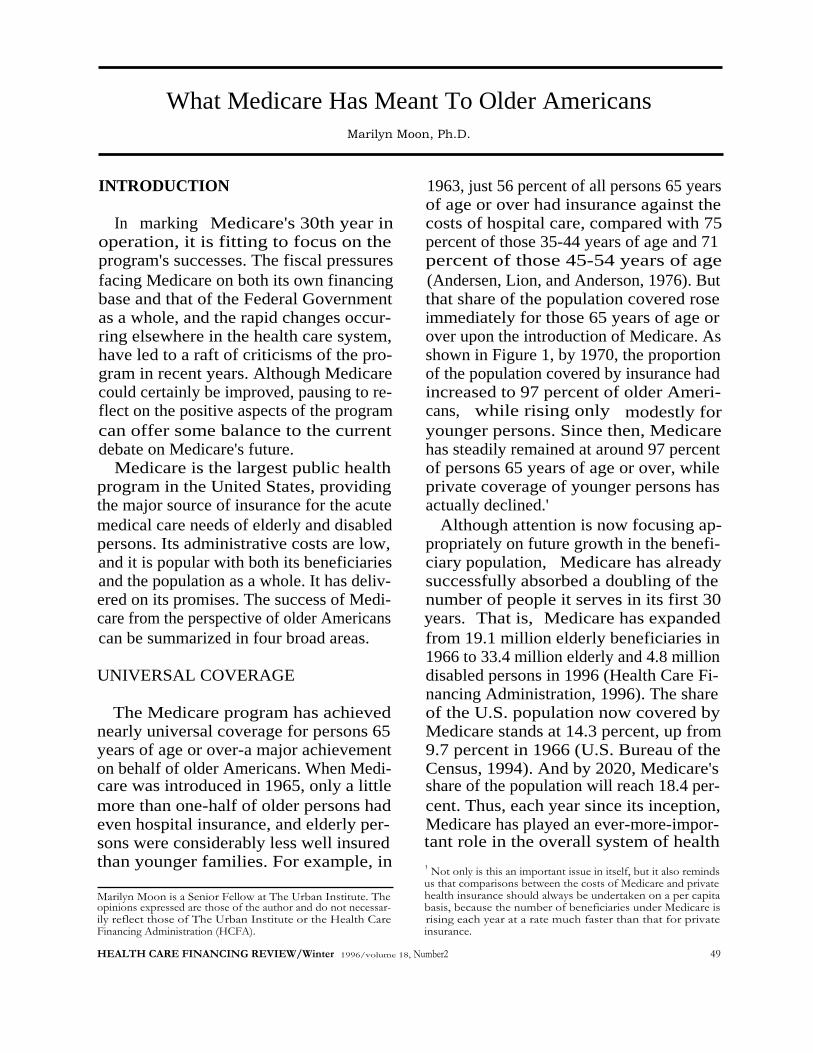
The Medicare program has achievednearly universal coverage for persons 65years of age or over-a major achievementon behalf of older Americans. When Medi-care was introduced in 1965, only a littlemore than one-half of older persons hadeven hospital insurance, and elderly per-sons were considerably less well insuredthan younger families. For example, in
What Medicare Has Meant To Older AmericansMarilyn Moon, Ph.D.
Marilyn Moon is a Senior Fellow at The Urban Institute. Theopinions expressed are those of the author and do not necessar-ily reflect those of The Urban Institute or the Health CareFinancing Administration (HCFA).
1963, just 56 percent of all persons 65 yearsof age or over had insurance against thecosts of hospital care, compared with 75percent of those 35-44 years of age and 71percent of those 45-54 years of age(Andersen, Lion, and Anderson, 1976). Butthat share of the population covered roseimmediately for those 65 years of age orover upon the introduction of Medicare. Asshown in Figure 1, by 1970, the proportionof the population covered by insurance hadincreased to 97 percent of older Ameri-cans, while rising only modestly foryounger persons. Since then, Medicarehas steadily remained at around 97 percentof persons 65 years of age or over, whileprivate coverage of younger persons hasactually declined.'
Although attention is now focusing ap-propriately on future growth in the benefi-ciary population, Medicare has alreadysuccessfully absorbed a doubling of thenumber of people it serves in its first 30years. That is, Medicare has expandedfrom 19.1 million elderly beneficiaries in1966 to 33.4 million elderly and 4.8 milliondisabled persons in 1996 (Health Care Fi-nancing Administration, 1996). The shareof the U.S. population now covered byMedicare stands at 14.3 percent, up from9.7 percent in 1966 (U.S. Bureau of theCensus, 1994). And by 2020, Medicare'sshare of the population will reach 18.4 per-cent. Thus, each year since its inception,Medicare has played an ever-more-impor-tant role in the overall system of health
' Not only is this an important issue in itself, but it also remindsus that comparisons between the costs of Medicare and privatehealth insurance should always be undertaken on a per capitabasis, because the number of beneficiaries under Medicare isrising each year at a rate much faster than that for privateinsurance.
HEALTH CARE FINANCING REVIEW/Winter 1996/volume 18, Number2
49
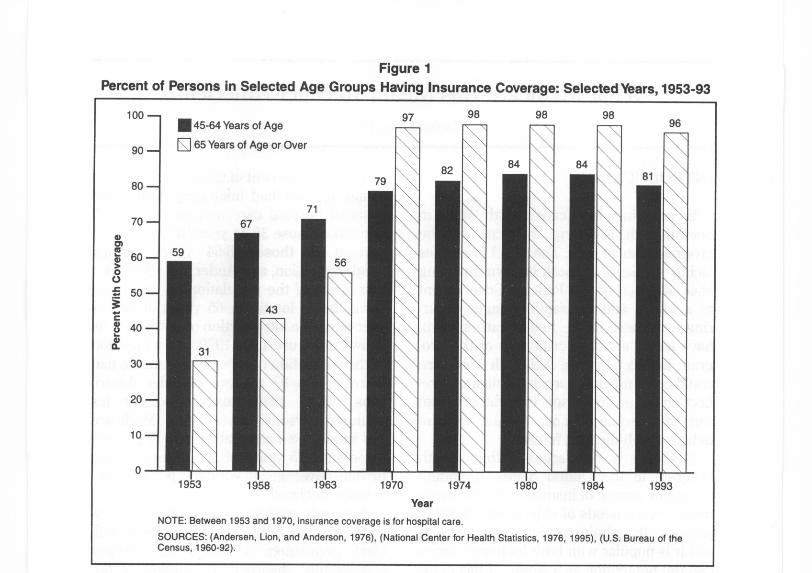
Figure 1Percent of Persons in Selected Age Groups Having Insurance Coverage: Selected Years, 1953-93
1953 1958 1963 1970
97 98
1980
98
1984
98
19931974
Year
NOTE: Between 1953 and 1970, insurance coverage is for hospital care.
SOURCES: (Andersen, Lion, and Anderson, 1976), (National Center for Health Statistics, 1976, 1995), (U.S. Bureau of theCensus, 1960-92).
insurance in the United States. And thatrole is projected to rise steadily in the future.
For those eligible, coverage cannot belost as beneficiaries get older or sicker, orface other changes of status such as widow-hood or retirement. Thus, in addition to theshare of persons covered, these protec-tions for beneficiaries give Medicare a sub-stantial advantage over our system of pri-vate insurance coverage. The employer-based system for younger workers hasmany more gaps in the certainty of cover-age and continuity over time. Coverage isnot fully portable for many Americans, de-spite recent legislation. At best, youngerworkers obtain coverage through a newplan if they change jobs, often resulting indiscontinuities in care when it becomes
necessary to choose new doctors, hospi-tals, and other providers of services. Whenworkers move, new plans may be less gen-erous or more restrictive than the previousplans. At worst, coverage for those withhealth problems may be denied for a pe-riod of time or new coverage may not beavailable at all. Medicare, on the otherhand, offers some choices through itshealth maintenance organization (HMO)option, but people can always remain in thetraditional program and are free to switchback and forth even when serious healthproblems arise.
Medicare's presence also has stimulatedthe supplemental insurance market for thispopulation (Figure 2). Almost from the be-ginning, private insurers have been willing
50
HEALTH CARE FINANCING REVIEW/Winter 1996/volume IS, Number 2
Age
le or Over
79
71
82 84\
84
--
81
43
56
\ \
V v
100---45-64 Years o
90 -Q 65 Years of A
80 -
70 - 67a,rnm 59`m 60-
0Ut 50 -3c
40-00. 31
30 -
\\20 -
10 -
0 I
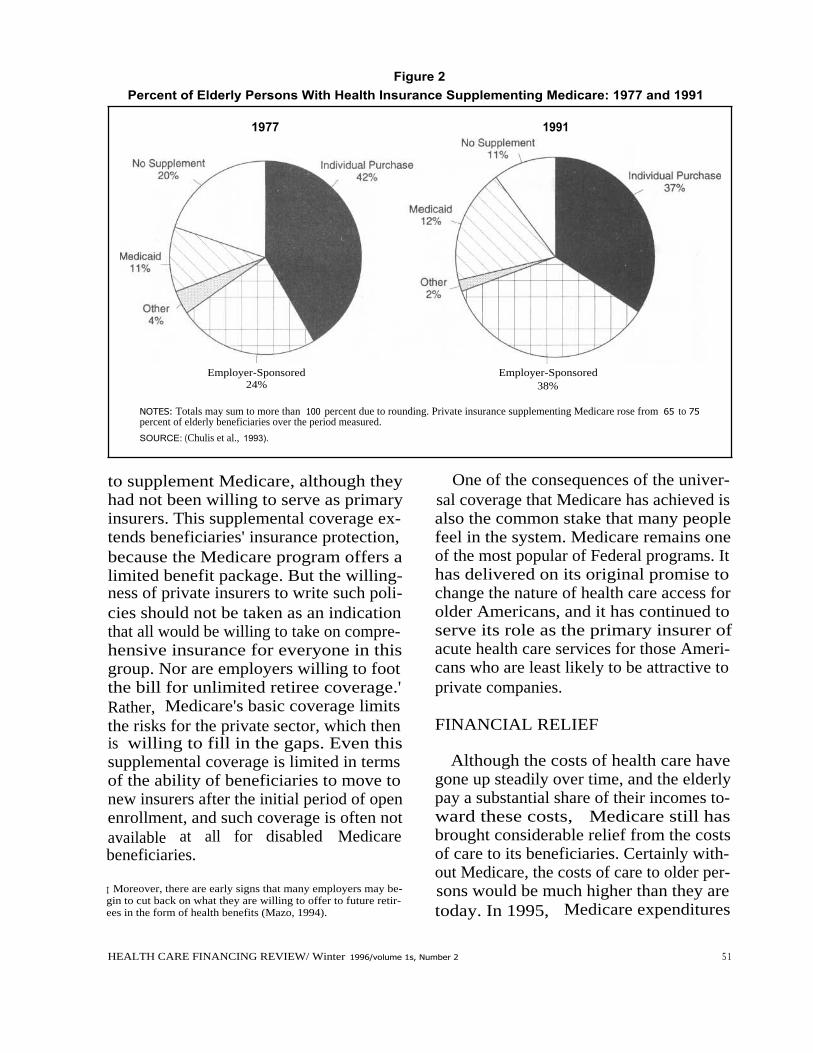
Figure 2Percent of Elderly Persons With Health Insurance Supplementing Medicare: 1977 and 1991
1977
Employer-Sponsored24%
1991
Employer-Sponsored38%
NOTES: Totals may sum to more than 100 percent due to rounding. Private insurance supplementing Medicare rose from 65 to 75percent of elderly beneficiaries over the period measured.
SOURCE: (Chulis et al., 1993).
to supplement Medicare, although theyhad not been willing to serve as primaryinsurers. This supplemental coverage ex-tends beneficiaries' insurance protection,because the Medicare program offers alimited benefit package. But the willing-ness of private insurers to write such poli-cies should not be taken as an indicationthat all would be willing to take on compre-hensive insurance for everyone in thisgroup. Nor are employers willing to footthe bill for unlimited retiree coverage.'Rather, Medicare's basic coverage limitsthe risks for the private sector, which thenis willing to fill in the gaps. Even thissupplemental coverage is limited in termsof the ability of beneficiaries to move tonew insurers after the initial period of openenrollment, and such coverage is often notavailable at all for disabled Medicarebeneficiaries.
I Moreover, there are early signs that many employers may be-gin to cut back on what they are willing to offer to future retir-ees in the form of health benefits (Mazo, 1994).
One of the consequences of the univer-sal coverage that Medicare has achieved isalso the common stake that many peoplefeel in the system. Medicare remains oneof the most popular of Federal programs. Ithas delivered on its original promise tochange the nature of health care access forolder Americans, and it has continued toserve its role as the primary insurer ofacute health care services for those Ameri-cans who are least likely to be attractive toprivate companies.
FINANCIAL RELIEF
Although the costs of health care havegone up steadily over time, and the elderlypay a substantial share of their incomes to-ward these costs, Medicare still hasbrought considerable relief from the costsof care to its beneficiaries. Certainly with-out Medicare, the costs of care to older per-sons would be much higher than they aretoday. In 1995, Medicare expenditures
HEALTH CARE FINANCING REVIEW/ Winter 1996/volume 1s, Number 2
5 1
0 Net Medicare Payment•
Beneficiary Liability
$910
$910
1977
1983
1995
Year' Adjusted for inflation.NOTES: 1965 figure represents out-of-pocket spending on hospital, physician, and other professional services. Boldednumbers at top of columns represent total per capita Medicare expenditures.SOURCES: (Fisher, 1980), (Health Care Financing Administration, 1995).
1965
$2,386
$660
$1,726
$3,304
$799
$2,505
$5,651
$4,300
$1,261
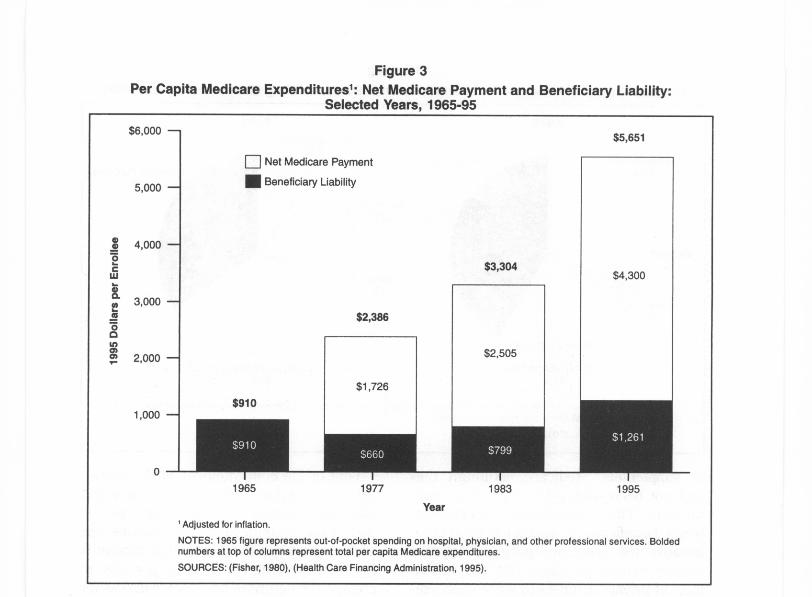
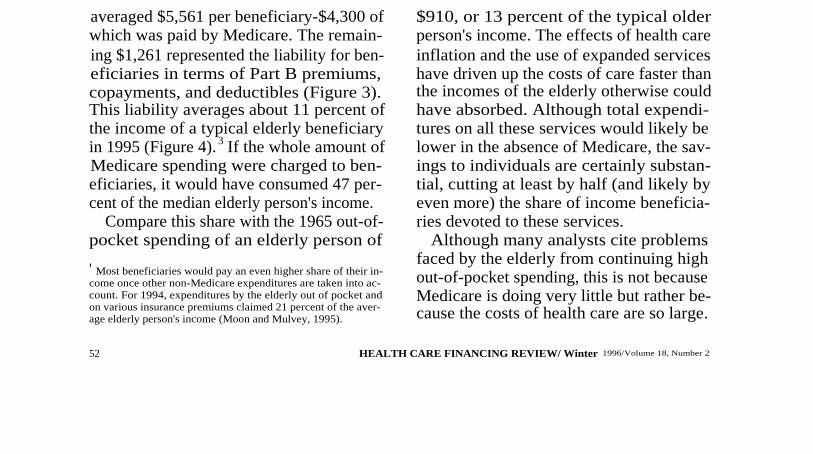
averaged $5,561 per beneficiary-$4,300 ofwhich was paid by Medicare. The remain-ing $1,261 represented the liability for ben-eficiaries in terms of Part B premiums,copayments, and deductibles (Figure 3).This liability averages about 11 percent ofthe income of a typical elderly beneficiaryin 1995 (Figure 4). 3 If the whole amount ofMedicare spending were charged to ben-eficiaries, it would have consumed 47 per-cent of the median elderly person's income.
Compare this share with the 1965 out-of-pocket spending of an elderly person of
' Most beneficiaries would pay an even higher share of their in-come once other non-Medicare expenditures are taken into ac-count. For 1994, expenditures by the elderly out of pocket andon various insurance premiums claimed 21 percent of the aver-age elderly person's income (Moon and Mulvey, 1995).
52
Figure 3Per Capita Medicare Expenditures': Net Medicare Payment and Beneficiary Liability:
Selected Years, 1965-95
$910, or 13 percent of the typical olderperson's income. The effects of health careinflation and the use of expanded serviceshave driven up the costs of care faster thanthe incomes of the elderly otherwise couldhave absorbed. Although total expendi-tures on all these services would likely belower in the absence of Medicare, the sav-ings to individuals are certainly substan-tial, cutting at least by half (and likely byeven more) the share of income beneficia-ries devoted to these services.
Although many analysts cite problemsfaced by the elderly from continuing highout-of-pocket spending, this is not becauseMedicare is doing very little but rather be-cause the costs of health care are so large.
HEALTH CARE FINANCING REVIEW/ Winter 1996/Volume 18, Number 2
$6,000 -
5,000 -
C)d 4,000 -0
`CW
3,000 -
00
rn 2,000 -r
1,000 -
0
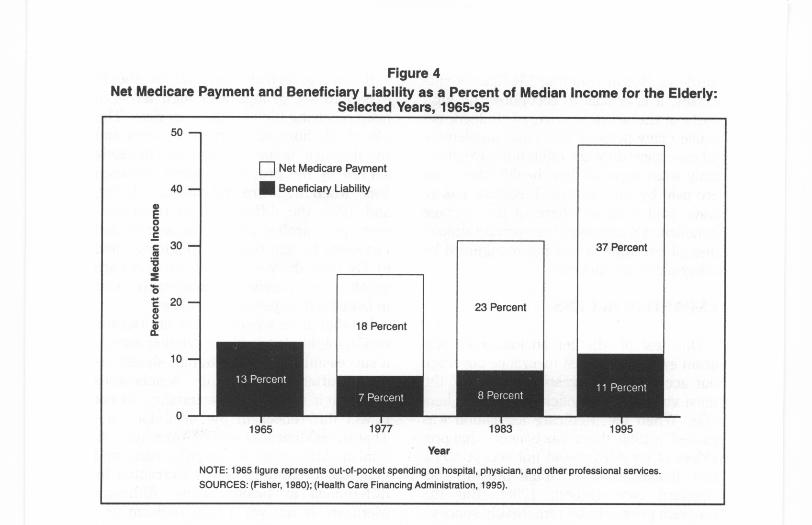
Figure 4Net Medicare Payment and Beneficiary Liability as a Percent of Median Income for the Elderly:
Selected Years, 1965-95
0 Net Medicare Payment
•
Beneficiary Liability
13 Percent
7 Percent
18 Percent
1965
1977
Year
8 Percent
23 Percent
37 Percent
11 Percent
1983
1995
NOTE: 1965 figure represents out-of-pocket spending on hospital, physician, and other professional services.SOURCES: (Fisher, 1980); (Health Care Financing Administration, 1995).
For all Americans, spending on health carehas risen substantially since 1965, andMedicare has shielded its beneficiariesfrom a substantial portion of that increase.
The large risk pool created by Medicaremeans that out-of-pocket costs for vulner-able groups are lower than they would oth-erwise be. Particularly in the case of Part Bpremiums, all beneficiaries pay the samemonthly amount for Part B coverage. Thevery old and the sick would face muchhigher premiums in an environment withno cross-subsidies. That is, the Part B pre-mium represents about 9.5 percent of thecosts of total Medicare services receivedby Medicare beneficiaries. But for those 80years of age or over, the Part B premiumpays for only about 7.5 percent of benefitsreceived.
Over time, Medicare has held the line onpayments to providers of care, particularlyhospitals and physicians, resulting in lower
HEALTH CARE FINANCING REVIEW/ Winter 1996/volume 18, Number 2
cost-sharing than would otherwise be thecase. For example, coinsurance for physi-cian services is 20 percent of what Medi-care deems reasonable, and Medicare'sfees tend to be below what physicians andhospitals charge others. Limits on balancebilling and pressures on physicians to ac-cept Medicare's fee as the total amountcharged have also kept cost sharing lowerthan it would otherwise be. In fact, bal-ance-billing burdens on Medicare benefi-ciaries have declined from a high of $89per enrollee in 1985 to just $15 in 1993(Health Care Financing Administration,1995).
Attention to the services not covered byMedicare often distracts from its benefits.Medicare does require high copaymentsand deductibles, and its lack of coverage ofprescription drugs, long-term care, andother services means that older and dis-abled persons are still left with substantial
53
50 -
40 -
0E00cc 30m.od
020
00
10
0
burdens. But in counting Medicare's suc-cesses, it is crucial to recognize the highcosts of the services covered. Indeed, be-cause many persons also have supplemen-tal coverage, they are often unaware of ex-actly what share of their health care costsare paid by what source. Medicare has al-ways paid a larger share of the averagebeneficiary's expenses than private supple-mental coverage, a fact not recognized bymany older beneficiaries.
EXPANDED ACCESS
One test of whether an insurance pro-gram expands not just insurance coveragebut access to care rests on whether themost vulnerable beneficiaries receive ben-efits. When the Medicare legislation waspassed in 1965, there was concern that pro-viders of services would not accept Medi-care beneficiaries or would provide sub-standard care (Moon, 1996). But theprogram proved to be remarkably success-ful from the beginning. Large numbers ofthe elderly enrolled, and use of servicesexpanded rapidly. There was no noticeableboycott by health care providers. In thefirst 3 years of Medicare, about 100,000 eli-gible enrollees were admitted to hospitalseach week (Myers, 1970). Medicare led toa major increase in the elderly's use ofmedical care. For example, hospital dis-charges averaged 190 per 1,000 elderlypersons in 1964 and 350 per 1,000 by 1973,with most of the change occurring in theearly years (Davis and Schoen, 1978). An-other study found that the proportion ofthe elderly using physician servicesjumped from 68 to 76 percent between1963 and 1970 (Andersen et al., 1973).Since that time, use of services underMedicare has continued to climb. In 1993,81.2 percent of all beneficiaries receivedMedicare services (Health Care FinancingAdministration, 1995).
54
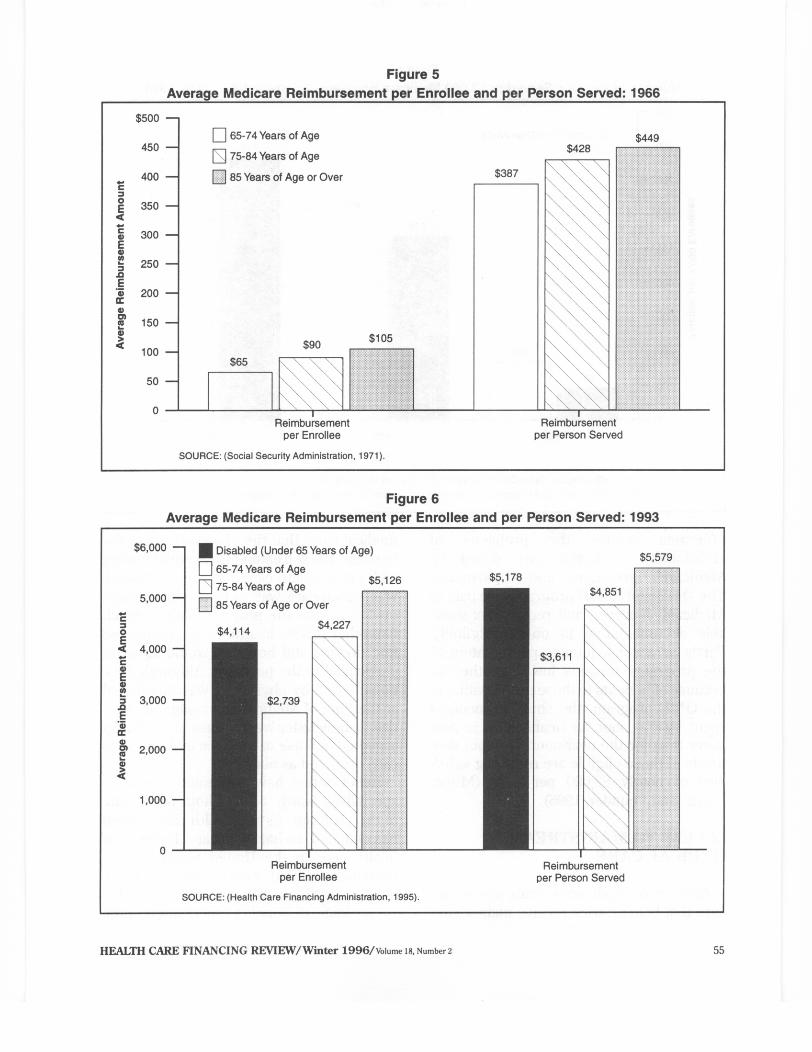
If coverage is truly universal, we shouldexpect to see groups with high levels ofneed receiving high levels of services. Theoldest old, those with chronic illnesses, andthe disabled should be disproportionatelyserved by the program. Indeed, between1966, when Medicare first came into being,and 1993, the differences in reimburse-ment per enrollee and per person servedincreased by age category (Figures 5 and6). By 1993, the very old, whose needs aregreater, were receiving considerably morein benefits than younger enrollees.
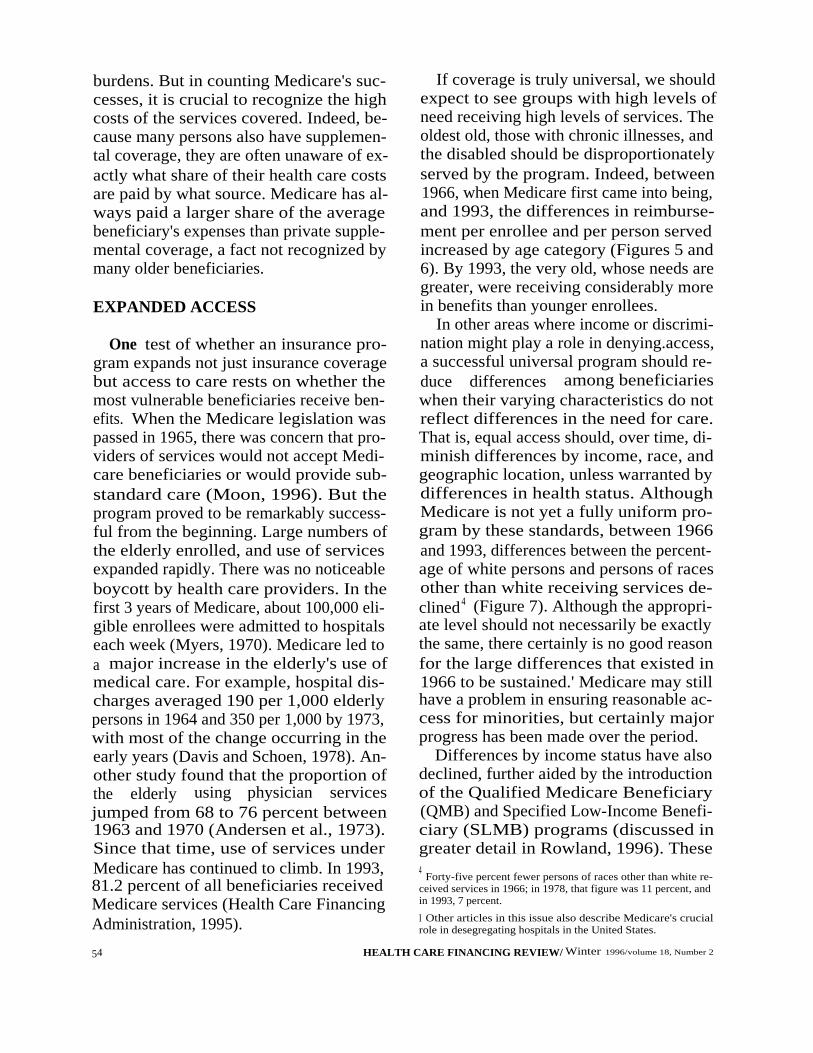
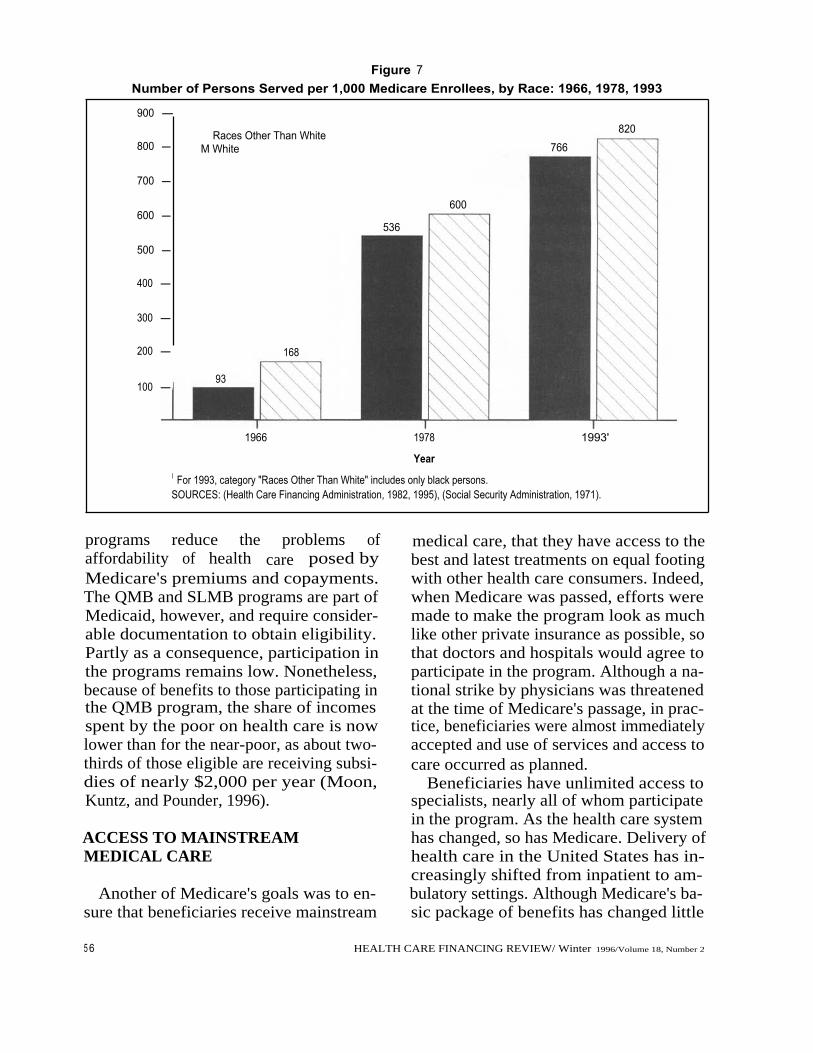
In other areas where income or discrimi-nation might play a role in denying.access,a successful universal program should re-duce differences among beneficiarieswhen their varying characteristics do notreflect differences in the need for care.That is, equal access should, over time, di-minish differences by income, race, andgeographic location, unless warranted bydifferences in health status. AlthoughMedicare is not yet a fully uniform pro-gram by these standards, between 1966and 1993, differences between the percent-age of white persons and persons of racesother than white receiving services de-clined 4 (Figure 7). Although the appropri-ate level should not necessarily be exactlythe same, there certainly is no good reasonfor the large differences that existed in1966 to be sustained.' Medicare may stillhave a problem in ensuring reasonable ac-cess for minorities, but certainly majorprogress has been made over the period.
Differences by income status have alsodeclined, further aided by the introductionof the Qualified Medicare Beneficiary(QMB) and Specified Low-Income Benefi-ciary (SLMB) programs (discussed ingreater detail in Rowland, 1996). These4
Forty-five percent fewer persons of races other than white re-ceived services in 1966; in 1978, that figure was 11 percent, andin 1993, 7 percent.
I Other articles in this issue also describe Medicare's crucialrole in desegregating hospitals in the United States.
HEALTH CARE FINANCING REVIEW/ Winter 1996/volume 18, Number 2
900 -
800 -
700 -
600 -
500 -
400 -
300 -
200 -
168
100 -
Races Other Than WhiteM White
93
1966
600
536
766
1978
1993'
YearI For 1993, category "Races Other Than White" includes only black persons.SOURCES: (Health Care Financing Administration, 1982, 1995), (Social Security Administration, 1971).
820
programs reduce the problems ofaffordability of health care posed byMedicare's premiums and copayments.The QMB and SLMB programs are part ofMedicaid, however, and require consider-able documentation to obtain eligibility.Partly as a consequence, participation inthe programs remains low. Nonetheless,because of benefits to those participating inthe QMB program, the share of incomesspent by the poor on health care is nowlower than for the near-poor, as about two-thirds of those eligible are receiving subsi-dies of nearly $2,000 per year (Moon,Kuntz, and Pounder, 1996).
ACCESS TO MAINSTREAMMEDICAL CARE
Another of Medicare's goals was to en-sure that beneficiaries receive mainstream
5 6
Figure 7Number of Persons Served per 1,000 Medicare Enrollees, by Race: 1966, 1978, 1993
medical care, that they have access to thebest and latest treatments on equal footingwith other health care consumers. Indeed,when Medicare was passed, efforts weremade to make the program look as muchlike other private insurance as possible, sothat doctors and hospitals would agree toparticipate in the program. Although a na-tional strike by physicians was threatenedat the time of Medicare's passage, in prac-tice, beneficiaries were almost immediatelyaccepted and use of services and access tocare occurred as planned.
Beneficiaries have unlimited access tospecialists, nearly all of whom participatein the program. As the health care systemhas changed, so has Medicare. Delivery ofhealth care in the United States has in-creasingly shifted from inpatient to am-bulatory settings. Although Medicare's ba-sic package of benefits has changed little
HEALTH CARE FINANCING REVIEW/ Winter 1996/Volume 18, Number 2
since 1965, delivery of care has changedwith the times. In 1966, inpatient hospitalservices constituted two-thirds of Medi-care's total payments (National Center forHealth Statistics, 1994). In 1995, that sharewas just under one-half (Health CareFinancing Administration, 1996).
An additional way to track Medicare'sability to offer mainstream care is to look atthe use of various types of new treatmentsand procedures to see whether older pa-tients are able to obtain such services onan equal footing with younger patients.Again, more careful analysis would be nec-essary to determine what the relationshipshould be in terms of levels of use, but theappropriate question to ask is this: Is therate of diffusion comparable across thegroups? This should give some indicationof general access to care. Two examplesare shown in Figures 8 and 9, which showthe increases in rates of angiocardiographyand cardiac catheterization for differentage groups. These high-technology proce-
dures are generally delivered in inpatientsettings, and these two figures track thegrowth rates of the procedures by agegroup. In both cases, growth in the use oftreatments expanded rapidly from 1980through 1985 as they were being intro-duced and then slowed through 1993 on anadjusted-annual-rate-of-growth basis. Inthese two examples, growth for the popula-tion 65 years of age or over was muchgreater than for those 45-64 years of ageover both periods. At least in these cases,as well as others not shown here, Medicarebeneficiaries do not appear to be disadvan-taged in terms of their access to services.They are benefiting from new technologyand at a rate sometimes greater than that ofyounger persons.
Another indicator of how our medicalcare system is changing rapidly is themovement toward managed care arrange-ments for the delivery of health care serv-ices. Although Medicare is behind the na-tional average in this regard, the option of
Figure 8Growth in Use of Angiocardiography Procedures, by Sex and Age Group: 1980-85 and 1985-93
18.5
Disabled (Under 65 Years of Age)
65-74 Years of Age
75 Years of Age or Over
33.0
24.6
63.0
24.4
I
I
Male
Female
Average Growth 1980-85
SOURCE: (National Center for Health Statistics, 1995).
18.0
I
IMale
Female
Average Growth 1985-93
HEALTH CARE FINANCING REVIEW/ Winter 1996/volume 18, Number 2 57
70 -
60 -
50 -
- 40 -cw0w
IL 30 -
20 -
10 -
0
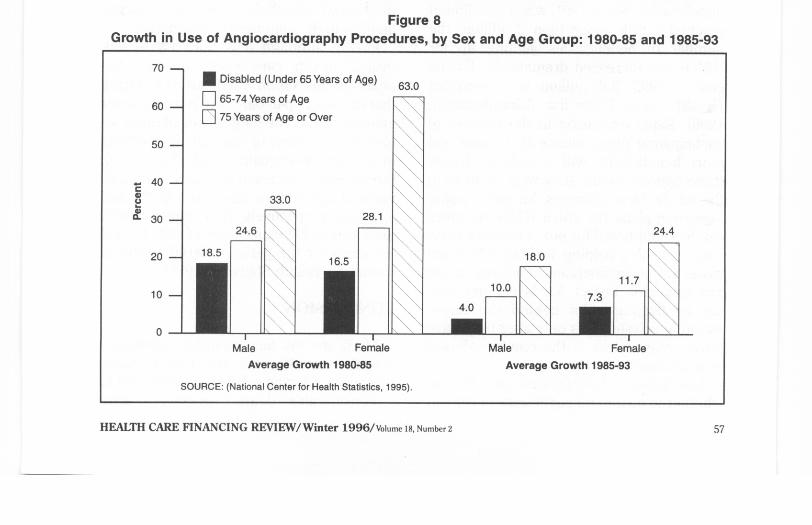
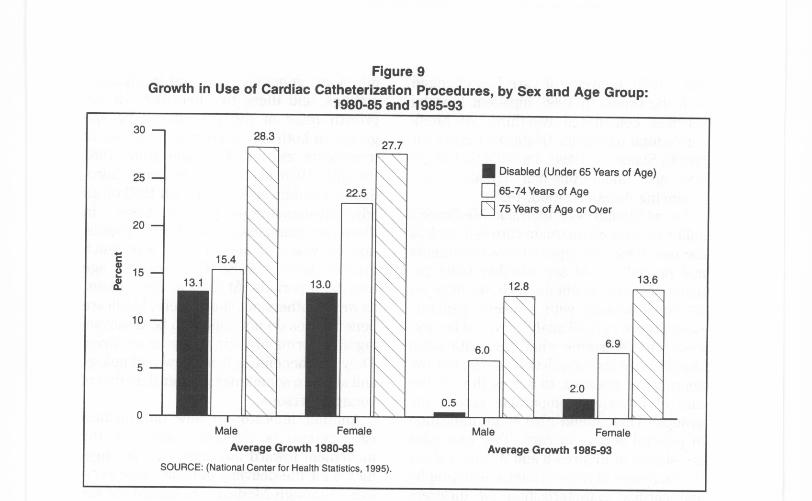
Figure 9Growth in Use of Cardiac Catheterization Procedures, by Sex and Age Group:
1980-85 and 1985-93
28.3
Male
Female
Average Growth 1980-85
SOURCE: (National Center for Health Statistics, 1995).
Male
Female
Average Growth 1985-93
enrolling in an HMO is available for manybeneficiaries. Since 1991, when enrollmentreached a little more than 2 million, thenumber of beneficiaries signing up forHMOs has increased dramatically. By theend of 1995, 3.8 million were enrolled(Health Care Financing Administration,1996). Rapid expansion in the number ofparticipating plans means that more andmore beneficiaries will be able to choosethese options should they wish to do so inthe future. New offerings, including point-of-service plans (in which HMO enrolleescan be reimbursed for out-of-network serv-ices), are also helping to keep Medicarecloser to the mainstream of activity in theprivate sector. In fact, Medicare may ben-efit by lagging a bit behind the times,adopting private plans only after they haveproven themselves in the employer-basedenvironment.
And because beneficiaries can choosewhether to go into managed care or remain58
in the traditional fee-for-service system,they have more choice than many youngerfamilies in the employer-based market.
Finally, although it is not easy to linkoverall health care spending with thehealth of the Nation, Medicare is ensuringthat the most up-to-date care is available forolder persons. The longer lives of these se-nior citizens attest to this and other effortsto improve their quality of life. Since 1960,the life expectancies of men and women 65years of age or over have risen by 2.7 and3.1 years, respectively. This compares withincreases in life expectancy of only 1.3 and3.6 years for the period 1900-60 (NationalCenter for Health Statistics, 1996).
CONCLUSION
Medicare will face daunting challengesover the next 30 years, and it seems likelythat major reforms will be legislated. But toa considerable degree, pressures arise
HEALTH CARE FINANCING REVIEW/ Winter 1996/Volume 18, Number 2
\ Disabled (Under 65 Years of Age)
22.5 65-74 Years of Age
75 Years of Age or Over
15.4
13.0 12.8
13.6\
6.9\ 6.0 \
2.00.5
30 -
25 -
20 -
cd
15 -a 13.1
10 -
5 -
0
because of the successes of the program.Medicare will go from serving 1 in 10Americans to caring for nearly 1 in 5, asbaby boomers begin to retire. BecauseMedicare serves the most vulnerablemembers of our population with up-to-datecare, it should not be surprising that costsof the program are high. Each older benefi-ciary can also expect to draw more years ofcoverage from the system as a result of in-creased life expectancy. All of these factorshave contributed to the costs of the pro-gram, but they are not indicators of failure.
Future reforms should build onMedicare's strengths as well as learn fromits weaknesses, recognizing the crucialrole the program has played in the lives ofolder Americans.
ACKNOWLEDGMENTS
The author would like to acknowledgethe help of Crystal Kuntz in developing thefigures used in this article. The authorwould also like to thank the Common-wealth Fund for its sponsorship of relatedresearch.
REFERENCES
Health Care Financing Administsration: MedicareSummary, Use and Reimbursements by Person,1976-1978. Washington, DC. U.S. GovernmentPrinting Office, 1982.
Health Care Financing Administration: Profiles ofMedicare, 30th Anniversary. Washington, DC. U.S.Government Printing Office, 1996.
Health Care Financing Administration: HealthCare Financing Review Medicare and Medicaid Sta-tistical Supplement, 1995. Washington, DC. U.S.Government Printing Office, 1995.
Mazo, J.F.: Introduction to Retiree Health Ben-efits. In Mazo, J.F., Rappaport, A.M., and Schieber,S.J., eds.: Providing Health Care Benefits in Retire-ment. Philadelphia. Pennsylvania Press, 1994.
Moon, M.: Medicare Now and in the Future. (Sec-ond Edition). Washington, DC. The Urban Insti-tute Press, 1996.
Moon, M., Kuntz, C., and Pounder, L.: ProtectingLow Income Medicare Beneficiaries. Urban InstituteDiscussion Paper prepared for The Common-wealth Fund. Washington, DC. The Urban Insti-tute, July 1996.
Moon, M., and Mulvey, J.: Entitlements and theElderly: Protecting Promises, Recognizing Realities.Washington, DC. The Urban Institute Press, 1995.
Myers, R.J.: Medicare. McCahan Foundation BookSeries. Homewood, IL. Richard D. Irwin, 1970.
National Center for Health Statistics: Health UnitedStates 1975. Hyattsville, MD. Public Health Serv-ice, May 1976.
National Center for Health Statistics: Health UnitedStates 1993. Hyattsville, MD. Public Health Serv-ice, May 1994.
National Center for Health Statistics: Health UnitedStates 1994. Hyattsville, MD. Public Health Serv-ice, May 1995.
National Center for Health Statistics: Health UnitedStates 1995. Hyattsville, MD. Public Health Serv-ice, May 1996.
Social Security Administration: Health Insurancefor the Aged, 1966, Section 1: Summary-Utiliza-tion and Reimbursement by Person. Washington,DC. U.S. Government Printing Office, 1971.
U.S. Bureau of the Census: Statistical Abstract ofthe United States: 1994. (114th edition). Washing-ton, DC. 1994.
Andersen, R., Lion, J., and Anderson, O.W.: TwoDecades of Health Services: Social Survey Trends inUse and Expenditure. Cambridge, MA. BallingerPublishing Co., 1976.
Andersen, R., Kravits, J., Anderson, O.W., andDaley, J.: Expenditures for Personal Health Services:National Trends and Variations, 1953-1970. Wash-ington, DC. U.S. Department of Health, Education,and Welfare, 1973.
Chulis, G.S., Eppig, F., Hogan, M., et al.: HealthInsurance and the Elderly: Data From MCBS.Health Care Financing Review 14(3):163-181,Spring 1993.
Davis, K., and Schoen, C.: Health and the War onPoverty: A Ten-Year Appraisal. Washington, DC.
ban Institute, 2100 M Street, NW, Washington, DC 20037.The Brookings Institution Press, 1978.
Fisher, C.: Differences by Age Groups in HealthCare Spending. Health Care Financing Review1 0:65-90, Spring 1980.
HEALTH CARE FINANCING REVIEW/Winter 1996/Volume Is, Number2
Reprint Requests: Marilyn Moon, Ph.D., Senior Fellow, The Ur-
59
Related Documents