Behind the Design What Lies Behind a Soccer Cleats’ Design

Welcome message from author
This document is posted to help you gain knowledge. Please leave a comment to let me know what you think about it! Share it to your friends and learn new things together.
Transcript
1
Behind the Design
What Lies Behind a Soccer Cleats’ Design

2
Table of Contents
Introduction-3
Research Paper-3
Methods and Materials-7
Results-10
Discussion of Results- 17
Works Cited- 21

3
Introduction
Question:
How does the design of a soccer cleat affect performance?
Problem:
Many soccer players are choosing the wrong cleat design for performance.
Hypothesis:
If the shell material, Padding, cleat formation, grip, and support of a soccer cleat is enhanced
and tested, then time in an obstacle course will be quicker.
Research Paper How the Design of Soccer Cleats Affects Performance
Playing soccer with the incorrect designed cleats is very risky and can lead to injury
(Evans). Normal soccer cleats are not suitable for hard, artificial, or indoor surfaces (Bauer).
Using incorrectly designed cleats in terms of gender, terrain, fit, body mass, and materials can
even give players an injury strong enough to keep them on the bench (Bauer). The cleat design
also has serious effect on control, accuracy, and speed. Using the wrong type of design can be
fatal to a player’s career, so it is vital to find a cleat with the perfect balance from all point of
views.

4
In order to thoroughly understand this experiment, there are three terms in which need
to be defined; soccer shoe design, soccer shoe material, and performance in obstacle course.
The “soccer shoe design” is made up of the following concepts; laces, padding, support,
stitching, and cleats. The laces on the cleat are always on the top of the shoe, however they
curve in a specific way to help enhance ball spin while shooting (Joan). Padding in the cleats is
inserted to fit the width, length, and arch of the foot (Joan). Support is given throughout the
shoe, such as extra padding, more sturdy materials, and higher cuts, to help with any disabilities
of a player. Stitching design on the cleats is usually divided up where the different materials
meet. The cleats are the most important part of the shoe; and have many different shapes and
designs for different terrains (Newell). They are only made of soft materials and must be not
less than 3/8 inch in diameter and ¾ inch long from the shoe (Midgley). The “Soccer Shoe
Material” is made up of the concepts of leather, synthetic, thread, and plastic. Leather is one of
the more common soccer shoe materials, and kangaroo leather is the most popular type
(“Soccer Shoes”). Synthetic material, the most common being KNG 100, is the most common
material used in the game, because it doesn’t stretch and is more water proof (Joan). Thread on
the soccer shoe is sturdy and thick to keep the shoes from falling apart (“Soccer Shoes”). Plastic
is used in the cleats of the shoe, as it is softer and will prevent injuries to players (Midgley).
Lastly, the “Performance in an obstacle course” is made up of the concepts of dribbling,
shooting, passing, grip, and speed. Dribbling in the obstacle course shows the control the cleats
have on the ball while maneuvering. Shooting shows accuracy of the cleats strike on the ball.
Passing shows how the shape of the cleats affects accurate passing. Speed shows how the
cleats slow or speed a player up while in action.
5
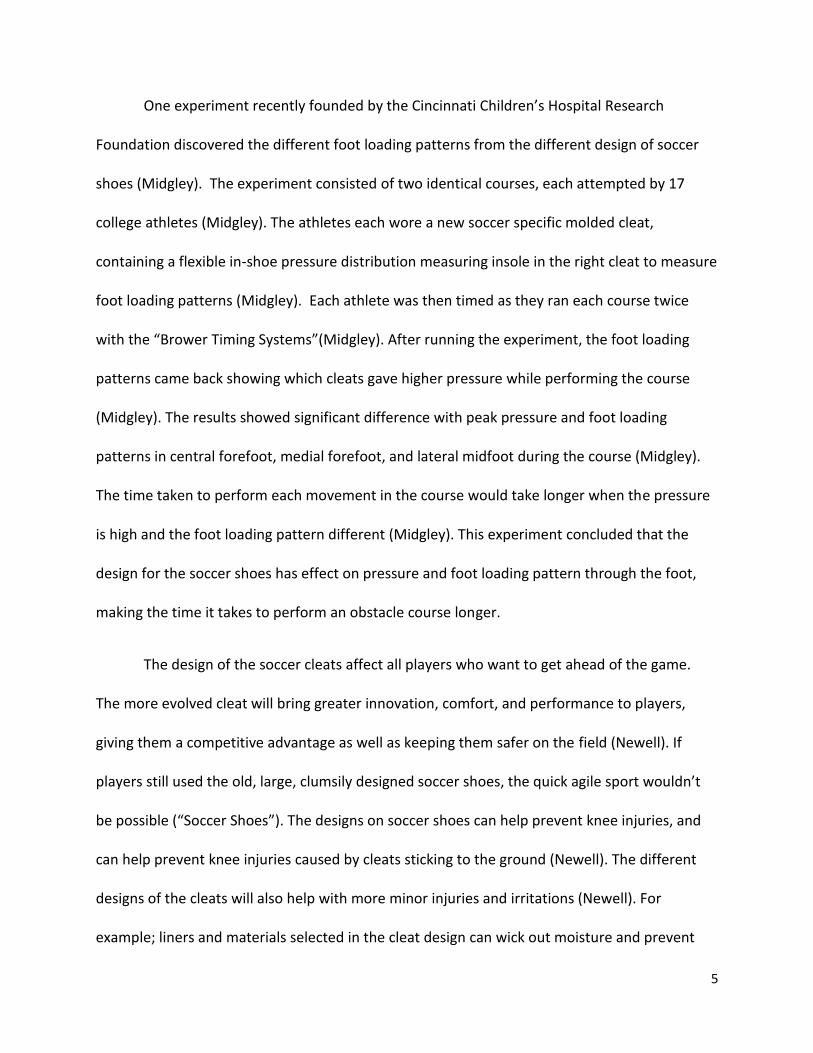
One experiment recently founded by the Cincinnati Children’s Hospital Research
Foundation discovered the different foot loading patterns from the different design of soccer
shoes (Midgley). The experiment consisted of two identical courses, each attempted by 17
college athletes (Midgley). The athletes each wore a new soccer specific molded cleat,
containing a flexible in-shoe pressure distribution measuring insole in the right cleat to measure
foot loading patterns (Midgley). Each athlete was then timed as they ran each course twice
with the “Brower Timing Systems”(Midgley). After running the experiment, the foot loading
patterns came back showing which cleats gave higher pressure while performing the course
(Midgley). The results showed significant difference with peak pressure and foot loading
patterns in central forefoot, medial forefoot, and lateral midfoot during the course (Midgley).
The time taken to perform each movement in the course would take longer when the pressure
is high and the foot loading pattern different (Midgley). This experiment concluded that the
design for the soccer shoes has effect on pressure and foot loading pattern through the foot,
making the time it takes to perform an obstacle course longer.
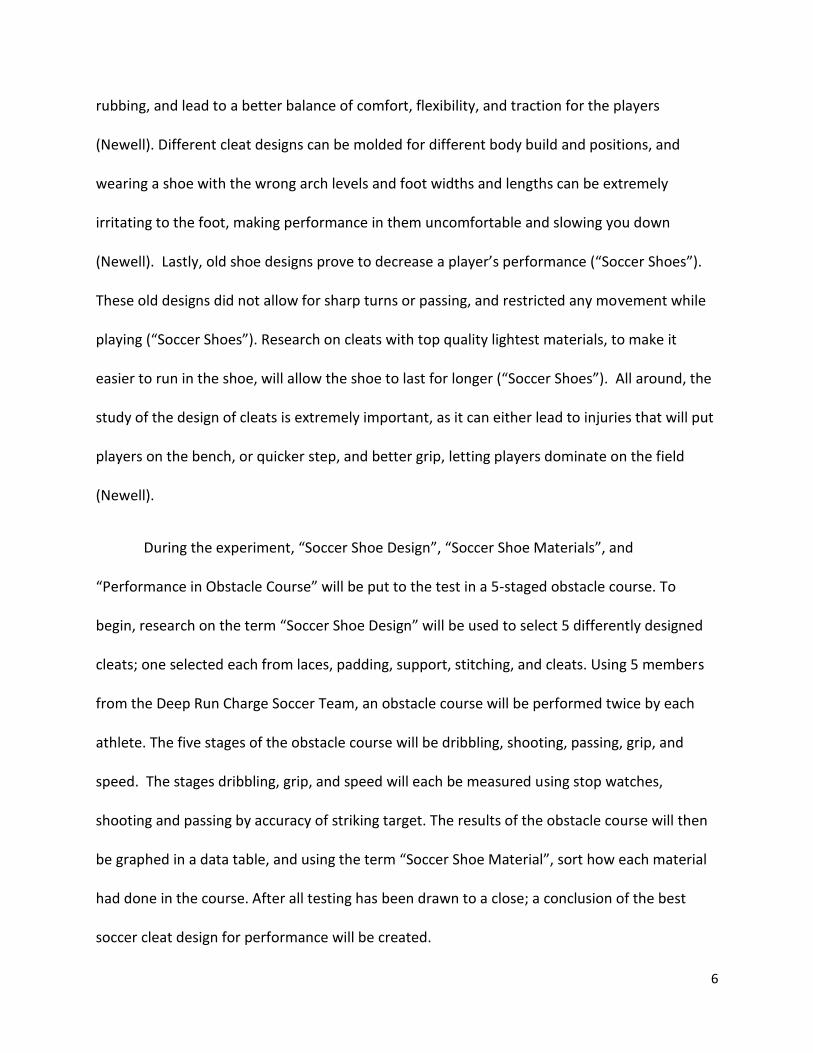
The design of the soccer cleats affect all players who want to get ahead of the game.
The more evolved cleat will bring greater innovation, comfort, and performance to players,
giving them a competitive advantage as well as keeping them safer on the field (Newell). If
players still used the old, large, clumsily designed soccer shoes, the quick agile sport wouldn’t
be possible (“Soccer Shoes”). The designs on soccer shoes can help prevent knee injuries, and
can help prevent knee injuries caused by cleats sticking to the ground (Newell). The different
designs of the cleats will also help with more minor injuries and irritations (Newell). For
example; liners and materials selected in the cleat design can wick out moisture and prevent
6
rubbing, and lead to a better balance of comfort, flexibility, and traction for the players
(Newell). Different cleat designs can be molded for different body build and positions, and
wearing a shoe with the wrong arch levels and foot widths and lengths can be extremely
irritating to the foot, making performance in them uncomfortable and slowing you down
(Newell). Lastly, old shoe designs prove to decrease a player’s performance (“Soccer Shoes”).
These old designs did not allow for sharp turns or passing, and restricted any movement while
playing (“Soccer Shoes”). Research on cleats with top quality lightest materials, to make it
easier to run in the shoe, will allow the shoe to last for longer (“Soccer Shoes”). All around, the
study of the design of cleats is extremely important, as it can either lead to injuries that will put
players on the bench, or quicker step, and better grip, letting players dominate on the field
(Newell).
During the experiment, “Soccer Shoe Design”, “Soccer Shoe Materials”, and
“Performance in Obstacle Course” will be put to the test in a 5-staged obstacle course. To
begin, research on the term “Soccer Shoe Design” will be used to select 5 differently designed
cleats; one selected each from laces, padding, support, stitching, and cleats. Using 5 members
from the Deep Run Charge Soccer Team, an obstacle course will be performed twice by each
athlete. The five stages of the obstacle course will be dribbling, shooting, passing, grip, and
speed. The stages dribbling, grip, and speed will each be measured using stop watches,
shooting and passing by accuracy of striking target. The results of the obstacle course will then
be graphed in a data table, and using the term “Soccer Shoe Material”, sort how each material
had done in the course. After all testing has been drawn to a close; a conclusion of the best
soccer cleat design for performance will be created.

7
Method and Materials
Materials:
1 Stopwatch (School)
3 Humans, Homo Sapiens (Deep Run Charge)
1 Shell Design Enhanced Soccer Cleats (worldsoccershop.com)
Lotto Zhero Gravity Ultra FG
1 Pair Cleat Formation Enhanced Soccer Cleats (worldsoccershop.com)
F50 adizero TRX FG
1 Pair Padding Enhanced Soccer Cleats (Sports Authority)
T90 Shoot IV FG
1 Pair Support Enhanced Soccer Cleats (worldsoccershop.com)
Pele 1970 FG MS
1Pair Grip Enhanced Soccer Cleats (Sports Authority)
Adidas Predator Absolado LZ TRX FG
1 Pair Basic Running Shoes (Home)

8
Adidas Women’s Indoor Soccer Shoe
30 Orange Training Cones (DRVSA)
1 Can of Orange Spray Paint (Home)
6 Size 5 Soccer Balls (Home)
Variables
Independent Variable: The Design of the Soccer Cleat
Dependent Variable: Speed (Seconds)
Control Group: Running the Obstacle Course Five Times per Volunteer with Basic Running Shoes
Controlled Variables: Obstacle Course, Weather, Time of Day, Type of Surface
Experimental Procedure:
1. Create the obstacle course
a. Using one bottle of orange spray paint, mark a starting point
b. Using spray paint, draw a 20 meter line, this is the speed without ball portion
c. Using spray paint, draw a perpendicular line at the end of the 20 meter line,
indicating end of speed without ball portion
d. Place a size 5 soccer ball at the perpendicular line
9
e. About 3 meters out from end of speed without ball portion, place 5 cones in a
straight line each 20 centimeters apart. Repeat this 3 meters away to get 5 sets
of three cones, this is the speed with ball portion
f. Mark a 20 meter circle with orange spray paint, indicating the area in which the
volunteer will do moves with a ball in
g. Mark a perpendicular line after the 20 meter circle, indicating the end of the
speed with ball portion and end of course
2. Have each volunteer run the obstacle course using basic running shoes (Control test)
a. Speed without a ball portion
i. Volunteer must sprint as fast as they can down the 20 meter orange line
until they reach perpendicular line
b. Speed with a ball portion
i. At the perpendicular line, the volunteer must pick up the ball and begin
dribbling through cones
1. Set one: inside of feet only
2. Set two: outside of feet only
3. Set three: right foot only
4. Set four: left foot only
5. Set five: any combination
ii. At the end of cones in the 20 meter circle, volunteer must do a
combination of any five moves and step over perpendicular line to stop
time of course

10
3. Time speed without a ball portion
4. Time speed with a ball portion
5. Have each volunteer repeat this test 5 times with basic running shoes
6. Repeat steps 2-5 with material enhanced cleats
7. Repeat steps 2-5 with cleat formation enhanced cleats
8. Repeat steps 2-5 with padding enhanced cleats
9. Repeat steps 2-5 with support enhanced cleats
10. Repeat steps 2-5 with grip enhanced cleats
Results
Graphs:
Table #1
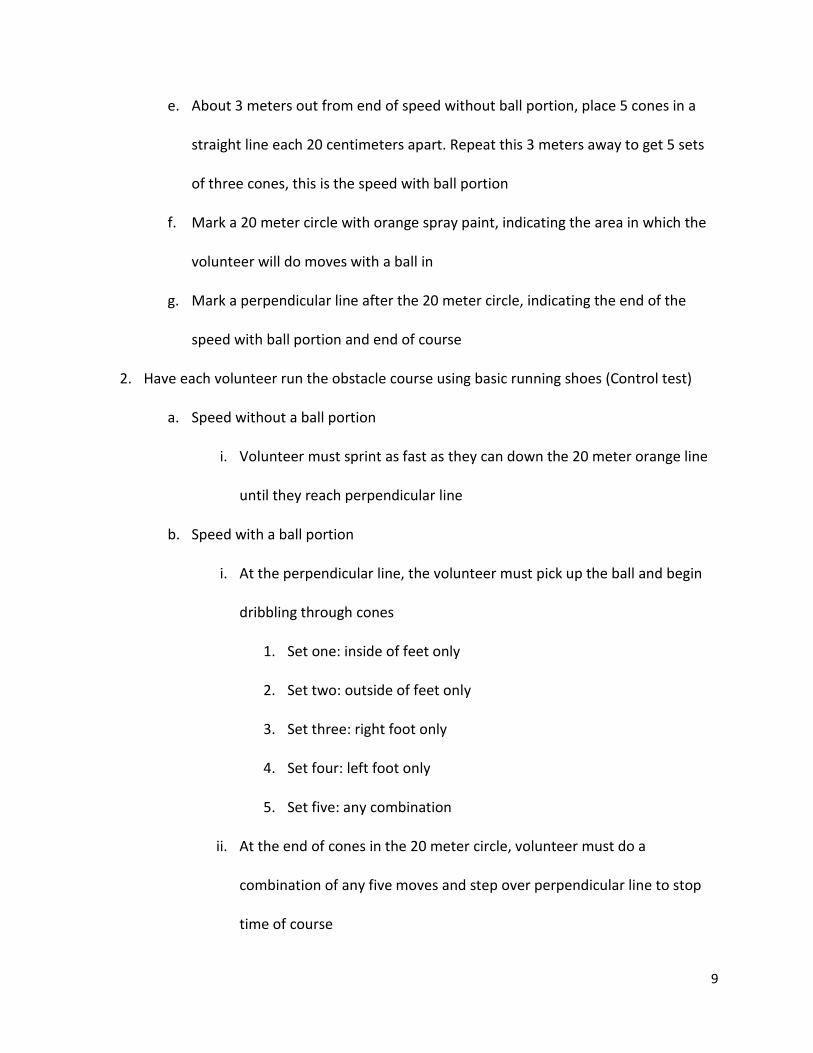
Control Test- How basic running shoes affect performance in an obstacle course (Seconds)
Basic Running Shoes Volunteer 1 Volunteer 2 Volunteer 3
Trial 1 44.1 43.2 43.1
Trial 2 42.4 45.8 43.3
Trial 3 42.8 44.5 42.9
Trial 4 43.3 45.8 44.0
Trial 5 45.6 44.1 43.9
Average 43.6 44.7 43.4
Table #2

11
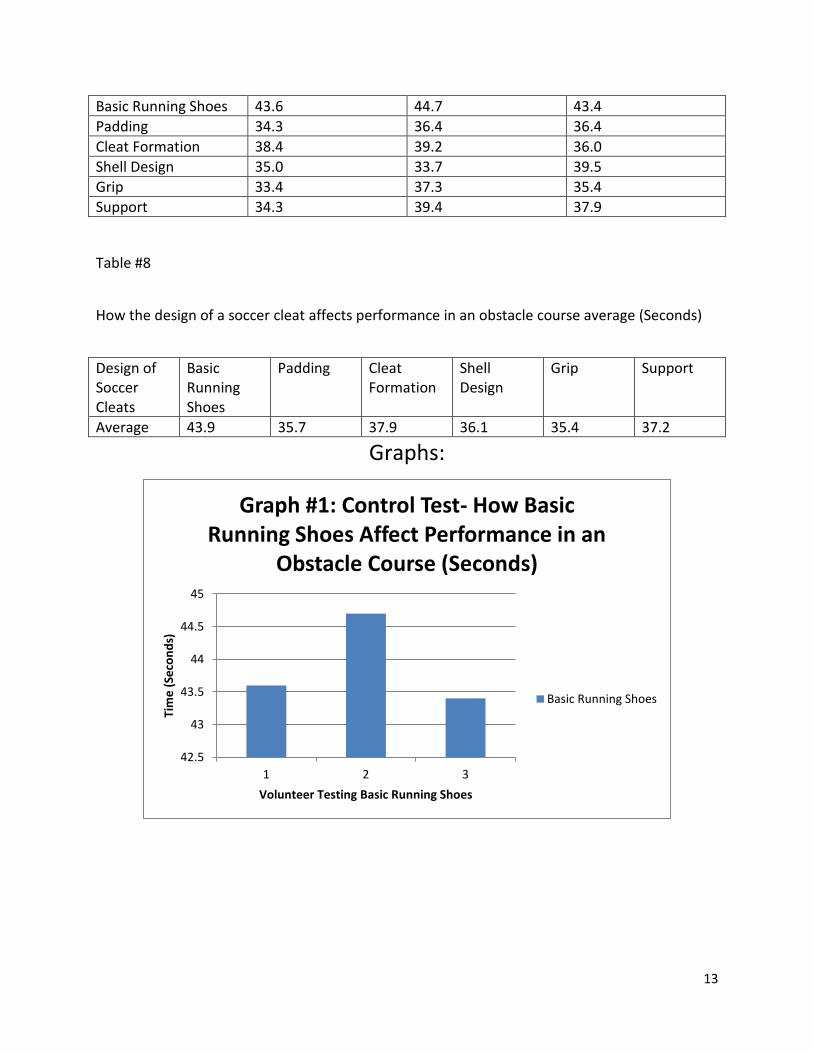
Padding- How padding enhanced soccer cleats affect performance in an obstacle course
(Seconds)
Padding Volunteer 1 Volunteer 2 Volunteer 3
Trial 1 39.1 38.6 37.6
Trial 2 33.8 36.8 38.9
Trial 3 32.5 35.0 36.0
Trial 4 32.1 36.7 35.2
Trial 5 34.0 34.7 34.1
Average 34.3 36.4 36.4
Table #3
Cleat Formation- How cleat formation enhanced soccer cleats affect performance in an obstacle
course (Seconds)
Cleat Formation Volunteer 1 Volunteer 2 Volunteer 3
Trial 1 38.5 39.5 36.3
Trial 2 39.7 41.8 34.9
Trial 3 39.4 42.2 37.0
Trial 4 38.5 37.5 35.0
Trial 5 36.0 34.8 36.9
Average 38.4 39.2 36.0
Table #4
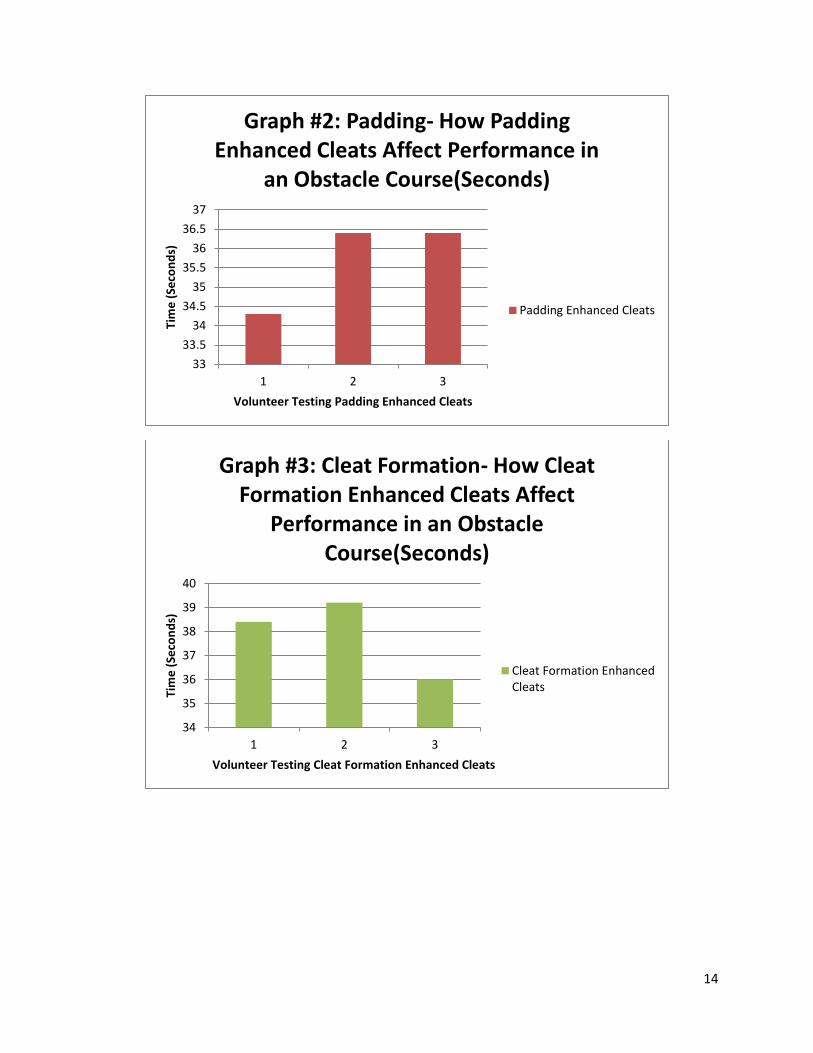
Shell Design- How shell design enhanced soccer cleats affect performance in an obstacle course
(Seconds)
Shell Design Volunteer 1 Volunteer 2 Volunteer 3
Trial 1 39.0 32.9 46.1
Trial 2 35.3 33.7 38.6
Trial 3 33.8 31.9 39.4
Trial 4 33.5 34.2 36.2
Trial 5 33.6 35.6 38.0

12
Average 35.0 33.7 39.5
Table #5
Grip- How grip enhanced soccer cleats affect performance in an obstacle course (Seconds)
Grip Volunteer 1 Volunteer 2 Volunteer 3
Trial 1 35.1 35.5 39.1
Trial 2 34.3 33.8 35.6
Trial 3 33.2 38.7 34.2
Trial 4 29.2 39.3 34.0
Trial 5 35.0 39.4 33.9
Average 33.4 37.3 35.4
Table #6
Support- How support enhanced soccer cleats affect performance in an obstacle course
(Seconds)
Support Volunteer 1 Volunteer 2 Volunteer 3
Trial 1 39.1 40.3 43.2
Trial 2 33.9 37.0 37.1
Trial 3 35.2 37.4 35.4
Trial 4 31.5 40.6 36.7
Trial 5 31.6 41.8 37.2
Average 34.3 39.4 37.9
Table #7
How the design of a soccer cleat affects performance in an obstacle course over three
volunteers (Seconds)
Design of Soccer Cleats
Volunteer 1 Volunteer 2 Volunteer 3
13
Basic Running Shoes 43.6 44.7 43.4
Padding 34.3 36.4 36.4
Cleat Formation 38.4 39.2 36.0
Shell Design 35.0 33.7 39.5
Grip 33.4 37.3 35.4
Support 34.3 39.4 37.9
Table #8
How the design of a soccer cleat affects performance in an obstacle course average (Seconds)
Design of Soccer Cleats
Basic Running Shoes
Padding Cleat Formation
Shell Design
Grip Support
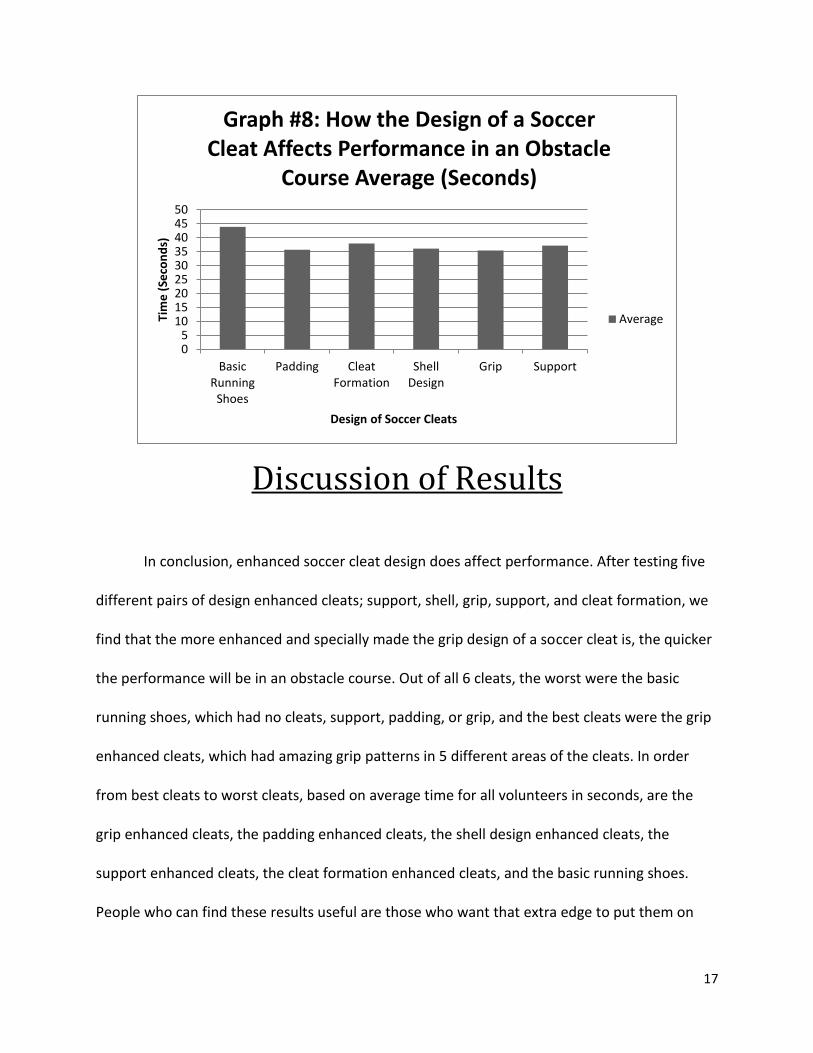
Average 43.9 35.7 37.9 36.1 35.4 37.2
Graphs:
42.5
43
43.5
44
44.5
45
1 2 3
Tim
e (
Seco
nd
s)
Volunteer Testing Basic Running Shoes
Graph #1: Control Test- How Basic Running Shoes Affect Performance in an
Obstacle Course (Seconds)
Basic Running Shoes
14
33
33.5
34
34.5
35
35.5
36
36.5
37
1 2 3
Tim
e (
Seco
nd
s)
Volunteer Testing Padding Enhanced Cleats
Graph #2: Padding- How Padding Enhanced Cleats Affect Performance in
an Obstacle Course(Seconds)
Padding Enhanced Cleats
34
35
36
37
38
39
40
1 2 3
Tim
e (
Seco
nd
s)
Volunteer Testing Cleat Formation Enhanced Cleats
Graph #3: Cleat Formation- How Cleat Formation Enhanced Cleats Affect
Performance in an Obstacle Course(Seconds)
Cleat Formation EnhancedCleats
15
30
31
32
33
34
35
36
37
38
39
40
1 2 3
Tim
e (
Seco
nd
s)
Volunteer Testing Shell Design Enhanced Cleats
Graph #4: Shell Design- How Shell Design Enhanced Cleats Affect Performance in
an Obstacle Course (Seconds)
Shell Design Enhanced Cleats
31
32
33
34
35
36
37
38
1 2 3
Tim
e (
Seco
nd
s)
Volunteer Testing Grip Enhanced Cleats
Graph #5: Grip- How Grip Enhanced Cleats Affect Performance in an Obstacle
Course (Seconds)
Grip Enhanced Cleats

16
31
32
33
34
35
36
37
38
39
40
1 2 3
Tim
e (
Seco
nd
s)
Volunteer Testing Support Enhanced Cleats
Graph #6: Support- How Support Enhanced Cleats Affect Performance in
an Obstacle Course (Seconds)
Support Enhanced Cleats
05
101520253035404550
BasicRunning
Shoes
Padding CleatFormation
ShellDesign
Grip Support
Tim
e (
Seco
nd
s)
Design of Soccer Cleats
Graph #7: How the Design of a Soccer Cleat Affects Performance in an Obstacle Course over Three Volunteers (Seconds)
Volunteer 1
Volunteer 2
Volunteer 3
17
Discussion of Results
In conclusion, enhanced soccer cleat design does affect performance. After testing five
different pairs of design enhanced cleats; support, shell, grip, support, and cleat formation, we
find that the more enhanced and specially made the grip design of a soccer cleat is, the quicker
the performance will be in an obstacle course. Out of all 6 cleats, the worst were the basic
running shoes, which had no cleats, support, padding, or grip, and the best cleats were the grip
enhanced cleats, which had amazing grip patterns in 5 different areas of the cleats. In order
from best cleats to worst cleats, based on average time for all volunteers in seconds, are the
grip enhanced cleats, the padding enhanced cleats, the shell design enhanced cleats, the
support enhanced cleats, the cleat formation enhanced cleats, and the basic running shoes.
People who can find these results useful are those who want that extra edge to put them on
05
101520253035404550
BasicRunning
Shoes
Padding CleatFormation
ShellDesign
Grip Support
Tim
e (
Seco
nd
s)
Design of Soccer Cleats
Graph #8: How the Design of a Soccer Cleat Affects Performance in an Obstacle
Course Average (Seconds)
Average

18
top of their game. During game time, that extra split second can be the difference between win
and loss, and it’s critical to always be on top of the game. The design of a soccer cleat does
affect player’s performance. Using cleats that are proven in the experiment to be harmful to a
player’s performance should not be used, and now soccer enthusiasts know that the best cleat
to look for to have the best step on the field are grip enhanced cleats.
In summary, the experiment was held to answer the question: how does the design of
the soccer cleat affect performance in an obstacle course. To find which cleat design was the
best, and to compare results of each cleat design, 5 pairs of soccer cleats: the grip enhanced
cleats, the padding enhanced cleats, the shell design enhanced cleats, the support enhanced
cleats, the cleat formation enhanced cleats, and once pair of basic running shoes, were tested
in an obstacle course which included speed with and without a ball. Three volunteers, all from
Deep Run Charge soccer team tested each pair of cleats 5 times and time was recorded in
seconds. The experiment contained human error, which involved stumbling or tripping while
performing in the course. The experiment could’ve been improved if there were more
volunteers and more pairs of cleats to test, and if it was held in the summer/spring, not winter.
Also, the cleats could’ve been put to the test more if there was a more elaborate obstacle
course.
The experiment did prove the original hypothesis. The hypothesis was: If the shell
material padding, cleat formation, grip, and support of a soccer cleat is enhanced and tested,
then time in an obstacle course will be quicker. The data showed that even the least improved
enhanced cleat was +6 seconds quicker than the basic running shoe, and the quickest cleat was
+8.5 seconds faster than the basic running shoe. Each cleat design had improved the
19
performance in each volunteer, and it became faster as the cleat became more enhanced. For
example, the quickest cleat; the grip enhanced cleats with an average speed of 35.4 seconds;
were also the most modified- or enhanced- cleats of the group. As the cleats became less
enhanced, such as the support enhanced cleats with 37.2 seconds, cleat formation enhanced
cleats with 37.9 seconds, and basic running shoes with 43.9 seconds, it took longer for the
participant to run the course. In conclusion, the general trend shown was the more enhanced
the design of the soccer cleat, the better the performance was. This trend is a mirror image of
the hypothesis, and draws the same conclusion: when the design of a soccer cleat is enhanced,
then the time in an obstacle course is quicker.
The reason why the design enhanced cleats performed better in an obstacle course then
the non- design enhanced cleats is because of each cleats special design. For example; the basic
running shoes did so poorly in the obstacle course, with an average of 43.9 seconds, because it
does not have the proper design; these shoes did not have cleats, which are essential for
working in long grass, and also for ball handling. They also had no padding or support, which
made it hard for the volunteers to run easily and work with the ball. Finally, these cleats had no
special shell material, and absolutely no grip, which made it near ‘impossible’ for the volunteers
to get a good grip on the ball and have good control when running the obstacle course. Time
added up as each of these faults took its toll when the players went. Moving up the results from
worst to best, the cleat formation enhanced soccer cleats came in second to last with an
average speed of 35.7 seconds. Due to the newer and more enhanced cleats, set in a new
formation, the volunteers were able to cut through the grass with ease, improving their time by
several seconds. However, this cleat still did poorly because it lacked grip and support, making
20
it still difficult to fully control the ball, and letting the volunteers move freely. In 4th place, are
the support enhanced cleats with an average of 37.2 seconds. This cleat averaged higher than
the past two cleats because they had amazing support in the ankle, arch, heel, and forefoot.
This led to great stability which allowed each volunteer to have a stable control on the ball.
Once again, we see that this cleat still is slower than many others, due to the lack of grip on the
cleats, which again doesn’t allow for a better grip on the ball. In third place, the shell design
cleats with an average of 36.1 seconds. These cleats did so well because they have a completely
smooth surface, with no laces, allowing for full accessibility of the foot. However, because there
are no laces on these cleats, the cleats were very stiff, and the volunteers were unable to have
good flexibility in them while performing. In second place are the padding enhanced cleats with
an average of 35.7 seconds. These cleats did very well compared to other cleats because the
proper padding removed pressure from all areas of the foot, and also had decent grip on the
outside, allowing for comfort while performing as well as moderate grip on the ball. This cleat
came just 0.3 seconds shy of first place because it did not have specific grip like the first place
cleats do. Finally, we have the best cleats, the grip enhanced cleats with an average of 35.4
seconds. These cleats did the best out of all the cleats because they have amazing grip. These
cleats have 5 specific lethal zones located in different areas of the cleat that provide superior
grip while performing. Each grip is specially designed for position, it isn’t just normal grip. Over
all, the specialized grip is definitely what put these cleats on top.
21
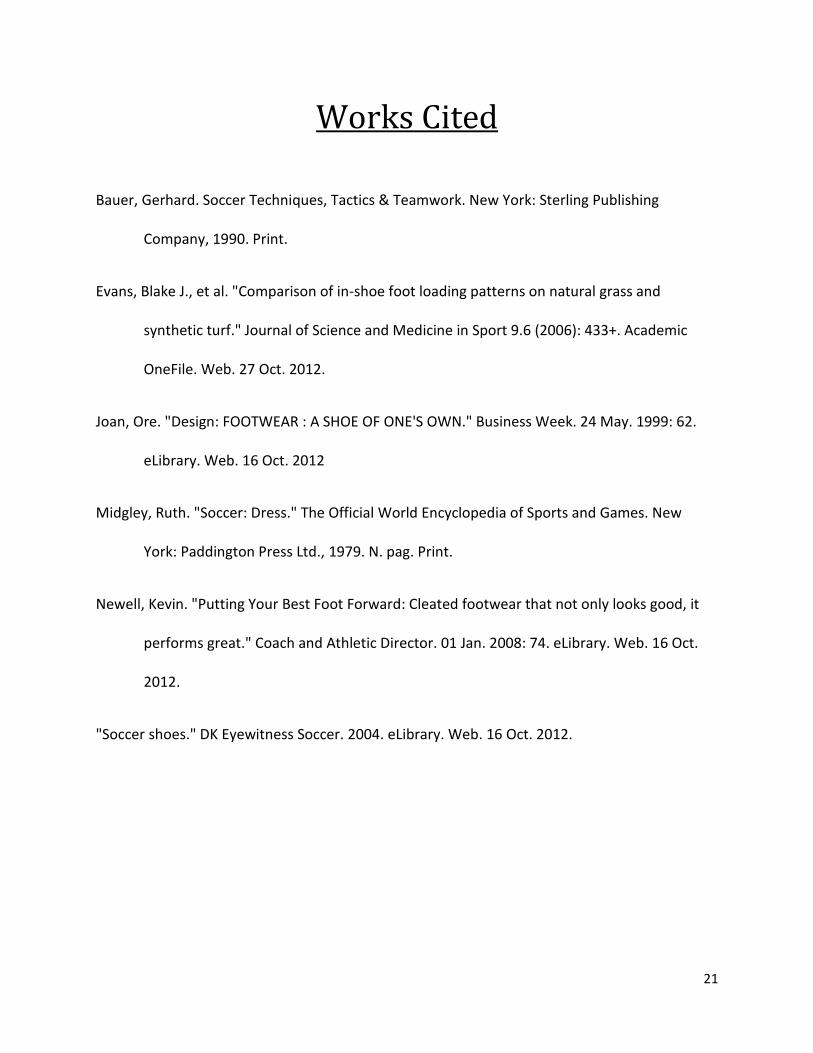
Works Cited
Bauer, Gerhard. Soccer Techniques, Tactics & Teamwork. New York: Sterling Publishing
Company, 1990. Print.
Evans, Blake J., et al. "Comparison of in-shoe foot loading patterns on natural grass and
synthetic turf." Journal of Science and Medicine in Sport 9.6 (2006): 433+. Academic
OneFile. Web. 27 Oct. 2012.
Joan, Ore. "Design: FOOTWEAR : A SHOE OF ONE'S OWN." Business Week. 24 May. 1999: 62.
eLibrary. Web. 16 Oct. 2012
Midgley, Ruth. "Soccer: Dress." The Official World Encyclopedia of Sports and Games. New
York: Paddington Press Ltd., 1979. N. pag. Print.
Newell, Kevin. "Putting Your Best Foot Forward: Cleated footwear that not only looks good, it
performs great." Coach and Athletic Director. 01 Jan. 2008: 74. eLibrary. Web. 16 Oct.
2012.
"Soccer shoes." DK Eyewitness Soccer. 2004. eLibrary. Web. 16 Oct. 2012.
Related Documents