UBS Investment Research Tectonic Economics What is the new normal? Quantifying normal The ‘new normal’ has become an established economic concept, reflecting the widely-shared view that global growth and asset returns will be lower for an extended period of time relative to the history preceding the financial crisis. However, there have been few studies that have tried to quantify the ‘new normal’. This note fills that gap. New global trend growth is 3%, not 4% Our model-based estimates suggest that global growth will average 3% over the next decade, about a percentage point slower than in the previous decade. This outcome is both supply- and demand-side driven. Weaker trend growth will be the by-product of slower world population growth and ageing workforces. But it is also the result of continued de-leveraging and weaker productivity growth in many developed economies. Tighter financial market regulation and the associated impact on the cost of capital may also restrain potential output growth. Market divergence In some ways the ‘new normal’ won’t be so new—divergent trend growth between emerging and advanced economies will endure. Emerging Asia and the Middle East are likely to be the fastest growing regions of the world economy over the next ten years. India, China, and Vietnam enjoy the best longer-term growth prospects in Asia, while Qatar, Egypt and Saudi Arabia lead the pack in the Middle East. Still, Asia will slow somewhat in the next decade, whereas the Middle East has the potential to accelerate. Latin America may also do better in the coming decade. The risks Of course, nothing is assured. Downside risks range from the possibility of more severe sovereign debt crises, heighted protectionism, more restrictive financial market regulation, or a hard landing in China. On the other hand, to the extent that advanced economies undertake structural adjustments to mitigate the impact of ageing populations or boost investment in productivity-enhancing endeavours, faster trend growth relative to our base case is possible. Implications Overall, our estimates suggest that consensus forecasts for trend growth are too high. If investors have to adjust downward trend earnings estimates, valuation multiples are unlikely to expand, even from relatively compressed levels. Finally, on our numbers for trend growth in developed economies, long-bond yields of around 3% do not look particularly out of step. Global Economics Research Global Singapore 3 September 2010 www.ubs.com/economics Andrew Cates Economist [email protected] +65 64952584 Larry Hatheway Economist [email protected] +44-20-7568 4053 This report has been prepared by UBS Limited ANALYST CERTIFICATION AND REQUIRED DISCLOSURES BEGIN ON PAGE 26. ab

What is the New Normal
Mar 11, 2016
Study by UBS n the shape of global growth in th light of the crisis
Welcome message from author
This document is posted to help you gain knowledge. Please leave a comment to let me know what you think about it! Share it to your friends and learn new things together.
Transcript

UBS Investment Research
Tectonic Economics
What is the new normal?
Quantifying normal The ‘new normal’ has become an established economic concept, reflecting thewidely-shared view that global growth and asset returns will be lower for an extended period of time relative to the history preceding the financial crisis.However, there have been few studies that have tried to quantify the ‘new normal’.This note fills that gap.
New global trend growth is 3%, not 4% Our model-based estimates suggest that global growth will average 3% over thenext decade, about a percentage point slower than in the previous decade. Thisoutcome is both supply- and demand-side driven. Weaker trend growth will be theby-product of slower world population growth and ageing workforces. But it isalso the result of continued de-leveraging and weaker productivity growth in manydeveloped economies. Tighter financial market regulation and the associatedimpact on the cost of capital may also restrain potential output growth.
Market divergence In some ways the ‘new normal’ won’t be so new—divergent trend growth between emerging and advanced economies will endure. Emerging Asia and the MiddleEast are likely to be the fastest growing regions of the world economy over the next ten years. India, China, and Vietnam enjoy the best longer-term growth prospects in Asia, while Qatar, Egypt and Saudi Arabia lead the pack in the MiddleEast. Still, Asia will slow somewhat in the next decade, whereas the Middle East has the potential to accelerate. Latin America may also do better in the comingdecade.
The risks Of course, nothing is assured. Downside risks range from the possibility of moresevere sovereign debt crises, heighted protectionism, more restrictive financial market regulation, or a hard landing in China. On the other hand, to the extent thatadvanced economies undertake structural adjustments to mitigate the impact ofageing populations or boost investment in productivity-enhancing endeavours, faster trend growth relative to our base case is possible.
Implications Overall, our estimates suggest that consensus forecasts for trend growth are toohigh. If investors have to adjust downward trend earnings estimates, valuationmultiples are unlikely to expand, even from relatively compressed levels. Finally,on our numbers for trend growth in developed economies, long-bond yields of around 3% do not look particularly out of step.
Global Economics Research
Global
Singapore
3 September 2010
www.ubs.com/economics
Andrew Cates
+65 64952584
Larry HathewayEconomist
[email protected]+44-20-7568 4053
This report has been prepared by UBS Limited ANALYST CERTIFICATION AND REQUIRED DISCLOSURES BEGIN ON PAGE 26.
ab
Tectonic Economics 3 September 2010
UBS 2
What is the new normal? There is much discussion at present about the ‘new normal’, reflecting the widely-shared view that global growth and asset returns will be weaker for considerably longer relative to the ‘norms’ experienced in the years leading up to the financial crisis. However, there have been few studies that have tried to quantify the ‘new normal’. This note is our attempt to fill that gap.
Specifically, we build on our earlier work that quantified probable trend global growth. We extend that work to include more recent data and some adjustments to our models. In addition, we have extended our analysis to include economies in the Middle East and sub-Sahara Africa. Finally we deploy our revised model for scenario analysis to address key issues and risks confronting the world economy.
The key conclusions are as follows:
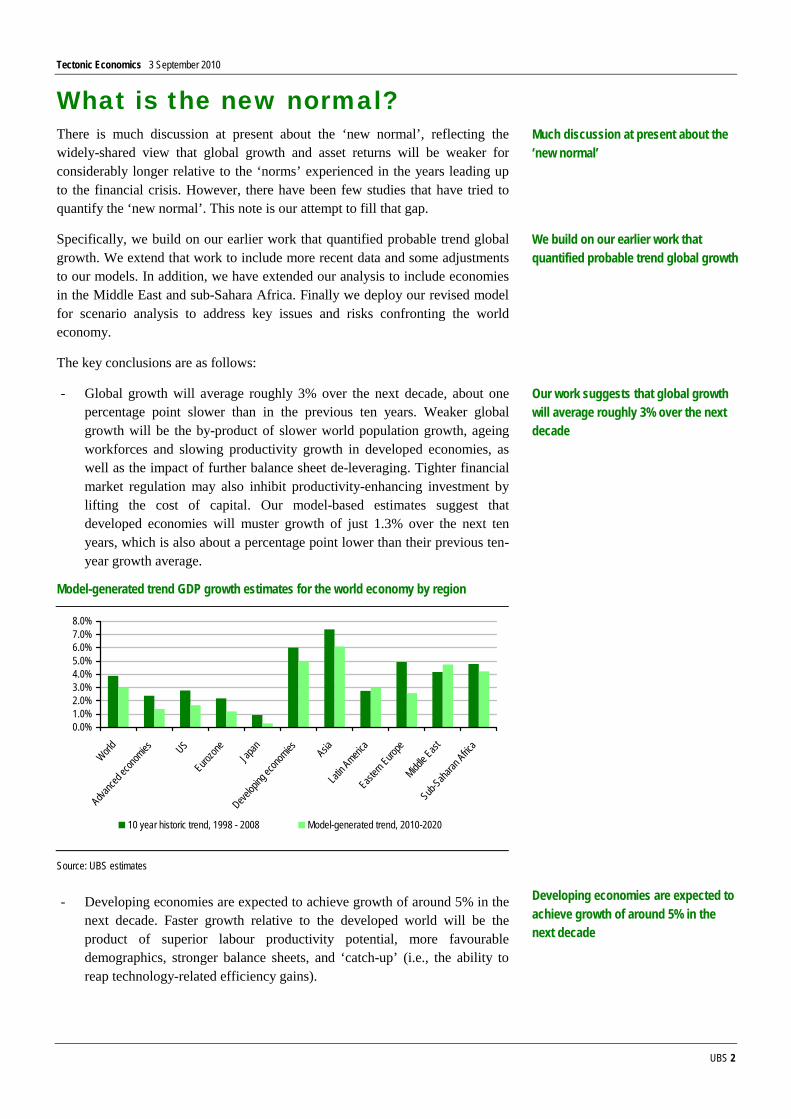
- Global growth will average roughly 3% over the next decade, about one percentage point slower than in the previous ten years. Weaker global growth will be the by-product of slower world population growth, ageing workforces and slowing productivity growth in developed economies, as well as the impact of further balance sheet de-leveraging. Tighter financial market regulation may also inhibit productivity-enhancing investment by lifting the cost of capital. Our model-based estimates suggest that developed economies will muster growth of just 1.3% over the next ten years, which is also about a percentage point lower than their previous ten-year growth average.
Model-generated trend GDP growth estimates for the world economy by region
0.0%1.0%2.0%3.0%4.0%5.0%6.0%7.0%8.0%
WorldAdva
nced e
conom
ies USEuro
zone
Japan
Develop
ing ec
onomies Asia
Latin A
merica
Eastern
Europe
Middle E
astSub-
Saharan
Africa
10 year historic trend, 1998 - 2008 Model-generated trend, 2010-2020
Source: UBS estimates
- Developing economies are expected to achieve growth of around 5% in the next decade. Faster growth relative to the developed world will be the product of superior labour productivity potential, more favourable demographics, stronger balance sheets, and ‘catch-up’ (i.e., the ability to reap technology-related efficiency gains).
Much discussion at present about the ‘new normal’
We build on our earlier work that quantified probable trend global growth
Our work suggests that global growth will average roughly 3% over the next decade
Developing economies are expected to achieve growth of around 5% in the next decade

Tectonic Economics 3 September 2010
UBS 3
- Asia and the Middle East will be the fastest growing regions of the world economy over the next decade. Within Asia, India, China, and Vietnam are likely to enjoy the best longer-term growth prospects. Qatar, Egypt and Saudi Arabia will lead the pack in the Middle East. Nevertheless, Asia will slow in the coming ten years compared with the previous decade, unlike the Middle East which may accelerate (conditional on stable-to-higher oil prices). Latin America is another region that may do better, notwithstanding a weaker outlook in some of its principal export markets (e.g., to the US).
- Downside risks include the possibility of more severe sovereign debt crises, greater protectionism, more restrictive financial market regulation, or a hard landing in China. If advanced economies can tackle structural labour market issues, including demographic challenges, and can boost productivity-enhancing investment, they may do better than we envisage in our central case.
- Consensus long-term forecasts—where available—appear too high relative to our conclusions. If investors have to ratchet down earnings expectations, equity multiples are unlikely to expand even from already low levels. And if policy makers over-estimate trend growth, they may make errors as well. Structural budget deficits are likely to be larger. And central banks may underestimate longer-term inflation risk.
In the sections that follow we explore the evidence behind our conclusions. We then present in greater detail our empirical analysis and move on with some scenario and risk analysis. We conclude with some implications for financial markets.
Demographics One of the critical factors that will shape the ‘new normal’ is demographics. Global population growth will slow. That, alone, is not new. World population growth has been slowing since the mid-1960s (see first chart below). Rather, the new development is the ageing of the global workforce, particularly in developed economies. Insofar as ageing populations and rising dependency ratios restrain growth of labour supply, they result in slower rates of economic growth (see second chart below).
Asia and the Middle East will be the fastest growing regions of the world economy over the next decade
Downside risks include the possibility of more severe sovereign debt crises, greater protectionism, more restrictive financial market regulation, or a hard landing in China
Consensus long-term forecasts—where available—appear too high relative to our conclusions
One of the critical factors that will shape the ‘new normal’ is demographics

Tectonic Economics 3 September 2010
UBS 4
Global population growth
0
0.5
1
1.5
2
2.5
1951
1955
1959
1963
1967
1971
1975
1979
1983
1987
1991
1995
1999
2003
2007
2011
2015
2019
2023
2027
Total world population growth Total working age population growth
Source: United Nations
Change in dependency ratio versus GDP growth
VIE
VENURG
UAE
UKR
SRI
SVN
SAU
QAT
PER
PAR
PAK
NGA
MOR
MCDLTU LAT
KEN
KAZ
ISR
EST
EGY
ECUCOL
CAM
ALGALB
TUR
THA
TWN
SAFSVK
SGP
RUSROU
POL PHP
MEX
MALKORIDN
IND
HUN
HK
CZE
CRO
CHN
CHL
BUL
BRA
ARG
USUK
SWISWE
ESPPORNOR
NZ
NLD
JPN
ITA
IRL
ISL GRC
GERFRAFIN
DNK
CANBEL
AUT
AUS
-2.0%
0.0%
2.0%
4.0%
6.0%
8.0%
10.0%
-3.5%
-3.0%
-2.5%
-2.0%
-1.5%
-1.0%
-0.5% 0.0
%
0.5%
1.0%
1.5%
Change in dependency ratio (%YoY, 1989-2009)
Real
GDP
grow
th (%
YoY
1989
-200
9)
Source: UBS/Haver/United Nations/IMF
Balance sheets The second factor restraining global growth is balance sheet repair. High levels of public and private sector indebtedness in many developed economies (and several developing economies) suggests continued de-leveraging efforts, which will act as an impediment to public and private sector spending relative to the ‘norms’ of recent decades. Quantifying the degree of deleveraging is problematic, but we suspect that the process will run for considerably longer insofar as current measures of leverage in the developed economies remain high relative to long-term averages.
The next factor restraining global growth is balance sheet repair

Tectonic Economics 3 September 2010
UBS 5
UBS financial risk index, 2009
Total financial risk index, 2009
0123456789
China
Hong
Kon
gSi
ngap
ore
Thail
and
Malay
siaPh
ilippin
esMe
xico
Taiw
anEg
ypt
Qatar
Arge
ntina
Chile
Peru
Saud
iInd
ones
iaVe
nezu
elaPa
kistan
Nige
riaCz
ech
Japa
nSl
ovak
Russ
iaInd
iaCo
lombia UA
EMo
rocc
oTu
rkey
Sri L
anka
S.Af
rica
Croa
tiaBr
azil
Polan
dKa
zakh
stan
Austr
alia
Austr
iaVi
etnam
Germ
any
Israe
lNZ
Kore
aNo
rway US
Cana
daFin
land
Nethe
rland
sBu
lgaria
Switz
erlan
dFr
ance
Swed
enRo
mania
Hung
ary
UKUk
raine
Lithu
ania
Italy
Eston
iaDe
nmar
kBe
lgium
Slov
enia
Portu
gal
Latvi
aSp
ainGr
eece
Irelan
d
Source: UBS calculations. The UBS financial risk index is a measure of the relative domestic financial fragility of an economy and is based on several macro-prudential risk indicators, including the private sector credit to GDP ratio, the banking sector’s loan to deposit ratio, and the public sector debt to GDP ratio. A higher level for the index indicates higher leverage and greater financial risk.
To some extent, however, de-leveraging in the advanced economies will be offset by re-leveraging in much of the developing economy bloc where the starting position for domestic balance sheets is healthier. That may boost private consumption and investment, but also offers policymakers greater leeway to offset the impact of diminished export growth potential on their economies via looser monetary and fiscal policies.
Change in financial risk index versus GDP growth
US UK
SWISWE
ESP
POR
NOR
NZNLD
JPNITA
IRL
GRC
GER
FRA
FIN
DNK
CAN
BEL
AUT
AUS
0.0%
1.0%
2.0%
3.0%
4.0%
5.0%
6.0%
7.0%
-2 -1 0 1 2 3 4 5 6 7 8
Change in financial risk index (2008 vs 1997)
Real
GDP
grow
th (%
YoY
1998
-200
8)
Source: UBS/Haver/IMF.
To some extent de-leveraging in the advanced economies will be offset by re-leveraging in much of the developing economy bloc

Tectonic Economics 3 September 2010
UBS 6
Financial risk index versus GDP growth
VIE
VEN
UAE
UKRSRI
SVN
SAU
QAT
PERPAK
NGA
MOR
LTULAT
KAZ
ISR
EST
EGY
COL
TURTHA
TWN
SVKSGP
RUS
ROUPOL
PHP
MEX
MALKOR
IDN
IND
HUNHKCZECRO
CHN
CHL
BUL
BRAARG US UK
SWI
SWE ESP
PORNORNZ NLD
JPN ITA
IRL
ISLGRC
GERFRA
FIN
DNK
CAN
BELAUT
AUS
0.0%
2.0%
4.0%
6.0%
8.0%
10.0%
12.0%0.0 1.0 2.0 3.0 4.0 5.0 6.0 7.0 8.0
Financial risk index, 1997
Real
GDP
grow
th (%
YoY
1998
-200
8)
Source: UBS/Haver/IMF
Investment and productivity The next factor is investment activity, or capital accumulation. Additions to the quality of the capital stock are arguably the single most important driver of trend growth in the world economy. For economies at the ‘cutting edge’ of technology, this is the primary determinant of supply-side led growth. But another key issue is the proclivity of developing economies to continue “catching-up” with the developed world, as they apply ever more and higher quality capital to boost comparatively low labour productivity. Many Asian economies, most notably China, have been very successful in reaping productivity gains from investment, but it seems probable that the rate of growth is likely to slow somewhat. Many Latin American and several East European economies, on the other hand, have been less able to match China’s productivity growth, perhaps because of less-sound balance sheets or a less-conducive macroeconomic environment for investment. That may be changing—the environment in Latin America, for example, appears more conducive to capital investment.
The next factor that will shape the new normal is investment activity, or capital accumulation

Tectonic Economics 3 September 2010
UBS 7
Gross domestic investment rate versus GDP per capita growth
VIE
VEN
URG
UAE
UKR
SRI
SVN
SAU QAT
PER
PAR
PAKMOR
MCD
LTULAT
KEN
KAZISR
ESTEGY
ECUCOL
CAM
ALG
ALB
TUR
THATWN
SAF
SVK
SGP
RUSROU
POL
PHP
MEX
MAL
KOR
IDN
IND
HUN
HK
CZE
CRO
CHN
CHL
BUL
BRA
ARG
USUK
SWISWE
ESPPOR
NOR
NZ
NLD
JPN
ITA
IRL
ISL
GRC
GERFRA
FIN
DNKCAN
BEL
AUTAUS
-1.0%
0.0%
1.0%
2.0%
3.0%
4.0%
5.0%
6.0%
7.0%
8.0%
9.0%13
.0%
18.0%
23.0%
28.0%
33.0%
38.0%
Investment to GDP ratio (%, 1988-2008)
Real
GDP
per c
apita
gro
wth
(%Yo
Y, 19
88-2
008)
Source: UBS/IMF/Haver
Relative real GDP per capita (versus US in 1988) versus subsequent real GDP per capita growth
TUR
THA TWN
SAF
SVK
SGP
RUS
ROU
POL
PHP MEX
MAL
KOR
IDN
IND
HUN
HK
CZECRO
CHN
CHL
BUL
BRA
ARG USUK
SWI
SWE
ESPPOR NOR
NZ
NLD
JPNITA
IRL
ISL
GRC
GERFRA
FIN
DNK
CANBELAUTAUS
0.0%
1.0%
2.0%
3.0%
4.0%
5.0%
6.0%
7.0%
8.0%
9.0%
-10.0
%
10.0%
30.0%
50.0%
70.0%
90.0%
110.0
%
130.0
%
Relative real GDP per capita (%, 1988)
Real
GDP
per c
apita
gro
wth
(%Yo
Y, 19
88-2
008)
Source: UBS/Haver/IMF
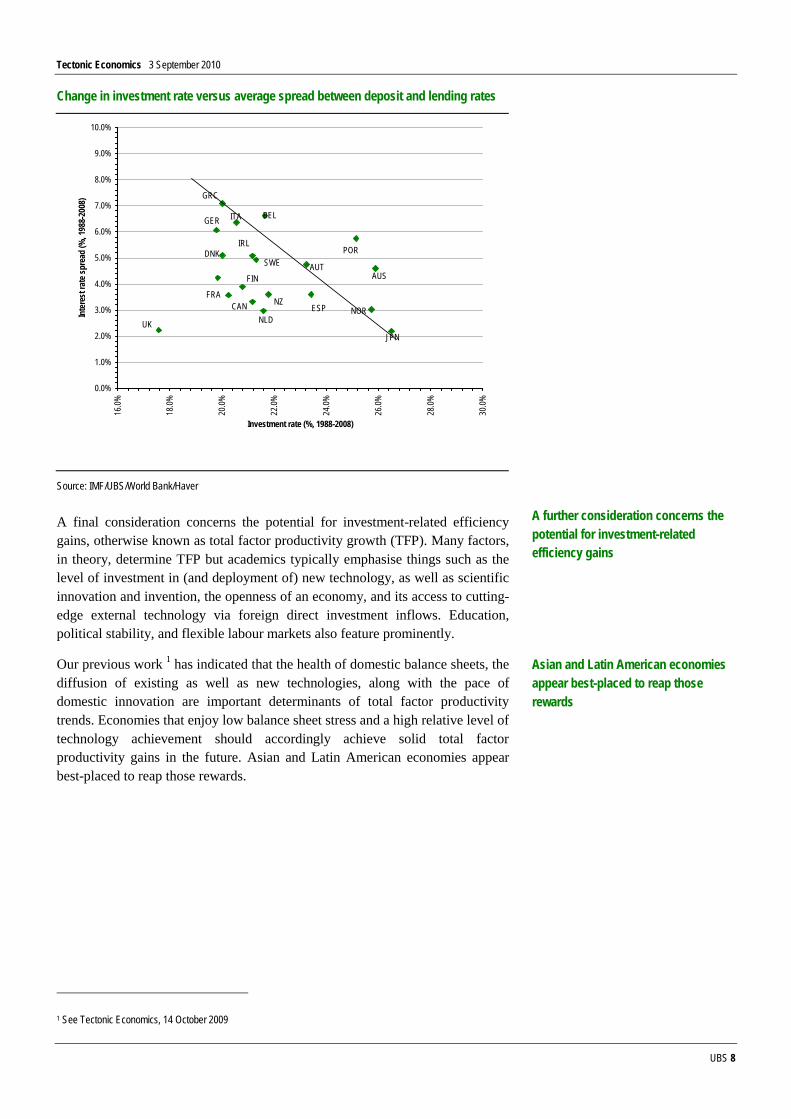
The risk, however, is that overly stringent financial market regulation may raise the cost of capital and choke off marginal investment in productivity-enhancing endeavours. Presently, that would appear to be a greater risk in advanced economies, but the matters nevertheless bears close monitoring.
Tectonic Economics 3 September 2010
UBS 8
Change in investment rate versus average spread between deposit and lending rates
UK
SWE
ESP
POR
NORNZ
NLD
JPN
ITA
IRL
GRC
GER
FRA
FIN
DNK
CAN
BEL
AUTAUS
0.0%
1.0%
2.0%
3.0%
4.0%
5.0%
6.0%
7.0%
8.0%
9.0%
10.0%16
.0%
18.0%
20.0%
22.0%
24.0%
26.0%
28.0%
30.0%
Investment rate (%, 1988-2008)
Inte
rest
rate
spre
ad (%
, 198
8-20
08)
Source: IMF/UBS/World Bank/Haver
A final consideration concerns the potential for investment-related efficiency gains, otherwise known as total factor productivity growth (TFP). Many factors, in theory, determine TFP but academics typically emphasise things such as the level of investment in (and deployment of) new technology, as well as scientific innovation and invention, the openness of an economy, and its access to cutting-edge external technology via foreign direct investment inflows. Education, political stability, and flexible labour markets also feature prominently.
Our previous work 1 has indicated that the health of domestic balance sheets, the diffusion of existing as well as new technologies, along with the pace of domestic innovation are important determinants of total factor productivity trends. Economies that enjoy low balance sheet stress and a high relative level of technology achievement should accordingly achieve solid total factor productivity gains in the future. Asian and Latin American economies appear best-placed to reap those rewards.
1 See Tectonic Economics, 14 October 2009
A further consideration concerns the potential for investment-related efficiency gains
Asian and Latin American economies appear best-placed to reap those rewards

Tectonic Economics 3 September 2010
UBS 9
Average change in balance sheet stress index versus total factor productivity growth
US
UK
TUR
THA
SWE
ESP
SGP
SAFRUS
POR
PHP
NZ
NOR
NLDMEX
MAL
KOR
ITA
IDN
IND
GRCGERFRA
FIN
DNK
CHN
CHL
CAN
BEL
AUT
AUS
ARG
-1.0%
0.0%
1.0%
2.0%
3.0%
4.0%
5.0%-2
0% 30%
80%
130%
180%
230%
Average change in balance sheet stress
Tota
l fac
tor p
rodu
ctivi
ty g
rowt
h (%
YoY,
1988
-200
7)
Source: UBS. The average change in balance sheet stress is measured by the average change in the current account to GDP ratio, the budget balance to GDP ratio and the private credit to GDP ratio with the sign on the current account reversed.
UBS Technology Achievement index versus total factor productivity growth
US
UK
TUR
THA
SWE
ESP
SGP
SAFRUS
POR
PHP
NZ
NOR
NLDMEX
MAL KOR
JPN ITA
IDN
IND
GRCGER
FRA
FIN
DNK
CHN
CHL
CAN
BRABEL
AUT
AUS
ARG
-1.0%
0.0%
1.0%
2.0%
3.0%
4.0%
5.0%
3% 4% 4% 5% 5% 6% 6% 7% 7%
Aggregate UBS technology achievemnt index
Tota
l fact
or p
rodu
ctivi
ty g
rowt
h (%
YoY,
1988
-200
7)
Source: UBS/World Development Index The Technology Achievement index is based on several indicators of scientific innovation, the penetration of recent technology, and the penetration of older technology. The methodology draws from ‘Global Economic Prospects,’ Chapter 2, The World Bank, 2008. Each indicator is indexed to 100 in a base year (1994). The aggregate index is an un-weighted average of the change in each index from 1994 though to 2007.
Tectonic Economics 3 September 2010
UBS 10
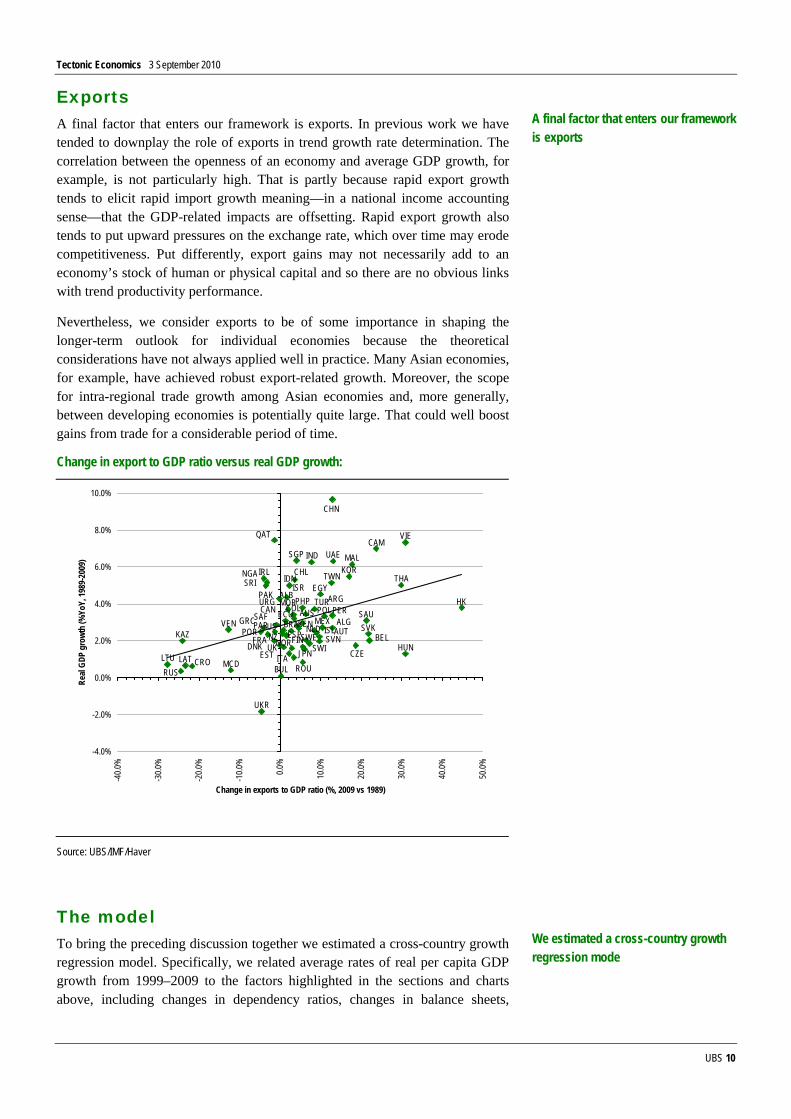
Exports A final factor that enters our framework is exports. In previous work we have tended to downplay the role of exports in trend growth rate determination. The correlation between the openness of an economy and average GDP growth, for example, is not particularly high. That is partly because rapid export growth tends to elicit rapid import growth meaning—in a national income accounting sense—that the GDP-related impacts are offsetting. Rapid export growth also tends to put upward pressures on the exchange rate, which over time may erode competitiveness. Put differently, export gains may not necessarily add to an economy’s stock of human or physical capital and so there are no obvious links with trend productivity performance.
Nevertheless, we consider exports to be of some importance in shaping the longer-term outlook for individual economies because the theoretical considerations have not always applied well in practice. Many Asian economies, for example, have achieved robust export-related growth. Moreover, the scope for intra-regional trade growth among Asian economies and, more generally, between developing economies is potentially quite large. That could well boost gains from trade for a considerable period of time.
Change in export to GDP ratio versus real GDP growth:
VIE
VEN
URG
UAE
UKR
SRI
SVN
SAU
QAT
PERPAR
PAK
NGA
MOR
MCDLTU LAT
KENKAZ
ISR
EST
EGY
ECUCOL
CAM
ALG
ALBTUR
THATWN
SAFSVK
SGP
RUS ROU
POLPHP
MEX
MALKOR
IDN
IND
HUN
HK
CZECRO
CHN
CHL
BUL
BRA
ARG
US
UK SWISWEESPPOR
NORNZNLD
JPNITA
IRL
ISLGRC
FRA FINDNK
CAN
BELAUT
AUS
-4.0%
-2.0%
0.0%
2.0%
4.0%
6.0%
8.0%
10.0%
-40.0
%
-30.0
%
-20.0
%
-10.0
%
0.0%
10.0%
20.0%
30.0%
40.0%
50.0%
Change in exports to GDP ratio (%, 2009 vs 1989)
Real
GDP
grow
th (%
YoY,
1989
-200
9)
Source: UBS/IMF/Haver
The model To bring the preceding discussion together we estimated a cross-country growth regression model. Specifically, we related average rates of real per capita GDP growth from 1999–2009 to the factors highlighted in the sections and charts above, including changes in dependency ratios, changes in balance sheets,
A final factor that enters our framework is exports
We estimated a cross-country growth regression mode

Tectonic Economics 3 September 2010
UBS 11
investment rates, relative per capita GDP levels, and the change in the export-to-GDP ratio. The results are illustrated in the table below.
The cross-country model for trend GDP growth
Regressor Coefficient T-Ratio
Constant -0.018 -1.7
Change in dependency ratio -0.552 -2.6
Relative per capita GDP level -0.008 -1.5
Investment rate 0.197 4.5
Change in financial risk 0.001 1.8
Change in export to GDP ratio 0.008 0.7
R-Squared 0.59
Standard error 0.01
Durbin Watson 1.56
Source: UBS
They indicate that the dispersion of average economic growth rates seen in the world economy in recent decades can be explained pretty well by our chosen variables. The statistical results from the model nevertheless suggest that around 40% of the world economy’s growth performance cannot be explained by those factors. That unexplained residual is in all likelihood the consequence of country-specific factors such as institutional arrangements, policy choice, and national differences in the structure of labour, product and capital markets. Our global modelling approach—by definition—cannot easily capture these national differences. Nevertheless, our approach still allows global consistency in the assessment of economic trend growth patterns.
Model-generated forecasts In this next section we use the model to project trend GDP growth rates based on what we know about demographic profiles, relative incomes, de- or re-leveraging tendencies and capital investment activity.
The demographic aspect is quite straightforward, inasmuch as projections of population growth and dependency ratios are readily available from the United Nations. They suggest that many Asian economies (though not China) and many African and Middle Eastern economies will enjoy a demographic advantage for the foreseeable future. European economies in both the West and the East are poorly placed, particularly relative to the developed economy bloc.
We use the model to project trend GDP growth rates
Many Asian economies and many African and Middle Eastern economies will enjoy a demographic advantage for the foreseeable future

Tectonic Economics 3 September 2010
UBS 12
Population growth
-1%-1%0%1%1%2%2%3%3%
Bulga
riaLit
huan
iaUk
raine
Latvi
aRo
mania
Russ
iaJa
pan
Hung
ary
Croa
tiaGe
rman
yPo
land
Eston
iaMa
cedo
niaPo
rtuga
lSl
ovak
iaIta
lyGr
eece
Denm
ark
Slov
enia
Czec
hAu
stria
Kore
aFin
land
NLD
Belgi
umUr
ugua
ySw
itzFr
ance
Swed
enS.
Afric
aTh
ailan
d UKAl
bania
China
Taiw
anKa
zakh
staSr
i Lan
kaBr
azil
Norw
aySp
ainMe
xico NZ HK
Chile
ARG US
Sing
apor
eCa
nada
Indon
esia
Austr
alia
Vietn
amTu
rkey
Peru
Ecua
dor
Moro
cco
Irelan
dInd
iaCo
lombia
Icelan
dIsr
ael
Alge
riaMa
laysia
Vene
zuela
Para
guay
Egyp
tPH
PCa
mbod
iaSa
udi
Unite
dQa
tarNi
geria
Pakis
tanKe
nya
Population growth, 2010-2020
Source: UBS/Haver/United Nations
Change in dependency ratio, 2010 – 2020
-2.0%-1.5%-1.0%-0.5%0.0%0.5%1.0%1.5%2.0%2.5%3.0%
Saud
i Ara
biaBr
azil
India
Mexic
oNi
geria
Para
guay
Vietn
amInd
ones
iaPa
kistan
Ecua
dor
Peru
PHP
Camb
odia
Turke
yMa
laysia
Keny
aEg
ypt
Unite
d Ara
bCo
lombia
Vene
zuela
Urug
uay
Moro
cco
ARG
S.Af
rica
Alba
niaIsr
ael
Alge
riaCh
ileQa
tarMa
cedo
niaTh
ailan
dKo
rea
Portu
gal
Austr
iaGe
rman
yIce
land
Lithu
ania
Norw
ayRo
mania Ita
ly UK NZGr
eece
Denm
ark
Irelan
dCh
ina USSp
ainSw
itzKa
zakh
stan
Croa
tiaAu
strali
aBe
lgium NL
DFr
ance
Sri L
anka
Hung
ary
Latvi
aUk
raine
Swed
enCa
nada
Slov
akia
Bulga
riaSi
ngap
ore
Russ
iaPo
land
Japa
nEs
tonia
Slov
enia
Finlan
d HKCz
ech
Change in dependency ratio (%YoY, 2010-2020)
Older populations
Younger populations
Source: UBS/Haver/United Nations
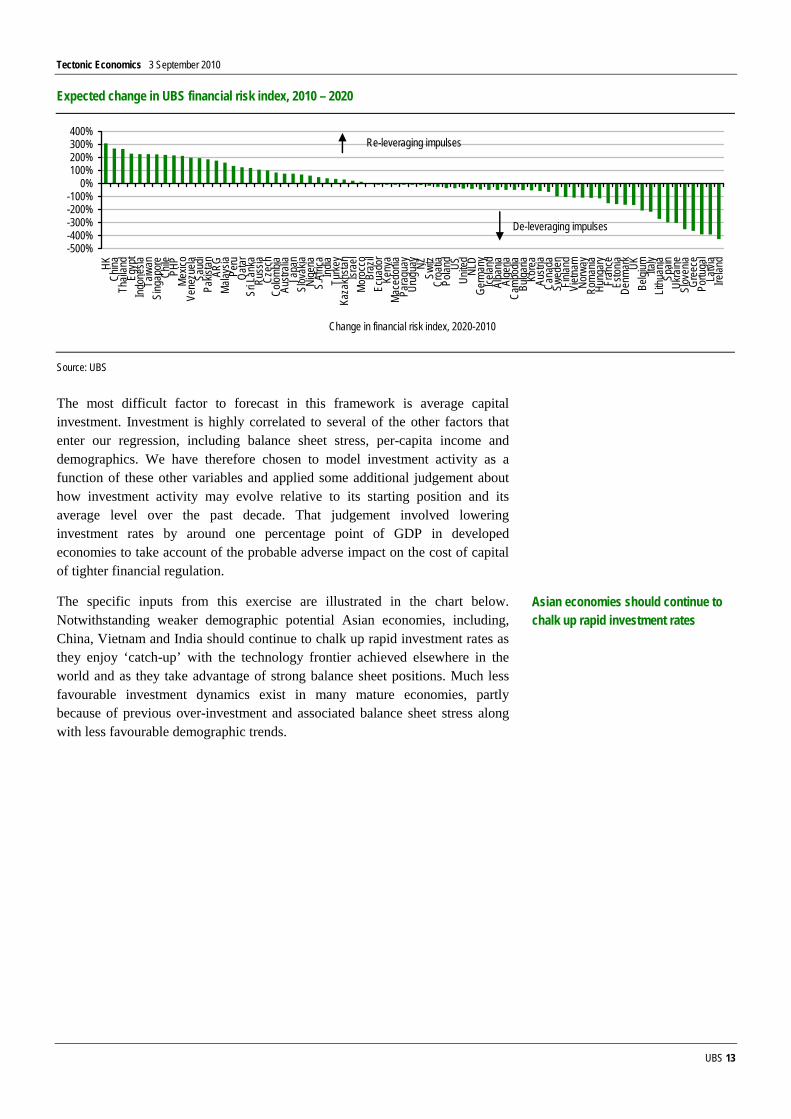
The inputs into our forecasting exercise for leverage and financial risk are illustrated in the chart below. We assume that highly stressed economies will continue de-leveraging their balance sheets in the coming years and by a sufficient margin that returns their financial risk index to the level that existed in 1997. Conversely, we assume that low-stress economies in the developing world will re-leverage their balance sheets in the period ahead, and thereby assist in some re-balancing of the world economy, returning their financial leverage indicators to levels that existed some 12-13 years ago. Inasmuch as their capital markets will be deeper and more liquid and their other institutional and productivity-related fabric that much stronger, this emerging economy re-leveraging does not necessarily carry crisis- or bubble-related connotations that some observers might otherwise suppose.
We assume that highly stressed economies will continue de-leveraging their balance sheets in the coming years
Tectonic Economics 3 September 2010
UBS 13
Expected change in UBS financial risk index, 2010 – 2020
-500%-400%-300%-200%-100%
0%100%200%300%400%
HKCh
inaTh
ailan
dEg
ypt
Indon
esia
Taiw
anSi
ngap
ore
Chile
PHP
Mexic
oVe
nezu
elaSa
udi
Pakis
tan ARG
Malay
siaPe
ruQa
tarSr
i Lan
kaRu
ssia
Czec
hCo
lombia
Austr
alia
Japa
nSl
ovak
iaNi
geria
S.Af
rica
India
Turke
yKa
zakh
stan
Israe
lMo
rocc
oBr
azil
Ecua
dor
Keny
aMa
cedo
niaPa
ragu
ayUr
ugua
yNZ
Switz
Croa
tiaPo
land US
Unite
dNL
DGe
rman
yIce
land
Alba
niaAl
geria
Camb
odia
Bulga
riaKo
rea
Austr
iaCa
nada
Swed
enFin
land
Vietn
amNo
rway
Roma
niaHu
ngar
yFr
ance
Eston
iaDe
nmar
kUK
Belgi
um Italy
Lithu
ania
Spain
Ukra
ineSl
oven
iaGr
eece
Portu
gal
Latvi
aIre
land
Change in financial risk index, 2020-2010
De-leveraging impulses
Re-leveraging impulses
Source: UBS
The most difficult factor to forecast in this framework is average capital investment. Investment is highly correlated to several of the other factors that enter our regression, including balance sheet stress, per-capita income and demographics. We have therefore chosen to model investment activity as a function of these other variables and applied some additional judgement about how investment activity may evolve relative to its starting position and its average level over the past decade. That judgement involved lowering investment rates by around one percentage point of GDP in developed economies to take account of the probable adverse impact on the cost of capital of tighter financial regulation.
The specific inputs from this exercise are illustrated in the chart below. Notwithstanding weaker demographic potential Asian economies, including, China, Vietnam and India should continue to chalk up rapid investment rates as they enjoy ‘catch-up’ with the technology frontier achieved elsewhere in the world and as they take advantage of strong balance sheet positions. Much less favourable investment dynamics exist in many mature economies, partly because of previous over-investment and associated balance sheet stress along with less favourable demographic trends.
Asian economies should continue to chalk up rapid investment rates

Tectonic Economics 3 September 2010
UBS 14
Average projected investment rate, 2010 – 2020
0%5%
10%15%20%25%30%35%40%45%50%
Nige
riaIce
land
Germ
any
Lithu
ania US
Irelan
dSw
itzFr
ance
Para
guay
Finlan
dPH
PJa
pan
Braz
ilGr
eece UK
Urug
uay
Belgi
umTu
rkey
Austr
iaPa
kistan HK
Camb
odia
Ukra
ine Italy
Denm
ark
Mexic
oPo
rtuga
lCa
nada
Hung
ary
Peru
Chile
Eston
ia NZNo
rway
Austr
alia
Keny
aIsr
ael
S.Af
rica
Swed
enMa
laysia
ARG
Colom
biaTh
ailan
dPo
land
Alge
riaSi
ngap
ore
Spain
Roma
niaUn
ited
Latvi
aEg
ypt
Vene
zuela
Sri L
anka
Bulga
riaTa
iwan
Saud
iEc
uado
rIn
done
siaCz
ech
Russ
iaNL
DCr
oatia
Mace
donia
Slov
enia
Slov
akia
Kore
aKa
zakh
stan
India
Alba
niaMo
rocc
oQa
tarVi
etnam
China
Average investment rate (projected), 2010-20
Source: UBS
Relative per capita real GDP level (versus US)
0%20%40%60%80%
100%120%
Keny
aNi
geria
Camb
odia
Vietn
amPa
kistan Ind
iaInd
ones
iaUk
raine
Sri L
anka
PHP
Para
guay
Moro
cco
Ecua
dor
Egyp
tAl
bania
Mace
doni
Alge
riaKa
zakh
stBu
lgaria
Thail
and
Roma
nia Peru
Colom
biaCh
inaRu
ssia
S.Af
rica
Braz
ilTu
rkey
Malay
siaVe
nezu
elLit
huan
iaLa
tvia
Chile
Polan
dHu
ngar
yMe
xico
Croa
tiaEs
tonia
Czec
hSl
ovak
iaUr
ugua
yAR
GSa
udi
Portu
gal
Slov
enia NZ
Gree
ceKo
rea
Spain
Taiw
an Italy
Israe
lFr
ance
Austr
alia
Belgi
umGe
rman
yUn
ited
Cana
daAu
stria
NLD
Sing
apor
eFin
land UK
Qatar
Irelan
dDe
nmar
kSw
eden HK
Icelan
dUS
Switz
Japa
nNo
rway
Relative per capita real GDP level (vs US), 2008
US = 100%
Source: IMF/Haver
The inputs that are illustrated in the charts above are combined with assumptions concerning export shares to generate the forecasts that appear in the charts below. On the basis of our analysis, India, Vietnam and China will be three of the best-performing economies in the world economy over the next ten years. Morocco, Qatar, Kenya, Saudi Arabia and Egypt also score well among African and Middle Eastern nations. Several Western and East European economies along with Japan bring up the rear. Indeed, our model-generated trend growth forecasts for many of these economies are below 1%.
India, Vietnam and China will be three of the best-performing economies in the world economy over the next ten years

Tectonic Economics 3 September 2010
UBS 15
Model-generated 10 year trend growth rates by country
0%1%2%3%4%5%6%7%8%
Lithu
ania
Japa
nGe
rman
ySw
itzFin
land
Gree
ceUk
raine
Fran
ceIce
land
Austr
iaBe
lgium US HK
Denm
ark
Italy
Portu
gal
UKIre
land
Eston
iaHu
ngar
yLa
tvia
Polan
dSi
ngap
ore
Cana
daNo
rway
Swed
enBu
lgaria
Roma
niaSl
oven
iaUr
ugua
yRu
ssia
NLD
Spain NZ
Austr
alia
Croa
tiaBr
azil
Czec
hKo
rea
Thail
and
Chile
Slov
akia
Mace
donia
S.Af
rica
Taiw
anTu
rkey
Mexic
oSr
i Lan
kaPa
ragu
ayIsr
ael
Nige
riaAR
GPH
PPe
ruCo
lombia
Camb
odia
Alge
riaMa
laysia
Kaza
khsta
nUA
EEc
uado
rIn
done
siaAl
bania
Vene
zuela
Pakis
tanEg
ypt
Saud
iKe
nya
Qatar
Moro
cco
China
Vietn
am India
Predicted 10 year trend growth rate
Source: UBS estimates. These estimates were obtained by applying the model that we estimated above to the inputs that we laid out above for dependency ratios, per capita GDP levels, financial risk, and investment rates and some further assumptions about likely changes in export to GDP ratios. We then added back projected population growth rates to the per capita GDP growth rates that were backed out of our model.
Our model implies that the world economy will register an average growth rate of around 3% over the next decade. This is about one percentage point below the trend in the previous ten years. That slowdown is the product of ebbing world population growth, ageing workforces in developed economies, the impact of further balance sheet de-leveraging, and weaker rates of trend productivity growth in many developed economies.
The model-based estimates suggest that developed economies will record growth of just 1.3% per annum over the next decade, while developing economies achieve growth of around 5% p.a. A growth gap of between 3.5 and 4 percentage points should continue between the developed and developing economies over the medium term.
Asia and the Middle East will be the fastest growing regions of the world economy over the next ten years according to our estimates. Still, Asia will record slower trend growth rates, whereas the Middle East should see stronger average growth assuming, as we do, that real oil prices remain elevated. Latin America is another region that should see slightly faster rates of growth in the coming decade, notwithstanding the weaker outlook in some of its principal export markets (e.g. the US). Perhaps the biggest scope for disappointment will emerge in Eastern Europe, where growth is projected to average just 2.5% over the next decade, about half the rate witnessed over the past decade. Finally, sub-Saharan Africa may achieve a respectable growth rate of over 4% in the next decade, albeit slightly slower than in the previous decade. The deceleration is almost entirely due to weaker growth in South Africa. Other economies such as Kenya and Morocco should perform well.
Our model implies that the world economy will register an average growth rate of around 3% over the next decade
Developed economies will record growth of just 1.3% per annum over the next decade while developing economies achieve growth of around 5%
Asia and the Middle East will be the fastest growing regions of the world economy over the next ten years

Tectonic Economics 3 September 2010
UBS 16
Model-generated trend GDP growth estimates for the world economy by region
0.0%1.0%2.0%3.0%4.0%5.0%6.0%7.0%8.0%
WorldAdva
nced e
conom
ies USEuro
zone
Japan
Develop
ing ec
onomies Asia
Latin A
merica
Eastern
Europe
Middle E
astSub-
Saharan
Africa
10 year historic trend, 1998 - 2008 Model-generated trend, 2010-2020
Source: UBS estimates
Some scenario analysis In this section we take a look at some of the risks that confront the world economy and deploy our model for scenario analysis in order to understand how those risks might impact the base-case forecasts that we laid out above.
Severe sovereign debt crisis
In the first scenario we consider a severe and prolonged sovereign debt crisis in the developed economies. We assume that this crisis derails not just some of the well-known peripheral European economies that have highly leveraged public balance sheets. Rather we assume that nearly every major developed economy succumbs to heightened investor risk aversion, intense financial market aftershocks, and associated balance sheet and investment constraints. In this scenario we assume that investment rates fail to climb above the levels they attained in 2009 in the developed economies and that more significant de-leveraging occurs. Global growth averages just 2.2% over the next ten years in this scenario with advanced economies achieving growth of just 0.6%. Developing economies are hit as well as export growth potential is curtailed and investment slows. Average emerging growth rates in this scenario fall to 4.3% from 5% in the baseline forecasts above.
What are the risks?
We consider a severe and prolonged sovereign debt crisis in the developed economies to be a risk

Tectonic Economics 3 September 2010
UBS 17
The impact of a severe sovereign debt crisis on trend GDP growth estimates
0.0%1.0%2.0%3.0%4.0%5.0%6.0%7.0%
World
Advance
d econ
omies US
Eurozon
eJap
an
Develop
ing ec
onomies Asia
Latin A
merica
Eastern
Europe
Middle E
ast
Sub-Saha
ran Afric
a
Baseline scenario Severe sovereign debt crisis
Source: UBS estimates
Heightened protectionism
Another worry is protectionism amid tough economic times across much of the world economy. As we have noted above, the role of export-related activity in determining an individual economy’s growth potential appears over-stated. Still, protectionism could clearly derail trade activity and depress growth, particularly in export-sensitive economies. Our risk scenario assumes that the world trade share of GDP falls by 3 percentage points, shaving slightly more off potential growth rates in developing countries but less in developed countries. Global growth potential falls to 2.7% in this scenario, 0.3 percentage points lower than in the base case.
The impact of greater protectionism on trend GDP growth estimates
0.0%1.0%2.0%3.0%4.0%5.0%6.0%7.0%
World
Advance
d econ
omies US
Eurozon
eJap
an
Develop
ing ec
onomies Asia
Latin A
merica
Eastern
Europe
Middle E
ast
Sub-Saha
ran Afric
a
Baseline scenario Heightened protectionism
Source: UBS estimates
Another worry is protectionism

Tectonic Economics 3 September 2010
UBS 18
China collapse
The next risk factor we consider is a hard landing in China. We assume that China’s investment rate falls by 10-15 percentage points with knock-on effects for other Asian economies’ export growth and re-leveraging. This would have a meaningful impact on Asian growth, lowering trend estimates by 1.5 percentage points primarily because China’s growth tumbles from around 7% in the baseline to 4.5% in the risk scenario. Global growth falls to 2.5% from 3%.
The impact of a hard landing in China on trend GDP growth estimates
0.0%1.0%2.0%3.0%4.0%5.0%6.0%7.0%
World
Advance
d econ
omies US
Eurozon
eJap
an
Develop
ing ec
onomies Asia
Latin A
merica
Eastern
Europe
Middle E
ast
Sub-Saha
ran Afric
a
Baseline scenario China collapse
Source: UBS estimates
Active policies designed to deal with ageing
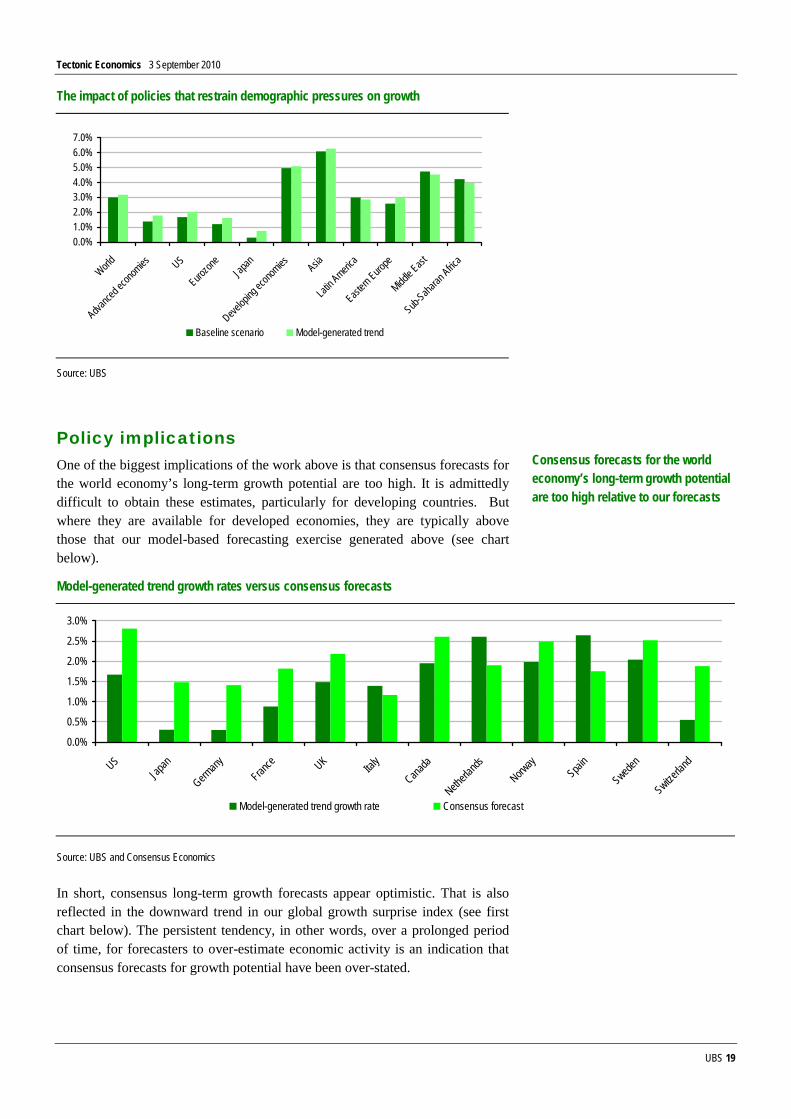
The final risk factor we consider is policies that restrain the impact on developed economies of population ageing. If governments pursue policies that encourage longer working lives the trend slowdown in the world’s labour force will not be as severe in the next decade (though the effect is postponed, not eliminated) and funding pressures on public balance sheets are not as acute. In this risk scenario we have assumed that the advance in dependency ratios in developed countries is restrained to one-third of the projected rate assumed in United Nations projections. We have also increased the export and investment assumptions that underpin our forecasts for the developing world. Global growth potential is lifted by 0.2 percentage points as a result. Advanced economies achieve growth of 1.8% in this scenario versus 1.3% in the baseline.
Another concern is a hard landing in China
An upside risk relates to policies that mitigate the impact of population ageing
Tectonic Economics 3 September 2010
UBS 19
The impact of policies that restrain demographic pressures on growth
0.0%1.0%2.0%3.0%4.0%5.0%6.0%7.0%
World
Advance
d econ
omies US
Eurozon
eJap
an
Develop
ing ec
onomies Asia
Latin A
merica
Eastern
Europe
Middle E
ast
Sub-Saha
ran Afric
a
Baseline scenario Model-generated trend
Source: UBS
Policy implications One of the biggest implications of the work above is that consensus forecasts for the world economy’s long-term growth potential are too high. It is admittedly difficult to obtain these estimates, particularly for developing countries. But where they are available for developed economies, they are typically above those that our model-based forecasting exercise generated above (see chart below).
Model-generated trend growth rates versus consensus forecasts
0.0%
0.5%
1.0%
1.5%
2.0%
2.5%
3.0%
USJap
an
Germany
France UK Ital
y
Canada
Netherla
ndsNorw
aySpai
n
Sweden
Switzerlan
d
Model-generated trend growth rate Consensus forecast
Source: UBS and Consensus Economics
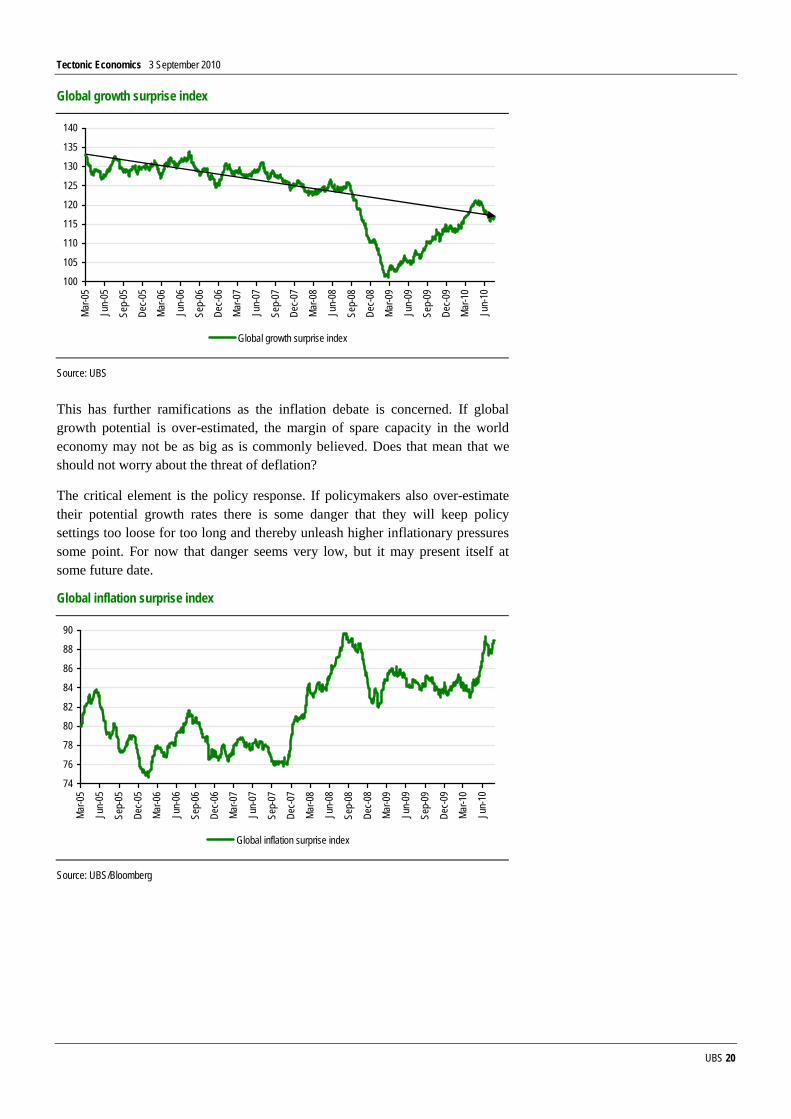
In short, consensus long-term growth forecasts appear optimistic. That is also reflected in the downward trend in our global growth surprise index (see first chart below). The persistent tendency, in other words, over a prolonged period of time, for forecasters to over-estimate economic activity is an indication that consensus forecasts for growth potential have been over-stated.
Consensus forecasts for the world economy’s long-term growth potential are too high relative to our forecasts
Tectonic Economics 3 September 2010
UBS 20
Global growth surprise index
100
105
110
115
120
125
130
135
140
Mar-0
5
Jun-
05
Sep-
05
Dec-0
5
Mar-0
6
Jun-
06
Sep-
06
Dec-0
6
Mar-0
7
Jun-
07
Sep-
07
Dec-0
7
Mar-0
8
Jun-
08
Sep-
08
Dec-0
8
Mar-0
9
Jun-
09
Sep-
09
Dec-0
9
Mar-1
0
Jun-
10
Global growth surprise index
Source: UBS
This has further ramifications as the inflation debate is concerned. If global growth potential is over-estimated, the margin of spare capacity in the world economy may not be as big as is commonly believed. Does that mean that we should not worry about the threat of deflation?
The critical element is the policy response. If policymakers also over-estimate their potential growth rates there is some danger that they will keep policy settings too loose for too long and thereby unleash higher inflationary pressures some point. For now that danger seems very low, but it may present itself at some future date.
Global inflation surprise index
74
76
78
80
82
84
86
88
90
Mar-0
5
Jun-
05
Sep-
05
Dec-0
5
Mar-0
6
Jun-
06
Sep-
06
Dec-0
6
Mar-0
7
Jun-
07
Sep-
07
Dec-0
7
Mar-0
8
Jun-
08
Sep-
08
Dec-0
8
Mar-0
9
Jun-
09
Sep-
09
Dec-0
9
Mar-1
0
Jun-
10
Global inflation surprise index
Source: UBS/Bloomberg

Tectonic Economics 3 September 2010
UBS 21
Investment implications Our analysis of trend growth also lends itself to several investment implications. The first set of implications derives from the differential trend growth rates between emerging and developed economies. This ought to manifest itself in gradual appreciation pressure for emerging economies. To the extent that pressure is resisted by policy makers, it suggests greater inflation risk in emerging economies over time.
In equity markets, the better outlook in developing economies for productivity and return on equity implies that emerging market risk premia should continue to shrink relative to advanced economies. This implies that benchmark weights for emerging equities in multi-asset portfolios may also rise in line with their increasing share in global earnings.
Emerging vs. advanced economy equity valuations EM share of equity capitalisation and earnings
-80%
-60%
-40%
-20%
0%
20%
40%
90 91 92 93 94 95 96 97 98 99 00 01 02 03 04 05 06 07 08 09 10EM P/BV relativ e WorldEM RoE relativ e World (forw ard earnings)
0%2%4%6%8%
10%12%14%16%18%
88 90 92 94 96 98 00 02 04 06 08EM equity market cap % World EM earnings % World
Source: UBS, Bloomberg, DataStream Source: UBS, MSCI
Similarly, in sovereign bond markets, we would expect risk premia in emerging markets to shrink over time. Relatively healthy sovereign balance sheets and lower financial risk scores (compared to advanced economies) and improving liquidity in many emerging bond markets should support this trend going forward.
These changing asset allocation trends may increase the risk that emerging market asset markets rise above levels that can be justified by fundamentals alone – i.e., they may be prone to form bubbles as speculative capital flows increase over time. Policy makers may seek to re-dress this shift by diversifying accumulated reserves away from domestic asset markets, and by using other policy tools such as capital controls and sterilisation to dampen any adverse domestic impacts from these flows.
A second set of investment implications centres on the potential impact of lower trend growth on markets. A reduction in trend growth implies a reduction in trend earnings growth. In earlier work, our asset allocation team have shown that equity multiple expansion/compression is typically a function of swings in long-term earnings expectations. In a world of slowing trend growth (and probable downward revisions to trend earnings estimates), equity multiples are unlikely to expand, even from already compressed levels.
Greater exchange rate appreciation pressures in emerging economies
Benchmark weights for emerging equities in multi-asset portfolios may continue rising
Risk premia in emerging economy sovereign bond markets to continue shrinking over time
A reduction in trend growth implies a reduction in trend earnings growth
Tectonic Economics 3 September 2010
UBS 22
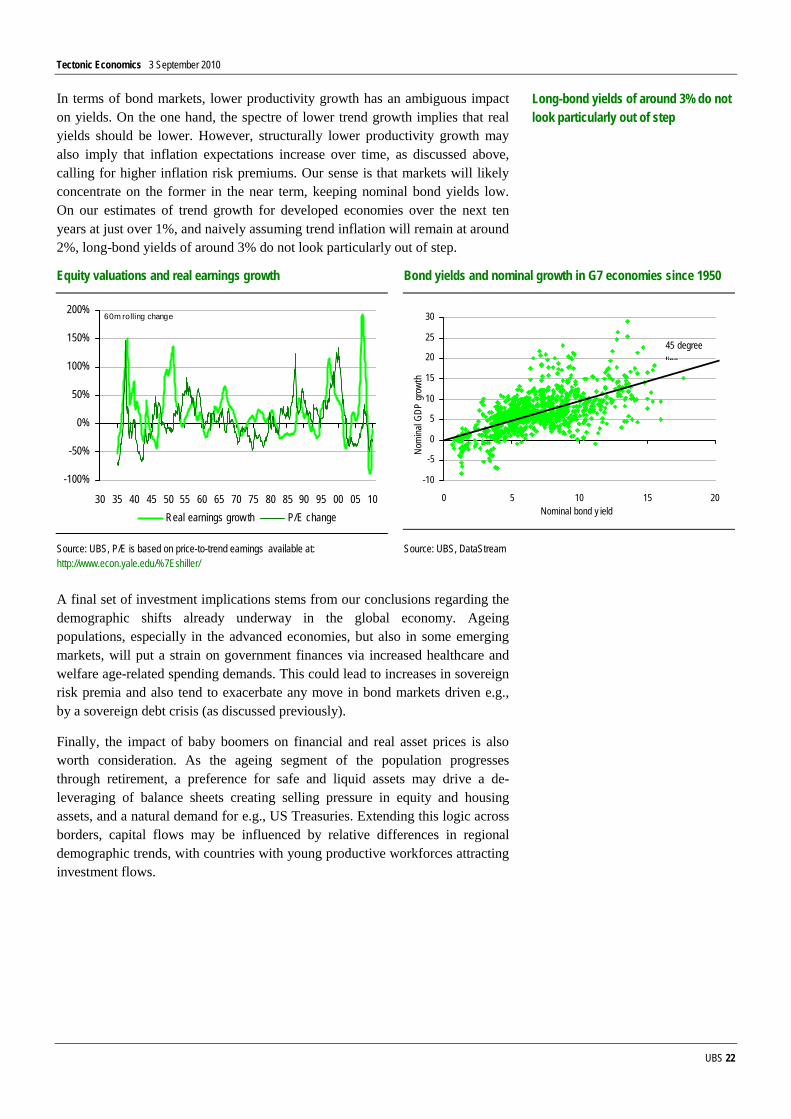
In terms of bond markets, lower productivity growth has an ambiguous impact on yields. On the one hand, the spectre of lower trend growth implies that real yields should be lower. However, structurally lower productivity growth may also imply that inflation expectations increase over time, as discussed above, calling for higher inflation risk premiums. Our sense is that markets will likely concentrate on the former in the near term, keeping nominal bond yields low. On our estimates of trend growth for developed economies over the next ten years at just over 1%, and naively assuming trend inflation will remain at around 2%, long-bond yields of around 3% do not look particularly out of step.
Equity valuations and real earnings growth Bond yields and nominal growth in G7 economies since 1950
-100%
-50%
0%
50%
100%
150%
200%
30 35 40 45 50 55 60 65 70 75 80 85 90 95 00 05 10Real earnings grow th P/E change
60m rolling change
-10
-5
0
5
10
15
20
25
30
0 5 10 15 20Nominal bond y ield
Nom
inal G
DP g
rowt
h
45 degree line
Source: UBS, P/E is based on price-to-trend earnings available at: http://www.econ.yale.edu/%7Eshiller/
Source: UBS, DataStream
A final set of investment implications stems from our conclusions regarding the demographic shifts already underway in the global economy. Ageing populations, especially in the advanced economies, but also in some emerging markets, will put a strain on government finances via increased healthcare and welfare age-related spending demands. This could lead to increases in sovereign risk premia and also tend to exacerbate any move in bond markets driven e.g., by a sovereign debt crisis (as discussed previously).
Finally, the impact of baby boomers on financial and real asset prices is also worth consideration. As the ageing segment of the population progresses through retirement, a preference for safe and liquid assets may drive a de-leveraging of balance sheets creating selling pressure in equity and housing assets, and a natural demand for e.g., US Treasuries. Extending this logic across borders, capital flows may be influenced by relative differences in regional demographic trends, with countries with young productive workforces attracting investment flows.
Long-bond yields of around 3% do not look particularly out of step

Tectonic Economics 3 September 2010
UBS 23
Appendix Country acronyms in selected charts
ALB Albania LTU Lithuania
ALG Algeria MAL Malaysia
ARG Argentina MCD Macedonia
AUS Australia MEX Mexico
AUT Austria MOR Morocco
BEL Belgium NGA Nigeria
BRA Brazil NLD Netherlands
BUL Bulgaria NOR Norway
CAM Cambodia NZ New Zealand
CAN Canada PAK Pakistan
CHL Chile PAR Paraguay
CHN China PER Peru
COL Colombia PHP Philippines
CRO Croatia POL Poland
CZE Czech Republic POR Portugal
DNK Denmark QAT Qatar
ECU Ecuador ROU Romania
EGY Egypt RUS Russia
ESP Spain SAF South Africa
EST Estonia SAU Saudi Arabia
FIN Finland SGP Singapore
FRA France SRI Sri Lanka
GER Germany SVK Slovakia
GRC Greece SVN Slovenia
HK Hong Kong SWE Sweden
HUN Hungary SWI Switzerland
IDN Indonesia THA Thailand
IND India TUR Turkey
IRL Ireland TWN Taiwan
ISL Iceland UAE United Arab Emirates
ISR Israel UK United Kingdom
ITA Italy UKR Ukraine
JPN Japan URG Uruguay
KAZ Kazakhstan US United States
KEN Kenya VEN Venezuela
KOR Korea VIE Vietnam
LAT Latvia
Source: UBS

Tectonic Economics 3 September 2010
UBS 24
Notes:

Tectonic Economics 3 September 2010
UBS 25
Notes:

Tectonic Economics 3 September 2010
UBS 26
Analyst Certification
Each research analyst primarily responsible for the content of this research report, in whole or in part, certifies that with respect to each security or issuer that the analyst covered in this report: (1) all of the views expressed accurately reflect his or her personal views about those securities or issuers; and (2) no part of his or her compensation was, is, or will be, directly or indirectly, related to the specific recommendations or views expressed by that research analyst in the research report.
Tectonic Economics 3 September 2010
UBS 27
Required Disclosures This report has been prepared by UBS Limited, an affiliate of UBS AG. UBS AG, its subsidiaries, branches and affiliates are referred to herein as UBS.
For information on the ways in which UBS manages conflicts and maintains independence of its research product; historical performance information; and certain additional disclosures concerning UBS research recommendations, please visit www.ubs.com/disclosures. The figures contained in performance charts refer to the past; past performance is not a reliable indicator of future results. Additional information will be made available upon request.

Tectonic Economics 3 September 2010
UBS 28
Global Disclaimer This report has been prepared by UBS Limited, an affiliate of UBS AG. UBS AG, its subsidiaries, branches and affiliates are referred to herein as UBS. In certain countries, UBS AG is referred to as UBS SA. This report is for distribution only under such circumstances as may be permitted by applicable law. Nothing in this report constitutes a representation that any investment strategy or recommendation contained herein is suitable or appropriate to a recipient’s individual circumstances or otherwise constitutes a personal recommendation. It is published solely for information purposes, it does not constitute an advertisement and is not to be construed as a solicitation or an offer to buy or sell any securities or related financial instruments in any jurisdiction. No representation or warranty, either express or implied, is provided in relation to the accuracy, completeness or reliability of the information contained herein, except with respect to information concerning UBS AG, its subsidiaries and affiliates, nor is it intended to be a complete statement or summary of the securities, markets or developments referred to in the report. UBS does not undertake that investors will obtain profits, nor will it share with investors any investment profits nor accept any liability for any investment losses. Investments involve risks and investors should exercise prudence in making their investment decisions. The report should not be regarded by recipients as a substitute for the exercise of their own judgement. Past performance is not necessarily a guide to future performance. The value of any investment or income may go down as well as up and you may not get back the full amount invested. Any opinions expressed in this report are subject to change without notice and may differ or be contrary to opinions expressed by other business areas or groups of UBS as a result of using different assumptions and criteria. Research will initiate, update and cease coverage solely at the discretion of UBS Investment Bank Research Management. The analysis contained herein is based on numerous assumptions. Different assumptions could result in materially different results. The analyst(s) responsible for the preparation of this report may interact with trading desk personnel, sales personnel and other constituencies for the purpose of gathering, synthesizing and interpreting market information. UBS is under no obligation to update or keep current the information contained herein. UBS relies on information barriers to control the flow of information contained in one or more areas within UBS, into other areas, units, groups or affiliates of UBS. The compensation of the analyst who prepared this report is determined exclusively by research management and senior management (not including investment banking). Analyst compensation is not based on investment banking revenues, however, compensation may relate to the revenues of UBS Investment Bank as a whole, of which investment banking, sales and trading are a part. The securities described herein may not be eligible for sale in all jurisdictions or to certain categories of investors. Options, derivative products and futures are not suitable for all investors, and trading in these instruments is considered risky. Mortgage and asset-backed securities may involve a high degree of risk and may be highly volatile in response to fluctuations in interest rates and other market conditions. Past performance is not necessarily indicative of future results. Foreign currency rates of exchange may adversely affect the value, price or income of any security or related instrument mentioned in this report. For investment advice, trade execution or other enquiries, clients should contact their local sales representative. Neither UBS nor any of its affiliates, nor any of UBS' or any of its affiliates, directors, employees or agents accepts any liability for any loss or damage arising out of the use of all or any part of this report. For financial instruments admitted to trading on an EU regulated market: UBS AG, its affiliates or subsidiaries (excluding UBS Securities LLC and/or UBS Capital Markets LP) acts as a market maker or liquidity provider (in accordance with the interpretation of these terms in the UK) in the financial instruments of the issuer save that where the activity of liquidity provider is carried out in accordance with the definition given to it by the laws and regulations of any other EU jurisdictions, such information is separately disclosed in this research report. UBS and its affiliates and employees may have long or short positions, trade as principal and buy and sell in instruments or derivatives identified herein. Any prices stated in this report are for information purposes only and do not represent valuations for individual securities or other instruments. There is no representation that any transaction can or could have been effected at those prices and any prices do not necessarily reflect UBS's internal books and records or theoretical model-based valuations and may be based on certain assumptions. Different assumptions, by UBS or any other source, may yield substantially different results. United Kingdom and the rest of Europe: Except as otherwise specified herein, this material is communicated by UBS Limited, a subsidiary of UBS AG, to persons who are eligible counterparties or professional clients and is only available to such persons. The information contained herein does not apply to, and should not be relied upon by, retail clients. UBS Limited is authorised and regulated by the Financial Services Authority (FSA). UBS research complies with all the FSA requirements and laws concerning disclosures and these are indicated on the research where applicable. France: Prepared by UBS Limited and distributed by UBS Limited and UBS Securities France SA. UBS Securities France S.A. is regulated by the Autorité des Marchés Financiers (AMF). Where an analyst of UBS Securities France S.A. has contributed to this report, the report is also deemed to have been prepared by UBS Securities France S.A. Germany: Prepared by UBS Limited and distributed by UBS Limited and UBS Deutschland AG. UBS Deutschland AG is regulated by the Bundesanstalt fur Finanzdienstleistungsaufsicht (BaFin). Spain: Prepared by UBS Limited and distributed by UBS Limited and UBS Securities España SV, SA. UBS Securities España SV, SA is regulated by the Comisión Nacional del Mercado de Valores (CNMV). Turkey: Prepared by UBS Menkul Degerler AS on behalf of and distributed by UBS Limited. Russia: Prepared and distributed by UBS Securities CJSC. Switzerland: Distributed by UBS AG to persons who are institutional investors only. Italy: Prepared by UBS Limited and distributed by UBS Limited and UBS Italia Sim S.p.A.. UBS Italia Sim S.p.A. is regulated by the Bank of Italy and by the Commissione Nazionale per le Società e la Borsa (CONSOB). Where an analyst of UBS Italia Sim S.p.A. has contributed to this report, the report is also deemed to have been prepared by UBS Italia Sim S.p.A.. South Africa: UBS South Africa (Pty) Limited (Registration No. 1995/011140/07) is a member of the JSE Limited, the South African Futures Exchange and the Bond Exchange of South Africa. UBS South Africa (Pty) Limited is an authorised Financial Services Provider. Details of its postal and physical address and a list of its directors are available on request or may be accessed at http:www.ubs.co.za. United States: Distributed to US persons by either UBS Securities LLC or by UBS Financial Services Inc., subsidiaries of UBS AG; or by a group, subsidiary or affiliate of UBS AG that is not registered as a US broker-dealer (a 'non-US affiliate'), to major US institutional investors only. UBS Securities LLC or UBS Financial Services Inc. accepts responsibility for the content of a report prepared by another non-US affiliate when distributed to US persons by UBS Securities LLC or UBS Financial Services Inc. All transactions by a US person in the securities mentioned in this report must be effected through UBS Securities LLC or UBS Financial Services Inc., and not through a non-US affiliate. Canada: Distributed by UBS Securities Canada Inc., a subsidiary of UBS AG and a member of the principal Canadian stock exchanges & CIPF. A statement of its financial condition and a list of its directors and senior officers will be provided upon request. Hong Kong: Distributed by UBS Securities Asia Limited. Singapore: Distributed by UBS Securities Pte. Ltd [mica (p) 039/11/2009 and Co. Reg. No.: 198500648C] or UBS AG, Singapore Branch. Please contact UBS Securities Pte Ltd, an exempt financial advisor under the Singapore Financial Advisers Act (Cap. 110); or UBS AG Singapore branch, an exempt financial adviser under the Singapore Financial Advisers Act (Cap. 110) and a wholesale bank licensed under the Singapore Banking Act (Cap. 19) regulated by the Monetary Authority of Singapore, in respect of any matters arising from, or in connection with, the analysis or report. The recipient of this report represent and warrant that they are accredited and institutional investors as defined in the Securities and Futures Act (Cap. 289). Japan: Distributed by UBS Securities Japan Ltd to institutional investors only. Where this report has been prepared by UBS Securities Japan Ltd, UBS Securities Japan Ltd is the author, publisher and distributor of the report. Australia: Distributed by UBS AG (Holder of Australian Financial Services License No. 231087) and UBS Securities Australia Ltd (Holder of Australian Financial Services License No. 231098) only to 'Wholesale' clients as defined by s761G of the Corporations Act 2001. New Zealand: Distributed by UBS New Zealand Ltd. An investment adviser and investment broker disclosure statement is available on request and free of charge by writing to PO Box 45, Auckland, NZ. Dubai: The research prepared and distributed by UBS AG Dubai Branch, is intended for Professional Clients only and is not for further distribution within the United Arab Emirates. Korea: Distributed in Korea by UBS Securities Pte. Ltd., Seoul Branch. This report may have been edited or contributed to from time to time by affiliates of UBS Securities Pte. Ltd., Seoul Branch. Malaysia: This material is authorized to be distributed in Malaysia by UBS Securities Malaysia Sdn. Bhd (253825-x). The disclosures contained in research reports produced by UBS Limited shall be governed by and construed in accordance with English law. UBS specifically prohibits the redistribution of this material in whole or in part without the written permission of UBS and UBS accepts no liability whatsoever for the actions of third parties in this respect. Images may depict objects or elements which are protected by third party copyright, trademarks and other intellectual property rights. © UBS 2010. The key symbol and UBS are among the registered and unregistered trademarks of UBS. All rights reserved.
ab
Related Documents