Chapter 4 – 1 Measures of Central Tendency • What is a measure of central tendency? • Measures of Central Tendency – Mode – Median – Mean • Shape of the Distribution • Considerations for Choosing an Appropriate Measure of Central Tendency

Welcome message from author
This document is posted to help you gain knowledge. Please leave a comment to let me know what you think about it! Share it to your friends and learn new things together.
Transcript

Chapter 4 – 1
Measures of Central Tendency
• What is a measure of central tendency?
• Measures of Central Tendency
– Mode
– Median
– Mean
• Shape of the Distribution
• Considerations for Choosing an Appropriate
Measure of Central Tendency

Chapter 4 – 2
• Numbers that describe what is average or
typical of the distribution
• You can think of this value as where the
middle of a distribution lies.
What is a measure of Central
Tendency?

Chapter 4 – 3
• The category or score with the largest
frequency (or percentage) in the
distribution.
• The mode can be calculated for variables
with levels of measurement that are:
nominal, ordinal, or interval-ratio.
The Mode

Chapter 4 – 4
The Mode: An Example
• Example: Number of Votes for Candidates for
Mayor. The mode, in this case, gives you the
“central” response of the voters: the most
popular candidate.
Candidate A – 11,769 votes The Mode:
Candidate B – 39,443 votes “Candidate C”
Candidate C – 78,331 votes

Chapter 4 – 5
The Median
• The score that divides the distribution
into two equal parts, so that half the cases
are above it and half below it.
• The median is the middle score, or
average of middle scores in a
distribution.

Chapter 4 – 6
Median Exercise #1 (N is odd)
Calculate the median for this hypothetical distribution:
Job Satisfaction Frequency
Very High 2
High 3
Moderate 5
Low 7
Very Low 4
TOTAL 21

Chapter 4 – 7
Median Exercise #2 (N is even)
Calculate the median for this hypothetical distribution:
Satisfaction with Health Frequency
Very High 5
High 7
Moderate 6
Low 7
Very Low 3
TOTAL 28

Chapter 4 – 8
Finding the Median in
Grouped Data
wf
CfNLMedian
)5(.

Chapter 4 – 9
Percentiles
• A score below which a specific percentage of
the distribution falls.
• Finding percentiles in grouped data:
wf
CfNL
)25(.%25

Chapter 4 – 10
The Mean
• The arithmetic average obtained by
adding up all the scores and dividing by
the total number of scores.

Chapter 4 – 11
Formula for the Mean
N
Y
Y
“Y bar” equals the sum of all the scores, Y, divided by
the number of scores, N.

Chapter 4 – 12
Calculating the mean with
grouped scores
where: f Y = a score multiplied by its frequency
N
Yf
Y

Chapter 4 – 13
Mean: Grouped Scores

Chapter 4 – 14
Mean: Grouped Scores

Chapter 4 – 15
Grouped Data: the Mean & Median
Number of People Age 18 or older living in a U.S. Household in
1996 (GSS 1996)
Number of People Frequency
1 190
2 316
3 54
4 17
5 2
6 2
TOTAL 581
Calculate the median and mean for the grouped
frequency below.

Chapter 4 – 16
Shape of the Distribution
• Symmetrical (mean is about equal to median)
• Skewed
– Negatively (example: years of education)
mean < median
– Positively (example: income)
mean > median
• Bimodal (two distinct modes)
• Multi-modal (more than 2 distinct modes)

Chapter 4 – 17
Distribution Shape

Chapter 4 – 18
Considerations for Choosing a
Measure of Central Tendency
• For a nominal variable, the mode is the only measure that can be used.
• For ordinal variables, the mode and the median may be used. The median provides more information (taking into account the ranking of categories.)
• For interval-ratio variables, the mode, median, and mean may all be calculated. The mean provides the most information about the distribution, but the median is preferred if the distribution is skewed.

Chapter 4 – 19
Central Tendency

Measures of Central
Tendency

Introduction
• How well did my students do on the last test?
• What is the average price of gasoline in the Phoenix metropolitan area?
• What is the mean number of home runs hit in the National League?
• These questions are asking for a statistic that describes a large set of data.
• In this section we will study the mean, median, and mode.
• These three statistics describe an average or center of a distribution of numbers.

Sigma notation Σ
• The sigma notation is a shorthand notation
used to sum up a large number of terms.
• Σx = x1+x2+x3+ … +xn
• One uses this notation because it is more
convenient to write the sum in this fashion.

Definition of the mean
• Given a sample of n data points, x1, x2, x3, … xn, the formula for the mean or average is given below.
ptsdatanumberthe
ptsdatatheofsumthe
n
xx

Find the mean
• My 5 test scores for Calculus I are 95, 83,
92, 81, 75. What is the mean?
• ANSWER: sum up all the tests and divide
by the total number of tests.
• Test mean = (95+83+92+81+75)/5 = 85.2

Example with a range of data
• When you are given a
range of data, you need
to find midpoints.
• To find a midpoint, sum
the two endpoints on the
range and divide by 2.
• Example 14≤x<18. The
midpoint (14+18)/2=16.
• The total number of
students is 5,542,000.
Age of
males
Number of
students
14≤x<18 94,000
18≤x<20 1,551,000
20≤x<22 1,420,000
22≤x<25 1,091,000
25≤x<30 865,000
30≤x<35 521,000
Total 5,542,000

Continuing the previous example
• What we need to do is find the midpoints of the
ranges and then multiply then by the frequency.
So that we can compute the mean.
• The midpoints are 16, 19, 21, 23.5, 27.5, 32.5.
• The mean is
[16(94,000)+19(1,551,000)+21(1,420,000)+
23.5(1,091,000)+27.5(865,000)+32.5(521,000)]
/5,542,000.=22.94

The median
• The median is the middle value of a distribution of data.
• How do you find the median?
• First, if possible or feasible, arrange the data from smallest value to largest value.
• The location of the median can be calculated using this formula: (n+1)/2.
• If (n+1)/2 is a whole number then that value gives the location. Just report the value of that location as the median.
• If (n+1)/2 is not a whole number then the first whole number less than the location value and the first whole number greater than the location value will be used to calculate the median. Take the data located at those 2 values and calculate the average, this is the median.

Find the median.
• Here are a bunch of 10 point quizzes from MAT117:
• 9, 6, 7, 10, 9, 4, 9, 2, 9, 10, 7, 7, 5, 6, 7
• As you can see there are 15 data points.
• Now arrange the data points in order from smallest to largest.
• 2, 4, 5, 6, 6, 7, 7, 7, 7, 9, 9, 9, 9, 10, 10
• Calculate the location of the median: (15+1)/2=8. The eighth piece of data is the median. Thus the median is 7.
• By the way what is the mean???? It’s 7.13…

The mode
• The mode is the most frequent number in a collection of data.
• Example A: 3, 10, 8, 8, 7, 8, 10, 3, 3, 3
• The mode of the above example is 3, because 3 has a frequency of 4.
• Example B: 2, 5, 1, 5, 1, 2
• This example has no mode because 1, 2, and 5 have a frequency of 2.
• Example C: 5, 7, 9, 1, 7, 5, 0, 4
• This example has two modes 5 and 7. This is said to be bimodal.

Section 4.2 #13
• Find the mean, median, and mode of the following data:
• Mean = [3(10)+10(9)+9(8)+8(7)+10(6)+
2(5)]/42 = 7.57
• Median: find the location (42+1)/2=21.5 Use the 21st and 22nd
values in the data set.
• The 21st and 22nd values are 8 and 8. Thus the median is (8+8)/2=8.
• The modes are 6 and 9 since they have frequency 10.
Score Number
of
students
10 3
9 10
8 9
7 8
6 10
5 2


A distribution is said to be 'skewed' when the mean and the
median fall at different points in the distribution, and the
balance (or centre of gravity) is shifted to one side or the
other-to left or right.
Measures of skewness tell us the direction and the extent of
Skewness. In symmetrical distribution the mean, median and
mode are identical. The more the mean moves away from the
mode, the larger the asymmetry or skewness

A frequency distribution is said to be symmetrical if the frequencies areequally distributed on both the sides of central value. A symmetricaldistribution may be either bell – shaped or U shaped.
1- Bell – shaped or unimodel Symmetrical DistributionA symmetrical distribution is bell – shaped if the frequencies are first
steadily rise and then steadily fall. There is only one mode and the valuesof mean, median and mode are equal.
Mean = Median = Mode

A frequency distribution is said to be skewed if the
frequencies are not equally distributed on both the sides
of the central value. A skewed distribution may be
• Positively Skewed
• Negatively Skewed
• ‘L’ shaped positively skewed
• ‘J’ shaped negatively skewed

Positively skewed
Mean ˃ Median ˃ Mode

Negatively skewed
Mean ˂ Median ˂ Mode

‘L’ Shaped Positively skewed
Mean ˂ Mode
Mean ˂ Median

‘J’ Shaped Negatively Skewed
Mean ˃ Mode
Mean ˃ Median

In order to ascertain whether a distribution is skewed or not the following tests may be applied. Skewness is present if:
The values of mean, median and mode do not coincide.
When the data are plotted on a graph they do not give the normal bell shaped form i.e. when cut along a vertical line through the centre the two halves are not equal.
The sum of the positive deviations from the median is not equal to the sum of the negative deviations.
Quartiles are not equidistant from the median.
Frequencies are not equally distributed at points of equal deviationfrom the mode.
There are four measures of skewness. The measures of skewness are:
Karl Pearson's Coefficient of skewness
Bowley’s Coefficient of skewness
Kelly’s Coefficient of skewness

The formula for measuring skewness as given by Karl Pearson is as follows
Where,
SKP = Karl Pearson's Coefficient of skewness,
σ = standard deviation
SKP = Mean – Mode
σ

In case the mode is indeterminate, the coefficient of skewness is:
Now this formula is equal to
The value of coefficient of skewness is zero, when the distribution is
symmetrical.
Normally, this coefficient of skewness lies between +1. If the mean is
greater than the mode, then the coefficient of skewness will be positive,
otherwise negative.
SKP = Mean – (3 Median - 2 Mean)
σ
SKP = 3(Mean - Median)
σ

Bowley developed a measure of skewness, which is based on quartile
values. The formula for measuring skewness is:
Where,
SKB = Bowley’s Coefficient of skewness,
Q1 = Quartile first
Q2 = Quartile second
Q3 = Quartile Third
SKB = (Q3 – Q2) – (Q2 – Q1)
(Q3 – Q1)

The above formula can be converted to
The value of coefficient of skewness is zero, if it is a symmetrical
distribution.
if the value is greater than zero, it is positively skewed and if the value
is less than zero, it is negatively skewed distribution.
SKB = Q3 + Q1 – 2Median
(Q3 – Q1)

Kelly developed another measure of skewness, which is based on
percentiles and deciles. The formula for measuring skewness is as
follows:
Based on Percentile
Where,
SKK = Kelly’s Coefficient of skewness,
P90
P50
P10
= Percentile Ninety.
= Percentile Fifty.
= Percentile Ten.
SKk = P10P90 – 2P50 +
P90 – P10

Based on Deciles
Where,
SKK = Kelly’s Coefficient of skewness,
D9 = Deciles Nine.
D5 = Deciles Five.
D1 = Deciles one.
SKk = D9 – 2D5 + D1
D9 – D1

In mechanics, the term moment is used to denote the rotating effect of
a force. In Statistics, it is used to indicate peculiarities of a frequency
distribution. The utility of moments lies in the sense that they indicate
different aspects of a given distribution. Thus, by using moments, we
can measure the central tendency of a series, dispersion or variability,
skewness and the peakedness of the curve. The moments about the
actual arithmetic mean are denoted by μ. The first four moments about
mean or central moments are as follows:

First moment μ1 = 1 Σ (X1 –X)
N
Second moment μ2 = 1 Σ (X1 –X) 2
N
Third moment μ3 = 1 Σ (X1 –X) 3
N
Fourth moment μ4 = 1 Σ (X1 -X) 4
N

First moment μ1 = 1 Σf (X1 –X)
N
Second moment μ2 = 1 Σf (X1 –X) 2
N
Third moment μ3 = 1 Σf (X1 –X) 3
N
Fourth moment μ4 = 1 Σf (X1 -X) 4
N

Two important constants calculated from μ2, μ3 and μ4
are:-
β1 (read as beta one)
β2 (read as beta two)
β1 (Beta one):- Beta one is defined as
β1 is used to measures of skewness. In symmetrical distribution β1
shall be zero. However, the coefficient β1 as a measure of skewnesshas serious limitations. β1 as a measure of skewness cannot tell usabout the direction of skewness that is whether it is positive ornegative.
This is for the simple reason that μ3 being the sum of the cubes ofthe deviation from the mean may be positive or negative but μ 2 is3
always positive. Also μ2 being the variance is always positive.
3 2Hence β1 = μ 2 / μ 2 is always positive.

This drawback is removed if we calculate karlpearson’s ϒ1 (
Pronounced as Gamma one). ϒ1 is defined as the square root of β1 that
is
The sign of skewness would depend upon the value of μ3. If μ3 is
positive we will have positive skewness and if μ3 is negative we will
have negative skewness.
ϒ1 = β1 = =μ32
μ22
μ3
μ23/2

β2 (Beta two):-
Beta two measures Kurtosis and is defined as:
β2 = μ4
μ22

Kurtosis is another measure of the shape of a frequency curve.
It is a Greek word, which means bulginess.
While skewness signifies the extent of asymmetry, kurtosis
measures the degree of peakedness of a frequency distribution.
Karl Pearson classified curves into three types on the basis of
the shape of their peaks.
These are Mesokurtic, leptokurtic and platykurtic. These three
types of curves are shown in figure below:

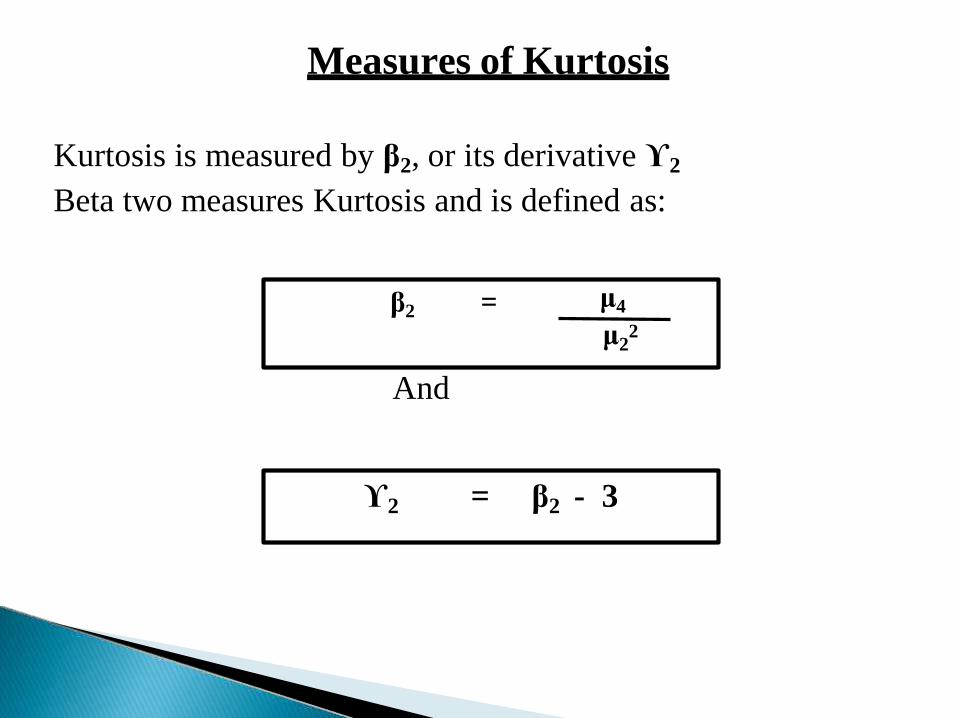
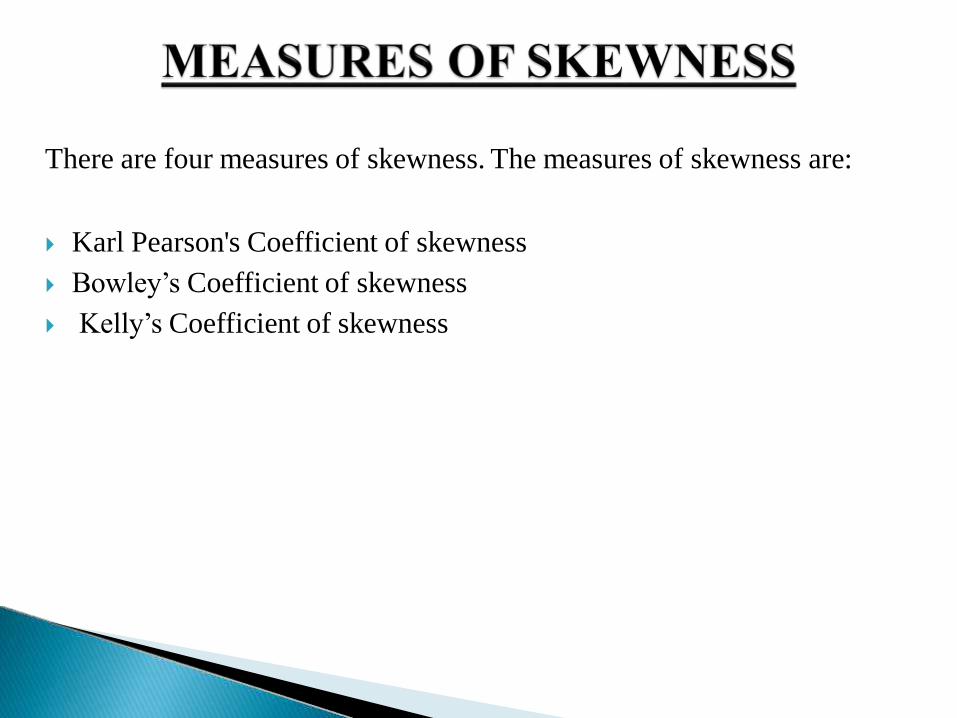
Measures of Kurtosis
Kurtosis is measured by β2, or its derivative ϒ2
Beta two measures Kurtosis and is defined as:
And
β2 = μ4
μ22
ϒ2 = β2 - 3

In case of a normal distribution, that is, mesokurtic curve, the value
of β2 = 3.
If β2 turn out to be greater than 3, the curve is called a leptokurtic
curve and is more peaked than the normal curve.
When β2 is less than 3, the curve is called a platykurtic curve and is
less peaked than the normal curve.
The measure of kurtosis is very helpful in the selection of an
appropriate average. For example, for normal distribution, mean is
most appropriate; for a leptokurtic distribution, median is most
appropriate; and for platykurtic distribution, the quartile range is
most appropriate
Related Documents