Proprietary information – not for distribution beyond intended recipient. What Investors Need to Know About Technology and Climate Change: The Race of Our Lives April 11, 2018

Welcome message from author
This document is posted to help you gain knowledge. Please leave a comment to let me know what you think about it! Share it to your friends and learn new things together.
Transcript
Proprietary information – not for distribution beyond intended recipient.
What Investors Need to Know About Technology and Climate Change: The Race of Our Lives April 11, 2018

1 JG_LSE_4-18
Proprietary information – not for distribution. Copyright © 2018 by GMO LLC. All rights reserved.
Presenter
Jeremy Grantham
Mr. Grantham co-founded GMO in 1977 and is a member of GMO’s Asset Allocation team, serving as the firm’s chief investment strategist. He is a member of the GMO Board of Directors and has also served on the investment boards of several non-profit organizations. Prior to GMO’s founding, Mr. Grantham was co-founder of Batterymarch Financial Management in 1969 where he recommended commercial indexing in 1971, one of several claims to being first. He began his investment career as an economist with Royal Dutch Shell. Mr. Grantham earned his undergraduate degree from the University of Sheffield (U.K.) and an M.B.A. from Harvard Business School. He is a member of the Academy of Arts and Sciences, holds a CBE from the UK and is a recipient of the Carnegie Medal for Philanthropy.

The Race of Our Lives:
Climate Change Accelerates

3 JG_LSE_4-18
Proprietary information – not for distribution. Copyright © 2018 by GMO LLC. All rights reserved.
Global Greenhouse Gas Oscillates… Until… Historical CO2 Levels
Proxy (Indirect) Measurements
Source: Reconstruction from ice cores Credit: NOAA

4 JG_LSE_4-18
Proprietary information – not for distribution. Copyright © 2018 by GMO LLC. All rights reserved.
Surface Temperatures: Not Just Rising but Accelerating
-1
-0.5
0
0.5
1
1.5
1900 1910 1920 1930 1940 1950 1960 1970 1980 1990 2000 2010
Tem
pera
ture
Ano
mal
y (°
C)
1958
+.007°C per year
+.025°C per year from peak to peak
+.015 °C per year
As of 8/31/16 Source: NASA Goddard Institute for Space Studies

5 JG_LSE_4-18
Proprietary information – not for distribution. Copyright © 2018 by GMO LLC. All rights reserved.
Ocean Temperatures Also Accelerating
Source: “Improved Estimates of Ocean Heat Content from 1960 to 2015”, Cheng et al, Science Advances
Ocean Heat Content (in Joules)
0 – 2000 M 1950 – 1990 = 37 units/year 1990 – 2016 = 99 units/year

6 JG_LSE_4-18
Proprietary information – not for distribution. Copyright © 2018 by GMO LLC. All rights reserved.
With Consequences!

7 JG_LSE_4-18
Proprietary information – not for distribution. Copyright © 2018 by GMO LLC. All rights reserved.
0
100
200
300
400
500
600
1950-1983 1984-2017
Num
ber o
f Dro
ught
s
0
100
200
300
400
1950-1983 1984-2017
Num
ber o
f Wild
fires
0
500
1,000
1,500
2,000
2,500
3,000
1950-1966 1967-1983 1984-2000 2001-2017
Num
ber o
f Flo
ods
Serious, Widespread Consequences Global extreme weather events have been on the rise
Floods Droughts
Wildfires Extreme Temperature Events
Source: HSBC 0
100
200
300
400
500
1950-1972 1973-1995 1996-2017
Num
ber o
f Eve
nts

Climate Change:
But Greener Technologies Also Accelerate
Resulting in De-Carbonizing the Economy

9 JG_LSE_4-18
Proprietary information – not for distribution. Copyright © 2018 by GMO LLC. All rights reserved.
From the Horse’s Mouth
“Without incentives, wind is going to be a $0.02 or $0.03 product early in the next decade. Battery storage will be $0.01 on top of that. And when you look at (...) coal and nuclear, today, operating costs are around $0.03. New wind and new solar, without incentives and combined with storage, are going to be cheaper than the operating cost of coal and nuclear in the next decade. That is going to totally transform this industry.
— James Robo, 06/22/2017
CEO of NextEra Energy
Alternative energy will crush fossil fuels – on cost!

10 JG_LSE_4-18
Proprietary information – not for distribution. Copyright © 2018 by GMO LLC. All rights reserved.
Hot Off the Press: Renewable Energy Proposals for Excel Corporation Colorado
■ 350 Proposals for wind and solar, both with battery storage for 2023
■ Median price $21/MWH for wind plus storage $36 for solar plus storage
■ Storage bids $3 – $7 down from $15/MWH for Arizona Utility in May 2017

11 JG_LSE_4-18
Proprietary information – not for distribution. Copyright © 2018 by GMO LLC. All rights reserved.
As Costs Continue to Drop for Wind and Solar, We Have Reached an Inflection Point When this exhibit was first done, the title said “Will Reach”
As of 12/31/16 Source: Lazard, SNL 2017, as cited by Carbon Tracker Initiative, No Country for Coal Gen (2017)
$/M
Wh
(Log
Sca
le)
$400
$100
$50
Unsubsidized Levelized Cost of Energy over Time
Onshore Wind
Utility Scale Solar
Coal

12 JG_LSE_4-18
Proprietary information – not for distribution. Copyright © 2018 by GMO LLC. All rights reserved.
Giant Wind Turbines Illustrate The Speed of Change Wind is becoming a powerful source of energy
As of 13/06/17 Source: Reuters, Dong Energy UK, Nextwind Inc.
2020 2016 2000
TOY MONSTER

13 JG_LSE_4-18
Proprietary information – not for distribution. Copyright © 2018 by GMO LLC. All rights reserved.
Battery Costs Continue to Drop as Well
Source: Bloomberg New Energy Finance
Lithium-ion Battery Pack Prices
-20% -20% -7% -10% -35% -22%
1,000
800642 599 540
350273
150
0
200
400
600
800
1,000
2010 2011 2012 2013 2014 2015 2016 2018Estimate
Pric
e ($
/kW
h)-45%
~

14 JG_LSE_4-18
Proprietary information – not for distribution. Copyright © 2018 by GMO LLC. All rights reserved.
Energy to Peak, Renewables to Grow... But fossil fuels still 50% by 2050
As of 09/30/17 Data from 2010-2050 is estimated or forecast Source: DNV GL, OurWorldInData.org, Vaclav Smil
World Annual Primary Energy Consumption by Source (1800-2010)
Coal

15 JG_LSE_4-18
Proprietary information – not for distribution. Copyright © 2018 by GMO LLC. All rights reserved.
But Climate Change Will Not Have Been Stopped
As of 09/30/17 Data from 2015-2050 is estimated or forecast Source: DNV GL, OurWorldInData.org, Vaclav Smil, Carbon Dioxide Information Analysis Centre
Annual Energy Supplied by Fossil Fuels, and Cumulative Total Human CO2 Emissions
16 JG_LSE_4-18
Proprietary information – not for distribution. Copyright © 2018 by GMO LLC. All rights reserved.
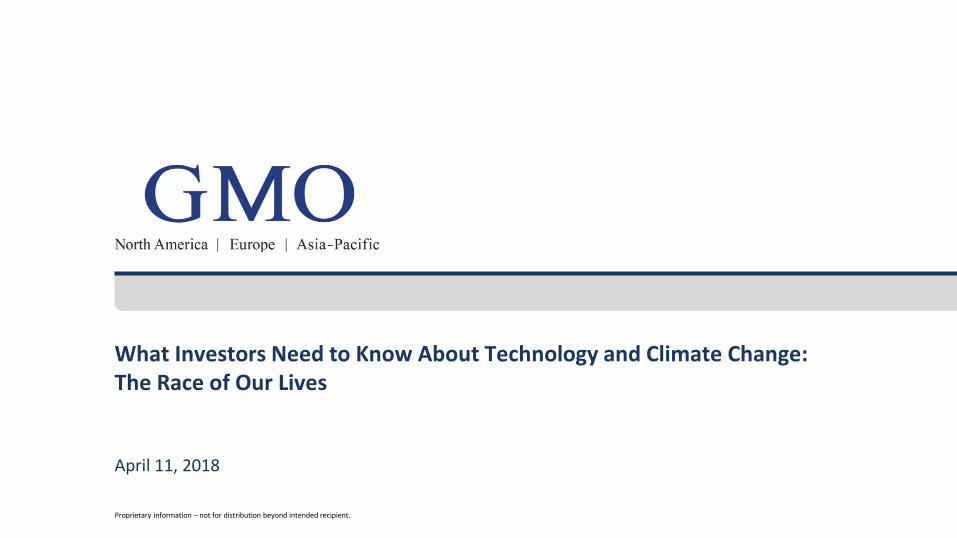
Prepare Yourselves: 2°C, Here We Come!
As of 09/30/17 Data from 2016-2050 is estimated or forecast Source: DNV GL, National Oceanic and Atmospheric Administration
Atmospheric CO2 Concentration and Temperature Increase since Pre-Industrial Era
1.9°C

17 JG_LSE_4-18
Proprietary information – not for distribution. Copyright © 2018 by GMO LLC. All rights reserved.
0
500
1000
1500
2000
2500
2015 2020 2025 2030 2035 2040 2045 2050
Billi
ons o
f 201
5 U
SD
Portfolios Must Prepare For Change Too (The biggest transformation since the introduction of oil)
As of 09/30/17 Data from 2015-2050 is estimated or forecast Source: DNV GL
Annual Global Renewable Energy Capex (billions of 2015 USD)
2.1 Trillion
300 Billion

Climate Change: But Now the Terrible News, Feeding the 12 Billion
The impact on food sufficiency of: – population growth (plus increasing wealth) – climate change – soil erosion (and many related factors)
19 JG_LSE_4-18
Proprietary information – not for distribution. Copyright © 2018 by GMO LLC. All rights reserved.
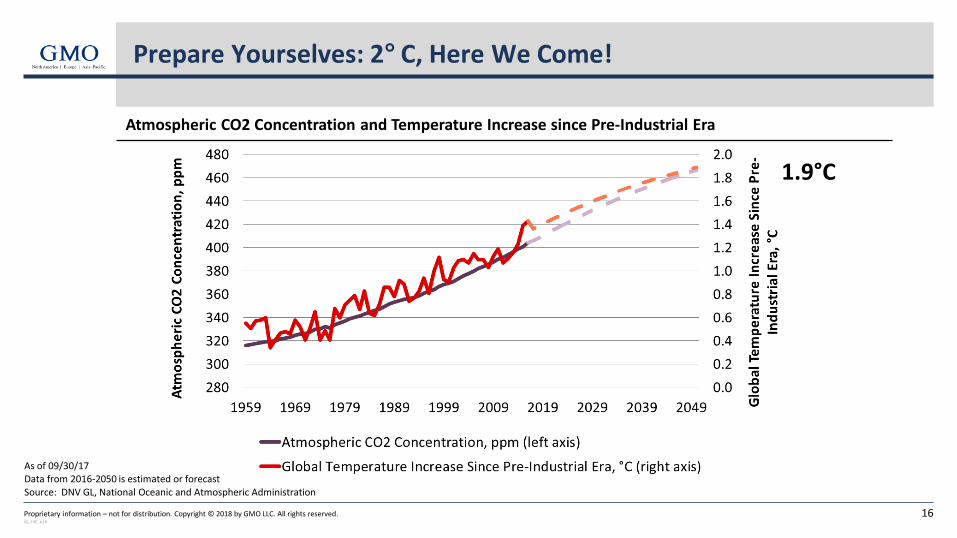
World Population Projections: 2000-2100
0
2,000,000,000
4,000,000,000
6,000,000,000
8,000,000,000
10,000,000,000
12,000,000,000
14,000,000,000
16,000,000,000
18,000,000,000
1500 1575 1650 1725 1800 1875 1950 2025 2100
Actual Low Projection Mid Projection High Projection
1798: Malthus publishes Essay on the Principle of Population
1938: I was born
X Y
1500 As of 1/25/18 Source: UN World Population Prospects

20 JG_LSE_4-18
Proprietary information – not for distribution. Copyright © 2018 by GMO LLC. All rights reserved.
As of 12/31/12 Source: World Bank, Centers for Disease Control and Prevention
Our Last Best Hope: Fertility Rates Drop Beyond the wildest dreams of Malthus
0.0
0.5
1.0
1.5
2.0
2.5
3.0
3.5
4.0
1961 1971 1981 1991 2001 2011
Ferti
lity
Rat
e, C
hild
ren
/ Wom
an
Low Birthrates in the "Western World"
United StatesFrance
GermanyItaly
United KingdomCanada

21 JG_LSE_4-18
Proprietary information – not for distribution. Copyright © 2018 by GMO LLC. All rights reserved.
Fertility Rates Also Drop for Many Poorer Countries
As of 12/31/12 Source: World Bank
Declines in Emerging Countries
Iran Bangladesh
Egypt
India Morocco
Malaysia
0.0
1.0
2.0
3.0
4.0
5.0
6.0
7.0
8.0
1961 1971 1981 1991 2001 2011
Fert
ility
Rat
e, C
hild
ren
/ W
oman

22 JG_LSE_4-18
Proprietary information – not for distribution. Copyright © 2018 by GMO LLC. All rights reserved.
African Population: The Real Population Problem (in the higher UN estimate for 2100)
As of 09/30/17 Source: United Nations World Population Prospects
World Population
Africa Nigeria The Rest of the World
2015 Population: 7.4 Billion 2050 Population: 9.8 Billion 2100 Population: 11.2 Billion
Total increase in population: 3.8 Bn
0.5 Bn 0.6 Bn 3.3 Bn Of which:

23 JG_LSE_4-18
Proprietary information – not for distribution. Copyright © 2018 by GMO LLC. All rights reserved.
0
5
10
15
20
25
1961 1970 1979 1988 1997 2006 2015
Trill
ion
kcal
/ d
ay
Total World Food Demand Trillions of kilocalories daily
As of Dec 2016 Source: FAOSTAT

24 JG_LSE_4-18
Proprietary information – not for distribution. Copyright © 2018 by GMO LLC. All rights reserved.
(projection*)
10-Year Average Annual Growth In Crop Yields
0.0%
0.5%
1.0%
1.5%
2.0%
2.5%
3.0%
3.5%
4.0%
1971 1976 1981 1986 1991 1996 2001 2006 2011
3.5%
1.0%
1971 2006
10-Year Average Growth in Crop Yields
10-Year Average Growth in Population
As of 9/17/12 Source: Food and Agriculture Organization of the United Nations, GMO * 2011 crop yields is a projection; population data is actual.

25 JG_LSE_4-18
Proprietary information – not for distribution. Copyright © 2018 by GMO LLC. All rights reserved.
Growth in Very Best Yielding Crops Slow Towards Zero Crop Yields (5-Year Moving Average)
As of 12/31/13 Source: UN Food and Agriculture Organization
40,000
45,000
50,000
55,000
60,000
65,000
70,000
0
10,000
20,000
30,000
40,000
50,000
60,000
70,000
80,000
90,000
1961 1966 1971 1976 1981 1986 1991 1996 2001 2006
Rice Yields, Hg/Ha
Whe
at Y
ield
s, Hg
/Ha
France (Wheat - Left Axis)
Germany (Wheat - left axis)
United Kingdom (Wheat - left axis)
Japan (Rice - right axis)

26 JG_LSE_4-18
Proprietary information – not for distribution. Copyright © 2018 by GMO LLC. All rights reserved.
-
2
4
6
8
10
12
1961 1966 1971 1976 1981 1986 1991 1996 2001 2006 2011
Fertilizer Use Starts to Max Out Tons of fertilizer used annually
As of 12/31/12 Source: Food and Agriculture Organization of the United Nations
10
1961
5X

27 JG_LSE_4-18
Proprietary information – not for distribution. Copyright © 2018 by GMO LLC. All rights reserved.
0.0%
0.5%
1.0%
1.5%
2.0%
2.5%
3.0%
3.5%
4.0%
1930-1950 1950-1970 1970-1990 1990-2010 2010-2030 (GMOprojection)
Aver
age
Annu
al Y
ield
Gro
wth
Grain Productivity Shows Diminishing Returns
-1.7%
-0.5% -0.25%
Green Revolution
Average Annual Agricultural Productivity Growth in the United States, by 20-year block Average of yield growth for corn, wheat and rice
As of Jan 2018 Source: USDA NASS

28 JG_LSE_4-18
Proprietary information – not for distribution. Copyright © 2018 by GMO LLC. All rights reserved.
Effect of Erosion on Grain Production
U.S. Grain Yields, Historical and Projected Index averaging corn, wheat, soy and rice yields, 2017 = 1
-10%
As of Jan 2018 Source: USDA NASS; “Soil Erosion, Climate Change and Global Food Security: Challenges and Strategies”, Rhodes, Science Progress, 2014; GMO
0.0
0.5
1.0
1.5
1970 1980 1990 2000 2010 2020 2030 2040
Historic Data
Projection only of historic productivity advances
Projection including effect of soil erosion (Rhodes 2014)
Projection including effect of increased flooding on soil erosion*

29 JG_LSE_4-18
Proprietary information – not for distribution. Copyright © 2018 by GMO LLC. All rights reserved.
Image Source: Iowa Public Radio “The Greatest Story Never Told”, installation in Adair County, Iowa, by David B. Dahlquist and RDG Planning & Design.
Soil Depth in Iowa Has Halved Since Intensive Cultivation Began in 1850
14”
11.5”
9.5” 7”
5.5”
1850 1900 1950 1975 2000

30 JG_LSE_4-18
Proprietary information – not for distribution. Copyright © 2018 by GMO LLC. All rights reserved.
Effect of Climate Change on Grain Production
0.0
0.2
0.4
0.6
0.8
1.0
1.2
1.4
1.6
1970 1980 1990 2000 2010 2020 2030 2040
Historic Data
Projection only of historic productivity advances
Projection including effect of climate change (Liang et al 2017)
U.S. Grain Yields, Historical and Projected Index averaging corn, wheat, soy and rice yields, 2017 = 1
-47%
As of Jan 2018 Source: USDA NASS; “Determining Climate Effects on US Total Agricultural Productivity”, Liang et al, Proceedings of the National Academy of Sciences; GMO

31 JG_LSE_4-18
Proprietary information – not for distribution. Copyright © 2018 by GMO LLC. All rights reserved.
Combined Effect Climate Change & Soil Erosion
As of Jan 2018 Source: USDA NASS, Rhodes 2014, Liang et al 2017, GMO
U.S. Grain Yields, Historical and Projected Index averaging corn, wheat, soy and rice yields, 2017 = 1
-56%
0.0
0.5
1.0
1.5
1970 1980 1990 2000 2010 2020 2030 2040
Historic DataProjection only of historic productivity advancesProjection including diminishing productivity advancesProjection including impact of soil erosionProjection including erosion / flooding interactionProjection including erosion accelerated by climate changeProjection including effect of climate changeProjection including adaptation to climate change
-38%

32 JG_LSE_4-18
Proprietary information – not for distribution. Copyright © 2018 by GMO LLC. All rights reserved.
Other Problems Facing “Big Ag”
■ Water availability
■ Urban expansion
■ Bug and pathogen immunity
■ Toxic environment
−75% loss of flying insects
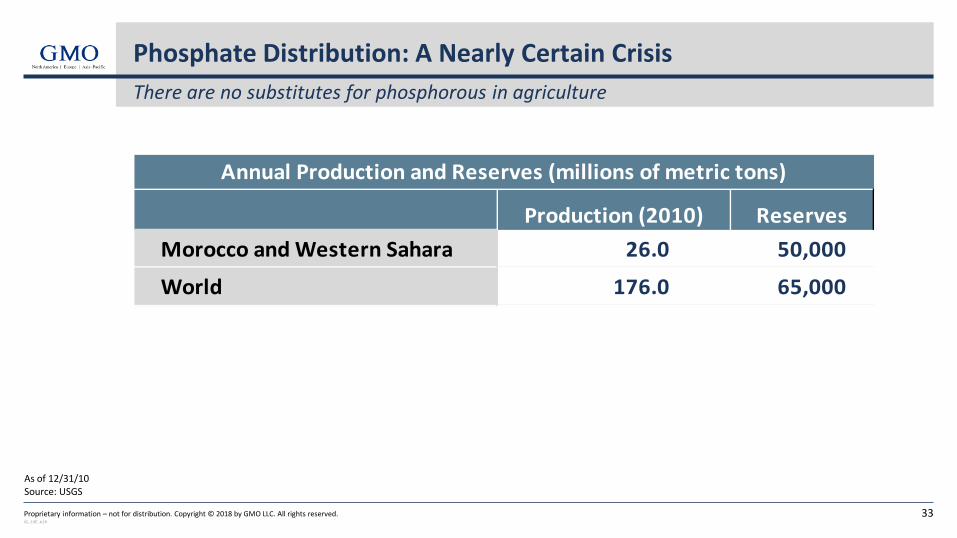
■ Global distribution of phosphate reserves
33 JG_LSE_4-18
Proprietary information – not for distribution. Copyright © 2018 by GMO LLC. All rights reserved.
Phosphate Distribution: A Nearly Certain Crisis There are no substitutes for phosphorous in agriculture
As of 12/31/10 Source: USGS
Production (2010) ReservesMorocco and Western Sahara 26.0 50,000
World 176.0 65,000
Annual Production and Reserves (millions of metric tons)

Climate Change: Problems with Capitalism
The Sixth Great Extinction
Toxicity affecting humans also: over 50% loss of sperm count in developed world
Complete inability of capitalism to deal with externalities, tragedies of the commons, and the very long-term
The Devil and the Farmer

35 JG_LSE_4-18
Proprietary information – not for distribution. Copyright © 2018 by GMO LLC. All rights reserved.
The Devil’s Deal: Your Soil & Your Soul! Three times more profit now in exchange for 1% per year soil erosion over 100 years (i.e. complete)
Profits per year under deal and no deal
As of Jan 2018 Source: GMO
0
50,000
100,000
150,000
200,000
250,000
300,000
350,000
0 10 20 30 40 50 60 70 80 90 100
Annu
al P
rofit
s
Year
"No deal" present value (5% discount rate): $2,000,000
"Deal" present value (5% discount rate): $5,583,000!

36 JG_LSE_4-18
Proprietary information – not for distribution. Copyright © 2018 by GMO LLC. All rights reserved.
Illustrative Climate Change Portfolio (Global Equities)
Segment Exposure
Clean Energy 34.58%Solar 9.92%Wind 5.61%Other Clean Energy 0.95%Clean Power Generation 10.45%Batteries & Storage 7.66%
Smart Grid 5.44%Copper 9.30%Energy Efficiency 20.31%
Transportation 6.25%Buildings 0.32%Diversified Efficiency 7.81%Technology 2.88%Lighting 1.68%Recycling 1.36%
Agriculture 23.18%Farming 5.33%Farm Machinery 2.51%Timber 1.20%Eco-Chemicals/Seeds 2.42%Fertil izer 8.34%Fish Farming 3.38%
Water 4.93%Cash 2.25%

And Finally the Peril of Divestment!
38 JG_LSE_4-18
Proprietary information – not for distribution. Copyright © 2018 by GMO LLC. All rights reserved.
-0.5
0.0
0.5
1.0
1.5
2.0
2.5
3.0
Sep-90 Mar-95 Sep-99 Mar-04 Sep-08 Mar-13 Sep-17
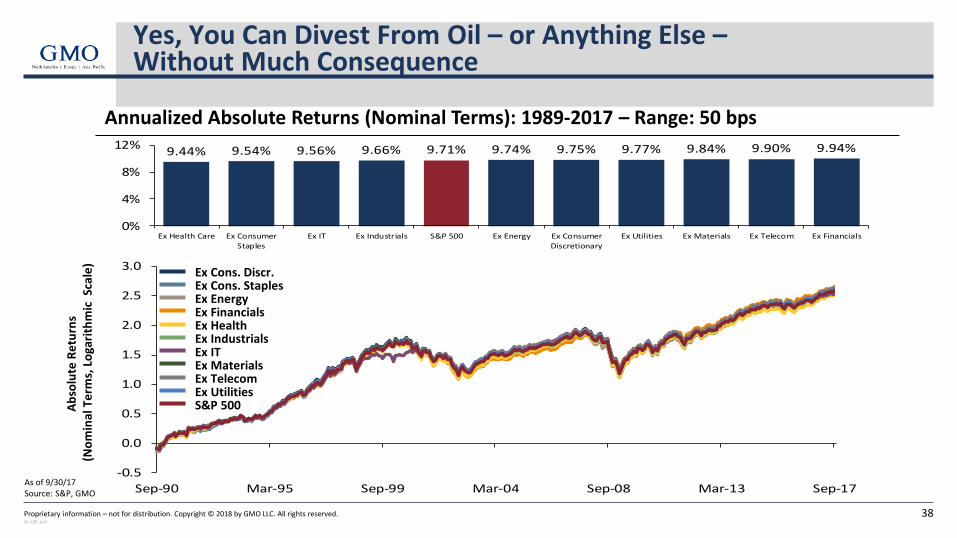
9.44% 9.54% 9.56% 9.66% 9.71% 9.74% 9.75% 9.77% 9.84% 9.90% 9.94%
0%
4%
8%
12%
Ex Health Care Ex ConsumerStaples
Ex IT Ex Industrials S&P 500 Ex Energy Ex ConsumerDiscretionary
Ex Utilities Ex Materials Ex Telecom Ex Financials
Yes, You Can Divest From Oil – or Anything Else – Without Much Consequence
Annualized Absolute Returns (Nominal Terms): 1989-2017 – Range: 50 bps
Ex Cons. Discr. Ex Cons. Staples Ex Energy Ex Financials Ex Health Ex Industrials Ex IT Ex Materials Ex Telecom Ex Utilities S&P 500 Ab
solu
te R
etur
ns
(Nom
inal
Ter
ms,
Log
arith
mic
Sca
le)
As of 9/30/17 Source: S&P, GMO

39 JG_LSE_4-18
Proprietary information – not for distribution. Copyright © 2018 by GMO LLC. All rights reserved.
Yes, You Can Divest From Oil – or Anything Else – Without Much Consequence
As of 9/30/17 Source: S&P, GMO Note: Prior to March 1957 the S&P 500 is represented by the S&P 90 Index
10.04% 10.12% 10.18% 10.25% 10.28% 10.28% 10.34% 10.34% 10.34% 10.39% 10.65%
0%
4%
8%
12%
Ex ConsumerStaples
Ex HealthCare
Ex Energy S&P 500 Ex ConsumerDiscretionary
Ex IT Ex Industrials Ex Telecom Ex Utilities Ex Financials Ex Materials
1957-2017 Range: 61bps
11.37% 11.39% 11.44% 11.48% 11.51% 11.51% 11.51% 11.53% 11.54% 11.57% 11.91%
0%
4%
8%
12%
Ex ConsumerStaples
Ex HealthCare
Ex ConsumerDiscretionary
Ex Energy Ex IT Ex Telecom Ex Utilities S&P Index Ex Financials Ex Materials Ex Industrials
1925-2017 Range: 54bps
Related Documents