1 POST-GRADUATE STUDENT RESEARCH PROJECT What Explains the IPO Cycle? Prepared by Lishan Du PhD in Finance Judge Business School, University of Cambridge Supervised by Raghavendra Rau Sir Evelyn de Rothschild Professor of Finance Judge Business School, University of Cambridge March 2014

Welcome message from author
This document is posted to help you gain knowledge. Please leave a comment to let me know what you think about it! Share it to your friends and learn new things together.
Transcript

1
POST-GRADUATE STUDENT RESEARCH PROJECT
What Explains the IPO Cycle?
Prepared by
Lishan Du
PhD in Finance
Judge Business School, University of Cambridge
Supervised by
Raghavendra Rau
Sir Evelyn de Rothschild Professor of Finance
Judge Business School, University of Cambridge
March 2014

2
What Explains the IPO Cycle?
Prepared by Lishan Du*
Abstract
The paper explores the drivers of initial public offering (IPO) cycles. In this, it closely follows
Lowry (2003). The primary contribution of the paper lies in analysing the U.K. IPO market using
a longer period from 1960 to 2009. The U.K. has been the next most important IPO market after
the U.S. over the last half century. We use quarterly time-series regressions of IPO volume to
analyse the explanatory power of capital demands, information asymmetry, and investor
sentiment hypotheses using proxies and controlling market variables. Subsequently, we use
regressions of post-IPO returns to analyse the relationship between IPO volume and post-IPO
stock and market returns. The paper finds that high future capital demand and recent information
asymmetry are important explanatory variables of high IPO volumes in the U.K. market. Unlike
Lowry (2003), we do not find evidence to support investor sentiment as a basis for fluctuations
in IPO volume in the U.K.
* Lishan Du, PhD in Finance, Judge Business School, University of Cambridge. The views expressed in the paper
are those of the author and do not necessarily reflect the opinion of the National Stock Exchange of India Ltd. I
would like to thank Raghavendra Rau and David Chambers for supervision and data support. The author can be
contacted at [email protected].

3
What Explains the IPO Cycle?
1. Introduction
Whether or not to go public is an important decision for a company during its life cycle.
Companies obtain external equity financing through an initial public offering (IPO) of the shares
when they go public. There are many reasons for listing a company on a stock exchange
including easier access to additional capital, lower cost of funding with greater diversification
and liquidity, as well as the potential to undertake some attractive investments. However, after
the transformation from a private to a listed company, the company has to follow strict legal and
regulatory requirements as well as disclose financial and business information. As a result, the
shareholders bear the high costs of the IPO and suffer possible dissemination of business-
relevant information to its peers and competitors.
There are three major academic issues related to IPOs. First, IPOs are typically underpriced—the
share price rises substantially on the first trading day. Underpricing is often referred to as the
initial return, defined as the percentage change of the closing price on the first day relative to the
IPO offer price. Extensive empirical research has shown that underpricing occurs across
countries and over time, suggesting that firms leave a considerable amount of money on the
table. The level of underpricing tends to fluctuate substantially. For example, Chambers and
Dimson (2009) presented innovative and comprehensive evidence of the significant changes in
underpricing in the U.K. IPO market throughout the twentieth century.1 The extant academic
literature focuses on explaining why IPOs are usually underpriced. Previous studies mainly
tested asymmetric information models and provided institutional explanations, ownership and
control considerations, and behavioural explanations to explain IPO underpricing.2
Second, IPOs typically occur in cycles. These cycles in IPO volume and the fluctuations in the
level of underpricing are observed because IPOs tend to come in waves characterised by hot/cold
1 Underpricing had an average of 3.8% from 1917 to 1945, 9.15% from 1846–1986, and 19% from 1986–2007 in the
U.K (Chambers and Dimson, 2009). 2 Asymmetric information models include: winner’s curse (Rock, 1986), information revelation theory (Benveniste
and Spindt, 1989), principal-agent model (Baron, 1982), and signalling model (Welch, 1989). Institutional
explanations include: legal liability and price stabilisation. Control models were proposed by Brennan and Franks
(1997). Behavioural models include: investor sentiment (Ljungqvist et al., 2006) and prospect theory (Loughran and
Ritter, 2002).

4
market periods. ―Hot issue‖ markets—usually denoting periods with high average initial
returns—appear to be followed by periods of high IPO volume. Two commonly used measures
of IPO volume are the number of IPOs and the total proceeds received in the offerings. The
number of firms going public is far from random, showing a close relationship with
underpricing. However, underpricing and IPO volume cycles are typically not perfectly
synchronised. For instance, data from the U.S. market shows that the initial returns led IPO
volume by 6–12 months.3 Moreover, a set of particular industries can drive up the IPO volume,
such as the oil and gas industry in the 1980s for the U.S. and the technology industry in the
1990s in both the U.S. as well as the U.K. Figure 1 illustrates the cycles in IPO volume and
average underpricing in the U.K. during the period 1960–2007. The time series in Figure 1
includes 3914 IPOs issued on either the main market of the London Stock Exchange or its junior
market, the Alternative Investment Market, during a 53-year period in the U.K. The plot of the
real gross proceeds (RGP) of IPOs in Panel B supports prior findings based on data from other
countries. The IPO volume and initial returns fluctuate substantially in cycles over time. For
example, only 643 firms went public in the 1960s, while 1413 firms went public during the 10-
year period from 1998–2007. Notably, the fluctuation in the proceeds from IPOs can be observed
even with Gross Domestic Production (GDP) deflator adjustment, implying that factors other
than the inflation over time affect the timing of IPOs. The IPOs were underpriced with positive
initial returns during most periods in the U.K., as shown in Figure 1. Figure 1 also suggests that a
high level of IPO underpricing subsequently drives a high level of IPO volume; two famous hot
issue markets in the U.K. happened during the ―Big Bang‖ in 1986 and the Internet boom in
2000.
Finally, although the U.S. and the U.K. capital markets are generally similar, the IPO selling
process is significantly different in the two countries. The U.S. has a long history of selling IPOs
via a book-building mechanism, which has also become increasingly popular in the U.K. starting
in the 1990s. However, the book-building process is different in the two countries. In the U.S.,
book building starts with the setting of a price range; a revised price range might be filed after
institutional investors express their demand; finally, the offer price could be set up to 20% above
or below the latest price range. In contrast, the price range in the U.K. IPOs is set after the start
3 See Ibbotson et al. (1994) for evidence from the U.S. market; see Jenkinson and Ljungqvist (2001) for evidence
from global markets.

5
of the book-building process, with the final offer price being adjusted in the direction given by
the when-issued market price. In addition, the fees charged by underwriters for U.K. IPOs are
lower than those in the U.S. The fees charged when using book-building methods are higher than
those charged when using auctions or traditional fixed price offers. Many empirical studies have
argued that the IPO issuing methods do have an impact on the degree of IPO underpricing as
well as the efficiency of the IPO market. Biais et al. (2002) conclude that the book-building
mechanism results in more severe underpricing and a less optimal outcome for issuers compared
to the auction method.
Among these three major topics of IPO underpricing, IPO cycles, and selling mechanisms, this
paper focuses on the less documented topic of IPO cycles in the context of the U.K. IPO market.
The IPO cycle is closely associated with hot and cold markets. As documented by Ibbotson and
Jaffe (1975) and Ritter (1984), a hot issue market is defined as a period in which IPOs have high
initial daily or monthly returns (higher than the previous mean returns). They also found that
each hot issue market period is followed by a significant increase in IPO volume. Loughran and
Ritter (2002) explained the hot issue markets using behavioural explanations such as prospect
theory. They argued that the positive initial returns imply that ―money is left on the table‖ by the
issuing companies. Thus, it is important for both companies as well as investors to understand
the determinants of the IPO cycle in order to make decisions on the timing of IPOs.
Using Lowry (2003) as the basic theoretical framework, the current paper examines the U.K.
IPO cycle by employing a time series of U.K. IPO data during the period 1960–2009. This is
important because existing research on IPOs, especially IPO cycles, is very U.S.-centric. The
analysis was begun from the year 1960 due to the availability of data and comparability to
Lowry’s (2003) dataset. The ending year was decided as 2009 instead of the most recent year in
order to study the long-run performance of IPOs (3 years). The U.K. has had a vibrant primary
equity market for a long time. Between 1960 and 2009, 3734 companies went public. The
objective of this paper is to investigate how the IPO volume cycle fluctuates over time using
large sets of U.K. data and to compare the results with Lowry’s (2003) findings on the U.S. IPO
market.

6
Figure 1: Time Series of IPO Volume—Number of IPOs and Real Gross Proceeds from IPOs in the
U.K. (1960–2012)
Panel A: Number of IPOs in each quarter during 1960–2012
Panel B: Plot of the real gross proceeds of IPOs during 1960–2012 in millions each quarter deflated
by the GDP in 2007
Following Lowry’s (2003) model, the paper investigates how capital demand, information
asymmetry, and investor sentiment can explain the variations in IPO volume in the U.K. and how
post-IPO long-run performance is related to IPO volume. Lowry’s (2003) model showed that
capital demand and investor optimism explain a substantial portion of the variation in the U.S.
0
10
20
30
40
50
60
70
80
19
60
19
61
19
63
19
65
19
67
19
68
19
70
19
72
19
74
19
75
19
77
19
79
19
81
19
82
19
84
19
86
19
88
19
89
19
91
19
93
19
95
19
96
19
98
20
00
20
02
20
03
20
05
20
07
20
09
20
10
20
12
Number of U.K. IPOs
0
1000
2000
3000
4000
5000
6000
7000
8000
9000
19
60
19
61
19
63
19
65
19
67
19
68
19
70
19
72
19
74
19
75
19
77
19
79
19
81
19
82
19
84
19
86
19
88
19
89
19
91
19
93
19
95
19
96
19
98
20
00
20
02
20
03
20
05
20
07
20
09
20
10
20
12
RGP of U.K. IPOs
RGP (2007 rebase, in mlns)
7
IPO volume. In contrast, the results of the current study show that the firms’ aggregate capital
demand and information asymmetry significantly explain the variation in IPO volume in the
U.K. The investor sentiment hypothesis does not appear to affect IPO volume fluctuation after
controlling for market condition variables. The results also show that the average post-IPO raw
return is positive while the average post-IPO market-adjusted abnormal return is slightly
negative. Both the post-IPO raw and abnormal returns are significantly and negatively correlated
with IPO volume. Given the differences in the significant drivers of IPO volume variation in the
U.S. and the U.K., for practical implications, the U.K. IPO volume appears to depend more on
the underwriters’ perceptions compared to those of the investors.
The remainder of this paper is organised as follows. Section 2 reviews the relevant literature and
proposes the hypotheses for the IPO cycle. Section 3 describes the data including the proxies,
control variables, and post-IPO data used in the empirical research. Section 4 presents the
empirical results for the two main parts of the IPO volume research: one is the relationship
between IPO volume variation and time-series variation in capital demand, the adverse-selection
costs due to information asymmetry, and the extent of investor sentiment; the other one is the
relationship between IPO volume and post-IPO returns. Section 5 summarises the main findings
and concludes the paper.
2. Literature Review and Hypotheses
While there is a considerable body of literature on IPOs, the extant research on variations in IPO
volume is relatively limited. Ibbotson and Jaffe (1975) documented substantial fluctuations in
IPO volume and attributed this phenomenon to hot issue markets. However, they did not
empirically test the underlying factors that contribute to the variation. Lowry and Schwert (2002)
focused on the interaction between IPO volume and IPO underpricing. They found that IPO
volume tends to be higher following periods of high initial returns because more firms are
willing to take advantage of hot markets and positive information. Thus, while some studies dealt
with the substantial fluctuations in IPO volume and tried to give some explanations for such
variation, very few studies comprehensively examined the underlying causes of IPO volume
cycles. Lowry (2003) suggested three potential explanations for the variations in IPO volume

8
based on evidence from the U.S.: capital demand, information asymmetry, and investor
sentiment.
2.1 Capital Demand Hypothesis
Under the capital demand hypothesis, firms issue equity due to their need for external capital.
The variation in IPO volume is driven by changes in the aggregate financing demand of private
firms. Such capital demand is then affected by the changes in the business cycle and economic
conditions. If economic expansion results in better investment opportunities and lower cost of
capital relative to the cost of debt, then firms tend to have greater capital demand to finance these
projects. In general, IPO volume increases when aggregate capital demand increases. The
variation in IPO volume is mainly caused by time-varying costs of equity and debt. Choe et al.
(1993) pointed out that economic conditions do have effects on equity issuing, as indicated by
empirical evidence that more companies make seasoned equity offerings when the economic
conditions are better. Pastor and Veronesi (2005) also found that IPO waves occur as a response
to market conditions rather than market misvaluations. Dittmar and Dittmar (2008) further
confirmed that changes in economic conditions affect aggregate capital demand and drive waves
of equity issuance. Specifically, economic expansion lowers the cost of equity, inducing more
firms to conduct IPOs. The results indicate that an increase in equity issuance occurs early in the
business cycle. Thus, the first hypothesis predicts that IPO volume is positively related to
aggregate capital demand.
2.2 Information Asymmetry (Agency Costs) Hypothesis
Information asymmetry arises from the information gap between managers and the market about
firm value. When information asymmetry is very high, companies suffer from high adverse
selection costs in addition to the direct issue costs. If the total costs exceed the benefits of an
IPO, firms will postpone the IPO until such time as the benefits can cover the costs, in order to
maximise firm value. Thus, the information asymmetry hypothesis suggests that the IPO cycle is
affected by the time-varying costs of adverse selection. Lucas and McDonald (1990) and Bayless
and Chaplinsky (1996) found that changes in information asymmetries contribute to the variation
in seasoned equity issue volume and that high information asymmetry is associated with a lower
level of seasoned equity issue. They then speculated that the results could be applied to IPOs as

9
well. Choe et al. (1993) showed that adverse selection costs decrease during economic
expansion, leading to an increased proportion of equity issues, given their relatively higher
benefits than costs. Thus, the second hypothesis predicts that IPO volume is negatively
correlated with information asymmetry.
2.3 Investor Sentiment (Misvaluation) Hypothesis
According to the investor sentiment hypothesis, fluctuations in IPO volume are due to the
changes in the level of investor optimism, which lead to the varying costs of issuing equity.
When investors are highly optimistic, they are willing to pay more for firms than they are
actually worth. In such a scenario, the costs of equity issuance are very low, causing many firms
to go public; thus, the IPO volume becomes relatively high. That is, firms want to issue
overvalued IPOs during periods of high investor sentiment. Lee et al. (1991) found that the
variations in investor sentiment significantly affect IPO volume. Loughran and Ritter (1995)
pointed out that periods of high returns tended to be followed by high volumes of equity
issuance. Baker and Wurgler (2000) found that new equity issuance has negative forecasting
power for future returns, supporting the finding that managers decide the timing of IPOs to take
advantage of overvaluation. Baker et al. (2012) explained investor sentiment using variables
including IPO volume for six major stock markets and the overall global market.
2.4 Comparison of the Three Hypotheses
Although Lowry (2003) formalised capital demand and information asymmetry as two separate
hypotheses, they are actually linked to each other because the costs of adverse selection are
related to the costs of equity and debt. While capital demand focuses on the demand for equity
and information asymmetry depends on the supply side, both hypotheses assume that the market
is semi-strong form efficient, with rational expectations of investment opportunities. In contrast,
the investor sentiment hypothesis—depending on the market supply of equity financing—asserts
that the market is inefficient and that firms would like to launch an IPO during periods of
overvaluation.
In addition to the above potential explanatory variables, IPO volume may be related to post-IPO
stock returns and abnormal returns. Ritter (1991) as well as Loughran and Ritter (1995)
concluded that IPO volume is negatively related to post-IPO stock returns. In their long-run

10
analysis, they found that the IPOs issued during periods of high volume had worse performance
given the lower post-IPO returns. Although long-run IPO performance has been discussed a lot,
empirical research on the interaction between IPO volume and long-run IPO performance has not
yet received much attention, especially in the context of the U.K. stock market.
3. Data and Methodology
The analysis in this paper uses a panel of 3734 companies that issued IPOs during the period
1960–2009 in the U.K. These firms are listed on either the main market of the London Stock
Exchange or its junior market, the Alternative Investment Market. The analysis uses the IPO
dataset taken from Chambers and Dimson (2009)4 as well as data from London Stock Exchange
website. The dataset excludes the IPOs of venture capitals, closed-end funds (known as
investment trusts in the U.K.), penny-stock IPOs with an offer price of 10 pence or less,5 and
new listings by firms already listed on another stock exchange.
3.1 Descriptive Statistics on IPOs
Table 1 presents the descriptive statistics on the U.K. IPOs during the period 1960–2012 with
prospectus data. The 4164 companies raised real gross proceeds (RGP) of GBP 874 billion with
average real proceeds per IPO of GBP 210 million (in 2007 currency). Compared to the stock
market in the U.S. (USD 12), the U.K. IPOs had relatively low offering prices whose average
was GBP 1.1. On average, the IPOs were underpriced with a positive first-day return of 16.7%.
Table 1 includes the number of IPOs and the RGP for the IPOs during the period 2008–2012;
however, this data is not included in the regression analyses. The firms that issued IPOs during
1960–2012 were classified into 10 industries, namely, basic materials, consumer goods,
consumer services, financials, healthcare, industrials, oil and gas, technology,
telecommunications, and utility; 19 firms did not fit into these industries. Among these 10
industries, the consumer goods industry includes the automobiles and parts, personal and
household goods, and food and beverages sectors; the consumer services industry includes the
4 Chambers and Dimson’s (2009) dataset is originally drawn from the Times Book of Prospectuses, the Singer and
Friedlander New Equity Issue Statistics, the Extel Book of New Issues, KPMG New Issue Statistics, Stock
Exchange Daily Official List, and The Financial Times. 5 Penny-stock IPOs were excluded in order to make the dataset and results comparable to those of Lowry (2003).
Moreover, there was only a small number of penny-stock IPOs compared to the large sample of 3734 IPOs.

11
media, retail, and travel and leisure sectors; the financial industry includes the financial services,
banks, insurance, and real estate sectors; and the industrial industry includes the industrial goods
and services as well as construction and materials sectors.
Table 1: Descriptive Statistics on U.K. IPO Volume (1960–2012)
IPOs: 1960–2012
No. of IPOs
Real gross proceeds (GBP
millions in 2007 currency)
Total 4164 GBP 873, 949
1960s
1970s
1980s
643
268
811
367,996
170,490
138,947
1990s 686 89,291
2000s 1326 171,027
2010-2012 181 25,489
1960–2012 Mean Median Standard deviation
Total proceeds (millions) 32.63 4.02 171.32
Offer price 1.10 0.83 4.34
Initial returns (%) 16.71 8.51 0.10
Industry
No. of IPOs
(1960–2012)
No. of IPOs in each industry in each decade
1960s 1970s 1980s 1990s 2000-12
Basic Materials 254 31 8 21 27 174
Consumer Goods 465 158 64 129 48 26
Consumer Services 824 125 60 190 193 256
Financials 614 102 35 92 70 315
Healthcare 176 2 5 11 45 113
Industrials 1014 223 88 280 286 236
Oil & Gas 139 0 7 23 13 96
12
Technology 344 3 1 63 81 196
Telecommunications 43 0 0 1 15 27
Utilities 29 0 0 0 2 27
The last section of Table 1 presents the number of IPOs for each industry in each decade (1960s,
1970s, 1980s, 1990s, and 2000–2012), showing the popularity of the industries over time. For
instance, the basic materials, oil and gas, and technology industries became active in recent
decades; the consumer goods and financials industries fluctuated a lot over the long period.
Unlike in the U.S. IPO markets, there is much stronger evidence of industry clustering in the
U.K. hot IPO markets. For example, the recent hot markets mainly came from the technology
and telecommunication industries during the dot-com boom in 2000 and from the oil and gas
industry around 2005. Such key differences from the U.S. IPO market are consistent with the
findings reported by Benveniste et al. (2002).
3.2 Time Series of Proxy Variables for Hypotheses Tests
The variables for capital demand, information asymmetry, and investor sentiment cannot be
directly observed. Thus, three sets of proxies were employed for these hypotheses in order to
investigate how they explain the IPO volume. Table 2 provides the descriptive statistics of the
proxies and control variables used in the quarterly time-series regressions. Since the time series
were different for capital demand (1985–2007), information asymmetry (1990–2007), and
investor sentiment (1962–2007), multiple quarterly regressions were performed. The following
sections discuss each proxy variable in detail. The definitions and time series of each variable are
summarised in the Appendix.
Table 2 provides the descriptive statistics, the mean, median, and standard deviation of the
explanatory variables (both proxies as well as control variables) used in Tables 3–5. The first
group in Table 2 contains the capital demand proxies. Quarterly industrial production growth
equals the log of real industrial production in quarter t minus the log of real industrial production
in quarter t-1. Quarterly GDP growth and investment growth represent the percentage change in
real GDP and investment each quarter. The second group contains the information asymmetry
proxies, which are used only in the quarterly time-series regressions. The dispersion of abnormal
returns around earnings announcements equals the standard deviation of the abnormal returns
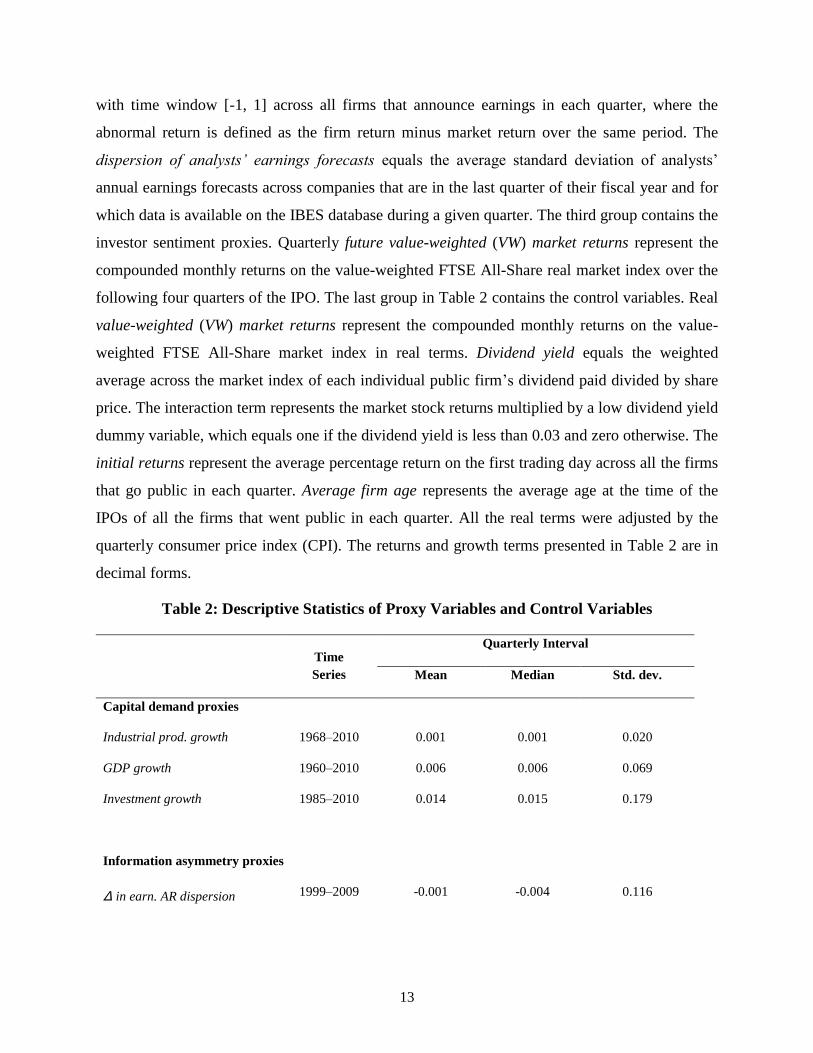
13
with time window [-1, 1] across all firms that announce earnings in each quarter, where the
abnormal return is defined as the firm return minus market return over the same period. The
dispersion of analysts’ earnings forecasts equals the average standard deviation of analysts’
annual earnings forecasts across companies that are in the last quarter of their fiscal year and for
which data is available on the IBES database during a given quarter. The third group contains the
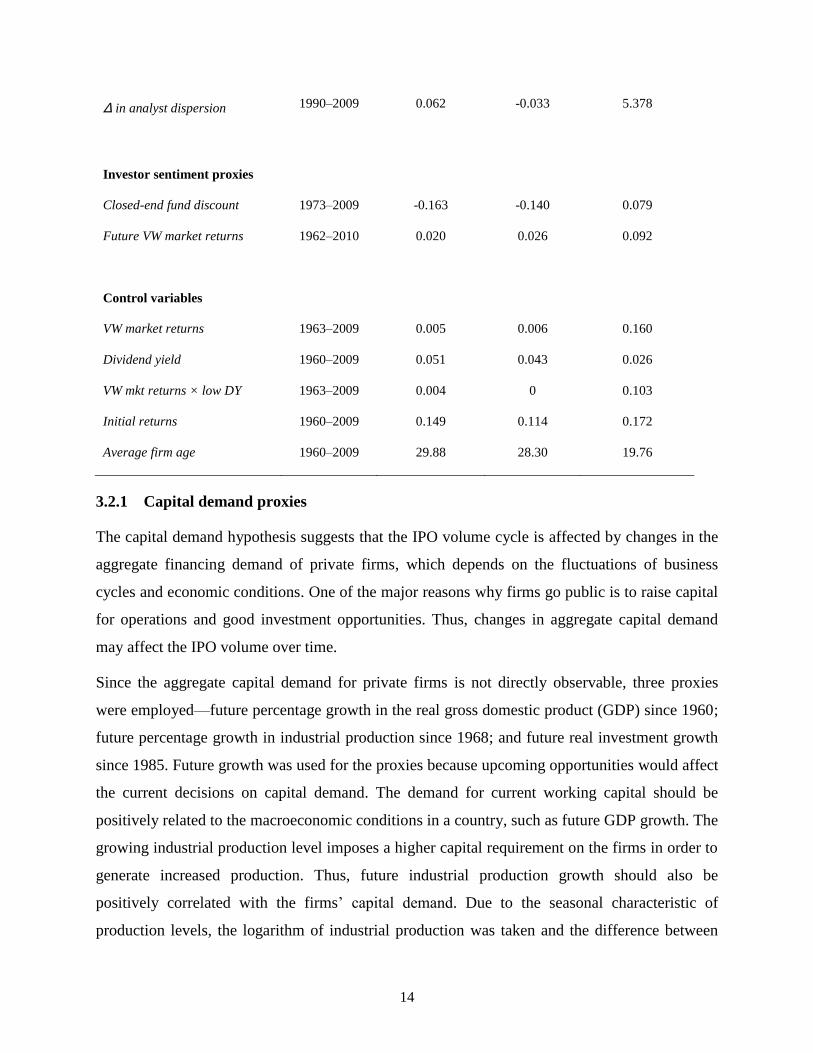
investor sentiment proxies. Quarterly future value-weighted (VW) market returns represent the
compounded monthly returns on the value-weighted FTSE All-Share real market index over the
following four quarters of the IPO. The last group in Table 2 contains the control variables. Real
value-weighted (VW) market returns represent the compounded monthly returns on the value-
weighted FTSE All-Share market index in real terms. Dividend yield equals the weighted
average across the market index of each individual public firm’s dividend paid divided by share
price. The interaction term represents the market stock returns multiplied by a low dividend yield
dummy variable, which equals one if the dividend yield is less than 0.03 and zero otherwise. The
initial returns represent the average percentage return on the first trading day across all the firms
that go public in each quarter. Average firm age represents the average age at the time of the
IPOs of all the firms that went public in each quarter. All the real terms were adjusted by the
quarterly consumer price index (CPI). The returns and growth terms presented in Table 2 are in
decimal forms.
Table 2: Descriptive Statistics of Proxy Variables and Control Variables
Time
Series
Quarterly Interval
Mean Median Std. dev.
Capital demand proxies
Industrial prod. growth 1968–2010 0.001 0.001 0.020
GDP growth 1960–2010 0.006 0.006 0.069
Investment growth 1985–2010 0.014 0.015 0.179
Information asymmetry proxies
Δ in earn. AR dispersion 1999–2009 -0.001 -0.004 0.116
14
Δ in analyst dispersion 1990–2009 0.062 -0.033 5.378
Investor sentiment proxies
Closed-end fund discount
Future VW market returns
1973–2009
1962–2010
-0.163
0.020
-0.140
0.026
0.079
0.092
Control variables
VW market returns 1963–2009 0.005 0.006 0.160
Dividend yield 1960–2009 0.051 0.043 0.026
VW mkt returns × low DY 1963–2009 0.004 0 0.103
Initial returns 1960–2009 0.149 0.114 0.172
Average firm age 1960–2009 29.88 28.30 19.76
3.2.1 Capital demand proxies
The capital demand hypothesis suggests that the IPO volume cycle is affected by changes in the
aggregate financing demand of private firms, which depends on the fluctuations of business
cycles and economic conditions. One of the major reasons why firms go public is to raise capital
for operations and good investment opportunities. Thus, changes in aggregate capital demand
may affect the IPO volume over time.
Since the aggregate capital demand for private firms is not directly observable, three proxies
were employed—future percentage growth in the real gross domestic product (GDP) since 1960;
future percentage growth in industrial production since 1968; and future real investment growth
since 1985. Future growth was used for the proxies because upcoming opportunities would affect
the current decisions on capital demand. The demand for current working capital should be
positively related to the macroeconomic conditions in a country, such as future GDP growth. The
growing industrial production level imposes a higher capital requirement on the firms in order to
generate increased production. Thus, future industrial production growth should also be
positively correlated with the firms’ capital demand. Due to the seasonal characteristic of
production levels, the logarithm of industrial production was taken and the difference between

15
quarter (t+3) and quarter (t-1) was used for quarterly regressions. For investment opportunities,
the aggregate capital demand should increase as new corporations and future investment projects
grow.
3.2.2 Information asymmetry proxies
The information asymmetry hypothesis suggests that the IPO cycle is affected by the time-
varying costs of adverse selection due to information asymmetry about firm value that exists
between the market and the firm’s managers. When information asymmetry is high, companies
suffer from high adverse selection costs; thus, fewer of them would want to issue IPOs.
Since information asymmetry is totally unobservable, prior literature commonly employed two
proxies related to earnings—the dispersion of abnormal returns around earnings announcements
and the dispersion of analysts’ annual earnings forecasts. These reflect the extent of private
information held by a firm’s managers and analysts. Thus, both these proxies should represent
information asymmetry to a certain extent and have a negative relationship with IPO volume.
Stock market reactions do reflect the degree of information asymmetry. The stronger the
abnormal reactions that are made by the market to earnings announcements, the higher the
information asymmetry that exists at that time. Based on the models proposed by Dierkins
(1991) and Lowry (2003), the abnormal return around earnings announcement with time window
[-1, 1] was measured for each firm in each quarter, where ―abnormal return‖ is defined as the 3-
day firm return minus the value-weighted FTSE All-Share index return within the same time
period. The earnings announcement data for the U.K. public companies could be obtained from
Bloomberg since the second quarter in 1998 only. Then, the standard deviation of these abnormal
returns was calculated for each quarter in order to get a quarterly time series of the change in the
dispersion of abnormal returns around earnings announcement during the period 1999–2007.
The other proxy—the dispersion of analysts’ earnings forecasts—can capture the information
asymmetry between analysts and the market. The I/B/E/S database provides the earnings
forecasts for public firms in the U.K. since 1989. Thus, the standard deviations of all the
analysts’ annual earnings forecasts for each company during the last quarter of its fiscal year
were found. Subsequently, the average of these standard deviations was calculated for each
quarter across companies to obtain a quarterly time series of the changes in the average
dispersion from 1990 to 2007.

16
3.2.3 Investor sentiment proxies
The investor sentiment hypothesis suggests that the IPO volume cycle is caused by changes in
the level of investor optimism, which leads to the varying costs of equity issuance. When
investors are highly optimistic, the costs of issuing equity are relatively low, causing many firms
to go public, leading to a relatively high IPO volume. Baker and Wurgler (2000), who focused
on investor sentiment research, found that more firms choose to issue IPOs around hot market
periods, which are then followed by periods of low market returns. Thus, IPO volume should
have a negative relationship with future market returns.
According to Baker and Wurgler (2007), discounts on closed-end funds, the dividend premium,
IPO volume and initial returns, and mutual funds flows could be reasonable proxies for investor
sentiment. This paper employs discounts on closed-end funds and future value-weighted market
returns as the two proxies for investor sentiment. The discount is measured by the difference
between the net asset value and the fund market price. The discount for a given quarter starting
1973 is measured as the value-weighted discount across all domestic equity closed-end funds,
where discounts are weighted by the fund’s net asset value multiplied by the number of shares
outstanding. As shown by Lee et al. (1991) and Neal and Wheatley (1998), closed-end funds are
mostly held by retail investors, who are more likely to be affected by sentiment. When investor
sentiment is high, these investors are willing to pay more for closed-end funds, leading to a
relatively small discount. Therefore, past discounts—measured by lags of the discounts—are
included in the regressions as potential explanatory variables. Compared to the discounts on
closed-end funds, the future market return is a weaker proxy for favourable sentiment. If
investors are paying too little today relative to the future stock market values, this could be an
indication of unfavourable sentiment instead of a plausible proxy for favourable sentiment.
3.3 Control Variables
In order to capture the true effects of the explanatory proxies on the variation of IPO volume,
some stock market variables were added to control their effects in the regression. As mentioned
in Section 2.4, Loughran and Ritter (1995) found that periods of high market returns tended to be
followed by high volumes of equity issuance. Such hot markets can be caused by an increase in
capital demand (good investment opportunities and favourable economic conditions) and in
investor sentiment (high investor optimism).

17
Unlike the previous three groups of hypotheses, the stock market control variables have the
advantage of not using proxies. The past value-weighted FTSE All-Share market returns during
the three quarters before IPO, the average dividend yield in the quarter before the IPO, and an
interaction term of market returns and low dividend yield were included.6 The time series of
market returns since the second quarter in 1962 is available at Datastream; the time series was
adjusted into real terms using quarterly CPI. Although Lowry (2003) used the index market-to-
book ratio, such data in the U.K. context is not available in terms of a long time series. Thus, this
paper uses/imitates the index dividend yield in the quarter prior to the IPO as another stock
market control variable. A low index dividend yield implies the market is overvalued, similar to
what the high market-to-book ratio suggests. The interaction term between market returns and
low dividend yield is employed to measure whether the returns have a larger effect on IPO
volume when the index dividend yield is relatively low.
In addition to these stock market variables, firm age at the time of the IPO was included as a
control variable. The average age of the firms at the time of their respective IPOs was calculated,
which forms a time series in the period 1960–2009.
4. Empirical Results
This section explains the time-series analysis of IPO volume by the proxies for the hypotheses
and the stock market control variables. Subsequently, the section explores how long-run
performance—post-IPO stock returns as well as market returns—is related to variations in IPO
volume.
4.1 Time-Series Regressions of IPO Volume
Table 3 presents the quarterly regressions of IPO volume on the proxy variables for the capital
demand, information asymmetry, and investor sentiment hypotheses, as well as for the control
variables including initial return and stock market return variables. Quarterly regressions were
6 We consider low dividend yield to be equal to one if the dividend yield is less than 3% and zero otherwise. This
cut-off point of 3% was chosen because many analysts often compare stock dividend yield with the 10-year
government bond yield, which is a little lower than 3% in average.

18
run because the time series may have quarterly seasonal effects, and quarterly regressions could
cover more observations and include annual effects as well compared to annual regressions.
Table 3 presents the quarterly regressions of the number of IPOs in each quarter during the
period 1960–2007. There are two panels in Table 3: one includes the regressions on each group
of proxies (discussed in Section 4.1.1) and the other includes the regressions on a combination of
these proxies and the control variables (see Section 4.1.2). Future industrial production growth
equals the log of real industrial production in quarter t+3 minus the log of real industrial
production in quarter t-1. Future GDP growth and future investment growth equal the growth of
real GDP and real investments from quarter t to quarter t+3. The dispersion of abnormal returns
around earnings announcements equals the standard deviation of the abnormal returns with time
window [-1, 1] across all firms that announce earnings in each quarter, where abnormal return is
defined as the firm’s returns minus market returns over the same period. The dispersion of
analysts’ earnings forecasts equals the average standard deviation of analysts’ annual earnings
forecasts across the companies that are in the last quarter of their fiscal year and for which data is
available on the IBES database during a given quarter. The change of these two dispersion terms
equals the dispersion in quarter t-1 minus the dispersion in quarter t-4. Future market returns
equal the compounded monthly returns for the FTSE All-Share value-weighted market index in
real terms from quarter t+1 to quarter t+4. The fund discount equals the value-weighted
(weighted by fund total market capitalisation) discounts across all domestic closed-end funds for
two lagged quarters. The real value-weighted market returns represent the compounded monthly
returns on the value-weighted FTSE All-Share market index in real terms from quarter t-3 to
quarter t-1. The dividend yield equals the weighted average across the market index of each
individual public firm’s dividend paid divided by the share price, and the dividend yield in
quarter t-1 is used for quarter t as the control variable. The interaction term represents the lagged
market returns multiplied by a low dividend yield dummy variable, which equals one if the
dividend yield is less than 0.03 and zero otherwise. The initial returns t-1 represents the average
return on the first trading day across all the firms that went public in the previous quarter. Firm
age represents the average firm age at the time of the IPO of the firms that went public in each
quarter. A Quarter 1 dummy was included in each regression in order to control for seasonality.
An autoregressive parameter AR(1) was included in order to consider the residual serial
correlation. All the returns and growth terms presented in Table 3 are in decimal forms.

19
Table 3: Quarterly Time Series Analysis of IPO Volume
Panel A: Analysis of IPO volume on each group of variables individually
(1)
Mkt
Var.
(2)
Capital
Demand
(3)
No inv.
from (2)
(4)
Info. Aysm.
(5)
Investor
Sent.
Constant
5.38
(1.97)
28.88***
(6.15)
20.82***
(7.03)
38.48***
(4.10)
13.28***
(5.14)
Capital demand proxies
362.93**
(1.93)
259.72***
(1.98)
59.54
(1.63)
2.396
(0.34)
-9.90
(-0.79)
Information asymmetry proxies
-56.07**
(-5.52)
-0.57
(0.60)
Investor sentiment proxies
21.03
(1.07)
-8,60
(-0.44)
-14.07*
(-1.73)
Control variables
0.28
(0.79)
-165.27*
(2.25)
-20.72
(0.02)
Quarter 1 dummy
-8.35***
(-4.03)
-10.71***
(-5.54)
-7.96***
(-6.85)
-12.34***
(-5.16)
-9.08***
(-6.55)
AR(1)
0.70***
(10.72)
0.72***
(10.09)
0.76***
(12.46)
0.76***
(6.35)
0.73***
(12.11)

20
Adjusted R-squared without AR(1) 0.08991 0.06725 0.1004 0.05165 0.1973
Adjusted R-squared with AR(1) 0.5352 0.574 0.6251 0.6251 0.6475
Number of observations 172 92 159 43 144
***, **, and * indicate significance at 1%, 5%, and 10% levels, respectively, in two-sided significance tests.
Panel B: Analysis of IPO volume on groups of proxy and control variables
(1) cap demand +
investor sent.
(2) control var.
+(1)
(3) all proxies +
control var.
Constant
28.11***
(3.88)
9.29
(1.56)
-9.50
(-0.21)
Capital demand proxies
51.63*
(1.65)
196.31*
(1.73)
76.9*
(1.74)
414.56**
(1.87)
96.15
(0.25)
330.92
(0.64)
4.40
(0.51)
5.04
(0.49)
193.61**
(2.25)
Information asymmetry proxies
-23.07*
(-1.75)
-1.68
(-1.57)
Investor sentiment proxies
72.78
(1.20)
-62.09
(-1.10)
-29.58*
(1.66)
76.47
(0.99)
-68.41*
(-1.69)
-4.88
(0.42)
147.99
(0.55)
-659.94***
(-4.56)
-0.89
(-0.39)
Control variables
4.89
(0.51)
95.19***
(2.96)
-137.40
(-1.49)
-311.23
(-1.16)
0.62
(0.03)
-156.51***
(-3.46)
Firm age at IPO issuance
-0.12*
(-1.76)
-0.96*
(-1.93)
20.82***
(4.37)
17.65**
(3.21)

21
(1) cap demand +
investor sent.
(2) control var.
+(1)
(3) all proxies +
control var.
Quarter 1 dummy
-10.70***
(-5.60)
-14.96***
(-5.45)
-7.50
(-1.51)
AR(1)
0.71***
(9.63)
0.63***
(6.11)
0.33**
(2.08)
Adjusted R-squared without AR(1) 0.0987 0.3744 0.652
Adjusted R-squared with AR(1) 0.5837 0.6016 0.7288
Number of observations 100 84 40
***, **, and * indicate significance at 1%, 5%, and 10% levels, respectively, in two-sided significance tests.
4.1.1 Regressions on each group of proxy variables
From the regressions of the capital demand proxies, future industrial production growth was
found to be significantly and positively correlated with IPO volume, and future GDP growth was
insignificantly and positively correlated with IPO volume. These findings are consistent with the
capital demand hypothesis.
The information asymmetry hypothesis was found to provide some support for the variation in
IPO volume in the U.K. over the period 1999–2009, which was slightly different from Lowry’s
(2003) results. The significantly negative coefficient for the change in the dispersion of abnormal
returns around earnings announcements was at 1% significance level. Further, although its
coefficient was insignificant, the change in the dispersion of analysts’ earnings forecasts was
found to have a negative relationship with IPO volume as well. These negative coefficients
support the hypothesis that when analysts hold more private information of firms, the agency
costs and information asymmetry will be greater, leading to lower IPO volume.
For the investor sentiment proxies with the data over the period 1962–2009, the significant
negative coefficients of the first and second lags of discounts and future value-weighted market
returns provided some support for the investor sentiment hypothesis as an explanation for
variations in IPO volume. Diverging from Lowry’s (2003) model, only two lags of fund
discounts were kept in the current model due to the consistent insignificance of the third and
fourth lags.
4.1.2 Regressions with control variables
After controlling for the stock market variables (stock market variables, average initial returns,
and firm age), the capital demand hypothesis could still explain the IPO volume variation.

22
However, the future value-weighted market returns for the investor sentiment hypothesis became
insignificantly negative in both columns (Table 3: Panel B), while the second lag of the closed-
end fund discounts was still significantly negative. This could support the investor sentiment
hypothesis; further, the discount on closed-end funds is probably a reasonable measure of
sentiment. Notably, aside from the significant coefficients in the individual regressions, after
these control variables were included, the change in the dispersion of abnormal returns around
earnings announcements was still significantly negatively related to IPO volume, while the
change in the dispersion of analysts’ earnings forecasts became significant. This further supports
the hypothesis that information asymmetry is significantly and negatively correlated with IPO
volumes in the U.K. For the control variables, the significant positive coefficient of average
initial returns supports the theory that hot issue markets with high initial returns are followed by
periods of high IPO volume. The lesser information gap between the underwriters and
issuers/investors during the selling process could also contribute to the significant effects of
information asymmetry.
Further, an F-test was run as an alternative measure in order to find the joint explanatory power
of each group of proxy variables—capital demand, information asymmetry, and investor
sentiment. The results of the F-test supported the findings of the quarterly regressions that both
capital demand as well as information asymmetry can explain the variations of primary IPOs.
The investor sentiment proxy was found to be insignificant once again.
In summary, we compare the coefficient signs as well as the statistical and economic
significance between our regression results and Lowry’s (2003) results in Table 4. Table 4 is
based on the quarterly regressions of IPO volume on the capital demand, information
asymmetry, and investor sentiment proxies, as well as the control variables.
Table 4: Comparison of Regression Results with Lowry’s Paper
Coefficient sign Statistical significance Economic significance
This
paper
Lowry’s
Paper
This
paper
Lowry’s
Paper
This
paper
Lowry’s
Paper
Capital demand proxies + + Yes Yes Yes Yes
Information asy. proxies - - Yes No No No

23
Coefficient sign Statistical significance Economic significance
This
paper
Lowry’s
Paper
This
paper
Lowry’s
Paper
This
paper
Lowry’s
Paper
Investor sentiment proxy - - Yes/No Yes Yes/No Yes
Initial returns + + Yes Yes
Quarter 1 dummy - - Yes Yes
AR(1) + + Yes Yes
4.2 Relationship between Post-IPO Returns and IPO Volume
As mentioned in the literature review in Section 2, post-IPO returns have a potential relationship
with IPO volume (Ritter, 1991; Loughran and Ritter, 1995). Therefore, empirical tests were run
on the IPO volume and post-IPO returns to find out how they interact, with the advantage of not
having to use proxies.
4.2.1 Descriptive evidence on post-IPO returns and IPO volume
Table 5 reports both equal-weighted and value-weighted (by the firms’ market capitalisation at
the time of the IPO) post-IPO returns for the quartiles classified based on the IPO volume during
the quarter in which the firms went public. The equal-weighted returns represent the average of
the sum of raw (abnormal) IPO returns across all firms in each quartile over the number of firms
in the quartile. The value-weighted returns represent the average of the raw (abnormal) IPO
returns in the quartile weighted by the firm’s market capitalisation after the IPO.
Table 5 presents the post-IPO returns for those IPOs during the period 1992–2012 because the
price data for the U.K. stocks is available on Bloomberg starting 1992. For the 3-year buy-and-
hold stock returns, the monthly-compounded raw post-IPO returns was calculated over the 36
months after the IPO or over the period until the IPO delisting date (if the IPO firm delisted
during the 36 months after the IPO). Abnormal post-IPO returns with market adjustment equal
the raw stock returns minus the FTSE All-Share index return as a benchmark over the same
period.

24
Table 5 targets those firms that went public between 1992 and 2007 and had both 3-year
compounded post-IPO returns data on Bloomberg as well as the firms’ market capitalisation data
after the IPO. These firms were classified into four quartiles based on the IPO volume—the
number of firms that went public in each quarter—during the quarter in which they issued their
respective IPOs. During the period 1992–2007, there were a total of 64 quarters; each quartile
covered 16 quarters, with quartile 1 representing the lowest IPO volume periods. The third
column in Table 5 shows the total number of firms in each quartile.
Table 5: Descriptive Evidence on Post-IPO Stock Returns and IPO Volume
Equal-weighted returns Value-weighted returns
IPO volume
Quartile
No. of
quarters
No. of firms
w/ data
Raw
IPO returns
Abnormal
IPO returns
Raw
IPO returns
Abnormal
IPO returns
1 (low) 16 80 66.44% 23.03% 10.72% -8.24%
2 16 190 35.78% 8.73% 10.09% 1.57%
3 16 346 35.91% 10.90% 30.08% 18.60%
4(high) 16 640 -11.04% -24.97% -17.34% -23.72%
Raw IPO percentage compounded returns over the following 36-month after the IPO’s first
trading day = Abnormal IPO percentage
returns = the difference between the raw IPO returns and the FTSE All-Share market return as
the benchmark over the same period; that is,
.
The average post-IPO raw return was 17.85% and the average abnormal return adjusted by the
market benchmark was -1.92%, showing a long-run underperformance. We expect that such
underperformance could be relieved if the characteristics-matched four-factor model were
employed. As shown in Table 5, the 3-year equal-weighted raw returns and abnormal returns
showed that there were roughly monotonic relationships across the quartiles, given that the
middle quartiles were quite close to each other. The equal-weighted returns suggest that the
highest IPO volume quartile has the lowest post-IPO returns. However, no clear trend could be
identified from the value-weighted raw and abnormal returns. For the value-weighted returns, the
lowest IPO volume quartile was far from having the highest raw and abnormal returns, which

25
opposed the investor sentiment hypothesis and was contrary to Ritter’s (1991) findings. Since the
descriptive evidence gave mixed results, we continued to conduct regression analyses to arrive at
a more reliable conclusion of the relationship between post-IPO returns and IPO volume.
4.2.2 Regression of post-IPO stock returns on IPO volume
Following Ritter’s (1991) model, as reported in Table 6, we ran a cross-sectional regression of
36 months of post-IPO stock (abnormal) returns on IPO volume during that year for each IPO,
where the post-IPO stock returns were monthly compounded. In the regression, we also included
the FTSE All-Share value-weighted market returns over the same period for each IPO, IPO
initial returns, an oil and gas dummy, and a financial dummy. Consistent with Ritter’s (1991)
theory and Lowry’s (2003) results based on the U.S. data, the long-term stock (abnormal) returns
were found to be significantly and negatively related to IPO volume, implying that periods of
high IPO volume (hot issue markets) lead to long-term underperformance of these stocks.
Table 6: Regression of Post-IPO Stock Returns against IPO Volume (1992–2007)
Panel A: Regression of post-IPO stock raw returns
Dependent
variable
Intercept Initial
return
VW
market
return
IPO volume Oil &
gas
dummy
Financial
dummy
Obs Adj
R-sqr
36-month
post-IPO
returns
0.38**
(0.16)
-0.0076
(0.0069)
1.41***
(0.19)
-0.0032***
(0.0007)
0.81
(0.22)
-0.07
(0.36)
1239 0.085
Panel B: Regression of post-IPO stock abnormal returns
Dependent
variable
Intercept Initial
return
IPO volume Oil & gas
dummy
Financial
dummy
Obs Adj
R-sqrd
36-month
post-IPO
abnormal
returns
0.58***
(0.15)
-0.013*
(0.0068)
-0.0038***
(0.0007)
0.83
(0.67)
-0.11
(0.08)
1239 0.02
***, **, and * indicate significance at 1%, 5%, and 10% levels, respectively, in two-sided significance tests.
26
Panel A of Table 6 shows the cross-sectional regression of the post-IPO stock returns for the
U.K. IPOs during the period 1992–2007 on IPO volume (because stock data is available on
Bloomberg only from 1992). The post-IPO stock returns (as the dependent variable) were
compounded monthly over the 36 months after the IPO, defined as
. The initial return represents the first trading day’s
returns, which equals the difference between the first-day closing price and the offer price
divided by the offer price. The value-weighted market returns over the same period were
included in the regression. The IPO volume equals the number of IPOs that went public during
the same year with each firm. The oil and gas dummy equalled one if the firm operated in the oil
and gas industry and zero otherwise. The financial dummy equalled one if the firm operated in
the financial industry (such as banks, financial services, insurance, and real estate) and zero
otherwise. Panel B of Table 6 presents a similar regression, but takes the difference between
post-IPO stock returns and value-weighted market returns (as a proxy of expected returns) to
obtain the 36-month post-IPO abnormal returns as the dependent variable. All the other
independent variables were unchanged. All the return terms presented in Table 6 are in decimal
forms.
5. Conclusion
Although there is a considerable body of research on IPOs, studies on the variations in IPO
volume over time are relatively few, especially in the context of the IPO market in the U.K. This
paper aims to fill this gap by employing a large IPO sample in the U.K. over the period 1960–
2007. IPO volume—in terms of both the number of IPOs as well as the gross proceeds from
IPOs—fluctuates substantially over time. Based on Lowry’s (2003) model, we developed proxies
for the aggregate capital demand, the information asymmetry surrounding equity issuance, and
the extent of investor sentiment. These proxies were included in the regressions to investigate
how these groups of proxies could explain the variations in IPO volume over time. We then
analysed the relationship between IPO volume and post-IPO stock returns and market returns,
which are related to the relationship between IPO volume and hot/cold markets. We conclude
that the firms’ aggregate capital demand is significantly and positively correlated with IPO
volume, while information asymmetry is slightly significantly and negatively correlated with

27
IPO volume in the U.K. For the investor sentiment hypothesis, the second lag of fund discount
was found to be significantly and negatively correlated while the future market return was found
to be insignificantly and negatively correlated.
References
Baker, M., and Wurgler, J. (2000). The Equity Share in New Issues and Aggregate Stock Returns.
Journal of Finance, 55, 2219–2257.
Baker, M., and Wurgler, J. (2007). Investor Sentiment in the Stock Market. Journal of Economic
Perspectives, 21, 129–151.
Baker, M., Wurgler, J., and Yuan, Y. (2012). Global, Local, and Contagious Investor Sentiment. Journal
of Financial Economics, 104, 272–287.
Baron, D.P. (1982). A Model of the Demand for Investment Banking Advising and Distribution Services
for New Issues. Journal of Finance, 37, 955–976.
Bayless, M., and Chaplinsky, S. (1996). Is there a Window of Opportunity for Seasoned Equity Issuance?
Journal of Finance, 51, 253–278.
Benveniste, L., and Spindt, P. (1989). How Investment Bankers Determine the Offer Price and Allocation
of New Issues. Journal of Financial Economics, 24, 343–361.
Benveniste, L., Busaba, W.Y., and Wilhhelm W.J. (2002). Information Externalities and the Role of
Underwriters in Primary Equity Markets. Journal of Financial Intermediation, 11, 61–86.
Biais, B., Bossaerts, P., and Rochet, J.-C. (2002). An Optimal IPO Mechanism. Review of Financial
Studies, 69, 117–146.
Brennan, M., and Franks, J. (1997). Underpricing, Ownership and Control in Initial Public Offerings of
Equity Securities in the UK. Journal of Financial Economics, 45, 391–414.
Chambers, D., and Dimson, E. (2009). IPO Underpricing over the Very Long-Run. Journal of Finance,
64, 1407–1443.
Choe, H., Masulis, R., and Nanda, V. (1993). Common Stock Offerings across the Business Cycle.
Journal of Empirical Finance, 1, 1–29.
Dierkins, N. (1991). Information Asymmetry and Equity Issues. Journal of Financial and Quantitative
Analysis, 2, 181–199.
Dittmar, A. K., and Dittmar, R.F. (2008). The Timing of Financing Decisions: An examination of the
correlation in financing waves. Journal of Financial Economics, 90, 59–83.
Ibbotson, R., and Jaffe, J. (1975). ―Hot Issue‖ Markets. Journal of Finance, 30, 1027–1042.

28
Ibbotson, R. G., Sindelar, J., and Ritter, J. (1994). The Market's Problems with the Pricing of Initial
Public Offerings. Journal of Applied Corporate Finance, 7, 66–74.
Jenkinson, T.J., and Ljungqvist, A.P. (2001). Going Public: The theory and evidence on how companies
raise equity finance. Oxford University Press (2nd
edition).
Lee, C., Shleifer, A., and Thaler, R. (1991). Investor Sentiment and the Closed-End Puzzle. Journal of
Finance, 46, 75–109.
Ljungqvist, A., Nanda, V., and Singh, R. (2006). Hot Markets, Investor Sentiment, and IPO Pricing.
Journal of Business, 79, 1667–1702.
Loughran, T., and Ritter, J.R. (1995). The New Issues Puzzle. Journal of Finance, 50, 23–51.
Loughran, T., and Ritter, J.R. (2002). Why Don’t Issuers Get Upset about Leaving Money on the Table in
IPOs? Review of Financial Studies, 15, 413–443.
Lowry, M. (2003). Why Does IPO Volume Fluctuate so much? Journal Financial Economics, 67, 3–40.
Lowry, M., and Schwert, G. (2002). IPO Market Cycles: Bubbles or sequential learning? Journal of
Finance, 57, 1171–1200.
Lucas, D., and McDonald, R. (1990). Equity Issues and Stock Market Dynamics. Journal of Finance, 45,
1019–1043.
Neal, R., and Wheatley, S.M. (1998). Do Measures of Investor Sentiment Predict Returns? Journal of
Financial and Quantitative Analysis, 33, 523– 548.
Pastor, L., and Veronesi P. (2005). Rational IPO Waves. Journal of Finance, 60, 1713–1757.
Rau, R., and Stouraitis, A. (2011). Patterns in the Timing of Corporate Event Waves. Journal of Financial
and Quantitative Analysis, 46, 209–246.
Ritter, J.R. (1984). The ―Hot Issue‖ Market of 1980. Journal of Business, 57, 215–240.
Ritter, J.R. (1991). The Long-Run Performance of Initial Public Offerings. Journal of Finance, 46, 3–
27.
Rock, K. (1986). Why New Issues Are Underpriced. Journal of Financial Economics, 15, 187–212.
Welch, I. (1989). Seasoned Offerings, Imitation Costs, and the Underpricing of Initial Public Offerings.
Journal of Finance, 44, 421–448.
29
Appendix
Definition and Time Series of Variables
IPO volume: 1960–2009
Number of IPOs, gross proceeds from IPOs, and real gross proceeds from IPOs adjusted by 1990
currency.
Number of primary and secondary IPOs: 1960–2009
Primary IPOs are defined as those IPOs where at least three-quarters of the shares issued are new
shares; secondary IPOs are those where new shares are less than three-quarters of the total shares
issued.
IPO initial returns: 1960–2009
The difference between offer price and first-day closing price over the offer price of IPO.
Capital demand proxy: Industrial production growth—1968-2009
The industrial production index measures the volume of production of the manufacturing, mining and
quarrying, and energy supply industries in the U.K. The growth equals the difference of the log of
real industrial production adjusted by quarterly CPI during the period(s). (Source: Datastream, Office
of National Statistics)
Capital demand proxy: GDP growth—1960–2009
The percentage change in real Gross Domestic Production adjusted by CPI in each period in the U.K.
(Source: Datastream, Office of National Statistics)
Capital demand proxy: Investment growth—1985–2009
The percentage change in actual real investment growth in the U.K. provided by the investment
survey. (Source: Datastream, Directorate General for Economic and Financial Affairs)
Information asymmetry proxy: Dispersion of abnormal returns around earnings
announcements—1999–2009
Standard deviation of the abnormal returns with time window [-1, 1] across all firms that announced
earnings in each quarter, where abnormal return is defined as the firm’s returns minus market returns
over the same period. (Source: Bloomberg for earnings announcements, stock returns, and market
returns during each time window)
Information asymmetry proxy: Dispersion of analysts’ earnings forecasts—1990–2009
Average standard deviation of analysts’ annual earnings forecasts across companies that were in the
last quarter of their fiscal year. (Source: IBES)
Investor sentiment proxy: Discounts in closed-end funds—1973–2009
Average of the discounts across all domestic equity closed-end funds at the end of each
quarter. (Source: Morningstar. Thanks to Kirsty McLaren for providing the data given the
limited access to the database.)
Investor sentiment proxy: Future value-weighted market returns—1962–2009
Compounded monthly returns on the value-weighted FTSE All-Share real market index over the
following four quarters (one year). (Source: FTSE All-Share)
Dividend yield (index): 1960–2009

30
Dividend yield equals the dividend paid divided by the IPO price. Before 1997, the market dividend
yield was approximated by the average of the IPOs’ dividend yield during each period. After 1997,
the dividend yield data comes from Bloomberg, equalling the weighted average across the market
index of each public firm’s dividend paid divided by the share price.
Firm age: 1960–2009
Average age of all the firms that went public at the time of the IPO in each period.
Post-IPO stock (market) returns: 1992–2011
Compounded monthly returns over the 36 months after the IPO’s first trading day.
Related Documents