What evidence exists for alternative ecological regimes in salinising wetlands? LIEN L. SIM, JENNY A. DAVIS, JANE M. CHAMBERS AND KARIN STREHLOW Aquatic Ecosystems Research Group, School of Environmental Science, Murdoch University, Murdoch, WA, Australia SUMMARY 1. Land clearing in Australia’s southwest has led to widespread salinisation of aquatic ecosystems. Four different ecological regimes (clear, submerged macrophyte-dominated; clear, benthic microbial community-dominated; turbid, phytoplankton-dominated; and turbid, sediment-dominated) have previously been identified in the salinising wetlands of this region. 2. Monitoring data from seven saline wetlands over an 18-month period were used to evaluate whether a continuum, simple threshold or alternative regimes conceptual model (sensu Hydrobiologia, 200/201, 1990, 367; Hydrobiologia, 200/201, 1990, 475) most appropriately represented transitions between these ecological regimes. We also aimed to identify whether factors other than salinity played a major role in defining ecological regimes or causing shifts between them. 3. Ordination of biological variables revealed a separation of benthic microbial commu- nity-dominated from submerged macrophyte-dominated sites and times. The mean salinities of these two groups were very similar, suggesting that a salinity threshold was not responsible for benthic microbial versus macrophyte dominance. No other environ- mental variable was found to have a strong, direct influence on the groupings. 4. The dynamics of regime change in saline wetlands appear not to be driven by any single variable, but by the combined effects of salinity and water regime on species life histories and competitive abilities. Macrophytes were powerful competitors, able to germinate and establish under a range of salinities, turbidities and water depths, and were favoured by seasonal drying. 5. Data from the seven wetlands indicated that the continuum, simple threshold and alternative regimes conceptual models did not appropriately represent transitions between ecological regimes in seasonally drying wetlands. Macrophyte and benthic microbial regimes occurred at overlapping salinity levels, excluding both the continuum and threshold models, and the regular occurrence of drying appeared to preclude the alternative regimes model. Drying prevented the development of strong positive feedback mechanisms, which might otherwise have maintained the benthic microbial community- dominated regime. We hypothesise that an alternative regimes model might still be valid for salinising ecosystems holding permanent water. Keywords: benthic microbes, regime shift, salinity, submerged macrophytes, water regime Introduction Land clearing in the agricultural zone of Australia’s southwest has led to widespread salinisation of flowing and standing waters (Davis et al., 2003; Halse, Ruprecht & Pinder, 2003). Recently, attempts have Correspondence: Lien L. Sim, Aquatic Ecosystems Research Group, School of Environmental Science, Murdoch University, South Street, Murdoch 6150, WA, Australia. E-mail: [email protected]

Welcome message from author
This document is posted to help you gain knowledge. Please leave a comment to let me know what you think about it! Share it to your friends and learn new things together.
Transcript

What evidence exists for alternative ecological regimesin salinising wetlands?
LIEN L. SIM, JENNY A. DAVIS, JANE M. CHAMBERS AND KARIN STREHLOW
Aquatic Ecosystems Research Group, School of Environmental Science, Murdoch University, Murdoch, WA, Australia
SUMMARY
1. Land clearing in Australia’s southwest has led to widespread salinisation of aquatic
ecosystems. Four different ecological regimes (clear, submerged macrophyte-dominated;
clear, benthic microbial community-dominated; turbid, phytoplankton-dominated; and
turbid, sediment-dominated) have previously been identified in the salinising wetlands of
this region.
2. Monitoring data from seven saline wetlands over an 18-month period were used to
evaluate whether a continuum, simple threshold or alternative regimes conceptual model
(sensu Hydrobiologia, 200/201, 1990, 367; Hydrobiologia, 200/201, 1990, 475) most
appropriately represented transitions between these ecological regimes. We also aimed to
identify whether factors other than salinity played a major role in defining ecological
regimes or causing shifts between them.
3. Ordination of biological variables revealed a separation of benthic microbial commu-
nity-dominated from submerged macrophyte-dominated sites and times. The mean
salinities of these two groups were very similar, suggesting that a salinity threshold was
not responsible for benthic microbial versus macrophyte dominance. No other environ-
mental variable was found to have a strong, direct influence on the groupings.
4. The dynamics of regime change in saline wetlands appear not to be driven by any single
variable, but by the combined effects of salinity and water regime on species life histories
and competitive abilities. Macrophytes were powerful competitors, able to germinate and
establish under a range of salinities, turbidities and water depths, and were favoured by
seasonal drying.
5. Data from the seven wetlands indicated that the continuum, simple threshold and
alternative regimes conceptual models did not appropriately represent transitions between
ecological regimes in seasonally drying wetlands. Macrophyte and benthic microbial
regimes occurred at overlapping salinity levels, excluding both the continuum and
threshold models, and the regular occurrence of drying appeared to preclude the
alternative regimes model. Drying prevented the development of strong positive feedback
mechanisms, which might otherwise have maintained the benthic microbial community-
dominated regime. We hypothesise that an alternative regimes model might still be valid
for salinising ecosystems holding permanent water.
Keywords: benthic microbes, regime shift, salinity, submerged macrophytes, water regime
Introduction
Land clearing in the agricultural zone of Australia’s
southwest has led to widespread salinisation of
flowing and standing waters (Davis et al., 2003; Halse,
Ruprecht & Pinder, 2003). Recently, attempts have
Correspondence: Lien L. Sim, Aquatic Ecosystems Research
Group, School of Environmental Science, Murdoch University,
South Street, Murdoch 6150, WA, Australia.
E-mail: [email protected]
been made to characterise the salinity-driven ecologi-
cal changes occurring in wetlands using the paradigm
of multiple stable equilibria (Davis et al., 2003). Four
different equilibria, viewed as alternative ecological
regimes, have been identified in the seasonally drying
salinised wetlands of Australia’s southwest: (i) clear
water dominated by submerged aquatic macrophytes;
(ii) clear water dominated by benthic microbial
communities; (iii) turbid water dominated by phyto-
plankton; and (iv) turbid water dominated by sedi-
ment (Davis et al., 2003; Strehlow et al., 2005). The
criteria used to define each regime are given in
Table 1. Davis et al. (2003) predicted shifts from (i) to
(ii) driven by increased salinity, and from (i) to (iii)
and (ii) to (iii) driven by increased nutrient loading.
Regime (i) is the desirable regime or management goal
for the salinised seasonally drying wetlands of Aus-
tralia’s southwest as it is most similar to the historic
condition of these wetlands, and performs a more
diverse range of ecological functions than regimes
(ii)–(iv) (Sim, Chambers & Davis, in press a; Sim,
Davis & Chambers, in press b).
The salinising wetlands of southwestern Australia
differ from European brackish coastal lakes (as
described in Bales et al., 1993; Jeppesen et al., 1994,
1998; Moss, 1994) in their freshwater origins, inland
location and importantly, their ability to support high
abundances of large-bodied planktivorous grazers
including cladocerans (Strehlow et al., 2005). The
occurrence of large numbers of halotolerant-grazing
zooplankton appears to allow the development of
the clear water (macrophyte or benthic microbial-
dominated) regimes described above (Strehlow et al.,
2005), even under conditions of nutrient enrich-
ment. In European brackish wetlands, the suppres-
sion of these large grazers (particularly cladocerans)
by salinity keeps nutrient-enriched saline waters
highly turbid, even when macrophytes are abundant
(Jeppesen et al., 1994; Moss, 1994). This contrasts
with the widely documented association between
macrophytes and clear water that has been observed
in freshwater shallow lakes (e.g. Beklioglu & Moss,
1996; Blindow, Hargeby & Andersson, 2002). The
existence of saline, clear water regimes in Australian
salinising wetlands suggests that aspects of the
ecological dynamics of these systems may parallel
freshwater lakes more closely than those of their
brackish European counterparts.
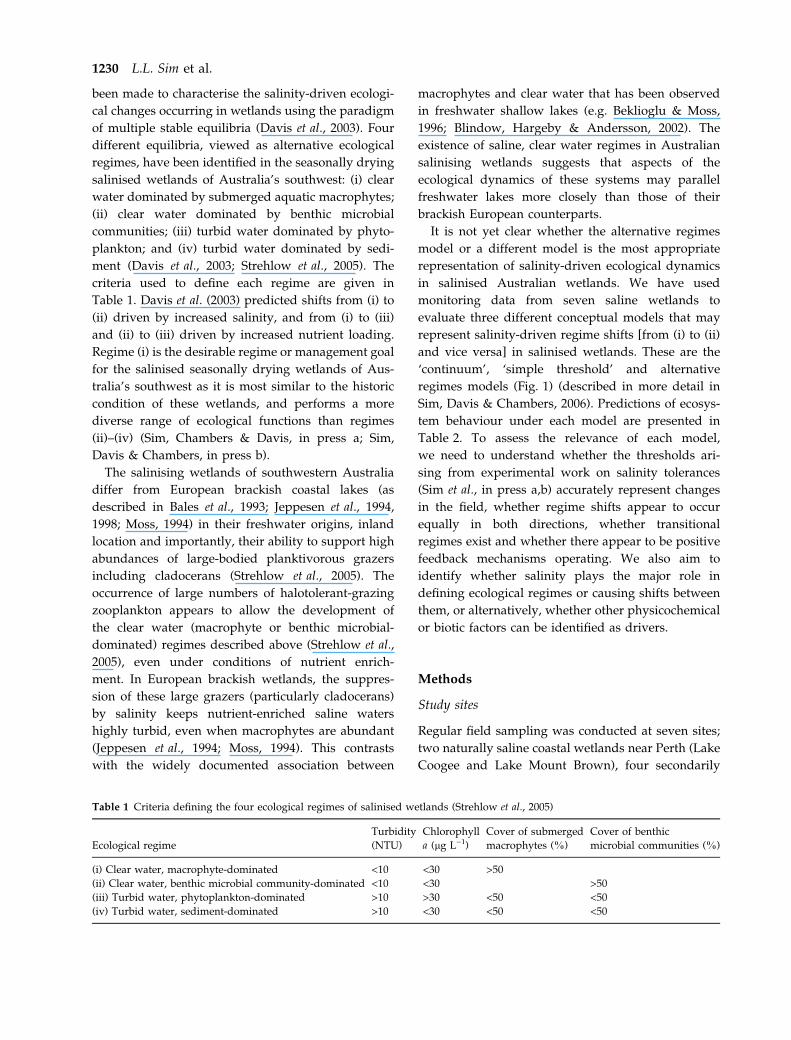
It is not yet clear whether the alternative regimes
model or a different model is the most appropriate
representation of salinity-driven ecological dynamics
in salinised Australian wetlands. We have used
monitoring data from seven saline wetlands to
evaluate three different conceptual models that may
represent salinity-driven regime shifts [from (i) to (ii)
and vice versa] in salinised wetlands. These are the
‘continuum’, ‘simple threshold’ and alternative
regimes models (Fig. 1) (described in more detail in
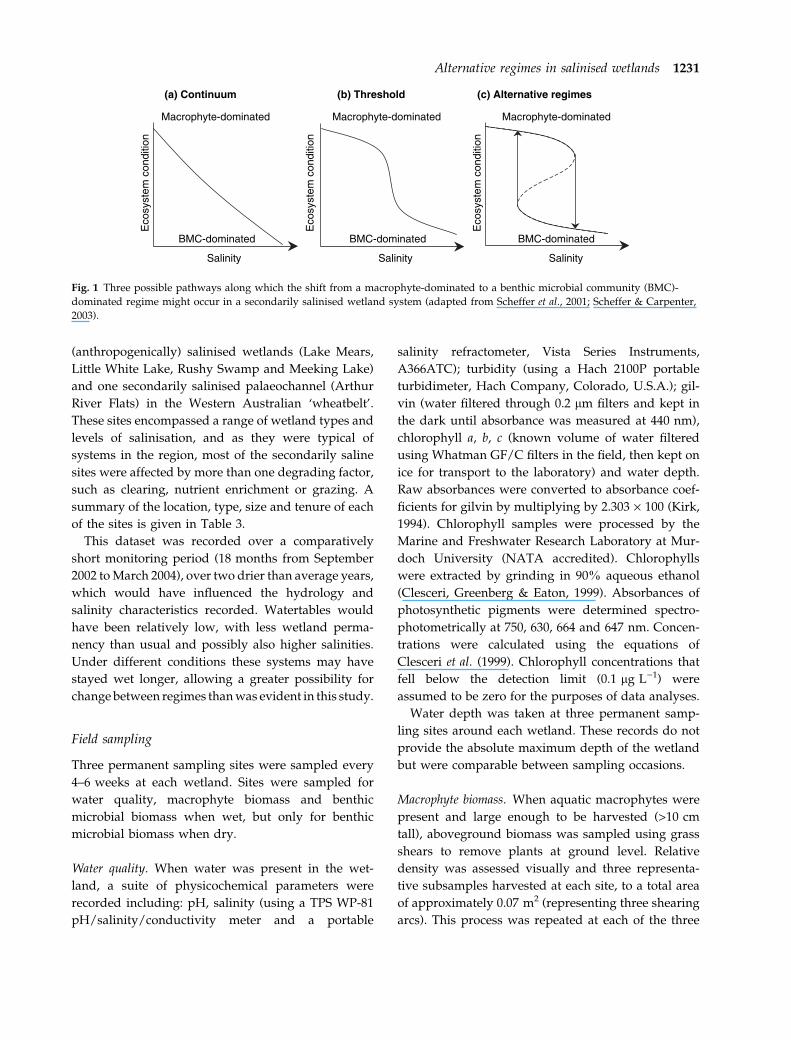
Sim, Davis & Chambers, 2006). Predictions of ecosys-
tem behaviour under each model are presented in
Table 2. To assess the relevance of each model,
we need to understand whether the thresholds ari-
sing from experimental work on salinity tolerances
(Sim et al., in press a,b) accurately represent changes
in the field, whether regime shifts appear to occur
equally in both directions, whether transitional
regimes exist and whether there appear to be positive
feedback mechanisms operating. We also aim to
identify whether salinity plays the major role in
defining ecological regimes or causing shifts between
them, or alternatively, whether other physicochemical
or biotic factors can be identified as drivers.
Methods
Study sites
Regular field sampling was conducted at seven sites;
two naturally saline coastal wetlands near Perth (Lake
Coogee and Lake Mount Brown), four secondarily
Table 1 Criteria defining the four ecological regimes of salinised wetlands (Strehlow et al., 2005)
Ecological regime
Turbidity
(NTU)
Chlorophyll
a (lg L)1)
Cover of submerged
macrophytes (%)
Cover of benthic
microbial communities (%)
(i) Clear water, macrophyte-dominated <10 <30 >50
(ii) Clear water, benthic microbial community-dominated <10 <30 >50
(iii) Turbid water, phytoplankton-dominated >10 >30 <50 <50
(iv) Turbid water, sediment-dominated >10 <30 <50 <50
1230 L.L. Sim et al.
(anthropogenically) salinised wetlands (Lake Mears,
Little White Lake, Rushy Swamp and Meeking Lake)
and one secondarily salinised palaeochannel (Arthur
River Flats) in the Western Australian ‘wheatbelt’.
These sites encompassed a range of wetland types and
levels of salinisation, and as they were typical of
systems in the region, most of the secondarily saline
sites were affected by more than one degrading factor,
such as clearing, nutrient enrichment or grazing. A
summary of the location, type, size and tenure of each
of the sites is given in Table 3.
This dataset was recorded over a comparatively
short monitoring period (18 months from September
2002 to March 2004), over two drier than average years,
which would have influenced the hydrology and
salinity characteristics recorded. Watertables would
have been relatively low, with less wetland perma-
nency than usual and possibly also higher salinities.
Under different conditions these systems may have
stayed wet longer, allowing a greater possibility for
change between regimes than was evident in this study.
Field sampling
Three permanent sampling sites were sampled every
4–6 weeks at each wetland. Sites were sampled for
water quality, macrophyte biomass and benthic
microbial biomass when wet, but only for benthic
microbial biomass when dry.
Water quality. When water was present in the wet-
land, a suite of physicochemical parameters were
recorded including: pH, salinity (using a TPS WP-81
pH/salinity/conductivity meter and a portable
salinity refractometer, Vista Series Instruments,
A366ATC); turbidity (using a Hach 2100P portable
turbidimeter, Hach Company, Colorado, U.S.A.); gil-
vin (water filtered through 0.2 lm filters and kept in
the dark until absorbance was measured at 440 nm),
chlorophyll a, b, c (known volume of water filtered
using Whatman GF/C filters in the field, then kept on
ice for transport to the laboratory) and water depth.
Raw absorbances were converted to absorbance coef-
ficients for gilvin by multiplying by 2.303 · 100 (Kirk,
1994). Chlorophyll samples were processed by the
Marine and Freshwater Research Laboratory at Mur-
doch University (NATA accredited). Chlorophylls
were extracted by grinding in 90% aqueous ethanol
(Clesceri, Greenberg & Eaton, 1999). Absorbances of
photosynthetic pigments were determined spectro-
photometrically at 750, 630, 664 and 647 nm. Concen-
trations were calculated using the equations of
Clesceri et al. (1999). Chlorophyll concentrations that
fell below the detection limit (0.1 lg L)1) were
assumed to be zero for the purposes of data analyses.
Water depth was taken at three permanent samp-
ling sites around each wetland. These records do not
provide the absolute maximum depth of the wetland
but were comparable between sampling occasions.
Macrophyte biomass. When aquatic macrophytes were
present and large enough to be harvested (>10 cm
tall), aboveground biomass was sampled using grass
shears to remove plants at ground level. Relative
density was assessed visually and three representa-
tive subsamples harvested at each site, to a total area
of approximately 0.07 m2 (representing three shearing
arcs). This process was repeated at each of the three
(a) Continuum (b) Threshold (c) Alternative regimes
Eco
syst
em c
ondi
tion
Salinity
BMC-dominated
Macrophyte-dominated
Eco
syst
em c
ondi
tion
Salinity
BMC-dominated
Macrophyte-dominated
BMC-dominated
Macrophyte-dominated
Eco
syst
em c
ondi
tion
Salinity
Fig. 1 Three possible pathways along which the shift from a macrophyte-dominated to a benthic microbial community (BMC)-
dominated regime might occur in a secondarily salinised wetland system (adapted from Scheffer et al., 2001; Scheffer & Carpenter,
2003).
Alternative regimes in salinised wetlands 1231
Table
2P
red
icti
on
sfo
rsa
lin
ew
etla
nd
eco
syst
emre
spo
nse
sto
sali
nit
ych
ang
eu
nd
erea
cho
fth
ree
con
cep
tual
mo
del
s(F
ig.
1)
Fac
tor
Co
nti
nu
um
mo
del
Sim
ple
thre
sho
ldm
od
elA
lter
nat
ive
reg
imes
mo
del
Rel
atio
nsh
ipb
etw
een
sali
nit
ych
ang
ean
d
reg
ime
shif
ts
Ch
ang
ein
com
mu
nit
yd
om
inan
ced
irec
tly
pro
po
rtio
nal
tosa
lin
ity
chan
ge
Reg
ime
shif
tat
thre
sho
ldsa
lin
ity
Reg
ime
shif
tsat
sali
nit
yex
trem
eso
rat
inte
rmed
iate
sali
nit
ies
wit
had
dit
ion
al
per
turb
atio
n
No
thre
sho
ldsa
lin
ity
con
cen
trat
ion
nee
ds
tob
ecr
oss
edfo
rre
gim
eto
chan
ge
No
hy
ster
esis
effe
cts
evid
ent
(sh
ift
bac
k
can
occ
ur
atsa
me
sali
nit
y)
Hy
ster
esis
effe
cts
evid
ent
Macrophyteloss
andbenthic
microbial
com-
munityincrease
aregradual
assalinity
increases(andvice
versa)
Macrophyte-dominated
below
threshold
salinityandbenthic
microbial
community-
dominated
above.Sudden
switch
betw
een
dominance
atsalinitythreshold(approxi-
mately50
ppt)
Sudden
switch
betw
eenmacrophyteandbenthic
microbial
communitydominance
whensalin-
ityreachesan
extrem
e(highor
low
salinity)
orthesystem
isperturbed
atinterm
ediate
salinities(<15
toapproxim
ately50
ppt)
Per
sist
ence
of
tran
siti
on
alre
gim
esT
ran
siti
on
alre
gim
esab
leto
per
sist
Tra
nsi
tio
nal
reg
imes
hig
hly
tran
sien
tT
ran
siti
on
alre
gim
esh
igh
lytr
ansi
ent
Macrophytes
andbenthic
microbial
communi-
ties
canbe
co-dom
inantover
arange
ofsalini-
ties
andover
severalmonths
Macrophytes
andbenthic
microbial
communi-
ties
rarely
co-dom
inantandonly
forvery
shortperiods
Macrophytes
andbenthic
microbial
communi-
ties
rarely
co-dom
inantandonly
forvery
shortperiods
Imp
ort
ance
of
eco
log
ical
resi
lien
ceto
reg
ime
shif
ts
Ch
ang
esin
eco
log
ical
resi
lien
cear
en
ot
nec
essa
ryfo
ra
shif
tto
occ
ur
Ch
ang
esin
eco
log
ical
resi
lien
cear
en
ot
nec
essa
ryfo
ra
shif
tto
occ
ur
Wea
ken
ing
of
eco
log
ical
resi
lien
ceim
po
rt-
ant
for
reg
ime
shif
ts
Wea
ken
ing
of
eco
syst
emre
sili
ence
may
chan
ge
the
slo
pe
of
mo
del
,b
ut
no
tit
s
shap
e
Wea
ken
ing
of
eco
syst
emre
sili
ence
may
chan
ge
thre
sho
ldsa
lin
ity
,b
ut
no
tth
e
shap
eo
fm
od
el
Sh
ifts
atin
term
edia
tesa
lin
itie
sca
nn
ot
oc-
cur
wit
ho
ut
exte
rnal
per
turb
atio
n
Bio
tic
chan
ges
dri
ven
larg
ely
by
sali
nit
y
incr
ease
so
rd
ecre
ases
(sal
init
yto
lera
nce
)
Bio
tic
chan
ges
dri
ven
larg
ely
by
sali
nit
y
incr
ease
so
rd
ecre
ases
(sal
init
yto
lera
nce
)
Ch
ang
esin
resi
lien
cem
ayu
nd
erm
ine
a
par
ticu
lar
‘eq
uil
ibri
um
’
Macrophyteandbenthic
microbial
community
dominance
respondprim
arilyto
salinity
level
Macrophyteandbenthic
microbial
community
dominance
respondprim
arilyto
threshold
salinitylevel(50ppt)
Macrophyteor
benthic
microbial
community
dominance
canbe
maintained
over
arange
of
interm
ediate
salinitylevels
(<15
toapproxi-
mately50
ppt)
Ex
iste
nce
of
self
-sta
bil
isin
gm
ech
anis
ms
No
stro
ng
feed
bac
ko
rse
lf-s
ust
ain
ing
mec
han
ism
s
So
me
wea
kfe
edb
ack
mec
han
ism
sat
sali
n-
ity
extr
emes
bu
tli
kel
yto
bre
akd
ow
n
wh
enth
resh
old
sali
nit
yre
ach
ed
Str
on
gfe
edb
ack
or
self
-sta
bil
isin
gm
ech
a-
nis
ms
Once
salinitystarts
toincrease,achange
in
macrophyteandbenthic
microbial
commu-
nitydominance
occurs
Change
inmacrophyteor
benthic
microbial
communitydominance
may
beminim
aluntil
threshold(50ppt)is
reached
Verylittle
change
inmacrophyteor
benthic
microbial
communitydominance
over
awide
range
ofinterm
ediate
salinities(<15
toap-
proxim
ately50
ppt)
(withoutperturbation)
Via
bil
ity
of
reco
lon
isat
ion
Per
sist
ence
of
som
eo
rgan
ism
sfr
om
each
do
min
ant
com
mu
nit
yat
inte
rmed
iate
sali
nit
ies
No
per
sist
ence
of
org
anis
ms
fro
mal
ter-
nat
ive
do
min
ant
com
mu
nit
yo
nce
thre
sho
ldis
cro
ssed
No
per
sist
ence
of
org
anis
ms
fro
mal
ter-
nat
ive
do
min
ant
com
mu
nit
yo
nce
reg
ime
shif
to
ccu
rs
Rec
olo
nis
atio
nre
lati
vel
yra
pid
Sp
eed
of
reco
lon
isat
ion
dep
end
ent
on
avai
lab
ilit
yo
fv
iab
lep
rop
agu
les
fro
mth
e
seed
ban
ko
rn
earb
yw
etla
nd
Sp
eed
of
reco
lon
isat
ion
dep
end
ent
on
avai
lab
ilit
yo
fv
iab
lep
rop
agu
les
fro
mth
e
seed
ban
ko
rn
earb
yw
etla
nd
Bothtypesof
organismsareableto
persistand
reproduce
atinterm
ediate
salinities(<15
to
approxim
ately50
ppt)
Once
thresholdis
reached(50ppt),most/all
livingorganismsfrom
previousregimeareno
longerableto
persistor
reproduce
Once
regimeshiftoccurs,most/allliving
organismsfrom
previousregimearenolonger
ableto
persistor
reproduce
Pro
po
sed
thre
sho
ldsa
lin
itie
s(>
50p
pt
thre
sho
ldfo
rsh
ift
fro
msu
bm
erg
edm
acro
ph
yte
tob
enth
icm
icro
bia
lco
mm
un
ity
do
min
ated
,<
15p
pt
thre
sho
ldfo
rre
ver
sesw
itch
)fr
om
Sim
etal.,
inp
ress
a,b
.It
alic
ised
tex
tin
dic
ates
det
ails
spec
ific
tore
gim
esh
ifts
insa
lin
ew
etla
nd
s.
1232 L.L. Sim et al.

permanent sampling sites at each wetland. If macro-
phytes were too small to be harvested, their presence
only was recorded.
Macrophyte samples were refrigerated after collec-
tion, and debris, sediment and invertebrates removed
from them by washing and hand-picking before
drying for 24 h at 105 �C . Dry samples were weighed
to the nearest 0.01 g. Macrophyte beds usually com-
prised two or three species (Table 4), but species were
not separated before drying.
Biomass (g dry weight m)2) was expressed in cat-
egories on a scale of natural logarithms (Table 5). Due
to the large spread of values in the data, a linear scale
was inappropriate (too many categories would have
been required). The use of categories allowed an
estimate of biomass to be made for occasions when
plants were too small for harvesting and when there
were missing data (December 2003). When plants
were too small for harvesting they always fell into the
first category.
Macrophyte biomass was standardised across sites
by adjusting all values to a percentage of the maxi-
mum biomass at each site within each wetting and
drying cycle. This accounted for between-site vari-
ation in biomass and for the effects of year-to-year
differences in rainfall.
Macrophyte % cover. Percentage cover of submerged
macrophytes (whole lake) was determined using
aerial photographs where available (usually every
2 months), together with ground-truthing at each four
to six weekly sampling event. Ground-truthing consis-
ted of visual surveys of the lake bed during each
sampling trip to confirm the presence of macrophyte
stands or bare sediment. Data were expressed as
categories: 0 ¼ 0%; 20 ¼ 1–20%; 40 ¼ 21–40%; 60 ¼41–60%; 80 ¼ 61–80%; and 100 ¼ 81–100%. Similarly
to macrophyte biomass, the use of categories allowed
an estimate of percentage cover to be made for
occasions on which aerial photographs were not avail-
able. These estimates were made using the preceding
and subsequent aerial photographs for the site.
Benthic microbial biomass. If a benthic microbial com-
munity was deemed to be present (visual assessment
of colour and cohesiveness), the estimated depth of
the benthic layer and levels of benthic chlorophyll and
phaeophytin were measured using sediment cores
(40 mm diameter). If the benthic layer was cohesive,Tab
le3
Stu
dy
site
loca
tio
ns
and
det
ails
Wet
lan
dn
ame
Lo
cati
on
Lat
itu
de,
lon
git
ud
eT
yp
eS
ize
(ha)
Ten
ure
Lak
eC
oo
gee
Nea
rC
oo
gee
,
sou
thw
est
of
Per
th
32�0
8.40
1¢S
,11
5�46
.738¢E
Med
ium
-siz
ed,
per
man
ent
wet
lan
d(p
oss
ibly
gro
un
dw
ater
fed
)w
ith
seas
on
al
flu
ctu
atio
ns
inw
ater
lev
el
60.4
Cit
yo
fC
ock
bu
rn
Lak
eM
ears
Nea
rB
roo
kto
n32�1
3.84
2¢S
,11
7�21
.566¢E
Lar
ge,
op
en,
per
iod
ical
lyin
un
dat
ed.
Max
imu
md
epth
2.4
m
208
Pri
vat
ean
dD
epar
tmen
to
f
Co
nse
rvat
ion
and
Lan
dM
anag
emen
t
Lit
tle
Wh
ite
Lak
eN
ear
Nar
rog
in33�0
0.64
0¢S
,11
7�26
.456¢E
Med
ium
-siz
ed,
seas
on
alw
etla
nd
64D
epar
tmen
to
fC
on
serv
atio
nan
d
Lan
dM
anag
emen
t
Art
hu
rR
iver
Fla
tsN
ear
Hig
hb
ury
33�0
4.65
1¢S
,11
7�16
.614¢E
Sea
son
ally
inu
nd
ated
shal
low
pal
aeo
chan
nel
–D
epar
tmen
to
fC
on
serv
atio
nan
d
Lan
dM
anag
emen
t
Lak
eM
ou
nt
Bro
wn
Nea
rH
end
erso
n
sou
thw
est
of
Per
th
33�1
0.36
8¢S
,11
5�47
.446¢E
Sm
all,
seas
on
alw
etla
nd
5.3
Dep
artm
ent
of
Co
nse
rvat
ion
and
Lan
dM
anag
emen
t
Mee
kin
gL
ake
No
rth
of
Dar
kan
33�1
4.73
2¢S
,11
6�47
.058¢E
Med
ium
-siz
ed,
seas
on
alw
etla
nd
25P
riv
ate
Ru
shy
Sw
amp
Nea
rW
oo
dan
illi
ng
33�3
2.42
0¢S
,11
7�16
.142¢E
Med
ium
-siz
ed,
seas
on
alw
etla
nd
12.5
Pri
vat
e
Alternative regimes in salinised wetlands 1233

the top part of the core (benthic microbial community
above the sediment) was cut off and placed in a vial
(depth of layer recorded); if flocculent, the top part of
the layer was poured into a vial and the volume
recorded. The nature of the benthic microbial com-
munity varied, but was usually comprised of dia-
toms, non-filamentous green algae or non-filamentous
cyanobacteria.
Similarly to water column photosynthetic pigments,
sediment pigments were extracted using the acetone
method by the Marine and Freshwater Research
Laboratory at Murdoch University (Clesceri et al.,
1999). Pigment concentrations that fell below the
detection limit (0.1 mg m)3) were assumed to be zero
for the purposes of data analyses.
Similarly to macrophyte biomass, benthic microbial
biomass (mg m)3 of benthic chlorophyll a) was
standardised across sites by adjusting all values to a
percentage of the maximum biomass at each site
within one wetting and drying cycle.
Benthic microbial community % cover. Percentage cover
of benthic microbial community (whole lake) was
determined using visual estimates at each four to six
weekly sampling event. Data were expressed as
categories: 0 ¼ 0%; 33.3 ¼ 1–33.3%; 66.7 ¼ 33.4–
66.7%; and 100 ¼ 66.8–100%. Benthic microbial com-
munities were not reliably detectable using aerial
photographs. The patchiness of benthic microbial
communities meant that cover could only be assessed
with reasonable accuracy in broad categories.
Statistical analyses
Classification and ordination. Multivariate analyses per-
formed in PRIMER (Clarke & Gorley, 2001) were usedTable
4S
pec
ies
of
mac
rop
hy
tes
fou
nd
atfi
eld
site
san
dre
lati
ve
abu
nd
ance
s
Wet
lan
d
Rupp
ia
polycarpa
R.
Mas
on
Rupp
ia
megacarpa
R.
Mas
on
Lepilaena
preissii
(Leh
m.)
F.
Mu
ell
Lam
prothamnium
macropogon
(A.
Bra
un
)O
ph
el
Lam
prothamnium
cf.succinctum
(A.
Bra
un
in
Asc
her
son
)W
oo
d
Lam
prothamnium
sp.
(undescribed)
Lak
eC
oo
gee
Few
pla
nts
on
ly,
pro
bab
lyR.polycarpa
––
––
–
Lak
eM
ears
–P
rese
nt
incl
um
ps
––
Do
min
ant
–
Lit
tle
Wh
ite
Lak
eS
par
se–
Co
-do
min
ant
–C
o-d
om
inan
t–
Art
hu
rR
iver
Fla
ts–
–F
ewp
lan
tso
nly
No
tfl
ow
erin
g(n
ot
po
siti
ve
ID)
––
–
Lak
eM
tB
row
nD
om
inan
t–
Pre
sen
t–
–C
o-d
om
inan
t
Mee
kin
gL
ake
Do
min
ant
–P
rese
nt
Co
-do
min
ant
––
Ru
shy
Sw
amp
Pre
sen
t–
Pre
sen
tD
om
inan
t–
–
Table 5 Above-ground submerged macrophyte biomass categ-
ories (scale is natural logarithms)
Biomass
category
Range of biomass values
included (g DW m)2)
0 0
2.72 0–2.72
7.39 2.73–7.39
20.09 7.40–20.09
54.60 20.10–54.60
148.41 54.61–148.41
403.43 148.42–403.43
1096.63 403.44–1096.63
2980.96 1096.64–2980.96
1234 L.L. Sim et al.
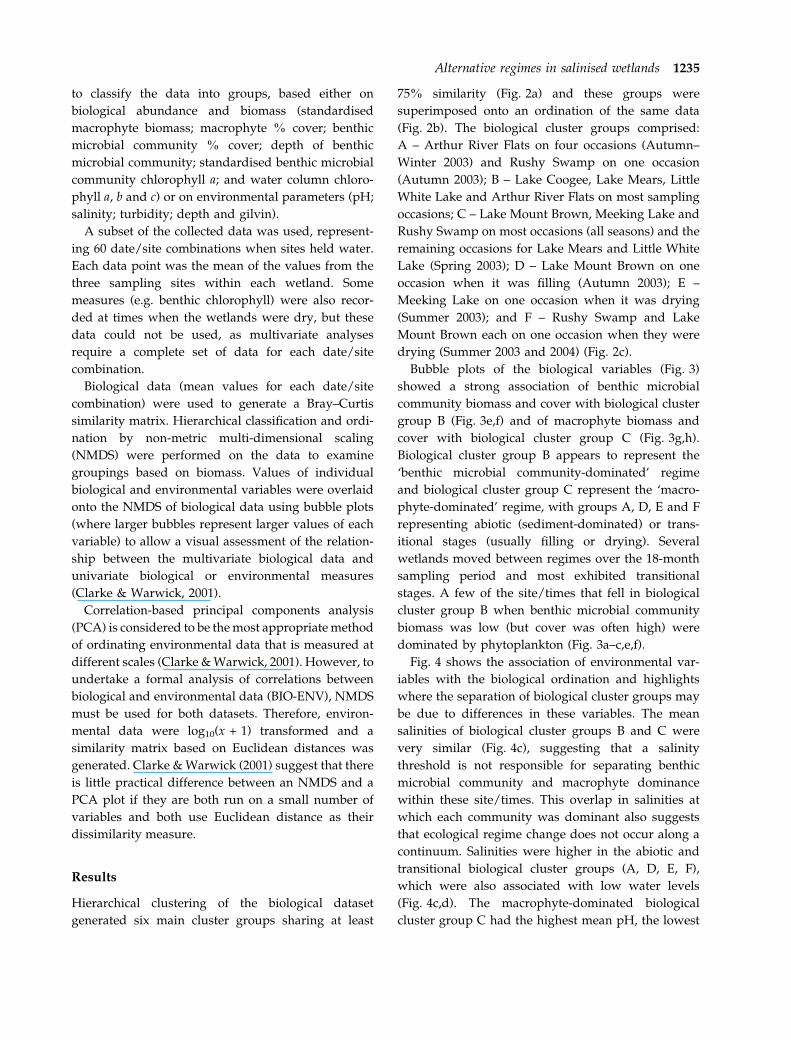
to classify the data into groups, based either on
biological abundance and biomass (standardised
macrophyte biomass; macrophyte % cover; benthic
microbial community % cover; depth of benthic
microbial community; standardised benthic microbial
community chlorophyll a; and water column chloro-
phyll a, b and c) or on environmental parameters (pH;
salinity; turbidity; depth and gilvin).
A subset of the collected data was used, represent-
ing 60 date/site combinations when sites held water.
Each data point was the mean of the values from the
three sampling sites within each wetland. Some
measures (e.g. benthic chlorophyll) were also recor-
ded at times when the wetlands were dry, but these
data could not be used, as multivariate analyses
require a complete set of data for each date/site
combination.
Biological data (mean values for each date/site
combination) were used to generate a Bray–Curtis
similarity matrix. Hierarchical classification and ordi-
nation by non-metric multi-dimensional scaling
(NMDS) were performed on the data to examine
groupings based on biomass. Values of individual
biological and environmental variables were overlaid
onto the NMDS of biological data using bubble plots
(where larger bubbles represent larger values of each
variable) to allow a visual assessment of the relation-
ship between the multivariate biological data and
univariate biological or environmental measures
(Clarke & Warwick, 2001).
Correlation-based principal components analysis
(PCA) is considered to be the most appropriate method
of ordinating environmental data that is measured at
different scales (Clarke & Warwick, 2001). However, to
undertake a formal analysis of correlations between
biological and environmental data (BIO-ENV), NMDS
must be used for both datasets. Therefore, environ-
mental data were log10(x + 1) transformed and a
similarity matrix based on Euclidean distances was
generated. Clarke & Warwick (2001) suggest that there
is little practical difference between an NMDS and a
PCA plot if they are both run on a small number of
variables and both use Euclidean distance as their
dissimilarity measure.
Results
Hierarchical clustering of the biological dataset
generated six main cluster groups sharing at least
75% similarity (Fig. 2a) and these groups were
superimposed onto an ordination of the same data
(Fig. 2b). The biological cluster groups comprised:
A – Arthur River Flats on four occasions (Autumn–
Winter 2003) and Rushy Swamp on one occasion
(Autumn 2003); B – Lake Coogee, Lake Mears, Little
White Lake and Arthur River Flats on most sampling
occasions; C – Lake Mount Brown, Meeking Lake and
Rushy Swamp on most occasions (all seasons) and the
remaining occasions for Lake Mears and Little White
Lake (Spring 2003); D – Lake Mount Brown on one
occasion when it was filling (Autumn 2003); E –
Meeking Lake on one occasion when it was drying
(Summer 2003); and F – Rushy Swamp and Lake
Mount Brown each on one occasion when they were
drying (Summer 2003 and 2004) (Fig. 2c).
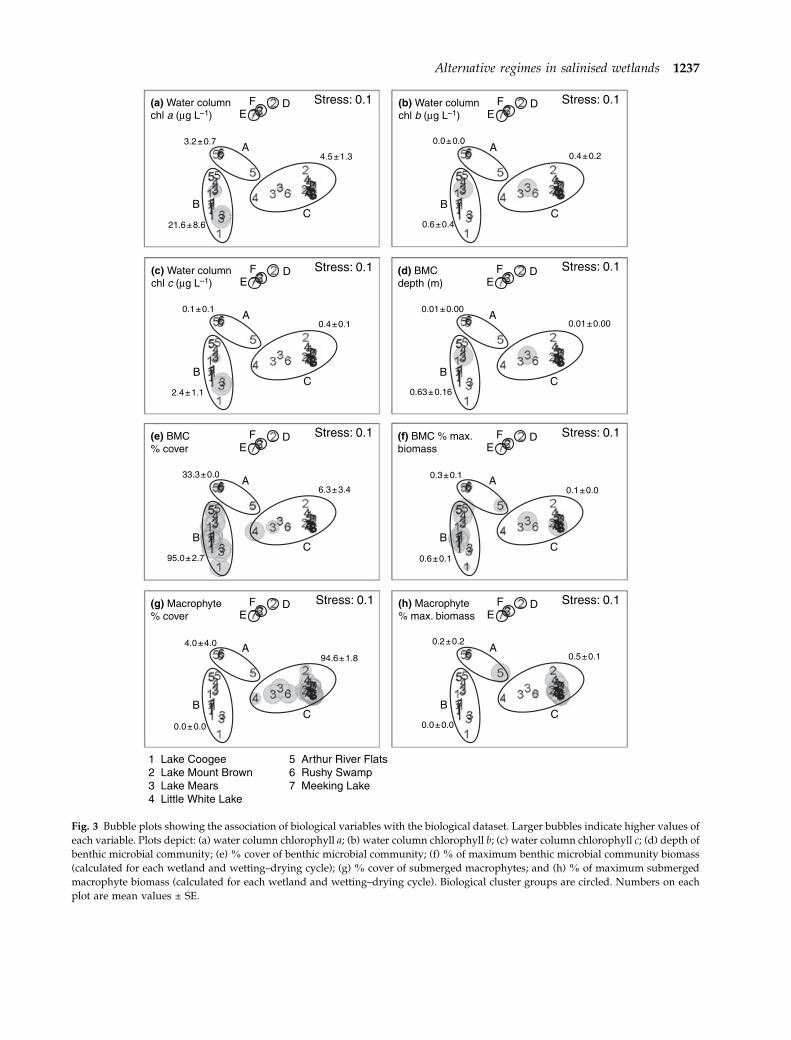
Bubble plots of the biological variables (Fig. 3)
showed a strong association of benthic microbial
community biomass and cover with biological cluster
group B (Fig. 3e,f) and of macrophyte biomass and
cover with biological cluster group C (Fig. 3g,h).
Biological cluster group B appears to represent the
‘benthic microbial community-dominated’ regime
and biological cluster group C represent the ‘macro-
phyte-dominated’ regime, with groups A, D, E and F
representing abiotic (sediment-dominated) or trans-
itional stages (usually filling or drying). Several
wetlands moved between regimes over the 18-month
sampling period and most exhibited transitional
stages. A few of the site/times that fell in biological
cluster group B when benthic microbial community
biomass was low (but cover was often high) were
dominated by phytoplankton (Fig. 3a–c,e,f).
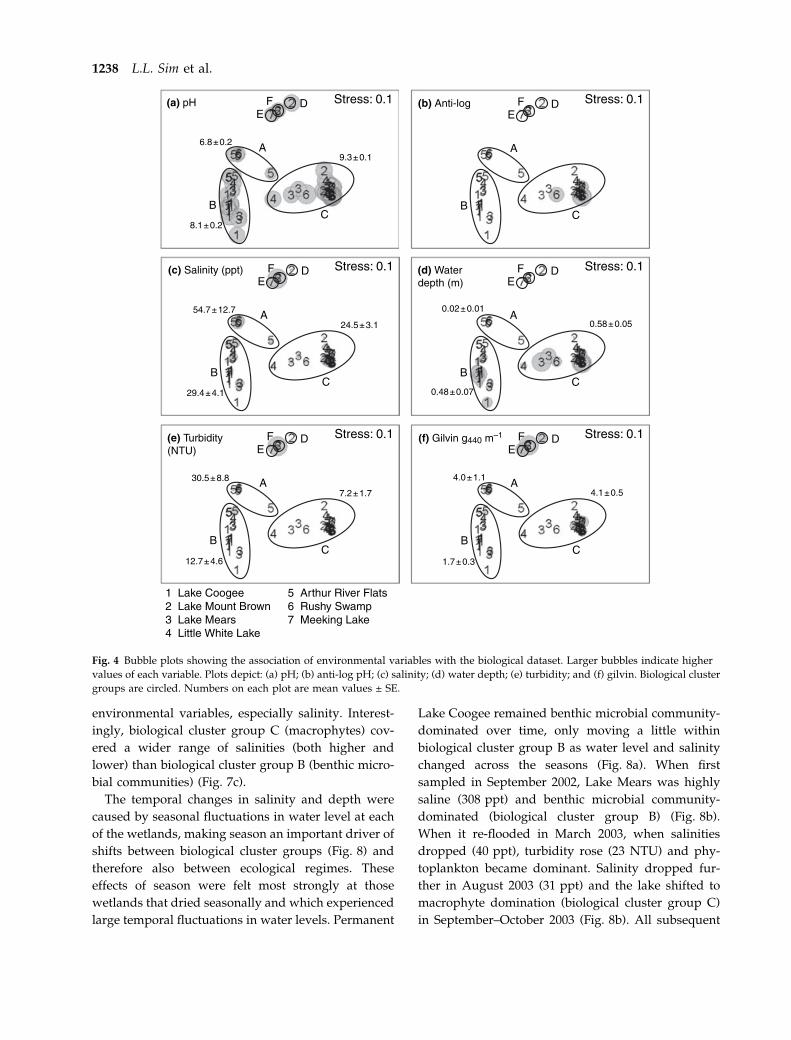
Fig. 4 shows the association of environmental var-
iables with the biological ordination and highlights
where the separation of biological cluster groups may
be due to differences in these variables. The mean
salinities of biological cluster groups B and C were
very similar (Fig. 4c), suggesting that a salinity
threshold is not responsible for separating benthic
microbial community and macrophyte dominance
within these site/times. This overlap in salinities at
which each community was dominant also suggests
that ecological regime change does not occur along a
continuum. Salinities were higher in the abiotic and
transitional biological cluster groups (A, D, E, F),
which were also associated with low water levels
(Fig. 4c,d). The macrophyte-dominated biological
cluster group C had the highest mean pH, the lowest
Alternative regimes in salinised wetlands 1235

turbidity and the highest mean water depth
(Fig. 4a,e,d). Fig. 5 confirms the overlap in salinity
levels between biological cluster groups B and C and
shows that a threshold between the macrophyte and
benthic microbial community-dominated regimes
does not exist at 30, 40 or 50 ppt.
Ranked correlations between the biological similar-
ity matrix and the environmental dataset (using the
BIO-ENV procedure, Clarke & Warwick, 2001)
revealed that no environmental variable (or combina-
tion thereof) strongly influenced the groupings of the
biological site/times (Table 6). These low correlations
were reflected by the scatter of high and low
environmental values across the bubble plots
(Fig. 4). The variable with the strongest correlation
with the biological similarity matrix was pH (qw ¼0.361, Table 6). The relationship of pH with biological
cluster groups was not evident in Fig. 4a due to its
expression on a logarithmic scale. However, when pH
was plotted as anti-logs, the highest values can be
seen tightly clustered within biological cluster group
C, where macrophyte biomass’ were also high
(Figs 3g & 4b).
Ordination of the environmental dataset (Fig. 6)
revealed no distinct clustering into environmental
cluster groups, but a clear divide between one side of
the plot (most of biological cluster groups B and C)
and the other side (abiotic and transitional site/times).
Strong environmental gradients were evident (Fig. 7),
with the ordination apparently driven most strongly
by salinity, depth and to a lesser degree by pH
(Fig. 7b–d). All the abiotic or transitional site/times,
including the outliers from biological cluster group B
were characterised by low water levels, and in many
cases, also by high salinities. The biological cluster
group B outliers were all from Arthur River Flats, the
driest site sampled. Both the strongly biotic biological
cluster groups (B and C) ranged over a wide range of
5555613333555111111111111443326442627773236272673366673267266722762
20
40
60
80
100
A B C DE F
(a)
Sim
ilari
ty
Stress: 0.1 A
B
C
D
E
F
A
CB
EF D(b)
Stress: 0.1
A
CB
EF D(c)
1 Lake Coogee2 Lake Mount Brown3 Lake Mears4 Little White Lake5 Arthur River Flats6 Rushy Swamp7 Meeking Lake
Fig. 2 Two-dimensional non-metric
multidimensional scaling (NMDS)
ordination plots and hierarchical cluster
diagram based on the biological dataset:
(a) hierarchical cluster diagram (single
linkage); (b) NMDS showing cluster
groupings based on hierarchical clustering
(‡75% similarity); and (c) NMDS showing
sites. Cluster groups are circled.
1236 L.L. Sim et al.
Stress: 0.1
A
CB
EF D(a) Water column
chl a (µg L–1)
A
CB
EF D(b) Water column
chl b (µg L–1)
A
CB
EF D(c) Water column
chl c (µg L–1)
A
CB
EF D(d) BMC
depth (m)
A
CB
EF D(e) BMC
% cover
A
CB
EF D(f) BMC % max.
biomass
A
CB
EF D(g) Macrophyte
% cover
A
CB
EF D(h) Macrophyte
% max. biomass
Stress: 0.1
Stress: 0.1Stress: 0.1
Stress: 0.1Stress: 0.1
Stress: 0.1 Stress: 0.1
1 Lake Coogee2 Lake Mount Brown3 Lake Mears4 Little White Lake
3.2 ± 0.7
21.6 ± 8.6
4.5 ± 1.3
0.0 ± 0.0
0.6 ± 0.4
0.4 ± 0.2
0.1 ± 0.1
2.4 ± 1.1
0.4 ± 0.1
0.01 ± 0.00
0.63 ± 0.16
0.01 ± 0.00
33.3 ± 0.0
95.0 ± 2.7
6.3 ± 3.4
0.3 ± 0.1
0.6 ± 0.1
0.1 ± 0.0
4.0 ± 4.0
0.0 ± 0.0
94.6 ± 1.8
0.2 ± 0.2
0.0 ± 0.0
0.5 ± 0.1
5 Arthur River Flats6 Rushy Swamp7 Meeking Lake
Fig. 3 Bubble plots showing the association of biological variables with the biological dataset. Larger bubbles indicate higher values of
each variable. Plots depict: (a) water column chlorophyll a; (b) water column chlorophyll b; (c) water column chlorophyll c; (d) depth of
benthic microbial community; (e) % cover of benthic microbial community; (f) % of maximum benthic microbial community biomass
(calculated for each wetland and wetting–drying cycle); (g) % cover of submerged macrophytes; and (h) % of maximum submerged
macrophyte biomass (calculated for each wetland and wetting–drying cycle). Biological cluster groups are circled. Numbers on each
plot are mean values ± SE.
Alternative regimes in salinised wetlands 1237
environmental variables, especially salinity. Interest-
ingly, biological cluster group C (macrophytes) cov-
ered a wider range of salinities (both higher and
lower) than biological cluster group B (benthic micro-
bial communities) (Fig. 7c).
The temporal changes in salinity and depth were
caused by seasonal fluctuations in water level at each
of the wetlands, making season an important driver of
shifts between biological cluster groups (Fig. 8) and
therefore also between ecological regimes. These
effects of season were felt most strongly at those
wetlands that dried seasonally and which experienced
large temporal fluctuations in water levels. Permanent
Lake Coogee remained benthic microbial community-
dominated over time, only moving a little within
biological cluster group B as water level and salinity
changed across the seasons (Fig. 8a). When first
sampled in September 2002, Lake Mears was highly
saline (308 ppt) and benthic microbial community-
dominated (biological cluster group B) (Fig. 8b).
When it re-flooded in March 2003, when salinities
dropped (40 ppt), turbidity rose (23 NTU) and phy-
toplankton became dominant. Salinity dropped fur-
ther in August 2003 (31 ppt) and the lake shifted to
macrophyte domination (biological cluster group C)
in September–October 2003 (Fig. 8b). All subsequent
A
CB
EF D(a) pH
A
CB
EF D(b) Anti-log
A
CB
EF D(d) Water
depth (m)
A
CB
EF D(c) Salinity (ppt)
A
CB
EF D(f) Gilvin g440 m–1
A
CB
EF D(e) Turbidity
(NTU)
1 Lake Coogee2 Lake Mount Brown3 Lake Mears4 Little White Lake
Stress: 0.1
Stress: 0.1
Stress: 0.1
Stress: 0.1
Stress: 0.1Stress: 0.1
6.8 ± 0.2
8.1 ± 0.2
9.3 ± 0.1
54.7 ± 12.7
29.4 ± 4.1
24.5 ± 3.1
0.02 ± 0.01
0.48 ± 0.07
0.58 ± 0.05
30.5 ± 8.8
12.7 ± 4.6
7.2 ± 1.7
4.0 ± 1.1
1.7 ± 0.3
4.1 ± 0.5
5 Arthur River Flats6 Rushy Swamp7 Meeking Lake
Fig. 4 Bubble plots showing the association of environmental variables with the biological dataset. Larger bubbles indicate higher
values of each variable. Plots depict: (a) pH; (b) anti-log pH; (c) salinity; (d) water depth; (e) turbidity; and (f) gilvin. Biological cluster
groups are circled. Numbers on each plot are mean values ± SE.
1238 L.L. Sim et al.

site/times for Lake Mears occurred within biologi-
cal cluster group C. Little White Lake showed a
very similar pattern of movement to Lake Mears,
moving rapidly from benthic microbial community-
dominated in April–May 2003 (130–192 ppt) to macro-
phyte-dominated by September when salinity had
remained at 27–28 ppt for over a month (Fig. 8c).
Arthur River Flats started in biological cluster group
A when water levels were low (depth <0.01 m,
salinity 79 ppt) and moved into biological cluster
group B as the water rose slightly (depth <0.02 m,
salinity 65.5 ppt) (Fig. 8d).
There were two occasions on which both macro-
phytes and a benthic microbial community covered
>50% of a wetland; once at Lake Mears and once at
Little White Lake, both in September 2003, at a
salinity of 27 ppt. By October, the cover of macro-
phytes at both lakes had increased further and the
benthic microbial community had declined,
A
CB
EF D(a)
Stress: 0.1
Stress: 0.1
Stress: 0.1
A
CB
EF D(b)
A
CB
EF D(c)
<30 ppt
>30 ppt
<40 ppt
>40 ppt
<50 ppt
>50 ppt
Fig. 5 Biological non-metric multidimensional scaling (NMDS)
plot showing sites classified by salinity level: (a) greater or less
than 30 ppt; (b) greater or less than 40 ppt; and (c) greater or less
than 50 ppt. The submerged macrophyte community is likely to
have a restricted ability to establish and persist at >50 ppt (Sim
et al., in press a). Biological cluster groups are circled.
Table 6 Results of the BioEnv correlation analysis (Spearman
ranked correlation of biological similarity matrix with the
environmental dataset)
Selections Correlation qw
pH 0.361
pH, water depth, gilvin 0.285
Water depth, gilvin 0.28
pH, turbidity, water depth, gilvin 0.26
Turbidity, water depth, gilvin 0.258
pH, salinity, water depth, gilvin 0.258
Salinity, water depth, gilvin 0.255
All 0.236
Salinity, turbidity, water depth, gilvin 0.234
pH, water depth 0.224
pH, turbidity, water depth 0.22
Turbidity, water depth 0.216
Water depth 0.208
pH, salinity, water depth 0.205
Salinity, water depth 0.202
pH, salinity, turbidity, water depth 0.197
Salinity, turbidity, water depth 0.194
pH, turbidity, gilvin 0.193
Turbidity, gilvin 0.188
pH, gilvin 0.162
1 Lake Coogee2 Lake Mount Brown3 Lake Mears4 Little White Lake5 Arthur River Flats6 Rushy Swamp7 Meeking Lake
A
B
C
D
E
F
Stress: 0.11
Stress: 0.11
Fig. 6 Two-dimensional non-metric multidimensional scaling
(NMDS) ordination plots based on the environmental dataset:
(a) showing sites; and (b) showing biological cluster groupings
(‡75% similarity).
Alternative regimes in salinised wetlands 1239

although salinities had increased slightly (Fig. 8b,c).
At Lake Mears, phytoplankton were co-dominant
with benthic microbial communities from March to
late June 2003 and were co-dominant with macro-
phytes in August 2003.
Lake Mount Brown dried soon after it was first
sampled in 2002 (Fig. 8e). When re-wetting occurred
in April 2003, salinity was higher (22 ppt), depth
lower and turbidity higher than just prior to drying
and it formed part of an outlying (transitional)
biological cluster group D. It moved back to
biological cluster group C (macrophyte-dominated)
on the next sampling occasion as the water level
rose, salinity dropped (12 ppt) and macrophytes
first became large enough for biomass samples
(Fig. 8e). Drying at the end of the season caused it
to become transitional once more (Fig. 8e). Meeking
Lake and Rushy Swamp showed similar patterns to
each other, with rapid movement away from other
members of biological cluster group C (clear,
macrophyte-dominated) to outlying biological clus-
ter groups E and F, respectively, when drying
(Fig. 8f,g). These shifts were associated with decrea-
ses in water level, increases in salinity level (to 69
Stress:0.11(a) pH (b) Anti-log pH
(d) Water depth(c) Salinity
(e) Turbidity (f) GilvinStress:0.11
Stress:0.11
Stress:0.11
Stress:0.11
Stress:0.11
1 Lake Coogee2 Lake Mount Brown3 Lake Mears4 Little White Lake
5 Arthur River Flats6 Rushy Swamp7 Meeking Lake
Fig. 7 Bubble plots showing the association of environmental variables with the environmental dataset. Plots depict: (a) pH; (b) anti-
log pH; (c) salinity; (d) water depth; (e) turbidity; and (f) gilvin. Larger bubbles indicate higher values of each variable. Arrows
indicate gradient of increase for selected variables.
1240 L.L. Sim et al.
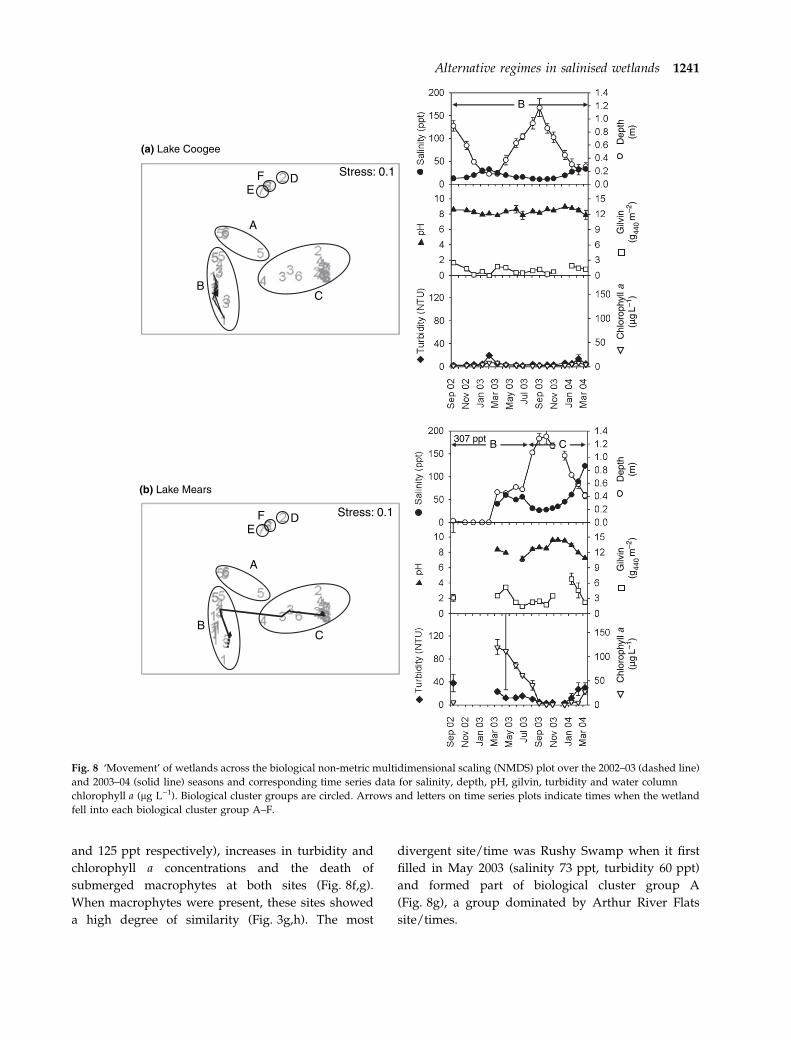
and 125 ppt respectively), increases in turbidity and
chlorophyll a concentrations and the death of
submerged macrophytes at both sites (Fig. 8f,g).
When macrophytes were present, these sites showed
a high degree of similarity (Fig. 3g,h). The most
divergent site/time was Rushy Swamp when it first
filled in May 2003 (salinity 73 ppt, turbidity 60 ppt)
and formed part of biological cluster group A
(Fig. 8g), a group dominated by Arthur River Flats
site/times.
A
CB
EF D Stress: 0.1
(a) Lake Coogee
B
A
CB
EF D Stress: 0.1
(b) Lake Mears
B C 307 ppt
C
hlor
ophy
ll a
(µg
L–1)
Gilv
in
(g44
0 m–2
)D
epth
(m)
Chl
orop
hyll
a(µ
g L–1
)G
ilvin
(g44
0 m–2
)D
epth
(m)
Fig. 8 ‘Movement’ of wetlands across the biological non-metric multidimensional scaling (NMDS) plot over the 2002–03 (dashed line)
and 2003–04 (solid line) seasons and corresponding time series data for salinity, depth, pH, gilvin, turbidity and water column
chlorophyll a (lg L)1). Biological cluster groups are circled. Arrows and letters on time series plots indicate times when the wetland
fell into each biological cluster group A–F.
Alternative regimes in salinised wetlands 1241

Discussion
Either submerged macrophytes or benthic microbes
dominated all seven wetlands on most occasions
when water was present during the 18-month samp-
ling period from September 2002 to March 2004.
Dominance of one group usually precluded domin-
ance of the other, despite the fact that the salinities
A
CB
EF D
Stress: 0.1
(c) Little White Lake
A
CB
EF D Stress: 0.1
(d) Arthur River Flats
B C B
A B
Chl
orop
hyll
a(µ
g L–1
)G
ilvin
(g44
0 m–2
)D
epth
(m)
Chl
orop
hyll
a(µ
g L–1
)G
ilvin
(g44
0 m–2
)D
epth
(m)
Fig. 8 (Continued)
1242 L.L. Sim et al.
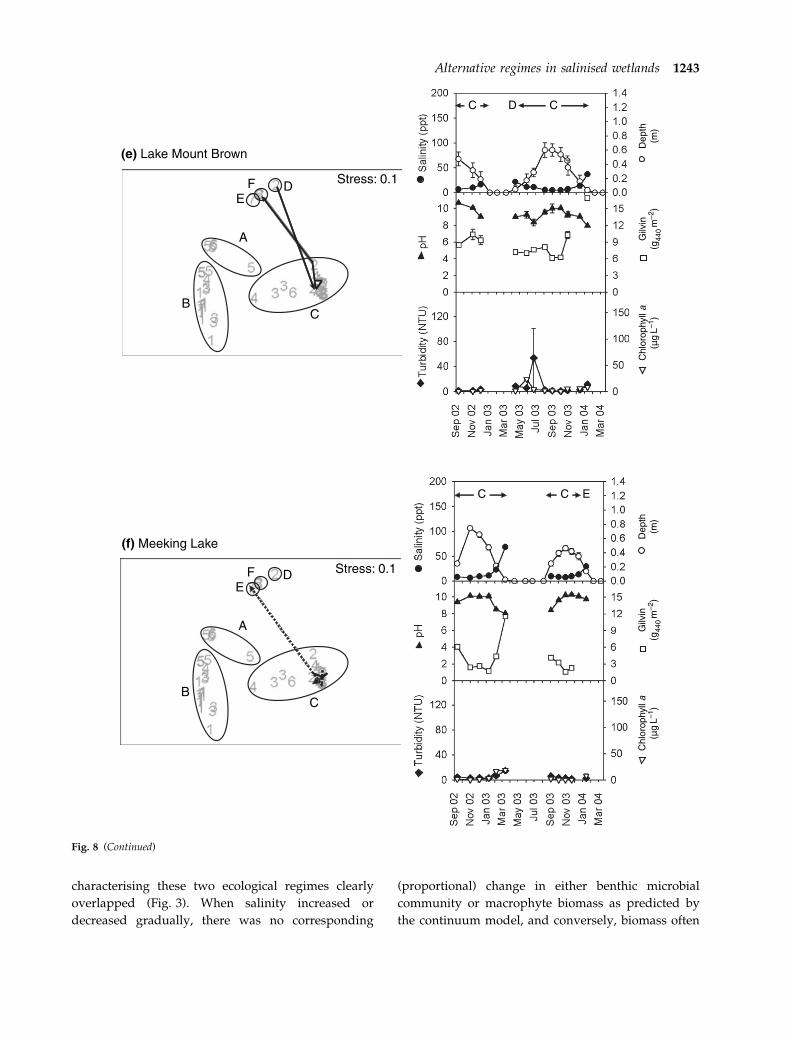
characterising these two ecological regimes clearly
overlapped (Fig. 3). When salinity increased or
decreased gradually, there was no corresponding
(proportional) change in either benthic microbial
community or macrophyte biomass as predicted by
the continuum model, and conversely, biomass often
A
CB
EF D Stress: 0.1
(e) Lake Mount Brown
A
CB
EF D Stress: 0.1
(f) Meeking Lake
C C D
C E C
Chl
orop
hyll
a(µ
g L–1
)G
ilvin
(g44
0 m–2
)D
epth
(m)
Chl
orop
hyll
a(µ
g L–1
)G
ilvin
(g44
0 m–2
)D
epth
(m)
Fig. 8 (Continued)
Alternative regimes in salinised wetlands 1243
continued to change when salinity remained relat-
ively stable (Figs 3 & 4). Furthermore, there was no
clear threshold salinity at which macrophyte and
benthic microbial community dominance switched,
even when a possible time lag after reaching this
salinity was taken into account (Fig. 8). These results
indicated that neither the continuum nor the simple
threshold model (Fig. 1) accurately represented eco-
logical regime shifts in these wetlands.
If the continuum model were supported, we would
expect to find macrophytes dominant at lower salinities
(<50 ppt, Sim et al., in press a) and benthic microbial
communities dominant at higher salinities (>50 ppt),
with a range of transitional regimes between these
(Sim et al., 2006). According to this model, benthic
microbial communities should not have become dom-
inant at lower salinities than macrophytes (Fig. 8) and
there should have been a range of intermediate salini-
ties at which the two regimes were co-dominant.
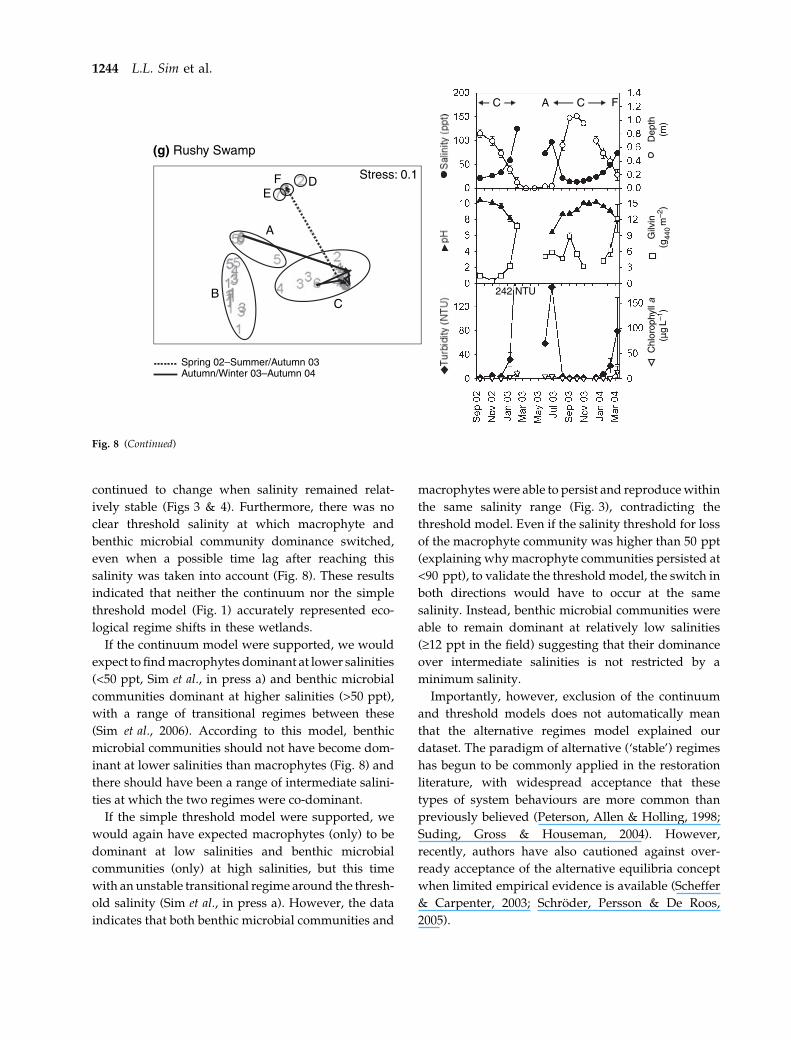
If the simple threshold model were supported, we
would again have expected macrophytes (only) to be
dominant at low salinities and benthic microbial
communities (only) at high salinities, but this time
with an unstable transitional regime around the thresh-
old salinity (Sim et al., in press a). However, the data
indicates that both benthic microbial communities and
macrophytes were able to persist and reproduce within
the same salinity range (Fig. 3), contradicting the
threshold model. Even if the salinity threshold for loss
of the macrophyte community was higher than 50 ppt
(explaining why macrophyte communities persisted at
<90 ppt), to validate the threshold model, the switch in
both directions would have to occur at the same
salinity. Instead, benthic microbial communities were
able to remain dominant at relatively low salinities
(‡12 ppt in the field) suggesting that their dominance
over intermediate salinities is not restricted by a
minimum salinity.
Importantly, however, exclusion of the continuum
and threshold models does not automatically mean
that the alternative regimes model explained our
dataset. The paradigm of alternative (‘stable’) regimes
has begun to be commonly applied in the restoration
literature, with widespread acceptance that these
types of system behaviours are more common than
previously believed (Peterson, Allen & Holling, 1998;
Suding, Gross & Houseman, 2004). However,
recently, authors have also cautioned against over-
ready acceptance of the alternative equilibria concept
when limited empirical evidence is available (Scheffer
& Carpenter, 2003; Schroder, Persson & De Roos,
2005).
A
CB
EF D Stress: 0.1
(g) Rushy Swamp
Spring 02–Summer/Autumn 03Autumn/Winter 03–Autumn 04
A FCC
242 NTU
Chl
orop
hyll
a(µ
g L–1
)G
ilvin
(g44
0 m–2
)D
epth
(m)
Fig. 8 (Continued)
1244 L.L. Sim et al.

The occurrence of the two ecological regimes at
overlapping salinities is not enough to demonstrate
that they comprise alternative equilibria. Likewise, the
transience of transitional regimes (when benthic
microbial community and macrophytes were co-domi-
nant) is far from conclusive evidence for a switch
from one ‘basin of attraction’ to another (Scheffer &
Carpenter, 2003). Furthermore, the alternative regimes
model predicts that an ecosystem will require external
perturbation to cause a regime shift (away from either
equilibrium state) at intermediate level of the driving
variable (salinity) (Table 2), which does not appear to
have occurred at either Lake Mears or Little White Lake
when moving from benthic microbial community to
macrophyte dominance. Instead, the shift away from
the benthic microbial community-dominated regime
appears simply to have occurred when water was
present for long enough, and at low enough salinities,
for germination to occur (Fig. 8). The benthic microbial
communities then declined due to physical break-up by
emerging macrophytes (L. Sim, personal observations,
Sim et al., in press b) and presumably also the eventual
shading of the substrate. This evidence suggests that
the benthic microbial community-dominated regime is
not a very stable equilibrium.
There were no recorded transitions from macro-
phyte to benthic microbial community dominance
except where drying first ended the macrophyte
regime (Fig. 8). It appears that once macrophytes
have established in seasonally drying wetlands, a
salinity-driven shift away from their dominance will
not occur within one wetting–drying cycle, even if
salinities reach up to 90 ppt. Furthermore, since high
salinities usually occur just before drying (Fig. 8) there
may be insufficient time for a (high) salinity-driven
regime shift to occur in these systems. It is possible
that drying is also necessary for conditions to again
become suitable for the establishment of benthic
microbial communities, since when macrophytes
senesce in these wetlands, the dead and dying plants
cover the benthos, forming a relatively thick layer of
decaying organic matter (L. Sim, personal observa-
tions), making it more difficult for a benthic microbial
community to establish even if water is present and
salinities remain high.
In order for the benthic microbial community and
macrophyte-dominated regimes to truly constitute
alternative equilibria, both of them would require self-
stabilising mechanisms and resilience against pertur-
bations that might cause them to lose their domin-
ance. Ecological resilience is a measure of the amount
of change/force required to shift a system from one
‘stability domain’ or persistent ecological regime to
another (Peterson et al., 1998). A measure of ecological
resilience takes into account the existence of factors
that help to stabilise an ecosystem, such as the
presence of multiple species that share similar func-
tional roles (Peterson et al., 1998). If one of these
species is lost, the system is still able to maintain the
same ecological function, due to functional redund-
ancy. There is an acceptance that lower biodiversity
leads to lower resilience for this reason; there is a
smaller suite of species to compensate if one group is
lost through a disturbance (Peterson et al., 1998).
In the shift from freshwater to salt-tolerant species
dominance, wetland ecosystems show considerable
resilience; the individual species change, but most of
their functional roles in habitat provision, primary
production and nutrient cycling are retained. How-
ever, the resultant salt-tolerant macrophyte commu-
nity tends to be species-poor, therefore reducing the
ability of the system to compensate for further species
losses. The remaining species offset this problem by
having very wide tolerance ranges for salinity, light
and other physicochemical variables (Brock, 1982;
Garcıa & Chivas, 2004; Sim et al., in press a) and
through their ability to rapidly exploit favourable (if
brief) hydrological conditions (Brock & Lane, 1983;
Brock et al., 2003), meaning that they are not easily lost
from a system.
The resilience of the benthic microbial community-
dominated regime appears to be much lower, not
because species diversity is too low or because the
functions of the microbes do not overlap sufficiently,
but because the benthic microbial community has a
low resistance to physical disturbance and is easily
outcompeted by a superior competitor (submerged
macrophytes) (Sim et al., in press b). As a community,
the benthic microbial community has wide tolerance
limits, but weak competitive power. It therefore
requires other conditions to be favourable (e.g.
hydrological regime at Lake Coogee) to allow it to
maintain dominance.
In this way, the existence of self-stabilising or
positive feedback mechanisms directly impact on the
resilience of a particular ecological regime. There are
well-documented self-stabilising mechanisms that
promote submerged macrophyte persistence and
Alternative regimes in salinised wetlands 1245
dominance, including their roles in providing refuges
for phytoplankton grazers, reducing sediment resus-
pension and removing nutrients from the water
column (Beklioglu & Moss, 1996) and these appear
to act over a wide range of salinity levels in Australian
salinising wetlands. Abiotic positive feedbacks also
promote the macrophyte-dominated regime, includ-
ing seasonal drying, which both stimulates germina-
tion and prevents benthic microbial communities
from becoming well established. In permanent sys-
tems, the benthic microbial community growth form
has the potential for strong self-stabilising mechan-
isms which could prevent macrophyte establishment;
for example it can persist in the form of an unstable
(e.g. flocculent) layer, which undermines the physical
stability of submerged plants (e.g. at Lake Coogee) or
can form a thick, laminated physical barrier between
the sediment and water column (Burke & Knott,
1997). In the latter case, sealing-off the sediment can
effectively cause a lake to become ‘perched’, promo-
ting evapoconcentration and making the salinities too
high for macrophytes to tolerate (Burke & Knott,
1997). However, in seasonally drying systems, benthic
microbial communities are unable to persist for long
enough (at intermediate salinities) to facilitate either
of these types of mechanisms. Drying consolidates the
sediments (Bjornsson, Ostendorf & Recknagel, 2003)
and kills the microbial biomass that has been building
while sediments were wet (Qiu & McComb, 1996;
Baldwin & Mitchell, 2000).
The comparative ecological resilience of these two
regimes means that resilience of the macrophyte-
dominant regime must be reduced (perturbation is
required) to facilitate a shift towards benthic microbial
communities, but that the benthic microbial commu-
nity-dominant regime already has low resilience,
allowing shifts away to occur more easily. If benthic
microbial communities and macrophytes could be
called alternative regimes, it appears that that they are
not equally ‘stable’.
All three of the conceptual models we have
considered here assume that salinity is the primary
driver of ecological regime shifts in salinising wet-
lands. However, in the highly disturbed southwestern
Australian agricultural zone, salinity is unlikely to be
the only environmental variable with importance for
the initiation and persistence of regimes. Once a
wetland has become salinised, the sensitive fresh-
water biota are lost (Halse et al., 2003) leaving a
relatively tolerant biota, which are able to persist at
a range of salinities (Kay et al., 2001; Sim et al., in press
a,b). This means that other factors are likely to be
influential within the ‘intermediate’ ranges of salinity
that all these organisms can tolerate. However, we did
not find strong relationships between any of the
additional physicochemical variables we measured
(pH, water depth, turbidity and gilvin, Table 6) and
the formation or persistence of ecological regimes
(Table 6, Fig. 8). One important condition that we did
not measure was trophic status, however, we believe
that nutrients were unlikely to be highly influential in
determining the dominance of submerged macro-
phytes versus benthic microbial communities. Both of
these two regimes optimally require clear water
conditions and are likely to be outcompeted by a
phytoplankton-dominated regime under high nutri-
ent loadings. It is, however, clear from our data that
several aspects of hydrology other than water depth,
particularly water persistence and the timing of
drying, strongly interacted with salinity to influence
ecological dynamics. This suggests that any model
incorporating only a single driver is unlikely to be
appropriate when considering seasonally drying
saline wetlands.
Conclusions
The dynamics of regime change in Australian season-
ally drying salinising wetlands appear to be driven by
the combined effects of salinity and water regime on
species life histories and on the ability of different
groups to compete effectively with each other. Salinity
sets the boundaries within which a macrophyte
community can establish and persist (Sim et al.,
in press a), enabling microbes to hold dominance at
the very high salinities beyond this range (Bauld,
1981; Kushner, 1993). Within the salinity limits of
macrophyte tolerance, this group were powerful
competitors, able to germinate and establish under a
range of salinities, turbidities and water depths. In
addition, regular drying facilitated their ongoing
dominance. At all sites where water was present for
at least 4–5 months and which dried annually or
biennially, macrophytes became dominant, regardless
of the previous dominant regime.
A conceptual model representing regime changes in
salinising wetlands must incorporate the roles of both
salinity and water regime in ecosystem dynamics. As
1246 L.L. Sim et al.
such, the alternative regimes model does not appear
to be an appropriate model for seasonally drying
wetlands, since the regular occurrence of drying
appears to prevent the development of strong positive
feedback mechanisms which might maintain the
benthic microbial community-dominated regime. It
is possible that an alternative regimes model might be
valid for permanent saline ecosystems; in this case,
positive feedback mechanisms for benthic microbial
community dominance are likely to be much stronger,
allowing this regime to constitute a true alternative to
macrophyte dominance.
Acknowledgments
LLS was supported by a Postgraduate Research Schol-
arship from Land and Water Australia. The authors
wish to thank Wally Mills and family, and Todd Mills
and family for access to Lake Mears; Murray and Dana
Steddy for access to Meeking Lake; the Department of
Conservation and Land Management for permission to
sample at Lake Mount Brown, Lake Mears, Little White
Lake and Arthur River Flats; the City of Cockburn for
permission to sample at Lake Coogee; Duncan Suther-
land for helpful discussion of ideas, constructive
comments on the manuscript and assistance with field
work and harvesting; Suzi Wild, Christina Mykytiuk,
Megan McGuire and Marianne Worley for assistance
with field work. The manuscript was improved by
comments from two anonymous referees.
References
Baldwin D.S. & Mitchell A.M. (2000) The effects of drying
and re-flooding on the sediment and soil nutrient
dynamics of lowland river-floodplain systems: a
synthesis. Regulated Rivers: Research & Management,
16, 457–467.
Bales M., Moss B., Phillips G., Irvine K. & Stansfield J.
(1993) The changing ecosystem of a shallow, brackish
lake, Hickling Broad, Norfolk, U.K. II. Long-term
trends in water chemistry and ecology and their
implications for restoration of the lake. Freshwater
Biology, 29, 141–165.
Bauld J. (1981) Occurrence of benthic microbial mats in
saline lakes. Hydrobiologia, 81, 87–111.
Beklioglu M. & Moss B. (1996) Existence of a macro-
phyte-dominated clear water state over a very wide
range of nutrient concentrations in a small shallow
lake. Hydrobiologia, 337, 93–106.
Bjornsson K.T., Ostendorf B. & Recknagel F. (2003) Using
wetland nutrient modelling to estimate River Murray
and floodplain wetland water exchange. In: MODSIM
2003 International Congress on Modelling and Simulation,
Townsville, July 2003, Vol. 1 (Ed. D.A. Post), pp. 404–
409. Modelling and Simulation Society of Australia
and New Zealand, Canberra, Australia.
Blindow I., Hargeby A. & Andersson G. (2002) Seasonal
changes of mechanisms maintaining clear water in a
shallow lake with abundant Chara vegetation. Aquatic
Botany, 72, 315–334.
Brock M.A. (1982) Biology of the salinity tolerant genus
Ruppia L. in saline lakes in South Australia. II.
Population ecology and reproductive biology. Aquatic
Botany, 13, 249–268.
Brock M.A. & Lane J.A.K. (1983) The aquatic macrophyte
flora of saline wetlands in Western Australia in
relation to salinity and permanence. Hydrobiologia,
105, 63–76.
Brock M.A., Nielsen D.L., Shiel R.J., Green J.D. & Langley
J.D. (2003) Drought and aquatic community resilience:
the role of eggs and seeds in sediments of temporary
wetlands. Freshwater Biology, 48, 1207–1218.
Burke C.M. & Knott B. (1997) Homeostatic interactions
between the benthic microbial communities and the
waters of a hypersaline lake, Lake Hayward, Western
Australia. Marine and Freshwater Research, 48, 623–631.
Clarke K.R. & Gorley R.N. (2001) Primer v5: User Manual/
Tutorial. PRIMER-E Ltd, Plymouth, UK.
Clarke K.R. & Warwick R.M. (2001) Change in Marine
Communities: An Approach to Statistical Analysis and
Interpretation. PRIMER-E, Plymouth, UK.
Clesceri L.S., Greenberg A.E. & Eaton A.D. (1999)
Standard Methods for the Examination of Water and
Wastewater. American Public Health Association,
Washington DC, USA.
Davis J., McGuire M., Halse S., Hamilton D., Horwitz P.,
McComb A., Froend R., Lyons M. & Sim L. (2003)
What happens when you add salt: predicting impacts
of secondary salinisation on shallow aquatic ecosys-
tems using an alternative states model. Australian
Journal of Botany, 51, 715–724.
Garcıa A. & Chivas A.R. (2004) Quaternary and extant
euryhaline Lamprothamnium Groves (Charales) from
Australia: gyrogonite morphology and paleolimnolo-
gical significance. Journal of Paleolimnology, 31, 321–341.
Halse S.A., Ruprecht J.K. & Pinder A.M. (2003) Salinisa-
tion and prospects for biodiversity in rivers and
wetlands of south-west Western Australia. Australian
Journal of Botany, 51, 673–688.
Jeppesen E., Søndergaard M., Jensen J.P., Kanstrup E. &
Petersen B. (1998) 28. Macrophytes and turbidity in
brackish lakes with special emphasis on the role of
Alternative regimes in salinised wetlands 1247

top-down control. In: The Structuring Role of Submerged
Macrophytes in Lakes (Eds J.E.M. Søndergaard, M.
Søndergaard & K. Christoffersen), pp. 369–377. Sprin-
ger-Verlag, New York.
Jeppesen E., Søndergaard M., Kanstrup E., Petersen B.,
Eriksen R.B., Hammershøj M., Mortensen E., Jensen
J.P. & Have A. (1994) Does the impact of nutrients
on the biological structure and function of brackish
and freshwater lakes differ? Hydrobiologia, 275/276,
15–30.
Kay W., Halse S.A., Scanlon M.D. & Smith M.J. (2001)
Distribution and environmental tolerances of aquatic
macroinvertebrate families in the agricultural zone of
southwestern Australia. Journal of the North American
Benthological Society, 20, 182–199.
Kirk J.T.O. (1994) Light and Photosynthesis in Aquatic
Ecosystems. Cambridge University Press, Cambridge,
UK.
Kushner D.J. (1993) Microbial life in extreme environ-
ments. In: Aquatic Microbiology. An Ecological Approach
(Ed. T.E. Ford), pp. 383–407. Blackwell Scientific
Publications, Boston, MA.
Moss B. (1994) Brackish and freshwater shallow lakes –
different systems or variations on the same theme?
Hydrobiologia, 276, 1–14.
Peterson G., Allen C.R. & Holling C.S. (1998) Ecological
resilience, biodiversity and scale. Ecosystems, 1,
6–18.
Qiu S. & McComb A.J. (1996) Drying-induced stimula-
tion of ammonium release and nitrification in
reflooded lake sediment. Marine & Freshwater Research,
47, 531–536.
Scheffer M. & Carpenter S.R. (2003) Catastrophic regime
shifts in ecosystems: linking theory to observation.
Trends in Ecology & Evolution, 18, 648–656.
Scheffer M., Carpenter S., Foley J.A., Folke C. & Walker
B. (2001) Catastrophic shifts in ecosystems. Nature, 413,
591–596.
Schroder A., Persson L. & De Roos A.M. (2005) Direct
experimental evidence for alternative stable states: a
review. Oikos, 110, 3–19.
Sim L.L., Chambers J.M. & Davis J.A. (in press a)
Ecological regime shifts in salinised wetland systems.
I. Salinity thresholds for the loss of submerged macro-
phytes. Hydrobiologia.
Sim L., Davis J.A. & Chambers J.M. (2006) When is it too
salty for saline wetlands? Conceptual models for the
examination of ecological regime shifts in saline
wetlands. Verhandlungen Internationale Vereinigung fur
theoretische und angewandte Limnologie, 29(3), 1679–1682.
Sim L.L., Davis J.A. & Chambers J.M. (in press b)
Ecological regime shifts in salinised wetland systems.
II. Factors affecting the dominance of benthic microbial
communities. Hydrobiologia.
Strehlow K., Davis J., Sim L., Chambers J., Halse S.,
Hamilton D., Horwitz P., McComb A. & Froend R.
(2005) Temporal changes between ecological regimes
in a range of primary and secondary salinised wet-
lands. Hydrobiologia, 552, 17–31.
Suding K.N., Gross K.L. & Houseman G.R. (2004)
Alternative states and positive feedbacks in restoration
ecology. Trends in Ecology & Evolution, 19, 46–53.
(Manuscript accepted 23 February 2006)
1248 L.L. Sim et al.
Related Documents