EV RANGE PREFERENCES 1 Citation: Franke, T., & Krems, J.F. (2013). What drives range preferences in electric vehicle users? Transport Policy, 30, 56- 62. http://dx.doi.org/10.1016/j.tranpol.2013.07.005 What drives range preferences in electric vehicle users? Thomas Franke & Josef F. Krems Technische Universität Chemnitz, Germany Published in Transport Policy Volume 30 , November 2013, Pages 56–62 http://www.journals.elsevier.com/transport-policy/ http://dx.doi.org/10.1016/j.tranpol.2013.07.005 ABSTRACT While research has shown that limited-range electric vehicles (EVs) satisfy the range needs of a sizeable share of the driving population, car buyers seem to prefer vehicles with high available range. The objective of the present research was to advance understanding of the factors that influence the range preferences of potential EV customers who had the opportunity to test an EV. Data from 79 participants who had driven an EV for 3 months was assessed in a field study setting. Range preferences of those users were found to be substantially higher than their average range needs. Regression analyses indicated that higher average range needs, higher range of the driver’s familiar combustion vehicle (CV), and greater experienced range anxiety were related to higher range preferences. Furthermore, we found that range preferences decreased over the first 3 months of EV use. Finally, indicators of average range needs were more strongly associated with range preferences as EV experience increased. Thus, only customers with EV experience seem to rely on accurate estimates of their range needs when constructing their range preferences. Implications for strategies aimed at enhancing customer appraisal of limited range mobility and determining optimal EV range are discussed. Keywords: range, electric vehicle, preferences, mobility needs, sustainability, field study Address for correspondence: Chemnitz University of Technology, Department of Psychology, D-09107 Chemnitz, Germany. Email: [email protected]. NOTICE: This is the author’s version of a work accepted for publication by Elsevier (AAM). Changes resulting from the publishing process, including peer review, editing, corrections, structural formatting and other quality control mechanisms, may not be re flected i n this document. Changes may have been made to this work since it was submitted for publication. The final version is available at www.sciencedirect.com (Journal: Transport Policy).

Welcome message from author
This document is posted to help you gain knowledge. Please leave a comment to let me know what you think about it! Share it to your friends and learn new things together.
Transcript
EV RANGE PREFERENCES 1
Citation: Franke, T., & Krems, J.F. (2013). What drives range preferences in electric vehicle users? Transport Policy, 30, 56-62. http://dx.doi.org/10.1016/j.tranpol.2013.07.005
What drives range preferences in electric vehicle users?
Thomas Franke & Josef F. Krems Technische Universität Chemnitz, Germany
Published in Transport Policy Volume 30, November 2013, Pages 56–62
http://www.journals.elsevier.com/transport-policy/ http://dx.doi.org/10.1016/j.tranpol.2013.07.005
ABSTRACT
While research has shown that limited-range electric vehicles (EVs) satisfy the range needs of
a sizeable share of the driving population, car buyers seem to prefer vehicles with high available
range. The objective of the present research was to advance understanding of the factors that
influence the range preferences of potential EV customers who had the opportunity to test an EV.
Data from 79 participants who had driven an EV for 3 months was assessed in a field study setting.
Range preferences of those users were found to be substantially higher than their average range
needs. Regression analyses indicated that higher average range needs, higher range of the driver’s
familiar combustion vehicle (CV), and greater experienced range anxiety were related to higher range
preferences. Furthermore, we found that range preferences decreased over the first 3 months of EV
use. Finally, indicators of average range needs were more strongly associated with range preferences
as EV experience increased. Thus, only customers with EV experience seem to rely on accurate
estimates of their range needs when constructing their range preferences. Implications for strategies
aimed at enhancing customer appraisal of limited range mobility and determining optimal EV range
are discussed.
Keywords: range, electric vehicle, preferences, mobility needs, sustainability, field study Address for correspondence: Chemnitz University of Technology, Department of Psychology, D-09107 Chemnitz, Germany. Email: [email protected].
NOTICE: This is the author’s version of a work accepted for publication by Elsevier (AAM). Changes resulting from the publishing process, including peer review, editing, corrections, structural formatting and other quality control mechanisms, may not be re flected in this document. Changes may have been made to this work since it was submitted for publication. The final version is available at www.sciencedirect.com (Journal: Transport Policy).
EV RANGE PREFERENCES 2
Citation: Franke, T., & Krems, J.F. (2013). What drives range preferences in electric vehicle users? Transport Policy, 30, 56-62. http://dx.doi.org/10.1016/j.tranpol.2013.07.005
1 INTRODUCTION
What is the optimal range of an electric vehicle (EV)? This question is consistently raised in
conjunction with efforts to develop sustainable and marketable EVs, and has yielded substantially
disparate answers: Evidence suggests that range needs of a sizeable share of the current car fleet
could be covered with 100-mile range per charge (Pearre et al., 2011). However, potential customers
have repeatedly been found to prefer vehicles with considerably higher available range
(Dimitropoulos et al., 2011).
This paradoxical disparity has been noted frequently in the literature (e.g., Giffi et al., 2011;
Kurani et al., 1994) and various explanations for high range preferences have been suggested, such
as inaccurate conceptions of usual mobility needs (Kurani et al., 1994), high anchors for estimating
required range stemming from experience with combustion vehicles (CVs; Kurani et al., 1994), range
anxiety (Nilsson, 2011), and lack of experience with limited range mobility (Kurani et al., 1994).
However, research that examines these assumptions is lacking. Moreover, it has been argued that
examining the range preferences of respondents without EV experience, as most previous studies
did, may not be a useful approach for determining truly marketable EV range in more mature
markets. Accordingly, researchers have recommended that studies of range preferences should
include samples of drivers with EV experience (Kurani et al., 1994).
The objective of the present research was to increase understanding of range preferences of
potential EV customers with practical EV experience and of the factors driving those preferences. To
this end, a field trial approach was applied in which 79 EV users drove an EV for 3 months and
provided extensive objective and subjective data. We studied the disparity between range needs and
range preferences and examined potential explanatory variables for range preferences. This research
aims to provide data needed to guide the development of measures for reducing the gap between
range needs and range preferences, and to support customers in selecting more sustainable EV
setups.
EV RANGE PREFERENCES 3
Citation: Franke, T., & Krems, J.F. (2013). What drives range preferences in electric vehicle users? Transport Policy, 30, 56-62. http://dx.doi.org/10.1016/j.tranpol.2013.07.005
2 BACKGROUND
2.1 The EV range paradox
The battery of a fully electric vehicle is a precious resource. Its efficient layout is critical for
environmental utility, as it uses a sizeable amount of energy and rare mineral resources for
production and, consequently, has a substantial impact on the ecological footprint of an EV
(McManus, 2012). Moreover, more battery capacity results in a higher purchase price and, thus,
lower affordability and cost-effectiveness (Neubauer et al., 2012). Hence, from a sustainability
perspective, the optimal EV range is the smallest sufficient range.
Determining sufficient EV range has been the focus of numerous studies examining data on
travel behavior. For example, findings based on representative data of everyday automobile usage in
Germany show that on a typical day, 95% of cars on the road travel less than 100 km (Öko-Institut,
2011). Similar figures have been reported for other European countries (Bunzeck et al., 2011).
However, this criterion has been criticized for underestimating range needs, because a vehicle that
can cover an average, or typical, day will not satisfy user needs on many days (Greene, 1985).
Consequently, other indicators have been studied, for instance, the longest daily travel distance per
year (Greene, 1985; Pearre et al., 2011), per week (Chlond et al., 2012) or on a certain energy critical
day (Sammer et al., 2011). Still, these studies show that the currently common 100-mile range of EVs
is sufficient for a sizeable share of the car driving population (see overview in Table 1).
EV RANGE PREFERENCES 4
Citation: Franke, T., & Krems, J.F. (2013). What drives range preferences in electric vehicle users? Transport Policy, 30, 56-62. http://dx.doi.org/10.1016/j.tranpol.2013.07.005
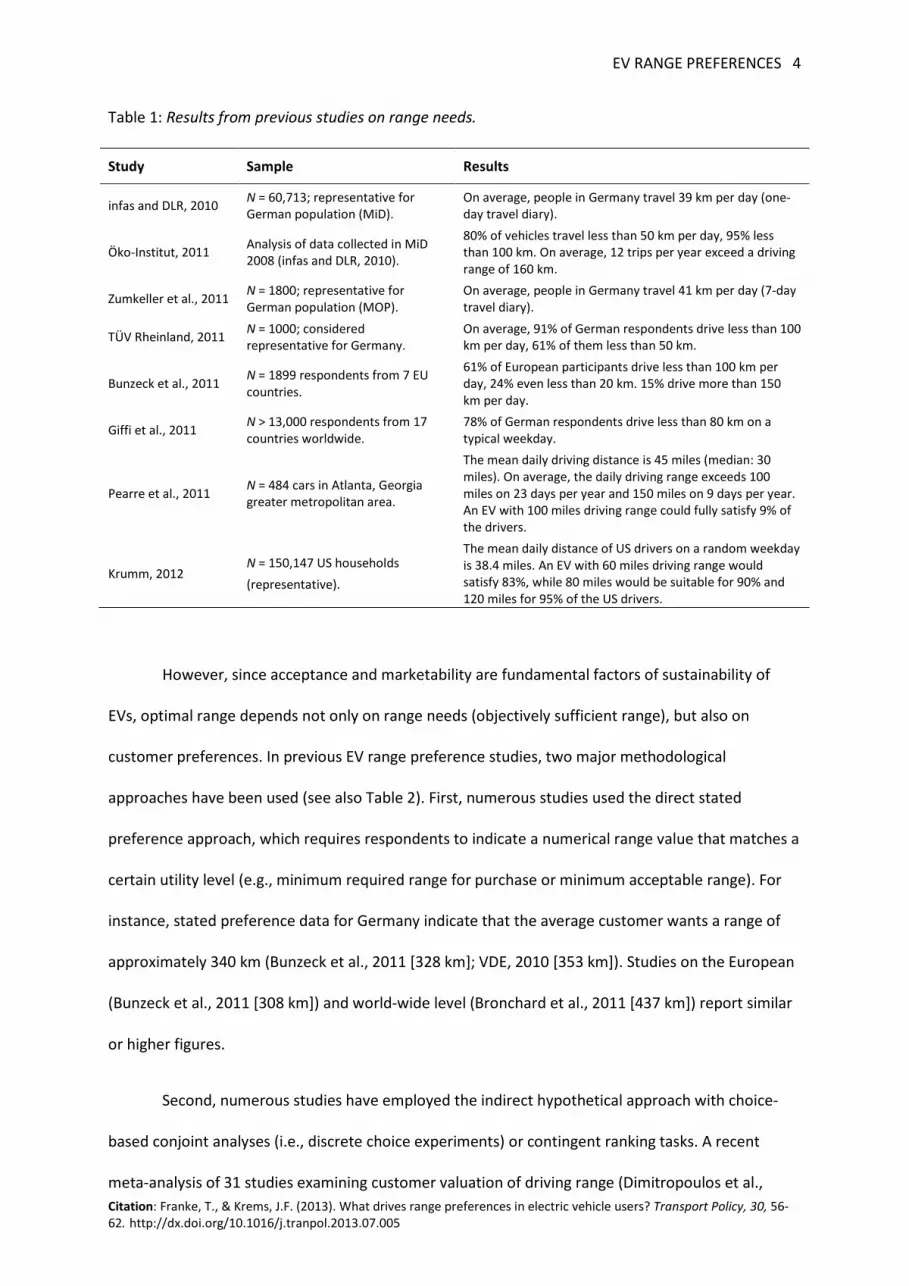
Table 1: Results from previous studies on range needs.
Study Sample Results
infas and DLR, 2010 N = 60,713; representative for German population (MiD).
On average, people in Germany travel 39 km per day (one-day travel diary).
Öko-Institut, 2011 Analysis of data collected in MiD 2008 (infas and DLR, 2010).
80% of vehicles travel less than 50 km per day, 95% less than 100 km. On average, 12 trips per year exceed a driving range of 160 km.
Zumkeller et al., 2011 N = 1800; representative for German population (MOP).
On average, people in Germany travel 41 km per day (7-day travel diary).
TÜV Rheinland, 2011 N = 1000; considered representative for Germany.
On average, 91% of German respondents drive less than 100 km per day, 61% of them less than 50 km.
Bunzeck et al., 2011 N = 1899 respondents from 7 EU countries.
61% of European participants drive less than 100 km per day, 24% even less than 20 km. 15% drive more than 150 km per day.
Giffi et al., 2011 N > 13,000 respondents from 17 countries worldwide.
78% of German respondents drive less than 80 km on a typical weekday.
Pearre et al., 2011 N = 484 cars in Atlanta, Georgia greater metropolitan area.
The mean daily driving distance is 45 miles (median: 30 miles). On average, the daily driving range exceeds 100 miles on 23 days per year and 150 miles on 9 days per year. An EV with 100 miles driving range could fully satisfy 9% of the drivers.
Krumm, 2012 N = 150,147 US households (representative).
The mean daily distance of US drivers on a random weekday is 38.4 miles. An EV with 60 miles driving range would satisfy 83%, while 80 miles would be suitable for 90% and 120 miles for 95% of the US drivers.
However, since acceptance and marketability are fundamental factors of sustainability of
EVs, optimal range depends not only on range needs (objectively sufficient range), but also on
customer preferences. In previous EV range preference studies, two major methodological
approaches have been used (see also Table 2). First, numerous studies used the direct stated
preference approach, which requires respondents to indicate a numerical range value that matches a
certain utility level (e.g., minimum required range for purchase or minimum acceptable range). For
instance, stated preference data for Germany indicate that the average customer wants a range of
approximately 340 km (Bunzeck et al., 2011 [328 km]; VDE, 2010 [353 km]). Studies on the European
(Bunzeck et al., 2011 [308 km]) and world-wide level (Bronchard et al., 2011 [437 km]) report similar
or higher figures.
Second, numerous studies have employed the indirect hypothetical approach with choice-
based conjoint analyses (i.e., discrete choice experiments) or contingent ranking tasks. A recent
meta-analysis of 31 studies examining customer valuation of driving range (Dimitropoulos et al.,
EV RANGE PREFERENCES 5
Citation: Franke, T., & Krems, J.F. (2013). What drives range preferences in electric vehicle users? Transport Policy, 30, 56-62. http://dx.doi.org/10.1016/j.tranpol.2013.07.005
2011) reveals that the compensating variation for increasing range from 100 to 350 miles would be
16,200 US$. The authors conclude that EVs with a 100-mile range would have to be priced 50%
cheaper than comparable CVs to be competitive. A similar pattern of results is revealed by Daziano’s
(2013) analysis of choice experiment data. Using the function of range equivalency (i.e., the range at
which an EV is perceived to be as attractive as a benchmark vehicle), the author concludes that an EV
would only be perceived as equivalent to a conventional gasoline vehicle if its driving range were 330
miles, when cheaper EV operating costs are not considered. If operating costs are factored into the
analysis, this estimate would drop to 180 miles (assuming the same purchase price for an EV and a
gasoline vehicle).
All in all, these results reveal a substantial discrepancy between range preferences and
sufficient range. We refer to this as the “range paradox” in EVs. However, will this discrepancy also
hold for future markets that consist of more potential customers who already have experience with
limited range mobility? And which factors may influence range preferences in such contexts?
Answering these questions may help to yield better estimates of marketable range and aid in the
development of strategies to further reduce the range discrepancy.
EV RANGE PREFERENCES 6
Citation: Franke, T., & Krems, J.F. (2013). What drives range preferences in electric vehicle users? Transport Policy, 30, 56-62. http://dx.doi.org/10.1016/j.tranpol.2013.07.005
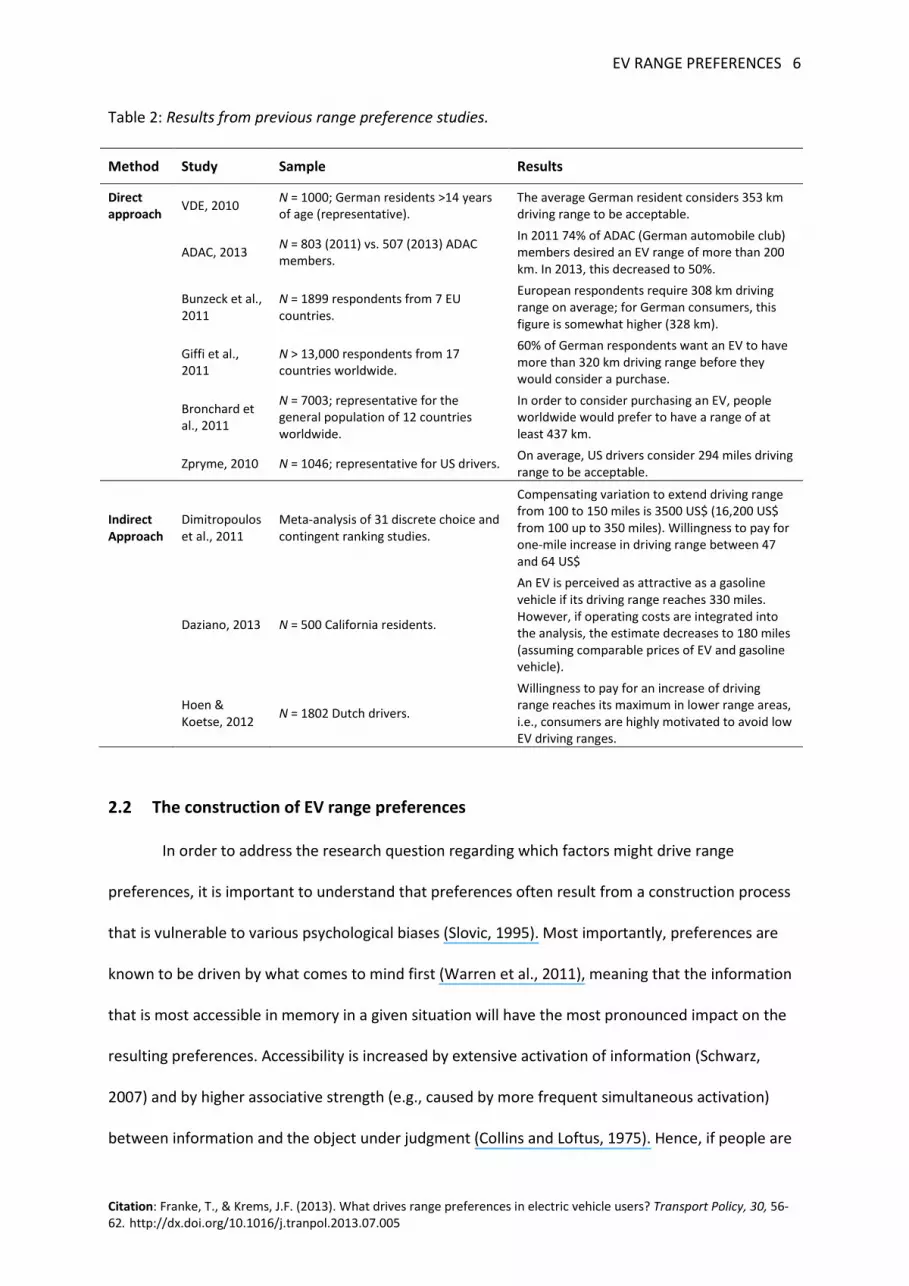
Table 2: Results from previous range preference studies.
Method Study Sample Results
Direct approach VDE, 2010 N = 1000; German residents >14 years
of age (representative). The average German resident considers 353 km driving range to be acceptable.
ADAC, 2013 N = 803 (2011) vs. 507 (2013) ADAC members.
In 2011 74% of ADAC (German automobile club) members desired an EV range of more than 200 km. In 2013, this decreased to 50%.
Bunzeck et al., 2011
N = 1899 respondents from 7 EU countries.
European respondents require 308 km driving range on average; for German consumers, this figure is somewhat higher (328 km).
Giffi et al., 2011
N > 13,000 respondents from 17 countries worldwide.
60% of German respondents want an EV to have more than 320 km driving range before they would consider a purchase.
Bronchard et al., 2011
N = 7003; representative for the general population of 12 countries worldwide.
In order to consider purchasing an EV, people worldwide would prefer to have a range of at least 437 km.
Zpryme, 2010 N = 1046; representative for US drivers. On average, US drivers consider 294 miles driving range to be acceptable.
Indirect Approach
Dimitropoulos et al., 2011
Meta-analysis of 31 discrete choice and contingent ranking studies.
Compensating variation to extend driving range from 100 to 150 miles is 3500 US$ (16,200 US$ from 100 up to 350 miles). Willingness to pay for one-mile increase in driving range between 47 and 64 US$
Daziano, 2013 N = 500 California residents.
An EV is perceived as attractive as a gasoline vehicle if its driving range reaches 330 miles. However, if operating costs are integrated into the analysis, the estimate decreases to 180 miles (assuming comparable prices of EV and gasoline vehicle).
Hoen & Koetse, 2012 N = 1802 Dutch drivers.
Willingness to pay for an increase of driving range reaches its maximum in lower range areas, i.e., consumers are highly motivated to avoid low EV driving ranges.
2.2 The construction of EV range preferences
In order to address the research question regarding which factors might drive range
preferences, it is important to understand that preferences often result from a construction process
that is vulnerable to various psychological biases (Slovic, 1995). Most importantly, preferences are
known to be driven by what comes to mind first (Warren et al., 2011), meaning that the information
that is most accessible in memory in a given situation will have the most pronounced impact on the
resulting preferences. Accessibility is increased by extensive activation of information (Schwarz,
2007) and by higher associative strength (e.g., caused by more frequent simultaneous activation)
between information and the object under judgment (Collins and Loftus, 1975). Hence, if people are
EV RANGE PREFERENCES 7
Citation: Franke, T., & Krems, J.F. (2013). What drives range preferences in electric vehicle users? Transport Policy, 30, 56-62. http://dx.doi.org/10.1016/j.tranpol.2013.07.005
very frequently exposed to certain numerical values in connection with driving range, it is likely that
those values also drive their range preferences (i.e., act as reference points).
Second, this information more strongly influences a preference that is perceived to be more
plausible, relevant, or diagnostic (Warren et al., 2011). Hence, if people have two equally accessible
information sources when constructing their range preferences, they will likely more strongly rely on
the more diagnostic one (e.g., the more precise indicator of their mobility needs).
Third, affective associations will influence all of these processes. For example, the experience
of negative affect (e.g., fear) in conjunction with the object under judgment will lead to more risk-
averse preferences (Peters, 2006; Weber and Johnson, 2009). All in all, we expect that these general
dynamics in preference formation will also play a role in range preference construction.
2.3 Hypotheses regarding factors that drive range preferences of EV users
(H1) Research has revealed a discrepancy between range preferences and usual range needs
in people without EV experience (see section 2.1), indicating that people might desire certain range
safety buffers. Similar safety buffers have also been identified in range utilization behavior of
experienced EV users (Franke et al., 2012c; Franke and Krems, 2013). Consequently, we also expect
range preferences of experienced EV users to be higher than their usual range needs.
(H2) It has been argued that people typically do not hold highly accessible, accurate
representations of their usual range needs, as they do not deal with daily distance budgets in using
CVs (Kurani et al., 1994). However, when users deal with limited-range electric mobility, they have to
manage daily distance budgets and develop heuristics to plan their journeys (Franke et al., 2012c).
This should lead to more accessible, precise representations of usual range needs. Hence, it seems
likely that experienced EV users use relatively precise estimates of their usual range needs to
construct range preferences. Consequently, we expect a positive relationship between usual range
needs and range preference in EV users.
EV RANGE PREFERENCES 8
Citation: Franke, T., & Krems, J.F. (2013). What drives range preferences in electric vehicle users? Transport Policy, 30, 56-62. http://dx.doi.org/10.1016/j.tranpol.2013.07.005
(H3) It has repeatedly been argued that people are so adapted to high-range, single-mode
CVs that they likely base their judgments of acceptable vehicle range on these highly accessible
familiar values (Giffi et al, 2010; Kurani et al., 1994). Indeed, the status quo is known to be a powerful
reference point in preference construction (Samuelson and Zeckhauser, 1988). Consequently, we
expect a positive relationship between familiar CV range, hereafter referred to as CV performant
range (cf. Franke and Krems, 2013), and range preferences.
(H4) Range anxiety has repeatedly been proposed as a factor that promotes high range
preferences (Nilsson, 2011). Given the research demonstrating the impact of negative affect on
judgment (see section 2.2.), it seems reasonable that experienced range anxiety may be associated
with higher range preferences. Consequently, we expect a positive relationship between experienced
range anxiety and range preferences of EV users.
(H5) When considering (H2) from a longitudinal perspective, it can be expected that as EV
experience increases, precise representations of usual range needs will be more strongly
incorporated into range preference construction. Consequently, we expect that as experience
increases, the relationship between range needs and range preferences will strengthen.
(H6) Taken together, these hypotheses suggest that experienced EV users should prefer
lower range setups than inexperienced users. This is also supported by the finding that the need for
safety buffers decrease with EV experience (Franke et al., 2012b). Consequently, we expect that
users’ range preferences at post-test (i.e., after driving the EV for some time) will be lower than at
pre-test (i.e., before receiving the EV).
EV RANGE PREFERENCES 9
Citation: Franke, T., & Krems, J.F. (2013). What drives range preferences in electric vehicle users? Transport Policy, 30, 56-62. http://dx.doi.org/10.1016/j.tranpol.2013.07.005
3 METHOD
3.1 Field trial setup
The present research was part of a large-scale EV field trial in the metropolitan area of Berlin,
Germany. This trial was set up by the BMW Group and Vattenfall Europe, and funded by the German
Federal Ministry for the Environment, Nature Conservation and Nuclear Safety. It was part of an
international EV field trial (Vilimek et al., 2012). The EV was a converted MINI Cooper with 168 km
range under normal driving conditions (miniusa.com, 2012). Users had access to public and private
charging stations. Two consecutive 6-month user studies (S1 and S2) included 40 participants each.
Data were collected prior to receiving the EV (T0), after 3 months (T1), and after 6 months (T2). Data
for the present study came only from T0 and T1, 79 users completed T0 and T1. Further details on
methodology are reported elsewhere (Cocron et al., 2011; Franke et al., 2012a).
3.2 Participants
Eighty participants were selected from more than 1000 applicants recruited via an online
screening instrument that was announced in both print and online media. Requirements for
participation were residence in the Berlin metropolitan area, willingness to pay a monthly leasing
rate of 400 Euros, and to install a private charging station. Additional criteria aimed to increase
variance in basic socio-demographic (e.g., age, gender, education) and mobility-related variables
(e.g., mileage, vehicle fleet). Despite these efforts, our sample was still restricted in variance on
certain basic socio- demographic characteristics compared to the general population of automobile
drivers in Germany (i.e., the average German car driver). The sample can rather be assumed to
represent early adopters of EVs in German metropolitan areas.
The 79 users in the sample who completed T1 had a mean age of 49 years. Eighty-five
percent were male, 76% had obtained at least a university of applied science entrance qualification
(nearly all of these had a university degree), 10% reported a monthly net household income below
3.000 Euro, and the average household size was 2.9 persons (47% of households had <3 persons). To
EV RANGE PREFERENCES 10
Citation: Franke, T., & Krems, J.F. (2013). What drives range preferences in electric vehicle users? Transport Policy, 30, 56-62. http://dx.doi.org/10.1016/j.tranpol.2013.07.005
better understand the differences between this sample and the population of German car drivers, we
analyzed data from the representative large-scale survey “Mobility in Germany 2008” (Mobilität in
Deutschland, MiD; infas and DLR, 2010). We included only those persons who had access to a car at
any time (72 % of the persons living in Germany) and were at least 17 years old. These had a mean
age of 42 years, 51% were male, 40% had at least a university of applied science entrance
qualification, 65% had a monthly net household income below 3.000 Euro, and the average
household size was 2.4 persons (64% of households had <3 persons). Hence, our sample is older,
more affluent, more educated, and includes more male persons than the general population of
German car drivers. In terms of average-day travel distances in a typical week our sample had even
higher values (M7D = 58.76 km, only N = 66, see section 3.3.2) than the German average of 40.6 km
(Zumkeller et al., 2011).
3.3 Measures
3.3.1 Range preferences Two open-ended, stated preference items asked users to directly indicate their preferred
range value underlying two different levels of the utility function. For contexts where incentive-
aligned methods are not applicable, it has been shown that single-item, open-ended question
formats can be as valid as choice-based conjoint analyses (Miller et al., 2011). Items were framed to
the real available range of the test EV. The item text was: (1) “Which EV range would you consider to
be quite short, but just acceptable?” (termed “minimum acceptable range”, conceptually similar to a
reservation price), and (2) “Which EV range would you consider to be just right and, therefore,
appropriate?” (termed “appropriate range”). Both items were administered at T1. In S2, minimum
acceptable range was also assessed at T0. This and all following variables were checked for univariate
outliers in accordance with Grubbs (1969). One case was an outlier on both T1 variables (z > 4.96),
hence N = 78, and one case was an outlier on T0 minimum acceptable range in S2 (z = 3.49), hence N
= 39. The Kolmogorov-Smirnov (KS) test was used to test for violations of normality for all score
EV RANGE PREFERENCES 11
Citation: Franke, T., & Krems, J.F. (2013). What drives range preferences in electric vehicle users? Transport Policy, 30, 56-62. http://dx.doi.org/10.1016/j.tranpol.2013.07.005
variables. As one would expect for range preferences (Dimitropoulos et al., 2011), log transformation
was needed for the data to fit a normal distribution.
3.3.2 Range needs Data on range needs were derived from the T0 travel diary, which was a person-based 1-
week record of all trips, including all modes of transport. Based on previously proposed range need
indicators (see section 2.1), we computed the mean (M7D) and maximum (Max7D) daily travel
distances for the 7-day week (7D), N = 66 because of 11 cases with missing data and 2 outlier cases (z
> 3.29). We also asked users to mark a typical day (TD) and computed the total distance traveled on
that day (SumTD), N = 56, as only 57 users marked their TD and there was one outlier (z > 6.38). Log
transformation was needed to fit a normal distribution.
3.3.3 Performant range Users’ CV performant range was assessed at T0 only in S2 with one item (N = 40): “How far
does one full tank usually last (based on annual average) before the tank is completely emptied in
your most used car (km)?”
3.3.4 Range anxiety Range anxiety was assessed with two items at T1 (N = 79): (1) “I am more concerned about
the range in the EV than I would be in a conventional vehicle with an internal combustion engine.”
(2) “While driving, I was often worried about the range.” Cronbach’s Alpha was .62.
EV RANGE PREFERENCES 12
Citation: Franke, T., & Krems, J.F. (2013). What drives range preferences in electric vehicle users? Transport Policy, 30, 56-62. http://dx.doi.org/10.1016/j.tranpol.2013.07.005
4 RESULTS
We analyzed our data using t-tests and regression analyses. Assumptions for t-tests were
satisfactorily met. Assumptions for regression analyses (Stade et al., 2011) were satisfactorily met,
except for some non-normal distributions, that were resolved with log-transformation, and some
single outlier cases, residual z-value > |1.96|. Urban and Mayerl (2008) recommended presenting
results with and without these outliers. To aid readability, results without outliers are presented only
if their significance or effect size magnitude differed considerably from results with outliers. To test
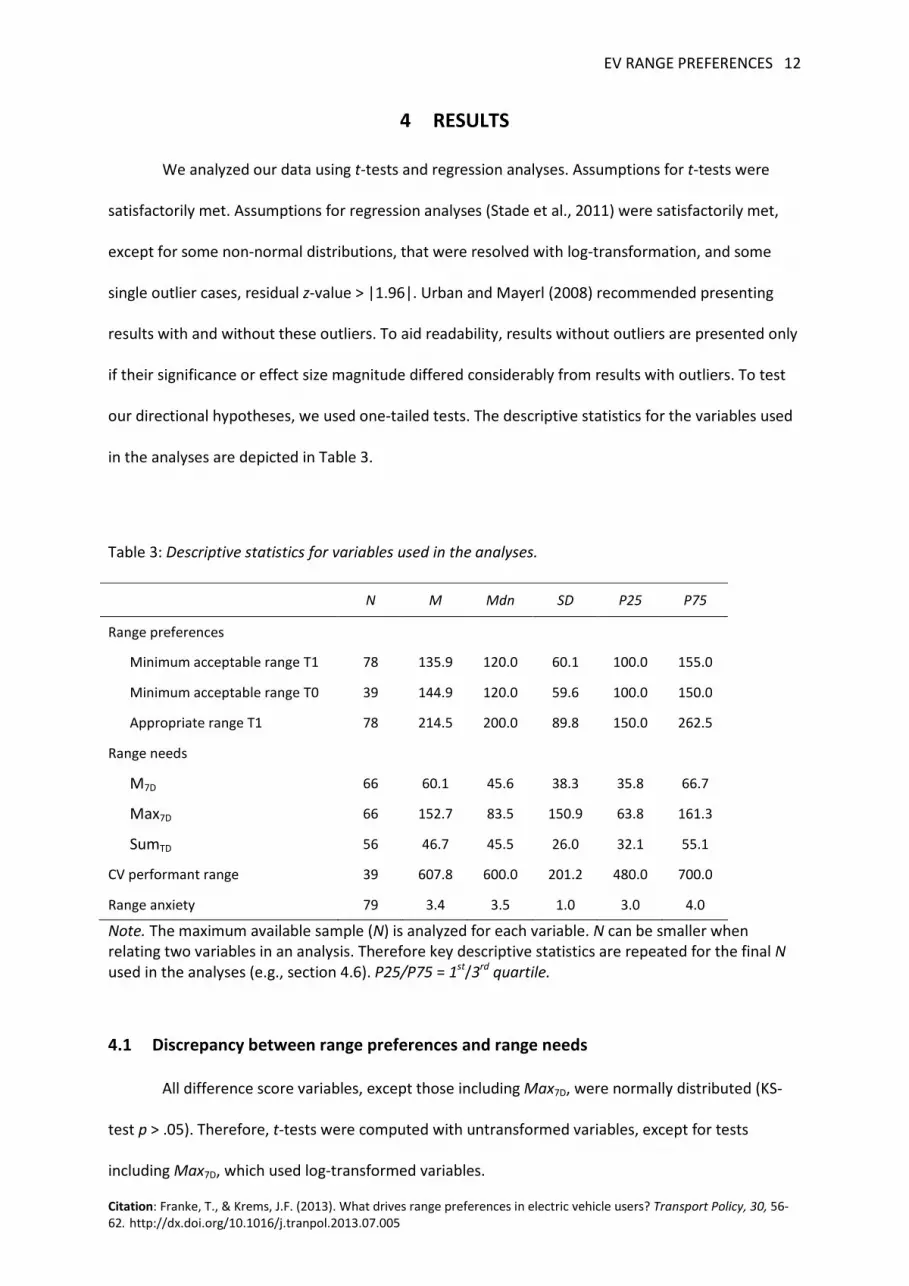
our directional hypotheses, we used one-tailed tests. The descriptive statistics for the variables used
in the analyses are depicted in Table 3.
Table 3: Descriptive statistics for variables used in the analyses.
N M Mdn SD P25 P75
Range preferences
Minimum acceptable range T1 78 135.9 120.0 60.1 100.0 155.0
Minimum acceptable range T0 39 144.9 120.0 59.6 100.0 150.0
Appropriate range T1 78 214.5 200.0 89.8 150.0 262.5
Range needs
M7D 66 60.1 45.6 38.3 35.8 66.7
Max7D 66 152.7 83.5 150.9 63.8 161.3
SumTD 56 46.7 45.5 26.0 32.1 55.1
CV performant range 39 607.8 600.0 201.2 480.0 700.0
Range anxiety 79 3.4 3.5 1.0 3.0 4.0
Note. The maximum available sample (N) is analyzed for each variable. N can be smaller when relating two variables in an analysis. Therefore key descriptive statistics are repeated for the final N used in the analyses (e.g., section 4.6). P25/P75 = 1st/3rd quartile.
4.1 Discrepancy between range preferences and range needs
All difference score variables, except those including Max7D, were normally distributed (KS-
test p > .05). Therefore, t-tests were computed with untransformed variables, except for tests
including Max7D, which used log-transformed variables.
EV RANGE PREFERENCES 13
Citation: Franke, T., & Krems, J.F. (2013). What drives range preferences in electric vehicle users? Transport Policy, 30, 56-62. http://dx.doi.org/10.1016/j.tranpol.2013.07.005
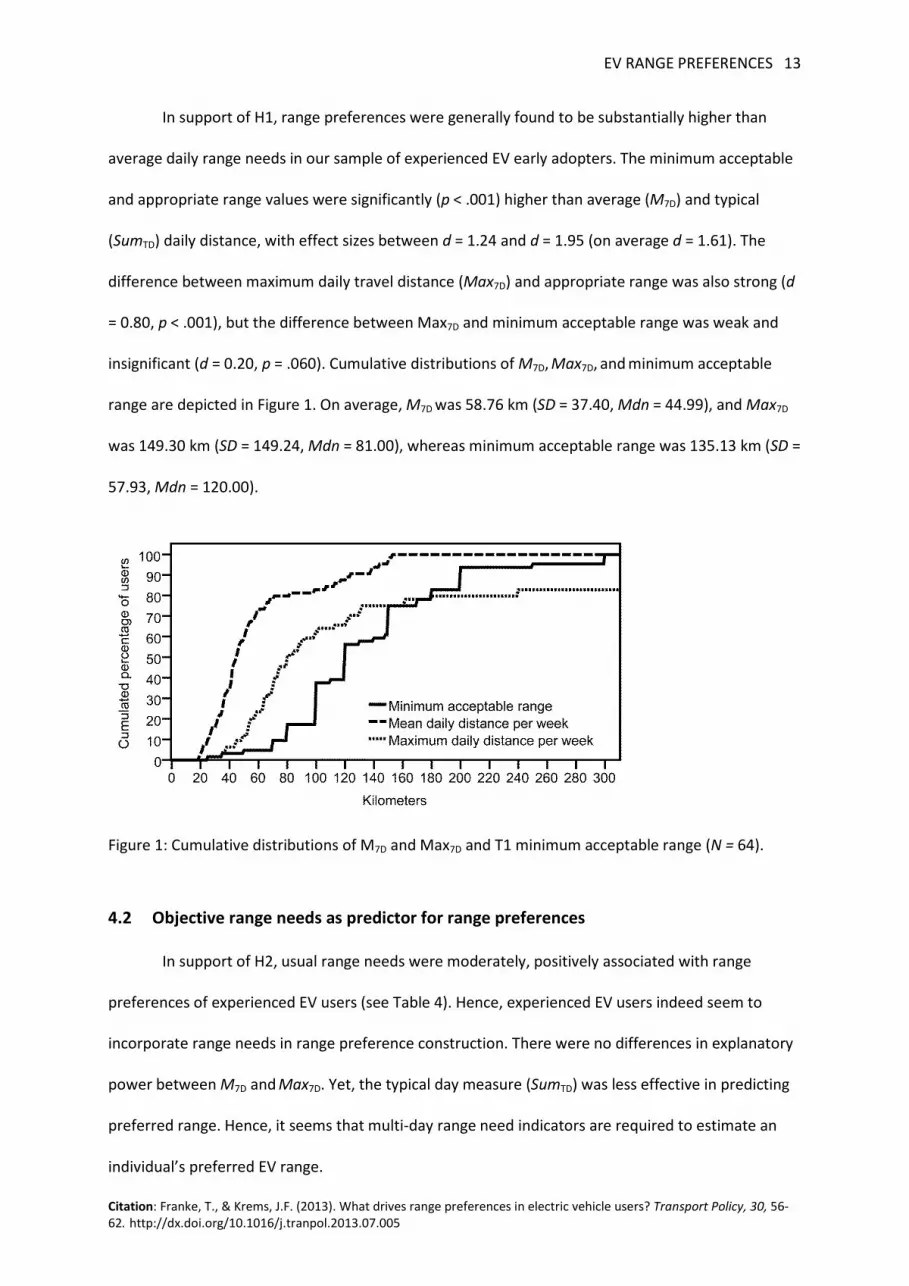
In support of H1, range preferences were generally found to be substantially higher than
average daily range needs in our sample of experienced EV early adopters. The minimum acceptable
and appropriate range values were significantly (p < .001) higher than average (M7D) and typical
(SumTD) daily distance, with effect sizes between d = 1.24 and d = 1.95 (on average d = 1.61). The
difference between maximum daily travel distance (Max7D) and appropriate range was also strong (d
= 0.80, p < .001), but the difference between Max7D and minimum acceptable range was weak and
insignificant (d = 0.20, p = .060). Cumulative distributions of M7D, Max7D, and minimum acceptable
range are depicted in Figure 1. On average, M7D was 58.76 km (SD = 37.40, Mdn = 44.99), and Max7D
was 149.30 km (SD = 149.24, Mdn = 81.00), whereas minimum acceptable range was 135.13 km (SD =
57.93, Mdn = 120.00).
Figure 1: Cumulative distributions of M7D and Max7D and T1 minimum acceptable range (N = 64).
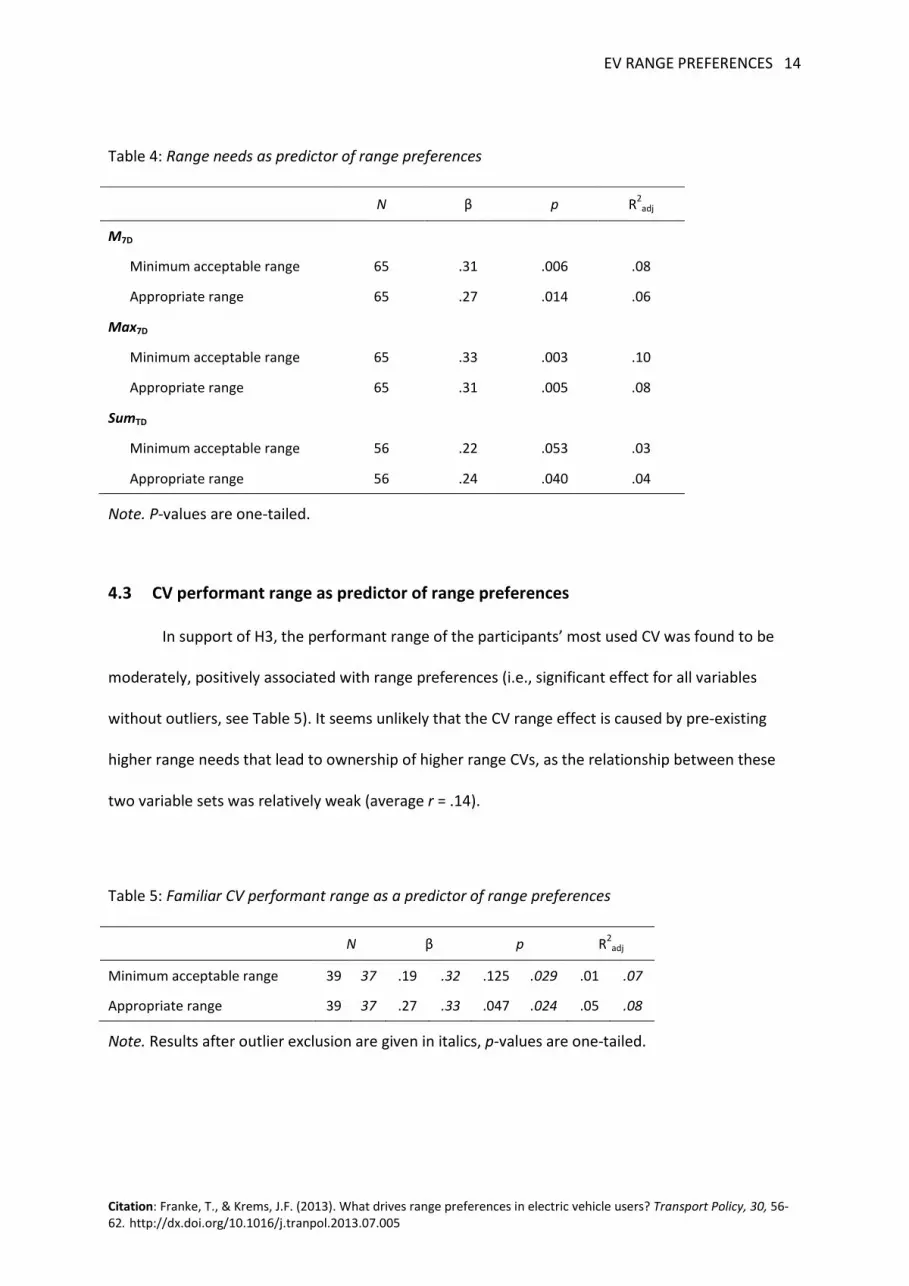
4.2 Objective range needs as predictor for range preferences
In support of H2, usual range needs were moderately, positively associated with range
preferences of experienced EV users (see Table 4). Hence, experienced EV users indeed seem to
incorporate range needs in range preference construction. There were no differences in explanatory
power between M7D and Max7D. Yet, the typical day measure (SumTD) was less effective in predicting
preferred range. Hence, it seems that multi-day range need indicators are required to estimate an
individual’s preferred EV range.
EV RANGE PREFERENCES 14
Citation: Franke, T., & Krems, J.F. (2013). What drives range preferences in electric vehicle users? Transport Policy, 30, 56-62. http://dx.doi.org/10.1016/j.tranpol.2013.07.005
Table 4: Range needs as predictor of range preferences
N β p R2adj
M7D
Minimum acceptable range 65 .31 .006 .08
Appropriate range 65 .27 .014 .06
Max7D
Minimum acceptable range 65 .33 .003 .10
Appropriate range 65 .31 .005 .08
SumTD
Minimum acceptable range 56 .22 .053 .03
Appropriate range 56 .24 .040 .04
Note. P-values are one-tailed.
4.3 CV performant range as predictor of range preferences
In support of H3, the performant range of the participants’ most used CV was found to be
moderately, positively associated with range preferences (i.e., significant effect for all variables
without outliers, see Table 5). It seems unlikely that the CV range effect is caused by pre-existing
higher range needs that lead to ownership of higher range CVs, as the relationship between these
two variable sets was relatively weak (average r = .14).
Table 5: Familiar CV performant range as a predictor of range preferences
N β p R2adj
Minimum acceptable range 39 37 .19 .32 .125 .029 .01 .07
Appropriate range 39 37 .27 .33 .047 .024 .05 .08
Note. Results after outlier exclusion are given in italics, p-values are one-tailed.
EV RANGE PREFERENCES 15
Citation: Franke, T., & Krems, J.F. (2013). What drives range preferences in electric vehicle users? Transport Policy, 30, 56-62. http://dx.doi.org/10.1016/j.tranpol.2013.07.005
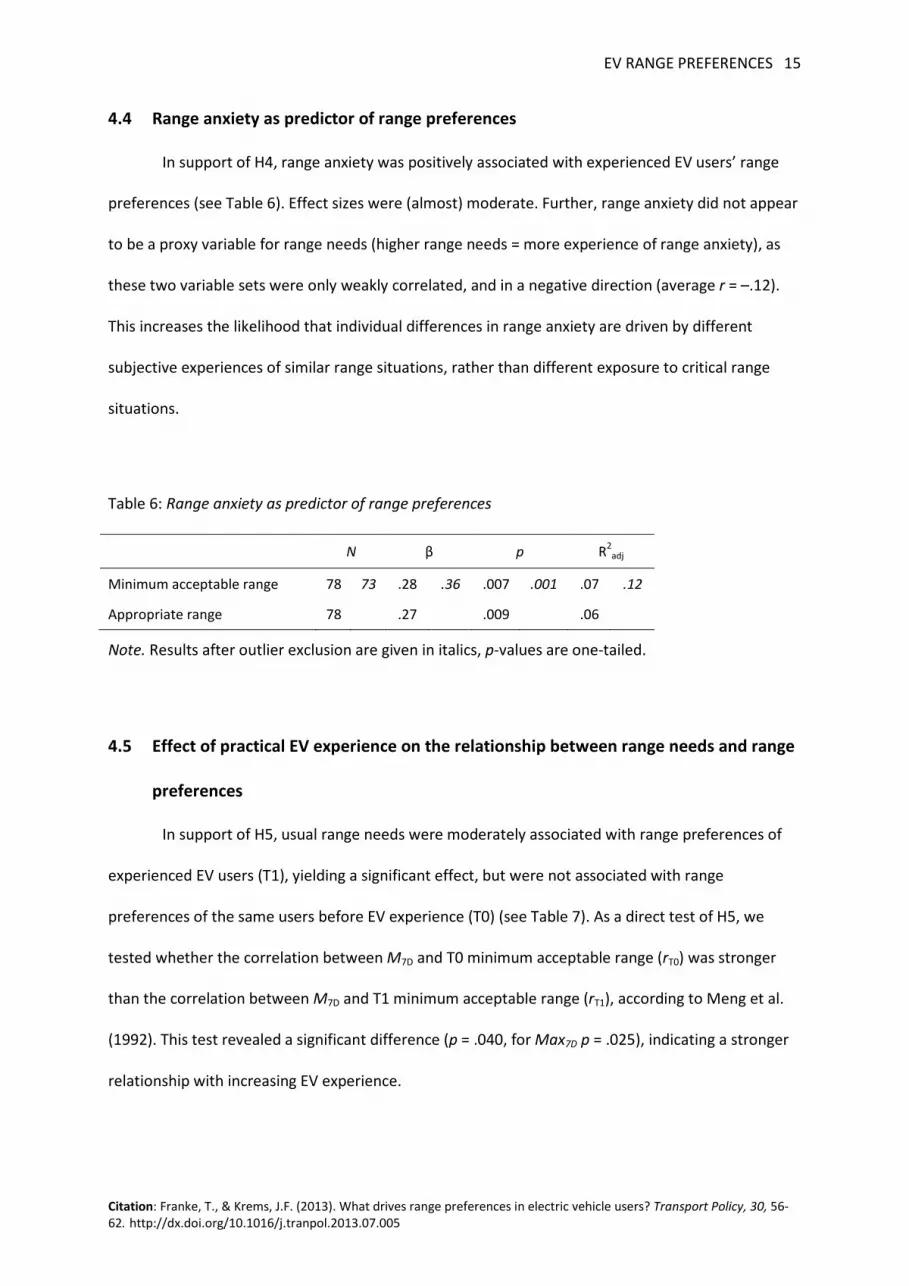
4.4 Range anxiety as predictor of range preferences
In support of H4, range anxiety was positively associated with experienced EV users’ range
preferences (see Table 6). Effect sizes were (almost) moderate. Further, range anxiety did not appear
to be a proxy variable for range needs (higher range needs = more experience of range anxiety), as
these two variable sets were only weakly correlated, and in a negative direction (average r = –.12).
This increases the likelihood that individual differences in range anxiety are driven by different
subjective experiences of similar range situations, rather than different exposure to critical range
situations.
Table 6: Range anxiety as predictor of range preferences
N β p R2adj
Minimum acceptable range 78 73 .28 .36 .007 .001 .07 .12
Appropriate range 78 .27 .009 .06
Note. Results after outlier exclusion are given in italics, p-values are one-tailed.
4.5 Effect of practical EV experience on the relationship between range needs and range
preferences
In support of H5, usual range needs were moderately associated with range preferences of
experienced EV users (T1), yielding a significant effect, but were not associated with range
preferences of the same users before EV experience (T0) (see Table 7). As a direct test of H5, we
tested whether the correlation between M7D and T0 minimum acceptable range (rT0) was stronger
than the correlation between M7D and T1 minimum acceptable range (rT1), according to Meng et al.
(1992). This test revealed a significant difference (p = .040, for Max7D p = .025), indicating a stronger
relationship with increasing EV experience.

EV RANGE PREFERENCES 16
Citation: Franke, T., & Krems, J.F. (2013). What drives range preferences in electric vehicle users? Transport Policy, 30, 56-62. http://dx.doi.org/10.1016/j.tranpol.2013.07.005
Table 7: Range needs as predictor of range preferences
N β p R2adj
M7D
T0: Minimum acceptable range 35 .14 .204 -.01
T1: Minimum acceptable range 35 .45 .003 .18
Max7D
T0: Minimum acceptable range 35 .07 .340 -.02
T1: Minimum acceptable range 35 .42 .006 .15
Note. P-values are one-tailed.
4.6 Effect of practical EV experience on range preferences
In support of H6, minimum acceptable range was found to be higher at T0 (M = 144.87 km,
SD = 59.64) than at T1 (M = 123.97 km, SD = 60.69), revealing a relatively small (d = .32) but
significant effect, t(38) = –2.02, p = .025. Untransformed variables were used, as the difference score
T0–T1 could be assumed to be normally distributed. However, a similar result was obtained with log-
transformed variables, d = .45, t(38) = –2.84, p = .004.
5 DISCUSSION
The present research sought to better understand factors that influence range preferences in
potential EV customers with EV experience. In general, our assumptions were supported: (H1) Range
preferences were found to be substantially higher than typical and average daily range needs, but
not much higher than weekly maximum daily range needs. (H2) Usual range needs were positively
related to range preference of experienced EV users. (H3) Familiar CV performant range was
associated with higher range preferences. (H4) Experienced range anxiety was associated with higher
range preferences. (H5) Usual range needs were more strongly associated with range preferences
with increasing EV experience. (H6) Range preferences decreased with EV experience.
EV RANGE PREFERENCES 17
Citation: Franke, T., & Krems, J.F. (2013). What drives range preferences in electric vehicle users? Transport Policy, 30, 56-62. http://dx.doi.org/10.1016/j.tranpol.2013.07.005
5.1 Implications for understanding and resolving the EV range paradox
The discrepancy between average range needs and range preferences in our study is
consistent with previous findings (see section 2.1); though, our effects appear smaller than those
reported in previous studies. This might be partially attributable to the decrease in range preference
associated with increased EV experience (H6), but it might also partly be attributable to our sample
of early adopters, who are known to accept potential usage barriers more readily (Rodriguez and
Page, 2004). Hence, the discrepancy between range needs and range preferences might be larger in
the future general population of experienced EV drivers than was observed here. However, given
that there are some indications of decreasing EV range preferences in the general population over
the last several years (see study of ADAC, 2013 reported in Table 2), this might also not be the case.
Importantly, our findings indicate that early EV buyers may not, on average, request exaggerated
range setups, because their minimum acceptable range was similar to their weekly maximum daily
range needs.
Our findings suggest that average and maximum usual range needs only act as a reference
point in preference construction for experienced EV drivers. The weak effect for inexperienced
drivers is consistent with previous research (Bunzeck et al., 2011). However, is it really plausible that
potential customers without EV experience do not anchor preferences on their range needs at all? It
might be that they do not use accurate estimators of their range needs; instead, they may only use
highly accessible indicators, such as a critical destination or most recent holiday trip, which do not
accurately represent usual range needs. Future research identifying these alternative reference
indicators in people without EV experience may help to inform strategies for reducing range
discrepancy by, for example, fostering users’ understanding of the low diagnostic value of certain
highly accessible range need indicators. It might also be possible to establish accurate
representations of range needs in users without 3 months of limited range mobility experience.
However, filling out a travel diary alone is likely not sufficient to accomplish this objective, as users
also did this before the T0 range preference assessment in the present study and there was no
EV RANGE PREFERENCES 18
Citation: Franke, T., & Krems, J.F. (2013). What drives range preferences in electric vehicle users? Transport Policy, 30, 56-62. http://dx.doi.org/10.1016/j.tranpol.2013.07.005
indication that participants relied on those recorded values. Yet, providing detailed individual
feedback on the results of such a diary could already be sufficient for producing a measurable effect
on range preferences.
From a methodological perspective, these findings also suggest that collecting data on travel
patterns over a 1-week period is sufficient to derive meaningful estimates of average range
preferences in future EV markets with more experienced users. The necessity of using multiple-day,
instead of single-day data, to derive meaningful estimates of optimal range is supported by the high
correlation between multiple-day range need scores and range preferences and the relatively weak
correlation between the typical-day range needs and range preferences.
The obtained relationship between experienced CV range and range preferences indicate
that familiar vehicle range likely acts as a reference point in range preference construction. However,
based on our results, it seems unlikely that only a few months of driving a limited-range vehicle will
replace the representation of high-range CVs, which users have experienced for years as the status
quo of vehicle range. This should be true, at least, when users sometimes still use a conventional car,
as in our study.
Range anxiety is another moderator variable that should be taken into account when
considering strategies to reduce the range discrepancy. People who experience more (anticipated)
range anxiety may need more support in coming to view lower range values as acceptable. An
important next step will be to better understand the psychological variables that influence range
anxiety.
Finally, the decrease in range preference over the first 3 months of usage suggests that
practical experience with limited range mobility could play an important role in increasing
acceptance and purchase intentions. This is also supported by related research that has found an
increasing perceived fit between mobility needs and EV mobility resources over the first 3 months of
EV experience (Franke et al., 2012b). However, the potential of short-term experience on range
EV RANGE PREFERENCES 19
Citation: Franke, T., & Krems, J.F. (2013). What drives range preferences in electric vehicle users? Transport Policy, 30, 56-62. http://dx.doi.org/10.1016/j.tranpol.2013.07.005
appraisal has yet to be quantified because adaptation to EV range seems to take several weeks
(Pichelmann et al., 2013). It might be that this time of adaptation (i.e., the learning process) can be
shortened, for example, by motivating and supporting users to actively explore and exhaust the
range. This could be achieved with advanced driver information and assistance systems that help
users to extend the range and reduce uncertainty regarding the sufficiency of the remaining range
for upcoming trips. A critical task for future research will be to examine the changes (i.e., adaptation
effects) in range preferences that are caused by EV experience more in depth.
5.2 Critical evaluation of study design and findings
The present study was among the first to examine factors influencing range preferences of
potential EV customers who had experience using a realistic electric mobility system. In interpreting
the results, several critical issues must be taken into account. Given the field study research design,
inferences about causal relationships cannot be easily drawn. Future studies should be conducted to
determine whether the associations reported here are causally related. Moreover, replication studies
with larger sample sizes are needed to test for the robustness of the present results.
Furthermore, our study results are based on a specific sample of early adopters of EVs, who
are likely not representative of all car buyers. However, we believe that understanding this target
group is of essential importance as it represents a wellspring for EV market penetration. Moreover,
the factors influencing range preference observed in this sample of experienced users may also
generalize to more mature markets, which include fewer first time buyers and more experienced EV
drivers.
Finally we did not take into account several factors that affect mobility resources in an
electric mobility system, such as recharging infrastructure (i.e., density and recharging time) and user
access to other mobility options. These elements of an electric mobility system have the potential to
act as technical safety buffers, facilitate coping with limited EV range, and therefore potentially
EV RANGE PREFERENCES 20
Citation: Franke, T., & Krems, J.F. (2013). What drives range preferences in electric vehicle users? Transport Policy, 30, 56-62. http://dx.doi.org/10.1016/j.tranpol.2013.07.005
leading to lower range preferences. Future research should empirically test the effects of these
factors on range preferences.
Acknowledgments
This research was funded by the German Federal Ministry for the Environment, Nature Conservation and Nuclear Safety (16EM0003) and the Federal Ministry of Economics and Technology (01MX12018). Any views expressed herein are those of the authors and do not necessarily reflect those of the funding bodies or partners involved in the project.
We are grateful for the support of our consortium partners, BMW Group (G. Schmidt, Søren Mohr, Dr. A. Keinath and Dr. R. Vilimek) and Vattenfall Europe AG (A. Weber and F. Schuth) who made our research possible. We also thank the interviewers for their support in conducting the studies and the reviewers for their very helpful comments.
6 REFERENCES
ADAC, 2013. ADAC Elektromobilität 2013. Umfrage im Auftrag des ADAC Technik Zentrums (Landsberg am Lech). Available at: <http://www.konferenz-elektromobilitaet.de/programm/vortraege/Umfrage-Elektromobilitaet-2013.pdf>
Bronchard, S., McGuinness, M., Narich, C., Noom, M., Raut, C., Schutz, M., Stark, M., Ubbink, P., Viglino, M., Vos, A., 2011. Plug-in Electric Vehicles: Changing Perceptions, Hedging Bets. Available at: <http://www.accenture.com/SiteCollectionDocuments/PDF/Resources/Accenture_Plug-in_Electric_Vehicle_Consumer_Perceptions.pdf>
Bunzeck, I., Feenstra, C. F. J., Paukovic, M., 2011. Preferences of potential users of electric cars related to charging - A survey in eight EU countries. Available at: <http://www.d-incert.nl/wp-content/uploads/2011/05/rapportage_ECN.pdf>
Chlond, B., Kagerbauer, M., Vortisch, P., Wirges, J., 2012. Market potential for electric vehicles from a travel behavior perspective. In: Proceedings of the 91st Annual Meeting of the Transportation Research Board, January 21-26, 2011, Washington, DC.
Cocron, P., Bühler, F., Neumann, I., Franke, T., Krems, J. F., Schwalm, M., Keinath, A., 2011. Methods of evaluating electric vehicles from a user's perspective - the MINI E field trial in Berlin. IET Intelligent Transport Systems 5 (2), 127-133.
Collins, A. M., Loftus, E. F.. 1975. A Spreading-Activation Theory of Semantic Processing. Psychological Review 82 (6), 407-428.
Daziano, R. A., 2013. Conditional-logit Bayes estimators for consumer valuation of electric vehicle driving range. Resource and Energy Economics 35 (3), 429-450.
Dimitropoulos, A., Rietveld, P., van Ommeren, J. N., 2011. Consumer Valuation of Driving Range: A Meta-Analysis. Tinbergen Institute Discussion Paper 133 (3), 1-35.
Franke, T., Bühler, F., Cocron, P., Neumann, I., Krems, J. F., 2012a. Enhancing sustainability of electric vehicles: A field study approach to understanding user acceptance and behavior. In: Sullman, M., Dorn, L. (Eds.), Advances in Traffic Psychology. Ashgate, Farnham, UK, pp. 295-306.
Franke, T., Cocron, P., Bühler, F., Neumann, I., Krems, J.F., 2012b. Adapting to the range of an electric vehicle — the relation of experience to subjectively available mobility resources. In: Valero Mora, P., Pace, J.F., Mendoza, L. (Eds.), Proceedings of the European Conference on Human
EV RANGE PREFERENCES 21
Citation: Franke, T., & Krems, J.F. (2013). What drives range preferences in electric vehicle users? Transport Policy, 30, 56-62. http://dx.doi.org/10.1016/j.tranpol.2013.07.005
Centred Design for Intelligent Transport Systems, Valencia, Spain, June 14-15 2012. Humanist Publications, Lyon, France, pp. 95-103.
Franke, T., Krems, J. F., 2013. Interacting with limited mobility resources: Psychological range levels in electric vehicle use. Transportation Research Part A: Policy and Practice 48, 109-122.
Franke, T., Neumann, I., Bühler, F., Cocron, P., Krems, J. F., 2012c. Experiencing Range in an Electric Vehicle: Understanding Psychological Barriers. Applied Psychology 61 (3), 368-391.
Giffi, C., Hill, R., Gardner, M., Hasegawa, M., 2010. Gaining traction: A customer view of electric vehicle mass adoption in the U.S. automotive market. Available at: <http://www.deloitte.com.br/publicacoes/2007/MFG.Gaining_Traction_customer_view_of_electric_vehicle_mass_adoption.pdf >
Giffi, C., Vitale Jr., J., Drew, M., Kuboshima, Y., Sase, M., 2011. Unplugged: Electric vehicle realities versus consumer expectations. Available at: < http://www.deloitte.com/electricvehicle>
Greene, D. L., 1985. Estimating daily vehicle usage distributions and the implications for limited-range vehicles. Transportation Research Part B: Methodological 19 (4), 347-358.
Grubbs, F. E., 1969. Procedures for Detecting Outlying Observations in Samples. Technometrics 11 (1), 1-21.
Hoen, A., Koetse, M. J., 2012. A Choice Experiment on AFV Preferences of Private Car Owners in The Netherlands. PBL Working Paper 3, 1-46.
infas, DLR, 2010. Mobilität in Deutschland: Ergebnisbericht. Available at: <http://mobilitaet-in-deutschland.de/02_MiD2008/publikationen.htm>
Krumm, J., 2012. How People Use Their Vehicles: Statistics from the 2009 National Household Travel Survey. SAE Technical Paper 2012-01-0489.
Kurani, K. S., Turrentine, T. S., Sperling, D., 1994. Demand for electric vehicles in hybrid households: an exploratory analysis. Transport Policy 1 (4), 244-256.
McManus, M. C., 2012. Environmental consequences of the use of batteries in low carbon systems: The impact of battery production. Applied Energy 93, 288–295.
Meng, X.-L., Rosenthal, R., Rubin, D. B., 1992. Comparing correlated correlation coefficients. Psychological Bulletin 111, 172-175.
Miller, K., Hofstetter, R., Krohmer, H., Zhang, Z. J., 2011. How Should Consumers' Willingness to Pay Be Measured? An Empirical Comparison of State-of-the-Art Approaches. Journal of Marketing Research 48 (1), 172-184.
miniusa.com (2012). MINI E specifications. Available at: <http://www.miniusa.com/minie-usa/pdf/MINI-E-spec-sheet.pdf>
Neubauer, J., Brooker, A., Wood, E., 2012. Sensitivity of battery electric vehicle economics to drive patterns, vehicle range, and charge strategies. Journal of Power Sources 209, 269–277.
Nilsson, M., 2011. Electric Vehicle: The phenomenon of range anxiety. Available at: <http://www.elvire.eu/IMG/pdf/The_phenomenon_of_range_anxiety_ELVIRE.pdf>
Öko-Institut, 2011. Autos unter Strom. Available at: <http://www.oeko.de/oekodoc/1283/2011-413-de.pdf>
Pearre, N. S., Kempton, W., Guensler, R. L., Elango, V. V., 2011. Electric vehicles: How much range is required for a day's driving? Transportation Research Part C: Emerging Technologies 19 (6), 1171-1184.
Peters, E., 2006. The Functions of Affect in the Construction of Preferences. In: Lichtenstein, S., Slovic, P. (Eds.), The Construction of Preference. Cambridge University Press, New York, NY, pp. 454-463.
Pichelmann, S., Franke, T., Krems, J., 2013. The Timeframe of Adaptation to Electric Vehicle Range. Manuscript submitted for publication.
Rodriguez, A., Page, C., 2004. A Comparison of Toyota and Honda Hybrid Vehicle Marketing Strategies. Available at: <http://www.linxus.co.kr/lib/download.asp?post_file_seq_no=27505&targettype=club&targetid=japaneconomy>
Sammer, G., Stark, J., Link, C., 2011. Einflussfaktoren auf die Nachfrage nach Elektroautos. Elektrotechnik & Informationstechnik 128, 22-27.

EV RANGE PREFERENCES 22
Citation: Franke, T., & Krems, J.F. (2013). What drives range preferences in electric vehicle users? Transport Policy, 30, 56-62. http://dx.doi.org/10.1016/j.tranpol.2013.07.005
Samuelson, W., Zeckhauser, R., 1988. Status Quo Bias in Decision Making. Journal of Risk and Uncertainty 1, 7-59.
Schwarz, N., 2007. Attitude Construction: Evaluation in Context. Social Cognition 25 (5), 638-656. Slovic, P., 1995. The Construction of Preference. American Psychologist 50 (5), 364-371. Stade, M., Meyer, C., Niestroj, N., Nachtwei, J., 2011. (Not) Everybody’s Darling: Value and Prospects
of Multiple Linear Regression Analysis and Assumption Checking. In: Krause, B., Beyer, R., Kaul, G. (Eds.), Empirische Evaluationsmethoden Band 15. ZeE Verlag, Berlin, Germany, pp. 17-34.
TÜV Rheinland, 2011. Results of the representative survey on the acceptance of electric cars. Available at: <http://www.dincertco.de/web/media_get.php?mediaid=35741&fileid=86473&sprachid=2>
Urban, D., Mayerl, J., 2008. Regressionsanalyse: Theorie, Technik und Anwendung (3rd ed.). VS Verlag für Sozialwissenschaften, Wiesbaden, Germany.
VDE (2010). E-Mobility 2020. Available at: <http://www.vde.com/de/E-Mobility/Seiten/VDEStudieEMobility2020.aspx>
Vilimek, R., Keinath, A., Schwalm, M., 2012. The MINI E field study - Similarities and differences in international everyday driving. In: 4th International Conference Applied on Human Factors and Ergonomics, July 21-25, 2012, San Fancisco, CA.
Warren, C., McGraw, A. P., Van Boven, L., 2011. Values and preferences: defining preference construction. Wiley Interdisciplinary Reviews: Cognitive Science 2 (2), 193-205.
Weber, E. U., Johnson, E. J., 2009. Mindful Judgment and Decision Making. Annual Review of Psychology 60, 53-85.
Zpryme, 2010. The Electric Vehicle Study. Available at: <http://www.zpryme.com/SmartGridInsights/The_Electric_Vehicle_Study_Zpryme_Smart_Grid_Insights_Airbiquity_Sponsor_December_2010.pdf>
Zumkeller, D., Vortisch, P., Kagerbauer, M., Chlond, B., Streit, T., Wirtz, M., 2011. Deutsches Mobilitätspanel (MOP) - wissenschaftliche Begleitung und erste Auswertungen. Bericht 2011: Alltagsmobilität & Tankbuch. Available at: <http://daten.clearingstelle-verkehr.de/192/85/Bericht_MOP_10_11.pdf>
Related Documents