Journal of Marketing, forthcoming, March 2013 What Drives Managerial Use of Marketing and Financial Metrics and Does Metric Use Impact Performance of Marketing Mix Activities? Ofer Mintz Imran S. Currim October 2012 Ofer Mintz ([email protected] ) is Assistant Professor of Marketing, E. J. Ourso College of Business, Louisiana State University, Baton Rouge, LA 70803. Imran S. Currim ([email protected] ) is Chancellor’s Professor at the Paul Merage School of Business, University of California, Irvine, CA 92697. The first author would like to thank his doctoral committee members Dominique M. Hanssens (UCLA), Donna L. Hoffman (UCR), and Ivan Jeliazkov, L. Robin Keller, and Cornelia (Connie) Pechmann (all of UCI) as well as Rick Andrews (University of Delaware), Philip Bromiley (UCI), Donald C. Hambrick (Penn State), and Marvin Lieberman (UCLA) for their support and helpful guidance. This research was supported by the Dean’s office of the Paul Merage School of Business.

Welcome message from author
This document is posted to help you gain knowledge. Please leave a comment to let me know what you think about it! Share it to your friends and learn new things together.
Transcript
Journal of Marketing, forthcoming, March 2013
What Drives Managerial Use of Marketing and Financial
Metrics and Does Metric Use Impact Performance of
Marketing Mix Activities?
Ofer Mintz
Imran S. Currim
October 2012
Ofer Mintz ([email protected]) is Assistant Professor of Marketing, E. J. Ourso College of
Business, Louisiana State University, Baton Rouge, LA 70803. Imran S. Currim
([email protected]) is Chancellor’s Professor at the Paul Merage School of Business, University
of California, Irvine, CA 92697. The first author would like to thank his doctoral committee
members Dominique M. Hanssens (UCLA), Donna L. Hoffman (UCR), and Ivan Jeliazkov, L.
Robin Keller, and Cornelia (Connie) Pechmann (all of UCI) as well as Rick Andrews (University
of Delaware), Philip Bromiley (UCI), Donald C. Hambrick (Penn State), and Marvin Lieberman
(UCLA) for their support and helpful guidance. This research was supported by the Dean’s
office of the Paul Merage School of Business.
1
What Drives Managerial Use of Marketing and Financial
Metrics and Does Metric Use Impact Marketing Mix
Performance?
Abstract
To increase marketing’s accountability, JM, MSI, and ISBM have advocated
development of marketing metrics and linking marketing mix activities with financial metrics.
While progress has been made, less attention has been paid to what drives managerial use of
marketing and financial metrics and whether metric use is associated with marketing mix
performance. A conceptual model is proposed which links firm strategy, metric orientation, type
of marketing mix activity, and managerial, firm, and environmental characteristics to marketing
and financial metric use which in turn are linked to performance of marketing mix activities. An
analysis of 1,287 marketing mix activities reported by 439 U.S. managers reveals that firm
strategy, metric orientation, type of marketing mix activity, and firm and environmental
characteristics are more useful than managerial characteristics in explaining use of marketing and
financial metrics and use of metrics is positively associated with marketing mix performance.
Results allow identification of conditions under which managers use less metrics and how metric
use can be increased to improve marketing mix performance.
Keywords: Metrics, Marketing Finance Interface, Marketing Mix, Managerial Decision-
Making

2
“We [marketers] don’t speak the same language as senior management, so there is little trust and even less belief in
our capabilities. If we don’t find a better way to communicate the value of marketing and communication, none of
the other factors will matter.” (An anonymous manager quoted in the Institute for the Study of Business Markets
(ISBM) B-To-B Marketing Trends 2010 report)
To increase marketing’s accountability, the Journal of Marketing (JM Special Sections 2004,
2009), Marketing Science Institute (MSI Research Priorities 1998, 2000, 2002, 2004, 2006,
2008) and the Institute for the Study of Business Markets (ISBM B-To-B Marketing Trends 2010
report) have continuously advocated development of marketing metrics and linking marketing
mix activities with financial metrics. The demands for marketing accountability have been
recognized by practitioners as well. A 2007 Deloitte study found 83% of marketing managers
increasing emphasis on marketing metrics and a 2009 Lenskold Group / MarketSphere report
found 79% of managers indicating greater need for employing financial metrics to assess
marketing mix performance.
Marketing scholars have responded in three ways. First, a menu of marketing metrics,
which are defined as metrics that are based on a customer or marketing mindset such as
awareness, satisfaction, and market share, have been proposed for different marketing mix
activities such as advertising, price promotion, pricing, product management, etc. (Ambler 2003;
Farris et al. 2010; Lehmann and Reibstein 2006). Second, marketing mix efforts have been
linked to financial metrics, which are defined as metrics that are either monetary based, based on
financial ratios, or readily converted to monetary outcomes such as net profit, ROI, and target
volume (see Srinivasan and Hanssens 2009 for a review). Third, metric-based information is
found to influence firm profits (Abramson, Currim, and Sarin 2005) and shareholder value
(Schulze, Skiera, and Wiesel 2012), and the effect of comprehensiveness of metric-based
marketing performance measurement systems on firm performance is found to be mediated by
market alignment and knowledge (Homburg, Artz, and Wieseke 2012). While several advances

3
have been made in the development of marketing metrics, linking marketing efforts to financial
metrics, and linking metric use to firm performance, to the best of our knowledge, there is little if
any understanding of what drives the use of marketing or financial metrics in a managerial
marketing mix decision setting and whether metric use is associated with the performance of the
marketing mix decision (in contrast to firm performance).
Thus, the primary objective and key theoretical contribution of this study relative to
extant research is to propose and test a conceptual model of how factors such as firm strategy
including market and strategic orientation and organizational involvement in the marketing mix
decision, metric-based compensation and training, the type of marketing mix decision
considered, and other characteristics of managers, firms, and the environment drive use of
marketing and financial metrics in managerial marketing decisions. The main result is that it is
not managerial characteristics but rather the setting in which the manager operates that drives
metric use. The secondary objective is to link use of marketing and financial metrics to perceived
performance of the marketing mix activity. Increase in metric use is found to be associated with
improved marketing mix performance. The key managerial contribution of the study relative to
extant research is that the two results noted above allow identification of several conditions,
described in the results and discussion sections, under which managers are less likely to use
metrics, and five different methods to increase managers’ metrics use in such situations in order
to increase marketing mix performance. Such theoretical and managerial contributions are
important steps towards “accountability” of marketing (Lehmann 2004) and marketing
“regaining a seat at the table” (Deshpande and Zaltman 1982; Reibstein, Day, and Wind 2009).
CONCEPTUAL MODEL
In this section we provide the rationale for selection and definition of each construct based on a
review of literatures in marketing, finance, strategy, accounting, and organizational behavior and
4
discussions with 22 marketing executives, who varied on their level in the organization, function,
and industry. Because this is the first study on drivers of metric use and a large number of
potential drivers are identified, we focus on establishing the main effects of drivers. Our main
two dependent variables of interest are the number of marketing and financial metrics that
managers employ when making a marketing mix decision. Based on previous works (Ambler
2003; Farris et al. 2010; Lehmann and Reibstein 2006) and conversations with marketing
executives we consider (a) general marketing and financial metrics, defined as metrics suited to
many marketing-mix decisions and (b) specific marketing and financial metrics, defined as
metrics largely suited to each of 10 marketing mix decisions considered (Table 1).
Our first driver of metric use is firm strategy (see Figure 1). Firm strategy is theorized in
the organizational behavior and strategy literatures to drive “homophily” which results in
managers employing similar decision making processes throughout the firm (Finkelstein,
Hambrick, and Cannella 2009). Homophily theory potentially explains why a manager in a
particular firm setting employs a larger or smaller number of metrics when making marketing
mix decisions. Firm strategy is based on three strategic variables studied extensively in the
marketing literature (a) market orientation, defined as the extent to which the firm measures,
monitors, and communicates customer needs and experiences throughout the firm and whether
the firm’s strategy is based on this information (Kohli and Jaworski 1990); (b) strategic
orientation, defined as the strategy which a firm employs to compete in an industry or market
(Olson, Slater and Hunt 2005); and (c) organizational involvement in managerial decision
making, defined as the extent to which a firm’s marketing mix decision is based on involvement
of a wide range of managers across functions (Noble and Mokwa 1999).
Second, we consider metric orientation, which comprises of (a) metric based
compensation, defined as the importance of metrics in a manager’s compensation package and

5
(b) metric based training, defined as a manager’s level of training on the use of metrics based on
professional and educational experiences. Agency theory (Fama 1980; Jensen and Meckling
1976) suggests that compensation incentives align goals of managers with principals,
consequently, principals seeking to promote metric use can design metric-based incentives.
While metric-based compensation could incentivize metric use, metric-based training could
facilitate its use. Third, prior marketing and strategy research suggests that managerial
characteristics can influence a manager’s priorities, abilities, and hence their use of information
(Curren, Folkes, and Steckel 1992; Lehmann 2004; Lehmann and Reibstein 2006; Perkins and
Rao 1990; Rust et al. 2004). Consequently, we consider the manager’s (a) functional area
(defined as marketing vs. non-marketing), (b) level (Vice President (VP) and higher vs. lower
than VP), (c) length of experience (based on overall career, at the firm, and in the current
position), and (d) quantitative background (based on education and work experience).
Fourth, the resource based view of the firm (March 1991; Wernerfelt 1984) suggests that
firm characteristics account for differences in resources, motivations, and abilities which can
impact information use. Hence, we consider (a) firm size (number of full-time employees), (b)
ownership (private vs. public), (c) chief marketing officer (CMO) presence, (d) recent business
performance (relative to the firm’s expectations and competitors’ performance), and the extent to
which sales come from (e) business-to-business (B2B) vs. business-to-consumer (B2C) markets
and (f) goods vs. service markets. Fifth, contingency theory (Donaldson 2001; Homburg,
Workman and Krohmer 1999) suggests that firms seek to match managerial decisions and
information use with environmental conditions because the environment in which the manager
operates can affect their priorities, abilities, and need for information. Consequently, we consider
(a) stage of the product life cycle (introductory/growth vs. maturity/decline), (b) industry
concentration (percentage of sales controlled by four largest businesses), (c) market growth

6
(annual growth/decline of the company and industry), and (d) market turbulence (rate at which
products/services become obsolete). Verhoef and Leeflang (2009), Homburg, Workman, and
Krohmer (1999), Deshpande and Zaltman (1982) and Kuester, Homburg, and Robertson (1999)
consider such firm and environmental variables to understand the use of information, managerial
decision making, and marketing’s influence in the firm. Sixth, Lehmann and Reibstein (2006)
discuss a “value chain” based theory for metrics and identify the marketing mix decision as a
driver of the use of marketing and financial metrics. Consequently, we consider 10 marketing
mix decisions (a) traditional advertising, (b) internet advertising, (c) direct to consumer, (d)
social media, (e) price promotions, (f) pricing, (g) new product development, (h) sales force, (i)
distribution, and (j) PR/sponsorships, as our final construct driving metric use.
Finally, following the literature on the relationship between use of information and
decision making (Abramson, Currim, and Sarin 2005; Menon et al. 1999), use of metrics,
defined as employment of metrics as decision aids (e.g., for considering, benchmarking, or
monitoring) when making a marketing mix decision, is expected to be associated with perceived
performance of the marketing mix activity, which is defined based on a firm’s stated marketing
(customer satisfaction, loyalty, market share), financial (sales, profitability, ROI), and overall
outcomes, relative to a firm’s stated objectives and to similar prior activities (Jaworski and Kohli
1993; Moorman and Rust 1999; Verhoef and Leeflang 2009).
HYPOTHESES
Antecedents of Marketing and Financial Metric Use
Firm Strategy. Organizational behavior and strategy literatures suggest that managers in
an organization follow similar decision making processes largely shaped by overall firm strategy
(Finkelstein et al. 2009). To understand whether and how firm strategy drives use of metrics we
consider three widely studied strategic concepts in the marketing literature, (a) market

7
orientation (Kirca et al. 2005; Kohli and Jaworski 1990; Deshpande and Farley 1998), (b)
strategic orientation (Olson et al. 2005; Walker and Ruekert 1987), and (c) organizational
involvement in managerial decision making (Noble and Mokwa 1999; Palmatier et al. 2007).
Market Orientation. Ambler, Kokkinaki, and Puntoni (2004) find that top managers in
market oriented firms emphasize marketing over financial metrics in their marketing mix
decisions because top management in market oriented firms maintains more interest in assessing
customer satisfaction and needs, the relationship between satisfaction and brand assets, and how
marketing efforts influence satisfaction, than in how marketing efforts influence profits. Due to
the customer-based focus of top management in market and customer oriented firms, we expect
managers involved in generation and dissemination of market-wide intelligence in such firms to
face greater pressure to employ marketing metrics but less pressure to employ financial metrics
in their marketing mix decisions.
H1. The greater the market orientation of the firm the greater the use of marketing
metrics and the less the use of financial metrics in marketing decisions.
Strategic Orientation. Olson et al. (2005) combine Miles and Snow (1978) and Porter
(1980) frameworks and contend that companies are classified into one of four strategic
orientations: prospectors, analyzers, low-cost defenders, and differentiated defenders. The formal
definition of each orientation is provided in Appendix A. We expect analyzers and both types of
defenders to employ more marketing and financial metrics than prospectors for three reasons.
First, prospectors are driven towards innovative new product-markets (Miles and Snow 1978)
which comprise greater uncertainty about customers (i.e., who the customer will be, how will
they react to the new product, etc.) and competition (i.e., where competition will come from,
what types of competitive products will be introduced, etc.). Hence, it may be premature for
managers in prospector firms to measure general marketing metrics such as satisfaction,

8
preferences, loyalty, consideration sets, share of market, etc., and predict general financial
metrics such as net profit, ROI, ROS, ROMI, EVA, etc. In contrast, as analyzers and defenders
enter a market subsequent to prospectors there is less product-market uncertainty about
customers and competition so that marketing and financial metrics may be less difficult to
measure. Second, because analyzers and defenders do not possess pioneering or first mover
advantages (Kalyanaram, Robinson, and Urban 1995), it becomes more important for such
companies to ensure market success, which requires more reliance on metrics.
Third, prospectors usually have innovation based company cultures which reward
discontinuous innovation (Finkelstein et al. 2009), facilitate complex and disorderly innovation
processes through significant latitude in decision making (Olson et al. 2005), and substitute rigid
rules and policies with discretion and informal coordination mechanisms (Walker and Ruekert
1987). Thus, we expect managers in these firms to encounter less top management pressure for
justification of marketing expenditures through formal marketing and financial metric use. In
contrast, analyzers and both types of defenders maintain a cost-benefit perspective (Vorhies and
Morgan 2003) that seeks to improve on prospectors’ offerings (Matsuno and Mentzer 2000) so
that decision making is more likely to require justification based on marketing and financial
metrics with less latitude and flexibility to depart from norms. For efficiency purposes we
present each of 6 expectations (3 strategic orientations x 2 types of metrics) in Table 2 but
summarize the 6 expectations here in one hypothesis.
H2. Managers in analyzer, low-cost defender, and differentiated defender organizations
will employ more marketing and financial metrics than managers in prospector
organizations.
Organizational Involvement. The level of organizational involvement in marketing mix
decisions can be important because selection of metrics can depend on whether constituencies
other than marketing are included in the decision (Palmatier et al. 2007). In a longitudinal study,

9
Palmatier et al. (2007) consider variety of theoretical perspectives to show that commitment-trust
is the immediate precursor to and the key driver of exchange performance between
constituencies involved in a decision. Commitment is defined as an enduring desire to maintain a
valued relationship while trust is defined as confidence in reliability and integrity with exchange
partners. In order to build trust and commitment between organizational groups (finance,
accounting, etc.), marketers will need to consider goals and metrics relevant to each
organizational group. Consequently, we expect that greater the organizational involvement in the
marketing mix decision, greater the use of financial metrics. And when more financial metrics
are being considered we expect that for purposes of organizational balance between marketing
and non-marketing groups greater number of marketing metrics will also be employed.
H3. The greater the organizational involvement in marketing decisions
the greater the use of marketing and financial metrics.
Metric Orientation. Agency theory (Fama 1980) suggests that incentive pay aligns the
interest of principals and agents to which principals delegate their duties (Jensen and Meckling
1976). Hence, if principals are interested in managers employing metrics in their managerial
decisions they can develop metric based compensation incentives. Rajgopal and Shevlin (2002)
and Coles, Daniel, and Naveen (2006) find that compensation based incentives affect managerial
decision making and firm value. Thus, we expect managers with greater metric based
compensation to employ more metrics in their marketing mix decisions. While metric based
compensation incentivizes use of metrics, metric based training facilitates use of metrics. Clark,
Abela, and Ambler (2006) show that training and use of dashboard systems populated with
metrics helps employees employ metrics in their marketing mix decisions. Consequently, we
expect:

10
H4. The greater the extent of metric based compensation and greater the level of metric
based training the greater the use of marketing and financial metrics in marketing
decisions.
Managerial Characteristics. Following the decision maker’s perspective (Curren,
Folkes, and Steckel 1992) and our interviews with managers, characteristics of managers can
influence a manager’s priorities, abilities, information use, and hence metric use (Lehmann 2004;
Lehmann and Reibstein 2006; Perkins and Rao 1990; Rust et al. 2004). First, we include the
manager’s functional area (marketing vs. non-marketing). Much has been written about
marketing’s lack of financial accountability which has undermined its credibility in the eyes of
top management (Anderson 2006; Day and Fahey 1988; Rust et al. 2004; Srinivasan and
Hanssens 2009). Therefore, in comparison with non-marketing managers we expect marketing
managers to utilize more marketing but less financial metrics when making marketing decisions.
Second, we include the level of the manager (VP and above vs. below VP). Managers at different
levels have different goals that impact metric use. Higher level executives (S/VP, CMO, CFO,
CEO) are responsible for conveying performance of the firm through financial reporting which
affects firm valuation, while lower level managers (marketing, product, and brand managers)
focus on metrics more relevant to their own decisions (Lehmann and Reibstein 2006; Menon et
al. 1999). Therefore, we expect higher level managers to use more financial metrics and less
marketing metrics relative to managers at lower levels.
Third, we include managerial experience. The literature comparing experts with novices
suggests that experts have more highly developed cognitive structures, information in memory,
and rules for using information, which allow more effective problem structuring and successful
problem solving (Harmon and King 1985; Sujan, Sujan, and Bettman 1988). Perkins and Rao
(1990) find more experienced managers consider more kinds of information as useful and make
more financially conservative decisions. Consequently, we expect more experienced managers to

11
employ more marketing and financial metrics in their marketing mix decisions. Fourth, we
include the quantitative background of the manager with the expectation that managers who are
more quantitative will use more formal metrics in their marketing decisions. For efficiency
purposes we summarize our 8 expectations into 2 hypotheses.
H5. Managers with marketing (vs. non-marketing) titles, lower level titles (lower than
VP), more managerial experience, and more quantitative background will employ more
marketing metrics in their marketing decisions.
H6. Managers with non-marketing (vs. marketing) titles, higher level titles (VP and
above), more managerial experience, and more quantitative background will employ
more financial metrics in their marketing decisions.
Firm Characteristics. The resource based view of the firm suggests that firm
characteristics influence resources which in turn influence a manager’s priorities, abilities,
decisions, and information use (March 1991; Wernerfelt 1984). First, we include firm size. In
larger firms, managers are able to access greater financial and marketing managerial resources
and experience from previous marketing efforts (March 1991). Hence, we expect managers in
larger firms to assemble and employ more marketing and financial metrics in their marketing
mix decisions. Second, we include type of ownership (i.e., private vs. public). Publicly traded
firms rely on external financing from public equity markets which demand financial statements
and earnings reports (Burgstahler, Hail, and Leuz 2006). Thus, we expect managers in publicly
traded firms to be incentivized to employ more financial metrics in their marketing decisions.
Third, we include CMO presence. Nath and Mahajan (2008) indicate that firms employ a CMO
to reduce uncertainty top management faces in marketing areas. We expect presence of a CMO
to reduce such uncertainty through greater reliance on marketing metrics. In addition, the CMO,
as a member of top management will recognize importance of financial metrics to other top
managers, and as a result we expect the CMO to encourage and facilitate use of financial metrics
for marketing decisions.
12
Fourth, we include recent business performance. On the one hand, when performance
falls below expectation levels, firms are expected to hold employees more accountable through
financial metrics. However, our expectation follows Bromiley (1991) who argues that when
recent business performance falls below expected aspiration levels, firms are more likely to
undertake new risky investments involving greater uncertainty and difficulty in measurement of
metrics. In contrast, when recent business performance is better than expected, managers are less
pressured to undertake new risky investments and more likely to use metrics, either because they
have more time to develop metrics or because measurement of metrics is simplified for
continuing investments. Fifth, we consider whether the firm has a B2C or B2B orientation.
Managers in B2C oriented firms are more likely to focus their marketing efforts on “one-to-
many” while those in B2B oriented firms are more likely to focus their marketing efforts on
“one-to-one.” We expect it is more difficult to observe results achieved from many customers
than it is to observe results from a single customer so that it will be more important and useful to
develop and use metrics in B2C oriented firms. Sixth, we consider the firm’s goods versus
service orientation. Coviello et al. (2002) find that managers in goods oriented firms are more
transactional focused than managers in service oriented firms, which suggests that managers in
goods oriented firms may be more likely to rely on metrics than managers in service oriented
firms.
H7. Managers in larger firms, with (vs. without) CMO presence, with better recent
performance, and in B2C and goods oriented firms will employ more marketing metrics
in marketing decisions.
H8. Managers in larger firms, public (vs. private) firms, with (vs. without) CMO
presence, with better recent performance, and in B2C and goods oriented firms will
employ more financial metrics in marketing decisions.
Environmental Characteristics. Contingency theory suggests that managers make
decisions to match environmental and industry conditions because environmental conditions
13
affect the manager’s priorities, abilities, and need for information (Donaldson 2001; Homburg et
al. 1999), which could impact metric use. Hence, we first consider stage of the product life cycle.
In the introductory and growth stages of the product life cycle, managers are typically most
concerned about customer acquisition and growth (Kotler and Keller 2009; Porter 1980) and thus
more likely to employ marketing metrics; while in maturity and decline stages the market is not
growing, and consequently, we expect managers to focus on financial based efficiencies such as
profit, ROI, and other financial metrics (Gupta, Lehmann, and Stuart 2004; Morgan, Anderson,
and Mittal 2005). Second, we consider the level of concentration in the industry. Managers
whose firms are in more concentrated industries face fewer major competitors, so that metric
computation is less complex than when there are a larger number of major competitors.
Consequently, we expect managers of firms in more concentrated industries to employ more
marketing and financial metrics.
Third, we consider market growth often associated with economic growth. Fiscal
effectiveness is of less concern when markets are growing (Kohli and Jaworski 1990), thus there
may be less pressure for metric use. Conversely, when the market is shrinking, companies
require greater financial accountability (Deleersnyder et al. 2009), so that there may be more
pressure for metric use. Fourth, we consider the level of market turbulence. In stable markets,
consumers exhibit relatively invariant choices (Morgan et al. 2005), and as a result managers
have less need for metrics. Conversely, in turbulent markets, there is more uncertainty as
consumers exhibit more variant choices (Kohli and Jaworski 1990), so that managers have
greater need for metrics to assess the effectiveness of their marketing mix decisions. Thus, we
expect managers in turbulent markets to use more marketing and financial metrics than when
these markets are stable.
14
H9. Managers in introductory/growth (vs. maturity/decline) product life cycle stages,
more (vs. less) concentrated industries, facing lower market growth, and experiencing
more market turbulence will employ more marketing metrics in marketing decisions.
H10. Managers in maturity/decline (vs. introductory/growth) product life cycle stages,
more (vs. less) concentrated industries, facing lower market growth, and experiencing
more market turbulence will employ more financial metrics in marketing decisions.
Type of Marketing Mix Activity. Lehmann and Reibstein (2006) discuss a “value-
chain” for metrics and identify the marketing mix activity as a driver of marketing and financial
metric use. Ambler (2003) and Farris et al. (2010) propose a variety of metrics for each
marketing mix activity. Building on these works we focus on how 10 marketing mix activities
are expected to drive marketing and financial metric use. We begin with public relations
(PR)/sponsorship decisions, which are considered the most difficult to measure (Kotler and
Keller 2009) for two reasons. First, PR usually focuses on new information about a company
which lacks historical benchmarks and reduces the firm’s ability to generate metrics for such
decisions. Second, companies rarely conduct both supply-side measurements on extent of media
coverage (e.g., reach, volume of media coverage, total costs, and cost per exposure) and demand-
side measurements on reported exposure by consumers (e.g., awareness, recall, and lead
generation) so that linking to marketing and financial metrics is difficult to achieve (Ambler
2003). Consequently, we consider PR/sponsorship as a base level for hypothesizing effects of
each other marketing mix activity.
First, we consider traditional advertising decisions. While it is difficult to measure long-
term effects of advertising (Bucklin and Gupta 1999), advertising involves a large ongoing
financial investment with historical benchmarks and a number of traditional short-term measures.
Therefore, managers are likely to experience pressure to not just use more marketing metrics
such as awareness, reach, and impressions, but more financial metrics such as ROI to justify
large investments (Joshi and Hanssens 2010). As a result, we expect managers to employ a larger
15
set of marketing and financial metrics for traditional advertising decisions as compared to
PR/sponsorship decisions. Second, we consider internet-based advertising, which facilitates
computation of metrics such as hits/visits/page views, click-through rates, impressions, cost-per-
click, conversion rates, and ROI (Bucklin and Sismeiro 2009), so that use of marketing and
financial metrics is facilitated. Hence, we expect managers making internet-based advertising
decisions to employ more marketing and financial metrics than when making PR/sponsorship
decisions.
Third, we consider direct to consumer marketing, which involves traditional marketing
efforts such as direct mail, catalog marketing, telemarketing, etc., for which historical benchmark
data exist. And, newer approaches such as e-mail marketing, interactive TV, kiosks, and mobile
devices, like internet-based advertising, facilitate computation of metrics such as awareness,
number of responses, lead generation, conversion rate, cost-per-customer acquired, and ROI.
Consequently, we expect managers to employ more marketing and financial metrics for direct to
consumer decisions than for PR/sponsorship decisions. Fourth, we consider social media efforts,
such as Facebook and Twitter campaigns, which allow consumers to co-create brands and
experiences, express themselves digitally, establish social networks, and share creations and
expressions with their social networks (Steenburgh and Avery 2008). Social media efforts, like
internet-based advertising, are suited to computation of marketing metrics such as hits/visits/page
views, awareness, number of friends or followers, willingness to recommend, and lead
generation. However, because of the relative newness of social media, consumer creations,
expressions, and sharing have not as yet been linked to purchases on a larger scale and hence
financial metrics (eMarketer 2010; Hoffman and Fodor 2010). As a result, while we expect
managers making social media decisions to employ more marketing metrics than when making
PR/sponsorship decisions it is unclear whether they will employ more financial metrics.

16
Fifth, we consider price promotions, which are not found to generate positive long-term
effects (Pauwels, Hanssens, and Siddarth 2002) and could generate negative long-term effects on
brand equity. Hence, we expect managers to experience greater pressure to justify their use of
sales promotions financially and to employ a larger number of short-term financial metrics
(relative to PR/sponsorship decisions) such as target volume, promotional sales or incremental
lift, net profit, and ROI. Sixth, we consider pricing decisions, which have important implications
for finance and hence will be supported by pricing models and data-based benchmarks (Bucklin
and Gupta 1999). Consequently, we expect managers to employ a larger set of financial metrics
in their pricing decisions (relative to PR/sponsorship decisions) such as margin, target volume,
ROI, and price elasticity, but not necessarily a larger number of marketing metrics.
Seventh, we consider new product development, which requires substantial capital over
long time horizons. Although longer horizons reduce confidence in metrics (Kahn 2009),
because of substantial capital involved, we expect managers to employ a larger set of marketing
and financial metrics (relative to PR/sponsorship decisions) such as belief in or attitude towards
the new product concept, expected margin, total customers and target volume, market share, net
profit, and ROI as well as periodically update metrics to enhance confidence over long new
product development periods. Eighth, we consider sales force decisions. Salespeople are closer
to the sale than marketers so that sales peoples’ efforts (relative to marketers’ PR/sponsorship
decisions) are more readily tied to financial metrics such as forecasts of sales potential,
productivity, target volumes, sales funnels and pipelines, net profit, and ROI. Yet, due to the
typical rivalry and independence observed in firms between sales and marketing, we are unsure
if sales managers will apply more or less marketing metrics. Ninth, we consider distribution
decisions, which like sales force decisions are more readily tied to financial metrics (relative to
PR/sponsorship decisions) such as channel margins, target volume, inventory, number of

17
distributors, and net profit. However, because distribution decisions are less likely made by
marketers and more likely made by sales organizations or operations we are unsure whether such
decision makers will use more or less marketing metrics. For efficiency purposes we present
each of 13 hypotheses in Table 2, but summarize these here into 2 hypotheses.
H11. Managers making traditional advertising, internet advertising, direct to consumer,
social media, and new product development decisions will employ more marketing
metrics than when making PR/sponsorship decisions.
H12. Managers making traditional advertising, internet advertising, direct to consumer,
price promotion, pricing, new product development, sales force, and distribution
decisions will employ more financial metrics than when making PR/sponsorship
decisions.
Relationship between Metric Use and Marketing Mix Performance
Metric use is defined as employment of metrics as decision aids (e.g., for considering,
benchmarking, or monitoring) when making a marketing mix decision (Abramson, Currim, and
Sarin 2005). Perceived performance of a marketing mix activity is defined based on a firm’s
stated marketing (customer satisfaction, loyalty, market share), financial (sales, profitability,
ROI), and overall outcomes, relative to the firm’s stated objectives and to similar prior activities
or decisions (Jaworski and Kohli 1993; Moorman and Rust 1999; Verhoef and Leeflang 2009).
We focus on perceived performance of the marketing mix activity (in contrast to a firm based
performance metric) because the unit of analysis is a particular marketing mix activity and not all
efforts which affect firm performance.
When managers employ more metrics (e.g., awareness, net profit, etc.) as decision aids
they perform more comprehensive evaluations of marketing mix decisions which increases the
quality of decisions (Abramson, Currim, and Sarin 2005) and results in better marketing mix
performance (Menon et al. 1999). The theoretical rationale is briefly described as follows. When
managers use a metric (e.g., net profit) as a decision aid in a marketing mix decision (e.g., price

18
promotions) just the consideration of the metric (without benchmarking or monitoring) can be
better than no metric considered because it makes them sensitive to a goal (e.g., net profit). In
addition, given that they have information on the metric (net profit) prior to the marketing mix
decision, which can serve as a benchmark, it is likely that the metric will be computed post
implementation of the marketing mix decision (price promotion) so that there is now an
opportunity to monitor performance of the marketing mix activity. Monitoring the performance
of the marketing mix activity is facilitated in two ways (a) relative to the manager’s stated
objectives or goals (net profit) for the marketing mix activity and (b) relative to similar
marketing mix activities (price promotions) made in the past. In addition, benchmarking and
monitoring over time allows managers to assess performance differences between variants of the
marketing mix decision (e.g., price promotions with different price cuts) so that there is less
uncertainty not just about the performance of the decision but about the fact that the decision (the
extent of the price cut) was the correct one (Abramson, Currim, and Sarin 2005). In summary,
greater use of metrics enables better marketing mix performance because it permits
benchmarking and monitoring of performance and hence more comprehensive evaluations of
marketing mix decisions which provides information to help planned marketing mix activities
produce desired results (Jaworski 1988; Menon et al. 1999).
Finally, it will be important for managers to employ both marketing and financial metrics
to assess the performance of the marketing mix activity because if only marketing metrics are
employed (e.g., market share) there may be financial uncertainty (e.g., on net profit given that
additional market share can come from loyals buying more and earlier than usual which can later
lead to post promotion sales dips). Likewise, if only financial metrics are employed (ROI), there
will be marketing uncertainty (on the extent to which sales come from switchers vs. loyals which
is important for targeting). Consequently, we expect that the greater the number of marketing and

19
financial metrics employed when making a marketing mix decision the better the perceived
performance of the marketing mix activity.
H13. Increasing use of marketing and financial metrics in marketing mix decisions will
be associated with better perceived performance of the marketing mix activity.
RESEARCH METHODOLOGY
Questionnaire Development and Measurement
Operational measures for constructs in Figure 1 are taken from a variety of extant
literatures summarized in Appendix A. Measurement of (a) firm strategy is taken from literatures
on market orientation (Deshpande and Farley 1998; Verhoef and Leeflang 2009), strategic
orientation (Olson et al. 2005; Slater and Olson 2000), and organizational involvement (Noble
and Mokwa 1999); (b) firm and environmental characteristics are taken from literatures on
market orientation (Jaworski and Kohli 1993), marketing’s influence in the firm (Homburg et al.
1999; Verhoef and Leeflang 2009), firms’ use of marketing research (Deshpande and Zaltman
1982), new product entry (Kuester, Homburg, and Robertson 1999), and top management
decision processes (Miller, Burke, and Glick 1998); (c) marketing mix activity is taken from the
literature on marketing decision making (Menon et al. 1999); (d) marketing and financial metrics
are derived from a three step procedure (i) a literature review (Ambler 2003; Ambler, Kokkinaki,
and Puntoni 2004; Barwise and Farley 2004; Du, Kamakura, and Mela 2007; Farris et al. 2010;
Hoffman and Fodor 2010; Lehmann and Reibstein 2006; Pauwels et al. 2009; Srinivasan,
Vanhuele, and Pauwels 2010), (ii) conversations with 22 executives, as noted earlier, mainly for
validation and omission errors in (i), and (iii) equalization of the marketing and financial metrics
to avoid presentation bias in managerial elicitation of the marketing and financial metrics
employed in a particular marketing mix decision1. Finally, (e) marketing mix activity
performance is based on 8 operational measures, 2 measures of overall performance relative to

20
the firm’s stated objectives and to similar marketing mix activities in the past, based on Jaworski
and Kohli (1993), and 6 performance measures relative to the firm’s objectives and specific
marketing and financial goals such as customer satisfaction, loyalty, sales, market share,
profitability, and ROI based on Moorman and Rust (1999) and Verhoef and Leeflang (2009).
The questionnaire consisted of two sections. First, from a list of 10 marketing mix
activities, managers indicated which marketing mix decisions they recently undertook. Following
Menon et al. (1999, p. 28) we asked them to focus on decisions that “(1) were not so recent that
performance evaluation is premature and (2) not so long ago that memory about the decision and
performance is fuzzy.” Next, for each marketing mix activity they undertook (managers were
required to report at least one marketing mix decision but could report more than one decision),
we asked managers to indicate which marketing (financial) metrics they utilized prior to or while
making the decision from a list of 12 general marketing (financial) metrics common to all
marketing mix activities and 3 specific marketing (financial) metrics related to the particular
marketing mix activity (Table 1). Managers could also view the definition of each listed metric,
indicate any other unlisted metric utilized, or select a no metric employed option. This was
followed by 8 measures of marketing mix activity performance observed after the decision was
made, so that simultaneity/endogeneity concerns are minimized. Subsequently, managers
indicated the level of organizational involvement for each activity. In the second section,
managers provided information on firm strategy, metric orientation, and managerial, firm and
environmental characteristics2.
Data Collection and Sample Description
We used a variety of sources to obtain participants. First, we directly sent 500 members of the
American Marketing Association and 560 MBA alumni of a west-coast university the study
purpose, how to participate, and the questionnaire hyperlink, followed by two reminders, 10 days

21
later and the following week. Second, we approached marketing professional organizations such
as Marketing Executives Group, Marketing Executives Network Group, Society of Marketing
Professional Services, and VP’s of Sales/Marketing whose membership range from 1,800-30,000
marketing professionals. These organizations posted announcements to their respective members
on LinkedIn with a request to participate. LinkedIn is the most successful and comprehensive
professional medium consisting of 135 million members, and is designed to encourage exchange
of information, ideas, and opportunities among members. Professional organizations employ
LinkedIn to carefully select members and advance best practices, white papers, and networking
opportunities, which makes LinkedIn not just legitimate but a high involvement setting for
professional managers. Following Fredrickson and Mitchell (1984) we indicated in our cover
letter post and questionnaire introduction that we were interested in responses from managers
who do and do not employ metrics in decisions. To encourage response, we offered managers a
customized benchmark report comparing their use of metrics to other respondents. To ensure
validity of reports on metric use and marketing mix performance we guaranteed anonymity of
the individual and company. A total of 439 managers responded on 1,287 marketing decisions,
with 84% of managers (and 81% of decisions) from professional organizations and 16% of
managers (and 19% of decisions) from the alumni group. Non-response bias is not detected
among our respondents, based on the Armstrong and Overton (1977) test in which late and early
respondents scores are compared on the included constructs (p>.05).
The sample consists of a good mix of top vs. lower level managers (56% vs. 44%),
managers in prospector (26%), analyzer (25%), differentiated defender (37%) and low-cost
defender (12%) organizations, companies in introductory/growth (43%) vs. maturity/decline
(57%) stages of the product life cycle, and in concentrated (40%) vs. fragmented (60%)
industries. The average number of employees is 12,658 and the median is 125 employees, which

22
indicates a good mix of large and small firms. In addition there is good variation on each of the
other drivers of metric use included in Figure 13.
Validity and Reliability of Measures
Before the questionnaire was distributed it was pretested by 5 academic experts of a dissertation
committee and 10 marketing managers. To help ensure construct validity, we asked academic
experts to assess whether questions and scale items were representative of our underlying
constructs. Based on the pretest we reduced length, altered wording, and skipped redundant
items, and all our pretest academic experts and managers felt comfortable that other managers
could answer the questions. To further assess reliability and validity of measures three tests were
conducted. First, we computed coefficient alphas; all but three were greater than .7 (market
turbulence is .63, market growth is .66, managerial experience is .68). Second, we conducted
exploratory factor analyses for our new constructs which revealed appropriate loadings higher
than .7 for each scale item belonging to a construct. Third, we tested for common method bias
based on Harman’s one-factor test which did not indicate any common method bias. We also
employed the test proposed by Lindell and Whitney (2001) and suggested by Podsakoff et al.
(2003) and adjusted the correlation matrix by the lowest positive pairwise correlation value to
create a partial-correlation adjusted matrix. No pairwise correlation lost significance, also
indicating no evidence of common method bias in our sample.
Econometric Model
Following our conceptual model, we formulate our econometric model as follows:
1.
5 2 4
0 5 7
1 1 1
6 4 9
11 17 21
1 1 1
p p d d g g
p d g
q q c c i i MMET
q c i
MMET FS MO MC
FC EC MA

23
2.
5 2 4
0 5 7
1 1 1
6 4 9
11 17 21
1 1 1
p p d d g g
p d g
q q c c i i FMET
q c i
FMET FS MO MC
FC EC MA
3. 0 1 2 PERFPERF MMET FMET
where MMET is the number of marketing metrics employed in a marketing mix decision, FSp are
five firm strategy variables (analyzers, differentiated defenders, and low-cost defenders each
relative to prospectors which is the base level, market orientation, and organizational
involvement), MOd are two metric orientation measures, MCg are four managerial characteristics,
FCq are six firm characteristics, ECc are four environmental characteristics, and MAi are nine
marketing activities relative to PR/sponsorship which is the base level. In equation 2, FMET is
the number of financial metrics employed in a marketing mix decision, with independent
variables similar to equation 1. Potential dependence created by including multiple marketing
mix decisions by a single manager is accounted for through inclusion of managerial
characteristics. In equation 3, PERF assesses marketing activity performance which is explained
by MMET and FMET.
To estimate our econometric model, we employ a seemingly unrelated regression (SUR)
to allow for (a) contemporaneous correlations between error terms of equations 1, 2, and 3, and
(b) joint estimation of equations 1, 2, and 3. In addition, the system of equations is estimated
using ordinary least squares (OLS) and generalized least squares (GLS), the latter technique to
account for variances of observations being unequal (heteroscedasticity) or when there is
correlation between observations. We report SUR-GLS results because fits and significance
levels were higher although differences between SUR-GLS and SUR-OLS results were small. In
addition, equation 3 was run with managerial characteristics, recent business performance, and

24
growth as additional independent variables, however results were similar to our original model
specification. Variance inflation factor scores computed for each independent variable are well
below 6 (Hair et al. 1998), so that estimation is not expected to suffer from multicollinearity in
the aggregate based on all other independent variables. In addition, over 99% of pairwise
correlation coefficients (524 of 528) in Appendix B are less than .40 (e.g., Leeflang et al. 2000).
One exception is firm size and ownership (.66). The null hypothesis that variance of the residuals
is homogenous cannot be rejected in any of three equations (p > .66, .86, and .86 respectively),
indicating no heteroscedasticity in any equation.
RESULTS
Of the 439 managers reporting on 1,287 marketing mix decisions, more than 100 managers
reported on 8 of 10 marketing mix decisions while 70 and 46 managers reported on price
promotion and distribution decisions respectively (Table 3). The news on reported use of metrics
appears to be good. Managers reported using 3.64 marketing and 3.18 financial metrics on
average and between 2.8 and 4.8 marketing metrics and between 1.8 and 4.2 financial metrics
across 10 marketing mix decisions. In Table 4 Panels A and B we present reported use (in % of
times used) and rank order of use for each general and specific marketing and financial metric
for each of 10 marketing mix activities. The results in Tables 3 and 4 have face validity and
should be very useful for researchers and managers interested in selecting metrics to link
marketing mix efforts to performance.
Antecedents of Marketing and Financial Metric Use
The standardized coefficients for equations 1 and 2 appear in Table 5. We begin with firm
strategy. Firms with higher market orientation are found to use more marketing metrics (p<.01)
but not more financial metrics, so H1 is supported only for marketing metrics. Analyzers (p<.05)
and low cost defenders (p<.01) are found to employ more marketing metrics than prospectors;

25
and analyzers (p<.01), low-cost defenders (p<.01), and differentiated defenders (p<.05) are
found to employ more financial metrics (each p<.01) than prospectors. Consequently, H2 is
largely supported (for 5 of 6 firm strategy-metric combinations). The greater the organizational
involvement in the marketing decision, the greater the use of marketing (p<.01) and financial
(p<.01) metrics. Hence, H3 is supported. Second, we discuss metric orientation. The greater the
manager’s metric based compensation and metric based training, the greater the number of
marketing and financial metrics used in marketing mix decisions (all four p<.01). Consequently,
H4 is supported. Third, in contrast to firm strategy and metric orientation, managerial
characteristics are not found to explain variance in the number of marketing and financial metrics
employed. Only the quantitative background of the manager, as expected, is found to be
positively associated with the use of financial metrics (p<.01). Thus, H5 is not supported and H6
is minimally supported on only the quantitative background measure.
Fourth, firm characteristics are found to be associated with managerial use of metrics.
Managers report more use of marketing metrics in public (vs. private) firms (p<.05), firms with
better recent business performance, and in B2C vs. B2B and goods vs. service focused firms
(each p<.01). Thus, H7 is largely supported (3 of 5 expectations). And managers report higher
use of financial metrics in firms which are publicly owned (vs. private), with CMO presence,
better recent business performance, and B2C vs. B2B and goods vs. service orientations (each
p<.01). Hence, H8 is largely supported (5 of 6 expectations). A possible explanation for the
hypotheses on firm size not being supported is the correlation between ownership and size (.66).
Fifth, managers report more use of marketing and financial metrics when there is higher industry
concentration (p<.01) and more market turbulence (p<.01). Consequently, H9 and H10 on
environmental characteristics are partially supported (2 of 4 expectations each) for industry
concentration and market turbulence. Finally, regarding marketing mix activities, as
26
hypothesized, managers are found to use more marketing metrics for internet advertising and
new product decisions (each p<.01) than for PR/sponsorship decisions; and are found to use
more financial metrics for traditional advertising, internet advertising, direct to consumer, price
promotions, pricing, new product development, and sales force decisions (each p<.01 except
traditional advertising which has p<.05), each relative to the PR/sponsorship decision.
Consequently, H11 is partially supported only for internet advertising and new product decisions
while H12 is largely supported (7 of 8 expectations). While firm strategy, metric orientation, and
firm and environmental (managerial) characteristics are found to be about equally important
(unimportant) in explaining variation in marketing and financial metrics employed, type of
marketing mix effort is somewhat more important in explaining number of financial metrics
employed than number of marketing metrics employed, in particular, for traditional advertising,
direct to consumer, and sales force decisions.
Relationship between Metric Use and Marketing Mix Performance
Table 5 also reports estimation results of equation 3. As hypothesized, increasing use of
marketing and financial metrics is found to result in better perceived marketing mix performance
(both p<.01), so H13 is supported. This result supports the measurement of use of metrics and
perceived marketing mix performance. It is interesting to note that after we correct or account for
use of financial metrics, use of marketing metrics almost equally contributes to improved
marketing mix performance with the additional use of a marketing (financial) metric in a
marketing mix decision associating with a 3% (2%) increase in marketing mix performance.
Additional Analyses
First, we investigated conditions under which managers use more marketing than financial
metrics (the third column in Table 5). The results demonstrate that firm strategy (3 of 5
variables) and type of marketing mix activity (6 of 9 variables) largely influence relative use of
27
marketing versus financial metrics, firm (2 of 6 variables) and managerial characteristics (1 of 4
variables) only somewhat influence relative use of marketing versus financial metrics, and metric
orientation (0 of 2 variables) and environmental characteristics (0 of 4 variables) do not influence
relative use of marketing versus financial metrics. Second, we investigated whether the effects of
driver variables on marketing and financial metrics employed were different for private vs.
public firms. Of the 58 potential effects (29 driver variables x 2 types of metrics employed
marketing and financial) we found no differences on 39 effects and differences on 19 effects
(about 2:1 ratio in favor of no differences). Most differences found indicated that effects were
greater for private firms and number of financial metrics employed. For example, the effects of
firm strategy, metric orientation, and firm and environmental characteristics on financial metric
use (to a larger extent) and marketing metric use (to a lesser extent) are greater for private firms.
Third, we investigated whether the effects of driver variables on marketing and financial metric
use were different for the sample of MBA alumni versus the sample drawn from members of
professional organizations, and found that the alumni sample has no distorting effect or makes
the results reported in the paper (with the inclusion of the alumni sample) more conservative for
90% of the hypotheses4. Fourth, we added squared terms for MMET and FMET in equation 3.
The coefficient for FMET2
was insignificant (p>.05), while the coefficient for MMET2
indicated
diminishing returns of scale after 1 marketing metric.
In summary, the results demonstrate that type of marketing mix activity, firm strategy,
metric orientation, and firm and environmental characteristics are more useful than managerial
characteristics in explaining metric use. Firm strategy, metric orientation, and firm characteristics
explain both marketing and financial metric use, however, the type of marketing mix activity is
more useful in explaining financial metric use than marketing metric use. Firm strategy and type
of marketing mix activity also influence relative marketing versus financial metric use, while the

28
aforementioned results largely hold when the sample is split by public and private firms, and
when pooled or not.
DISCUSSION AND MANAGERIAL RECOMMENDATIONS
Our main result suggests that a manager’s use of metrics is not based on who the manager is, but
rather on the cluster of other variables describing the setting in which the manager operates (e.g.,
firm strategy, metric orientation, type of marketing mix decision, and firm and environmental
characteristics). In other words, the strategic theory of homophily, agency theory, the resource
based view of the firm, and contingency theory are more powerful than the decision maker’s
perspective at explaining metric use. Our secondary result is that use of metrics is found to be
positively associated with marketing mix performance. In particular, marketing metrics are found
to be positively associated with marketing mix performance, and equally important to financial
metrics, which supports the current demand for development and use of both marketing and
financial metrics for marketing accountability.
Based on our results, we identify settings in which managers use less marketing and
financial metrics both independently, and relative to each other, followed by recommendations
on how to get managers to use more metrics in such settings. On the independent use of metrics,
managers are found to use less marketing metrics in firms with lower market orientation and in
prospector and differentiated defender firms (vs. low cost defender and analyzer firms).
Managers are also found to use less marketing metrics for traditional advertising, direct to
consumer, social media, price promotions, pricing, sales force, and distribution than new product
development and internet advertising decisions. In addition, managers are found to use less
financial metrics in firms which are prospectors, private, and without CMO presence. We also
find managers employ less marketing and financial metrics when there is less organizational
involvement in the marketing mix decision, when their compensation is less metric based and
29
when there is less metric based training, and in firms with worse recent business performance,
greater B2B and service orientations, and in industries which are less concentrated and turbulent.
On the relative use of metrics, managers use less marketing (than financial) metrics in firms
which are analyzers and low cost defenders, both relative to prospectors, when managers have a
greater quantitative background, when the firm has a CMO presence, and in direct to consumer,
price promotion, pricing, sales force, and distribution decisions. Managers use less financial
(than marketing) metrics when the firm has a higher market orientation, when sales come more
from services than goods, and in social media decisions.
Our results suggest five strategies to increase overall use of metrics. First, top
management can link managerial compensation to metrics. Second, managers should receive
training on development and use of metrics. Third, managers from other functions in the
organization (accounting, finance, etc.) could be involved in the marketing mix decision, so that
the decision is not just a marketing but company wide effort. Fourth, top management can hire a
CMO to participate in top management decisions to increase relative use of financial over
marketing metrics. Fifth, managers with quantitative backgrounds should be involved in the
marketing mix decision to also increase relative use of financial over marketing metrics.
Although these five recommendations are straightforward and easy to implement the reward for
marketing can be great (Lehmann 2004). In fact if top management is less forthcoming on these
aspects it is in the interest of marketing managers to encourage top management or move
independently on these aspects.
This study has limitations. First, we only study firms in one country. Clearly, there is
need for an international study that compares metric use across countries. Second, we use self-
reported performance from a single-informant. In general, the use of self-reported performance
can lead to stronger relationships between metric use and performance (e.g., Verhoef and

30
Leeflang 2009). However, we do use eight subjective measures based on three separate
published studies from the literatures on the role of marketing, market orientation, and
marketing’s influence in the firm. Multiple-respondents per firm could increase reliability of
findings. Third, use of cross-sectional data has inherent limitations for inferring causal
relationships and dynamics. However, these three limitations are shared with majority of
published studies in literatures on the role of marketing, market orientation, and marketing’s
influence in the firm. Fourth, while we study use of metrics we do not comment on importance
of metrics used to judge marketing mix performance. We did measure importance of each metric
used, however results were similar to reported results. Fifth, we did exclude a few overlapping
metrics to equalize the number of marketing and financial metrics, however we consider 42
marketing and 42 financial metrics and allow managers to write-in any unlisted marketing or
financial metric used, consequently the exclusion problem is minimal. Sixth, the level of
accountability and long versus short orientation of the firm could affect the use of metrics,
although we do consider firm strategy and metric orientation which mitigate this issue.
One future direction to extend this work is to explore heterogeneity across managers’
decisions in the variety of settings in the study. In this first study on drivers of metric use we
focus on establishing main effects of marketing mix activities, firm strategy, metric orientation,
and managerial, firm, and environmental characteristics to understand which variables are useful
in driving metric use. A subsequent study can focus on interaction effects to judge whether
importance of drivers is moderated by variables considered. We hope such future research will
build on our efforts.

31
References
Abramson, Charles, Imran S. Currim, and Rakesh Sarin (2005), “An Experimental Investigation
of the Impact of Information on Competitive Decision Making,” Management Science,
51(2), 195-207.
Ambler, Tim (2003), Marketing and the Bottom Line: The Marketing Metrics to Pump Up Cash
Flow, FT Prentice Hall, London.
---, Flora Kokkinaki, and Stefano Puntoni (2004), “Assessing Marketing Performance: Reasons
for Metrics Selection,” Journal of Marketing Management, 20(3), 475-498.
Anderson, Eugene W. (2006), “Linking Service and Finance,” Marketing Science, 25(6), 587-
589.
Armstrong, J. Scott and Terry S. Overton (1977), “Estimating Nonresponse Bias in Mail
Surveys,” Journal of Marketing Research, 14(3), 396-402.
Barwise, Patrick and John U. Farley (2004), “Marketing Metrics: Status of Six Metrics in Five
Countries,” European Management Journal, 22(3), 257-262.
Bromiley, Philip (1991), “Testing a Causal Model of Corporate Risk Taking and Performance,”
Academy of Management Journal, 34(1), 37-59.
Bucklin, Randolph E. and Sunil Gupta (1999), “Commercial Use of UPC Scanner Data: Industry
and Academic Perspectives,” Marketing Science, 18(3), 247-263.
--- and Catarina Sismeiro (2009), “Click Here for Internet Insight: Advances in Clickstream Data
Analysis in Marketing,” Journal of Interactive Marketing, 23(1), 35-48.
Burgstahler, David C., Luzi Hail, and Christian Leuz (2006), “The Importance of Reporting
Incentives: Earnings Management in European Private and Public Firms,” Accounting
Review, 81(5), 983-1016.

32
Clark, Bruce H., Andrew V. Abela, and Tim Ambler (2006), “Behind the Wheel,” Marketing
Management, 15(3), 19-23.
Coles, Jeffrey L., Naveen D. Daniel, and Lalitha Naveen (2006), “Managerial Incentives and
Risk-Taking,” Journal of Financial Economics, 79(2), 431-468.
Coviello, Nicole E., Roderick J. Brodie, Peter J. Danaher, and Wesley J. Johnston (2002), “How
Firms Relate to Their Markets: An Empirical Examination of Contemporary Marketing
Practices,” Journal of Marketing, 66(3), 33-46.
Curren, Mary T., Valerie S. Folkes, and Joel H. Steckel (1992), “Explanations for Successful and
Unsuccessful Marketing Decisions: The Decision Maker’s Perspective,” Journal of
Marketing, 56(2), 18-31.
Day, George S. and Liam Fahey (1988), “Valuing Market Strategies,” Journal of Marketing,
52(3), 45-57.
Deleersnyder, Barbara, Marnik G. Dekimpe, Jan-Benedict E. M. Steenkamp, and Peter S. H.
Leeflang (2009), “The Role of National Culture in Advertising’s Sensitivity to Business
Cycles: An Investigation Across Continents,” Journal of Marketing Research, 46(5),
623-636.
Deloitte (2007), “In the dark II: What many Boards and Executives STILL don’t know about the
Health of their Businesses,” Research Report.
Deshpande, Rohit and John U. Farley (1998), “Measuring Market Orientation: Generalization
and Synthesis,” Journal of Market-Focused Management, 2(3), 213-232.
--- and Gerald Zaltman (1982), “Factors Affecting the Use of Market Research Information: A
Path Analysis,” Journal of Marketing Research, 19(1), 14-31.
Donaldson, Lex (2001), The Contingency Theory of Organizations, Sage Publications, Thousand
Oaks, California.
33
Du, Rex Yuxing, Wagner A. Kamakura, and Carl F. Mela (2007), “Size and Share of Customer
Wallet,” Journal of Marketing, 71(2), 94-113.
eMarketer (2010), “Measuring Return on Social Investment: Marketers Must Connect Business
Goals to Social Media Objectives,” eMarketer.com.
Fama, Eugene F. (1980), “Agency Problems and the Theory of the Firm,” Journal of Political
Economy, 88(2), 288-307.
Farris, Paul W., Neil T. Bendle, Phillip E. Pfeifer, and David J. Reibstein (2010), Marketing
Metrics: The Definitive Guide to Measuring Marketing Performance, Wharton School
Publishing, Upper Saddle River, New Jersey.
Finkelstein, Sydney, Donald C. Hambrick, and Albert A. Cannella (2009), Strategic Leadership:
Theory and Research on Executives, Top Management Teams, and Boards, Oxford
University Press, Oxford, UK.
Fredrickson, James W. and Terence R. Mitchell (1984), “Strategic Decision Processes:
Comprehensiveness and Performance in an Industry with an Unstable Environment,”
Academy of Management Journal 27(2), 399–423.
Gupta, Sunil, Donald R. Lehmann, and Jennifer Ames Stuart (2004), “Valuing Customers,”
Journal of Marketing Research, 41(1), 7-18.
Hair, Joseph F., Rolf E. Anderson, Ronald L. Tatham, and William C. Black (1998),
Multivariate Data Analysis, Prentice Hall, Upper Saddle River, New Jersey.
Harmon, Paul and David King (1985), Expert Systems: Artificial Intelligence in Business, John
Wiley & Sons, Inc., New York.
Hoffman, Donna L. and Marek Fodor (2010), “Can You Measure the ROI of Your Social Media
Marketing?” MIT Sloan Management Review, 52(1), 41-49.

34
Homburg, Christian, John P. Workman Jr., and Harley Krohmer (1999), “Marketing’s Influence
Within the Firm,” Journal of Marketing, 63(2), 1-17.
---, Martin Artz, and Jan Wieseke (2012), “Marketing Performance Measurement Systems: Does
Comprehensiveness Really Improve Performance?,” Journal of Marketing, 76(3), 56–77.
Jaworski, Bernard J. (1988), “Toward a Theory of Marketing Control: Environmental Context,
Control Types, and Consequences,” Journal of Marketing, 52(3), 23-39.
--- and Ajay K. Kohli (1993), “Market Orientation: Antecedents and Consequences,” Journal of
Marketing, 57(3), 53-70.
Jensen, Michael C. and William H. Meckling (1976), “Theory of the Firm: Managerial Behavior,
Agency Costs and Ownership Structure,” Journal of Financial Economics, 3(4), 305-360.
Joshi, Amit and Dominique M. Hanssens (2010), “The Direct and Indirect Effects of Advertising
Spending on Firm Value,” Journal of Marketing, 74(1), 20-33.
Journal of Marketing Special Section (2004), “Linking Marketing to Financial Performance and
Firm Value,” Journal of Marketing, 68(4), 73-185.
--- (2009), “Marketing Strategy and Wall Street: Nailing Down Marketing’s Impact,” Journal of
Marketing, 73(6), 115-266.
Kahn, Kenneth B. (2009), “Identifying the Biases in New Product Forecasting,” Journal of
Business Forecasting, 28(1), 34-37.
Kalyanaram, Gurumurthy, William T. Robinson, and Glen L. Urban (1995), “Order of Market
Entry: Established Empirical Generalizations, Emerging Empirical Generalizations, and
Future Research,” Marketing Science, 14(3), G212-G221.
Kirca, Ahmet H., Satish Jayachandran, and William O. Bearden (2005), “Market Orientation: A
Meta-Analytic Review and Assessment of Its Antecedents and Impact on Performance,”
Journal of Marketing, 69(2), 24-41.

35
Kohli, Ajay K. and Bernard J. Jaworski (1990), “Market Orientation: The Construct, Research
Propositions, and Managerial Implications,” Journal of Marketing, 54(2), 1-18.
Kotler, Philip and Kevin Lane Keller (2009), Marketing Management, Prentice Hall, Upper
Saddle River, New Jersey.
Kuester, Sabine, Christian Homburg, and Thomas S. Robertson (1999), “Retaliatory Behavior to
New Product Entry,” Journal of Marketing, 63(4), 90-106.
Leeflang, Peter S. H., Dick R. Wittink, Michel Wedel, and Philip A. Naert (2000), Building
Models for Marketing Decisions, Kluwer Academic Publishers, Dordrecht.
Lehmann, Donald R. (2004), “Metrics for Making Marketing Matter,” Journal of Marketing,
68(4), 73-75.
--- and David J. Reibstein (2006), Marketing Metrics and Financial Performance, Relevant
Knowledge Series, Marketing Science Institute, Cambridge, Massachusetts.
Lenskold Group / MarketSphere (2009), “2009 Lenskold Group / MarketSphere Marketing ROI
and Measurements Study,” Research Report.
Lindell, Michael K. and David J. Whitney (2001), "Accounting for Common Method Variance in
Cross-Selectional Research Designs," Journal of Applied Psychology, 86(1), 114–121.
March, James G. (1991), “Exploration and Expoitation in Organizational Learning,”
Organization Science, 2(1), 71-87.
Marketing Science Institute (1998, 2000, 2002, 2004, 2006, 2008), Research Priorities: A Guide
to MSI Research Programs and Procedures, Marketing Science Institute, Cambridge,
Massachusetts.
Matsuno, Ken and John T. Mentzer (2000), “The Effects of Strategy Type on the Market
Orientation-Performance Relationship,” Journal of Marketing, 64(4), 1-16.

36
Menon, Anil, Sundar G. Bharadwaj, Phani Tej Adidam, and Steven W. Edison (1999),
“Antecedents and Consequences of Marketing Strategy Making: A Model and a Test,”
Journal of Marketing, 63(2), 18-40.
Miles, Robert E. and Charles C. Snow (1978), Organizational Strategy, Structure, and Process,
McGraw-Hill, New York.
Miller, C. Chet, Linda M. Burke, and William H. Glick (1998), “Cognitive Diversity among
Upper-Echelon Executives: Implications for Strategic Decision Processes,” Strategic
Management Journal, 19(1), 39-58.
Moorman, Christine and Roland T. Rust (1999), “The Role of Marketing,” Journal of Marketing,
63(4), 180-197.
Morgan, Neil A., Eugene W. Anderson, and Vikas Mittal (2005), “Understanding Firms’
Customer Satisfaction Information Usage,” Journal of Marketing, 69(3), 131-151.
Nath, Pravin and Vijay Mahajan (2008), “Chief Marketing Officers: A Study of Their Presence
in Firms’Top Management Teams,” Journal of Marketing, 72(1), 65-81.
Noble, Charles H. and Michael P. Mokwa (1999), “Implementing Marketing Strategies:
Developing and Testing a Managerial Theory,” Journal of Marketing, 63(4), 57-73.
Olson, Eric M., Stanley F. Slater, and G. Tomas M. Hult (2005), “The Performance Implications
of Fit Among Business Strategy, Marketing Organization Structure, and Strategic
Behavior,” Journal of Marketing, 69(3), 49-65.
Palmatier, Robert W., Rajiv P. Dant, and Dhruv Grewal (2007), “A Comparative Longitudinal
Analysis of Theoretical Perspectives of Interorganizational Relationship Performance,”
Journal of Marketing, 71(4), 172-194.

37
Pauwels, Koen, Tim Ambler, Bruce H. Clark, Pat LaPointe, David J. Reibstein, Bernd Skiera,
Berend Wierenga, and Thorsten Wiesel (2009), “Dashboards as a Service: Why, What,
How, and What Research Is Needed?” Journal of Service Research, 12(2), 175-189.
---, Dominique M. Hanssens, and S. Siddarth (2002), “The Long-Term Effects of Price
Promotions on Category Incidence, Brand Choice, and Purchase Quantity,” Journal of
Marketing Research, 39(4), 421-439.
Perkins, W. Steven and Ram C. Rao (1990), “The Role of Experience in Information Use and
Decision Making by Marketing Managers,” Journal of Marketing Research, 27(1), 1-10.
Podsakoff, Philip M., Scott B. MacKenzie, Jeong-Yeon Lee, and Nathan P. Podsakoff (2003),
“Common Method Biases in Behavioral Research: A Critical Review of the Literature
and Recommended Remedies,” Journal of Applied Psychology, 88(5), 879-904.
Porter, Michael E. (1980), Competitive Strategy: Techniques for Analyzing Industries and
Competitors, The Free Press, New York.
Rajgopal, Shivaram and Terry Shevlin (2002), “Empirical Evidence on the Relation between
Stock Option Compensation and Risk Taking,” Journal of Accounting & Economics,
33(2), 145-171.
Reibstein, David J., George S. Day, and Yoram Wind (2009), “Guest Editorial: Is Marketing
Academia Losing Its Way?,” Journal of Marketing, 73(4), 1-3.
Rust, Roland T., Tim Ambler, Gregory S. Carpenter, V. Kumar, and Rajendra K. Srivastava
(2004), “Measuring Marketing Productivity: Current Knowledge and Future Directions,”
Journal of Marketing, 68(4), 76-89.
Schulze, Christian, Bernd Skiera, and Thorsten Wiesel (2012), "Linking Customer and Financial
Metrics to Shareholder Value: The Leverage Effect in Customer-Based Valuation,"
Journal of Marketing, 76 (2),17-32.
38
Slater, Stanley F. and Eric M. Olson (2000), “Strategy Type and Performance: The Influence of
Sales Force Management,” Strategic Management Journal, 21(8), 813-829.
Srinivasan, Shuba and Dominique M. Hanssens (2009), “Marketing and Firm Value: Metrics,
Methods, Findings, and Future Directions,” Journal of Marketing Research, 46(3), 293-
312.
---, Marc Vanhuele, and Koen Pauwels (2010), “Mind-Set Metrics in Market Response Models:
An Integrative Approach,” Journal of Marketing Research, 47(4), 672-684.
Sujan, Harish, Mita Sujan, and James R. Bettman (1988), “Knowledge Structure Differences
between More Effective and Less Effective Salespeople,” Journal of Marketing
Research, 25(1), 81-86.
Steenburgh, Thomas J. and Jill Avery (2008), “UnMe Jeans: Branding in Web 2.0,” Harvard
Business School Case, 509-035.
The Institute for the Study of Business Markets (2010), “B-TO-B MARKETING TRENDS
2010,” The Institute for the Study of Business Markets, University Park, Pennsylvania.
Verhoef, Peter C. and Peter S. H. Leeflang (2009), “Understanding the Marketing Department’s
Influence Within the Firm,” Journal of Marketing, 73(2), 14-37.
Vorhies, Douglas W. and Neil A. Morgan (2003), “A Configuration Theory Assessment of
Marketing Organization Fit with Business Strategy and Its Relationship with Marketing
Performance,” Journal of Marketing, 67(1), 100-115.
Walker Jr., Orville C. and Robert W. Ruekert (1987), “Marketing’s Role in the Implementation
of Business Strategies: A Critical Review and Conceptual Framework,” Journal of
Marketing, 51(3), 15-33.
Wernerfelt, Birger (1984), “A Resource-based View of the Firm,” Strategic Management
Journal, 5(2), 171-180.

39
Footnotes
1 Equalization involved minimal change to the metrics considered and was accomplished by
excluding a particular marketing or financial metric conceptually similar to an included metric
but reported less often used by managers in the pretest. Across the 10 marketing mix decisions
less than 5% (3%) of managers wrote in marketing (financial) metrics used not presented to
them, indicating that the set of metrics presented is quite thorough.
2 We expected respondent drop off in the second section of the questionnaire since the effects of
length are more likely to be felt in the second section of the questionnaire than the first section of
the questionnaire. However, we observed a 40% drop-out rate while answering the first section
of the questionnaire and a much smaller 5% drop-out rate while answering the second section of
the questionnaire. This suggests that drop-out was less due to length of the questionnaire and
perhaps more explained by whether the manager was fully informed about the marketing mix
decision or whether the manager responding was the one most responsible for the marketing mix
decision.
3 There is also good variance on metric-based compensation (mean = 4.8, s.d.= 1.5 where 1= not
important and 7 = extremely important), metric training (mean = 4.5, s.d.= 1.8 where 1= much
less than average and 7 = much more than average), B2B and B2C oriented companies (mean =
2.9, s.d. = 2.2 where 1= mostly B2B, 7 = mostly B2C), goods and service oriented firms (mean =
5.0, s.d. = 2.4 where 1= mostly goods, 7 = mostly services), firms experiencing market growth
and decline (mean = 5.1, s.d.= 1.9 where 1 = >20% decline and 7 = >20% growth), and market
turbulence (mean = 4.4, s.d. = 1.1 where 1 = strongly disagree, 7 = strongly agree). The mix of
privately held vs. publicly traded companies is 76% vs. 24%, close but higher than the 2007 US
Census of 67% vs. 33%) and firms without vs. with a CMO (72% vs. 28%) is also close to Nath
and Mahajan (2008) modalities of 75% vs. 25%.
4 We also conducted analysis to investigate how the alumni sample, compared to the sample of
members of professional organizations, affects support for hypotheses proposed in the study. The
sizes of the two samples vary in that the alumni sample accounts for 241 marketing mix
decisions while the member of professional organizations sample accounts for 1046 marketing
mix decisions. Of the 52 hypotheses the alumni sample is found to have no differential effect on
the results of 32 hypotheses, weaken support for 13 hypotheses proposed, and strengthen support
for 7 hypotheses. As a result, for 45 (32+13) of 52 hypotheses (or close to 90% of hypotheses)
the alumni sample has no distorting effect or makes the results reported in the paper (with the
inclusion of the alumni sample) more conservative.

40
Figure 1. Conceptual Model
Marketing
Metric Use
Financial
Metric Use
Marketing
Mix Activity
Performance
Firm Strategy Market Orientation
Strategic Orientation
o Prospectors
o Analyzers
o Low-Cost Defenders
o Differentiated Defenders
Organizational Involvement
Marketing Mix Activity Traditional Advertising
Internet Advertising
Direct to Consumer
Social Media
Price Promotions
Pricing
New Product Development
Sales Force
Distribution
PR / Sponsorships
Firm Characteristics Firm Size
Type of Ownership
CMO Presence
Recent Business Performance
B2B vs. B2C Oriented
Goods vs. Services Oriented
Managerial Characteristics Functional Area
Managerial Level
Managerial Experience
Quantitative Background
Metric Orientation Metric-Based Compensation
Metric Training Level
Environmental Characteristics Product Life Cycle
Industry Concentration
Market Growth
Market Turbulence

41
Table 1. Marketing and Financial Metrics
Marketing
Mix Activity
Marketing Metrics Financial Metrics
General
Metrics
• Market Share (Units or Dollars)
• Awareness (Product or Brand)
• Satisfaction (Product or Brand)
• Likeability (Product or Brand)
• Preference (Product or Brand)
• Willingness to Recommend (Product
or Brand)
• Loyalty (Product or Brand)
• Perceived Product Quality
• Consideration Set
• Total Customers
• Share of Customer Wallet
• Share of Voice
• Net Profit
• Return on Investment (ROI)
• Return on Sales (ROS)
• Return on Marketing Investment (ROMI)
• Net Present Value (NPV)
• Economic Value Added (EVA)
• Marketing Expenditures (% specifically
on Brand Building Activities)
• Stock Prices / Stock Returns
• Tobin’s q
• Target Volume (Units or Sales)
• Customer Segment Profitability
• Customer Lifetime Value (CLV)
Traditional
Advertising
• Impressions
• Reach
• Recall
• Cost per Customer Acquired / Cost per
Thousand Impressions (CPM)
• Lead Generation
• Internal Rate of Return (IRR)
Internet
Advertising
• Impressions
• Hits/Visits/Page Views
• Click-through Rate
• Cost per Click
• Conversion Rate
• Internal Rate of Return (IRR)
Direct to
Consumer
• Reach
• Number of Responses by Campaign
• New Customer Retention Rate
• Cost per Customer Acquired
• Conversion Rate
• Lead Generation
Social Media
• Hits/Visits/Page Views
• Number of Followers / Tags
• Volume of Coverage by Media
• Lead Generation
• Cost per Exposure
• Total Costs
Price
Promotions
• Impressions
• Reach
• Trial / Repeat Volume (or Ratio)
• Promotional Sales / Incremental Lift
• Redemption Rates (coupons, etc.)
• Internal Rate of Return (IRR)
Pricing
• Price Premium
• Reservation Price
• Relative Price
• Unit Margin / Margin %
• Price Elasticity
• Optimal Price
New Product
Development
• Belief in New Product Concept
• Attitude toward Product / Brand
• Expected Annual Growth Rate
• Expected Margin %
• Level of Cannibalization /
Cannibalization Rate
• Internal Rate of Return (IRR)
Sales Force
• Reach
• Number of Responses by Campaign
• New Customer Retention Rate
• Sales Potential Forecast
• Sales Force Productivity
• Sales Funnel / Sales Pipeline
Distribution
• Out of Stock % / Availability
• Strength of Channel Relationships
• Product Category Volume (PCV)
• Total Inventory / Total Distributors
• Channel Margins
• Sales per Store / Stock-keeping units
(SKUS)
PR /
Sponsorship
• Volume of Coverage by Media
• Reach
• Recall
• Lead Generation
• Cost per Exposure
• Total Costs

42
Table 2. Summary of Hypotheses Effect on Marketing Metric Use Effect on Financial Metric Use
Variable Hypothesis Supported Hypothesis Supported
Firm Strategy 1
Market Orientation + Yes - No
Analyzers + Yes + Yes
Low-Cost Defenders + Yes + Yes
Differentiated Defenders + No + Yes
Organizational Involvement + Yes + Yes
Metric Orientation
Metric based Compensation + Yes + Yes
Metric Training Level + Yes + Yes
Managerial Characteristics
Functional Area (Marketing) + No - No
Managerial Level - No + No
Managerial Experience + No + No
Quantitative Background + No + Yes
Firm Characteristics
Firm Size + No + No
Type of Ownership (Public) --- --- + Yes
CMO Presence + No + Yes
Recent Business Performance
(Better) + Yes + Yes
B2C + Yes + Yes
Services - Yes - Yes
Environmental Characteristics
Product Life Cycle Stage
(Maturity/Declining) - No + No
Industry Concentration + Yes + Yes
Market Growth - No - No
Market Turbulence + Yes + Yes
Marketing Mix Activity 2
Traditional Advertising + No + Yes
Internet Advertising + Yes + Yes
Direct to Consumer + No + Yes
Social Media + No --- ---
Price Promotions --- --- + Yes
Pricing --- --- + Yes
New Product Development + Yes + Yes
Sales Force --- --- + Yes
Distribution --- --- + No
Effect on Marketing Activity Performance
Variable Hypothesis Supported
Marketing Metric Use + Yes
Financial Metric Use + Yes
NOTES, + = a positive hypothesized relationship; - = a negative hypothesized relationship; --- = no hypothesized relationship 1 Analyzers, low-cost defenders, and differentiated defenders are compared to prospectors. 2 All marketing mix activities are compared to PR/sponsorships decisions.

43
Table 3. Reported Usage of Metrics
Marketing Mix Activity Number of
Managers
Marketing
Metrics
(mean)
Financial
Metrics
(mean)
Total
Metrics
(mean)
Traditional Advertising 136 3.81 2.94 6.75
Internet Advertising 150 4.03 3.33 7.36
Direct to Consumer 214 3.48 3.34 6.82
Social Media 142 3.68 1.94 5.62
Price Promotions 70 2.83 3.44 6.27
Pricing 104 3.88 3.99 7.87
New Product Development 144 4.76 4.15 8.91
Sales Force 127 3.10 3.75 6.85
Distribution 46 3.76 4.09 7.85
PR / Sponsorships 154 2.90 1.82 4.72
Overall 1,287 3.64 3.18 6.82

44
Table 4. Panel A. Reported Percentage Use and Rank Order of General Metrics by
Marketing Mix Activity
Ov
eral
l
Tra
dit
ion
al
Ad
ver
tisi
ng
Inte
rnet
A
dv
erti
sin
g
Dir
ect
to
Co
nsu
mer
So
cial
Med
ia
Pri
ce
Pro
mo
tio
ns
Pri
cin
g
New
Pro
du
ct
Dev
elo
pm
ent
Sal
es
Fo
rce
Dis
trib
uti
on
PR
/
Sp
on
sors
hip
s
General Marketing Metrics Market Share (Units or Dollars)
28%(5) 30%(11) 15%(16) 14%(24) 11%(22) 37%(5) 43%(4) 56%(3) 34%(7) 35%(7) 9%(21)
Awareness (Product
or Brand) 41%(2) 60%(1) 42%(7) 45%(3) 53%(3) 29%(7) 28%(13) 38%(10) 28%(11) 30%(10) 55%(1)
Satisfaction (Product
or Brand) 20%(11) 17%(18) 17%(13) 20%(15) 15%(18) 10%(22) 30%(12) 38%(9) 19%(14) 24%(13) 12%(19)
Likeability (Product
or Brand) 15%(16) 19%(15) 13%(20) 14%(23) 25%(8) 9%(23) 10%(24) 21%(21) 10%(24) 15%(20) 14%(17)
Preference (Product or Brand)
17%(15) 22%(14) 14%(18) 16%(19) 15%(16) 6%(29) 25%(15) 28%(14) 12%(22) 15%(20) 17%(13)
Willingness to
Recommend (Product or Brand)
22%(7) 26%(12) 19%(12) 24%(12) 29%(6) 13%(19) 26%(14) 28%(14) 17%(18) 24%(13) 17%(13)
Loyalty (Product or
Brand) 20%(12) 23%(13) 15%(16) 24%(13) 16%(15) 20%(11) 24%(16) 26%(18) 17%(16) 15%(20) 17%(13)
Perceived Product Quality
22%(8) 16%(19) 13%(21) 18%(17) 18%(14) 17%(15) 38%(7) 36%(11) 21%(13) 26%(12) 18%(12)
Consideration Set 4%(24) 4%(27) 3%(31) 4%(30) 4%(28) 7%(27) 4%(32) 7%(28) 3%(30) 4%(29) 3%(27)
Total Customers 37%(3) 31%(10) 27%(9) 30%(7) 25%(7) 51%(3) 38%(8) 44%(6) 48%(5) 57%(4) 23%(8)
Share of Customer Wallet
13%(18) 8%(25) 9%(23) 10%(25) 3%(29) 20%(11) 22%(18) 23%(20) 16%(20) 13%(24) 5%(24)
Share of Voice 8%(21) 18%(17) 9%(25) 5%(29) 13%(20) 0%(33) 6%(31) 6%(30) 4%(28) 9%(27) 16%(16)
Other Marketing
Metric 5%(23) 4%(27) 5%(28) 7%(27) 4%(27) 9%(23) 8%(26) 6%(30) 4%(28) 2%(32) 4%(26)
No Marketing Metric 12%(20) 12%(24) 5%(27) 9%(26) 15%(16) 13%(19) 8%(26) 8%(27) 17%(18) 11%(25) 20%(11)
General Financial Metrics
Net Profit 28%(6) 13%(23) 14%(18) 20%(15) 5%(26) 44%(4) 61%(1) 49%(5) 28%(11) 48%(5) 3%(27)
Return on Investment
(ROI) 36%(4) 42%(5) 47%(6) 43%(4) 20%(12) 34%(6) 34%(10) 65%(2) 35%(6) 22%(18) 22%(9)
Return on Sales (ROS)
19%(14) 15%(21) 17%(13) 16%(19) 8%(24) 26%(8) 22%(18) 15%(23) 30%(9) 33%(9) 5%(24)
Return on Marketing
Investment (ROMI) 20%(10) 32%(7) 34%(8) 26%(10) 13%(21) 19%(13) 15%(21) 9%(26) 13%(21) 28%(11) 14%(17)
Net Present Value
(NPV) 8%(22) 4%(27) 5%(28) 6%(28) 1%(30) 9%(23) 15%(21) 27%(17) 5%(27) 7%(28) 1%(31)
Economic Value Added (EVA)
4%(25) 3%(31) 3%(31) 2%(31) 1%(30) 1%(31) 8%(26) 13%(24) 3%(30) 4%(29) 1%(32)
Marketing
Expenditures (%
specifically on Brand Building Activities)
21%(9) 48%(2) 27%(10) 21%(14) 23%(10) 9%(23) 13%(23) 12%(25) 11%(23) 24%(13) 27%(7)
Stock Prices / Stock
Returns 1%(27) 0%(33) 0%(33) 0%(33) 0%(33) 1%(31) 3%(33) 1%(32) 1%(33) 0%(33) 0%(33)
Tobin’s q 0%(28) 0%(33) 0%(33) 0%(34) 0%(33) 0%(33) 0%(34) 0%(34) 1%(33) 0%(33) 0%(33)
Target Volume (Units
or Sales) 43%(1) 32%(7) 25%(11) 28%(9) 15%(18) 76%(1) 56%(2) 69%(1) 57%(1) 65%(1) 8%(22)
Customer Segment
Profitability 19%(13) 16%(19) 17%(13) 16%(18) 10%(23) 19%(13) 23%(17) 29%(13) 17%(16) 35%(7) 7%(23)
Customer Lifetime
Value (CLV) 12%(19) 8%(25) 9%(23) 16%(19) 7%(25) 14%(18) 19%(20) 17%(22) 9%(25) 15%(20) 3%(29)
Other Financial Metric
3%(26) 1%(32) 8%(26) 2%(31) 1%(32) 3%(30) 8%(26) 1%(32) 3%(30) 4%(29) 3%(29)
No Financial Metric 14%(17) 13%(22) 10%(22) 15%(22) 32%(5) 11%(21) 8%(26) 7%(28) 9%(25) 11%(25) 28%(6)

45
Table 4. Panel B. Reported Percentage Use and Rank Order of Metrics Specific to Marketing Mix Activities
Tra
dit
ion
al
Ad
ver
tisi
ng
Inte
rnet
A
dv
erti
sin
g
Dir
ect
to
Co
nsu
mer
So
cial
Med
ia
Pri
ce
Pro
mo
tio
ns
Pri
cin
g
New
Pro
du
ct
Dev
elo
pm
ent
Sal
es
Fo
rce
Dis
trib
uti
on
PR
/
Sp
on
sors
hip
s
Specific
Marketing
Metrics
Reach
Click-
through Rate
Number of
Responses
by Campaign
Number of
Followers /
Tags
Trial / Repeat
Volume (or
Ratio)
Relative
Price
Belief in
New Product
Concept
New Customer
Retention
Rate
Strength of Channel
Relation-
ships
Reach
46%(3) 75%(1) 61%(1) 60%(1) 23%(10) 40%(6) 44%(6) 31%(8) 63%(2) 42%(2)
Impressions
Hits/Visits/
Page Views
Reach
Hits/Visits/
Page Views
Reach
Price
Premium
Expected
Annual
Growth Rate
Number of
Responses
by Campaign
Out of Stock
% /
Availability
Volume of
Coverage by
Media
37%(6) 75%(1) 29%(8) 55%(2) 17%(15) 37%(9) 39%(8) 29%(10) 24%(13) 29%(4)
Recall
Impressions
New
Customer Retention
Rate
Volume of Coverage by
Media
Impressions
Reservation
Price
Attitude
toward Product /
Brand
Reach
Product
Category Volume
(PCV)
Recall
18%(16) 51%(5) 25%(11) 23%(10) 16%(17) 10%(24) 36%(11) 18%(15) 20%(19) 11%(20)
Specific
Financial
Metrics
Lead
Generation
Cost per
Click
Lead
Generation
Lead
Generation
Promotional Sales /
Incremental
Lift
Unit Margin
/ Margin %
Expected
Margin %
Sales Funnel
/ Sales
Pipeline
Channel
Margins
Lead
Generation
46%(4) 64%(3) 58%(2) 47%(4) 59%(2) 47%(3) 55%(4) 56%(2) 61%(3) 40%(3)
Cost per
Customer
Acquired / Cost per
Thousand
Impressions (CPM)
Conversion Rate
Conversion Rate
Total Costs
Redemption
Rates
(coupons, etc.)
Price Elasticity
Level of Cannibal-
ization /
Cannibal-ization Rate
Sales Force Productivity
Total
Inventory /
Total Distributors
Total Costs
32%(7) 59%(4) 42%(5) 23%(9) 26%(8) 42%(5) 28%(14) 54%(3) 39%(6) 29%(4)
Internal Rate
of Return
(IRR)
Internal Rate
of Return
(IRR)
Cost per
Customer
Acquired
Cost per
Exposure
Internal Rate
of Return
(IRR)
Optimal
Price
Internal Rate
of Return
(IRR)
Sales
Potential
Forecast
Sales per
Store / Stock-
keeping units
(SKUS)
Cost per
Exposure
4%(27) 4%(30) 36%(6) 20%(12) 7%(27) 33%(11) 24%(19) 54%(3) 24%(13) 21%(10)

46
Table 5. Seemingly Unrelated Regression-Generalized Least Squares Estimation Results
Antecedents of Metric Use
Variable Marketing
Metric Use
Financial
Metric Use
Mktg. – Fin.
Metric Use
Intercept .00*** .00*** .00***
Firm Strategy 1
Market Orientation .17*** .04 .13***
Analyzers .06** .17*** -.11***
Low-Cost Defenders .10*** .18*** -.08***
Differentiated Defenders .04 .07** -.06*
Organizational Involvement .07*** .12*** -.04
Metric Orientation
Metric-Based Compensation .15*** .16*** -.03
Metric Training Level .10*** .11*** .00
Managerial Characteristics
Functional Area (Marketing) .01 -.02 .04
Managerial Level .03 .05 .00
Managerial Experience .02 -.05* .05
Quantitative Background -.04 .07*** -.11***
Firm Characteristics
Firm Size -.05 -.07* .04
Type of Ownership (Public) .09** .12*** -.05
CMO Presence .02 .11*** -.08***
Recent Business Performance (Better) .10*** .09*** -.04
B2C .12*** .08*** .05*
Services -.10*** -.19*** .09***
Environmental Characteristics
Product Life Cycle Stage (Maturity/Declining) -.05* .02 -.05*
Industry Concentration (Concentrated) .11*** .08*** .03
Market Growth -.06* -.04 -.01
Market Turbulence (More Turbulent) .10*** .07*** .05*
Marketing Mix Activity 2
Traditional Advertising .04 .06** -.01
Internet Advertising .10*** .18*** -.04
Direct to Consumer .03 .20*** -.15***
Social Media .05 -.03 .08**
Price Promotions -.08** .08*** -.12***
Pricing .05 .15*** -.10***
New Product Development .14*** .17*** -.02
Sales Force -.02 .18*** -.18***
Distribution -.02 .04* -.08***
Relationship between Metric Use and Marketing Mix Activity Performance
Variable Marketing Mix Activity
Performance
Marketing Mix Activity
Performance
Intercept .00*** .00***
Marketing Metrics .21*** ---
Financial Metrics .15*** ---
Marketing – Financial Metrics --- .00
Model Diagnostics for SUR-GLS System
System Weighted R-Square .21 .08
System Weighted Degrees of Freedom 3796 2541
System Weighted MSE 1.00 1.00
NOTES, *p<.10; **p<.05, ***p<.01; 1 Analyzers, low-cost defenders, and differentiated defenders are compared to prospectors. 2 All marketing mix activities are compared to PR/sponsorships
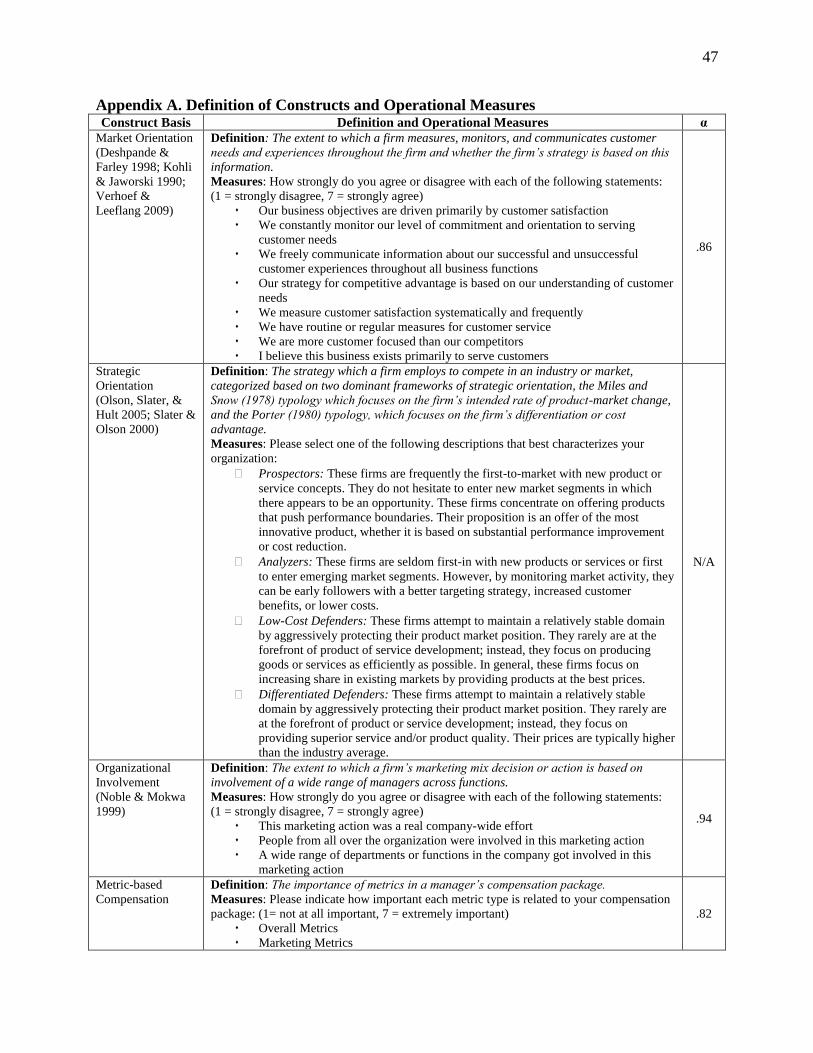
47
Appendix A. Definition of Constructs and Operational Measures Construct Basis Definition and Operational Measures α
Market Orientation
(Deshpande &
Farley 1998; Kohli
& Jaworski 1990;
Verhoef &
Leeflang 2009)
Definition: The extent to which a firm measures, monitors, and communicates customer
needs and experiences throughout the firm and whether the firm’s strategy is based on this
information.
Measures: How strongly do you agree or disagree with each of the following statements:
(1 = strongly disagree, 7 = strongly agree)
Our business objectives are driven primarily by customer satisfaction
We constantly monitor our level of commitment and orientation to serving
customer needs
We freely communicate information about our successful and unsuccessful
customer experiences throughout all business functions
Our strategy for competitive advantage is based on our understanding of customer
needs
We measure customer satisfaction systematically and frequently
We have routine or regular measures for customer service
We are more customer focused than our competitors
I believe this business exists primarily to serve customers
.86
Strategic
Orientation
(Olson, Slater, &
Hult 2005; Slater &
Olson 2000)
Definition: The strategy which a firm employs to compete in an industry or market,
categorized based on two dominant frameworks of strategic orientation, the Miles and
Snow (1978) typology which focuses on the firm’s intended rate of product-market change,
and the Porter (1980) typology, which focuses on the firm’s differentiation or cost
advantage.
Measures: Please select one of the following descriptions that best characterizes your
organization:
Prospectors: These firms are frequently the first-to-market with new product or
service concepts. They do not hesitate to enter new market segments in which
there appears to be an opportunity. These firms concentrate on offering products
that push performance boundaries. Their proposition is an offer of the most
innovative product, whether it is based on substantial performance improvement
or cost reduction.
Analyzers: These firms are seldom first-in with new products or services or first
to enter emerging market segments. However, by monitoring market activity, they
can be early followers with a better targeting strategy, increased customer
benefits, or lower costs.
Low-Cost Defenders: These firms attempt to maintain a relatively stable domain
by aggressively protecting their product market position. They rarely are at the
forefront of product of service development; instead, they focus on producing
goods or services as efficiently as possible. In general, these firms focus on
increasing share in existing markets by providing products at the best prices.
Differentiated Defenders: These firms attempt to maintain a relatively stable
domain by aggressively protecting their product market position. They rarely are
at the forefront of product or service development; instead, they focus on
providing superior service and/or product quality. Their prices are typically higher
than the industry average.
N/A
Organizational
Involvement
(Noble & Mokwa
1999)
Definition: The extent to which a firm’s marketing mix decision or action is based on
involvement of a wide range of managers across functions.
Measures: How strongly do you agree or disagree with each of the following statements:
(1 = strongly disagree, 7 = strongly agree)
This marketing action was a real company-wide effort
People from all over the organization were involved in this marketing action
A wide range of departments or functions in the company got involved in this
marketing action
.94
Metric-based
Compensation
Definition: The importance of metrics in a manager’s compensation package.
Measures: Please indicate how important each metric type is related to your compensation
package: (1= not at all important, 7 = extremely important)
Overall Metrics
Marketing Metrics
.82

48
Financial Metrics
Metric-based
Training
Definition: A manager’s level of training on the use of metrics.
Measures: Please indicate your level of training with metrics (can be through work or
educational experiences): (1= much less than average amount of training, 7 = much more
than average amount of training)
Overall Metrics
Marketing Metrics
Financial Metrics
.94
Functional Area
and Managerial
Level
(Finkelstein,
Hambrick, &
Cannella 2009)
Definition: (Functional Area) Whether a manager works in the marketing department;
(Managerial Level) Whether a manager is (a) VP-level or higher (e.g., SVP, C-level or
Owner) or (b) lower than VP-level (e.g., Director, Manager).
Measures: Please indicate your job title:
CEO/Owner, CMO, C-Level (Other than Marketing), SVP/VP of Marketing, SVP/VP
Sales, SVP/VP (Other than Marketing and Sales), Director of Marketing, Director of Sales,
Brand Manager, Marketing Manager, Product Manager, Sales Manager, Other (Please list)
N/A
Managerial
Experience
Definition: A manager’s experience in number of years as a manager, at the firm, and in
the current position.
Measures: How many years of managerial experience do you have?
How many years have you been working for this company?
How many years have you been working at your current position?
.68
Quantitative
Background
Definition: A manager’s qualitative/quantitative orientation based on education and work
experience.
Measures: Please rate your qualitative/quantitative background: (1 = entirely qualitative, 7
= entirely quantitative)
Overall orientation
Educational Background
Work Experience Background
.85
Firm Size Definition: The number of full-time employees in a firm.
Measure: Approximately how many full-time employees does your firm have? N/A
Type of Ownership
(Verhoef &
Leeflang 2009)
Definition: Whether a firm is publicly traded or privately held.
Measure: Is your firm publicly traded? N/A
CMO Presence Definition: Whether a firm employs a Chief Marketing Officer (CMO).
Measure: Does your firm employ a Chief Marketing Officer (CMO)? N/A
Recent Business
Performance
(Jaworski & Kohli
1993)
Definition: A business unit’s overall performance last year, relative to its own
expectations and its competitors’ performance.
Measures: To what extent did the overall performance of the business unit meet
expectations last year: (1= poor, 7=excellent)
To what extent did the overall performance of your business unit relative to your major
competitors meet expectations last year: (1= poor, 7=excellent)
.84
B2B vs. B2C
(Verhoef &
Leeflang 2009)
Definition: The extent to which a manager’s sales come from B2B or B2C markets.
Measure: Please indicate the extent to which your sales come from B2B or B2C markets:
(1 = mostly B2B, 7 = mostly B2C)
N/A
Goods vs. Services
(Verhoef &
Leeflang 2009)
Definition: The extent to which a manager’s sales come from goods or services markets.
Measure: Please indicate the extent to which your sales come from goods or services
markets: (1 = mostly goods, 7 = mostly services)
N/A
Product Life Cycle
(Deshpande &
Zaltman 1982)
Definition: The stage of the product life cycle.
Measure: At which one of the following stages would you place your product? (shown in a
product life cycle diagram, introductory, growth, maturity, decline)
N/A
Industry
Concentration
(Kuester,
Homburg, &
Robertson 1999)
Definition: The percentage of sales the four largest businesses competing in a market
control.
Measure: Approximately what percentage of sales does the largest 4 competing businesses
in your market control?
0-50%, 51-100%
N/A
Market Growth
(Homburg,
Workman, &
Krohmer 1999)
Definition: The average annual growth or decline of the company and the industry over
the last three years.
Measure: Over the last three years, what was the average annual market growth or decline
for your company?
.66

49
Over the last three years, what was the average annual market growth or decline for your
industry?
Market Turbulence
(Miller, Burke, &
Glick 1998)
Definition: The rate at which products or services become obsolete, the ease of forecasting
consumer preferences, and how often a firm needs to change its marketing and
production/service technology to keep up with competitors and/or consumer preferences.
Measures: How strongly do you agree or disagree with each of the following statements
(1 = strongly disagree, 7 = strongly agree): ® = reverse scored
Products/services become obsolete very slowly in your firm’s principal industry
®
Your firm seldom needs to change its marketing practices to keep up with
competitors ®
Consumer demand and preferences are very easy to forecast in your firm’s
principal industry ®
Your firm must frequently change its production/service technology to keep up
with competitors and/or consumer preferences
.63
Marketing Mix
Decision (Menon et
al. 1999)
Definition: A major marketing mix decision undertaken not so recently that performance
evaluation is premature and not so long ago that memory of the decision and its
performance is fuzzy.
Measures: Please indicate which types of major marketing decisions you have undertaken
(or implemented) that (1) were not so recent that performance evaluation is premature and
(2) not so long ago that memory about the decision and performance is fuzzy:
Traditional Advertising (i.e., TV, Magazine, Radio, etc.), Internet Advertising
(i.e., Banner Ads, Display Ads, SEO, etc.), Direct to Consumer (i.e., Emails,
CRM, Direct mail, etc.), Social Media (i.e., Twitter, Facebook, MySpace, etc.),
Price Promotions, Pricing, New Product Development, Sales Force, Distribution,
PR/Sponsorships
N/A
Marketing and
Financial Metrics
Used (Partial list:
Ambler 2003;
Barwise & Farley
2003; Farris et al.
2010; Hoffman &
Fodor 2010;
Lehmann &
Reibstein 2006;
Pauwels et al.
2009)
Marketing Metric Definition: Marketing Metrics are based on a customer or marketing
mind set. A metric is defined to be used in a marketing mix decision if a manager employed
the metric as a decision aid when making the marketing mix decision.
Financial Metric Definition: Financial metrics are either monetary based, based on
financial ratios, or readily converted to monetary outcomes.
Measure: Please indicate if you used any of the following MARKETING or FINANCIAL
metrics when making your marketing mix decision:
See Table 1 for 12 general marketing and 12 general financial metrics which were listed for
each of 10 marketing mix decisions.
In addition, see Table 1 for 3 specific marketing metrics and 3 specific financial metrics
listed for each of 10 specific marketing mix decisions.
N/A
Marketing Mix
Activity
Performance
(Jaworski & Kohli
1993; Moorman &
Rust 1999; Verhoef
& Leeflang 2009)
Definition: The performance of a marketing mix activity is defined based on a firm’s
stated marketing, financial, and overall outcomes, relative to a firm’s stated objectives
and to similar prior decisions. Measures: Relative to your firm’s stated objectives, how is the last major marketing
activity undertaken performing overall? (Jaworski and Kohli 1993)
(1=much worse, 7=much better)
Relative to similar prior marketing activities you've undertaken, how is the last major
marketing activity undertaken performing? (Jaworski and Kohli 1993)
(1=much worse, 7=much better; N/A if unsure or never undertook activity)
Relative to your firm’s stated objectives, how is the last major marketing activity
undertaken performing on: (1=much worse, and, 7=much better; N/A if unsure)
Customer satisfaction (Moorman and Rust 1999; Verhoef and Leeflang 2009)
Profitability (Moorman and Rust 1999; Verhoef and Leeflang 2009)
Customer loyalty (Verhoef and Leeflang 2009)
Sales (Moorman and Rust 1999)
Market share (Moorman and Rust 1999; Verhoef and Leeflang 2009)
ROI (Moorman and Rust 1999)
.94

50
Appendix B. Correlation Matrix
Mrk
t. O
r.
An
aly
zer
Lo
w-C
ost
Dif
f. D
ef.
Org
. In
vo
l.
Met
. C
om
p.
Met
. T
rain
.
Fu
n.
Are
a
Mg
r. L
evel
Wo
rk E
xp
.
Qu
anti
tati
ve
Fir
m S
ize
Ow
ner
.
CM
O
Rec
. P
erf.
B2C
Ser
vic
es
Lif
e C
ycl
e
Ind
. C
on
c.
Mrk
t. G
row
th
Mrk
t. T
urb
.
Tra
d. A
dv
.
Int.
Adv
D2
C
So
c. M
edia
Pri
ce P
rom
o.
Pri
cin
g
NP
D
Sal
es F
orc
e
Dis
trib
uti
on
Mrk
t. M
etri
cs
Fin
. M
etri
cs
Per
form
ance
Mrkt. Or. 1.00
Analyzer .03 1.00
Low-Cost -.21 -.20 1.00
Diff. Def. -.04 -.41 -.27 1.00
Org. Invol. .16 .01 -.08 -.09 1.00
Met. Comp. .19 .08 -.09 -.13 .27 1.00
Met. Train. .17 -.01 -.06 -.12 .23 .33 1.00
Fun. Area -.09 -.09 -.01 .03 -.04 -.09 -.03 1.00
Mgr. Level .03 .07 -.14 -.02 .08 .13 .08 -.53 1.00
Work Exp. .13 .09 -.04 .01 .11 .11 .03 -.29 .39 1.00
Quantitative -.03 .13 -.03 -.13 .08 .16 .31 -.12 .16 .09 1.00
Firm Size -.14 .04 -.06 .07 -.02 .03 .10 .27 -.23 -.12 .12 1.00
Owner. -.15 .08 .00 -.03 .06 .05 .15 .14 -.11 -.03 .14 .66 1.00
CMO -.06 .09 -.02 -.06 .04 .07 .04 .06 .04 .13 .05 .21 .14 1.00
Rec. Perf. .30 .05 -.11 .00 .02 .03 .07 .11 -.08 -.05 -.01 .17 .02 -.02 1.00
B2C .06 .07 .10 -.10 .08 .03 .05 .05 -.01 .00 .08 .10 -.03 .07 .03 1.00
Services .11 .01 .09 .07 -.05 -.17 -.09 .04 .00 .03 -.14 -.17 -.19 .02 -.06 .04 1.00
Life Cycle -.16 .10 .00 .19 -.09 -.07 -.02 -.03 .01 .17 .07 .21 .15 .02 -.12 .06 .06 1.00
Ind. Conc. -.09 -.06 -.04 -.01 -.03 .03 .07 .02 -.05 .01 .03 .12 .12 .03 .04 -.17 -.23 -.04 1.00
Mrkt. Growth .06 -.04 -.04 -.13 .08 .12 .06 .00 -.01 -.14 .01 .01 .04 .04 .37 -.03 -.21 -.34 .17 1.00
Mrkt. Turb. .02 .15 .03 -.25 .11 .18 .14 -.02 .03 .05 .06 -.01 .10 .13 .02 .06 .01 -.05 -.05 -.03 1.00
Trad. Adv. .00 .02 .03 .00 -.05 -.02 .00 .06 -.05 .01 -.01 .02 -.05 -.02 .00 .11 .02 .03 -.02 -.07 .00 1.00
Int. Adv. -.01 .01 .00 -.01 -.13 -.03 -.02 .02 .00 -.03 .00 -.03 -.04 -.01 .03 .02 .01 -.02 -.04 .02 -.01 -.12 1.00
D2C .04 -.02 .01 .02 -.01 -.01 -.03 .04 -.06 -.04 -.04 -.01 -.02 -.03 -.03 .05 .10 .00 -.06 -.06 -.02 -.15 -.16 1.00
Soc. Media .05 .01 .00 -.01 -.05 -.02 -.02 .00 .00 -.02 -.02 -.12 -.12 -.02 -.01 -.02 .07 -.04 -.04 -.04 .04 -.12 -.13 -.16 1.00
Price Promo. -.05 -.01 -.01 .02 .04 .02 .01 -.03 .02 -.02 .04 .05 .04 .04 .00 .01 -.12 .03 .04 .04 .04 -.08 -.09 -.11 -.08 1.00
Pricing -.01 .01 -.02 -.01 .03 .03 .04 -.02 .05 .01 .03 .03 .07 .00 -.01 -.01 -.08 .06 .05 .01 -.03 -.10 -.11 -.13 -.10 -.07 1.00
NPD -.04 .00 .02 -.05 .20 .04 .07 -.04 .05 .05 .06 .04 .11 .00 -.03 -.04 -.10 -.01 .08 .06 .03 -.12 -.13 -.16 -.12 -.09 -.11 1.00
Sales Force -.01 -.01 -.02 -.02 .05 .05 .02 -.09 .05 .05 .03 .02 .04 .04 -.01 -.06 -.01 -.03 .02 .06 -.02 -.11 -.12 -.15 -.12 -.08 -.10 -.12 1.00
Distribution -.01 .04 .01 -.02 .00 .05 .06 -.03 -.01 .03 .05 .02 .08 .01 .04 -.03 -.11 .00 .05 .06 -.01 -.07 -.07 -.09 -.07 -.05 -.06 -.07 -.06 1.00
Mrkt. Metrics .19 .06 .04 -.12 .17 .26 .25 -.05 .07 .07 .07 .00 .06 .06 .09 .13 -.12 -.07 .10 .06 .16 .02 .05 -.03 .01 -.07 .03 .14 -.06 -.01 1.00
Fin. Metrics .04 .13 .07 -.14 .21 .33 .30 -.08 .10 .07 .22 .07 .18 .14 .07 .10 -.25 .00 .11 .10 .13 -.03 .02 .03 -.17 .03 .10 .14 .08 .04 .54 1.00
Performance .17 .08 .00 -.09 .28 .15 .17 -.01 -.04 .05 .06 .10 .07 .03 .28 .07 -.09 -.10 .00 .16 .06 -.11 -.02 .00 -.01 .01 .04 .07 .04 .04 .21 .19 1.00
Related Documents