1 CSAE WPS/2007-14 What can Teachers do to Raise Pupil Achievement? By Monazza Aslam * and Geeta Kingdon Department of Economics University of Oxford June 2007 Abstract Improving weak teaching may be one of the most effective means of raising pupil achievement. However, teachers classroom practices and the teaching process may matter more to student learning than teachers observed rØsumØ characteristics (such as certification and experience). There may also be important differences in teacher characteristics across government and private schools which may help explain the large documented public-private achievement differences often found in studies. This paper delves into the black-box representing teaching to uncover the teacher characteristics and teaching practices that matter most to pupil achievement. This is done using unique, school-based data, collected in 2002-2003 from government and private schools from one district in Punjab province in Pakistan. The data allow exploitation of an identification strategy that permits the matching of students test scores in language and mathematics to the characteristics of teachers that teach those subjects. Within pupil (across subject rather than across time) variation is used to examine whether the characteristics of different subject teachers are related to a students mark across subjects. The data is also unique in asking all subject teachers questions pertaining to their teaching practices and these, often unobserved, process variables are included in achievement function estimates. Our pupil fixed-effects findings reveal that the standard rØsumØ characteristics of teachers do not significantly matter to pupil achievement. Perversely, however, teachers are found to be rewarded for possessing these characteristics highlighting the highly inefficient nature of teacher pay schedules. Our findings also show that teaching process variables matter significantly to student achievement. There are important differences across school-types. *Corresponding Author: Department of Economics, University of Oxford, Manor Road, Oxford, OX1 3UQ, United Kingdom, Telephone: +44-1865-271089. Email: [email protected] JEL Classification: I21 Keywords: teacher characteristics, pupil fixed-effects achievement, government and private middle- schools, Pakistan

Welcome message from author
This document is posted to help you gain knowledge. Please leave a comment to let me know what you think about it! Share it to your friends and learn new things together.
Transcript
1
CSAE WPS/2007-14
What can Teachers do to Raise Pupil Achievement? By
Monazza Aslam* and Geeta Kingdon
Department of Economics University of Oxford
June 2007
Abstract
Improving weak teaching may be one of the most effective means of raising pupil achievement. However, teachers� classroom practices and the teaching �process� may matter more to student learning than teachers� observed résumé characteristics (such as certification and experience). There may also be important differences in teacher characteristics across government and private schools which may help explain the large documented public-private achievement differences often found in studies. This paper delves into the black-box representing �teaching� to uncover the teacher characteristics and teaching practices that matter most to pupil achievement. This is done using unique, school-based data, collected in 2002-2003 from government and private schools from one district in Punjab province in Pakistan. The data allow exploitation of an identification strategy that permits the matching of students� test scores in language and mathematics to the characteristics of teachers that teach those subjects. Within pupil (across subject rather than across time) variation is used to examine whether the characteristics of different subject teachers are related to a students� mark across subjects. The data is also unique in asking all subject teachers questions pertaining to their teaching practices and these, often unobserved, �process� variables are included in achievement function estimates. Our pupil fixed-effects findings reveal that the standard résumé characteristics of teachers do not significantly matter to pupil achievement. Perversely, however, teachers are found to be rewarded for possessing these characteristics highlighting the highly inefficient nature of teacher pay schedules. Our findings also show that teaching �process� variables matter significantly to student achievement. There are important differences across school-types.
*Corresponding Author: Department of Economics, University of Oxford, Manor Road, Oxford, OX1 3UQ, United Kingdom, Telephone: +44-1865-271089. Email: [email protected]
JEL Classification: I21
Keywords: teacher characteristics, pupil fixed-effects achievement, government and private middle-schools, Pakistan
2
1. Introduction
Identification of the characteristics and practices of teachers that contribute most towards
improving pupil achievement has often eluded researchers even though the most effective means of
improving school quality may be through addressing weak teaching (Glewwe and Kremer, 2006, pp.
995). The objective of this paper is to delve into the black-box representing �teaching� to uncover the
teacher characteristics and teaching practices that matter most to pupil achievement.
Past literature probing teacher quality has adopted one of two approaches. In the first, an
educational production function links measurable teacher characteristics to pupil achievement,
controlling for student characteristics. The methodologies adopted in this approach vary, from IV
approaches (Hoxby, 1996; Kingdon and Teal, 2007; Sprietsma and Waltenberg, 2005) to panel data
studies (Clotfelter, Ladd and Vigdor, 2006; Hanushek, 2005), to randomized experiment studies
(Lavy, 2002; Glewwe and Kremer, 2006). The consensus from this wide array of studies is that many
of the standard teacher characteristics such as certification, training and experience do not matter to
pupil achievement (Hanushek and Rivkin, 2006). As these resumè characteristics often underpin
teacher compensation policies, these findings are controversial and widely debated.
A second approach calculates �teacher quality� as a teacher fixed effect in an equation of student
achievement gain where different groups of students (in a given year or over time) are taught by the
same teacher. The resulting �total teacher effect� enables the researcher to define a good teacher as
one who consistently produces high achievement growth for pupils. This approach, in estimating total
teacher effects, does not require identification of specific teacher characteristics that generate student
learning. A number of studies have used this approach (Aaronson, Barrow and Sander, 2003; Rockoff,
2004; Rivkin, Hanushek and Kain, 2005; and Hanushek, Kain, O� Brien and Rivkin, 2005) and they
conclude that teacher quality matters substantially to pupil achievement. However, when they regress
this teacher fixed effect on teachers� observed characteristics, their findings are consistent with those
from the more direct achievement production function approach: observable characteristics such as
certification and training explain little of the variation in teacher quality.
3
This study takes the direct approach linking teacher characteristics to student outcomes in an
achievement production function, but with two innovations. Firstly, we use a methodology that
overcomes the biases associated with the non-random matching of students to schools and, within
schools, to teachers. Secondly, we also test the importance of classroom practices and teaching
techniques rather than confining attention only to teachers� resumè characteristics i.e. qualifications,
experience and training.
The key empirical challenge in identifying teacher effects arises due to the potential non-random
matching of students to schools and, within schools, to particular teachers. For instance, if higher-
ability students sort into classes with better qualified/trained/experienced teachers within their grade
or if teachers possessing these characteristics are systematically assigned to teach the classes with
higher performing pupils, a positive coefficient on a given teacher characteristic could not be
interpreted as causal. Our approach to address such endogeneity is to estimate a pupil fixed effects
equation of achievement using cross-section data. Across subject rather than across time differencing
is used. The idea is exactly the same as in panel data estimates of the achievement production function
but we will show below that our approach is superior to the panel data approach both
methodologically and in terms of cost-effectiveness. Apart from Kingdon (2006), the studies adopting
this technique use data from the US or Europe and look exclusively at teacher gender effects on pupil
achievement (Dee, 2005; Holmlund and Sund, 2005; and Ammermǖller and Dolton, 2007).Kingdon
(1996) for India is the only study to our knowledge that applies this empirical methodology to study
the effect of wider teacher characteristics.
The second innovation in this paper is to test the importance of (typically unobserved)
teaching �process� variables in determining pupil achievement rather than only of observed teacher
education, experience or training. If unobserved teaching methods are correlated with both observed
teacher characteristics and pupil achievement, included teacher characteristics variables suffer omitted
variable bias. The inclusion of measures of teaching methods should mitigate such bias. We are
fortunate to have data on measures of various important aspects of the class teaching process.
4
Finally, it should not be presumed that the achievement production function is a universal
constant, applicable to all school types and all settings. The way in which teacher characteristics or
teaching practices affect student learning may differ across school types. In particular, private and
public schools operate under very different sets of incentives. Pakistan has a large and growing
private schooling sector which experienced an almost 800 per cent increase at all education levels in
the past few decades (Aslam 2007a; Andrabi, Das and Khwaja 2006). We will ask whether the pupil
fixed effects achievement production function differs in public and private school systems.
The paper proceeds as follows. Section 2 discusses the data while section 3 explains the pupil
fixed-effects methodology. Section 4 analyses the key results. Section 5 extends the analysis by
looking at differences in teacher characteristics across the government and private sector while section
6 estimates teacher pay schedules. Section 7 concludes.
2. Data
The data for this study come from a purpose-built school-based survey conducted by one of the
authors in Lahore district in Punjab province, Pakistan in 2002-2003. Using stratified random
sampling on 65 schools (25 government and 40 private) in urban and rural Lahore, the survey
collected detailed information on 1887 pupils in any one section of grade 8 in each sample school.
Each pupil filled out a questionnaire with questions on personal characteristics (age, motivation1,
gender etc.), parental and family background (parental education and occupation, family structure and
size, wealth and income etc.), and schooling (books prescribed in school, length of the school week,
family expenditure on schooling in the past year, hours of home tuition taken etc.). Each child was
also weighed and his/her height and arm circumference measured. In addition, the Raven�s Standard
1 In most studies, motivation or child�s educational aspirations are not controlled for. In our purpose designed study, special care was taken to obtain a measure, albeit not a perfect one, to capture child motivation. We asked the child the question: �What is the highest level of education you wish to attain?� with all possible educational levels (such as Middle school or up to 8th grade, Matric or grade 10 etc.) as answer choices.
5
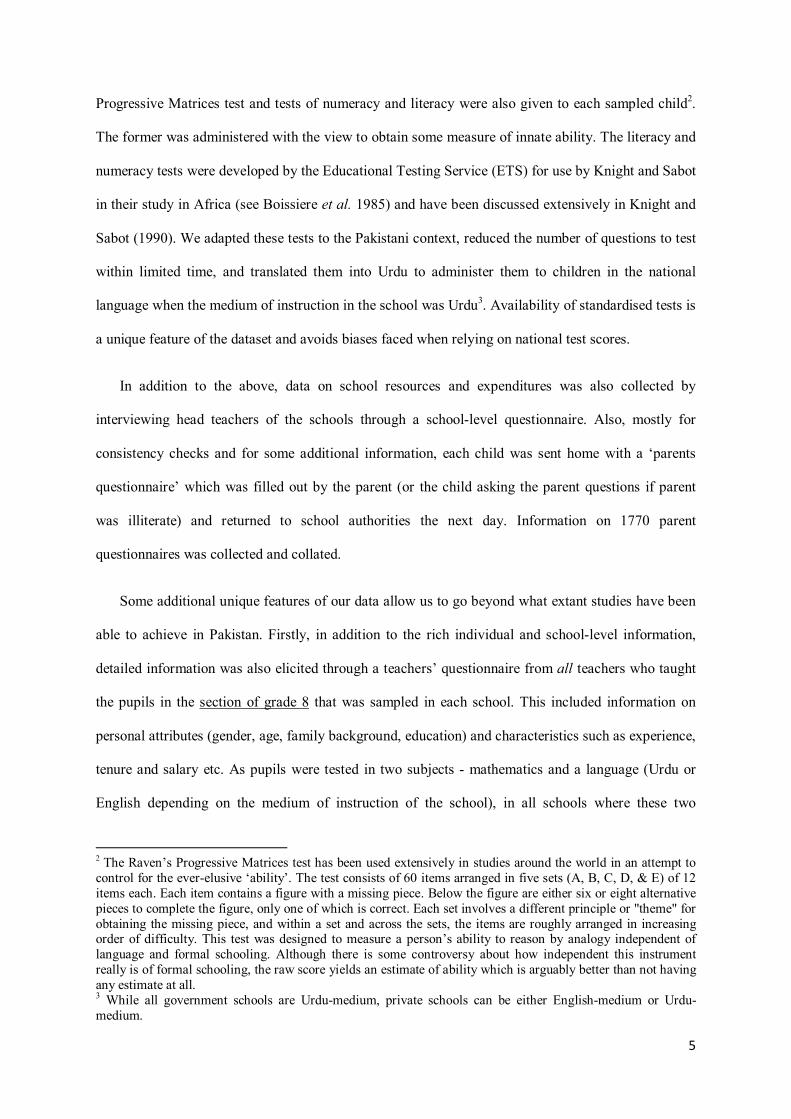
Progressive Matrices test and tests of numeracy and literacy were also given to each sampled child2.
The former was administered with the view to obtain some measure of innate ability. The literacy and
numeracy tests were developed by the Educational Testing Service (ETS) for use by Knight and Sabot
in their study in Africa (see Boissiere et al. 1985) and have been discussed extensively in Knight and
Sabot (1990). We adapted these tests to the Pakistani context, reduced the number of questions to test
within limited time, and translated them into Urdu to administer them to children in the national
language when the medium of instruction in the school was Urdu3. Availability of standardised tests is
a unique feature of the dataset and avoids biases faced when relying on national test scores.
In addition to the above, data on school resources and expenditures was also collected by
interviewing head teachers of the schools through a school-level questionnaire. Also, mostly for
consistency checks and for some additional information, each child was sent home with a �parents
questionnaire� which was filled out by the parent (or the child asking the parent questions if parent
was illiterate) and returned to school authorities the next day. Information on 1770 parent
questionnaires was collected and collated.
Some additional unique features of our data allow us to go beyond what extant studies have been
able to achieve in Pakistan. Firstly, in addition to the rich individual and school-level information,
detailed information was also elicited through a teachers� questionnaire from all teachers who taught
the pupils in the section of grade 8 that was sampled in each school. This included information on
personal attributes (gender, age, family background, education) and characteristics such as experience,
tenure and salary etc. As pupils were tested in two subjects - mathematics and a language (Urdu or
English depending on the medium of instruction of the school), in all schools where these two
2 The Raven�s Progressive Matrices test has been used extensively in studies around the world in an attempt to control for the ever-elusive �ability�. The test consists of 60 items arranged in five sets (A, B, C, D, & E) of 12 items each. Each item contains a figure with a missing piece. Below the figure are either six or eight alternative pieces to complete the figure, only one of which is correct. Each set involves a different principle or "theme" for obtaining the missing piece, and within a set and across the sets, the items are roughly arranged in increasing order of difficulty. This test was designed to measure a person�s ability to reason by analogy independent of language and formal schooling. Although there is some controversy about how independent this instrument really is of formal schooling, the raw score yields an estimate of ability which is arguably better than not having any estimate at all. 3 While all government schools are Urdu-medium, private schools can be either English-medium or Urdu-medium.
6
subjects are taught by different teachers, for each student-subject row corresponding information on
the subject�s teacher is available. This allows exploitation of an identification strategy which
effectively controls for all subject invariant student unobservables.
The second rare quality of the dataset is that in addition to the standard teacher characteristics,
information about �teaching methods and techniques� was also obtained. This was done by asking
each sampled teacher to answer a series of questions such as those recording the minutes/week spent
on average in giving �surprise tests� or quizzes, maintaining discipline and order, writing material on
the blackboard and reviewing homework given to the students previously. Teachers also noted
whether they used lesson-plans, asked students� frequent questions and read out aloud from notes or
text books etc while teaching to the sampled pupils in grade 8. These �process� variables provide some
insight into teacher �unobservables� that affect student achievement. This is because unobserved
teacher-effort or motivation is captured (albeit imperfectly) through some of these variables. For
example, more effective or motivated teachers may plan their lessons in advance, spend more time
quizzing their pupils and be more interactive by involving students during lessons by asking
questions. Finally, we also tested all the sample teachers in a small test of English. Their test scores
present additional measures of the potential �quality� of teaching they provide to the students they
teach4.
Although information was collected on 1887 pupils and 339 teachers from 65 schools, achieving
identification of teacher effects through pupil fixed-effects entails matching each student subject-row
to the characteristics of the teacher teaching that subject. As students were tested in two subjects -
mathematics and language � the characteristics of these two subjects� teachers are most relevant. All
other subject teachers (such as those teaching Islamiyat, History, Geography, Science etc.) are
dropped from the sample. Moreover, in 13 of the sampled schools we find the same teacher teaching
both language and mathematics and these schools are dropped from the sample as there is no variation
in teacher characteristics across student subject-rows5. Finally, among the sampled schools,
4 The English test consisted of 6 questions. However, one question was deleted during data entry. 5 Because we rely on within school estimation, sample selectivity is not important.
7
information on mathematics teacher characteristics was missing for 2 schools and these were also
dropped from the sample. This effectively leaves us with 50 schools (34 private and 16 government),
100 teachers (2 teachers per school) and 1410 pupils. The final data set constitutes 2820 observations,
with each pupil represented twice � one row for mathematics matching the math teacher
characteristics to the individual, and another for language matching the language teacher�s
characteristics to the student6.
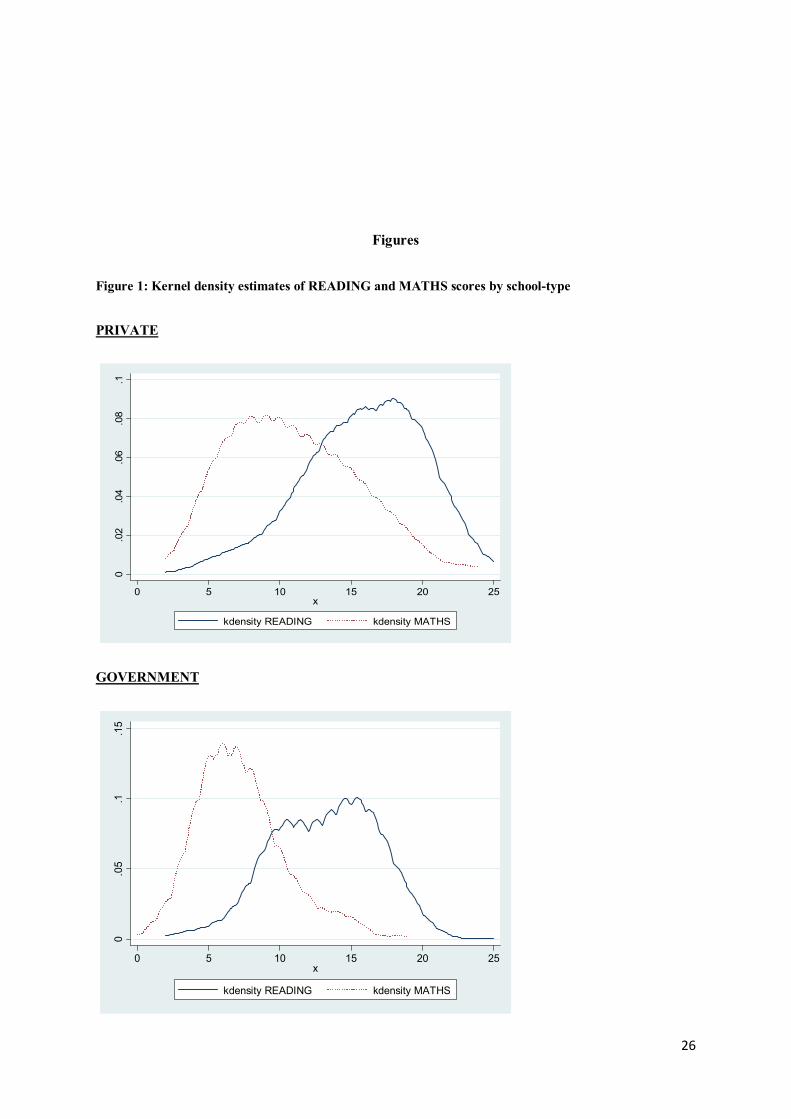
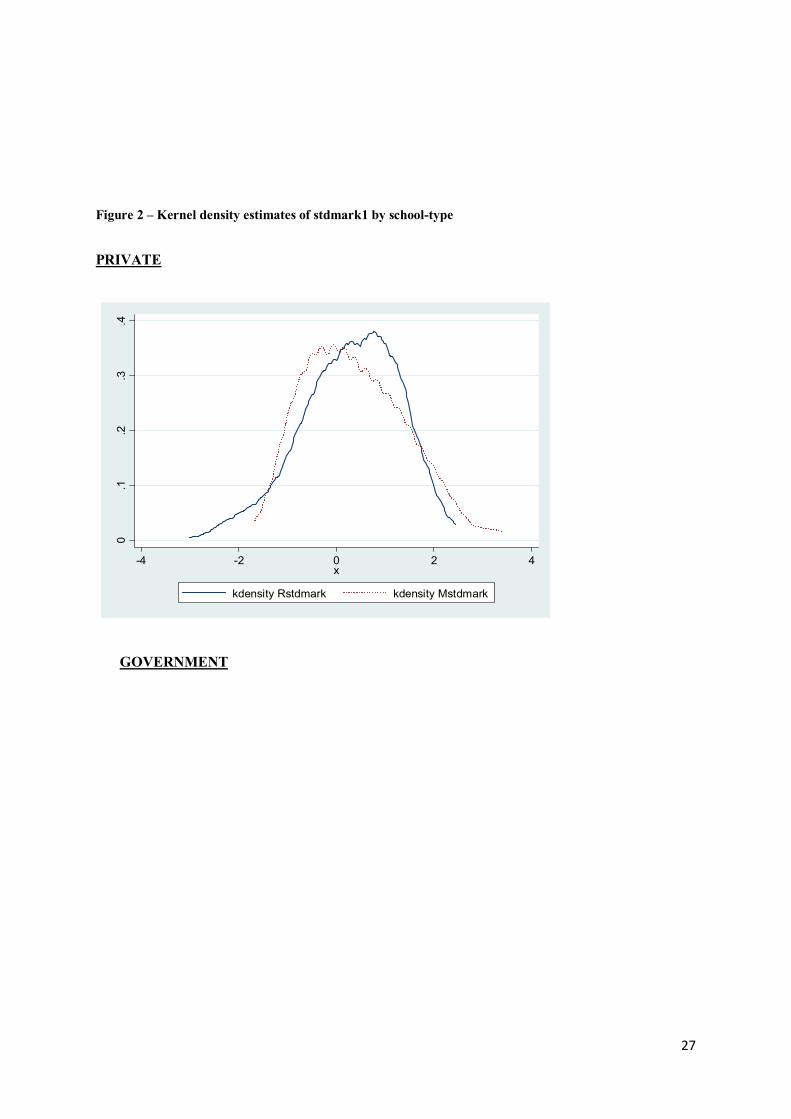
The dependent variable of interest is pupil achievement. We tested students of grade 8 in two
subjects (mathematics and language). Each test was composed of 25 questions. When we plot the
Epanechnikov kernel densities of marks in the two subjects across the two school types, their
distributions differ considerably (Figure 1). To render the marks in these two subjects comparable, we
compute z-scores by subtracting the overall mean of the score in that subject from the student�s actual
score and dividing by the standard deviation of the score in that subject. The z-scores of the two
subjects� marks are then used as the dependent variables and, by construction, have mean 0 and
standard deviation 1. The distribution of the z-scores is similar across the two subjects (Figure 2).
3. Methodology
The methodology used in this paper mirrors Kingdon�s (2006) approach. Some of the
fundamental methodological issues surrounding pupil fixed-effects estimation and a key innovation
using the Pakistan data are summarised here.
This paper adopts the direct approach linking teacher characteristics to student achievement
within an achievement production function framework:
Aik = α + βXik + δSk + μi + ηk (1)
where Aik denotes the achievement of the ith pupil in the kth school and is determined by a vector of
personal (individual and family-level) characteristics (X) and school and teacher characteristics (S).
6 In 3 of the sample schools, we found more than one teacher teaching any one subject. These were English-medium private schools and in all instances the language (English) was taught by two teachers instead of one. In these 3 schools we averaged the characteristics of the language teacher and ascribed them to the pupil.
8
The individual and school-level unobservables are denoted by μi and ηk respectively. Typically, at
best, data sets have information about the average characteristics of a teacher (i.e. in the vector S, the
teacher variables have a k subscript) and achievement production functions estimated using average
teacher characteristics are �across-school� rather than �within-school� estimations as there is no
variation in the teacher characteristics within a school.
The availability of data on teacher characteristics by subject for pupils in grade 8 allows us to
exploit the variation in characteristics and adopt a within-student approach to achievement function
estimation. A pupil fixed-effects achievement function can thus be estimated as follows:
Aijk = α + βXik + γTjk + δSk + (μij + εjk + ηjk) (2)
where Aijk is the achievement of the ith student in the jth subject in the kth school. X is, as before, a
vector of personal characteristics of the ith pupil in school k, T is a vector of the jth subject-teacher
characteristics in school k and S is the vector of school-level variables determining student
achievement. The composite error term now represents the unobserved characteristics of the student
(μij), the teacher (εjk) and the school (ηk). The pupil fixed-effects model for the case of the two subjects
means the differenced version of the achievement function can be written as:
AiMATHk - AiLANGk = γ(TMATHk � TLANGk) + (μiMATH - μiLANG)+ (εMATHk � εLANGk) + (ηMATHk � ηLANGk) (3)
where only the teacher characteristics are retained in the final estimation (and individual and school-
level variables are dropped) as only these vary within a pupil in a given school. If one believes that
school and individual unobservables are not subject-specific (i.e. they do not have a j subscript),
equation (3) can be re-written as:
AiMATH - AiLANG = γ(TMATH � TLANG) + (εMATH � εLANG) (4)
and regressing differences in pupil�s test scores across the two subjects on differences in teacher
characteristics controls for the unobserved student (individual and family-level) variables.
9
There are, however, two important caveats to estimating pupil fixed-effects models as in (4).
Firstly, if student ability is not subject invariant, (μiMATH - μiLANG) will be in the error term and, if
correlated with any of the teacher characteristics included in (4), could generate an omitted variable
bias. Non-random matching of pupils to particular teachers within the school on the basis of
unobserved characteristics is, however, not a problem in our data set as we restrict our analysis to one
section of grade 8 that is taught a subject by any one teacher within the school. This problem of non-
random matching could have arisen if the 8th grade pupils from any one section within the school
could either have chosen to be taught by a certain teacher (say brighter students choose abler teachers)
or if school policy deliberately matched pupils of a certain ability in our sampled section to certain
teachers. In our sample, all students in a given subject are taught by a single teacher and in the very
few instances where more than one teacher teaches the pupils, all pupils are additionally taught by
those teachers whose characteristics we average across the subject.
The second caveat to estimating (4) is that teacher unobservables in (εMATH � εLANG) may be
correlated both with included teacher characteristics and student achievement and this may still bias
the parameter estimates of the vector of observed teacher characteristics. For instance, researchers
cannot often observe teacher �effort�, motivation or ability. These unobservables, residing in the error
term will potentially determine pupil achievement (for instance if greater teacher effort generates
higher achievement). If more educated, experienced or trained teachers are also more motivated or
able, or put more �effort� into teaching (by using certain techniques for instance), E(TMATH �
TLANG)(εMATH � εLANG) ≠ 0 and this violates a basic estimation condition and even pupil fixed-effects
estimation does not permit interpretation of teacher characteristics as causal. However, biases
associated with this source of endogeneity may be somewhat reduced in this paper through the
inclusion of �process-type� variables. Consider the following: suppose people with higher motivation
also have higher education levels, i.e. teacher education and motivation are positively correlated, and
more motivated teachers put in greater effort in teaching by planning lessons, quizzing students
frequently and adopting a �participatory� approach by asking many questions while teaching. By
including these process-type variables (which may be correlated with unobserved teacher effort,
10
ability and motivation), we may be able to reduce, even if not completely eliminate, some of the
biases generated with this source of endogeneity.
Altonji, Elder and Taber (2005) suggest that the size of correlation between observable
characteristics can give an idea of the extent of correlation between the unobservables. We examined
the correlation in observed teacher characteristics across the two subjects and found that in case of
some teacher characteristics there was indeed systematic correlation. Consequently, we cannot
confidently interpret the coefficients on teacher variables as free of endogeneity bias.
4. Discussion of results � peeking into the black-box of the achievement function
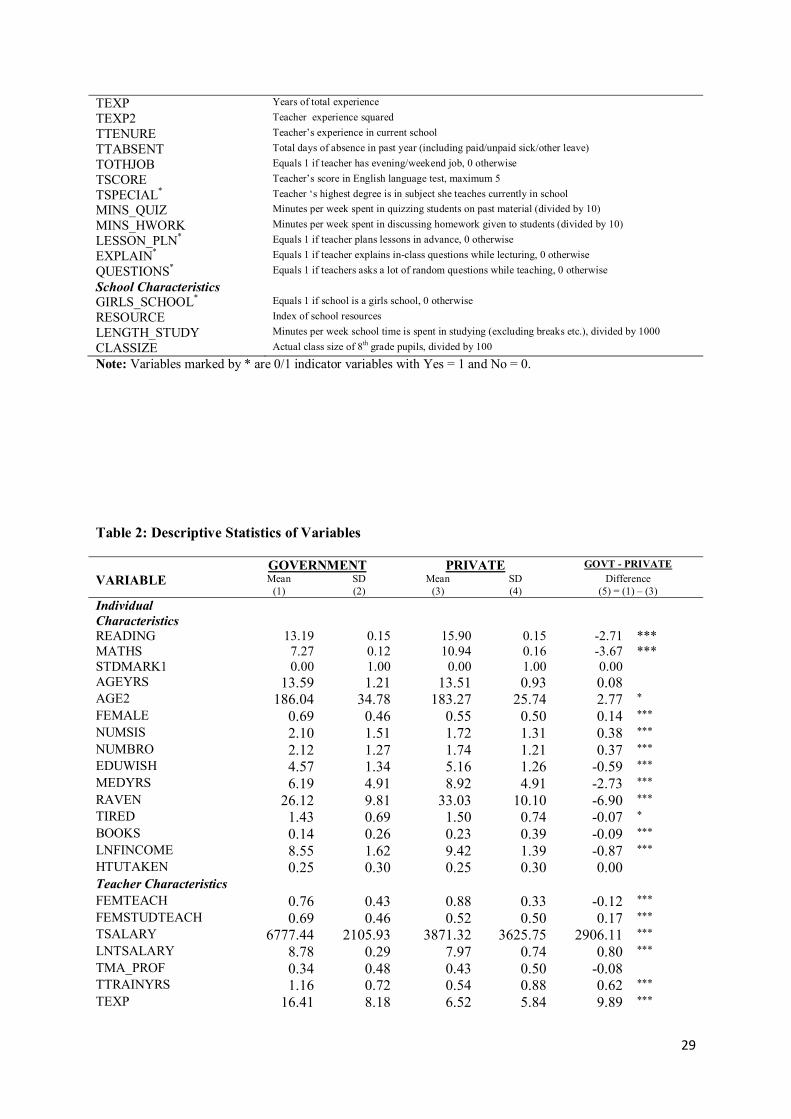
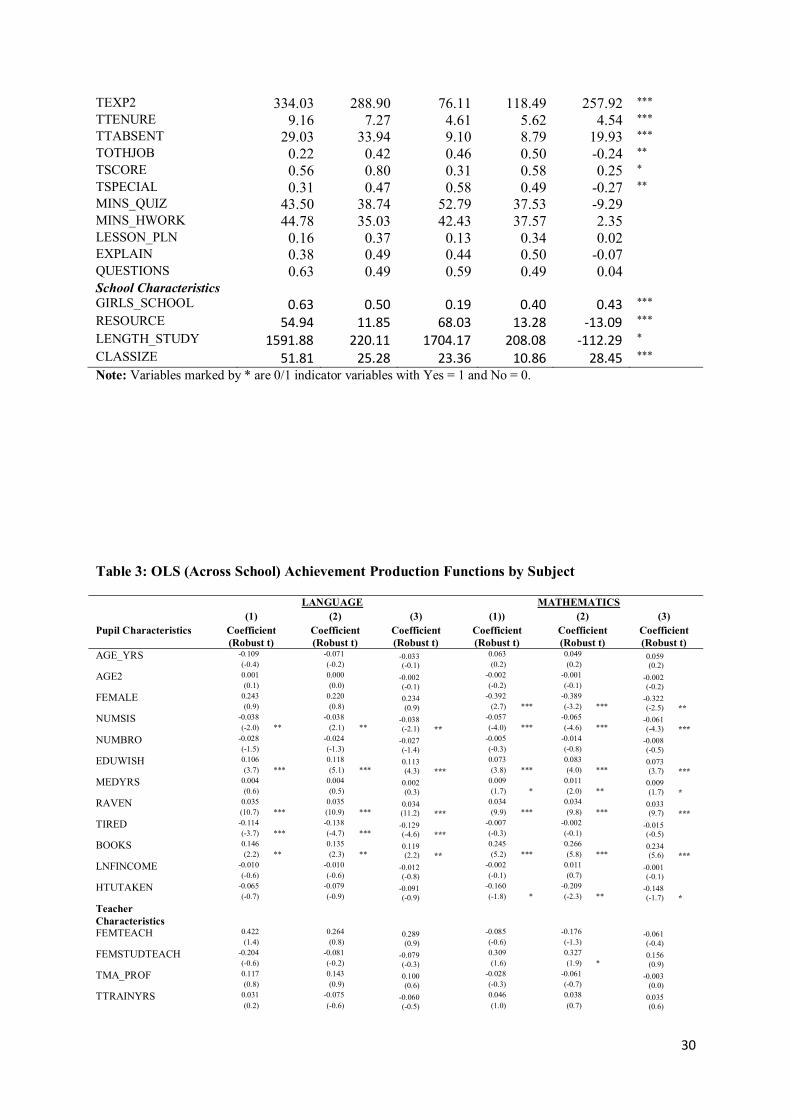
Table 1 describes the variables used in subsequent equations while Table 2 shows the descriptive
statistics by school type. Table 3 shows the results from OLS achievement production functions
estimated separately for language and math. For each subject, three specifications are reported. In the
first specification (column 1 under each subject), the baseline OLS regression is estimated using a rich
vector of individual, household, teacher and school-level variables. The vector of teacher variables
includes the standard variables such as teacher certification, training, experience etc. that are usually
available to researchers. The second specification (column 2) extends the standard production
function by including a parsimonious set of �teaching process� variables. These measure class-room
practices and are aimed at capturing teacher effectiveness. Column 3 includes school-level variables.
Focusing first on columns (1) and (2) without and with teacher process variables (under each
subject), we see that among the individual and family characteristics, most variables have expected
signs. For example, more aspiring and able pupils (EDU_WISH and RAVEN) perform better.
Physical tiredness reduces pupil achievement while the home learning environment (proxied by the
number of books at home) improves learning significantly. Interestingly, a higher proportion of sisters
reduce language achievement significantly while there is no such effect with a higher proportion of
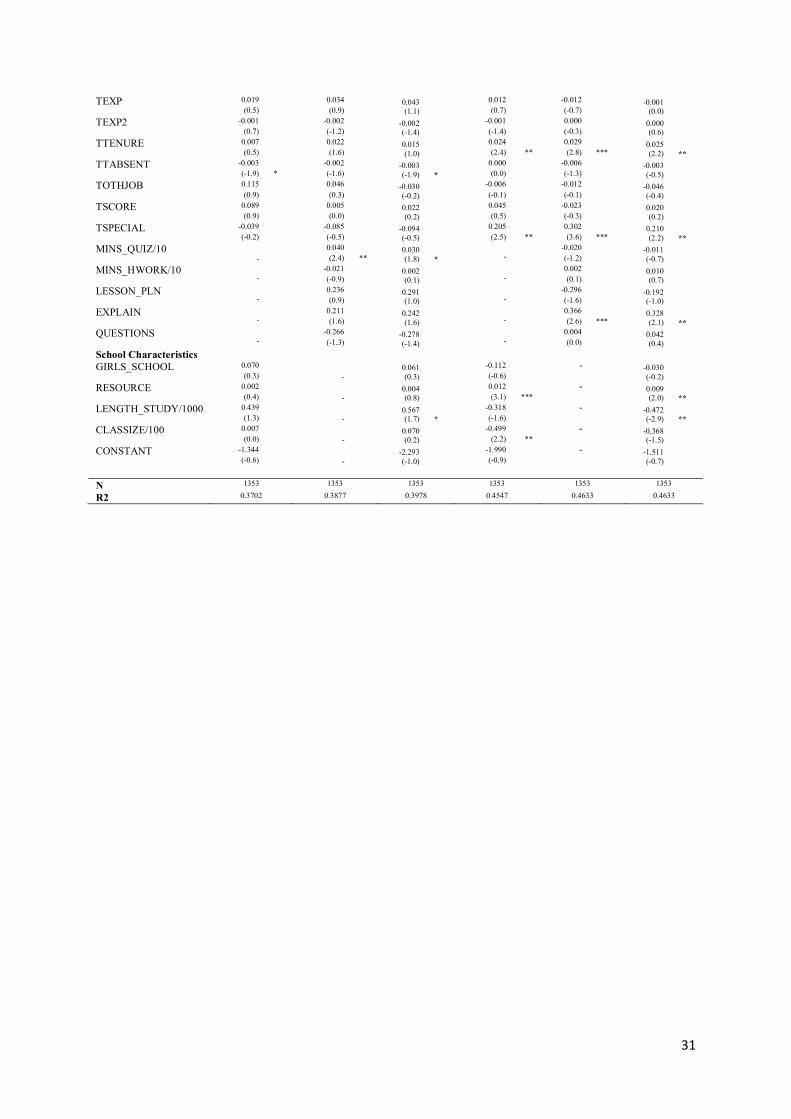
brothers. No teacher or school characteristics other than teacher absence are significantly associated
with language achievement, but math learning profits from having teachers with longer tenure and
11
specialist teachers, i.e. those who themselves had a degree in the subject they teach � in this case
math. Students� language skills benefit from a larger number of minutes spent by teachers in quizzing
them and maths skills benefit from having teachers that take time to explain concepts. Including
school characteristics in column (3) does not change the coefficients in (2) much.
The first cut achievement regressions in Table 3 reveal some interesting findings - one of the
key results is that while standard teacher variables do not appear to determine students� language and
numeracy skills, some �process� variables clearly matter depending on the subject: while quizzing
benefits language scores, explaining and involving pupils in discussions appear to benefit
mathematics skills more. However, these �across-school� results suffer from biases and we now
discuss the main results of this paper presented in Table 4.
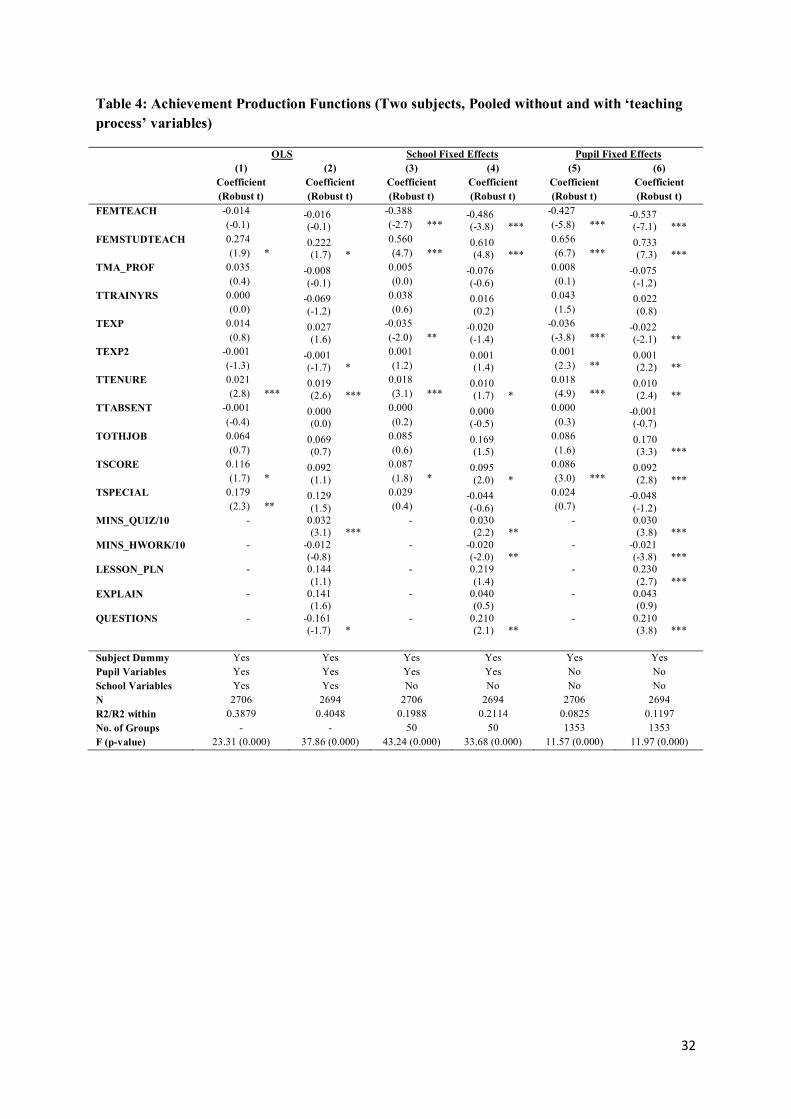
Table 4 presents the achievement production function estimates by pooling both subjects.
Achievement functions are estimated: 1) across-schools, 2) within schools using school fixed-effects
and 3) within pupils using pupil fixed effects. In each case, two specifications are reported � without
and with the vector of process variables. We report only the parameter estimates of the teacher
variables. The similarity of the results in columns (3) and (5) and columns (4) and (6) i.e. the school
and pupil fixed effects (without and with process variables) is unsurprising given that they would have
been identical had it not been for an unbalanced panel since there is no variation within the school
which is also not within the pupil. This is because in each school we only sampled one section of
grade 8. Had we sampled at least two sections, teacher characteristics could have been pupil-specific
rather than subject-specific provided the two sections were taught by different teachers within a
school.
Focus first on the pupil fixed-effects results in columns (5) and (6) as these are of most interest to
us. Comparing the estimates without and with process variables, among the significant coefficients,
the inclusion of class-room practice variables causes the coefficient on TTENURE to decline from
0.018 to 0.010. This suggests that it may not be tenure per se which generates an improvement in
pupil achievement; it may be the adoption of certain teaching practices by teachers with more
12
experience in a given school that increases pupil achievement. Alternatively, teachers who adopt
certain teaching techniques and are more efficient may also have their contracts renewed (and hence
have greater tenure). Disentangling which of these two effects may be operating is not possible in this
study.
Focus now on column (6) in Table 4. One of the most striking findings is that a student�s
standardised mark in a subject taught by a female teacher is 0.5 standard deviations lower than if the
same student were taught by a male teacher. Female students, however, appreciably benefit from
being taught by same-sex teachers - their standardised mark increases by 0.7 standard deviations. A
number of explanations can rationalise this finding (Holmlund and Sund, 2005). Firstly, the
�preferences� explanation suggests that teachers of a given sex have preferences for students of the
same gender, and may reward same-sex students in terms of higher grades. A second, �stereotyping�,
explanation argues that teachers own stereotypes may influence their evaluations of pupils. Although
these two explanations can be ruled out by arguing that the tests taken by pupils in this sample were
neither administered by nor graded by their teachers, we cannot rule out the possibility that
�preferences� or �stereotypes� influence the way in which knowledge is transmitted to students of
different genders. Finally, a third - �role-models� - explanation, argues that students of the same
gender may perform better by being taught by same-sex teachers viewed as role models. This
hypothesis is convincing in light of cultural norms in Pakistan where adolescent girls suddenly face
strict mobility restrictions and may see female teachers as effective role models. While highlighting
possible hypotheses, this paper does not delve into which one best explains this result in Pakistan7.
Teacher certification has no bearing on pupil�s standardised achievement. This finding
corroborates international evidence (see Hanushek, 2006 for a summary). Note that variables such as
teacher experience and tenure (TEXP, TEXP2 and TTENURE) are included merely as control
7 While pupil-teacher gender effects are of great interest especially given the feminisation of teaching with the mushrooming of private schools in Pakistan, focusing on teacher-pupil gender is not possible within the pupil fixed-effects methodology adopted in this paper. The reason for this is that we strive for heterogeneity in the gender of pupils and teachers to generate variation across subjects. However, while this heterogeneity is completely ruled out in government schools (female students are always taught both subjects by female teachers while male students are most often taught by male teachers), in our private school sample there is not sufficient variation in subject-teacher-pupil gender to allow for a convincing utilisation of the pupil fixed-effects approach.
13
variables as they are likely to be jointly determined with pupil achievement and we do not discuss
their coefficients. For example, the positive coefficient on teacher tenure could reflect that more time
spent in a given school (hence greater teacher experience in that school) raises pupil learning
(causation from tenure to achievement) or it could reflect that teachers who are more effective in
raising pupil achievement are also more likely to have their contracts renewed (causation from
achievement to tenure). Arguably, however, by including a large number of process variables
potentially capturing some elements of teacher �effectiveness� typically unobserved, this bias may be
considerably reduced.
The headline story in column (6), however, is that a large number of �process� variables are
significant determinants of achievement. Being taught by a teacher with another job (in addition to the
teaching job in the school) substantially benefits a pupil compared to being taught by a teacher who
doesn�t have any other job. This could be because more �effective� or better teachers are also able to
find secondary employment. Alternatively, as a large percentage of school-teachers are employed as
tutors in evening coaching centres or give extra home tuition to pupils8, the positive externalities of
teaching different pupils or practice may be passed on to day-time pupils9. The effect of teacher�s
English test scores is also significantly positive � a pupil taught by a higher scoring teacher scores, on
average, 0.09 standard deviations higher than when being taught by a lower scoring teacher. Among
the �process� variables, largest positive effects on pupil achievement are from being taught by lesson-
planning teachers and who ask many questions from pupils during lessons. For instance, being taught
by a teacher who plans lessons raises pupil achievement by 0.23 standard deviations. The effect of
asking questions is of a similar magnitude. Though the size of the coefficient is small, quizzing on
past lessons also raises student mark. Finally, increased time spent reviewing homework is inimical to
8 For instance, in the total sample of 339 teachers, 122 state having secondary employment either in evening coaching centres, providing private home tuition, some other activity or more than one of the above. Amongst those with any secondary job, an overwhelming 71 per cent�s evening/weekend employment is in evening coaching or in providing private home tuition. 9 Another alternative explanation could be that as many day-time students are also coerced into attending paid evening tuition often given by the same teachers who teach them during the school day, elements of favouritism increase pupils test scores. However, this is not a feasible explanation in this setting as the tests on which the standardised scores are based were set by the author without any input from the teachers. They were also administered and checked in controlled environments without the presence of a teacher who could have guided any �favoured� student or given him/her a higher score.
14
achievement (though the effect is small) perhaps because it take away from time that could have been
spent learning new material.
Summarising the results so far, pupil fixed-effects estimates showcase several interesting
findings. Firstly, most of the standard teacher variables believed to determine pupil achievement (such
as certification and training) and often used to guide education policy, have no bearing on student�s
standardised mark. Secondly, gender interaction effects suggest that girls benefit from being taught by
female teachers and this has important policy implications. However, this study doesn�t delve into
potential explanations for this effect (i.e. whether it is because of stereotyping or because female
teachers act as role models for impressionable female adolescents). Finally, the study also finds that it
is the often un-captured teaching �process� variables that impact student achievement � lesson
planning, involving students through asking questions during class and quizzing them on past material
all substantially benefit pupil learning.
Given that much of past work determining the effect of teacher characteristics on pupil
achievement has estimated across-school equations such as in column (1) of Table 4, it is of interest to
see how results change when moving to a within-pupil analysis. Comparing columns (2) and (6) in
Table 4, while being taught by a female teacher has no effect on pupil learning in across-school
estimation, the effect is large and significantly negative in a within-pupil framework. And while the
coefficient on FEMSTUDTEACH is significantly positive in (1), it more than triples in size and
becomes even more precise in column (3). Among the process variables, the size and even the
significance of a few coefficients changes � for example while minutes spent discussing homework is
negative and insignificant in (2), the effect almost doubles and becomes significant in (6). Similarly,
while lesson-planning has a positive and insignificant effect in (1), a student taught by a lesson-
planning teacher benefits a large and significant improvement in achievement if taught by a lesson-
planning compared to a non-lesson planning teacher. Finally, while in column (1), QUESTIONS is
negative and just significant indicating that pupils taught by a teacher who asks many questions suffer
a 0.16 deviation reduced standardised mark compared to when being taught otherwise, this is
completely reversed in the pupil fixed-effects estimates where we find that the same pupil taught by a
15
teacher who asks many questions benefits from a 0.21 standard deviation improvement in test scores
compared to being taught by a teacher asking few questions. Clearly, across-school results are often
quite dramatically different from with-pupil ones. As the former estimates are often confounded by
the correlation between teacher characteristics and pupil and school unobservables, they may give
misleading results. Within-pupil estimates are more powerful as they control at least for all subject-
invariant pupil and family-level unobservables that may generate biases in estimation.
Finally, note that teacher pay is absent from the above estimates despite it often being of
significant policy interest. The appeal of this variable rests in the conviction that higher teacher pay
may result in improved pupil achievement either through increased teacher effort, or by attracting a
better pool of applicants in a given school or by creating an incentive for teachers to retain their more
valuable jobs (Kingdon and Teal, 2006). If true, this provides a rationale for schools to adopt
�performance-related-pay� mechanisms, and offers a tool for policy-makers to channel constrained
resources to improve pupil learning. A key challenge, however, is in identifying the causal effect of
teacher pay on student achievement. Even within a pupil fixed-effects framework, this is complicated
because of the various biases (omitted variables and simultaneity bias) associated with the inclusion
of this variable. While reduced, through the inclusion of process variables potentially capturing
elements of effort and motivation (often relegated to the error term), biases may not be completely
eliminated. Therefore, although we estimated identical equations including the teacher pay variable,
the results are not reported in tables 2 and 310. We also note that the inclusion of teacher salary in logs
(LNTSALARY) did not change any of the results in the two tables and the variable itself was often
insignificant. While suggesting that increasing teacher pay may not be a potent tool for improving
student achievement (at least in Lahore), it does raise an interesting question - if higher teacher pay is
not associated with improvements in students� test scores, how efficient is the pay schedule in schools
across Lahore? That is, are teachers rewarded by schools for possessing characteristics that improve
students� performance? We explore this question later in the paper.
10 Results available from authors upon request.
16
5. Learning gaps in government and private schools � what role do teachers play?
The past few decades have seen something of a revolution in the provision of schooling in
Pakistan with private schooling increasing more than 800 per cent in slightly more than a decade
(Alderman, Orazem and Paterno, 2001; Andrabi, Das and Khwaja, 2002; Aslam, 2007a). Until
recently, much of the debate about the quality of government and private schools, measured in terms
of achievement differences of their student bodies, was based on anecdotal accounts. However, the
very obvious emergence of private school provision at all schooling levels and parents� decision to
send their children to fee-charging schools rather than opt for free government schools, coupled with
higher labour market rewards (in terms of higher earnings) for private school graduates (Aslam,
2007b, Nasir 1999) were seen indicative of the superior quality schooling provided by the latter. The
anecdotal accounts of better private quality in terms of higher pupil achievement were translated into
robust econometric studies with Alderman et al�s pioneering work in Lahore district in 2001 in which
the authors proved that private primary schools were indeed imparting better quality education
compared to government schools. These findings have since been corroborated by more recent
evidence often with a wider and more varied geographical coverage than Alderman et al.�s original
study (Arif and Saqib, 2003, Das, Pandey and Zajonc, 2006, and Aslam 2007a).
While highlighting the better performance of pupils in the private compared to the government
sector at the primary education level (Alderman et al., 2001, Arif and Saqib, 2003, Das et al., 2006)
and the middle-level (Aslam, 2007a), neither study pinpoints why private schools are potentially more
effective. Differences in achievement across school-types can be variously attributed. They could be
due to variation in the quality of the student body (i.e. selection of more able or motivated pupils into
private schools), difference in school quality in terms of infrastructure, school facilities or
management styles, or disparities in teacher characteristics or even the style of teaching. Hence, one
explanation for private schools� better performance in Pakistan may be in the exposure of their pupils
to a set of teachers whose observed or unobserved characteristics are superior to those for government
school pupils.
17
The differences in observed teacher characteristics across the two school-types are well-
documented � teachers in government schools are more qualified (have higher training, more
experience and tenure), are older and are paid more while those in private schools are younger, most
often female, are less qualified and are paid considerably less (see table 1). If anything, at first glance,
this suggests that government school pupils are taught by a superior pool of teachers. However, this is
by no means a forgone conclusion. Firstly, it remains to be econometrically determined whether
observed teacher characteristics affect pupil achievement at all across the two school types. Secondly,
unobserved teacher characteristics such as effort or motivation may differ significantly across the
school-types. Indeed, differences in the political economy of hiring and firing, types of contracts
offered to teachers and the resultant incentive mechanisms prevailing in government and private
schools may hold the key to at least identifying the differences in unobserved characteristics across
the two sectors. For instance, government teachers� recruitment in Pakistan is highly politicised rather
than merit-based with local politicians gaining votes by securing government jobs for their
constituents. Moreover, teachers favour government jobs as entry requirements are lax, jobs are most
often permanent, pay better than those in the private sector and lack established mechanisms of
checking teacher presence in school, let alone teacher effort (Ali, 1998). While teaching jobs in the
government sector stipulate stringent training requirements, the quality of training is poor when
available, extremely dated with little innovation, and has little relation to teaching the teacher how to
teach once in school. At the other extreme, private schools often favour hiring female staff (who can
be paid less compared to males), who are younger and often unmarried and less experienced and less
trained (though not necessarily less certified). However, private schools may also monitor teacher
presence quite strictly and may even adopt measures to supervise their effort as may be suggested by
the much higher turnover in private schools perhaps because less effective teachers are fired.
In this part of the paper, we look into the black-box and unravel the specific characteristics of
teachers that may differ between the two school-types enough to generate quite substantial differences
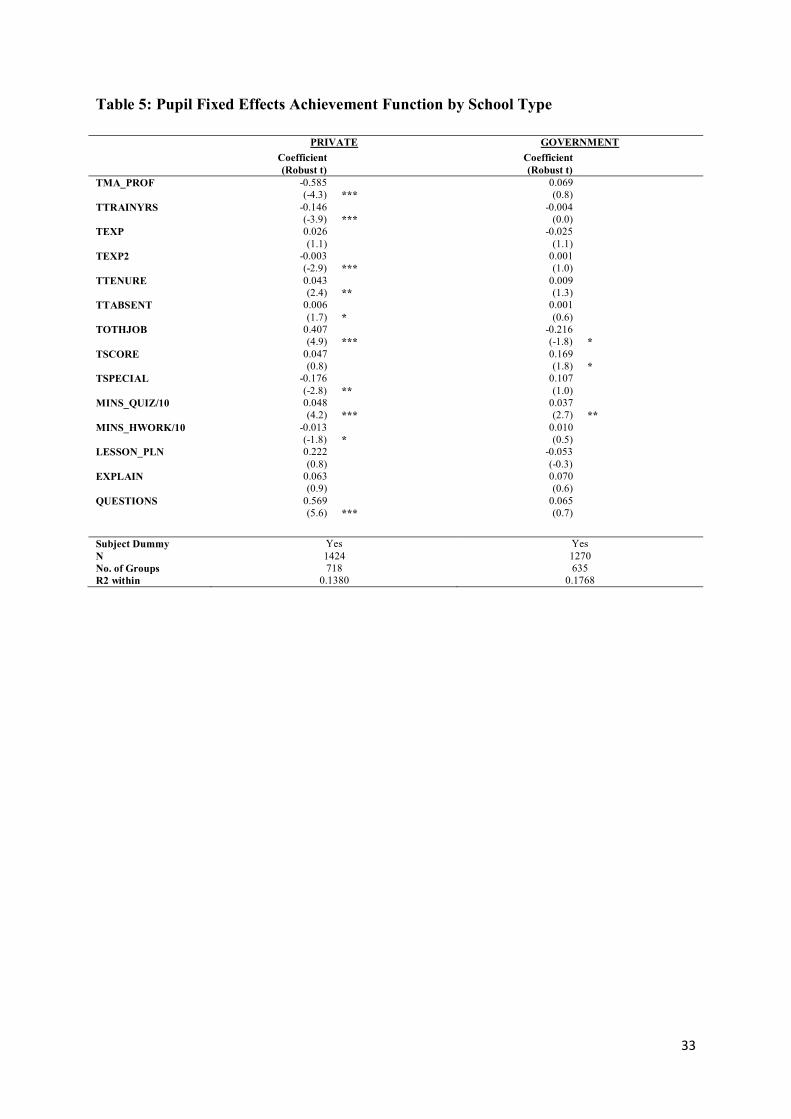
in student achievement. Table 5 shows the results of pupil fixed-effect achievement production
18
functions estimated separately for government and private school pupils11. The findings show that the
vector of coefficients differs dramatically across the two sectors. For instance, in government schools
none of the standard teacher characteristics (such as teacher certification or training) matter to
student�s achievement. The only teacher-variables determining government school pupil�s
achievement are: TOTHJOB, TSCORE and MINS_QUIZ. A student in a government school taught
by a moonlighting teacher suffers significantly - her score is 0.22 standard deviations less than if
taught by a teacher who does not have an evening job. Finally, the largest positive effect on
government school students� achievement comes about through higher TSCORE implying that
teachers with higher cognitive skills themselves are more effective in imparting learning.
In sharp contrast, almost all teacher characteristics in private schools have large and significant
effects on standardised scores. While some variables (such as TMA_PROF and TTABSENT) have
unexpected signs, a number of variables, often process-type ones go in the expected direction. The
negative coefficient on TMA_PROF could be indicative of adverse selection � if teachers with MA
are no more effective in teaching than with BA degrees, only low-ability MA candidates unable to
secure more lucrative government employment may select into private schools having a debilitating
effect on pupil achievement. The effect of TOTHJOB in private schools is positive - moon-lighting
teachers have large and significant positive effects on pupil achievement, raising their standardised
scores by 0.4 standard deviations. This could be due to some reverse causation in the private school
achievement equation: the more effective teachers are more successful in getting out-of-school jobs to
supplement their meagre private school salaries. The sign on TSPECIAL is surprising, indicating that
it is a disadvantage to be taught a subject by a teacher in which she/he specialised. Among the
process-variables, the findings show that a student taught by a teacher who asks many questions from
pupils during the lesson improves the mark by a large 0.6 standard deviations.
11 Teacher gender and the gender interaction term is not included in the specification by school-type as all government schools are single-sex schools and female students in government schools at grade 8 level are always taught by female teachers. While male students may be taught by female teachers, the proportion is extremely low. Among private schools, we noted that the gender of the teacher and subject were
19
Finally, a debate in recent years maintains that focusing on differences in achievement across the
government and private sector may be too simplistic as there are large variations within the two
sectors (Das et al., 2006, Aslam 2007a). In both sectors, schools range from elite institutions to
extremely poor ones with abysmal conditions, lacking even the basic facilities that form a prerequisite
for generating an environment conducive to learning. Thus, variations in achievement among the good
and bad schools within a sector may be as important as the gaps between the two school-types.
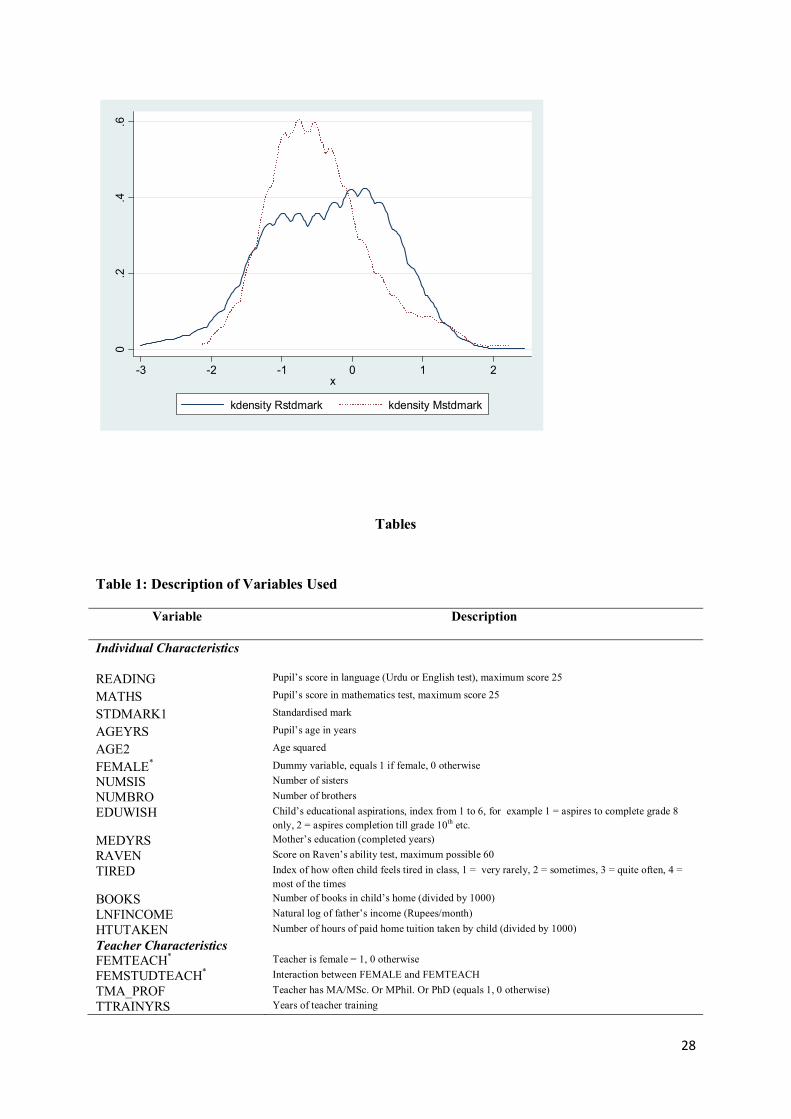
That not all government schools have poor-performing pupils and not all private schools high
achievers is also apparent from the kernel plots of the achievement distributions presented in Figure 2.
While on average government school pupils underperform private school counterparts, there is a large
area of overlap suggesting that a large proportion of �good-performers� in government schools
perform at levels similar to average-poor performers in private schools. Also note that the lower tail of
the distribution for private schools almost superimposes on the government school distribution
suggesting that the poorest performing private school pupils are no different from the worst-
performers in government schools. At the higher tail-end though, best-performing pupils are almost
exclusively in private schools.
In this study, we can shed light on some of the potential factors underlying variations in
achievement within the two sectors. From Table 5, we conclude that within the government sector,
better schools possibly hire more �effective� teachers (i.e. whose English language skills are better and
who spend more time quizzing pupils on past work) and who adopt some incentive mechanisms that
discourage teachers from moonlighting. Good private schools (compared to �bad� ones), also hire
more �effective� teachers but their success rests in adopting a teaching methodology that encourages
pupil-testing and adopting an interactive approach during lessons. Good private schools are also able
to retain better teachers by renewing their contracts (positive coefficient on tenure) and firing the less
effective ones.
20
6. Rational rewards - Are teachers rewarded for possessing characteristics that improve
pupil learning?
Rationality in teacher pay schedules requires efficiency which means that teacher pay is linked to
the possession of observed characteristics that are instrumental in raising pupil achievement. In this
section, we estimate earnings functions for teachers from the sample of 65 schools to determine
whether more effective teachers (i.e. those who raise pupil achievement more) are rewarded
accordingly12.
As mentioned before, the dataset used in this study sampled students from 65 schools and all
teachers teaching any one sampled section of grade 8. This yielded a total of 339 teachers from across
25 government and 40 private schools. Log of teacher monthly salary is regressed on teacher and
school characteristics in a standard OLS regression. Table 6 presents an OLS equation (pooling
government and private school teachers) of log of teacher monthly salary in column (1) and a school-
fixed effects regression exploiting within-school variation in teacher pay in column (2). The latter
yields more robust results as unobserved teacher characteristics generate difficulty in interpreting the
effect of included teacher characteristics as causal (for instance if more able teachers sort into higher
paying jobs) and school fixed-effects potentially control some of the bias though omitted variable bias
due to teachers� unobserved characteristics remains possible even in this.
A comparison of column (2) in Table 6 with the pooled pupil fixed-effects results in column (3)
of table 3 shows that teachers are largely rewarded for the possession of characteristics which either
have nothing to do with improving pupils� achievement or, in fact, reduce it. For example, teacher
certification is highly rewarded in the labour market � the coefficient on TMA_PROF is large and
positive. However, this variable doesn�t improve student performance (Table 4). Similarly, teacher
12 To our knowledge only one other study has investigated the issue of rationality of teacher pay scales in Pakistan. This study, by Khan (2002), questions whether rural teachers are paid rationally by defining teacher �effectiveness� as teacher�s cognitive skills in mathematics and comprehension. The author uses data from the 1980s from rural Pakistan and concludes that public sector pay schedules are extremely rigid while pay schedules in the NGO and private school sectors are responsive to qualifications and, hence, less rigid compared to the government sector.
21
experience clearly has payoffs in terms of increased salary, but in Table 4, it clearly reduces pupil
achievement. Thus, it would seem that teacher�s salary schedules are highly inefficient.
A more lucid picture emerges when we compare teacher pay schedules across the government and
private sector. Table 7 reports teacher pay schedules by school type. Firstly, as before, the across-
school results are very often significantly different from the school fixed-effects results across both
school types. As the latter are more convincing, we focus on those. Secondly, in table 6 the vector of
coefficients determining teacher pay is significantly different across both school types. For instance,
the government school results provide support to the commonly held belief that government pay
scales are based on fixed factors such as qualifications, training and experience. This is exactly what
appears to be the case. On the other hand, private school salary structures appear relatively more
flexible although more qualified teachers are rewarded in terms of higher salary. Similarly, in private
schools the coefficient on tenure is positive and the effect is significant though as this variable is
highly correlated with experience, it is difficult to interpret the direct effect of tenure on teacher
salary. Appendix table 1 presents results of the school fixed-effects regression separately for
government and private schools excluding TTENURE. As expected, as TTENURE is significantly
positive in private schools and is positively correlated with TEXP, excluding it in Appendix table 1
causes the effect to be picked up by TEXP. The only other noteworthy change is that excluding
TTENURE causes the coefficient on TMA_PROF to become insignificant suggesting that teacher
education and tenure are negatively correlated. This is plausible since older teachers (who generally
have longer tenure) also typically have lower levels of education. The effect of excluding TTENURE
in the government school sample is negligible and this is not surprising given the insignificance of
TTENURE in Table 7.
In any case, focus now on comparing the school fixed-effects results in table 7 with those in Table
5. In private schools, teacher�s pay is linked with certification and tenure. While tenure clearly
improves pupil achievement significantly in Table 5, TMA_PROF has a large and significantly
negative effect on student�s standardised marks. Thus, while efficient in one respect, private school�s
teacher pay schedules are clearly inefficient in another. This inefficiency could, presumably, have to
22
do with private schools either choosing to or having to hire more certified teachers to signal
prospective parents that they have a qualified staff despite qualification having nothing to do with
productivity. The inefficiency in rewarding teachers is even starker in government schools. In
accordance with government policy, government schools reward teachers on the basis of fixed rules �
better certified, better trained and more experienced teachers are rewarded more and none of these
characteristics has any effect in improving students� standardised mark.
7. Conclusions
The objective of this paper was to delve into the black-box representing �teaching� to uncover the
teacher characteristics and teaching practices that matter most to pupil achievement. To do so, we
exploited a unique identification strategy - within-pupil variation was used to estimate the effects of
teacher characteristics on student achievement. This was done by utilizing data from Pakistan that
permits the matching of students� test scores in language and mathematics tests to the teachers that
teach those subjects, allowing examination of whether the characteristics of different subject teachers
are related to a student�s marks across subjects.
Apart from the innovative identification methodology used in this study, a further unique feature
is that the data also allow us to test the importance of classroom practices and teaching techniques
rather than confining attention only to teachers� resumè characteristics i.e. qualifications, experience
and training. Finally, instead of imposing a universal achievement production function, we provide
separate estimates for government and private schools.
The pupil fixed-effects estimates reveal some striking results. One of the findings of interest is
that most of the standard teacher resumè characteristics (such as certification and training) often used
to guide education policy have no bearing on student�s standardised mark. However, despite this we
also find that teachers are largely rewarded for possessing characteristics which have nothing to do
with improving pupils� achievement. Thus, it would seem that teacher�s salary schedules are
inefficient. While this is true more for government schools, private school salary structures appear
relatively more flexible although even there more qualified teachers are rewarded by higher salaries.
23
Another interesting finding is that girls benefit from being taught by female teachers, a finding
with interesting policy implications. We also find that the usually un-measured teaching �process�
variables impact student achievement strongly � lesson planning, involving students by asking
questions during class and quizzing them on past material, all substantially benefit pupil learning. A
comparison across the two school-types suggests that within the government sector, better schools
possibly hire more �effective� teachers (i.e. whose English language skills are better and who spend
more time quizzing pupils on past work) and who adopt some incentive mechanisms that discourage
teachers from moonlighting. Good private schools (compared to �bad� ones), also hire more
�effective� teachers but their success rests in adopting a teaching methodology that encourages pupil-
testing and adopting an interactive approach during lessons. Good private schools are also able to
retain better teachers by renewing their contracts (positive coefficient on tenure) and firing the less
effective ones.
We conclude this paper with an important caveat. As mentioned before, the differences between
teachers in their unobserved characteristics still remain a source of endogeneity and undermine the
ability to attribute causality to observed teacher variables. However, we also note that the biases
associated with this source of endogeneity may be somewhat reduced in this paper. By including
process-type variables which may be correlated with unobserved teacher effort, ability and
motivation, we have been able to reduce though not necessarily eliminate, some of the biases
generated with this source of endogeneity.
24
References
Aaronson, D., Barrow, L. and Sander, W. (2003), �Teachers and Student Achievement in the Chicago Public High Schools�, WP-2002-08, Federal Reserve Bank of Chicago, February.
Alderman, H., Orazem, P.F. and Paterno, E.M. (2001), �School Quality, School Cost, and the Public/Private School Choices of Low-Income Households in Pakistan.� The Journal of Human Resources, Vol. 36 (2), pp. 304-326.
Ali, M. A. (1998), �Supervision for Teacher Development: a Proposal for Pakistan�, International Institute for Educational Planning, UNESCO 1998.
Altonji, J.G., Elder, T.E. and Taber, C. (2005), �Selection on Observed and Unobserved Variables: Assessing the Effectiveness of Catholic Schools�, The Journal of Political Economy, Vol. 113 (February), pp. 151-184.
Ammermǖller, A. and Dolton, P. ( 2007), �Pupil-teacher gender interaction effects on scholastic outcomes in England and the USA�, Center for European Economic Research (ZEW) Discussion Paper No. 06-060.
Andrabi, T., Das, J. and Khwaja, A. (2002), �The Rise of Private Schooling in Pakistan: Catering to the Urban Elite or Educating the Rural Poor?� World Bank and Harvard University.
Andrabi, T.,Das, J. and Khwaja, A. (2006), �Students Today, Teachers Tomorrow? Identifying Constraints on the Provision of Education�, Harvard University Working Paper.
Arif, G.M. and Saqib, N. (2003), �Production of Cognitive Life Skills in Public, Private, and NGO Schools in Pakistan�, Pakistan Development Review, 42 (1), pp. 1-28.
Aslam, M. (2007a), �The Quality of School Provision in Pakistan: Are Girls Worse Off?�, Global Poverty Research Group Working Paper 066. Aslam, M. (2007b), �Rates of Return to Education by Gender in Pakistan�, Global Poverty Research Group Working Paper 064.
Boissiere M., Knight J.B and Sabot, R. H. (1985), �Earnings, schooling, ability and cognitive skills.� American Economic Review, Vol. 75 (5), pp. 1030 -1061.
Clotfelter, C., H. Ladd and J. Vigdor (2006), �Teacher-Student Matching and the Assessment of Teacher Effectiveness�, NBER Working Paper No. 11936, January.
Das, J., Pandey, P. And Zajonc, T. (2006), �Learning Levels and Gaps in Pakistan�, World Bank Policy Research Working Paper No. 4067.
Dee, Thomas (2005) �Teachers and Gender Gaps in Student Achievement�, NBER Working Paper No. 11660. Glewwe, P. and Kremer, M. (2006), �Schools, teachers, and Education Outcomes in Developing Countries�, in Handbook of the Economics of Education, Hanushek, E. And Welch, F. (eds.), Vol. 2.
25
Hanushek, E., J. Kain, D. O�Brien and S. Rivkin (2005), �The market for teacher quality�, NBER Working Paper 11154, http://www.nber.org/papers/w11154.
Hanushek, E. and Rivkin, S.G. (2006), �Teacher Quality�, in Handbook of the Economics of Education, Hanushek, E. And Welch, F. (eds.), Vol. 2.
Holmlund, H. and Sund, K. (2005), �Is the Gender Gap in School Performance Affected by the Sex of the Teacher?�, Swedish Institute for Social Research (SOFI) Working Paper No. 5.
Hoxby, C. (1996), �How teachers� unions affect education production�, Quarterly Journal of Economics, 111 (4): 671-718. Khan, S.R. (2002), �Rationality in Public Sector Salary Scales: The Case of Rural Teachers in Pakistan�, Education Economics, Vol. 10 (3), pp. 333 � 345. Kingdon, G.G. and Teal, F. (2007), �Does performance related pay for teachers improve student performance? Some evidence from India�, Economics of Education Review, 26 (4), pp. 473-486.
Kingdon, G.G. (2006), �Teacher Characteristics and Student Performance in India: A pupil Fixed Effects Approach�, Global Poverty Research Group Working Paper 059.
Knight, J. and Sabot, R. (1990), Education, Productivity and Inequality: The East African Natural Experiment, Oxford University Press, Oxford Lavy, 2002
Nasir, Z.M. (1999), �Do Private Schools Make Workers More Productive�, Pakistan Development Review, 38, pp. 937-964.
Rivkin, S., E. Hanushek and J. Kain (2005), �Teachers, Schools and Academic Achievement�, Econometrica, 73(2): 417-58. Rockoff, J. (2004), �The Impact of Individual Teachers on Student Achievement: Evidence from Panel Data�, American Economic Review, May: 247-52.
Sprietsma, M. and Waltenberg, F. (2005), �The Impact of Teacher�s Wages on Student�s Performance in the Presence of Heterogeneity and Endogeneity � Evidence from Brazil�, Université catholique de Louvain, Département des Sciences Economiques Working Paper 2005008.
26
Figures
Figure 1: Kernel density estimates of READING and MATHS scores by school-type
PRIVATE
GOVERNMENT
0.0
2.0
4.0
6.0
8.1
0 5 10 15 20 25x
kdensity READING kdensity MATHS
0.0
5.1
.15
0 5 10 15 20 25x
kdensity READING kdensity MATHS
27
Figure 2 � Kernel density estimates of stdmark1 by school-type
PRIVATE
GOVERNMENT
0.1
.2.3
.4
-4 -2 0 2 4x
kdensity Rstdmark kdensity Mstdmark
28
Tables
Table 1: Description of Variables Used
Variable Description
Individual Characteristics
READING Pupil�s score in language (Urdu or English test), maximum score 25
MATHS Pupil�s score in mathematics test, maximum score 25
STDMARK1 Standardised mark
AGEYRS Pupil�s age in years
AGE2 Age squared
FEMALE* Dummy variable, equals 1 if female, 0 otherwise NUMSIS Number of sisters
NUMBRO Number of brothers
EDUWISH Child�s educational aspirations, index from 1 to 6, for example 1 = aspires to complete grade 8 only, 2 = aspires completion till grade 10th etc.
MEDYRS Mother�s education (completed years)
RAVEN Score on Raven�s ability test, maximum possible 60
TIRED Index of how often child feels tired in class, 1 = very rarely, 2 = sometimes, 3 = quite often, 4 = most of the times
BOOKS Number of books in child�s home (divided by 1000)
LNFINCOME Natural log of father�s income (Rupees/month)
HTUTAKEN Number of hours of paid home tuition taken by child (divided by 1000)
Teacher Characteristics
FEMTEACH* Teacher is female = 1, 0 otherwise
FEMSTUDTEACH* Interaction between FEMALE and FEMTEACH
TMA_PROF Teacher has MA/MSc. Or MPhil. Or PhD (equals 1, 0 otherwise)
TTRAINYRS Years of teacher training
0.2
.4.6
-3 -2 -1 0 1 2x
kdensity Rstdmark kdensity Mstdmark
29
TEXP Years of total experience
TEXP2 Teacher experience squared
TTENURE Teacher�s experience in current school
TTABSENT Total days of absence in past year (including paid/unpaid sick/other leave)
TOTHJOB Equals 1 if teacher has evening/weekend job, 0 otherwise
TSCORE Teacher�s score in English language test, maximum 5
TSPECIAL* Teacher �s highest degree is in subject she teaches currently in school MINS_QUIZ Minutes per week spent in quizzing students on past material (divided by 10)
MINS_HWORK Minutes per week spent in discussing homework given to students (divided by 10)
LESSON_PLN* Equals 1 if teacher plans lessons in advance, 0 otherwise
EXPLAIN* Equals 1 if teacher explains in-class questions while lecturing, 0 otherwise
QUESTIONS* Equals 1 if teachers asks a lot of random questions while teaching, 0 otherwise
School Characteristics
GIRLS_SCHOOL* Equals 1 if school is a girls school, 0 otherwise
RESOURCE Index of school resources
LENGTH_STUDY Minutes per week school time is spent in studying (excluding breaks etc.), divided by 1000
CLASSIZE Actual class size of 8th grade pupils, divided by 100
Note: Variables marked by * are 0/1 indicator variables with Yes = 1 and No = 0.
Table 2: Descriptive Statistics of Variables
VARIABLE
GOVERNMENT PRIVATE GOVT - PRIVATE Mean SD Mean SD Difference
(1) (2) (3) (4) (5) = (1) � (3) Individual Characteristics
READING 13.19 0.15 15.90 0.15 -2.71 ***MATHS 7.27 0.12 10.94 0.16 -3.67 ***STDMARK1 0.00 1.00 0.00 1.00 0.00 AGEYRS 13.59 1.21 13.51 0.93 0.08
AGE2 186.04 34.78 183.27 25.74 2.77 *
FEMALE 0.69 0.46 0.55 0.50 0.14 ***
NUMSIS 2.10 1.51 1.72 1.31 0.38 ***
NUMBRO 2.12 1.27 1.74 1.21 0.37 ***
EDUWISH 4.57 1.34 5.16 1.26 -0.59 ***
MEDYRS 6.19 4.91 8.92 4.91 -2.73 ***
RAVEN 26.12 9.81 33.03 10.10 -6.90 ***
TIRED 1.43 0.69 1.50 0.74 -0.07 *
BOOKS 0.14 0.26 0.23 0.39 -0.09 ***
LNFINCOME 8.55 1.62 9.42 1.39 -0.87 ***
HTUTAKEN 0.25 0.30 0.25 0.30 0.00
Teacher Characteristics
FEMTEACH 0.76 0.43 0.88 0.33 -0.12 ***
FEMSTUDTEACH 0.69 0.46 0.52 0.50 0.17 ***
TSALARY 6777.44 2105.93 3871.32 3625.75 2906.11 ***
LNTSALARY 8.78 0.29 7.97 0.74 0.80 ***
TMA_PROF 0.34 0.48 0.43 0.50 -0.08
TTRAINYRS 1.16 0.72 0.54 0.88 0.62 ***
TEXP 16.41 8.18 6.52 5.84 9.89 ***
30
TEXP2 334.03 288.90 76.11 118.49 257.92 ***
TTENURE 9.16 7.27 4.61 5.62 4.54 ***
TTABSENT 29.03 33.94 9.10 8.79 19.93 ***
TOTHJOB 0.22 0.42 0.46 0.50 -0.24 **
TSCORE 0.56 0.80 0.31 0.58 0.25 *
TSPECIAL 0.31 0.47 0.58 0.49 -0.27 **
MINS_QUIZ 43.50 38.74 52.79 37.53 -9.29
MINS_HWORK 44.78 35.03 42.43 37.57 2.35
LESSON_PLN 0.16 0.37 0.13 0.34 0.02
EXPLAIN 0.38 0.49 0.44 0.50 -0.07
QUESTIONS 0.63 0.49 0.59 0.49 0.04
School Characteristics
GIRLS_SCHOOL 0.63 0.50 0.19 0.40 0.43 ***
RESOURCE 54.94 11.85 68.03 13.28 -13.09 ***
LENGTH_STUDY 1591.88 220.11 1704.17 208.08 -112.29 *
CLASSIZE 51.81 25.28 23.36 10.86 28.45 ***
Note: Variables marked by * are 0/1 indicator variables with Yes = 1 and No = 0.
Table 3: OLS (Across School) Achievement Production Functions by Subject
LANGUAGE MATHEMATICS (1) (2) (3) (1)) (2) (3) Pupil Characteristics Coefficient
(Robust t) Coefficient (Robust t)
Coefficient (Robust t)
Coefficient (Robust t)
Coefficient (Robust t)
Coefficient (Robust t)
AGE_YRS -0.109 (-0.4)
-0.071 (-0.2)
-0.033 (-0.1)
0.063 (0.2)
0.049 (0.2)
0.059 (0.2)
AGE2 0.001 (0.1)
0.000 (0.0)
-0.002 (-0.1)
-0.002 (-0.2)
-0.001 (-0.1)
-0.002 (-0.2)
FEMALE 0.243 (0.9)
0.220 (0.8)
0.234 (0.9)
-0.392 (2.7) ***
-0.389 (-3.2) ***
-0.322 (-2.5) **
NUMSIS -0.038 (-2.0) **
-0.038 (2.1) **
-0.038 (-2.1) **
-0.057 (-4.0) ***
-0.065 (-4.6) ***
-0.061 (-4.3) ***
NUMBRO -0.028 (-1.5)
-0.024 (-1.3)
-0.027 (-1.4)
-0.005 (-0.3)
-0.014 (-0.8)
-0.008 (-0.5)
EDUWISH 0.106 (3.7) ***
0.118 (5.1) ***
0.113 (4.3) ***
0.073 (3.8) ***
0.083 (4.0) ***
0.073 (3.7) ***
MEDYRS 0.004 (0.6)
0.004 (0.5)
0.002 (0.3)
0.009 (1.7) *
0.011 (2.0) **
0.009 (1.7) *
RAVEN 0.035 (10.7) ***
0.035 (10.9) ***
0.034 (11.2) ***
0.034 (9.9) ***
0.034 (9.8) ***
0.033 (9.7) ***
TIRED -0.114 (-3.7) ***
-0.138 (-4.7) ***
-0.129 (-4.6) ***
-0.007 (-0.3)
-0.002 (-0.1)
-0.015 (-0.5)
BOOKS 0.146 (2.2) **
0.135 (2.3) **
0.119 (2.2) **
0.245 (5.2) ***
0.266 (5.8) ***
0.234 (5.6) ***
LNFINCOME -0.010 (-0.6)
-0.010 (-0.6)
-0.012 (-0.8)
-0.002 (-0.1)
0.011 (0.7)
-0.001 (-0.1)
HTUTAKEN -0.065 (-0.7)
-0.079 (-0.9)
-0.091 (-0.9)
-0.160 (-1.8) *
-0.209 (-2.3) **
-0.148 (-1.7) *
Teacher Characteristics
FEMTEACH 0.422 (1.4)
0.264 (0.8)
0.289 (0.9)
-0.085 (-0.6)
-0.176 (-1.3)
-0.061 (-0.4)
FEMSTUDTEACH -0.204 (-0.6)
-0.081 (-0.2)
-0.079 (-0.3)
0.309 (1.6)
0.327 (1.9) *
0.156 (0.9)
TMA_PROF 0.117 (0.8)
0.143 (0.9)
0.100 (0.6)
-0.028 (-0.3)
-0.061 (-0.7)
-0.003 (0.0)
TTRAINYRS 0.031 (0.2)
-0.075 (-0.6)
-0.060 (-0.5)
0.046 (1.0)
0.038 (0.7)
0.035 (0.6)
31
TEXP 0.019 (0.5)
0.034 (0.9)
0.043 (1.1)
0.012 (0.7)
-0.012 (-0.7)
-0.001 (0.0)
TEXP2 -0.001 (0.7)
-0.002 (-1.2)
-0.002 (-1.4)
-0.001 (-1.4)
0.000 (-0.3)
0.000 (0.6)
TTENURE 0.007 (0.5)
0.022 (1.6)
0.015 (1.0)
0.024 (2.4) **
0.029 (2.8) ***
0.025 (2.2) **
TTABSENT -0.003 (-1.9) *
-0.002 (-1.6)
-0.003 (-1.9) *
0.000 (0.0)
-0.006 (-1.3)
-0.003 (-0.5)
TOTHJOB 0.115 (0.9)
0.046 (0.3)
-0.030 (-0.2)
-0.006 (-0.1)
-0.012 (-0.1)
-0.046 (-0.4)
TSCORE 0.089 (0.9)
0.005 (0.0)
0.022 (0.2)
0.045 (0.5)
-0.023 (-0.3)
0.020 (0.2)
TSPECIAL -0.039 (-0.2)
-0.085 (-0.5)
-0.094 (-0.5)
0.205 (2.5) **
0.302 (3.6) ***
0.210 (2.2) **
MINS_QUIZ/10 -
0.040 (2.4) **
0.030 (1.8) * -
-0.020 (-1.2)
-0.011 (-0.7)
MINS_HWORK/10 -
-0.021 (-0.9)
0.002 (0.1) -
0.002 (0.1)
0.010 (0.7)
LESSON_PLN -
0.236 (0.9)
0.291 (1.0) -
-0.296 (-1.6)
-0.192 (-1.0)
EXPLAIN -
0.211 (1.6)
0.242 (1.6) -
0.366 (2.6) ***
0.328 (2.1) **
QUESTIONS -
-0.266 (-1.3)
-0.278 (-1.4) -
0.004 (0.0)
0.042 (0.4)
School Characteristics
GIRLS_SCHOOL 0.070 (0.3) -
0.061 (0.3)
-0.112 (-0.6)
- -0.030 (-0.2)
RESOURCE 0.002 (0.4) -
0.004 (0.8)
0.012 (3.1) ***
- 0.009 (2.0) **
LENGTH_STUDY/1000 0.439 (1.3) -
0.567 (1.7) *
-0.318 (-1.6)
- -0.472 (-2.9) **
CLASSIZE/100 0.007 (0.0) -
0.070 (0.2)
-0.499 (2.2) **
- -0.368 (-1.5)
CONSTANT -1.344 (-0.6) -
-2.293 (-1.0)
-1.990 (-0.9)
- -1.511 (-0.7)
N 1353 1353 1353 1353 1353 1353
R2 0.3702 0.3877 0.3978 0.4547 0.4633 0.4633
32
Table 4: Achievement Production Functions (Two subjects, Pooled without and with �teaching process� variables)
OLS School Fixed Effects Pupil Fixed Effects (1) (2) (3) (4) (5) (6) Coefficient
(Robust t) Coefficient (Robust t)
Coefficient (Robust t)
Coefficient (Robust t)
Coefficient (Robust t)
Coefficient (Robust t)
FEMTEACH -0.014 (-0.1)
-0.016 (-0.1)
-0.388 (-2.7) ***
-0.486 (-3.8) ***
-0.427 (-5.8) ***
-0.537 (-7.1) ***
FEMSTUDTEACH 0.274 (1.9) *
0.222 (1.7) *
0.560 (4.7) ***
0.610 (4.8) ***
0.656 (6.7) ***
0.733 (7.3) ***
TMA_PROF 0.035 (0.4)
-0.008 (-0.1)
0.005 (0.0)
-0.076 (-0.6)
0.008 (0.1)
-0.075 (-1.2)
TTRAINYRS 0.000 (0.0)
-0.069 (-1.2)
0.038 (0.6)
0.016 (0.2)
0.043 (1.5)
0.022 (0.8)
TEXP 0.014 (0.8)
0.027 (1.6)
-0.035 (-2.0) **
-0.020 (-1.4)
-0.036 (-3.8) ***
-0.022 (-2.1) **
TEXP2 -0.001 (-1.3)
-0.001 (-1.7) *
0.001 (1.2)
0.001 (1.4)
0.001 (2.3) **
0.001 (2.2) **
TTENURE 0.021 (2.8) ***
0.019 (2.6) ***
0.018 (3.1) ***
0.010 (1.7) *
0.018 (4.9) ***
0.010 (2.4) **
TTABSENT -0.001 (-0.4)
0.000 (0.0)
0.000 (0.2)
0.000 (-0.5)
0.000 (0.3)
-0.001 (-0.7)
TOTHJOB 0.064 (0.7)
0.069 (0.7)
0.085 (0.6)
0.169 (1.5)
0.086 (1.6)
0.170 (3.3) ***
TSCORE 0.116 (1.7) *
0.092 (1.1)
0.087 (1.8) *
0.095 (2.0) *
0.086 (3.0) ***
0.092 (2.8) ***
TSPECIAL 0.179 (2.3) **
0.129 (1.5)
0.029 (0.4)
-0.044 (-0.6)
0.024 (0.7)
-0.048 (-1.2)
MINS_QUIZ/10 - 0.032 (3.1) ***
- 0.030 (2.2) **
- 0.030 (3.8) ***
MINS_HWORK/10 - -0.012 (-0.8)
- -0.020 (-2.0) **
- -0.021 (-3.8) ***
LESSON_PLN - 0.144 (1.1)
- 0.219 (1.4)
- 0.230 (2.7) ***
EXPLAIN - 0.141 (1.6)
- 0.040 (0.5)
- 0.043 (0.9)
QUESTIONS - -0.161 (-1.7) *
- 0.210 (2.1) **
- 0.210 (3.8) ***
Subject Dummy Yes Yes Yes Yes Yes Yes Pupil Variables Yes Yes Yes Yes No No School Variables Yes Yes No No No No N 2706 2694 2706 2694 2706 2694 R2/R2 within 0.3879 0.4048 0.1988 0.2114 0.0825 0.1197 No. of Groups - - 50 50 1353 1353 F (p-value) 23.31 (0.000) 37.86 (0.000) 43.24 (0.000) 33.68 (0.000) 11.57 (0.000) 11.97 (0.000)
33
Table 5: Pupil Fixed Effects Achievement Function by School Type
PRIVATE GOVERNMENT Coefficient
(Robust t) Coefficient
(Robust t)
TMA_PROF -0.585 (-4.3) ***
0.069 (0.8)
TTRAINYRS -0.146 (-3.9) ***
-0.004 (0.0)
TEXP 0.026 (1.1)
-0.025 (1.1)
TEXP2 -0.003 (-2.9) ***
0.001 (1.0)
TTENURE 0.043 (2.4) **
0.009 (1.3)
TTABSENT 0.006 (1.7) *
0.001 (0.6)
TOTHJOB 0.407 (4.9) ***
-0.216 (-1.8) *
TSCORE 0.047 (0.8)
0.169 (1.8) *
TSPECIAL -0.176 (-2.8) **
0.107 (1.0)
MINS_QUIZ/10 0.048 (4.2) ***
0.037 (2.7) **
MINS_HWORK/10 -0.013 (-1.8) *
0.010 (0.5)
LESSON_PLN 0.222 (0.8)
-0.053 (-0.3)
EXPLAIN 0.063 (0.9)
0.070 (0.6)
QUESTIONS 0.569 (5.6) ***
0.065 (0.7)
Subject Dummy Yes Yes N 1424 1270 No. of Groups 718 635 R2 within 0.1380 0.1768
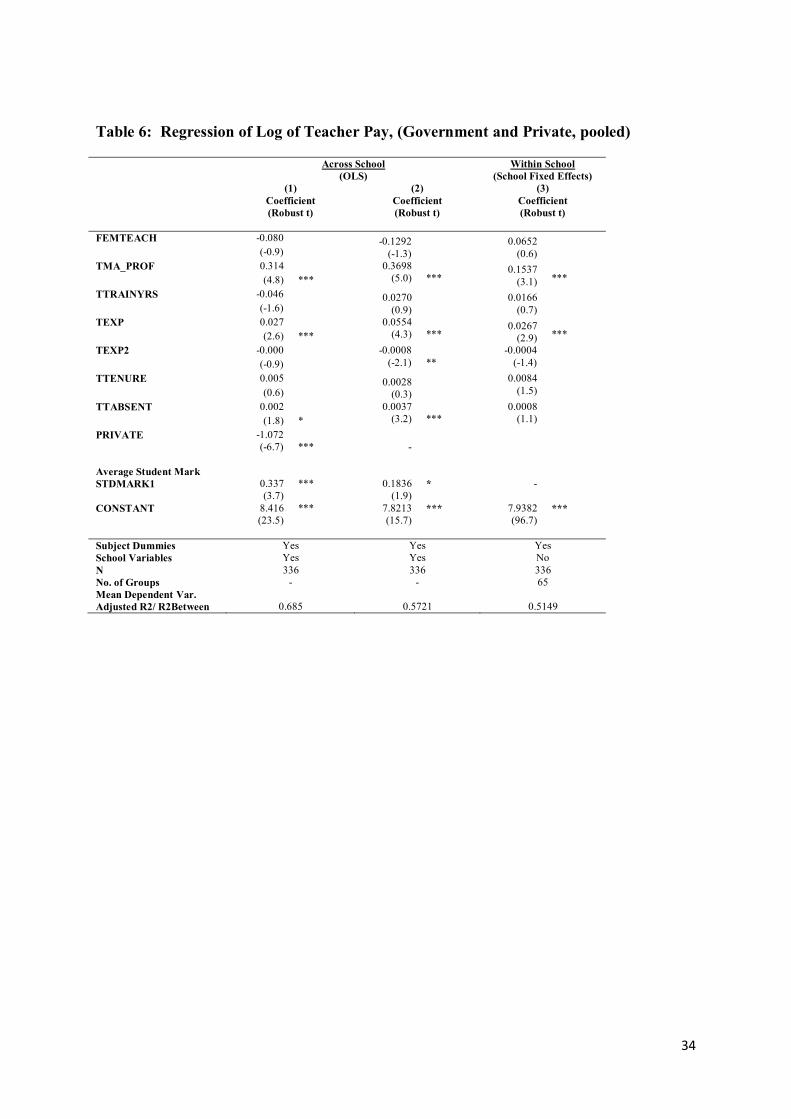
34
Table 6: Regression of Log of Teacher Pay, (Government and Private, pooled)
Across School (OLS)
Within School (School Fixed Effects)
(1) (2) (3) Coefficient
(Robust t) Coefficient (Robust t)
Coefficient (Robust t)
FEMTEACH -0.080
(-0.9) -0.1292
(-1.3) 0.0652
(0.6)
TMA_PROF 0.314 (4.8) ***
0.3698 (5.0)
***
0.1537 (3.1)
***
TTRAINYRS -0.046 (-1.6)
0.0270 (0.9)
0.0166 (0.7)
TEXP 0.027 (2.6) ***
0.0554 (4.3)
***
0.0267 (2.9)
***
TEXP2 -0.000 (-0.9)
-0.0008 (-2.1)
**
-0.0004 (-1.4)
TTENURE 0.005 (0.6)
0.0028 (0.3)
0.0084 (1.5)
TTABSENT 0.002 (1.8) *
0.0037 (3.2)
***
0.0008 (1.1)
PRIVATE -1.072 (-6.7)
***
-
Average Student Mark STDMARK1 0.337
(3.7) *** 0.1836
(1.9) * -
CONSTANT 8.416 (23.5)
*** 7.8213 (15.7)
*** 7.9382 (96.7)
***
Subject Dummies Yes Yes Yes School Variables Yes Yes No N 336 336 336 No. of Groups - - 65 Mean Dependent Var. Adjusted R2/ R2Between 0.685 0.5721 0.5149
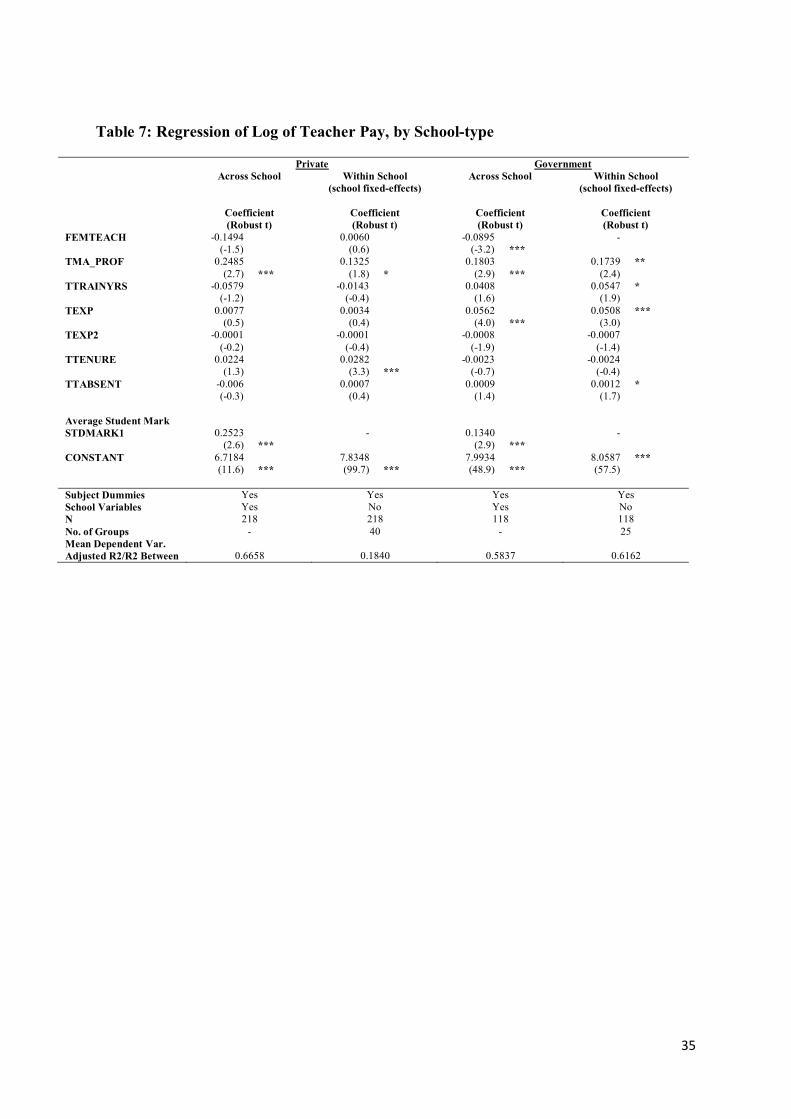
35
Table 7: Regression of Log of Teacher Pay, by School-type
Private Government Across School Within School
(school fixed-effects) Across School Within School
(school fixed-effects)
Coefficient (Robust t)
Coefficient (Robust t)
Coefficient (Robust t)
Coefficient (Robust t)
FEMTEACH -0.1494 (-1.5)
0.0060 (0.6)
-0.0895 (-3.2)
***
-
TMA_PROF 0.2485 (2.7)
***
0.1325 (1.8)
*
0.1803 (2.9)
***
0.1739 (2.4)
**
TTRAINYRS -0.0579 (-1.2)
-0.0143 (-0.4)
0.0408 (1.6)
0.0547 (1.9)
*
TEXP 0.0077 (0.5)
0.0034 (0.4)
0.0562 (4.0)
***
0.0508 (3.0)
***
TEXP2 -0.0001 (-0.2)
-0.0001 (-0.4)
-0.0008 (-1.9)
-0.0007 (-1.4)
TTENURE 0.0224 (1.3)
0.0282 (3.3)
***
-0.0023 (-0.7)
-0.0024 (-0.4)
TTABSENT -0.006 (-0.3)
0.0007 (0.4)
0.0009 (1.4)
0.0012 (1.7)
*
Average Student Mark STDMARK1 0.2523
(2.6) ***
- 0.1340 (2.9)
***
-
CONSTANT 6.7184 (11.6)
***
7.8348 (99.7)
***
7.9934 (48.9)
***
8.0587 (57.5)
***
Subject Dummies Yes Yes Yes Yes School Variables Yes No Yes No N 218 218 118 118 No. of Groups - 40 - 25 Mean Dependent Var. Adjusted R2/R2 Between 0.6658 0.1840 0.5837 0.6162
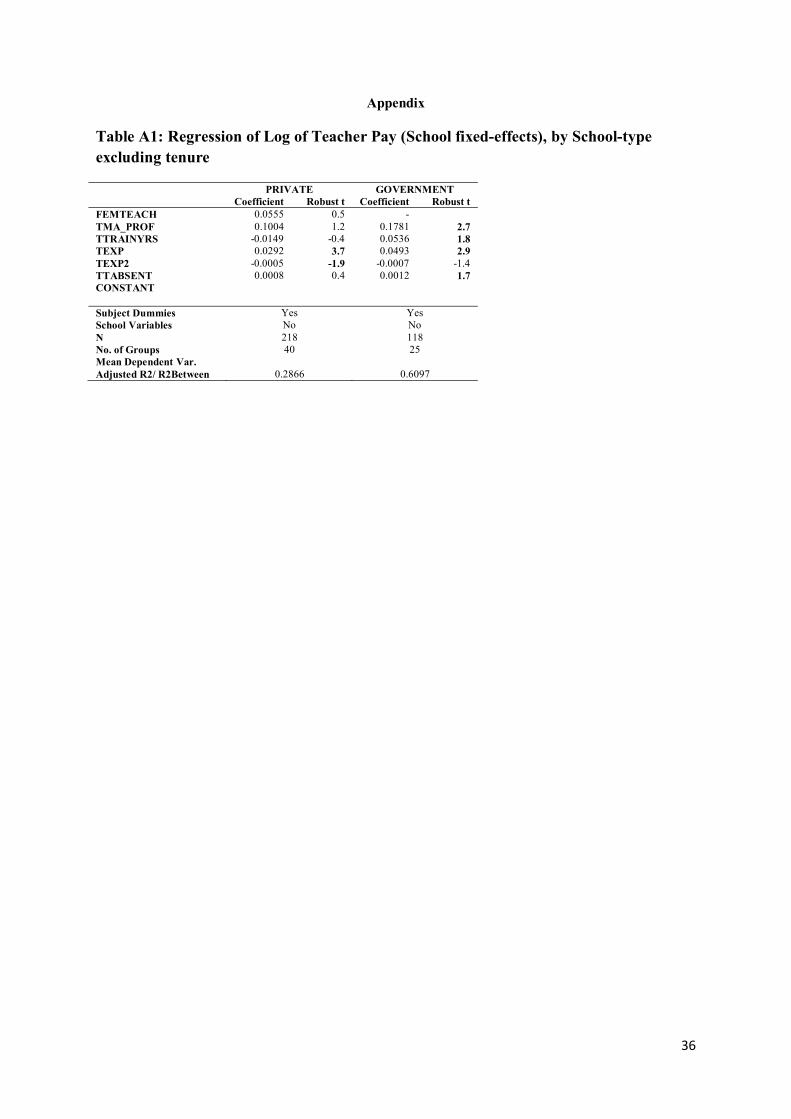
36
Appendix
Table A1: Regression of Log of Teacher Pay (School fixed-effects), by School-type excluding tenure
PRIVATE GOVERNMENT Coefficient Robust t Coefficient Robust t FEMTEACH 0.0555 0.5 - TMA_PROF 0.1004 1.2 0.1781 2.7 TTRAINYRS -0.0149 -0.4 0.0536 1.8 TEXP 0.0292 3.7 0.0493 2.9 TEXP2 -0.0005 -1.9 -0.0007 -1.4 TTABSENT 0.0008 0.4 0.0012 1.7 CONSTANT Subject Dummies Yes Yes School Variables No No N 218 118 No. of Groups 40 25 Mean Dependent Var. Adjusted R2/ R2Between 0.2866 0.6097
Related Documents