What can modelling tell us about HIV and TB that we don’t already know?

Welcome message from author
This document is posted to help you gain knowledge. Please leave a comment to let me know what you think about it! Share it to your friends and learn new things together.
Transcript

What can modelling tell us about HIV and TB that we
don’t already know?

I am not interested in this or that phenomenon, in the spectrum of this or that element. I want to know [God’s] thoughts, the rest are details.
Albert Einstein

Nature only uses the longest threads to weave her patterns, so each small piece of her fabric reveals the organization of the entire tapestry.
Richard Feynman

1. Why is there so much HIV in southern Africa and so little in India and Latin America?
2. Can we control TB without controlling AIDS?
3. Why does survival after infection with HIV vary from months to decades?
4. Is migration important in determining the spread of HIV.
Questions for Einstein
1. Is the prevalence of HIV in Harare really declining at 10% per year?
2. Are CD4 counts a useful measure of immune status for people with HIV?
3. Of TB cases in HIV+ people, what proportion are new and what proportion are reactivations?
4. What is the duration of TB disease in HIV+ and HIV- people?
Questions for Feynman

Theories and models
A model is the expression of a theory
1. Models should be as simple as possible but no simpler.
2. Always start from what is known.
3. Only add complexity as the data or the questions demand it.

15 – 40 5 – 15 1 – 50.5 – 10.1 – 0.50.0 – 0.1 No data
Prevalence of HIV among adults (%)
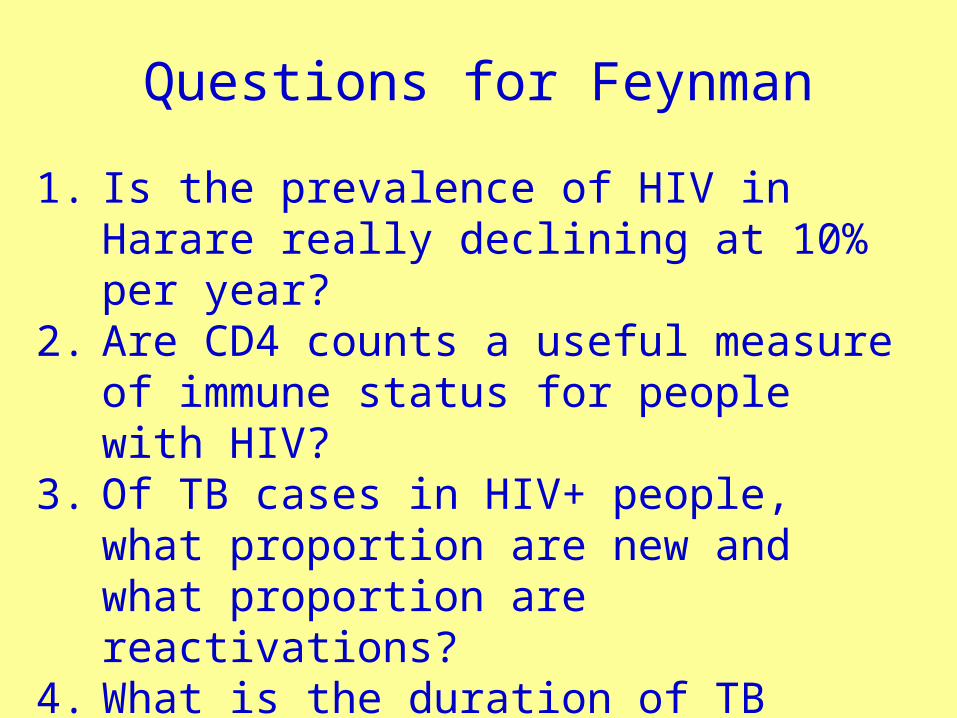
Highest per capita TB incidence in Africa
25 to 49
50 to 99
100 to 299
< 10
10 to 24
300 or more
No Estimate
per 100 000 population
The boundaries and names shown and the designations used on this map do not imply the expression of any opinion whatsoever on the part of the World Health Organization concerning the legal status of any country, territory, city or area or of its authorities, or concerning the delimitation of its frontiers or boundaries. Dotted lines on maps represent approximate border lines for which there may not yet be full agreement.
© WHO 2002
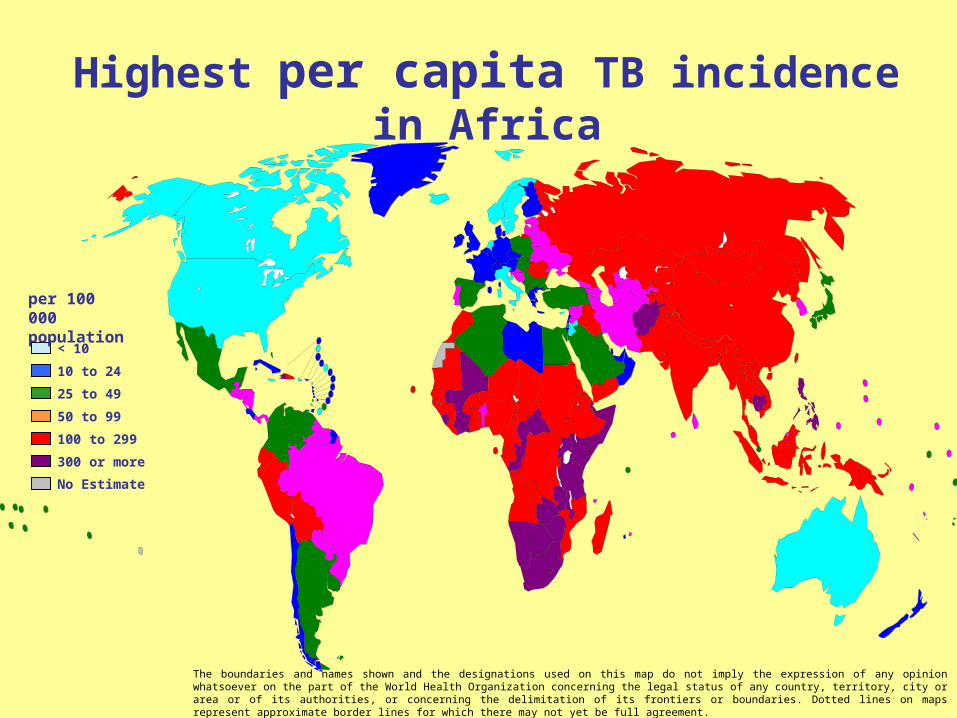
Prevalence of HIV in adults (2005)
North India: 0.2%
South India: 1.5%
Brazil: 0.7%
West Africa: 3%
East Africa: 5%
South Africa: 21%
(Median values in Africa)

Kinds of models
1.Dimensional models
2.Analytical models
3.Simple compartmental models
4.Complex compartmental
models
5.Stochastic models
6.Micro-simulation models
7.Network models
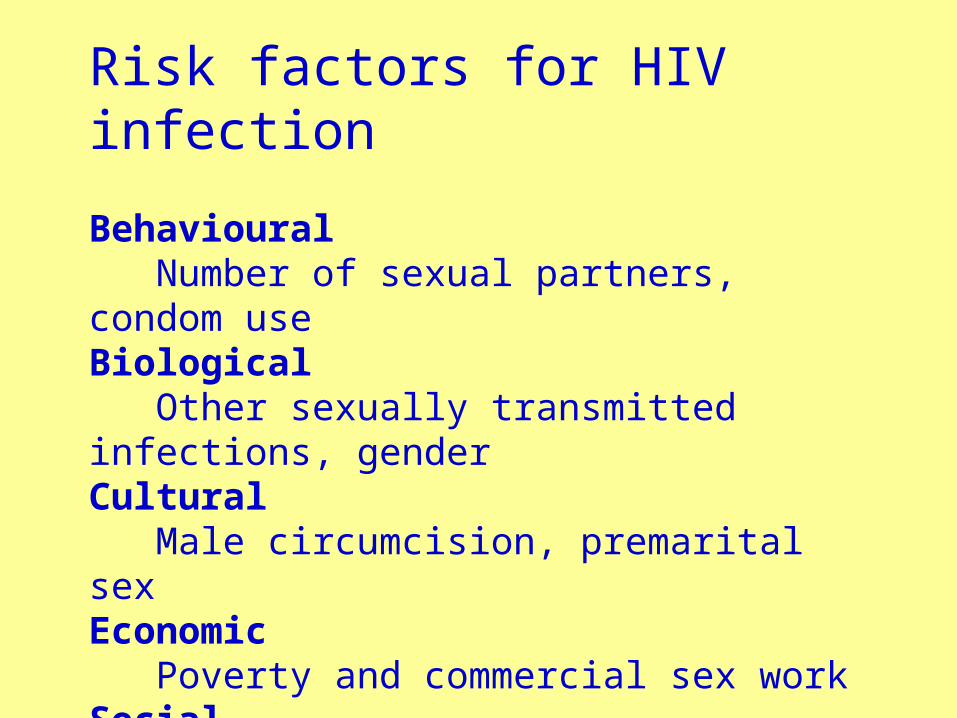
Risk factors for HIV infection
Behavioural Number of sexual partners, condom useBiological Other sexually transmitted infections, genderCultural Male circumcision, premarital sexEconomic Poverty and commercial sex workSocial Peer pressure and gender violenceOccupational Truck drivers and mine workers

Risk factors for TB
Behavioural Alcoholism, smokingBiological Gender, possibly race, age, HIVEconomic Poverty, crowding, indoor solid fuelOccupational Silica exposure

Three key concepts
R0: how many people does one person infect?
Generation time T0 : How long does it take?
Steady state P0: Where does it settle down?

0
5
10
15
20
25
30
1990 1995 2000 2005
HIV
pre
vale
nce
(%)
ANC women in South Africa
Doubling time = 15 months
R0 = 120/15 = 8
e( )
1 e
t
t
aP t

1. Grosskurth, H., et al., Impact of improved treatment of sexually transmitted diseases on HIV infection in rural Tanzania: randomised controlled trial. Lancet, 1995. 346: p. 530-6.2. Laga, M. STD control for HIV prevention--it works! Lancet, 1995. 346: p. 518-9.
Syndromic management of sexually transmitted diseases, Mwanza, Tanzania
Prevalence of STIs ~ 10%Curable STIs increase transmission ~ 5 timesSTIs increase HIV incidence by 0.15+0.91 = 1.4 times
Measured incidence in two groups of villages
Control: 0.9%/yr Intervention: 0.6%/yr
Ratio: 1.6 (1.2–2.2)1
It works!2
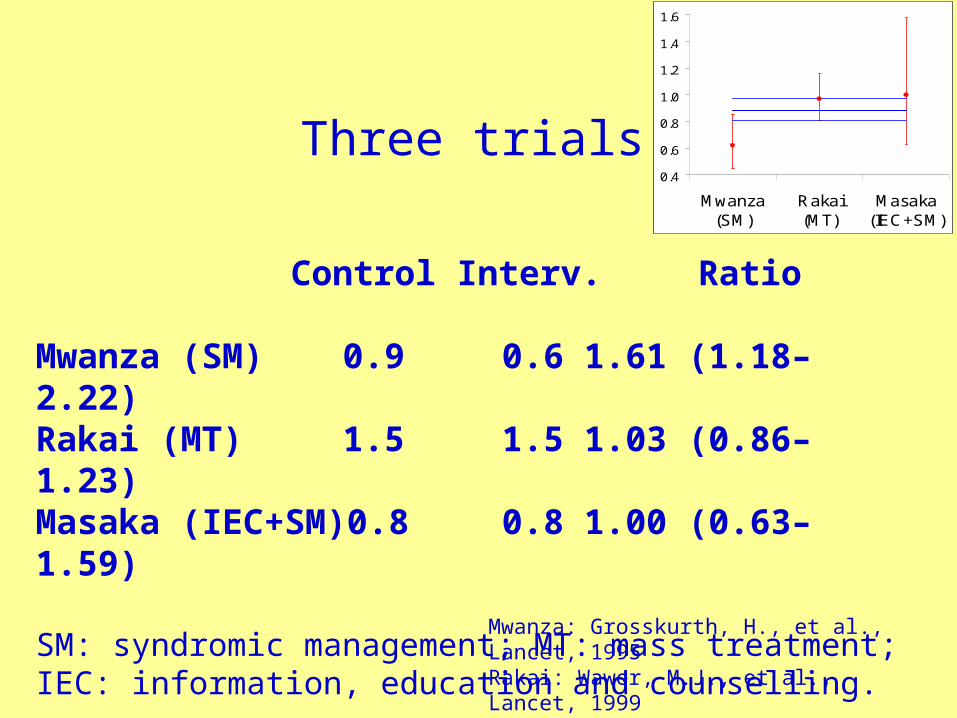
Mwanza: Grosskurth, H., et al., Lancet, 1995Rakai: Wawer, M.J., et al., Lancet, 1999Masaka: Kamali, A., et al., Lancet, 2003
Control Interv. Ratio
Mwanza (SM) 0.9 0.6 1.61 (1.18–2.22)Rakai (MT) 1.5 1.5 1.03 (0.86–1.23)Masaka (IEC+SM) 0.8 0.8 1.00 (0.63–1.59)
SM: syndromic management; MT: mass treatment; IEC: information, education and counselling.
Three trials0.4
0.6
0.8
1.0
1.2
1.4
1.6
Mwanza(SM)
Rakai(MT)
Masaka(IEC+SM)

STDSim: Micro-simulation model
•Individual based•Stochastic•Health care•STI natural history and transmission•Sexual behaviour•Demography•Interventions

Richard White’s conclusion
…in widely disseminated HIV epidemics … STI treatment may [not be an] effective HIV prevention strategy. In less advanced … HIV epidemics [it may be an] effective … strategy, and it remains useful … in sub-populations with very high rates of STIs, such as sex workers, their clients and regular partners.
Richard White Variability in the effectiveness of STI treatment interventions to prevent HIV transmission in Eastern and Southern Africa, Ph.D. Thesis. LSHTM, 2006
0
5
10
15
20
1970 1990 2010 2030
Pre
vale
nce
(%)
ANC women
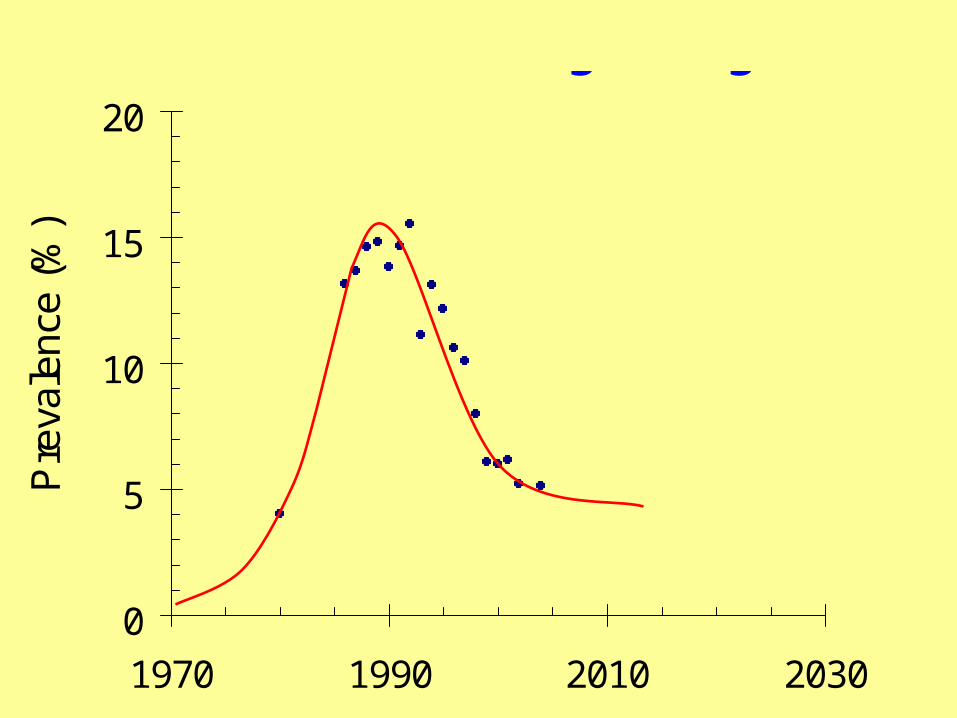
Behaviour change in Uganda
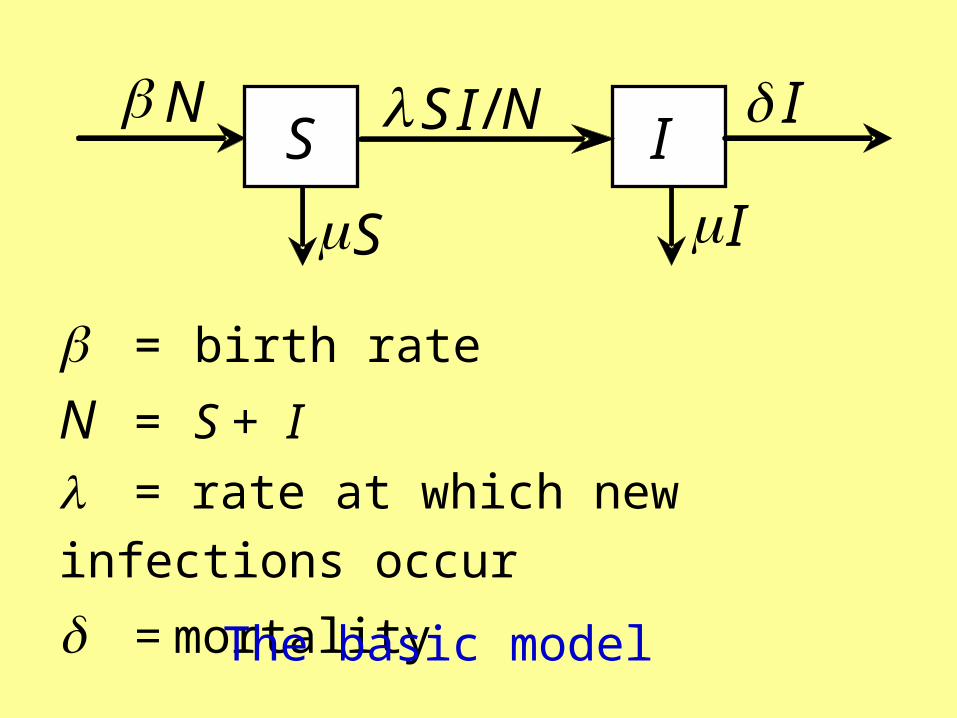
= birth rate
N = S + I
= rate at which new infections occur
= mortality
S I
I N SI /N I
S
The basic model

0
20
40
60
80
100
1970 1990 2010 2030
Pre
vale
nce
(%)
012345678910
Inci
denc
e/M
orta
lity
(%/y
r)
ANC women in Uganda
R0 = 3.3
0
0
-1=70%
R
R
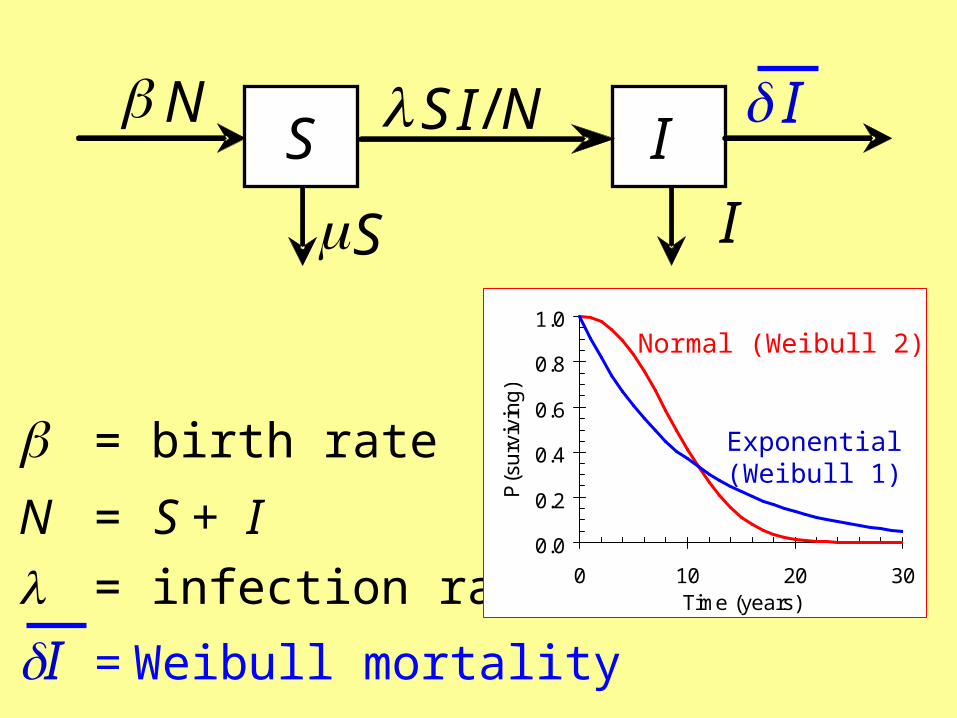
= birth rate
N = S + I
= infection rate
I = Weibull mortality
S I
I N SI /N I
S
0.0
0.2
0.4
0.6
0.8
1.0
0 10 20 30Time (years)
P(s
urv
ivin
g)
Normal (Weibull 2)
Exponential(Weibull 1)
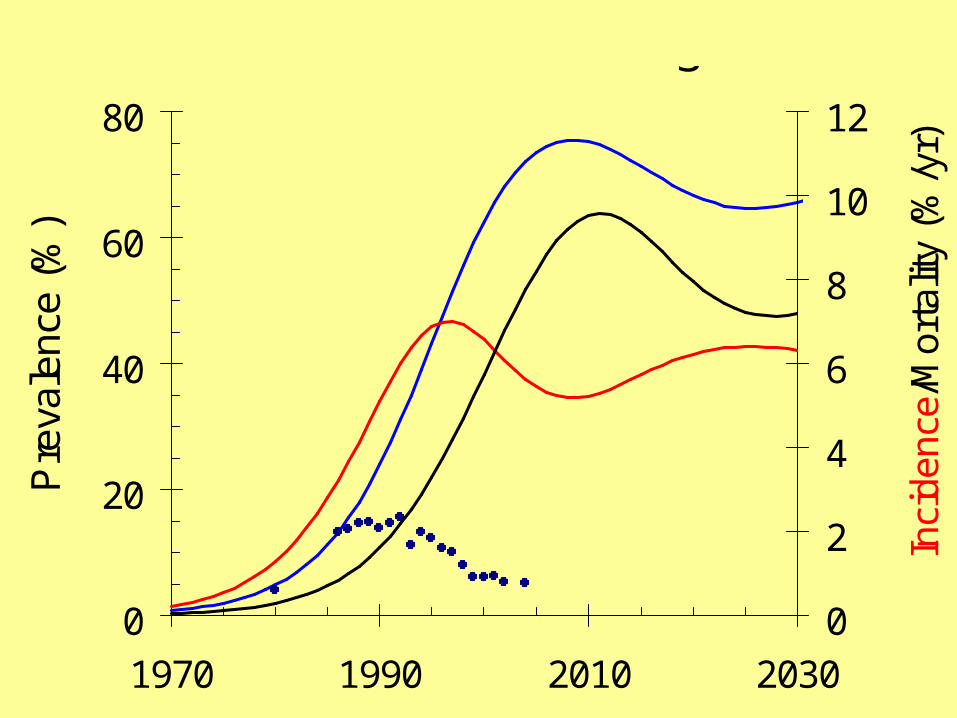
0
20
40
60
80
1970 1990 2010 2030
Pre
vale
nce
(%)
0
2
4
6
8
10
12
Inci
denc
e/M
orta
lity
(%/y
r)
ANC women in Uganda

= birth rate
N = population = e–P
I = Weibull mort.
~
~
S I
I N S I /N I S
0.0
0.2
0.4
0.6
0.8
1.0
0 10 20 30Prevalence (%)
Re
lativ
e t
ran
smis
sio
n
.
–Pe
Heterogeneity in sexual behaviour

0
5
10
15
1970 1990 2010 2030
Pre
vale
nce
(%)
0
1
2
Inci
denc
e/M
orta
lity
(%/y
r)
ANC women in Uganda

0.0
0.2
0.4
0.6
0.8
1.0
1985 1990 1995 2000Year
Re
lativ
e t
ran
smis
sio
n
.
~
S I
I N SI /N I
S ~
= birth rate
N = population = C(t)
I = mortality
~
~
C(t)
Including control

0
5
10
15
1970 1990 2010 2030
Pre
vale
nce
(%)
0
1
2
Inci
denc
e/M
orta
lity
(%/y
r)
ANC women in Uganda

~
S I
I N SI /N I
S *
= birth rate
N = population = e
I = mortality
~
* –M
0.0
0.2
0.4
0.6
0.8
1.0
0 2 4Annual mortality (%)
Re
lativ
e t
ran
smis
sio
n
. –Me
Mortality leads to behaviour change

0
5
10
15
1970 1990 2010 2030
Pre
vale
nce
(%)
0
1
2
Inci
denc
e/M
orta
lity
(%/y
r)
ANC women in Uganda

Nairobi
6 yr
Nunn P et al. Tuberculosis control in the era of HIV. Nat Rev Immunol. 2005 Oct;5(10):819-26.

9.4
1.11.11.0
5.9
2.2
0
2
4
6
8
10
1991-1994 1995-1997 1998-1999
Ann
ual in
ciden
ce (
%)
.HI V- HI V+
TB incidence among gold miners in SACorbett EL Stable incidence rates of tuberculosis (TB) among human immunodeficiency virus (HIV)-negative South African gold miners during a decade of epidemic HIV-associated TB. J Infect Dis. 2003;188: 1156-63.
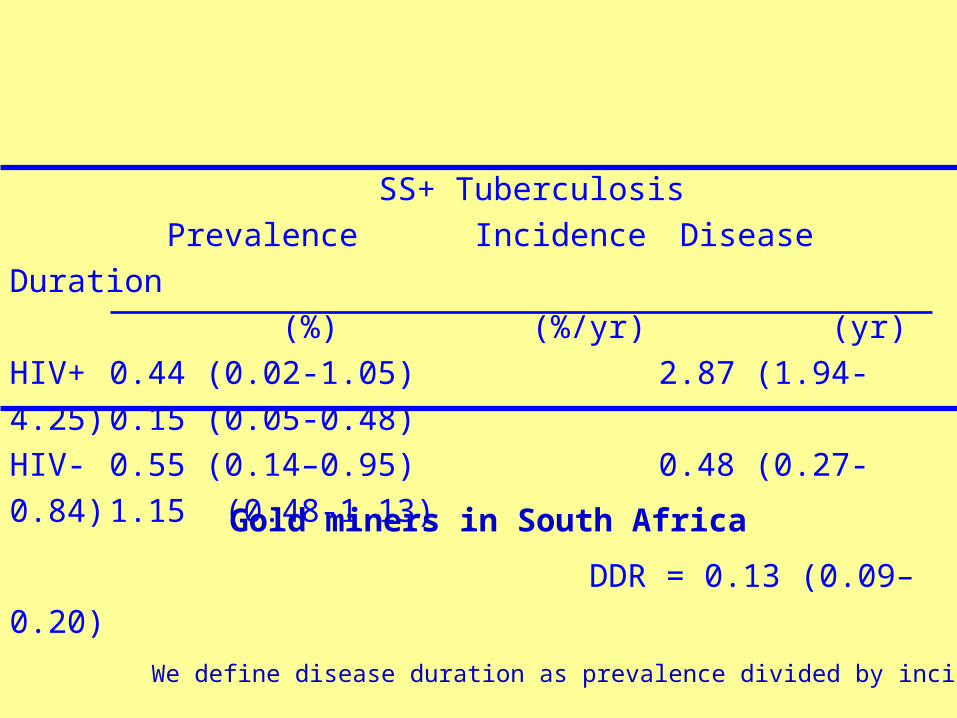
SS+ Tuberculosis
Prevalence Incidence Disease Duration
(%) (%/yr) (yr)
HIV+ 0.44 (0.02-1.05) 2.87 (1.94-4.25) 0.15 (0.05-0.48)
HIV- 0.55 (0.14–0.95) 0.48 (0.27-0.84) 1.15 (0.48-1.13) DDR = 0.13 (0.09–0.20)
Gold miners in South Africa
We define disease duration as prevalence divided by incidence
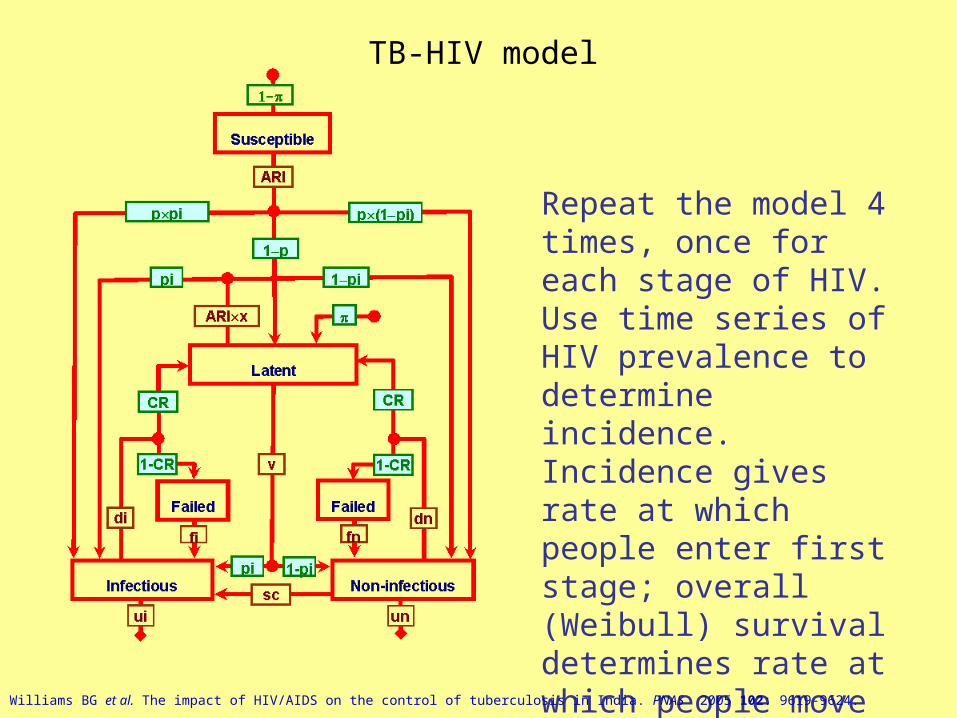
Repeat the model 4 times, once for each stage of HIV. Use time series of HIV prevalence to determine incidence. Incidence gives rate at which people enter first stage; overall (Weibull) survival determines rate at which people move to next stage.
TB-HIV model
Williams BG et al. The impact of HIV/AIDS on the control of tuberculosis in India. PNAS 2005 102: 9619-9624.

Impact of interventions on TB cases in KenyaT
B in
cide
nce/
100k
/yr
800
600
400
200
0
.Baseline
ARV 80%
TLTI (6 m)
TLTI (life)
ARV 100%
TB detect.
TB cure
HIV incid
Base line:CDR = 50%CR = 70%Interventions:1% increase
1980 2000 2020 2040 Year
Currie, C. et al. Cost, affordability and cost-effectiveness of strategies to control tuberculosis in countries with high HIV prevalence. BMC, 2005. 5: 130.

Percent Percent HIV positive HIV negative
Williams BG et al. HIV Infection, Antiretroviral Therapy, and CD4+ Cell Count Distributions in African Populations. J Infect Dis, 2006 194: 1450-8.
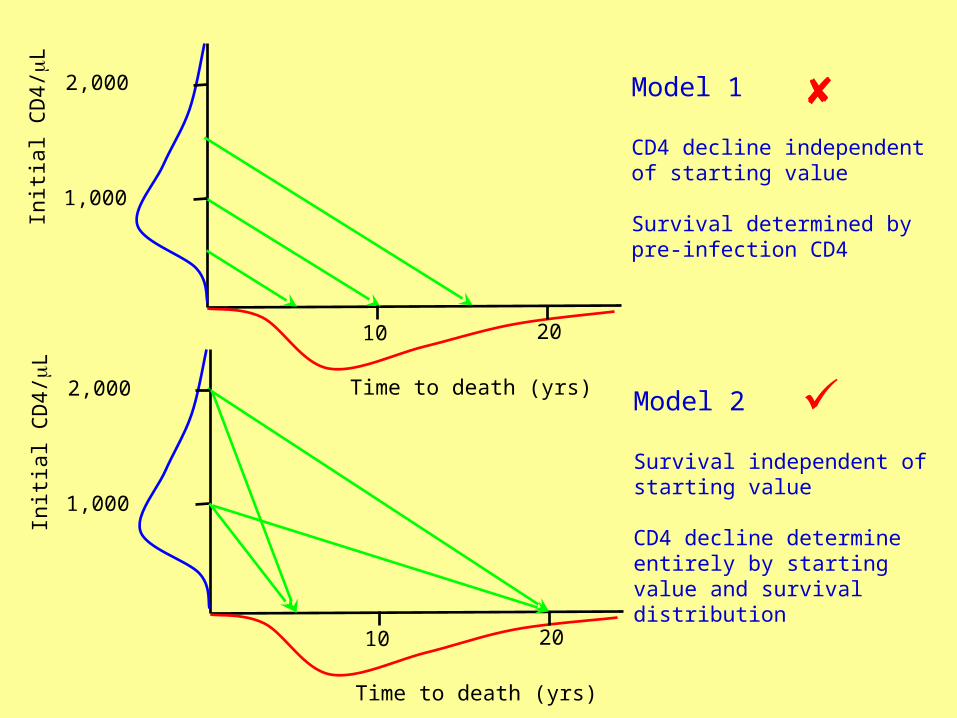
1,000
2,000
10 20
Time to death (yrs)
Initi
al C
D4/
L
Time to death (yrs)
1,000
2,000
10 20
Initi
al C
D4/
L
Model 1
CD4 decline independent of starting value
Survival determined by pre-infection CD4
Model 2
Survival independent of starting value
CD4 decline determine entirely by starting value and survival distribution
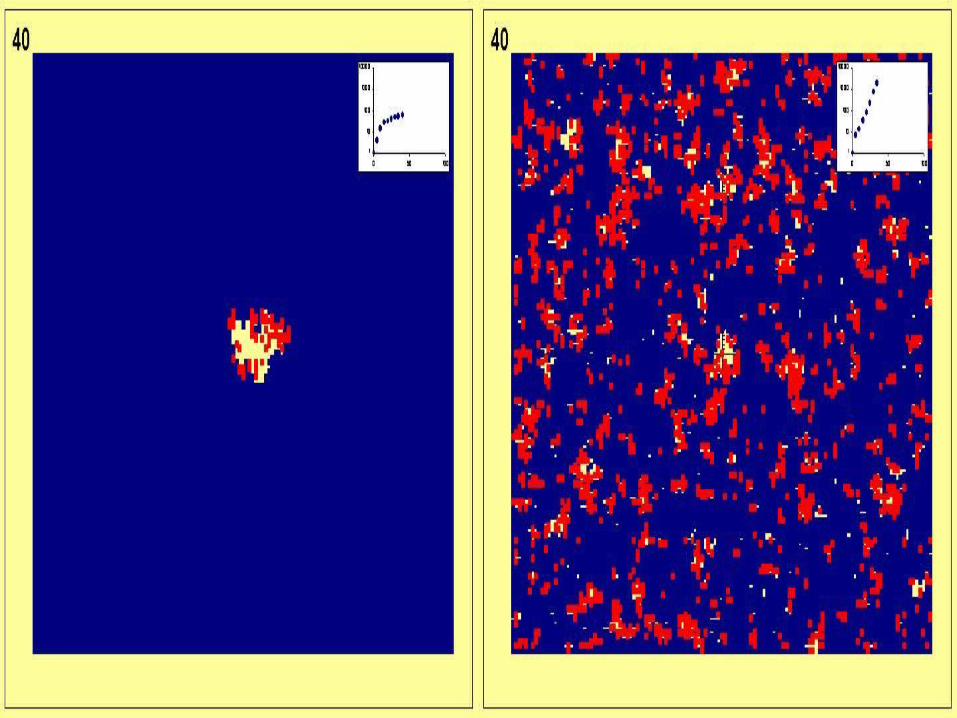
Spatial Epidemiology of HIV
Doubling time = 1 yearLife expectancy = 10 yearsNumber of partners = 4
Proportion of random partners chosen at random = 0 (left hand set) or 10% (right hand set) in the following slides.
Note that in this model migrants have exactly the same sexual behaviour and individual risk as non-migrants.


1. Can we combine spatial/network models with our more conventional continuous time models of HIV?
2. Can we get a better understanding of the host-viral interaction?
3. What are the population level implications of 2?
4. Do we have enough data to explore fully the joint dynamics of TB and HIV?
Questions for all of us

Advice to young epidemiologists
Never make a calculation until you know the answer. Make an estimate before every calculation,
try a simple biological argument (R0, generation time, selection, survival, control). Guess the answer to every puzzle. Courage: no one else needs to know what the guess is. Therefore, make it quickly, by instinct. A right guess reinforces this instinct. A wrong guess brings the refreshment of surprise. In either case, life as an epidemiologist, however long, is more fun.
Plagiarised from E.F. Taylor and J.A. Wheeler Space-time Physics 1963
Related Documents