
Welcome message from author
This document is posted to help you gain knowledge. Please leave a comment to let me know what you think about it! Share it to your friends and learn new things together.
Transcript

7/28/2019 What Are the Control Charts
http://slidepdf.com/reader/full/what-are-the-control-charts 1/26
P R O J E C T M A N A G E M E N T C E N T R E O F
E X C E L L E N C E
I P D / O U M
What are the Control Charts?
7/28/2019 What Are the Control Charts
http://slidepdf.com/reader/full/what-are-the-control-charts 2/26
Why Control Charts
They will let you know if an element within your project is out of control ornot
Control charts using historical,forecasted and actual data can helpproject managers determine if projectsare in control, off scope or over budget.

7/28/2019 What Are the Control Charts
http://slidepdf.com/reader/full/what-are-the-control-charts 3/26
What Can They do?
Project schedules, baselines, costs and budgets can all be measured with a few analysis tools
Control charts using historical,forecasted and actual data can helpproject managers determine if projectsare in control, off scope or over budget

7/28/2019 What Are the Control Charts
http://slidepdf.com/reader/full/what-are-the-control-charts 4/26
History of Control Charts
Walter Shewhart first utilized controlcharts in 1924 to aid the world of manufacturing.
W. Edward Deming added elements tocontrol charts to assess every area of aprocess or organization when totalquality management (TQM) was
explored.
7/28/2019 What Are the Control Charts
http://slidepdf.com/reader/full/what-are-the-control-charts 5/26
“no matter how well the
process is designed, there
exists a certain amount of
nature variability in outputmeasurements”
- Walter Shewhart, 1924

7/28/2019 What Are the Control Charts
http://slidepdf.com/reader/full/what-are-the-control-charts 6/26
•“A trend analysis is performed using run chartsand involves mathematical techniques to forecastfuture outcomes based on historical results”
• What a trend analysis reveals is whether theproject or an element of the project is where itshould be or way off track. Estimators,
• Pareto and control charts are the most popularly used methods of analyzing trends along withsimple product sampling
PMBOK view on Trends

7/28/2019 What Are the Control Charts
http://slidepdf.com/reader/full/what-are-the-control-charts 7/26
“A control chart tells you how much variationthe process causes. A
stable process producespredictable results
consistently” -Know Ware, the maker of QI Macros SPC Excel
Software for Six Sigma

7/28/2019 What Are the Control Charts
http://slidepdf.com/reader/full/what-are-the-control-charts 8/26
Causes of Fluctuation
Most examples of a controlcharts consider two causes of
fluctuation:I. Common causes, and
II. Special causes
7/28/2019 What Are the Control Charts
http://slidepdf.com/reader/full/what-are-the-control-charts 9/26
A Common Cause - e.g. Baking a cake
Common causes might be,
Types of oven utilized or high
elevation cooking—those items
would be considered a common
mishap if the cake baking process
failed. Essentially, if you don’t
know the exact temperature of anolder oven or high elevation
directions are not offered, it’s
acceptable a cake as an example
7/28/2019 What Are the Control Charts
http://slidepdf.com/reader/full/what-are-the-control-charts 10/26
A Special Cause - e.g. Baking a cake
Special causes (in baking that samecake) might be,
a recipe that forgets the baking
powder as a needed ingredient.The lack of baking powder is a
special cause as it “causes” the
cake baking process to fail.
Therefore, why the cake bakingprocess failed must first be
discovered (e.g. lack of baking
powder ) and then corrected
7/28/2019 What Are the Control Charts
http://slidepdf.com/reader/full/what-are-the-control-charts 11/26
.
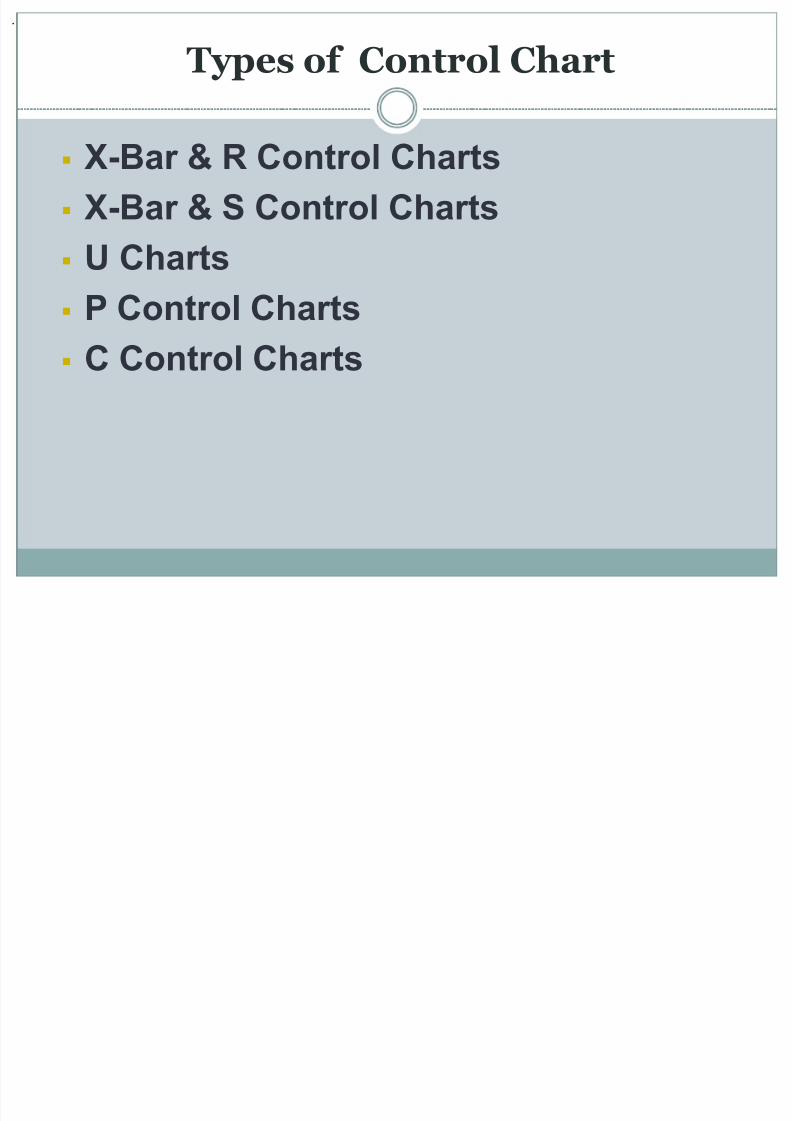
Types of Control Chart
X-Bar & R Control Charts
X-Bar & S Control Charts
U Charts
P Control Charts
C Control Charts
7/28/2019 What Are the Control Charts
http://slidepdf.com/reader/full/what-are-the-control-charts 12/26
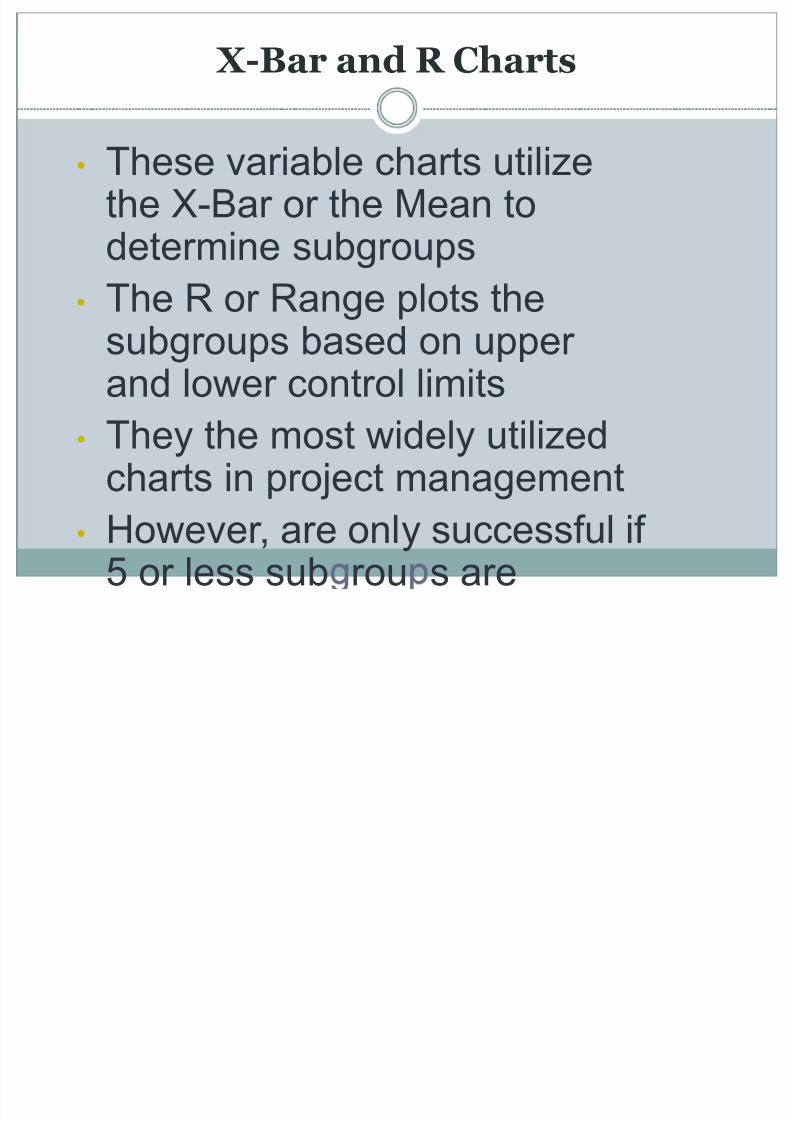
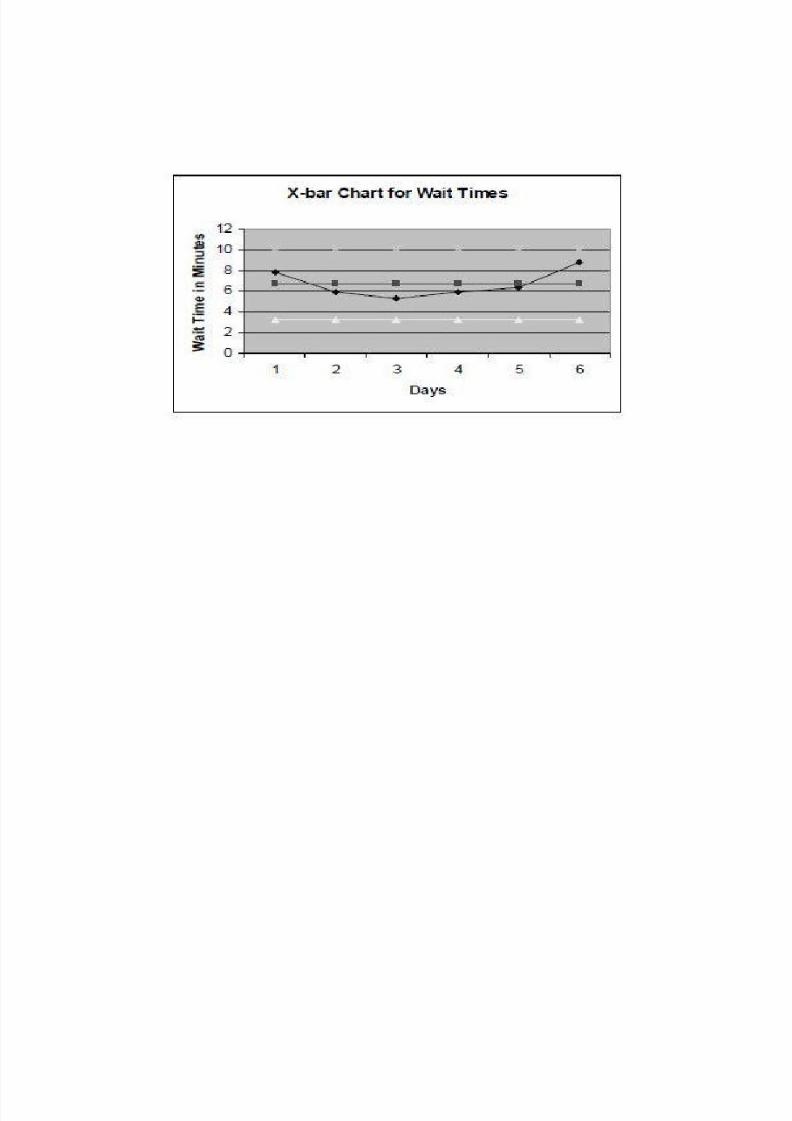
X-Bar and R Charts
• These variable charts utilizethe X-Bar or the Mean todetermine subgroups
• The R or Range plots thesubgroups based on upper and lower control limits
• They the most widely utilizedcharts in project management
• However, are only successful if 5 or less sub rou s are

7/28/2019 What Are the Control Charts
http://slidepdf.com/reader/full/what-are-the-control-charts 13/26
X Bar and S Charts
Using this example of a
variable control chart is
effective for 5 or moresubgroups
The S or Standard Deviations
are considered in bothupper and lower control
limits based on the X-Bar or
Mean

7/28/2019 What Are the Control Charts
http://slidepdf.com/reader/full/what-are-the-control-charts 14/26
U Charts
These variable types of
control charts utilize an upper
and lower range Elements falling in the upper
range need attention and
analysis in order for theproblem to be corrected

7/28/2019 What Are the Control Charts
http://slidepdf.com/reader/full/what-are-the-control-charts 15/26
p Control Charts
• This attribute-type chart is
effective when elements are
not equal• A p Control Chart might be
used to determine how many
accidents occur each day at achosen intersection

7/28/2019 What Are the Control Charts
http://slidepdf.com/reader/full/what-are-the-control-charts 16/26
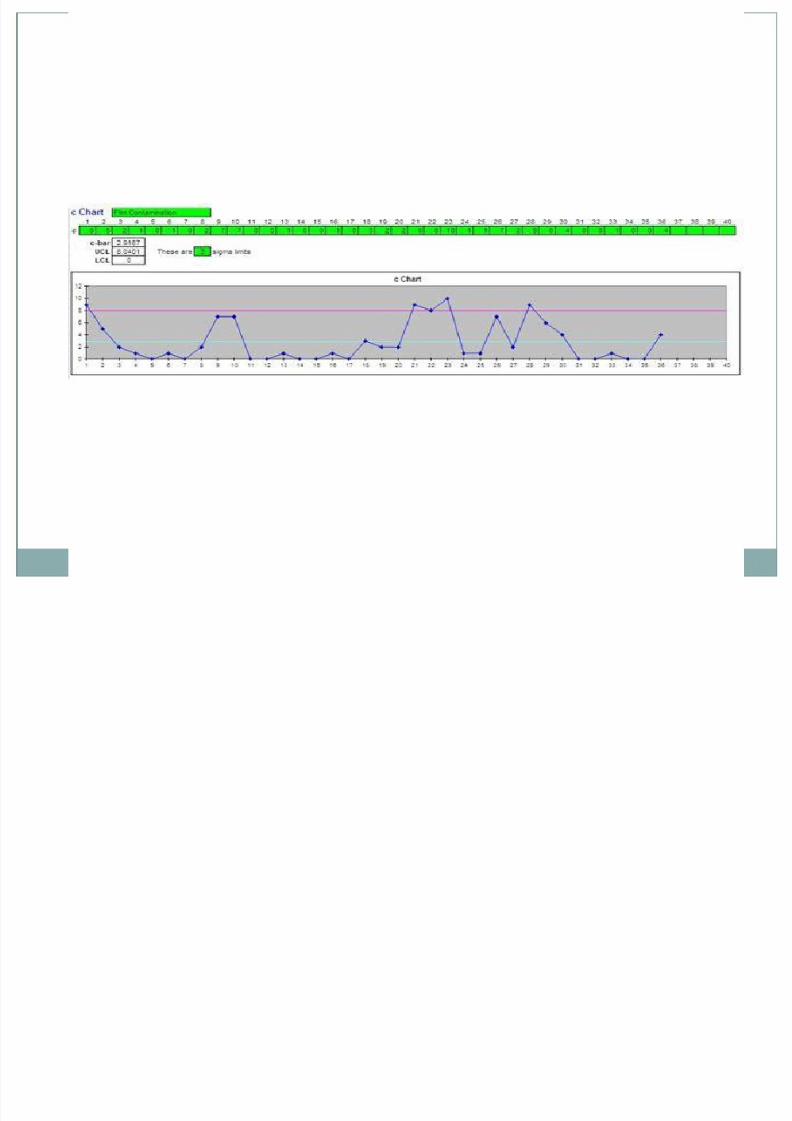
c Control Charts
Another attribute-type control
chart, the c Control Chart
explores elements that arenonconforming
A c Control Chart might be
used to explore mass-production of one similar
product where the elements
per unit do not conform to
7/28/2019 What Are the Control Charts
http://slidepdf.com/reader/full/what-are-the-control-charts 17/26

7/28/2019 What Are the Control Charts
http://slidepdf.com/reader/full/what-are-the-control-charts 18/26
7/28/2019 What Are the Control Charts
http://slidepdf.com/reader/full/what-are-the-control-charts 19/26

7/28/2019 What Are the Control Charts
http://slidepdf.com/reader/full/what-are-the-control-charts 20/26

7/28/2019 What Are the Control Charts
http://slidepdf.com/reader/full/what-are-the-control-charts 21/26

7/28/2019 What Are the Control Charts
http://slidepdf.com/reader/full/what-are-the-control-charts 22/26
“A trend analysis is
performed using runcharts and involves
mathematical techniquesto forecast futureoutcomes based on
historical results” – PMBOK Version 4
7/28/2019 What Are the Control Charts
http://slidepdf.com/reader/full/what-are-the-control-charts 23/26
What a trend analysisreveals is whether theproject or an element of
the project is where itshould be or way off track - Jean Shied
7/28/2019 What Are the Control Charts
http://slidepdf.com/reader/full/what-are-the-control-charts 24/26
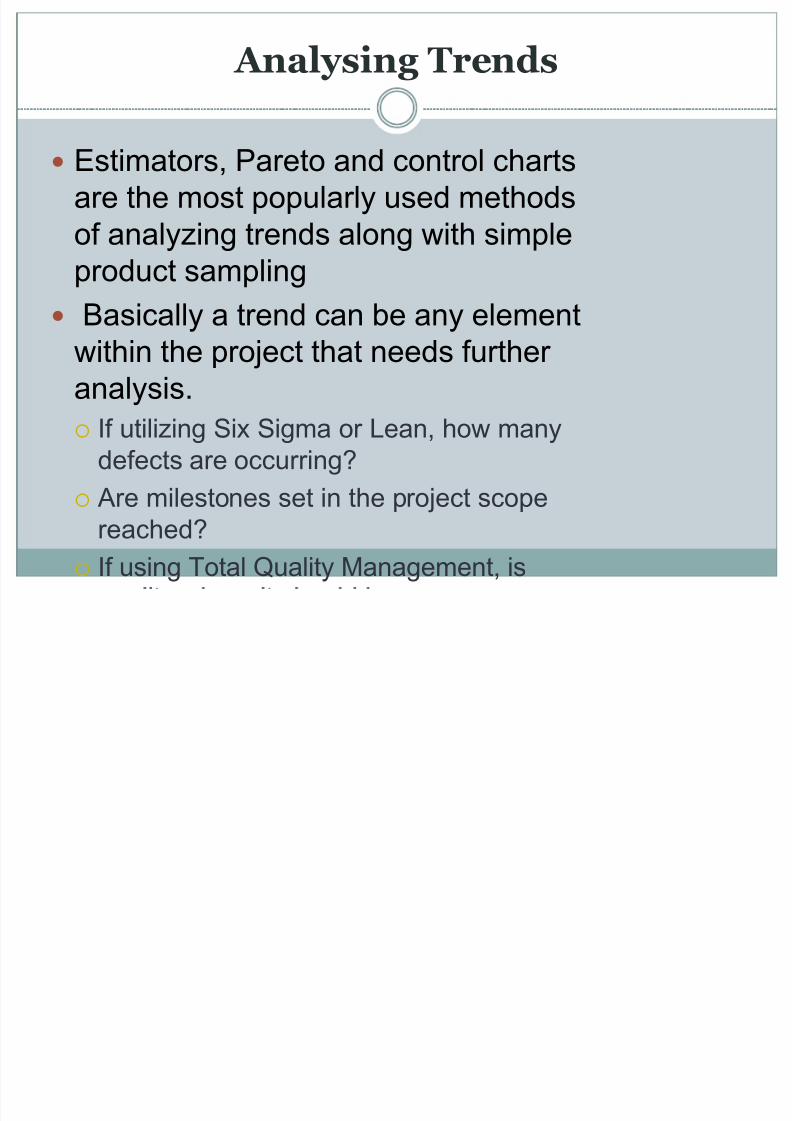
Analysing Trends
Estimators, Pareto and control charts
are the most popularly used methods
of analyzing trends along with simple
product sampling Basically a trend can be any element
within the project that needs further
analysis.
If utilizing Six Sigma or Lean, how many
defects are occurring?
Are milestones set in the project scope
reached?
If using Total Quality Management, is
7/28/2019 What Are the Control Charts
http://slidepdf.com/reader/full/what-are-the-control-charts 25/26
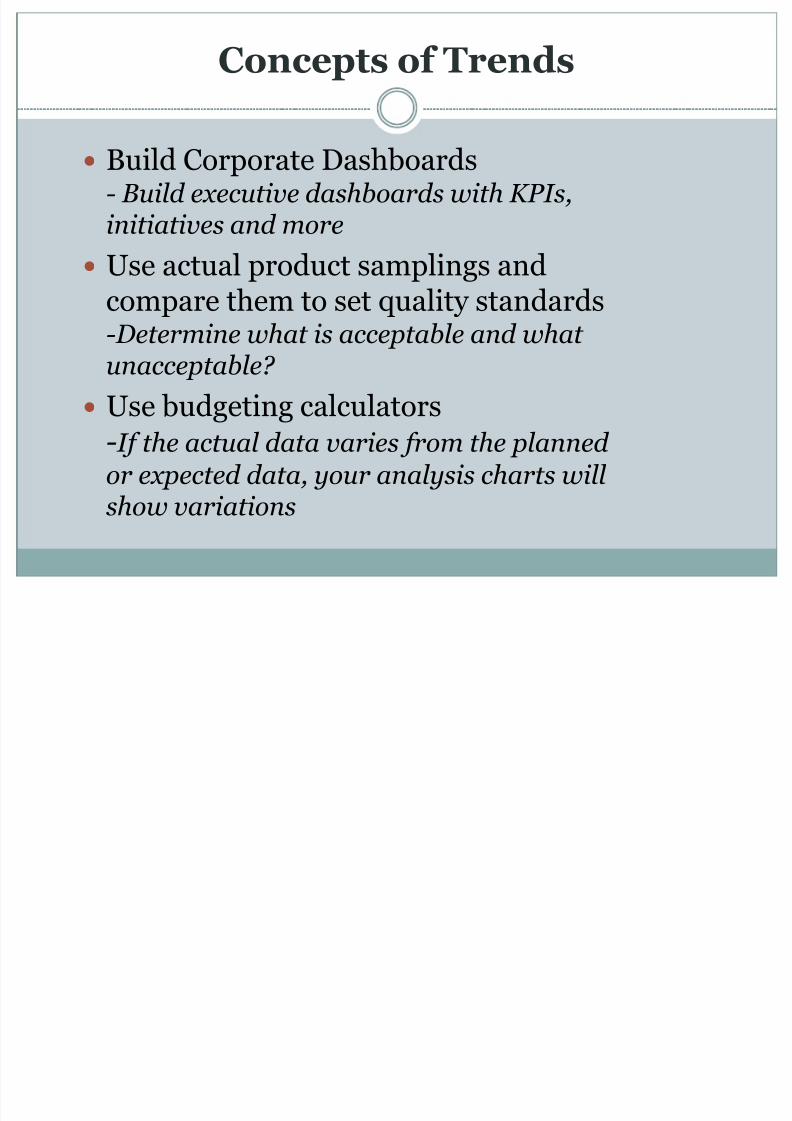
Concepts of Trends
Build Corporate Dashboards- Build executive dashboards with KPIs,initiatives and more
Use actual product samplings andcompare them to set quality standards-Determine what is acceptable and what unacceptable?
Use budgeting calculators- If the actual data varies from the planned
or expected data, your analysis charts will show variations
7/28/2019 What Are the Control Charts
http://slidepdf.com/reader/full/what-are-the-control-charts 26/26
References
[email protected]/IPD-OUM
26
PMBOK Versions 4/5
Media Gallery
Bright Hub PM
Project Management Questions.com Jean Shied & Linda Richter, 5/29/2011
Related Documents


![Control charts[1]](https://static.cupdf.com/doc/110x72/559b746a1a28ab744f8b4634/control-charts1-559c077e1e7b6.jpg)