WFP Supply Chain Capacity in Ethiopia: An Analysis of its Sufficiency, Constraints & Impact by Christina Sujin Kim B.S. Business Administration & B.A. English, University of California, Berkeley, 2003 and Javed Singha M.B.A., Cornell University, 2009 B.S. Business Administration, University of Connecticut, 2003 Submitted to the Engineering Systems Division in Partial Fulfillment of the Requirements for the Degree of MASSA Master of Engineering in Logistics at the Massachusetts Institute of Technology L CHUSETTS INSTITUTE F TECHNOLOGY UL 2 2010 IBRARIES ARCHVES June 2010 C 2010 Christina Kim and Javed Singha. All rights reserved. The author hereby grants to MIT permission to reproduce and to distribute publicly paper and electronic copies of this document in whole or in part. Signature of Authors............... .. .........- Master of Engin ring in Logistics Program, Lqgineering Systemi' Division May 14, 2010 Certified by......................... . .................................. Dr. Jarrod Goentzel Executive Director, Masters of Engineering in Logistics Program / Thesis Supervisor A ccepted by..................................... W Prof. Yossi Sheffi Professor, Engineering Systems Division Professor, Civil and Environmental Engineering Department Director, Center for Transportation and Logistics Director, Engineering Systems Division

Welcome message from author
This document is posted to help you gain knowledge. Please leave a comment to let me know what you think about it! Share it to your friends and learn new things together.
Transcript
WFP Supply Chain Capacity in Ethiopia:An Analysis of its Sufficiency, Constraints & Impact
by
Christina Sujin KimB.S. Business Administration & B.A. English, University of California, Berkeley, 2003
and
Javed SinghaM.B.A., Cornell University, 2009
B.S. Business Administration, University of Connecticut, 2003
Submitted to the Engineering Systems Division in Partial Fulfillment of theRequirements for the Degree of
MASSA
Master of Engineering in Logistics
at the
Massachusetts Institute of Technology L
CHUSETTS INSTITUTEF TECHNOLOGY
UL 2 2010
IBRARIES
ARCHVESJune 2010
C 2010 Christina Kim and Javed Singha. All rights reserved.
The author hereby grants to MIT permission to reproduce and to distribute publicly paper andelectronic copies of this document in whole or in part.
Signature of Authors............... . . .........-Master of Engin ring in Logistics Program, Lqgineering Systemi' Division
May 14, 2010
Certified by......................... . ..................................Dr. Jarrod Goentzel
Executive Director, Masters of Engineering in Logistics Program/ Thesis Supervisor
A ccepted by..................................... W Prof. Yossi SheffiProfessor, Engineering Systems Division
Professor, Civil and Environmental Engineering DepartmentDirector, Center for Transportation and Logistics
Director, Engineering Systems Division

WFP Supply Chain Capacity in Ethiopia:An Analysis of its Sufficiency, Constraints & Impact
by:
Christina Sujin Kimand
Javed Singha
SUBMITTED TO THE ENGINEERING SYSTEMS DIVISION IN PARTIAL FULFILLMENT OF THEREQUIREMENTS FOR THE DEGREE OF MASTER OF ENGINEERING IN LOGISTICS
ABSTRACT
The WFP's transport of food aid to Ethiopia's landlocked population is constrained by
supply chain bottlenecks at the port, and limited availability of trucks for inland transport.
How can the WFP supply chain be optimized to effectively operate within the given
constraints? First, we assess Ethiopia's current food transport capacity - a critical factor
for the WFP's ability to deliver humanitarian food aid. Specifically, we review the
current and forecasted movement of goods, gather and analyze information on transport
capacity versus demand, and address the impact of government policies and regulations
on the road transport sector. As a result, our research helps the WFP in analyzing
quantitative and qualitative factors used in selecting routes and mitigating port bottleneck
issues. The results of our study may be used by the WFP and other humanitarian
organizations which aid distressed populations.
Thesis Advisor: Dr. Jarrod GoentzelTitle: Executive Director, Masters of Engineering in Logistics Program

Acknowledgements
This thesis research project is possible thanks to the guidance, support and contributions
of many people. Our thesis advisor, Jarrod Goentzel guided us to select the appropriate
research methods, and navigate through the research process. We are also grateful to all
of the employees affiliated with the World Food Programme in Ethiopia who engaged in
weekly calls to answer our questions regarding the existing operating procedures,
provided data that we utilized to develop our analysis, and verified the final version of
this thesis report. Specifically, we would like to thank Adrian Vanderknaap, Bervery
Chawaguta, and Fethi Mohammed at the WFP. In particular, we are grateful to Bervery
Chawaguta, who on the WFP's end, thoughtfully managed the data collection process,
made sure that all of our questions were answered during our weekly calls, and was
invaluable to our understanding of the WFP shipping and trucking process. In addition,
we would like to thank Dr. Dieter Hannusch, retired independent consultant for the WFP,
for his time in providing foundational insights into the Ethiopia trucking system. Of
course, none of this would have been possible without the thoughtful support and
guidance of our family and friends (including MLOG / WFP thesis alums Lauren Shear
and Vidya Chander).

Table of Contents
1 Introduction................................................................................... 71.1 World Food Programme (WFP) In Ethiopia.......................................... 81.2 WFP Organization......................................................................... 91.3 Ethiopia Country History & Background.............................................. 101.4 Literature Review.......................................................................12
2 WFP's Current Ethiopia Food Transport .................................................. 142.1 C orridors................................................................................. 142.2 Road Conditions......................................................................... 172.3 Food Aid: Types, Conditions and Seasonality........................................ 182.4 Inland Shipping Options .............................................................. 202.5 Trucking: Industry Background & Contracting Practices.........................212.6 Shipping: Port Conditions................................................................23
2.6.1 Djibouti ... --. .. -.... -............. .......................................... 242.6.2 Berbera.... ---............................................................. 272.6.3 Port of Sudan.....................................................................282.6.4 M om basa.............................................................................282.6.5 Port Cost Comparison...........................................................29
3 Analysis & Recommendations................................................................. 303.1 Research Methods....................................................................... 313.2 Supply Chain Process Flow........................................................... 33
3.2.1 The Overseas Shipping Process................................................. 373.2.2 Djibouti: Port & Ground Transport.............................................. 403.2.3 Berbera: Port & Ground Transport............................................ 413.2.4 Port of Sudan: Port & Ground Transport ..................................... 423.2.5 Process Flow: Root of Impact.....................................................433.2.6 Communication, Transparency & Visibility of Supply Chain..............45
3.3. Corridor Selection Cost Analysis....................................................463.3.1 Transportation Costs............................................................. 493.3.2 Total C osts......................................................................... 50
3.4 Supply Chain Capacity Analysis...................................................... 523.5 Shipping, Port and Carrier Specific Analysis.......................................... 55
4 C onclusion ........................................................................................ 624.1 Transportation Networks.............................................................. 624.2 Trucking Contracting.................................................................. 634.3 Postponement & Risk Pooling ........................................................... 644.4 Final N ote...................................................................................65
R eferences...........................................................................................66A ppendix ............................................................................................. 68

List of Figures
FIGURE 1.1: Three Utilized Corridors and EDPs..........................................11FIGURE 2.1: WFP Ethiopia Main Corridors..............................................15FIGURE 2.2: WFP Ethiopia Port to EDP Corridors .................................... 16FIGURE 3.1: High-level WFP Ethiopia Logistics Process Flowchart................34FIGURE 3.2: Detailed WFP Ethiopia Logistics Process Flowchart (Bulk Cargo).....36FIGURE 3.3: Corridor Selection Decision Factors.......................................47FIGURE 3.4: Djibouti Port Total Calculated Delays by Arrival Month.................57FIGURE 3.5: Djibouti Port Total Calculated Delays Frequency.......................58FIGURE A. 1: Calculated Vessel Delays Multiple Regression Output................68FIGURE A.2: Vessel Delays Quantity of Food aid Regression Output .................. 69FIGURE A.3: Vessel Delays Vessel Quantity Regression Output ..................... 69

List of Tables
TABLETABLETABLETABLETABLE
2.1:2.2:2.3:2.4:2.5:
TABLE 2.6:
TABLE 2.7:TABLE 2.8:TABLE 3.1:TABLE 3.2:TABLE 3.3:TABLE 3.4:
Seasonality of Shipping Volume - All Food aid............................. 19Seasonality of Shipping Volume - WFP Food aid........................... 202009 Bulk Cereal Imports into Ethiopia by Port.............................24Djibouti Port Cereal Food aid Consigners in 2009....................... 24Bulk, Break Bulk and Containerized Food aid Volumes through Djibouti- W FP O nly...................................................................... 25Bulk, Break Bulk and Containerized Food aid Volumes through Djibouti- Total .... - .. ..................... ....................................... 25Total Port Costs per Metric ton by Cargo Type...........................29Shunting Costs per Metric Ton by Port and Shunting Location........... 29Transportation Costs from each Port to select EDPs..................... 50Total Bulk Costs For Select EDPs - Less Shunting........................ 51Total Bulk Costs For Select EDPs - Including Shunting................. 51Djibouti Port Vessel Average Delays......................................61
1 Introduction
The delivery of commercial and humanitarian goods is dependent upon a country's
available capacity to transport these goods to the population. For a land-locked country
like Ethiopia in need of humanitarian aid, sufficient transport capacity and an efficient
transport system are especially critical. The World Food Programme (WFP) and other
humanitarian agencies utilize Ethiopia's existing infrastructure of transport to deliver
food aid through both secure and insecure regions, and as a result, are often faced with
augmented transport capacity issues.
This thesis will explore the extent to which Ethiopia's shipping and ground
transport capacity is sufficient to address the country's commercial and humanitarian
needs. Next, it will define the relationship between this transport capacity and the
timely delivery of food aid and the cost efficiency of operations for WFP.
We review the current and forecasted movement of goods, gather and analyze
information on transport capacity versus demand, and assess the impact of government
policies and regulations on the road transport sector. The Ethiopian Government and
WFP will use the results of this study to enhance their understanding of transportation
and to identify any potential gaps in the logistics process impacting the capacity for
transport of commercial and humanitarian freight in Ethiopia.
In this introductory section, we set the groundwork for understanding the extent
of the WFP's involvement in Ethiopia food aid efforts, describe the WFP's
organizational structure and provide a brief background on Ethiopia's history and
geographic issues. The information in this introductory section provides the basis for

understanding the Methods and Analysis sections, which describe our study of trucking
transport capacity, route selection and port congestion.
1.1 The World Food Programme in Ethiopia
As the world's largest humanitarian agency fighting hunger worldwide, the United
Nations' World Food Programme (WFP) distributes food aid to over 100 million people
and moves on average 3.5 million tonnes of food per year around the world. In Ethiopia,
the WFP's work is complicated by geographic limitations, political conflicts, natural
disasters, and poor infrastructure. Ranked 171 out of 182 countries on the Human
Development Index, Ethiopia is one of the poorest countries in the world. According to
their website, the WFP assisted nearly ten million people within the total estimated
population of 80 million in Ethiopia in 2009. Of this ten million served by the WFP, 6.2
million people received emergency food assistance due to the recurrent drought. (WFP,
2010) In 2003 - 2007, there was no emergency food aid delivered by the WFP but in
2008, 74,000mt (equivalent to 11% of all 2008 WFP food aid) was of the emergency
nature.
Given Ethiopia's needs, the WFP is continuously searching for improved efficient
methods of transporting and distributing food (i.e. optimizing existing port capacity for
alleviating ship unloading bottlenecks and truck capacity for overland transport). Within
the past two years, Ethiopia's increasing need for support is stretching the capacity of the
supply chain. Per conversations with the WFP Ethiopia logistics department, the food
requirements in 2010 are projected to be 870,000mt with total USD requirements of $646
million and total planned beneficiaries of 9.4 million people. This increased demand for

food aid in Ethiopia comes at a time when government and commercial cargo imports
have greatly increased through the Djibouti port, further exacerbating the bottlenecks for
food transportation into the country. As a result, WFP began utilizing two additional
ports in Sudan (North-west) and Berbera (South-east) in May 2010 as alternate supply
routes to reach the landlocked population. In 2009, the WFP transported 86% of its food
aid through Djibouti, 14% through Berbera and 10% through Sudan. This decision has
alleviated the bottlenecks at Djibouti, and the WFP continues to examine ways to
mitigate port congestion, as well as transport and storage capacity issues in Ethiopia.
1.2 WFP Organization
The WFP is organized such that WFP Logistics is headquartered in Rome, Italy. The
department, headed by Martin Ohlsen, coordinates with the WFP Country Offices in
Ethiopia, most notably the Addis Ababa office, to execute shipping procedures from
other countries into the three ports in which Ethiopia receives food aid: Sudan, Berbera
and Djibouti. The responsibilities are divided between WFP Ethiopia and Rome in that
while WFP Rome Logistics performs the tendering process for vessel contract fixing
functions and other macro-duties, the WFP Ethiopia Logistics office works with Rome to
determine more detail-specific considerations such as shipping terms. WFP-wide
functions such as shipping documents (the Bill of Lading, Sailing Advice, and Inspection
Certificate) are performed by Rome, while decisions that affect on-the-ground
considerations such as cargo allocation to EDPs are managed by WFP Ethiopia.
1.3 Ethiopia Country History & Background
With the exception of a brief Italian occupation from 1936-1941, the ancient Ethiopian
monarchy maintained its independence from colonial rule. Emperor Haile Selassie ruled
from 1930 until 1974, when a group of military officers, the Derg, ruled the country after
seizing power. The Derg established a socialist state, while Ethiopia suffered from
pervasive drought, refugee issues, violence, and riots. In 1991, the regime was
overthrown by a coalition of rebel forces, the Ethiopian People's Revolutionary
Democratic Front (EPRDF). Ethiopia's border war with its geographic neighbor, Eritrea
in the 1990s concluded in a peace treaty established late 2000. In November 2007, the
Eritrea-Ethiopia Border Commission remotely demarcated the border by geographical
coordinates, but actual country borders remain in dispute. (CIA, 2010)
Geographically, Ethiopia is located in East Africa, west of Somalia and east of
Sudan. With an area comparable to slightly less than twice the size of Texas, Ethiopia is
landlocked between Djibouti, Kenya, Somalia, Sudan and Eritrea. Its terrain is varied
with high plateaus with a central mountain range divided by the Great Rift Valley.
Ethiopia's climate ranges from tropical monsoons to frequent droughts. In May 1993,
Ethiopia lost access to its entire Red Sea coastline when Eritrea became an independent
state.
Within the country, railways are extremely limited (681 kilometers of track) and
assumed inoperable. (CIA, 2010). Because of its landlocked geographical location,
limited railway capacity and costly air transport, Ethiopia is largely dependent upon its
36,469 kilometers of roadways, of which 6,980 kilometers are paved and 29,489

kilometers remain unpaved. As seen in Figure 1.1 below, the WFP uses these roadways
to transport food aid from the ports located in Djibouti, Berbera and Sudan to the
Extended Delivery Point (EDP) and the Final Delivery Point (FDP) destinations.
- rrnspot: orts to inlangl
R I A Y EM E N
Q001
+ This map highlights the three ports of entryand delivery routes to the Final DestinationPoints (FDP) located within Ethiopia.
FIGURE 1.1: Three Utilized Corridors and EDPs
Grain, fertilizer, cement, and general cargo are transported through these three
ports for both the government and commercial sectors within Ethiopia. Increases in
cargo-flow necessitate services such as discharging facilities, transport capacity and
storage facilities. Djibouti is the main corridor for humanitarian cargo to Ethiopia. In
order to further reduce the long waiting time at the port, in July 2009, the WFP negotiated
for extra berthing space and berthing priority for food aid vessels over EGTE grain
vessels. The WFP and the Ethiopian Road Transport Authority collaborate to ensure
enough trucks are available for uplifting food aid cargo in Port Djibouti. Food aid
arriving in the Sudan Port is transported by Sudanese trucking companies to the main hub
in North-west Ethiopia (Woreta). Meanwhile, there is a 50/50 split between Ethiopian
and Somaliland transport companies for transporting food aid arriving in Berbera to the
Ethiopian EDPs in Dire Dawa, Nazareth and Jijiga.
Currently, 90 percent of WFP Ethiopia cargo is transferred through Djibouti,
which operates as the primary port of entry for Ethiopian international arrivals. Given the
high fluctuations of cargo transferred through this port, and the increased overall volume
handled through the two new ports in Berbera and Sudan, the WFP is concerned with the
sufficiency of trucking capacity available for in-land transportation from Port to EDPs
and from EDPs to FDPs.
1.4 Literature Review
There is unfortunately very little written information published on Ethiopia, or the World
Food Programme's food aid involvement in the region. As Benita Beamon notes
"The majority of existing supply chain research focuses on managingand/or optimizing the commercial supply of goods and services. Thehumanitarian relief supply process is an important domain for supplychain management that has received little attention." (Beamon, 2004)
However, the WFP has been looking to change this by commissioning projects like this
on-going thesis work at MIT, and other universities. As such, our approach has been to
research general information on Ethiopia and the WFP separately. After developing an
understanding of the core issues facing the WFP's work in Ethiopia, we gathered
information regarding Ethiopia's infrastructure and both the current and planned
humanitarian projects in the region. We also reviewed articles pertaining to transportation
transactions and the infrastructures problems of developing countries. We used this
information to gain an understanding of the current environment that WFP operates in,
draw comparables from other capacity constrained situations and analyze the divergent
factors between past practices and future needs. Finally, we researched online periodicals
(from sources ranging from the United States Central Intelligence Agency website to The
New York Times) in order to obtain the facts upon which our Recommendations for the
WFP in Ethiopia are based.
In these efforts, our thesis research fits within the context of humanitarian
logistics work currently underway. Our work on the transportation process flow, supply
chain communication in less-developed markets, point-to-point route logistics and total
cost analysis relates to quantitative logistics work on World Bank data that examined
logistics performance metrics in terms of time, cost and variability in time. (Hausman,
Lee & Subramanian, 2005). Additionally, we focus on the challenges faced by the WFP
due to its unique humanitarian characteristics and highly variable demand pattern
(Beamon, 2004). Countries like Ethiopia can utilize our research in conjunction with
quantitative logistics metrics to implement logistics improvements and measure their
progress.

2 WFP's Current Ethiopia Food Transport Process
Given the geographic and political situation in Ethiopia, the WFP's involvement in food
aid, and the WFP's organizational structure, an understanding how the WFP currently
supplies food to Ethiopia provides the starting point of our analysis.
At a high level, humanitarian food aid for Ethiopia is either purchased by or
donated to the WFP. The central WFP logistics headquarters in Rome manages the
Estimated and Actual Times of Arrival for food shipments at each of the three ports in
Ethiopia - Djibouti, Sudan or Berbera. Then, the WFP determines whether or not trucks
are present at the dock before the food is loaded off the trucks either manually or through
automatic bagging machines. Thus, WFP Rome manages all food transport up until the
port delivery, and the WFP Ethiopia handles all in-land food transport.
This section describes the WFP's Ethiopia food transport process in relation to the
corridors currently utilized for food transport, the road conditions for inland transport of
food, and the nature of food aid delivered. Next, we describe the inland shipping
methods, and take a closer look at trucking including the considerations involved in truck
contracting. Finally, a breakdown of the current situation at each of the ports - Djibouti,
Berbera, Sudan and Mombasa - includes details on the port operations and throughput
capacity relevant to our analysis.
2.1 Corridors
The WFP has the ability to transport food aid for delivery to Ethiopia through four ports:
Port of Sudan located in Sudan, Djibouti located in the Republic of Djibouti, Berbera
located in Somalia, and Mombasa located in Kenya. Since its border war with Eritrea in

the 1990s, Ethiopia has remained landlocked and dependent upon these foreign ports
located in other countries surrounding its borders. After receipt at foreign ports, the food
aid then is transported inland via a set of corridors highlighted in Figures 2.1 below.
FIGURE 2.1: WFP Ethiopia Main Corridors
. ... ..............................

While the WFP can ship food aid through these four ports, Mombasa is not being
utilized. The following Figure 3.2 highlights the most common corridors from the Port of
Sudan, Djibouti and Berbera.
FIGURE 2.2: WFP Ethiopia Port to EDP Corridors
Usually, the port selection is determined prior to the start of cargo shipment.
Depending on the source of the food aid, the country of the food's origin, and the
shipping method, the WFP may be able to select and modify the port that the cargo will
arrive at.
From the port, cargo is transported inland on trucks to EDPs. EDPs act as
transshipment points and are located in strategic regions where warehouses are available
to store food and in populous geographic locations that are close to government or
16

humanitarian residences. Food can then be moved to EDPs, which allow easy access to
the FDPs.
At the FDPs, food is distributed to the vulnerable local populations and informally
stored. FDPs receive various amounts of food aid based upon the need of local programs.
In the Somali region of Ethiopia for example, roughly 20mt of food aid is distributed
each month at each FDP. In most cases, the government handles the transportation and
distribution of the food aid from the EDP to the FDP. For the purposes of our study, we
have focused mainly on the supply chain up until the EDP.
2.2 Road Conditions
Road conditions play an important role in selecting corridor routes. Road conditions, in
addition to the distances between ports and EDPs are a significant in determining the
transportation costs and lead times. For instance, unpaved roads increase the cost of
delivery. This increased cost is due the direct cost of the trucks necessitating longer lead
times to deliver cargo as well as the indirect costs due to great wear and damage to
vehicles (Chander & Shear, 2009).
The corridor from the Djibouti port to Ethiopia is paved. Additionally, the main
roads in Ethiopia that connect major cities and towns are paved. However, an alternative
route to Dire Dawa, a major hub in Ethiopia, is gravel (WFP Ethiopia, 2010).
The road conditions for the Berbera corridor are a mix of gravel and tarmac. The
Ethiopian government has pledged to improve roughly 150 km of roads in the Somalia
region of Ethiopia. Additionally, 565km of the corridor to Jijiga are currently under
construction for improvement. The Ethiopian Government is planning to turn Jijiga into
an international hub. The WFP has been offered a plot near Jijiga to setup a freight
terminal and warehouse. The improved road conditions are expected to reduce the
transportation rates (WFP Ethiopia, 2010).
The conditions from Port of Sudan to the border area of Ethiopia are asphalt.
However, the road to the major cities and EDPs in Ethiopia are gravel and span a difficult
terrain.
The conditions from Mombasa into Ethiopia EDPs are the worst of any of the
corridors; one of the primary reasons this route is rarely used (WFP Ethiopia, 2010).
Depending on the route, some trucks drive in convoys and are accompanied by a
locally-based security detail. From our understanding, security details, when used, are
typically for the EDP to the FDP portion of the supply chain. To speed up the time it
takes to pass through customs, trucks coming from Berbera travel in a convoy.
2.3 Food Aid: Types, Conditions and Seasonality
Donations come in two forms, cash donations and in-kind donations. In the case of cash
donations, the WFP chooses where to source the commodities (internationally, locally,
regionally), and arranges for the transportation of the goods. In-kind donations are when
donors provide food aid. From 2001 to 2005, the U.S. accounted for the vast majority of
in-kind donations (in 2009, the U.S. accounted for 43% of all donations). In-kind
donations are usually farming surpluses, which are donated to the WFP at the end of
growing seasons (Lopez, 2003).
If the cargo is not shipped on a chartered vessel and is sent via multiple break
bulk consignments or containerized on a liner, the WFP has less control over determining

the port destination or altering the port selection while the vessel is in transit. Bulk
shipments are preferred, followed next by break bulk shipments as they are less costly.
The shipment of food aid is seasonal due to a number of factors. The two most
significant factors causing this are the seasonal conditions in Ethiopia and the timing of
in-kind donations from the US, which coincide with harvests. The Tables 2.1-2.2 below
highlights the seasonality of food aid in metric tons that have been shipped to Ethiopia
since 2000. The data comes from the WFP shipping file the team provided us.
Historically, most food aid is imported between October and January. However, it should
be noted that there is often significant variability in shipping volume each year due to
factors such as emergency need. In addition to monthly shipping magnitude reflected in
these percentages, monthly volume quantities as reflected in the "Amount" column
indicate seasonality trends relevant for the WFP.
TABLE 2.1: Seasonality of Shipping Volume - All Food aid
2000-2008Months Amount %Jan 614,045 8%Feb 285,092 4%Mar 420,397 6%Apr 586,450 8%May 574,121 8%Jun 772,990 10%Jul 602,974 8%Aug 694,562 9%Sep 662,285 9%Oct 1,009,581 14%Nov 729,130 10%Dec 496,856 7%
Total 7,448,483 100%
2006 2007 2008
Months Amount % Months Amount % Months Amount %
Jan 116,014 30% Jan 107,346 21% Jan 41,059 3%Feb 21,234 5% Feb 12,928 3% Feb 10,366 1%Mar 1,050 0% Mar 57,740 11% Mar 47,003 3%Apr 35,591 9% Apr 55,288 11% Apr 42,652 3%May 3,386 1% May 20,776 4% May 52,731 4%
Jun 13,587 4% Jun 100,968 20% Jun 65,475 4%Jul 15,833 4% Jul 14,296 3% Jul 59,348 4%Aug 13,045 3% Aug 5,010 1% Aug 169,743 11%Sep 25,935 7% Sep 6,519 1% Sep 233,450 16%Oct 108,478 28% Oct 38,550 8% Oct 301,452 20%
Nov 28,095 7% Nov 76,487 15% Nov 217,514 14%Dec 4,939 1% Dec 8,309 2% Dec 260,347 17%
Total 387,187 100% Total 504,217 100% Total 1,501,140 100%

TABLE 2.2: Seasonality of Shipping Volume - WFP Food aid
Additionally, it should also be noted that the arrival of food aid often coincides with the
arrival of fertilizer in Ethiopia. These correlated arrivals further constrain the port's
ability to unload seasonal food aid due to differences in handling requirements, port
congestion and limiting factors such as port berths available and trucking capacity.
2.4 Inland Shipping Options
Similar to other emerging nations, the infrastructure in Ethiopia is underdeveloped. As
such, multi-modal transportation is not available for food aid transport into Ethiopia. A
rail system, which would be the best alternative to trucking, is not currently a viable
option. While some rail tracks exist from Djibouti port to Nazareth, Dire Dawa and Addis
Ababa, the system is not functional. A rehabilitation project is in planned and
investments have been made to renew the system but a good deal of uncertainty remains
with regard to when improvements will be implemented. Additionally, the WFP has
encountered issues of theft when utilizing trains in the past. Specifically, due to their slow
speed they are easy targets for looting and stationary rail carts have been pilfered.
2000-2008Months Amount %Jan 207,318 10%Feb 63,563 3%Mar 42,959 2%Apr 133,498 7%May 128,029 6%Jun 201,998 10%Jul 171,511 9%Aug 179,298 9%Sep 179,214 9%Oct 381,801 19%Nov 150,603 8%Dec 154,967 8%Total 1,994,759 100%
2006 2007 2008Months Amount % Months Amount % Months Amount %Jan 96,010 33% Jan 71,646 27% Jan 21,979 3%Feb 21,104 7% Feb 12,928 5% Feb 4,106 1%Mar 1,050 0% Mar 4,580 2% Mar 11,853 2%Apr 33,901 12% Apr 50,288 19% Apr 37,382 6%May 3,386 1% May 18,856 7% May 9,371 1%Jun 5,418 2% Jun 21,448 8% Jun 59,715 9%Jul 9,213 3% Jul 2,326 1% Jul 50,348 8%Aug 3,156 1% Aug 3,890 1% Aug 63,233 10%Sep 22,885 8% Sep 5,899 2% Sep 110,955 17%Oct 79,678 28% Oct 34,740 13% Oct 142,832 22%Nov 6,100 2% Nov 30,617 12% Nov 72,679 11%Dec 4,939 2% Dec 6,659 3% Dec 71,941 11%Total 286,840 100% Total 263,877 100% Total 656,394 100%

Another possible transportation alternative in Ethiopia is air transportation.
However, Ethiopia has utilized air transportation in the past only in situations of extreme
emergencies due to its high cost. Therefore, air transport is used on a case-by-case basis
as a last resort under time constraints. For example, if conditions make it impossible to
transport food via truck the WFP will airlift food to a site (WFP, 2000).
2.5 Trucking: Industry Background & Contracting Practices
The Ethiopian Government reports that there are 7000 trucks available for transporting
food aid. Due to the need to shunt (temporally warehouse) food aid, and increasing wait
times witnessed at the ports, the WFP has decided to investigate the transportation
capacity. As such, the WFP is working with the Ministry of Transport, the DRMFSS
(Disaster Risk Management and Food Security Sector), the World Bank and GTZ
(Gesellschaft fur Technische Zusammenarbeit) to perform a Freight Transportation
Study.
On average, the WFP requires 120 40mt trucks worth of capacity each day to
support the discharge of roughly 4000mt of food aid unloaded at the Djibouti port. The
40mt trucks are the standard truck size in Ethiopia and Somalia. Sudan, however, has a
limitation of 8-10 tons per axel and utilizes 60mt trucks. This requires cargo imported
from the Port of Sudan to be transshipped at the border to meet Ethiopia's payload weight
limit of 40 metric tons.
Truck carriers operate in a quasi-private capacity. While the government has
privatized its formerly public fleet, the Ethiopian government and Ministry of
Transportation still possess significant influence over the truck industry. If unrestricted,
the carriers will compete and bid on business as in a free market.
The WFP contracts with transport truck carriers to move its cargo from ports to
EDPs. The contracted transportation carriers are sometimes called "dedicated." It is
important to note that this differs from the typical U.S. version of the definition of a
dedicated fleet. While these carriers are contracted to transport WFP cargo, they are also
allowed to move other buyer's goods when not employed by the WFP to pick-up and
transport food aid.
As carriers are not dedicated fulltime, trucks may not always be immediately
available to transport the WFP's food aid when requested. When the WFP offered a 25%
premium on market rates for a truly dedicated fleet, the WFP received preferential
treatment from carriers, allowing for more immediate transport of its cargo. Recently,
however, the Ethiopian Government enforced more parity in transporting goods from the
Djibouti port, precluding the WFP from paying this premium.
The RFP bid process and terms vary between ports. For the Port of Sudan, the
WFP allows carriers that meet its standards to bid on the contract, contrary to the
Ethiopia transporters a single Sudanese transporter has the capacity to uplift the cargo.
The contract is therefore often awarded to a single Sudanese transport company. While
cost is a significant factor in the selection process, the company offering the "best
contract terms" is more likely to win the WFP transportation work.
The Request for Proposal (RFP) process for Ethiopian transporters is different
from the RFP process for Sudanese contractors, since no single transporter in Ethiopia
possesses the capacity sufficient to meet the WFP's needs. For the Djibouti port, the

WFP sends a tender, obtains quotes from transporters and then determines a fair rate.
The WFP then selects transporters for employment if they agree to accept the set rates.
The WFP is currently investigating new contracting terms and methods in order to
optimize capacity. The WFP would be willing to pay 50%-60% of transportation costs
upfront against some kind of performance bond if a transportation carrier were willing to
sign a contract agreeing to transport WFP cargo at an agreed upon capacity and service
level. If the contractor failed to provide the service or if capacity was unavailable, they
would have to pay the WFP a penalty fee. Not surprisingly, transportation carriers have
been unhappy with penalties in contracts. The Ethiopian government, although not
opposed to the penalty proposal, has also yet to adopt a penalty payment system. In the
past, the WFP has agreed to pay a penalty to carriers if they are delayed at the port
loading zone for more than 72 hours. For instance, in 2004, the WFP had agreed to pay
USD $100 per truck per day after this 72 hour window (WFP, 2004).
2.6 Shipping: Port Conditions
The port throughput capacity specific to WFP shipments are dictated by the number of
berths, berth offloading capacity, bagging capacity, and ability to shunt when necessary.
The Djibouti port is the main point of entry for Ethiopian food aid, with roughly 90% of
all WFP cargo being shipped through it. Until recently, it was the only port utilized for
delivering food aid to Ethiopia. In the past year, Berbera port and Port of Sudan have
been utilized for importing food aid. Below is a table of the 2009 Ethiopia bulk cereal
imports by port (WFP Ethiopia, 2010).
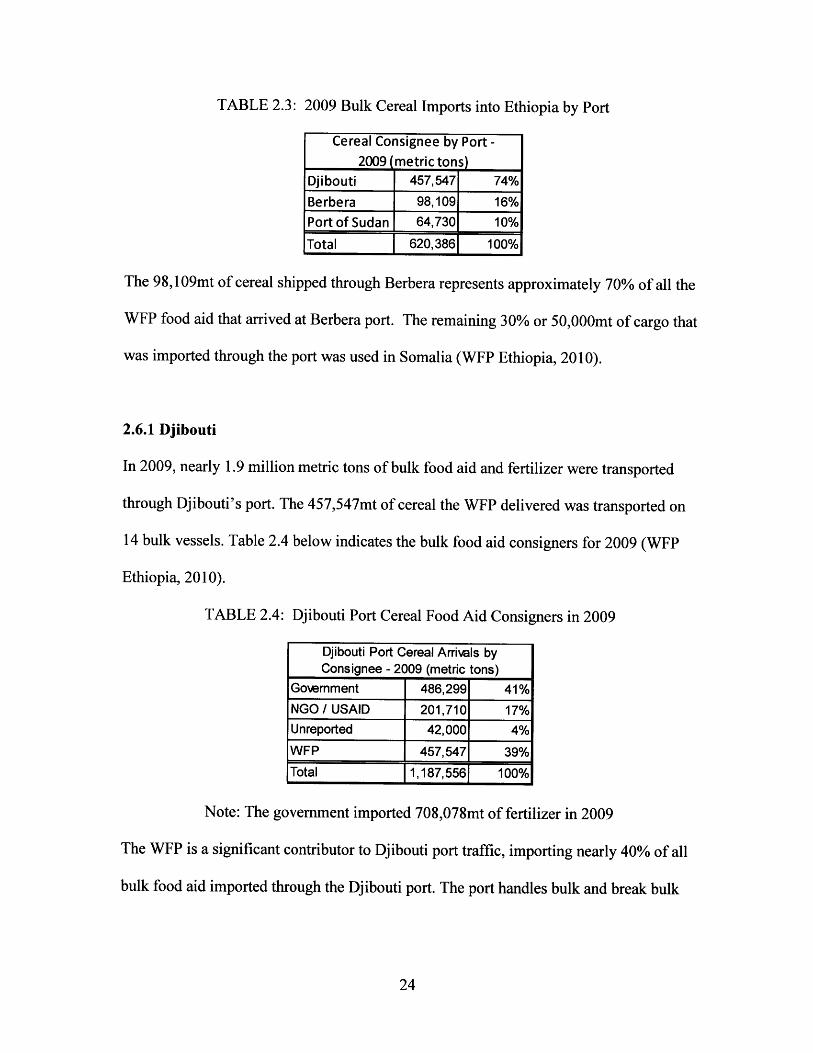
TABLE 2.3: 2009 Bulk Cereal Imports into Ethiopia by Port
Cereal Consignee by Port -2009 (metric tons)
Djibouti 457,547 74%
Berbera 98,109 16%Port of Sudan 64,730 10%
Total 1 62.386 100
The 98,109mt of cereal shipped through Berbera represents approximately 70% of all the
WFP food aid that arrived at Berbera port. The remaining 30% or 50,000mt of cargo that
was imported through the port was used in Somalia (WFP Ethiopia, 2010).
2.6.1 Djibouti
In 2009, nearly 1.9 million metric tons of bulk food aid and fertilizer were transported
through Djibouti's port. The 457,547mt of cereal the WFP delivered was transported on
14 bulk vessels. Table 2.4 below indicates the bulk food aid consigners for 2009 (WFP
Ethiopia, 2010).
TABLE 2.4: Djibouti Port Cereal Food Aid Consigners in 2009
Djibouti Port Cereal Arrivals byConsignee - 2009 (metric tons)
Govemment 486,299 41%NGO / USAID 201,710 17%Unreported 42,000 4%
WFP 457,547 39%Total [1,,556 0%
Note: The government imported 708,078mt of fertilizer in 2009
The WFP is a significant contributor to Djibouti port traffic, importing nearly 40% of all
bulk food aid imported through the Djibouti port. The port handles bulk and break bulk

cargo. Containerized cargo is unloaded at Doraleh Container Terminal, located a few
miles away from Djibouti.
The percentage of bulk, break bulk and containerized food aid imported through
the Djibouti port are as follows:
TABLE 2.5: Bulk, Break Bulk and Containerized Food aid Volumes through Djibouti -
WFP Only
WFP 2003-2008 (metric tons) WFP 2008 (metric tons)
Bulk 1,445,923 80.3% Bulk 559,651 85.3%Break Bulk 336,680 18.7% Break Bulk 90,750 13.8%Containerized 17,280 1.0% Containerized 5,720 0.9%
Total 1 1,799,8831 100% Total 656,121 100%
TABLE 2.6: Bulk, Break Bulk and Containerized Food aid Volumes through Djibouti -
Total
Total Food-aid 2003-2008 (metric tons) Total Food-aid 2008 (metric tons)
Bulk 4,619,892 83.8% Bulk 1,359,487 90.6%Break Bulk 772,918 14.0% Break Bulk 135,660 9.0%Containerized 121,504 2.2% Containerized 5,720 0.4%
Total 1 5,514,3141 100% Total 1,500,867 100%
In the Djibouti port, there are two berths that are dedicated to bulk food aid and fertilizer
handling. These berths are managed by SDTV (Societe Djiboutienne De Gestion Du
Terminal Varaquer).
"SDTV, owned by Sheik Mohammed Al-Amoudi, is a stevedoringcompany dealing with port handling, vessel discharge and bagging of bulkgrain activities at Djibouti port.... Accordingly, the contract, which willbecome effective in January 2009, will give SDTV the responsibility ofhandling all bulk food commodities from ship to trucks hired by WFP andwhich will transport to locations in Ethiopia" (Daily Monitor, 2008).

Three berths are used for grain bulk vessels and can unload 7000mt/day with several
vessels (WFP Ethiopia, 2010). The food is then either immediately bagged using
automated bagging machines or placed on a conveyor belt to an onsite silo to be bagged
later. The decision to silo the food aid or leave it on the vessel depends on the availability
of trucks being present to transport the food aid to the EDPs. If the food aid is stored on
the vessel while it is at the berth, the WFP can be charged between $20,000-$50,000 each
day for blocking other vessels at the port. Given this cost, food aid is rarely stored on
ships.
Before transporting the food aid to the EDPs, the bulk or break bulk cargo must
first be bagged before it can be loaded onto trucks. There are two sets of bagging
machines at the Djibouti port. Each set can unload up to 3000mt/day. However, one set of
the bagging machines is predominately used for bagging fertilizer. During times this
berth is not unloading fertilizer, the bagging machine can be switched over to bag food
aid after a lengthy cleaning process (WFP Ethiopia, 2010). In addition, the bagging
machines frequently break down, increasing unavailability and further constraining the
process flow.
In the event that transportation is not available, or if offloaded food needs to be
temporarily stored until bagging capacity is available, the Djibouti port offers three
options for shunting food aid. Food aid can be siloed at the port via conveyer, which can
hold 30,000mt. There is an additional 15,000mt of warehouse space available in the
harbor storage. Additionally, the WFP can utilize the Djibouti Dry Port or Free Zone.
Bagged food can be loaded on trucks and brought to these locations, which are both
located outside of the port (WFP Ethiopia, 2010). The WFP had considered building a

warehouse at the port and had submitted a proposal to the government. Unfortunately for
the WFP, there is not enough available space at the port at this time; forcing the WFP to
investigate building a warehouse outside of the port. Transport carriers are not in favor of
this as they prefer direct delivery from the vessel.
2.6.2 Berbera
The Berbera port in Somalia is designed to handle all types of cargo (bulk, break bulk
and containerized) cargo. The bagging machines at the port have a machine capacity of
2,800mt per 24hrs (three 8hr shifts). However, due to frequent breakdowns of the old
bagging equipment, the unloading capacity is less than 2,000mt per 24hrs. The port
provides roughly 10,000-15,000mt of temporary storage to the WFP for 45 days without
cost (WFP Ethiopia, 2010). The WFP has also been increasing its warehousing capacity
by utilizing mobile storage units; providing for an additional 8,000mt of storage
(Thomson Reuters Foundation, 2009).
Somalia's Berbera port faces a number of unique concerns relative to other ports.
First, the WFP has entered into a verbal agreement with Somaliland and Ethiopian
Authorities to utilize 50% Somali and 50% Ethiopian transportation carriers. Second, as
noted before, roughly 70% of the WFP food aid that arrived in Berbera was intended for
delivery to Ethiopia (WFP Ethiopia, 2010). This has raised concerns between WFP
Ethiopia and WFP Somalia with regard to coordination of tasks and utilization of
resources. Finally, Somalia is challenged with internal political issues such as
lawlessness, pirating and terrorism. (Gettleman, 2010) Per conversations with Bernard
Chomilier (Head of WFP Logistics Development Unit), the WFP was also recently
warned to stop operating in the country.
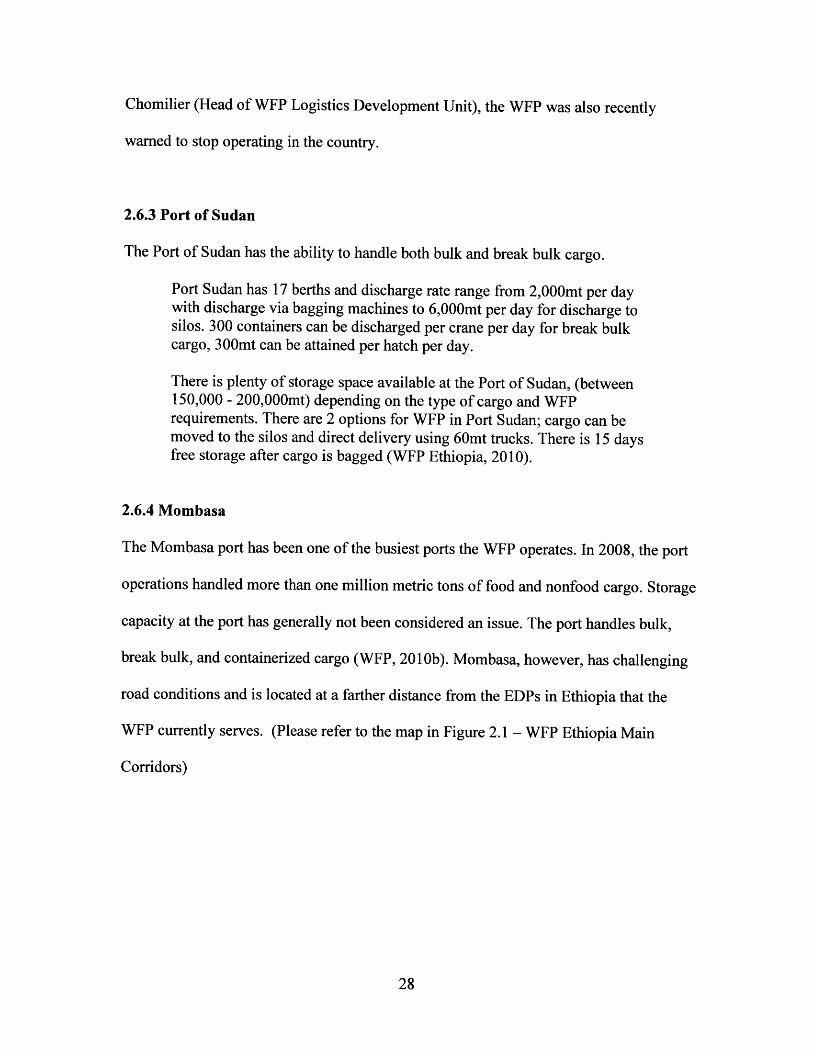
2.6.3 Port of Sudan
The Port of Sudan has the ability to handle both bulk and break bulk cargo.
Port Sudan has 17 berths and discharge rate range from 2,000mt per daywith discharge via bagging machines to 6,000mt per day for discharge tosilos. 300 containers can be discharged per crane per day for break bulkcargo, 300mt can be attained per hatch per day.
There is plenty of storage space available at the Port of Sudan, (between150,000 - 200,000mt) depending on the type of cargo and WFPrequirements. There are 2 options for WFP in Port Sudan; cargo can bemoved to the silos and direct delivery using 60mt trucks. There is 15 daysfree storage after cargo is bagged (WFP Ethiopia, 2010).
2.6.4 Mombasa
The Mombasa port has been one of the busiest ports the WFP operates. In 2008, the port
operations handled more than one million metric tons of food and nonfood cargo. Storage
capacity at the port has generally not been considered an issue. The port handles bulk,
break bulk, and containerized cargo (WFP, 201 Ob). Mombasa, however, has challenging
road conditions and is located at a farther distance from the EDPs in Ethiopia that the
WFP currently serves. (Please refer to the map in Figure 2.1 - WFP Ethiopia Main
Corridors)
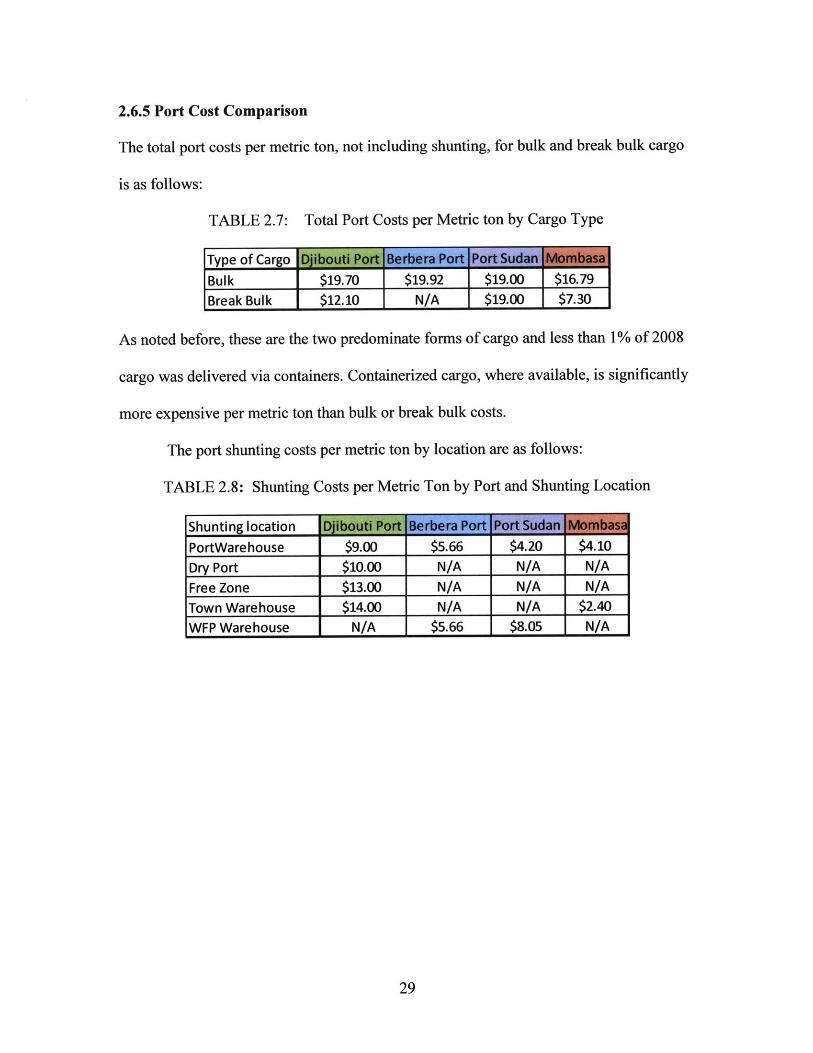
2.6.5 Port Cost Comparison
The total port costs per metric ton, not including shunting, for bulk and break bulk cargo
is as follows:
TABLE 2.7: Total Port Costs per Metric ton by Cargo Type
Type of CargoDjbuiPd e*Bulk $19.70 $19.92 $19.00 $16.79Break Bulk $12.10 N/A $19.00 $7.30
As noted before, these are the two predominate forms of cargo and less than 1% of 2008
cargo was delivered via containers. Containerized cargo, where available, is significantly
more expensive per metric ton than bulk or break bulk costs.
The port shunting costs per metric ton by location are as follows:
TABLE 2.8: Shunting Costs per Metric Ton by Port and Shunting Location
Shunting location DjiNbouti Porterb $o85t
PortWarehouse $9.00 $5.66 $4.20 $4.10Dry Port $10.00 N/A N/A N/AFree Zone $13.00 N/A N/A N/ATown Warehouse $14.00 N/A N/A $2.40WFP Warehouse N/A $5.66 C $8.05 N/A
............................... ... ......... . ........... - - -------- ----- m ..........

3 Analysis & Recommendations
With an understanding of the WFP's involvement in Ethiopia as established in the
Introduction, and the current factors (road conditions, ports, trucking and food aid types)
involved in the WFP's transport of food aid to Ethiopia, our approach in this next step of
our analysis was three-fold. In our analysis, we focused on three primary objectives: 1)
to holistically document the current food transport workflow for the WFP, 2) to drill
down to the root causes of existing processes and 3) to identify areas of improvement and
suggest practical ways to implement these solutions. Along the way, in each of these
areas we aimed to challenge the assumptions driving the WFP's current transportation
practices and develop clear decision-making solutions for implementation.
Throughout the course of the research process, we experienced challenges that
altered the original planned course and scope of our project. The data that we had hoped
to receive to identify if there was a trucking transportation capacity constraint never
materialized. We had initially planned to obtain truck transportation metrics data from
external international research organizations such as GTZ, a German government
organization focused on promoting international cooperation for sustainable
development. Specifically, we sought to gather data on the number and physical
condition of available trucks in Ethiopia, the carriers that supply WFP, the frequency
specific trucks entered and left the port and truck delays. We also requested transactional
data from the WFP regarding Djibouti port shunting and truck delay information. The
WFP indicated that this data would not be available because transaction-type shunting
was not used for all the cargo shunted to the port warehouses.

Adapting to this lack of data, we shifted the focus of our research. In lieu of
documenting the truck capacity available for the WFP to unload its ships in a timely
manner, we instead focused our attention on comparing the balance of trucking
transportation available between the three utilized ports. Since the WFP frequently has to
shunt food aid, we were able to find evidence that there is often a supply and demand
imbalance for trucking transportation at the ports. Additionally, WFP team members
were able to visually identify food aid inventory building up at the port and that there was
a lack of trucking transportation available. Even though truck transport data was
unavailable, we attempted to obtain secondary data, such as port information, that could
support the assertion that there are constraints in the supply chain caused in part by a
trucking transportation constraint.
This section first outlines the research approach used in our analysis. Then, we
analyze the details of the supply chain process flow, and identify the root impact points at
which the WFP can more efficiently execute its procedures. Building upon the shipping
and ground transport process flow, we then analyze the corridor selection, the supply
chain capacity and the port conditions affecting bottlenecks in the process. Integrated
within our analysis, we provide recommendations for improving the WFP's current
procedures.
3.1 Research Methods
The approach taken during our analysis was deliberate and systematic. We began by
actively listening to the WFP's needs, collaborating with the WFP team to develop our
project's scope, and reviewing prior research results developed at MIT for the WFP.

Concurrently, we reviewed literature to gather background research focused on
humanitarian logistics, Ethiopia, the WFP and its working relation in Ethiopia.
After having established the scope of our project, and gained a general
understanding of the situation in Ethiopia, we then preceded to interview WFP Ethiopia
Logistic team members to drill down to the details of our project. Through weekly calls
with the WFP Ethiopia Logistics team, we clarified our understanding of the WFP's
systems, and collected key metrics for data analysis. In doing this, we developed a supply
chain decision making flow chart used to identify the tradeoffs made at these important
decision making points. We then collected, cleaned, screened and analyzed data to better
understand the supply chains.
While our approach maintained consistency, we frequently lacked the data
necessary to quantify everything with the specificity we would have preferred. Setting
metrics, collecting and transmitting data are issues all organizations must face, and the
WFP is aware of the lack of existing data. Compounding the complications around data
collection, the WFP operates with many external stakeholders in a developing country
without access to the cutting-edge technology resources available to large, private
corporations.
In our calls with the WFP Ethiopia team, we attempted to challenge the
assumptions and dig deeper into the root causes for the existing processes. It was
important to holistically indentify not only the bottlenecks in the supply chain, but also to
identify the fixed constraints that the WFP must operate within.
This approach, with the assistance of the WFP Ethiopia team, allowed us to
identify a number of limitations and inefficiencies. We were then able to propose

recommendations that can help mitigate these issues and optimize the supply chain by
proposing changes that reduce cost, yet increase visibility, throughput and flexibility.
3.2 Supply Chain Process Flow
The WFP Ethiopia supply chain process flow can be divided into two segments: shipping
and ground transport. The shipping portion of the process flow includes the
categorization of food aid types, allocation to vessels for overseas shipment and port
selection process. The ground transport portion of the process flow is composed of the
procedures and decisions from the point at which the food aid arrives at the port, to the
truck capacity and carrier selections, the options for food loading and storage, and finally,
to the points of delivery inland to Extended Delivery Points and Final Destination Points.
Figure 3.1 below displays WFP's logistics process.
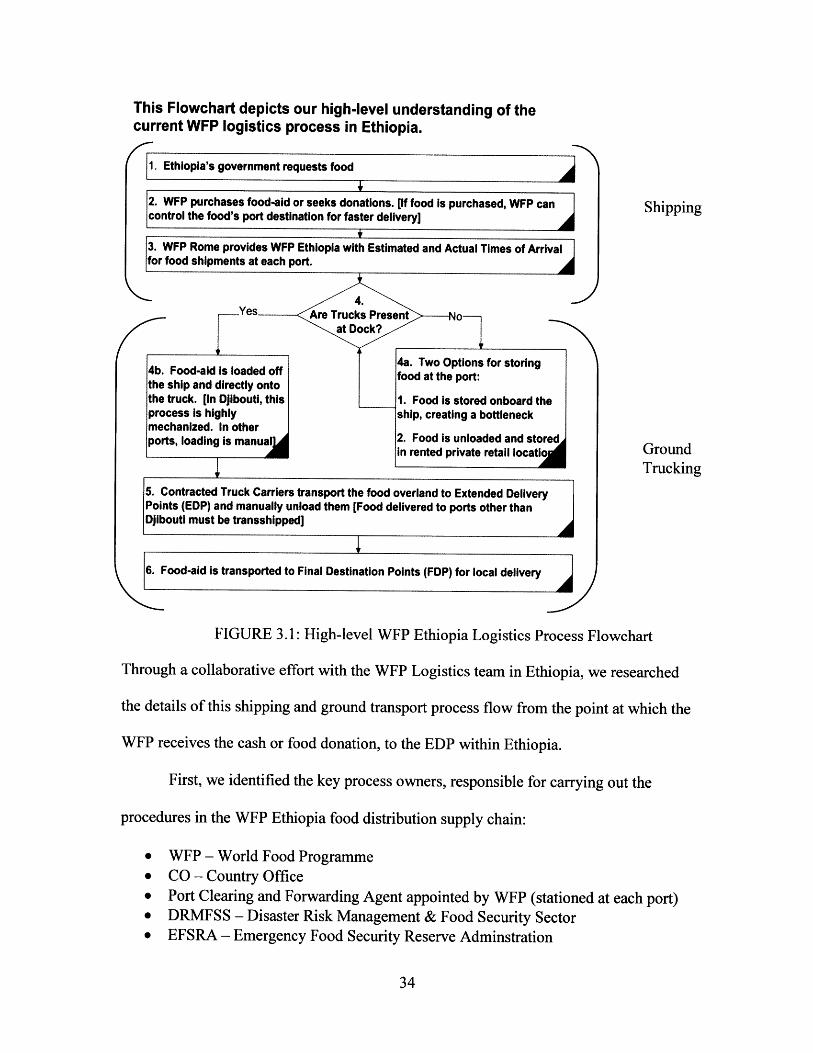
This Flowchart depicts our high-level understanding of thecurrent WFP logistics process in Ethiopia.
1. Ethiopia's government requests food
2. WFP purchases food-aid or seeks donations. [If food is purchased, WFP can Shippingcontrol the food's port destination for faster delivery]
3. WFP Rome provides WFP Ethiopia with Estimated and Actual Times of Arrivalfor food shipments at each port.
4.Yes Are Trucks Present No
at Dock?
4a. Two Options for storing4b. Food-aid is loaded off food at the port:the ship and directly ontothe truck. [In Djibouti, this 1. Food Is stored onboard theprocess is highly ship, creating a bottleneckmechanized. In other
Are Trucks in rented private retail locato GroundTrucking
5. Contracted Truck Carriers transport the food overland to Extended DeliveryPoints (EDP) and manually unload them [Food delivered to ports other thanDjibouti must be transshipped]
6. Food-aid is transported to Final Destination Points (FDP) for local delivery
FIGURE 3.1: High-level WFP Ethiopia Logistics Process Flowchart
Through a collaborative effort with the WFP Logistics team in Ethiopia, we researched
the details of this shipping and ground transport process flow from the point at which the
WFP receives the cash or food donation, to the EDP within Ethiopia.
First, we identified the key process owners, responsible for carrying out the
procedures in the WFP Ethiopia food distribution supply chain:
e WFP - World Food Programmee CO - Country Officee Port Clearing and Forwarding Agent appointed by WFP (stationed at each port)" DRMFSS - Disaster Risk Management & Food Security Sectore EFSRA - Emergency Food Security Reserve Adminstration
The following detailed flow figure and textual explanation of the WFP Ethiopia food
transport supply chain was developed through a combination of weekly phone meetings
with the WFP Ethiopia team, our own external research on the topic, and aggregated
analysis from internal sources such as the WFP Corridor Report and other WFP
publications.

WFP Ethiopia(Logistics) allocatescargo to each hub
using the downstreampipeline allocation
report and mobilizesrequired truck capacity
from its contractedtransporters in
preparation of vesselarrival at each port
WFP Ethiopia (AddisAbaba CO) issuesLandside Transport
Instruction (LTI) and isrecorded in COMPAS
Direct Delivery toNorthwest ofEthiopia -
EFSRAwarehouses for
loan repayments:Transport is
drawn from bothEthiopia & Sudan
through atendering process
Donors F
pledgeEtipa WPRmcash and PrjcConr (Porm ig ThPucaeRqiiincnflinooeothecae res
towards a apoe omdte eusto o nKn nentoa rlcldntoProject in b sun omdte
EEthiopia WFPoRome
bugerieomotes purhas Cash -(Logitcal PurhasEthoi
(Logistics) determines port of arrival andRequested Time of Arrival (RTA) of bulk cargo
TWFP Rome (Logistics) & WFP Ethiopia
(Logistics) determine shipping terms(Free Out & Liner Out) & port of entry
Estimated Time of Arrival (ETA) & Actual Time ofArrival (ATA): Vessel should give arrival notice to
WFP Ethiopia 10, 3 or 1 day prior to arrival at port ORthis can be estimated from the Sailing Advice
Cargo istransshippedfrom 60 mt
Sudanese trucksto 40 mt Ethiopia
trucks at atransshipmentpoint in Sudan
as due to terrain
Discharge+ silo +bagging
(integratedsystem)
Vessel goeson berth fordischargingimmediatelyupon arrival
If port is congested Landside TransportWFP negotiates with Instction (LTI) issued .port authorities for and recorded in COMPAS
priority berthing
Dischargeas prior + silo + e trucks
berthing been -yes t bagging available?ranted? (integratedI system)
No + Ys
anchorage until nextberth is available
unt cargoloDport warehouse if Ta
enough tWhen berthing spacebecomes available, Shuntship goes on berth -for discharging Port warehouses are
used as buffer storage;the food is moved -
immediately to reducestorage costsd
WFP Rome (Logistics) performscontract fixing of the vesselthrough a tendering process
WFP Ethiopia receives shipping documents (Bill of Lading,Sailing Advice, Inspection Certificate) 10 days within their
release by WFP Rome (Logistics) & arranges notification &customs clearances with clearing & forwarding agent
appointed by WFP at ports (Djibouti, Sudan, Berbera)
onse to an emergency or thepia (Logistics & Programming) + The Clearing & Forwarding
Agent accepts or accepts withVFP Ethiopia + agent organize conditions the shipping terms
(Free Out & Liner Out)ort warehouses are full andcargo to the receiving country.
GroundP Ethiopia
Clearing/Forwarding Transport*Sudan Agents prepare for arrival Berbera-
at each port (Djibouti,dan or Berber
Vessel goes on berth for
Dji outi discharging immediatelyupon arrival
if berthing space is mna agnavailable, vessel
mmediately goes on berth WPEhoi
for discharging (di bb
Discharge + silo + Instruction teughbagging (integrated (LTI) and
system) records in
C Direct delivery to FPtWFP main hubs warehouses
& EDPs in are used asSomali Region of buffer
)irect Delivery to WFP & Ethiopia: storage; theMFSS main hubs & EDPs: transport is food is movedsport is drawn from Ethiopia drawn from both immediately
Somaliland and to reduceEthiopia on 50/ storage costs
50 basis
Exceptional Cases: Ifarehouse is full, food will
LAL.IJ~UI dt IId mn ual~ bagin
not be offloaded at themain hub/EDP but sentirectly to selected FDPs
E-xceptional Cases: If warehouse isfull, food will not be offloaded at themain hub/EDP but sent directly to
selected FDPs with no security risk
FIGURE 3.2: Detailed WFP Ethiopia Logistics Process Flowchart (Bulk Cargo)
Shipping
Exceptional Cases:1. Vessel can be diverted to another CO in respreceiving CO does not accept GMO (WFP EthioWFP Regional Bureau + WFP Rome decide)2. Cargo can remain on board if it's infested. (fumigation3. Cargo (rob on ship) can remain on board if pthere is a lack of trucking capacity for off-take of
. I I
r

3.2.1 The Overseas Shipping Process
The shipping process begins when donors commit to providing cash and in kind
donations for Ethiopia. WFP Rome reviews the project and if approved, draws up a
budget for the engagement. The Programming department of the WFP Ethiopia Country
Office (CO) schedules and issues resource requests, and releases the purchase requisition
for commodities. The donations are categorized into one of three buckets: cash for
international purchases, cash for local purchases and in-kind for international or local
donations. It is important to note that the WFP Rome handles donated food (in-kind
donations) separately from purchased food (local & international) at the beginning of the
process, but that these donations, once turned into bulk cargo are managed by the WFP
Ethiopia CO in a similar, if not identical manner. There is currently no standard process
in place for using cash donations to procure food aid. Procurement typically is sourced
from the United States food surplus, the Black Sea countries or Asia. For in-kind
shipments, there is even less control for deciding the date but the WFP can estimate the
port of arrival that is most appropriate.
Next, the Logistics departments for both the WFP Rome and Ethiopia agencies
determine port of arrival and Requested Time of Arrival (RTA) for the bulk cargo of
purchased and donated food. In regards to the Estimated Time of Arrival (ETA) or the
Actual Time of Arrival (ATA), the vessel should give arrival notice to WFP Ethiopia ten,
three or one day prior to arrival at the port. The Country Office should receive the
shipping documents within 10 days of their release. If the voyage is less than 10 days,
then the documents will be sent via Fax (in 3 days). If the shipping documents have not
arrived within 10 working days before the ETA, the country office in the discharge

country should immediately contact the office within one day. Alternatively, the arrival
time can be estimated from the Sailing Advice document - a shipping document that
provides the cargo specifications. At this point, the WFP Ethiopia Logistics department
knows how much bulk cargo in each vessel is expected to arrive at each port because it
allocates cargo to each hub using the Downstream Pipeline Allocation Report - a detailed
report derived from the Bill of Lading containing information on the expected cargo and
shipping allocations by project. Based on this information, WFP Ethiopia Logistics
directs the sufficient capacity of contracted ground transport truck contractors at each
port to prepare for the arrival and ground mobilization of the arriving cargo at each port.
It is important to note however that WFP only has a Planned ETA but does not know the
Actual ETA until the ship sets sail. The Actual Time of Arrival (ATA) is obtained about
a week or two before the ship enters the port.
Meanwhile, WFP Rome Logistics uses a tendering process to fix the contract of
the shipping vessel for oversea transport. Then, the Logistics departments of WFP Rome
and Ethiopia CO coordinate to determine the port of entry for the shipment and terms of
shipment (Free Out and Liner Out). Free Out shipping is where the cost of unloading the
ship cargo is borne by the charterer (in this case, WFP). In the liner-out terms of freight
rate, the freight is inclusive of carriage and cost of cargo handling at the loading and
discharging ports. After ten days, the WFP Rome Logistics department sends to WFP
Ethiopia the shipping documents for the vessel cargo shipment. These documents
include the shipment's Bill of Lading, Sailing Advice and Inspection Certificate. Given
these documents, WFP Ethiopia communicates with the Clearing / Forwarding Agent
appointed by WFP at each port (Djibouti, Sudan and Berbera) to send notification of the

impending shipment and clear customs regulations for the shipment's passage through
the port of entry. The Clearing/Forwarding Agent at the Port either "accepts" or
"accepts with conditions" the shipping terms (Free Out and Liner Out). Most bulk cargo
is shipped to one of three ports (Berbera, Sudan or Djibouti) but there are few exceptional
cases that call for modified action:
1. In cases of emergency or if the receiving CO does not accept the shipment, then
the vessel can be diverted to another CO destination. This decision is made at the
discretion of the WFP Ethiopia Logistics and Programming departments, the WFP
Regional Bureau and the WFP head office in Rome.
2. If infested, the cargo will remain on board the vessel until the WFP Ethiopia and
Clearing/Forwarding Agent arrange for fumigation.
3. If port warehouses are full and trucking capacity is not sufficient for unloading
the cargo at the port, the cargo can remain on board. It costs the WFP between
$20,000 to $50,000 per day to delay a vessel at a port, depending on the vessel
carrier and port fees. Each additional vessel expected to dock at the port, waiting
on the delayed vessel to move from its parking space compounds the overall cost
by adding an additional $20,000 to $50,000 per day. Further, the government and
DP World Port Authority would prefer not to delay vessels at the port.
In spite of these exceptions, most shipments follow the standard process for receiving
shipments at each of the three ports, Berbera, Sudan and Djibouti. The ship discharging,
bagging and ground overland (from port to Extended Delivery Points; transport of goods
from other countries to Ethiopia) and ground inland (from Extended Delivery Point to
Final Destination Points; transport of goods within Ethiopia) of the bulk cargo differs,
however, depending on the port of entry.
3.2.2 Djibouti: Port & Ground Transport
Because the Djibouti Port has been the primary port of entry for Ethiopian international
oversea arrivals, and the volume and unpredictability of cargo passing through the port is
very high, berthing space may or may not be available for WFP shipments. Thus, there
are two scenarios for bulk cargo handling of shipments into Djibouti, depending on
whether or not berthing space is available at the port.
If berthing space is available, then the vessel arrives at the port and immediate
goes alongside the berth. Similar to Port Sudan, Djibouti also utilizes an integrated
system for the discharging, silo and bagging of bulk food aid. If trucks are available,
WFP Ethiopia uses the Landside Transport Instruction (LTI) tool to formalize a request
for transport services. The LTI serves as a means to allocate cargo to transporters; and as
a release instruction to the store keepers. It also serves as a monitoring, performance
evaluation and invoicing tool. The LTI is issued and recorded in COMPAS (the
Commodity Management Processing and Analysis System), which is used to track food
commodities from the point of origin through the supply chain to the final distribution
points. COMPAS, a globally implemented system at the WFP, provides WFP Logistics
with a point-in-time, updated snapshot of food inventory movement throughout the
supply chain. Ethiopian truck contractors are employed to conduct this delivery. In the
exceptional case where the EDP warehouse is full, WFP may send the food directly to
selected Final Destination Points without offloading it at the EDP.
If, due to port congestion, berthing space is not available, then the WFP negotiates
with port authorities for priority berthing options. If the Djibouti port authorities
immediately grant permission, the berthing and discharge process starts immediately.
Otherwise, as per Djibouti Port principle of "first come first serve," the vessel must wait
at the Djibouti Port on anchorage in queue until the next berth is available. Once
berthing space is available, the WFP employs its integrated discharging, silo and bagging
system and follows the process for if trucks are available. If trucks are not available,
cargo is shunted to the port warehouses, which are used as a buffer storage.
3.2.3 Berbera Port: Port & Ground Transport
At Berbera, the shipping vessel goes on berth for discharging immediately upon arrival.
Bulk cargo is manually bagged at the port during the unloading process. If trucks are
available, the shipment is directly delivered to the WFP EDPs located within the Somali
Region of Ethiopia. The trucking transport of food aid in Berbera is allocated on a
roughly 50/50 split between Somaliland and Ethiopian contractors. In exceptional cases
at the country office and field level, such as if the warehouse is full, the cargo is not
unloaded at the EDP but instead directly transported to FDPs pre-selected for their lower
security risk. In the case that trucks are not available at Berbera, the WFP Ethiopia
Logistics team directs the cargo to be shunted to the port warehouse. Port warehouses,
utilized as a buffer storage, are costly due to inventory holding costs and the WFP will
mobilize the cargo as soon as trucks become available. The vessel shipment and trucking
transport delivery data is captured in COMPAS, the WFP Commodity Management
Processing and Analysis System. For Berbera, the WFP Ethiopia (Addis Ababa Country
Office) uses the Landside Transport Instruction (LTI) report as an instruction document
to communicate with the ports how much food aid to loaded and transported.
3.2.4 Sudan Port: Port & Ground Transport
In Sudan, the process is similar to Berbera in that the vessel cargo goes on berth for
discharge immediately upon arrival, but the difference is that Sudan has an integrated
bagging system in place for the discharging, silo and bagging of food. Cargo is then
transshipped to a transshipment point in Gendarif, Sudan. Transshipment is defined as
changing the mode of transportation between routes. In this case, because Sudanese
trucks have a capacity of 60 metric tones, but the Gedarif to Ethiopia terrain requires
trucks with only a 40 metric ton capacity, the cargo is offloaded from 60 metric ton to 40
metric ton trucks at the transshipment point. (WFP Ethiopia, 2010). The Northwest
region of Ethiopia (cities like Wereta and Gonder) are usually the Final Desination Points
of shipments through Port Sudan. The Sudan-Ethiopia route is drawn from both
countries through a tendering process in order to leverage competitive rates. Similar to
its process for Berbera, WFP Ethiopia (Addis Ababa country office) captures vessel
shipment and trucking transport delivery data in COMPAS, and issues the Landside
Landside Transport Instruction (LTI) report to communicate with the ports how much
food aid to loaded and transported.. The Emergency Food Security Reserve
Administration (EFSRA) warehouses the final shipments in exchange for loan
repayments.

3.2.5 Process Flow: Root Cause Analysis
There are five primary areas within the shipping process flow where WFP can make a
defined impact on reducing the cost and timing of bulk cargo transportation: The
determination of port for arrival and Requested Time of Arrival (RTA) for bulk cargo,
Communication of Estimated Time of Arrival (ETA) and Actual Time of Arrival (ATA),
and the Reporting, Discharging and Overland/Inland transport from each of the three
Ports. The following points describe ideas that we think could be useful for the WFP:
1. Determination of port arrival and Requested Time of Arrival (RTA) of bulk
cargo. The roots of impact here affecting the timing and cost are the amount of
bulk volume available, the port congestion and relative needs of communities at
Extended Delivery Points. If the WFP intends to utilize 20 percent of the berth
capacity, then the WFP can coordinate with other organizations and shift the
utilization of each berth. In addition, depending on the shelf life of warehoused
grains, the WFP should plan ahead and bring more food in to a different port, hold
stock there and decrease it's utilization of the Djibouti port. Finally, in regards to
seasonal volume fluctuations at the port, the WFP does not have the ability to
easily pick one corridor (route from origin at port through to EDP) over another,
but the WFP can instead influence the overall quantity of food that is sent to a
different port. Further, the WFP can take seasonality into account by sending
food to Ethiopia a month earlier or support FDP's in need, through utilizing
alternative ports that are seasonally less congested.
2. Communicate Estimated Time of Arrival (ETA) and Actual Time of Arrival
(ATA). There are two roots of impact that drive the ETA and ATA: contractual

shipping terms and shipping documents used to communicate these terms. It
takes ten days for the WFP Ethiopia to obtain the Bill of Lading, Sailing Advice,
and Inspection Certificates necessary to move forward with scheduling ship
vessels and mobilizing truck capacity needed. More real-time communication
between WFP Rome and WFP Ethiopia Country Offices could reduce the lead
time at this critical early stage of the process. Further, the shipping terms of
vessel contract fixing and Free Out vs. Liner Out are complex and determined on
a case-by-case basis. The process could be more efficient if WFP could
institutionalize the shipping term negotiation process by categorizing a set of
standard contracts for use based upon defined scenarios (i.e. for shipments of x
metric tones with y carrier to z destination, use shipping term contract A). The
WFP would also benefit from increased communication with the Ethiopian
Government, other NGOs, Port/berth managers, Fertilizer ships, and
transportation carriers.
3. The LTI and waybill information data are recorded in COMPAS to track the flow
of food supply and analyze transport performance. The WFP could use COMPAS
to better predict trucking capacity based on historical truck availability at peak
times throughout the year.
4. Manual bagging versus Integrated Discharging + Silo + Bagging System. Only
the Berbera Port continues to utilize a manual bagging system upon the ship's
arrival. If the WFP were to implement into the Berbera Port the integrated
discharging + silo + bagging system used at Sudan and Djibouti, then more
capacity could be shifted to Berbera. The potential for greater utilization of the

Berbera Port, along with the decreased risk of congestion at Djibouti would offset
the costs of implementing this new automated bagging system.
5. Transshipment of Cargo and Port Warehouses. Only Sudan utilizes the
transshipment of cargo at transshipment points. This practice was necessitated by
the difference between Sudanese trucks and Ethiopia trucks in truck capacity.
Sudanese trucks hold 60 mt. while Ethiopia trucks must be 40mt to navigate the
mountainous terrain of the northwest region of Ethiopia that this port serves. This
transshipment practice could be expanded, however, into other areas not
necessitated by different size trucks. Transshipment, in lieu of utilizing EDP
points, saves time and labor resources - and ultimately saves the WFP money.
The WFP could test transshipment practices in a few of the most highly utilized
EDP's in Djibouti first, and if these test cases are successful, implement
transshipping in other EDP's in Berbera as well.
3.2.6 Communication, Transparency & Visibility of Supply Chain
Given the social, physical and cultural challenges facing the transportation of food aid in
Ethiopia, one key way in which the WFP can reduce supply chain inefficiencies and
bottlenecks in the process is to coordinate information flows with multiple partners.
Implementing greater communication channels within the supply chain will allow the
WFP to mitigate unexpected disruptions, diversify risks and increase the chain's
flexibility to unavoidable environmental changes. As an added benefit, utilizing the
community and other partners involved at the ground level at FDPs, EDPs and the Port
locations can also contribute to building the infrastructure of Ethiopia's developing

economy. Within the WFP Supply Chain, we have identified the following four metrics
which can greatly benefit from greater information dissemination:
1. Port delay to the berth2. Truck timing and capacity3. Number of trucks available to the WFP4. Shunting costs and frequency
The faster flow of land transport information for each of these metrics would have a
defined impact on the WFP's supply chain. Additionally, creating and tracking key
supply chain metrics would help track the progress of these information flow increase
efforts.
3.3 Corridor Landed Cost Analysis
Prior to 2009, the WFP utilized only the Djibouti corridor to transport food aid into
Ethiopia. However, now that Port of Sudan, Berbera and Mombasa ports are available,
the WFP must identify the most appropriate corridor and the best timing for utilizing that
corridor to deliver food aid to the Ethiopian population in need. The criteria that WFP
should use to determine the optimal corridor is based on a number of factors including
time, cost, distance, reliability and relationship. As these factors are not mutually
exclusive, it is important to understand how they influence each other. Figure 3.3 below
is visual representation of the relationship between each of the factors affecting corridor
selection.

FIGURE 3.3: Corridor Selection Decision Factors
1. Distance - This factor considers the how far EDPs and FDPs are located away
from a port. However, this distance alone does not provide a full understanding of
the cost and time associated with serving an EDP. For example, an EDP can be
located 1,000km away from the port, but may also happen to be a major city of
commerce supplied by paved roads. Because of these additional road condition
and commerce factors, it may be faster and cheaper than delivering to another
closer EDP.
2. Time - This factor considers the critical importance of delivering food aid
promptly to address the health and welfare of the in-need Ethiopia population.
The time factor is influenced by loading and unloading speeds and capacity, road
conditions and customs clearance. Additionally, distance, relationships and to an
extent, cost impact delivery time. With stronger relationships, the WFP can gain
greater reliability and preference in shipping its cargo. Additionally, if the WFP
were capable of offering incentives to carriers, it could have their food delivered
faster and with fewer delays.
.... ....... . ......... ............. ... ....... . .......... ...... ......

3. Relationships - This factor considers how the WFP interacts with governments,
carriers and local populations. For instance, in providing services to the Somalia
region of Ethiopia, the WFP may have better success utilizing local populations
for transportation and oversight. Additionally, strengthening the relationships
between the major stakeholders provides WFP more opportunities and flexibility
to operate, which in turn can help reduce cost and transit time as well as increase
service levels.
4. Reliability & Quality - This factor considers the value proposition and variability
of the transportation stakeholders. To provide food aid successfully, the WFP
depends on the ports and transportation carriers to provide consistent service
levels. Specifically, port facilities need to be capable of providing the required
capacity to unload food aid and transportation needs to be available at the port to
pick up the cargo.
5. Costs - This factor considers all the expenses that the WFP incurs in its supply
chain. These cost factors include shrinkage, administration and corridor costs. The
primary components of the corridor cost are associated with port, shunting and
transportation costs. Port costs include bagging, clearance, handling and port
charges. Shunting costs can vary by location and are charged on a per metric ton
basis. Transportation costs are provided as a birr (Ethiopian currency) rate per
metric ton. These transportation costs inherently take into account such factors as
economic forces, distance, time, and road conditions facing truck carriers
contracted by the WFP.

As the situation WFP faces is amorphous, it is difficult, if not impossible to
quantify the impact of each factor in the corridor selection process. However, with the
data provided, we are capable of analyzing the corridors (port to EDP) based on cost and
location. While time and distance are not absolute indicators of cost, they are significant
factors of transportation cost (Chander & Shear, 2009). This provides us a directional
understanding that lower costs should correlate with lower transportation times.
3.3.1 Transportation Costs
In analyzing the corridor costs, we focused our attention on the major, direct cost
categories that were unique to each corridor: transportation costs, port costs and shunting
costs. Tables 3.1-3.3 below compare the shared EDPs of the Djibouti corridor with the
newer Port of Sudan and Berbera port corridors. While there are additional EDPs in
Ethiopia, we focused our analysis on these specific ports, given their close proximity to
more than one corridor and data availability. The transportation costs for the newer ports
to travel to all the EDPs would be exorbitant and cost prohibitive. Mombasa was not
included in the analysis as the transportation costs were not available and the port has not
been utilized. The rate data were provided by WFP.
For Tables 3.1-3.3, please note the following:
1 USD = 12.55 Birr2 Distance from Berbera Port to WARDER estimated; cost is actual3 GONDER via KOMBOLCHA for Djibouti Port4 WERETA via CHIFRA for Djibouti Port5 Djibouti shunting costs range from $9-$14, estimated at $10 for this analysis

TABLE 3.1: Transportation Costs from each Port to select EDPs
Destination Degehabor Diae Gode Jijga Kebridehar Nazareth Warder Gonders Wereta"Dawa
Distance 638 315 1,033 472 863 723 992 1,230 822
$USD/ km/ mt $0.16 $0.13 $0.31 $0.14 $0.28 $0.07 $0.15 $0.09 $0.10Transportation $104.30 $42.39 $318.65 $63.82 $238.25 $52.59 $150.60 $116.61 $84.54
Distance 512 505 908 347 737 686 1,137 N/A N/A
$USD/ km/ mt $0.21 $0.16 $0.26 $0.16 $0.25 $0.16 $0.14 N/A N/ATanspottion $105.98 $82.23 $239.04 $55.38 $182.47 $110.76 $159.36 N/A N/A
Distance N/A N/A N/A N/A N/A N/A N/A 1,053 1,164
$USD/ km / mt' N/A N/A N/A N/A N/A N/A N/A $0.11 $0.10Transportation N/A N/A N/A N/A N/A N/A N/A $115.83 $116.40
I Difference vs. Djibouti $1.68 $39.84 -$79.61 -$8.44 -$55.78 $58.17 $8.76 -$0.78 $31.86Percent Difference vs. Djibouti 1 1.6% 94.0% -25.0% -13.2% -23.4% 110.6% 5.8% -0.7% 37.7%
During our analysis, it became immediately apparent that some EDPs could be
served at a lower transportation cost through the Berbera port or Port Sudan. However,
to obtain a more complete picture of the total costs of delivering one metric ton of food
aid, it is important to consider port and shunting costs in addition to transportation costs
alone.
3.3.2 Total Costs
To capture the total costs we analyzed the cost impact of cargo type (bulk or break bulk)
as well as the impact of shunting. While containerized cargo is available at some ports,
we did not include it in our analysis since it costs significantly more than bulk and break
cargo and it is less than 1% of food aid volume. For the sake of simplicity, since the
break bulk follows a similar relationship between the ports as bulk cargo, we are only
going to focus our discussion on bulk cargo. The total cost data below is a composite of
WFP corridor data and rate files. The total costs between Djibouti port corridor and the
new port corridors are seen in tables 3.2-3.3 below.
50
.............. . ..... .... ........... . .....

TABLE 3.2: Total Bulk Costs For Select EDPs - Less Shunting
Destination Degehabor Dire Gode Jijga Kebridehar Nazareth Warder2 Gonders Wereta4Dawa
Trans ortation $104.30 $42.39 $318.65 $63.82 $238.25 $52.59 $150.60 $116.61 $84.54
Port $19.70 $19.70 $19.70 $19.70 $19.70 $19.70 $19.70 $12.10 $12.10
Total Costs $124.00 $62.09 $338.35 $83.52 $257.95 $72.29 $170.30 $128.71 $96.64
Trans ortation $105.98 $82.23 $239.04 $55.38 $182.47 $110.76 $159.36 N/A N/A
Port $19.92 $19.92 $19.92 $19.92 $19.92 $19.92 $19.92 N/A N/A
Total Costs $125.90 $102.15 $258.96 $75.30 $202.39 $130.68 $179.28 N/A N/A
Trans ortation N/A N/A N/A N/A N/A N/A N/A $115.83 $116.40
Port N/A N/A N/A N/A N/A N/A N/A $19.00 $19.00
Total Costs N/A N/A N/A N/A N/A N/A N/A $134.83 $135.40
INet Difference vs. Djiiui I $1.90 $40.061-$79.391 -$8.22 $55.56 $58.39 $8.98 $6.12 $38.76
-ercent Difference vs. Djiboui 1.5% 64.5% -23.5% -9.8% -21.5% 80.8% 5.3% 4.8% 40.1%
TABLE 3.3: Total Bulk Costs For Select EDPs - Including Shunting
Destination Degehabor Dire Gode Jijga Kebridehar Nazareth Warder2 Gonder Wereta4Dawa
Shunting5 $10.00 $10.00 $10.00 $10.00 $10.00 $10.00 $10.00 $10.00 $10.00
Total Costs $134.00 $72.09 $348.35 $93.52 $267.95 $82.29 $180.30 $138.71 $106.64
Shuntings $5.66 $5.66 $5.66 $5.66 $5.66 $5.66 $5.66 N/A N/A
Total Costs $131.56 $107.81 $264.62 $80.96 $208.05 $136.34 $184.94 N/A N/A
Shuntings N/A N/A N/A N/A N/A N/A N/A $6.00 $6.00
Total Costs N/A N/A N/A N/A N/A N/A N/A $140.83 $141.40
Net Difference vs. Djibouti -$2.44 $35.72 -$83.73 -$12.561 -$59.90 $54.05 $4.64 $2.12 $34.76
Percent Difference vs. Djibouti -1.8% 49.5% -24.0% -13.4%J -22.4% 65.7% 2.6% 1.5% 32.6%
From Tables 3.2-3.3 above, we can see that some EDPs offer better or nearly similar
costs than the Djibouti corridor. Without considering shunting, Gode, Jijga and
Kebridehar, would be more cost effectively served utilizing one of the new corridors.
Additionally, Degahabor and Gonder are within 5% of the Djibouti cost. If we consider
shunting costs, Degahabor, Gode, Jijga, and Kebridehar would be more cost effectively
served utilizing one of the new corridors.
.... .......

In addition to lowering corridor costs, utilization of these corridors to reach the
above noted EDPs can help provide more flexibility and agility to WFP's supply chain,
reduce the time needed to deliver food aid, and reduce the strain on the Djibouti corridor.
Transportation rates for these new corridors are expected to decrease as roads are
improved. Additionally, if more cargo is shipped, the WFP may be able to gain
economies of scale with the increase in volume, and pressure transportation carriers to
decrease rates.
An exact analysis should be done at the FDP level. This would require a complete
mapping of transportation network costs as well as FDP level demand. While the select
EDPs noted before can be more cost effective to serve via one of the new port corridors,
this doesn't take all of the supply chain factors into account. For example, it may not be
effective to send a fully loaded, chartered vessel to the Port of Sudan just to serve the
Gonder EDP. Shipping costs, potential food aid spoilage, extended warehousing costs
and location demand would need to be considered before shifting significant food aid to a
new corridor.
3.4 Supply Chain Capacity Analysis
At the WFP's request, we initially attempted to examine if there was a food aid
transportation capacity constraint that limited the WFP's ability to meet Ethiopia's
humanitarian food needs. Given the lack of specific quantitative transportation data
currently available, we broadened our analysis to study all aspects of the supply chain
from the Djibouti port to the EDP. We identified current and potential capacity
constraints within a number of WFP processes. Within this and the remaining sections of
our thesis, we propose options to alleviate or eliminate the residing issues. The choke
points in the supply chain may consist of berth access, berth unloading capacity, bagging
capacity, shunting capacity and trucking capacity.
At a high level, the WFP port supply chain consists of five possible steps:
* Berth access* Beth unloading capacity* Shunting capacity* Bagging capacity* Trucking capacity
The annual Djibouti port throughput capacity for bulk and break bulk food aid is:
e 2 berths * 70OOmt/day * 365 days = 5,1 10,000mt
A single berth therefore has 2,550,000mt of unloading capacity.
The two sets of bagging machines have the following annual throughput capacity:
* 2 sets of bagging machines * 3000mt/day * 365 days = 2,190,000mt
A single berth therefore has 1,095,000mt of unloading capacity.
Given these throughput capacities, we can determine the number of trucks necessary to
meet daily throughput. Assuming each truck is loaded with 37mt of food aid on average,
the port would require the following number of trucks each day:
If the port is fully utilized (bagging not considered):
9 2 x 7,000mt / 37mt = 378 trucks per day
If only one berth is fully utilized (bagging not considered):
* 7,000mt / 37mt = 189 trucks per day
If both sets of bagging machines are fully utilized:
* 2 x 3,000mt / 37mt = 162 trucks per day
If only one set of bagging machines are fully utilized:
* 3,000mt / 37mt = 81trucks per day
Depending on the number of bagging machine sets that are operating, the Djibouti port
requires either 81 or 162 trucks to be loaded with 37 metric tons of food aid each day to
meet the bagging throughput. In the current system, if even one berth is being fully
utilized, the bagging machines sets become a bottleneck in the WFP supply chain as they
provide less throughput than the berth. Increasing the number of bagging machines or
sets could help expedite the WFP process, increasing throughput. Additional capacity or
improved machines should only be considered if enough trucks are available to load the
bagged food.
If bagging machines are unavailable, WFP must shunt the food aid via conveyer
to the silos. We are unable to confirm if shunting capacity adversely impacts the supply
chain. The four shunting options at the Djibouti port offer the following capacities:
* Silo - 30,000mt" Dry Port - 15,000mt" Djibouti Free Zone - unknowne Town Warehouse - 8,000mt
Assuming that WFP is the only organization utilizing the warehouses, then it may have
the capacity needed to match supply. For instance, in October 2008, 142,832mt of food
aid was delivered to the Djibouti port, the largest single month of food aid recorded. If
the minimum amount of trucks frequented the port necessary to meet the throughput of
one bagging machine set (81 trucks), then the port would have the ability to shunt nearly
all the food aid at the onsite port warehouses. However, if any other organizations need to
utilize the warehouses, bagging machine sets are unavailable or trucks are unavailable,
then WFP will likely not have enough warehousing capacity. This would require WFP to
delay the unloading process and incur greater costs.
The other bottleneck, as witnessed by the WFP is trucking capacity. The supply
chain becomes constrained by the high variability in food aid supply and the high
variability in transportation carrier supply. A lack of truck transport capacity forces WFP
to shunt food aid; increasing delivery time and shortening the useful life of food aid.
WFP must shunt the unbagged food aid in the silo or the bagged food aid in the Dry Port,
Free Zone or Town Warehouse. During our thesis project, WFP visually identified a need
for shunting and lack of transportation capacity. After relaying this information to the
Ethiopian government, the government made assurances to increase the trucking
capacity.
3.5 Shipping, Port and Carrier Specific Analysis
To better understand the capacity constraints that affect the WFP's supply chain, we
focused our analysis on the Djibouti port, since the WFP currently ships 90 percent of
their volume through this highly utilized port. The shipping data that we received
consisted of all the food aid shipments that have gone through the Djibouti port since
2000. This is an important distinction to note as we are examining the totality of
shipments at the port, including those apart from the WFP's consignee food aid. We
decided to analyze data in aggregate for two reasons. The first is that it is more
statistically relevant to have additional data points. Secondly, the practice of analyzing

the total data for all shipments provides a better representation of what is occurring at the
two bulk and break bulk berths at the Djibouti port. Although currently unavailable, if
we had access to the fertilizer vessels' data, we would have an even more complete
picture of what occurs at the two accessible berths.
The Djibouti shipping file provided information on when vessels arrived and
departed from the port. While we were able to quickly determine the number of days a
vessel spent in the port, we didn't know if the vessel had been delayed or if it had stayed
for an appropriate number of days. For instance, vessels carrying more food aid are
expected to spend more time in port unloading its cargo. However, knowing the port's
berth capacity, we are able to calculate the theoretical time a vessel should be in port. For
example, a vessel carrying 70,000mt of food should be able to unload its cargo and leave
the port in 10 days if the berth is operating at its 7,000mt level. We are then able to
compare the actual time a vessel spent in the port to the calculated time that we derived
from the berth unloading capacity. This provides us a days-of-delay metric that we can
use to analyze the days of delay for each vessel arrival on a monthly basis.
For each month, we added together all the vessels that arrived in the port that
month, the vessels' quantity of food aid delivered, and the number of days in spent in the
port. We then compared the number of days the accumulated vessels spent in port to the
number of days we calculated that the vessels should have spent in port based on various
berth capacities. We choose the following unloading rates to compare against the actual
days in port: 3,000mt (a single bagging machine set), 6,000mt (two bagging machine
sets), 7,000mt (a single berth capacity), and 14,000mt of capacity (the capacity from both
berths). Given the relationship of this metric, the larger the port capacity, the greater the

calculated delay; as we would expect the vessel to be able to unload and leave the port
quicker. We believe that analyzing the shipping data based on 7,000mt daily throughput
is the most realistic representation of the food aid capacity of the port. This takes into
account that the berths are also used for other cargo like fertilizer, and that the berths are
likely unable to constantly operate at 100% utilization.
The relationship between the actual quantity of food aid delivered and the
calculated delay assuming a 7,000mt throughput can be seen in the below figure 3.4.
Additionally, figure 3.5 shows a histogram of the calculated delays.
Total Days of Delay by Arrival Monthat Djibouti port (Quantity of Food Aid) uat
200 350,000
180 300,000
160
140 250,000
120 12. 200,000100 -
' - 150,000
60 ,100,000
40 .. -50,00020 . . . .
0oD C> 0 r-1 -4 C-4 C-4 rN en MA .J 19 LA Ln LA LOD to Ir. 1.. Il 00 00O 0 0 0 9 9 0 0 0 0 0 0 0 0 0 0O -L ' M 0 U -
(a 2 0 cc ) a)((A LLn IZ (LA UL
''**** Days of Delay Based on 7,000mt/day Capacity
-Actual Quantity of Food Aid Delivered (Metric Tons)
FIGURE 3.4: Djibouti Port Total Calculated Delays by Arrival Month
.. .... ................................................. . ..... ...... - - -.- ........... --- ....................... .... ..... ..................................... _ .-
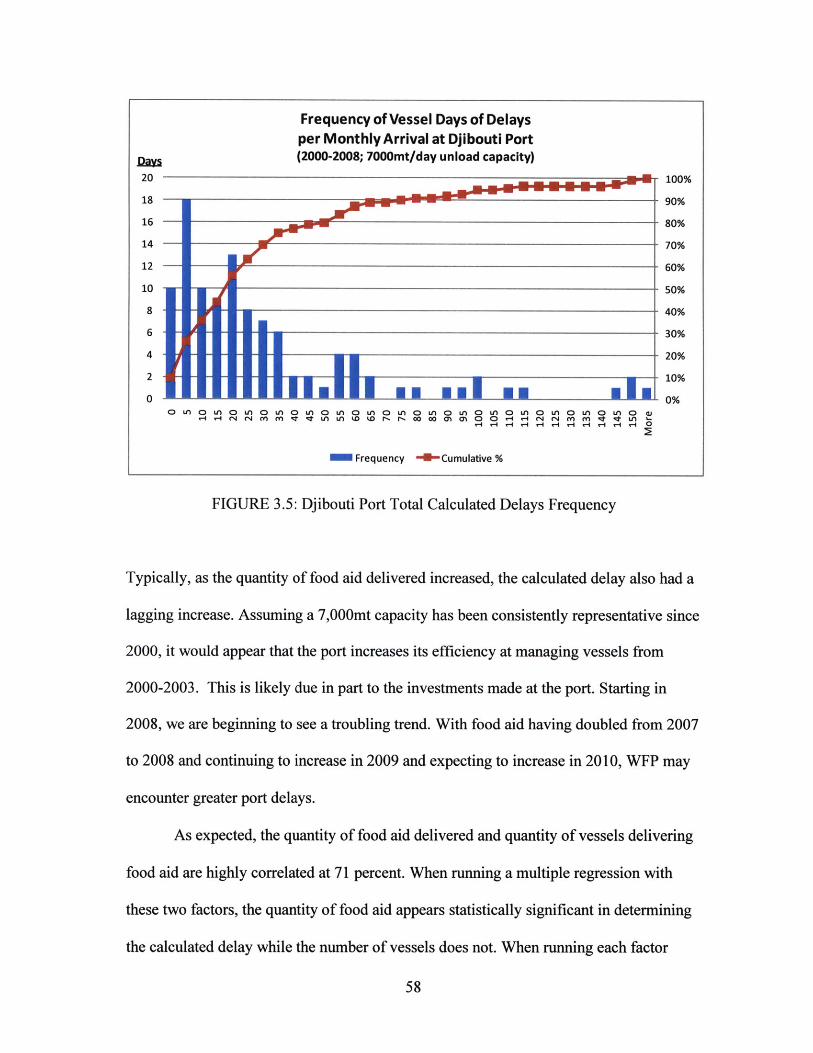
Frequency of Vessel Days of Delaysper Monthly Arrival at Djibouti Port(2000-2008; 7000mt/day unload capacity)
20 100%
18 90%
16 80%
14 70%
12 60%
10 50%
8 40%
6 30%
4 20%
2 110%
0 -0%0 LA 0 LA 0 LA 0 LA 0 LA 0 LA 0 LA 0 LA 0 LA 0 LA 0 LA 0 LA 0 LA 0 LA 0 LA 0 p)
v-4 v-.4 C4 r4I M M 4 oi LA LA wD wD F. F. co co m1 0(n 0 0 A-4 4 " rn rn 4 qt ~L LA,1 4 4 -4 -4 4 -4 -4 -4 -4 .-4 0
Frequency - Cumulative %
FIGURE 3.5: Djibouti Port Total Calculated Delays Frequency
Typically, as the quantity of food aid delivered increased, the calculated delay also had a
lagging increase. Assuming a 7,000mt capacity has been consistently representative since
2000, it would appear that the port increases its efficiency at managing vessels from
2000-2003. This is likely due in part to the investments made at the port. Starting in
2008, we are beginning to see a troubling trend. With food aid having doubled from 2007
to 2008 and continuing to increase in 2009 and expecting to increase in 2010, WFP may
encounter greater port delays.
As expected, the quantity of food aid delivered and quantity of vessels delivering
food aid are highly correlated at 71 percent. When running a multiple regression with
these two factors, the quantity of food aid appears statistically significant in determining
the calculated delay while the number of vessels does not. When running each factor
58

independently, the quantity of food aid is more explanatory. As such, we have chosen to
focus on the quantity of food aid for our analysis. For more information, please see the
regression output in the Appendix.
With 44% explanatory power or fit (R2), WFP could project the expected days of
delay per vessel. The formula to do this is: 2.83 +.00038* x if x is defined as the
expected number of metric tons delivered in a month. A 44% R2 is acceptable given the
seasonality of food aid and significant number of statistical unknowns at the port, such as
fertilizer data. Data entry mistakes and formatting could be a significant issue in the fit
not being greater. For instance, dates in the shipping file were input both as
Day/Month/Year and Month/Day/Year for the arrival and departure of the same vessel.
Data issues could contribute to some the skew in the above histograms.
There are many potential causes for port delays at the Djibouti port. Of these, the
most common cause is a lack of berths due to port congestion. The berth could be
blocked due to poor port management, queuing of vessels due to seasonality or offloading
issues. The offloading issues could be related to any number of problems such as cargo
being tainted, equipment failure or issues with customs clearance. Additionally, as cargo
is being unloaded it could be blocked by other port processes such as bagging and
loading on to trucks. Finally, the type of cargo appears can impact the port unloading
time.
For each issue there is typically a plausible solution although many require
significant investments or greater coordination with internal and external stakeholders.
The obvious port related options are to increase the number of ports and the capacity of
each berth. This however is a costly, long-term solution. The introduction of additional

bagging machines may however be a cheaper alternative that could increase throughput
and decrease delays. Another, option that could be more immediate and less costly would
be to increase coordination with other consignees. Where possible, the consignees could
share shipping forecasts which they could use to better plan shipments around each other
and the port's capacity. Finally, WFP can explore the effect of shipping smaller more
frequent batches of food aid. While large bulk shipments are most likely the cheapest
option for vessel shipping costs, these shipment could be straining port and transportation
capacity and actually increase the total supply chain costs. If financially and operationally
viable, WFP may be able to achieve a more optimized supply chain by decreasing bulk
batch shipments.
An ancillary benefit for reducing port delays could be to foster better relations
with transportation carriers. By reducing delays, carriers will be happier to work with
WFP. Specifically, trucking carriers wouldn't have to wait at the port as long allowing
them to be attain higher capital utilization and profitable. This in turn could allow WFP to
receive preferential treatment in the form or reduced rates and a better service level.
(Teravanintrhorn & Raballand, 2009, pp. 76-77).
In analyzing the shipping data we observed that a number of vessels that had
made multiple deliveries had significant calculated delays. Reviewing these instances
could provide WFP some interesting discoveries. Table 3.4 below provides a list of these
vessels.
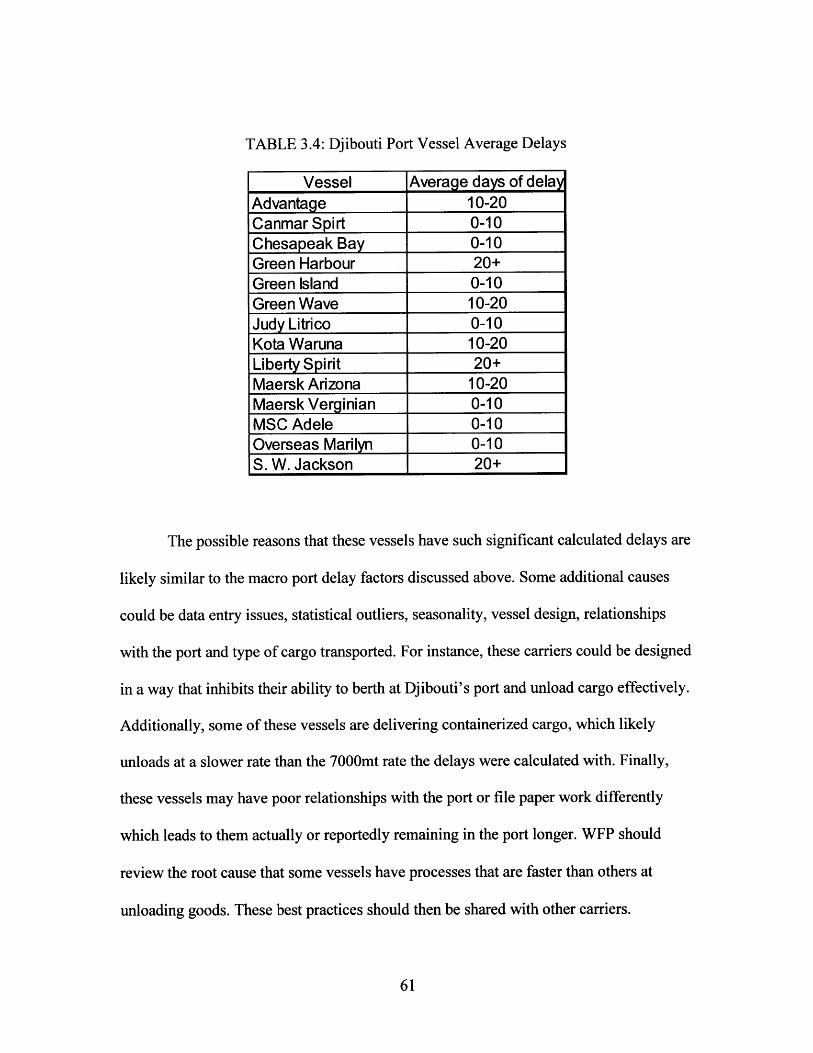
TABLE 3.4: Djibouti Port Vessel Average Delays
Vessel Average days of delayAdvantage 10-20Canmar Spirt 0-10Chesapeak Bay 0-10Green Harbour 20+Green Island 0-10Green Wave 10-20Judy Litrico 0-10Kota Waruna 10-20Liberty Spirit 20+Maersk Arizona 10-20Maersk Verginian 0-10MSC Adele 0-10Overseas Marilyn 0-10S. W. Jackson 20+
The possible reasons that these vessels have such significant calculated delays are
likely similar to the macro port delay factors discussed above. Some additional causes
could be data entry issues, statistical outliers, seasonality, vessel design, relationships
with the port and type of cargo transported. For instance, these carriers could be designed
in a way that inhibits their ability to berth at Djibouti's port and unload cargo effectively.
Additionally, some of these vessels are delivering containerized cargo, which likely
unloads at a slower rate than the 7000mt rate the delays were calculated with. Finally,
these vessels may have poor relationships with the port or file paper work differently
which leads to them actually or reportedly remaining in the port longer. WFP should
review the root cause that some vessels have processes that are faster than others at
unloading goods. These best practices should then be shared with other carriers.

4 Conclusion
The WFP is actively working towards increasing its supply chain capacity and efficiency
of operations, as evidenced in the Berbera and Sudan Port openings within the past year.
The first step towards improving its supply chain is in tracking metrics and gathering the
necessary data (i.e. truck capacity, delays at the port and corridor selections) in order for
the WFP to make informed, optimal decisions. The WFP is in the process of gathering
this data and hopes to move forward to implement google-maps lead-time displays,
defining metrics for transparency including Key Performance Indicators (KPI's), and
actively map programming, shipping, and procurement processes.
In addition to these efforts and the corridor optimization, supply chain process
flow root cause analysis, and port bottleneck analysis recommendations explored in our
thesis, the WFP has additional opportunities to improve its supply chain and make it
more lean, flexible and resilient. Transportation networks, truck contracting,
postponement and risk pooling are future areas of exploration in which the WFP's supply
chain can greatly benefit.
4.1 Transportation networks
WFP should lobby the government to continue to make infrastructure improvements to
Ethiopia and its surrounding countries. In addition to paving roads, WFP should push for
rehabilitation of the train system to locations like Dire Dawa. As noted by Supee
Teravanintrhorn and Gael Raballand in Transport Prices and Costs in Africa:
On the main international corridors, an absence of rail services createsopportunities for the trucking industry to inflate its prices. That is whyintermodal competition on these corridors is critical. Increase competitionfrom rail services benefits transport users primarily through comparable orlower transport costs (Teravanintrhorn & Raballand, 2009, p. 38).
In addition to helping lower total costs, this initiative could also provide additional
needed transport capacity.
4.2 Truck Contracting
Currently, there are 7000 trucks available for transporting food aid, according to Ethiopia
government reports. Given that the WFP requires 120 trucks of 40mt. each per day to
handle the flow of 4000 mt of food aid per day at the Djibouti port, the WFP may want to
consider exploring opportunities for improving truck contracting practices. In Ethiopia,
the government maintains control over the purchasing and allocation of trucks for use.
Because this privatization of truck capacity is controlled by the government, trucks are
typically allocated for use based on initiatives such as housing projects. In 2008, the
Ethiopia Ministry of works and Urban Development facilitated truck procurement for
"better performing contractors and transporters who are involved in the government's
housing projects. The facility concerns 2000 trucks to be imported from China." (Tekle,
2008). Contractors of the 2000 trucks from China would be required to pay 30 percent of
the truck purchasing price up-front, but have the option to pay the remaining 70 percent
of the truck price via secure loans from the Commercial Bank of Ethiopia. The WFP
could contract with the government to procure trucks from regions such as China under a
similar 30% down-payment + 70% on-loan payment agreement.

Alternatively, the WFP could opt to purchase trucks from the ministry and build
its own truly dedicated fleet. In this vertically integrated scenario, the WFP would be
able to secure better control over the truck capacity issue, maximize efficiencies by
mitigating the risk of bottlenecks at the port, eliminate concerns over penalizing
unreliable truck contractors, and increase information flow and visibility along the supply
chain. On the other hand, maintaining their own fleet would require the WFP to assume
risks traditionally absorbed by the truck contractors such as driver employment, truck
maintenance and management. Further, the WFP would have to make significant
investments to modify the existing systems and infrastructure in order to viably utilize a
dedicated fleet.
A compromising solution is to roll-out a dedicated fleet on a smaller scale - a
hybrid model of truck contracting and the dedicated fleet options. Adding even a small
dedicated fleet could help alleviate volume volatility spikes that affect port bottlenecks.
For example, the WFP could manage or contract 20 trucks to be a truly dedicated fleet
and significantly stabilize the demand for mobilizing food aid.
4.3 Postponement & Risk Pooling
A more radical option that the WFP can employ is risk pooling with postponement. This
would be difficult to coordinate and potentially add a level of complexity to WFP's
processes and organization. Compounding WFP's difficulty is that grain can only last
between six to twelve months under ideal conditions (Government of Alberta, 2002).
However, these challenges come with substantial benefits if developed and implemented
correctly. One such benefit is that it could allow a greater geographic region, beyond that

of Ethiopia, to pool demand risk and minimize variability. Pre-positioning and pooling
goods would allow the WFP to decouple its demand and supply of goods. Pooling even
5-10% of African food aid could help increase WFP's agility and ability to meet
changing needs (Oloruntoba & Gray, 2006). The system could function more similarly to
a multi-echelon DC feeding more local regions.
4.4 Final Note
These future areas of exploration - transportation networks, truck contracting,
postponement and risk pooling - are based upon our analysis of corridor optimization,
supply chain process flow root cause analysis, and port bottleneck analysis
recommendations (mentioned in our Analysis and Recommendations section). Our
methodology, analysis, process flow breakdown, and recommendations can also be used
by humanitarian organizations other than the WFP to improve their supply chain
performance.
References
Beamon, B.M. (2004), Humanitarian Relief Chains: Issues and Challenges," Proceedingsof the 34th International Conference on Computers & Industrial Engineering SanFrancisco, CA
Central Intelligence Agency. (2010). The World Fact book: Africa: Ethiopia. Retrievedfrom https://www.cia.gov/library/publications/the-world-factbook/geos/et.html
Chander, V. & Shear, L. (May 2009). An Analysis of World Food Programme Operationsin the Somali Region of Ethiopia. (Maters thesis) Massachusetts Institute ofTechnology, Boston, MA.
Daily Monitor. (November 16, 2008). Ethiopia: WFP, Company Sign Accord onHandling Commodities through Djibouti Port. Retrieved fromhttp://allafrica.com/stories/200811180773.html
Government of Alberta. (May 2002). Management of Cereal Grain in Storage. Retrievedfrom http://wwwl.agric.gov.ab.ca/$department/deptdocs.nsf/all/agdex4509
Lopez, M. (May 2003). A Study on The Lead-Times in The United Nations World FoodProgramme Supply Chain. A Focus on the Country Offices. (Maters thesis)Massachusetts Institute of Technology, Boston, MA.
Oloruntoba, R. & Gray, R. (2006). Humanitarian Aid: An Agile Supply Chain?. SupplyChain Management: An International Journal. pp. 115-120 Retrieved fromhttp://www.emeraldinsight.com/Insight/ViewContentServlet?Filename=Published/EmeraldFullTextArticle/Articles/1 770110204.html
Gettleman, J. (March 9, 2010). New York Times. Somalia Food Aid Bypasses Needy,U.N. Study Says. Retrieved fromhttp://www.nytimes.com/2010/03/10/world/africa/10somalia.html
Hausman, W., Lee, H. & Subramanian U. (October 10, 2005). Global LogisticsIndicators, Supply Chain Metrics, and Bilateral Trade Patterns
Tekle, T. (January 11, 2008). Ethiopia Helps Import 2000 Trucks From China. AfricaNews. com. Retrived fromhttp://www.africanews.com/site/Ethiopia helps import 2000 trucks from China/list messages/14580
Teravaninthorn, S. & Raballand, G. (2009). Transport Prices and Costs in Africa: AReview of the International Corridors. Washington, DC: The World Bank pp. 38,76-77.

Thomson Reuters Foundation. (April 29, 2009). Somalia: WFP Bid to Boost Capacity.Retrieved fromhttp://www.alertnet.org/thenews/newsdesk/IRIN/eb090cbc5b43d93ce839c4d9f67e85b.htm
World Food Programme. (May 2000). WFP Launches Urgent Food Airlift For Thousandsof People Displaced by Ethiopia and Eritrea War. Retrieved fromhttp://one.wfp.org/english/?ModuleID=137&Key=96
World Food Programme. (September 2004) Agreement for Leased Transport Fleet.Khartoum, Sudan
World Food Programme. (201 Oa) WFP Logistics. Country Operations. Ethiopia.Retrieved from http://www.wfplogistics.org/country-operations/africa/east/ethiopia
World Food Programme. (201 Ob) WFP Logistics. Country Operations. Kenya.Retrieved from http://www.wfplogistics.org/country-operations/africa/east/kenya
World Food Programme Ethiopia. (2010). Corridor Report 2009-2010. Addis Ababa,Ethiopia.
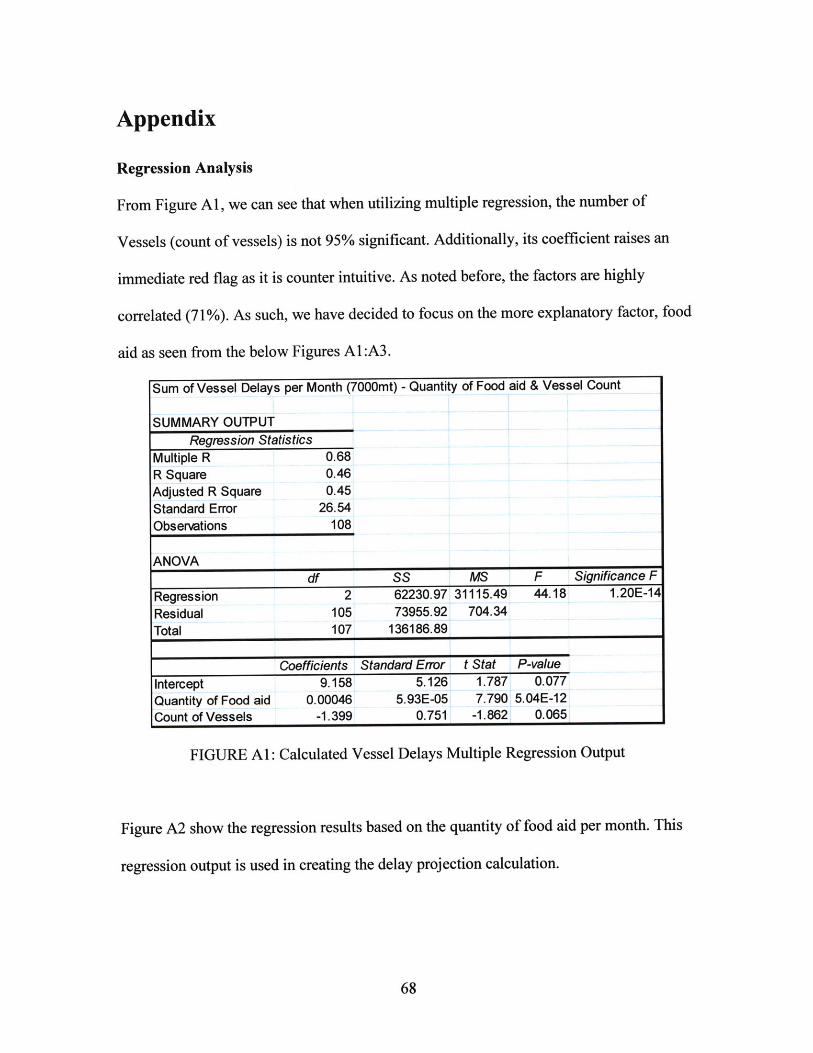
Appendix
Regression Analysis
From Figure Al, we can see that when utilizing multiple regression, the number of
Vessels (count of vessels) is not 95% significant. Additionally, its coefficient raises an
immediate red flag as it is counter intuitive. As noted before, the factors are highly
correlated (7 1%). As such, we have decided to focus on the more explanatory factor, food
aid as seen from the below Figures Al:A3.
Sum of Vessel Delays per Month (7000mt) - Quantity of Food aid & Vessel Count
SUMMARY OUTPUTRegression Statistics
Multiple R 0.68R Square 0.46Adjusted R Square 0.45Standard Error 26.54Observations 108
ANOVAdf SS MS F Significance F
Regression 2 62230.97 31115.49 44.18 1.20E-14Residual 105 73955.92 704.34Total 107 136186.89
Coefficients Standard Error t Stat P-valueIntercept 9.158 5.126 1.787 0.077Quantity of Food aid 0.00046 5.93E-05 7.790 5.04E-12Count of Vessels -1.399 0.751 -1.862 0.065
FIGURE Al: Calculated Vessel Delays Multiple Regression Output
Figure A2 show the regression results based on the quantity of food aid per month. This
regression output is used in creating the delay projection calculation.
... ....... 2M - .. .. - - - - " ..... .......
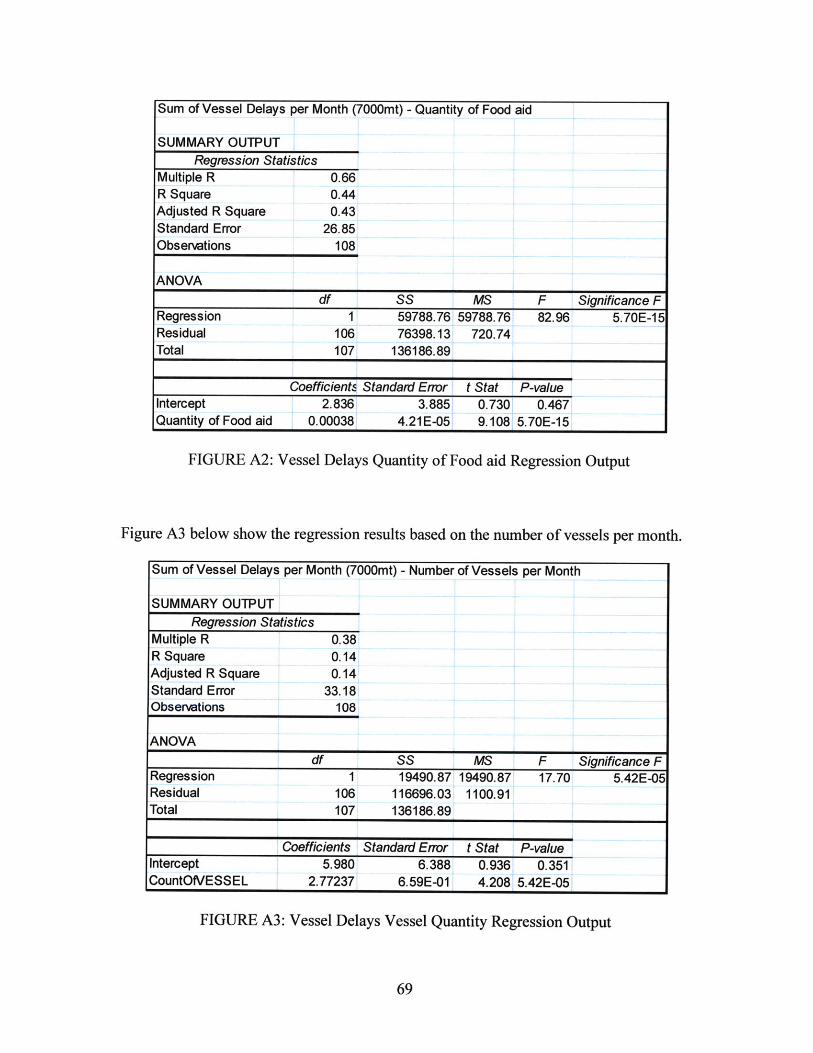
Sum of Vessel Delays per Month (7000mt) - Quantity of Food aid
SUMMARY OUTPUTRegression Statistics
Multiple R 0.66R Square 0.44Adjusted R Square 0.43Standard Error 26.85Observations 108
ANOVAdf SS MS F Significance F
Regression 1 59788.76 59788.76 82.96 5.70E-15Residual 106 76398.13 720.74Total 107 136186.89
Coefficients Standard Error t Stat P-valueIntercept 2.836 3.885 0.730 0.467Quantity of Food aid 0.00038 4.21E-05 9.108 5.70E-15
FIGURE A2: Vessel Delays Quantity of Food aid Regression Output
Figure A3 below show the regression results based on the number of vessels per month.
Sum of Vessel Delays per Month (7000mt) - Number of Vessels per Month
SUMMARY OUTPUTRegression Statistics
Multiple R 0.38R Square 0.14Adjusted R Square 0.14Standard Error 33.18Observations 108
ANOVAdf SS MS F Significance F
Regression 1 19490.87 19490.87 17.70 5.42E-05Residual 106 116696.03 1100.91Total 107 136186.89
Coefficients Standard Error t Stat P-valueIntercept 5.980 6.388 0.936 0.351CountOtVESSEL 2.77237 6.59E-01 4.208 5.42E-05
FIGURE A3: Vessel Delays Vessel Quantity Regression Output
.................................................... .. ................ . .. .. ... ...... ..... ... ....... I .... ........... .... . ... .. .... .... .
Related Documents