Strategies and Options for Increasing and Sustaining Fisheries and Aquaculture Production to Benefit Poorer Households in Asia www.worldfishcenter.org Reducing poverty and hunger by improving fisheries and aquaculture STUDIES AND REVIEWS | 1823

Welcome message from author
This document is posted to help you gain knowledge. Please leave a comment to let me know what you think about it! Share it to your friends and learn new things together.
Transcript
The last three decades have wi tnessed dramatic changes in the structure of supply and demand for fish, especially in Asia. This WorldFish research study sponsored by the Asian Development Bank focussed on nine developing countries – Bangladesh, China, India, Indonesia, Malaysia, the Philippines, Sri Lanka, Thailand, and Vietnam, all active players in the transformation of global fish supply and demand. The study, broken into five components and reported here, considered: 1) the profile of key aquaculture technologies and fishing practices; 2) analysis of policies, institutions and support services; 3) socioeconomic profile of major stakeholders in the fisheries sector; 4) projections of fish demand and supply in the nine Asian countries; and 5) formulation of national action plans based on the findings and recommendations of the study.
Strategies and Options for Increasing and Sustaining Fisheries and Aquaculture Production to Benefit Poorer Households in Asia
www.worldfishcenter.orgReducing poverty and hunger by improving fisheries and aquaculture
For further information on publications please contact:Business Development and Communications DivisionThe WorldFish CenterPO Box 500 GPO, 10670 Penang, MalaysiaTel : (+60-4) 626 1606Fax : (+60-4) 626 5530Email : [email protected]
This publication is also available from: www.worldfishcenter.org
ISBN 978-983-2346-66-1
2008 Th
e Wo
rldF
ish C
en
ter
Strate
gie
s an
d O
ptio
ns fo
r Inc
rea
sing
an
d S
usta
inin
g F
ishe
ries a
nd
Aq
ua
cu
lture P
rod
uc
tion
to B
en
efit P
oo
rer H
ou
seh
old
s in A
sia
STuDIES AND rEVIEWS | 1823

Strategies and Options for Increasing and Sustaining Fisheries and Aquaculture Production
to Benefit Poorer Households in Asia
The WorldFish Center2008
Madan M. DeyRoehlano M. Briones
Yolanda T. GarciaAyut Nissapa
U. Primo RodriguezRezaul Karim Talukder
Athulah SenaratneIshak Hj. Omar
Sonny KoeshendrajanaNguyen Tri Khiem
Tai Shzee YewMiao WeiminD.S. Jayakody
Praduman KumarRamachandra Bhatta
Muhammad Sirajul HaqueMuhammad A. Rab
Chen Oai LiLuping Li
Ferdinand J. Paraguas

This document should be cited as
Dey, M.M., R.M. Briones, Y.T. Garcia, A. Nissapa, U.P. Rodriguez, R.K. Talukder, A. Senaratne, I.H. Omar, S. Koeshendrajana, N.T. Khiem, T.S. Yew, M. Weimin, D.S. Jayakody, P. Kumar, R. Bhatta, M.S. Haque, M.A. Rab, O.L. Chen, L. Luping and F.J. Paraguas. 2008. Strategies and Options for Increasing and Sustaining Fisheries and Aquaculture Production to Benefit Poorer Households in Asia. WorldFish Center Studies and Reviews No. 1823. The WorldFish Center, Penang, Malaysia.
Cover photographs (L to R) by:Front: Dominyk Lever; Fem Com Bangladesh; Hong Meen CheeRear: Dominyk Lever
Printed by Sun Printers Sdn Bhd.
ISBN 978-983-2346-66-1
WorldFish Center Contribution No. 1823
© 2008 The WorldFish Center
Published by The WorldFish Center, P.O. Box 500 GPO, 10670 Penang, Malaysia
A PDF copy of this publication is available from: www.worldfishcenter.org
All rights reserved. This publication may be reproduced in whole or in part for educational or non-profit purposes without permission if due acknowledgement is given to the copyright holder. This publication may not be reproduced for profit or other commercial purposes without prior written permission from the WorldFish Center. To obtain permission contact the Business Development and Communications Division at [email protected].
iiiii

Appendices available on CD
Abbreviations and Acronyms
EXECUTIVE SUMMARY Part 1: INTRODUCTION AND BACKGROUND
Chapter 1 Introduction
Chapter 2 Overview of Fisheries and Aquaculture in Asia Part 2: RESULTS Chapter 3 Profile and Economics of Aquaculture and Fisheries Technologies
Chapter 4 Technical Efficiency of Aquaculture Systems in Asia
Chapter 5 Policies, Support Services, and Institutional Environment in Fisheries
Chapter 6 Profile of Fish Farmers, Fishers and Traders
Chapter 7 Analysis of Fish Demand, Supply and Trade Chapter 8 Projections for Fish Supply and Demand Chapter 9 The Potential Impacts of Various Technology and Policy Options
Chapter 10 Priority Technologies and National Strategies Chapter 11 Impacts of the Project References
Contents
vii
xi
1
6
15
42
56
78
100
127
159
170
197
206
iv
iiiii
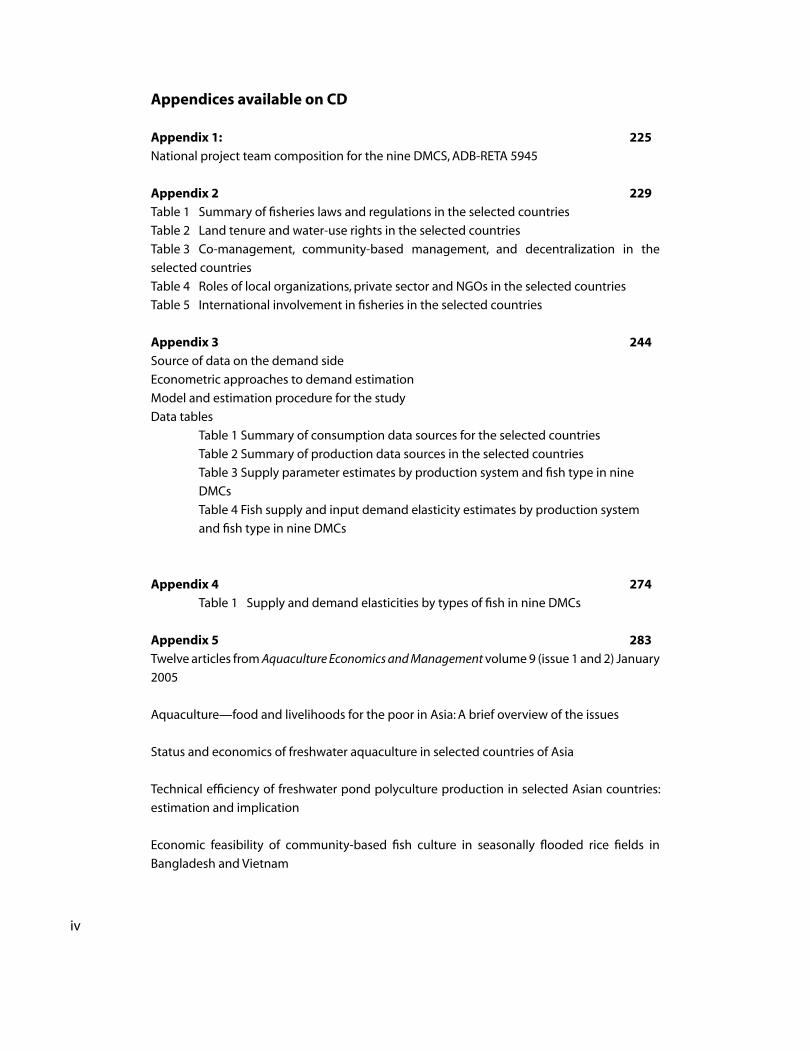
Appendices available on CD
Appendix 1: 225
National project team composition for the nine DMCS, ADB-RETA 5945
Appendix 2 229
Table 1 Summary of fisheries laws and regulations in the selected countries
Table 2 Land tenure and water-use rights in the selected countries
Table 3 Co-management, community-based management, and decentralization in the
selected countries
Table 4 Roles of local organizations, private sector and NGOs in the selected countries
Table 5 International involvement in fisheries in the selected countries
Appendix 3 244
Source of data on the demand side
Econometric approaches to demand estimation
Model and estimation procedure for the study
Data tables
Table 1 Summary of consumption data sources for the selected countries
Table 2 Summary of production data sources in the selected countries
Table 3 Supply parameter estimates by production system and fish type in nine
DMCs
Table 4 Fish supply and input demand elasticity estimates by production system
and fish type in nine DMCs
Appendix 4 274
Table 1 Supply and demand elasticities by types of fish in nine DMCs
Appendix 5 283
Twelve articles from Aquaculture Economics and Management volume 9 (issue 1 and 2) January
2005
Aquaculture—food and livelihoods for the poor in Asia: A brief overview of the issues
Status and economics of freshwater aquaculture in selected countries of Asia
Technical efficiency of freshwater pond polyculture production in selected Asian countries:
estimation and implication
Economic feasibility of community-based fish culture in seasonally flooded rice fields in
Bangladesh and Vietnam
viv

Fish consumption and food security: a disaggregated analysis by types of fish and classes of
consumers in selected Asian countries
Disaggregated analysis of fish supply, demand, and trade in Asia: baseline model and
estimation strategy
Demand for fish in the Philippines: a disaggregated analysis
The effects of export prices on the demand and supply for fish in the Philippines
China’s accession to the WTO and its implications for the fishery and aquaculture sector
Food safety standards and regulatory measures: implications for selected fish exporting Asian
countries
Inland aquaculture in India: past trend, present status and future prospects
The farming practices and economics of aquaculture in Thailand
viv
This publication and the project to which it relates were carried out in partnership with Department of Fisheries, Bangladesh Bangladesh Agricultural University University of Chittagong, Bangladesh Center for Chinese Agricultural Policy, China Freshwater Fisheries Research Center, China Indian Council of Agricultural Research, India Indian Agricultural Research Institute University of Agricultural Sciences, India Gujarat Agricultural University, India Ministry of Marine Affairs and Fisheries, Indonesia Institut Pertanian Bogor, Indonesia Diponegoro University, Indonesia Department of Fisheries, Malaysia Fisheries Development Authority of Malaysia Universiti Putra Malaysia Bureau of Fisheries and Aquatic Resources, Philippines University of the Philippines at Los Banos Department of Fisheries and Aquatic Resources, Sri Lanka National Aquatic Resources Research and Development Agency, Sri Lanka National Aquaculture Development Authority, Sri Lanka Department of Fisheries, Thailand Prince of Songkhla University, Thailand Institute of Fisheries Economics and Planning, Vietnam Vietnam Agricultural Science Institute, Vietnam Research Institute for Aquaculture No. 2, Vietnam An Giang University, Vietnam
—through generous funding support of the Asian Development Bank. The authors gratefully acknowledge the significant contribution of all the members of the project team listed in appendix 1. WorldFish also gratefully acknowledges the highly valued unrestricted funding support from the Consultative Group on International Agricultural Research (CGIAR) specifically the following members: Australia, Canada, Egypt, Germany, India, Japan, New Zealand, Norway, the Philippines, Sweden, the United Kingdom and the United States of America.
viivi
ACKNOWLEDGEMENTS
viivi
Abbreviations and Acronyms
(Note: This list follows the alphabetical order of the acronyms, not the full names to which they refer.)
ADB – Asian Development Bank, Manila, PhilippinesAFA – Area Fishers’ Association, MalaysiaAFMA – Agriculture and Fisheries Modernization Act (1997), PhilippinesAFTA – Association of Southeast Asian Nations (ASEAN) Free Trade Area (Agreement)AGE – Applied General EquilibriumAIDS – Almost Ideal Demand SystemAIT – Asian Institute of Technology, Prathumthani, ThailandBAR – Bureau of Agricultural Research, Department of Agriculture, PhilippinesBFAR – Bureau of Fisheries and Aquatic Resources, PhilippinesBFRI – Bangladesh Fisheries Research InstituteBOI – Board of Investment (in the Philippines, Sri Lanka and Thailand)CAFS – Chinese Academy of Fishery SciencesCARL – Comprehensive Agrarian Reform Law (1987), PhilippinesCBM – Community-based ManagementCCAP –Center for Chinese Agricultural Policy, People’s Republic of ChinaCD – Cobb-Douglas functional form of the Cobb-Douglas Production Function and Technical Efficiency ModelCFHC – Coastal Fisheries Household Census, Sri LankaCIDA – Canadian International Development AgencyCPIC – Consumer Price Index Survey, PhilippinesCPUE – Catch Per Unit of EffortCRZ – Coastal Resources Zone (1997), IndiaCTS – Consistent Two-step Estimation (model procedure)DA-BFAR – Department of Agriculture, Bureau of Fisheries and Aquatic Resources, PhilippinesDanida – Danish International Development AgencyDEA – Data Envelopment AnalysisDEGITA – Dissemination and Evaluation of Genetically Improved Tilapia, WorldFish CenterDFAR – Department of Fisheries and Aquatic Resources, Sri LankaDFID – Department for International Development, U.K.DMC – Developing Member CountryDOE – Department of the Environment, MalaysiaDOF – Department of Fisheries (Bangladesh, India, Malaysia and Thailand)DOFAR – Department of Fisheries and Aquatic Resources, Sri LankaEEZ – Exclusive Economic ZoneEU – European Union, Brussels, BelgiumFAO – Food and Agriculture Organization of the United Nations, Rome, ItalyFD – Food Expenditure Function
FFDA – Fish Farmers’ Development Agencies FFRC – Freshwater Fisheries Research Center, People’s Republic of ChinaFIES – Family Income and Expenditure SurveyFS – Fish Expenditure FunctionGAPPINDO – Federation of Indonesian Fisheries EntrepreneursGDP – Gross Domestic ProductGOI – (Used for) Government of India; Government of IndonesiaGSP – Generalized System of PreferencesHACCP – Hazard Analysis and Critical Control PointsHNSI – Association of Indonesian FishersHW – Heien and Wessells ModelIARI – Indian Agricultural Research Institute, IndiaICLARM – International Center for Living Aquatic Resources Management (in Manila, Philippines, prior to February 2000)IEEZ – Indonesia’s Exclusive Economic ZoneIKPI – Federation of Indonesian Fisheries CooperativesINFOFISH – Intergovernmental Organization for Marketing Information for Fisheries Products in Asia and the Pacific, Kuala Lumpur, MalaysiaIMR – Inverse Mills RatioISPIKANI – Association of Indonesian Fisheries ScholarsITSUR – Iterative Seemingly Unrelated Regression (method)IUU – Illegal, Unreported and Unregulated (fisheries)JICA – Japan International Cooperative Agency, TokyoKUB – Joint Aquaculture Groups, IndonesiaLA/AIDS – Linear Approximate Almost Ideal Demand SystemLES – Linear Expenditure SystemLGC – Local Government Code (1991), PhilippinesLKIM – Lembaga Kemajuan Ikan Malaysia (Fisheries Development Authority)MAF – Ministry of Marine Affairs and Fisheries, IndonesiaML – Maximum LikelihoodMLE – Maximum Likelihood EstimateMOA – Ministry of Agriculture, ChinaMOE – Ministry of Education, ThailandMOFAR – Ministry of Fisheries and Aquatic Resources, Sri LankaMOFI – Ministry of Fisheries, VietnamMOFL – Ministry of Fisheries and Livestock, BangladeshMOL – Ministry of Land, BangladeshMOMAF – Ministry of Marine Aquatic Fisheries, IndonesiaMONRE – Ministry of Natural Resources and the Environment (Thailand and Vietnam)MPI – Ministry of Planning and Investment, VietnamMPN – National Fisheries Society, IndonesiaNACA – Network of Aquaculture Centres in the Asia-Pacific Region, Bangkok, ThailandNARA – National Aquatic Resources Research Development Agency, Sri LankaNAP – National Action Plan
ixviii
ixviii
NAQDA – National Aquaculture Development Authority, Sri LankaNARA – National Aquatic Resources Research and Development Agency, Sri LankaNEKMAT – Fishers’ Association on the Federal Level, MalaysiaNESDB – National Economic and Social Development Board, ThailandNFRDI – National Fisheries Research and Development Institute, PhilippinesNGO – Non-governmental OrganizationNSO – National Statistics Office, PhilippinesNWP – North Western Provinces, Sri LankaODA – Overseas Development Assistance (cited under Japan and U.K.)OPM – Office of the Prime Minister, ThailandPF – Price Index for FoodPNF – Price Index for Non-food (commodities)PFC – Philippines Fisheries Code (1998)PRC – People’s Republic of ChinaPRRM – Philippine Rural Reconstruction Movement (NGO)QUAIDS – Quadratic Almost Ideal Demand SystemR & D – Research and DevelopmentRIA2 – Research Institute for Aquaculture No. 2, VietnamSAS – Statistical Analysis System (1984)SFA – State Fishers’ Association, MalaysiaSEAFDEC – Southeast Asian Fisheries Development Center, Bangkok, ThailandSPLAM – Malaysian Aquaculture Farm Certification SchemeSPS – Sanitary and Phyto-sanitary (concerning trade)SUR – Seemingly Unrelated Regression (technique)SYSNLIN – Non-linear System (procedure)TBT – Technical Barriers to TradeTE – Technical Efficiency (model)UAS – University of Agricultural Sciences, IndiaUNCLOS – United Nations Convention on the Law of the SeaUNDP – United Nations Development Programme, New YorkUPM – Universiti Putra MalaysiaUSAID – United States Agency for International Development, Washington, D.C.VAC – Small-scale, integrated farming system includes: (1) vegetable or fruit garden (vuon); fish/shrimp pond (ao); and (3) livestock pen (chuong)WB – World Bank, Washington, D.C.WTO – World Trade OrganizationWWF – World Wildlife Fund

xix
he last three decades have witnessed dramatic changes in the structure of supply and
demand for fish, including a growing demand for fish in both domestic and international
markets.Global demand has increased rapidly with rising populations and higher fish
consumption per capita. The rise in demand has been met by a rapid growth in production
and increased global trade in fish. Asia is the leading contributor to this expansion,
especially of low-value fish from capture fisheries and aquaculture that play a major role
in the livelihoods as well as animal protein intake of poor households.
Technological change is a key factor in this transformation. However, most of the
current innovations focus on relatively high-value species and resource-intensive
production technologies. As a result, the majority of poor fishers have failed to benefit
proportionately from the rising production and trade, as they have limited access to
capital, new technologies, and land and water resources. Past research has so far neglected
the assessment and prioritization of key species and technologies that are best suited to
poor fishers and small-scale fish farmers in the Developing Member Countries (DMCs)
of the Asian Development Bank (ADB). Moreover, the poor fishers and small-scale fish
farmers face threats from resource degradation, weak public support and investment,
and worsening conflicts and inequities in access to resources, infrastructure and markets.
More focused, specific and comprehensive analyses are essential to identify constraints
and opportunities as well as to develop strategies to help poor people to benefit from
fisheries and aquaculture.
In view of this research gap, the WorldFish Center undertook a three-year project
called “Strategies and Options for Increasing and Sustaining Fisheries and Aquaculture
Production to Benefit Poorer Households in Asia’’. The project covered nine DMCs, namely
Bangladesh, China, India, Indonesia, Malaysia, the Philippines, Sri Lanka, Thailand, and
Vietnam. These DMCs are active players in the transformation of global fish demand and
supply. The project, funded by the ADB (RETA 5945) was implemented upon request
from these countries from March 2001 to March 2004 (with a no cost extension up to
February 2005). It was jointly conducted by the WorldFish Center and national research
teams composed of fisheries specialists, economists, extension workers, and experts from
other relevant disciplines.
The project is divided into five components: 1) profile of key aquaculture technologies
and fishing practices; 2) analysis of policies, institutions and support services; 3)
socioeconomic profile of major stakeholders in the fisheries sector; 4) projections of fish
demand and supply in the nine Asian countries; and 5) formulation of national action
plans based on the findings and recommendations of the study.
EXECUTIVE SUMMARY
T
xix
This report, a synthesis of the findings and recommendations of the project, is arranged
in 11 chapters. Chapter 1 gives the background, objectives and scope of the study. Chapter
2 provides an overview of the economic performance of the fisheries sector in Asia, where
growth has been rapid in production, consumption, and trade of fish products. The fastest
growing component is aquaculture, whereas capture fisheries has remained generally
stagnant, consistent with experience worldwide. Aquaculture constitutes a huge part of
fish production and is the largest fisheries component for China (by far the world’s biggest
fish producer) as well as in Bangladesh. In the nine DMCs, technological change has been
a major driver of growth. This, to a great extent, has been facilitated by innovative research
and development activities, spearheaded by the public sector. In recent years, however,
public investment has failed to respond to the needs of the growth and sustainability
of the fish sector, as well as to the food and income security of the poor people. There
should be room for further investments that can be integrated to address the fundamental
problems of poverty and food insecurity in these countries.
The technology profile (Chapters 3 and 4) reflects the diversity of technologies and
production practices in both aquaculture and capture fisheries. Economic analysis
of these technologies shows that returns per unit of land are highest in aquaculture
involving intensive systems and high value species, such as shrimp. On the capture side,
the highest returns per vessel are results of fishing with mechanized crafts using larger and
more sophisticated gear. However, taking into consideration the amount of investment
(including working capital), the review finds that rates of return between intensive and
non-intensive systems in aquaculture (focused on low value species) are comparable;
likewise, some small-scale gears and non-motorized vessels compare favorably with large-
scale gears and vessels. Production by small-scale fish farmers and fishers (who are much
more likely to be poor), therefore need not be stereotyped as low return activities.
On the aquaculture side, a high degree of inefficiency in production appears to persist,
particularly for less intensive systems. The inefficiency is associated with the low level of
skills and human capital of many small-scale fish farmers. This suggests a large potential
for increasing production, not only by expanding the area for aquaculture and introducing
new technologies but also by disseminating existing technologies through a more effective
extension and training system.
The post-harvest and processing sub-sector is still largely characterized by traditional
methods, which is highly suited to the requirements of local consumption, as well as the
capabilities of poor households that engage in these activities. However, the traditional
system is unable to comply with stringent food quality and safety standards over the
length of the dispersed supply chain; hence, it remains a major impediment to the greater
participation of the poor in the benefits of global trade.
xiiixii
The comprehensive review of policies and institutions (Chapter 5) reveals a healthy
recognition of the growth potential and export performance of fisheries, even when (as
in many countries) sectoral policies remain embedded in overall national development
plans for the economy and agriculture. Nevertheless, considerable policy gaps remain.
Commercialized activities, concentrated among high value species (especially in marine
and brackishwater systems), continue to receive high priority. Trade policies in some of the
DMCs are highly protectionist, owing to fears of facing global competition. Prioritization
of high value species for world markets leads to a strong emphasis on compliance
with international food safety standards, but policies on increasing the participation
of the poor in export growth are often quite vague. In particular, there are deficiencies
in providing infrastructure and support services (particularly in ancillary services over
the supply chain). The usual problems of a large, cumbersome bureaucracy, as well as
inconsistent and often contradictory decision-making and regulations, continue to hamper
fisheries development. In the area of aquatic resource management, disenchantment
with the enforcement performance under the command-and-control set-up has led to
the promotion of decentralized, community-based arrangements, although these have
faced their own implementation problems. In some countries with a more effective set of
institutions, centralized mechanisms continue to be favored (e.g., in China).
The socioeconomic profile (Chapter 6) indicates that the poorest households tend to
be engaged in inland fishing. Noteworthy is the wide variation in household incomes
between marine fishers and freshwater fish farmers. The lower end of the income scale
represents large numbers of people who are among the poorest of the poor. In general,
the data confirm the pervasiveness of poverty among small-scale fishers and fish farmers
in Asia.
Analysis of supply and demand trends (Chapter 7) confirms the high dependence of the
poor on fish. In the Philippines, India, and Vietnam, there is an unmistakable rise in the
percentage of fish in the animal protein intake as the household income drops; the pattern
is less evident but still exists in Bangladesh. The measurement of demand response reflects
a high variety of price elasticities for the various fish types, implying that fish should not
be viewed as a single commodity; it needs to be disaggregated into individual species
groups. Price and income elasticities vary across income groups. It is likely, therefore, that
when per capita income increases, the demand for fish in Asia will increase substantially,
but the species combination will change. On the supply side, own-price parameters
for aquaculture tend to be significant, implying that price response is important when
production is conducted under relatively controlled conditions in culture systems. For
capture systems, however, price parameters tend to be rather insignificant, suggesting the
relative importance of non-price factors (such as the state of the resource base, weather
conditions, etc.) in determining the supply. Finally, trends in global trade suggest that
demand in foreign markets have driven much of the production growth in high-value
xiiixii
species, with most of the nine DMCs becoming heavily specialized in the production of
shrimp; whereas rising domestic demand has been met partly by imports of lower-value
species from abroad.
Projections in supply and demand (Chapter 8) are based on the AsiaFish model, a
disaggregated, multi-product equilibrium model of the fish sector in each of the nine
DMCs. The projections from 2005 to 2020 suggest that production of fish in the DMCs
will continue to increase, but at a slower rate than in the past. Gains may range from
as low as just 0.2 percent annually in the Philippines to 3.5 percent in Sri Lanka. The
gains will continue to be dominated by aquaculture, with China, Malaysia and Thailand
likely to experience the largest increases in output. Per capita consumption in some of
the high-consumption countries (Bangladesh, Indonesia, and the Philippines) will
probably decline, as demand growth outpaces the growth of supply and imports. With
a few exceptions, fish imports and exports are likely to increase. China is expected to
be the dominant exporter among the nine countries in 2020, accounting for about 52
percent of the total exports, while Southeast Asia’s share will probably decline. Projections
by individual fish types are also available from the AsiaFish model. In general, species
groups that dominate production quantities, such as carps (China, India), will continue
to be among the leaders in the foreseeable future. Growth will also be rapid in high-
value brackishwater species, especially shrimp. The impact analysis based on the AsiaFish
model (Chapter 9) implies that market access restrictions in the fish trade, such as the
imposition of food safety standards, may noticeably affect exports. Improvements in
capture categories are not expected to make any significant impact on production and
consumption, unlike technological changes in aquaculture.
The foregoing projections and impact assessment is broadly consistent with the list of
priority technologies and action plans for the fish sector (Chapter 10). In drawing up
the list of technologies, certain criteria were applied, namely: efficiency, food security,
environmental sustainability, employment generation, and acceptability to the poor. The
priority technologies are: aquaculture of common freshwater species (polyculture of carp
in ponds, integrated agriculture and aquaculture, and monoculture of tilapia in cages);
small-scale fisheries (especially those using specific gears, such as hook-and-line or gill-
net); and seed production of tilapia (a major species). Also high on the list of priorities
is shrimp polyculture (both grow-out and seed production), largely due to its economic
importance. Finally, upgrading traditional methods of preservation and processing (e.g.,
icing, fish drying and salting) remains an important technological priority to prevent
wastage.
Pro-poor strategies for the fisheries sector are encapsulated in the national action plans,
which display broad areas of regional agreement. The nine DMCs recognize that capture
fisheries have reached or are approaching production limits, except perhaps for offshore
xvxiv
fisheries. For this reason, coastal capture is targeted for capacity and employment
reduction, in conjunction with better resource management. Capacity reduction entails a
strategy for minimizing economic dislocation, involving employment generation, credit
schemes, training programs, and other support for exiting fishers who are embarking on
alternative livelihoods.
Significant expansion in fisheries production to meet growing demand and to offer
livelihood opportunities can only be sought in aquaculture by means of a combination of
productivity improvement and area expansion. The former is pursued by a combination
of R & D investment, extension service, and technical support to close inefficiency gaps
that are more prominent in the small-scale, non-intensive sector. While aquaculture of
freshwater, low-value species is characterized as pro-poor activity, brackishwater and
marine aquaculture remains an important sub-sector, even though the need to incorporate
the poor in the economic returns of these activities is recognized.
Sustainability of the remaining natural fish stocks requires prudent management of the
marine resources. Here the options vary, from decentralization and co-management
to centralized administration under command-and-control schemes. The bottom line
is improved formulation and enforcement of fishing rules that may require different
institutional arrangements across countries. Inland fisheries represents an important sub-
sector owing to its significant contribution to food security and livelihoods of the rural
poor. Establishing community organizations for managing common areas and investing
in appropriate stock enhancement and enrichment systems are promising means of
delivering benefits to the poor, particularly for countries with sizable inland fisheries,
large reservoir areas and extensive seasonally flooded lands.
All the countries recognize that fish production exists within a wider economic context,
namely, a supply and value chain beginning with the input supply, down to post-harvest
services, processing, and marketing. Constraints to growth lie at upstream and downstream
portions of this chain. On the post-harvest and processing side, wastage and poor quality
of finished products needs to be addressed by investments in landing and post-harvest
facilities, training of fishers and processors, and buildup of processing enterprises, towards
better quality standards, particularly to meet global food safety standards.
All the countries highlight the need for overall improvement in policy processes and
implementation of development programs, in terms of coordination, policy consistency,
and quality of human resources (especially in extension and research). Finally, the
national action plans call for greater regional collaboration, particularly in the area of trade
negotiation, to counter the arbitrary imposition of non-tariff barriers and protectionist
measures in developed countries, as well as to harmonize procedures and standards in
conducting South-South and North-South trade.
xvxiv
An evaluation of the project’s impacts (Chapter 11) highlights the project’s contributions
to policy research in fisheries in the participating DMCs. National and regional
consultations, as well as various efforts at disseminating research findings, have raised
awareness of fisheries in the development community. However, the impact of the research
will ultimately require integration of the national action plans and analytical methods in
regular development planning, investment programming, and policy implementation.
Such integration is expected to receive strong support from the national research partners,
the international network of fisheries experts and organizations, and donors, particularly
the Asian Development Bank.
The project has also generated a storehouse of information useful for policymakers and
researchers, systematically documented in terms of profiles for production, consumption,
trade and the policy environment. The project has addressed the information and
research gaps in terms of socio-economic analysis, by providing quality socioeconomic
research and databases for supporting the fisheries research in the participating countries.
A total of 19 scientific papers and 4 books have emanated from this project. A special
issue of Aquaculture Economics and Management (a top peer-reviewed international
journal) based on the findings of this project has been prepared. Finally, there has been
a considerable build-up of research capacity among the participating countries through
the project. This includes the capacity to undertake systematic, quantitative approaches to
sectoral planning at the national level, using the appropriate tools, such as priority setting
and the AsiaFish model, to aid in the process. No doubt, the lasting impact of the project
will lie in injecting greater rigor, at the national and regional levels, to goal-setting and
strategic planning activities for the fisheries sector.
xvi
1CHAPTER 1 | Introduction
1 Throughout this volume, the term “fisheries” generally refers to both capture and culture systems. Also, fish is defined in broad sense to include finfish.
Background
Over the last three decades, dramatic changes have been observed in the supply of and demand for fish1. Global fish consumption per capita nearly doubled from about 8 kg in the early 1950s to about 16 kg in 1999, even as global population more than doubled. This rise in demand has required rapid growth in production, much of which is contributed by developing countries. Fish exports from these countries now surpass in value their traditional food exports, such as sugar, beverages, and meat. Developing member countries (DMCs), such as the People’s Republic of China (PRC), India, Indonesia, and Thailand, are now world leaders in fisheries exports. Fisheries in the developing world continue to exhibit steady growth in production, consumption, and trade although the sustainability of this trend is now open to question given the rapid degradation of the aquatic resource base of capture fisheries.
Contributing to the changing structure of supply and demand are technological advances in both capture and culture fisheries, changes in legal and institutional regimes, and increased consumer awareness of the potential of fish as an alternative source of animal protein. Technological progress in fish genetics, breeding, nursery and grow-out operations for aquaculture, as well as gear and fishing methods for capture fisheries, highlights the potential for further production growth. However, most of the current innovations in fisheries focus on relatively high-value species, resource-intensive production technologies,
and expensive operations. Because the majority of poor fishers have very limited access to capital, new technologies, and land and water resources, they do not benefit proportionately from recent improvements in technology and market expansion. As fish production becomes increasingly market-driven, linkages between production and consumer demand will tighten, and agribusiness corporations using commercial marketing methods will increasingly control the supply chain. Strategies and options must be found to enable poor producers to find a defensible niche while participating and competing in the network of fisheries and aquaculture production, marketing, and trade. However, the net effects of continued growth and evolution of the fish and aquatic products sector on the DMCs are unknown, particularly for the poor segments of the population that derive a substantial amount of their food and income through participation in small-scale production, consumption, and sale of fish. Past research has so far neglected the assessment and prioritization of key species and technologies that are best suited to poor fishers and small-scale fish farmers in these countries.
In most DMCs, existing information and data collection on fisheries production and consumption are fragmented and often inadequate for a comprehensive analysis of the fisheries sector. For instance, statistics on catch and supply from the Food and Agriculture Organization (FAO) and the Intergovernmental Organization for Marketing Information for
Chapter 1
INTRODUCTION
Fisheries Products in Asia and the Pacific Region concentrate almost exclusively on commercially important fish and fish products. Likewise, past research in the field often focused on technology development in relation to resource assessment and biological productivity in fisheries and aquaculture. Often neglected are data on subsistence production, consumption, and local sale, which remain undocumented. Information on the supply and management of land, water resources, feed, and other inputs, both in the market and subsistence sector, is critical in assessing the long-term prospects of aquaculture and fishery production. More focused, specific, and comprehensive analyses of production, farming systems, fish technologies, and markets are required for evaluating options and designing strategies to favor resource-poor fishers and fish farmers. There is an urgent need for research and policy support to target these disadvantaged people.
In view of these research gaps, the WorldFish Center undertook a three-year project entitled “Strategies and Options for Increasing and Sustaining Fisheries and Aquaculture Production to Benefit Poorer Households in Asia’’, with funding from the Asian Development Bank (ADB-RETA 5945). The project aimed at enabling DMCs to improve fisheries policies affecting resource allocation and choices about technology, as well as to set targets for investments and development to address poverty and increase fish production in the long run.
The research was conducted jointly by WorldFish and national research teams composed of fisheries specialists, economists, extension workers, and experts from other relevant disciplines. The implementation period was from March 2001 to March 2004 and the Project continued running until 28 February 2005 with
no cost extension. Nine DMCs participated in the project, namely, Bangladesh, China, India, Indonesia, Malaysia, the Philippines, Sri Lanka, Thailand, and Vietnam (see Appendix 1)2. The nine countries (henceforth referred to as the selected countries) produce more than a third of global fish catch and supply over 84 percent of world aquaculture demand. Fish production in the selected countries represents more than 80 percent of all fish production in Asia.
Objectives and Scope of the Study
The general objectives of the project were to assist the DMCs in: (a) developing appropriate strategies for helping poor (often landless) fishers to escape poverty; and (b) identifying appropriate fish species and technologies for aquaculture, and fisheries management. These policies are directed towards increased fish production, higher income and better nutrition of poor fishers and fish farmers, and protection of fisheries resources. The specific objectives are to:
(i) formulate strategies and an action plan for increasing fish production, improving nutrition and income, and protecting fisheries resources so as to benefit poor fish producers and low-income consumers;
(ii) determine the most viable and sustainable aquaculture and fisheries practices (including prioritization of fish species, farming systems, fishing technologies, and management practices) that are of critical importance to poor fish farmers and fishers as well as low-income consumers;
(iii) analyze and forecast production and consumption of fish by species and income groups to evaluate the market potential for alternative fish products of poor farmers and fishers, and to identify fisheries management
2 Strategies and Options for Increasing and Sustaining Fisheries and Aquaculture Production to Benefit Poorer Households in Asia
2 All appendices provided on CD only.
3CHAPTER 1 | Introduction
options for increased participation by small-scale fishers; and
(iv) strengthen the capacity of the participating DMC institutions in fisheries policy research to monitor the impacts of changes in policy, technologies, and markets on poor households.
The following activities were simultaneously carried out in the nine participating countries to achieve the project’s objectives:
(i) comprehensive cataloguing of current aquaculture and fisheries technologies through national surveys of fish production, consumption, and marketing;
(ii) developing archetypal profiles of aquaculture and fisheries technologies (prioritization of fish species, farming systems, fishing methods, and fisheries resource management schemes); and describing socioeconomic conditions of stakeholders (fish producers, consumers, and traders) and support service systems (extension, credit, processing, and marketing);
(iii) analyzing factors determining supply, demand, trade, and consumption of fish and aquatic products of various consumer groups, reflecting disaggregations such as income, commodity type, locale (rural versus urban), resource limitations, and regional distinctions;
(iv) preparing a 15-year projection of supply and demand for fish in the participating DMCs, broken down by category of stakeholder; and simulation to evaluate production, income, and equity effects of alternative policy and technological options;
(v) ranking and evaluating strategies and action plans for adoption of appropriate fish species, and developing aquaculture systems,
fishing technologies, and participatory fisheries management measures for the poorest categories of producers, in order to increase and sustain fish production and resource management;
(vi) developing a replicable framework and consistent methodology for assessing appropriate technologies, socioeconomic analysis, and strategy formulation for the use of all DMCs;
(vii) conducting training activities and workshops to strengthen the capacity of national planners, scientists, and extension workers in fisheries policymaking, fisheries economic research, and technology development and transfer to benefit poor fish producers and low-income consumers; and
(viii) developing a comprehensive database on biophysical, socioeconomic, and market information for policy analysis and assessment of impact of changes within and outside the fisheries sector so that the database provides reliable estimates of the potential targets for pro-poor growth, with clear disaggregation at various producer and consumer levels.
The scope of research, training and workshops under the project spanned five related components, namely:
Component 1. Profile of Key Aquaculture Technologies and Fishing Practices Aquaculture and fishing practices, including operation, areas, production levels, cost and return, and adoption pattern, were profiled. Major fish species were identified for both inland and marine waters. On the capture side, the structure of fisheries, gear types used, and stock indicators were covered. A description of post-harvest handling and processing was also incorporated for key fish species.
Component 2. Analysis of Policies, Institutions and Support Services
Current policies on fisheries and aquaculture, feed production, as well as related sectoral and macroeconomic policies were evaluated. Institutional arrangements, such as the implementation of co-management regimes, formal and informal regulations for fisheries, role of local organizations, etc. were discussed. Support services and infrastructure were assessed by examining credit/delivery, marketing of input/output, extension, research and training, and the role of the private sector. Component 3. Socioeconomic Profile of Major Stakeholders in Fisheries
Survey data containing information on consumption, production, and trade of key fish species in the partner countries were analyzed to characterize the various stakeholders in the fishery sector, namely, the consumers, producers, and traders.
Component 4. Analysis of Fish Supply and Demand and Projections
Fish supply and demand were projected over a 15-year period by using the AsiaFish model, a disaggregated model of the fish sector in the nine countries. National statistics were used to assemble a consistent fish balance sheet for the available fish types and sources (i.e., major fish species groups and production categories). Detailed elasticities of demand and supply were estimated using primary and secondary data. Alternative scenarios for the fish sector were explored, such as varying rates of technological change, reduction of fishing effort, varying growth rates of income, and so on. The projections of trends and prospects for
the fisheries sector in Asia would enable DMCs and development agencies (including the ADB) to formulate country strategies and options for fisheries development.
Component 5. National Action Plans
In the final year of the project, the selected countries conducted multisectoral consultations with various stakeholders in the fishery sector, including governmental and nongovernmental organizations. The consultations aimed to draw up a national plan of action for each country and recommend an appropriate management policy on fishing and fish farming practices that are socially equitable, technically feasible, economically viable, and environmentally sustainable.
About This Report
This report synthesizes the findings and recommendations of the study. The remaining chapters are organized as follows: An overview of Asian fisheries, covering both capture and culture systems, is provided in Chapter 2. Component 1 is covered in Chapters 3 and 4, which respectively present the technology profile and analyze the technical efficiency of fish farming. Component 2 is dealt with in Chapter 5, which analyzes the policies, institutional environment, and support services for fisheries. Component 3, on the socioeconomic profile of fishers, fish farmers, and traders, is covered in Chapter 6. Component 4 spans Chapters 7 to 9, which analyze the behavior of fish supply and demand, present the baseline projections and alternative scenarios, and evaluate the impacts of various technology and policy options. Chapter 10 summarizes all the components and discusses the options and suitable strategies
4 Strategies and Options for Increasing and Sustaining Fisheries and Aquaculture Production to Benefit Poorer Households in Asia
5CHAPTER 1 | Introduction
to increase and sustain fisheries production to benefit poor households in Asia. Finally, Chapter 11 discusses the project impact.
This study is the first comprehensive analysis of fisheries from the perspective of the poor, in terms of the policy and institutional
environment, production and consumption patterns, earnings structure, and future trends. As such, it is hoped that this publication will serve as an invaluable reference for DMC policymakers, donor agencies, researchers in fisheries, and students of development.
6 Strategies and Options for Increasing and Sustaining Fisheries and Aquaculture Production to Benefit Poorer Households in Asia
The Global Context
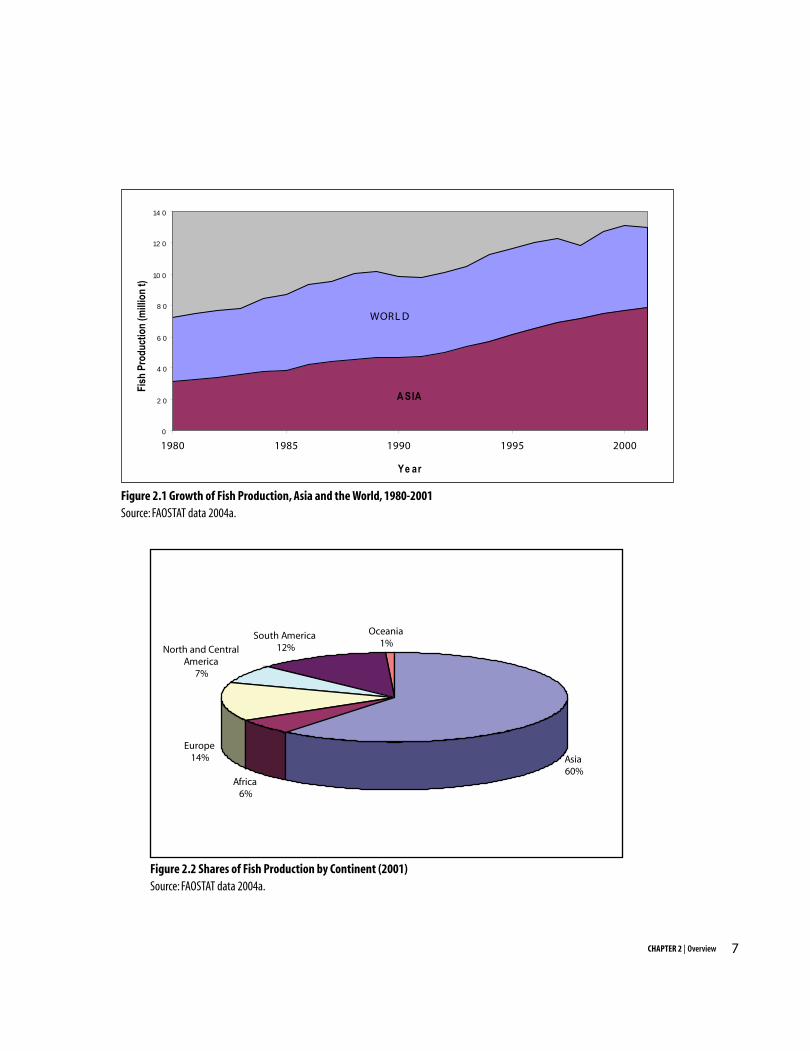
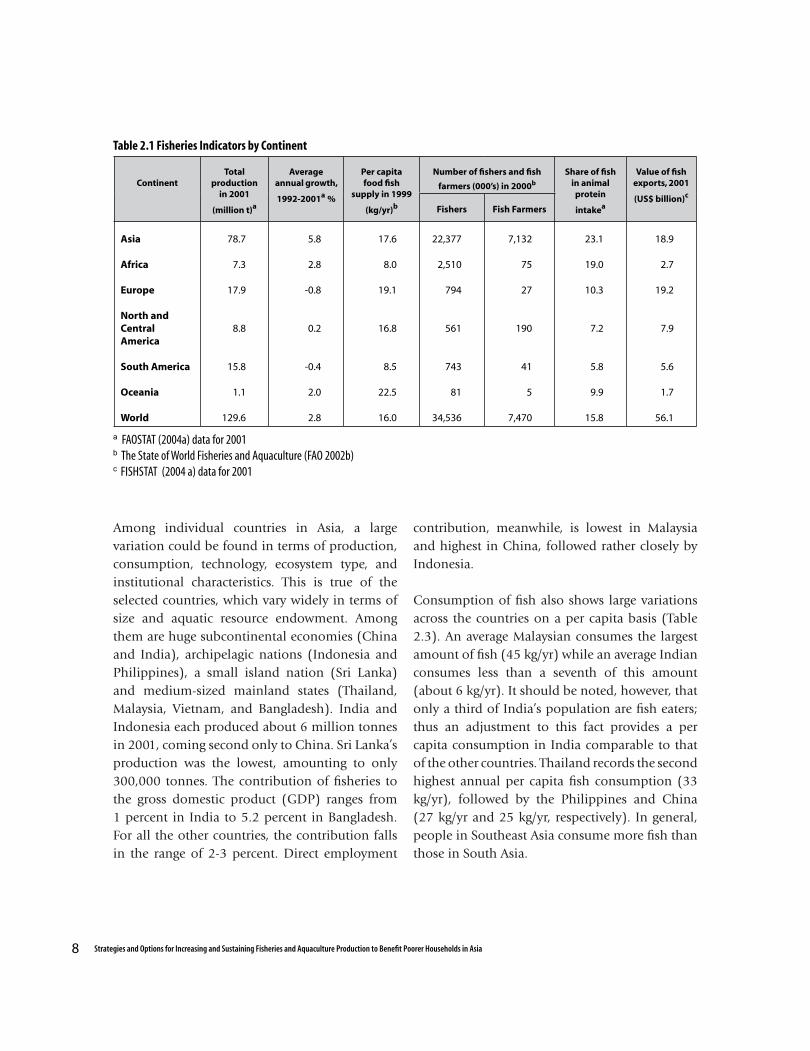
Fisheries represent one sector in which Asia has shown robust performance compared to the rest of the world (Table 2.1). From 1980 to 2001, Asia’s fisheries production had grown at an annual average of 5.8 percent, about twice the global average of 2.8 percent (Figure 2.1). In 2001, about 60 percent of the total global fish production came from Asia (Figure 2.2). The main source of growth in this sector has been aquaculture; from the 1990s onward, aquaculture grew by an annual rate of about 11 percent, surpassing that of all other agricultural commodities in the region.
The fisheries sector is also a significant employer in rural areas, providing livelihood for 34.5 million people in Asia (Table 2.1). Nearly 22 percent of these people are in aquaculture while the rest are in capture fisheries. The employment contribution can be multiplied further by incorporating indirect jobs created by fish trading and processing. Meanwhile, per capita fish consumption in Asia has also been on an upward trend, currently reaching levels comparable to that of the developed world (Delgado et al. 2003).
Exports of fish products from the region have also grown rapidly, in pace with production growth. The total value of fisheries export from Asia has climbed to about $19 billion, representing 34 percent of the global total, rivaling that of Europe (Table 2.1). Asia is now the major source of transcontinental fish exports to North and Central
America (32%) and Oceania (49%), far exceeding its rivals’ shares. Furthermore, Asia has competed with Africa as one of the leading fish exporters to Europe with a share of 11 percent. Meanwhile, trade within Asia itself accounts for 51 percent of the total imports of all Asian countries (FAO 2002b).
Contribution of Fisheries within Asia
These aggregate indicators, however, mask large variations in the performance of fisheries within different parts of Asia. Table 2.2 subdivides Asia into China, the rest of East Asia plus Southeast Asia, South Asia, West Asia, and Central Asia. China emerges as the single largest producer of fish worldwide, accounting for 34 percent of world production and 56 percent of Asia’s output. China’s fisheries have recorded an unparalleled annual growth of 14.3 percent during the last decade. The rest of East Asia plus Southeast Asia comes second in terms of per capita and total fish production. However, its output remained almost stagnant during the period 1992-2001, compared to the high growth performance of China, South Asia and West Asia. Within the same period, South Asia and West Asia exhibited healthy production growth; however per capita production remains low due to high population growth. In comparison, West Asia and Central Asia (mainly republics of the former Soviet Union) are minor contributors to Asia’s production: For Central Asia, growth has been sluggish to negative while per capita production remains insignificant.
Chapter 2
OVERVIEW OF FISHERIES AND AQUACULTURE IN ASIA
7CHAPTER 2 | Overview
WORLD
A SIA
0
2 0
4 0
6 0
8 0
10 0
12 0
14 0
1980 1985 1990 1995 2000
Ye ar
Fish
Pro
duct
ion
(milli
on t)
Figure 2.1 Growth of Fish Production, Asia and the World, 1980-2001Source: FAOSTAT data 2004a.
Asia 60%
Africa6%
Europe14%
North and Central America
7%
South America12%
Oceania1%
Figure 2.2 Shares of Fish Production by Continent (2001)Source: FAOSTAT data 2004a.
8 Strategies and Options for Increasing and Sustaining Fisheries and Aquaculture Production to Benefit Poorer Households in Asia
ContinentTotal
production in 2001
(million t)a
Average annual growth,
1992-2001a %
Per capitafood fish
supply in 1999
(kg/yr)b
Number of fishers and fish
farmers (000’s) in 2000b
Share of fish in animal
protein
intakea
Value of fish exports, 2001
(US$ billion)c
Fishers Fish Farmers
Asia
Africa
Europe
North and Central America
South America
Oceania
World
78.7
7.3
17.9
8.8
15.8
1.1
129.6
5.8
2.8
-0.8
0.2
-0.4
2.0
2.8
17.6
8.0
19.1
16.8
8.5
22.5
16.0
22,377
2,510
794
561
743
81
34,536
7,132
75
27
190
41
5
7,470
23.1
19.0
10.3
7.2
5.8
9.9
15.8
18.9
2.7
19.2
7.9
5.6
1.7
56.1
Table 2.1 Fisheries Indicators by Continent
a FAOSTAT (2004a) data for 2001 b The State of World Fisheries and Aquaculture (FAO 2002b)c FISHSTAT (2004 a) data for 2001
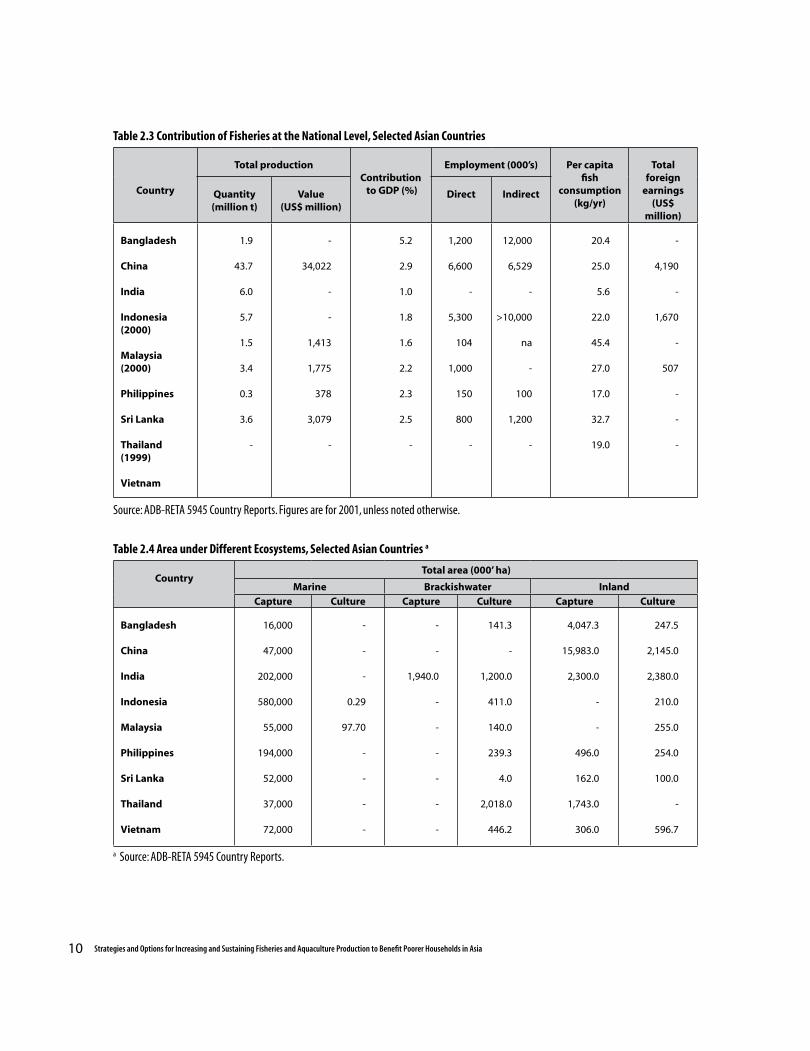
Among individual countries in Asia, a large variation could be found in terms of production, consumption, technology, ecosystem type, and institutional characteristics. This is true of the selected countries, which vary widely in terms of size and aquatic resource endowment. Among them are huge subcontinental economies (China and India), archipelagic nations (Indonesia and Philippines), a small island nation (Sri Lanka) and medium-sized mainland states (Thailand, Malaysia, Vietnam, and Bangladesh). India and Indonesia each produced about 6 million tonnes in 2001, coming second only to China. Sri Lanka’s production was the lowest, amounting to only 300,000 tonnes. The contribution of fisheries to the gross domestic product (GDP) ranges from 1 percent in India to 5.2 percent in Bangladesh. For all the other countries, the contribution falls in the range of 2-3 percent. Direct employment
contribution, meanwhile, is lowest in Malaysia and highest in China, followed rather closely by Indonesia.
Consumption of fish also shows large variations across the countries on a per capita basis (Table 2.3). An average Malaysian consumes the largest amount of fish (45 kg/yr) while an average Indian consumes less than a seventh of this amount (about 6 kg/yr). It should be noted, however, that only a third of India’s population are fish eaters; thus an adjustment to this fact provides a per capita consumption in India comparable to that of the other countries. Thailand records the second highest annual per capita fish consumption (33 kg/yr), followed by the Philippines and China (27 kg/yr and 25 kg/yr, respectively). In general, people in Southeast Asia consume more fish than those in South Asia.

9CHAPTER 2 | Overview
Regional BlockFish production
(million t)Average annual growth,
1992- 2001 (%)Per capita production
(kg/yr)
ChinaRest of East-Southeast AsiaSouth Asia West AsiaCentral Asia
44.124.3
8.71.60.1
14.30 0.044.433.23
-6.74
34.532.9
6.56.60.7
Role and Contribution of the Different Aquatic Ecosystems
A broad grouping of these ecosystems is presented in Table 2.4 with estimated areas under each category by country. (Note however that data usually pertain to potential rather than actual area.) Archipelagic countries, such as Indonesia and the Philippines, naturally have larger exclusive economic zones (EEZ), surpassing even that of subcontinental countries such as China and India. Indonesia, having the largest EEZ, has the biggest potential for marine fisheries among the Asian countries. In many countries, the potential for brackishwater capture-fisheries has not been properly assessed1, but brackishwater ecosystems are mostly recognized for their potential for commercial aquaculture. Only few countries have started to utilize this potential for mariculture. Lastly, a number of countries have identified vast areas for inland capture fisheries.
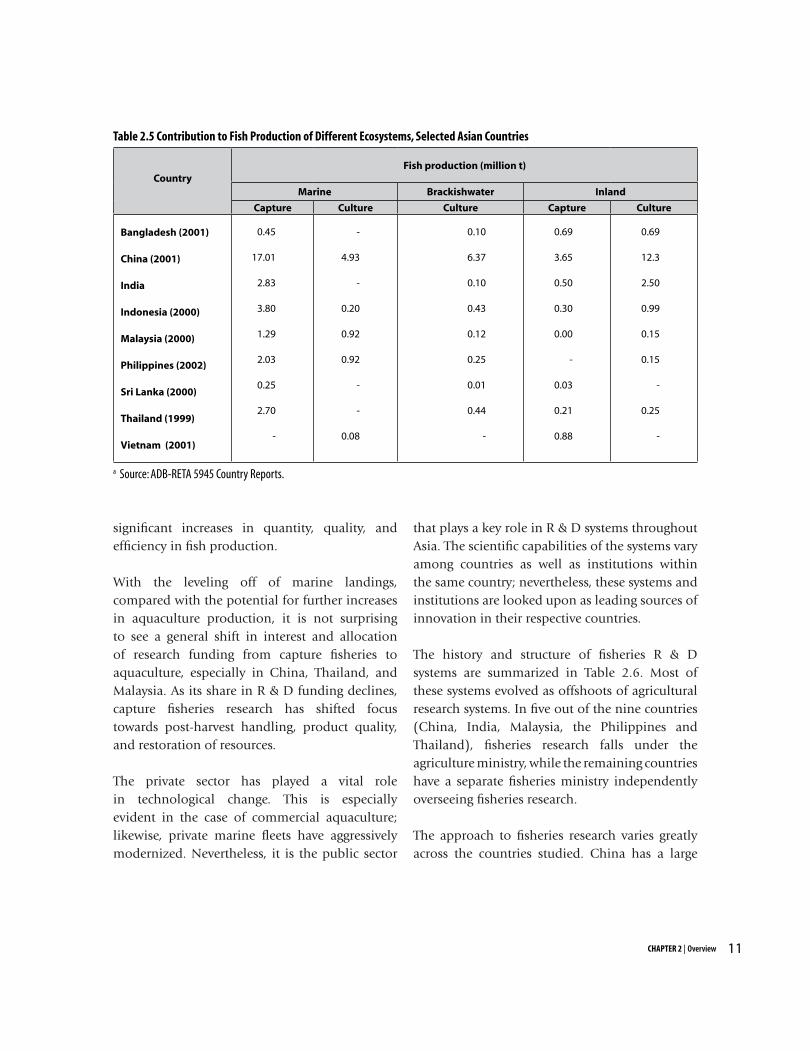
The contribution made by different aquatic systems under culture and capture fisheries production is presented in Table 2.5. Marine capture fisheries remains the major contributor
to the total fish output, with the greatest volume coming from the archipelagos while inland capture fisheries is only a minor contributor to the overall production. Brackishwater aquaculture has rapidly grown, encouraged by favorable prices of cultured fish products in both local and international markets. Currently, aquaculture is the source of growth in fisheries as marine capture has lately reached production limits (FAO 2002a). In the Philippines, Thailand, and Malaysia, marine aquatic resources are widely utilized for mariculture whereas inland culture is a major contributor to overall fisheries production in South Asian nations, except for Sri Lanka.
Overview of Fisheries Research and Development in Asia
Technological change originating from research and development (R & D) has been a major factor behind the rapid growth in the region’s fisheries. Breakthroughs in aquaculture technologies (e.g., new culture species and systems, artificial breeding), capture fisheries technologies (gear types, vessel designs), and post-harvest technologies (onboard refrigeration, canning) have contributed to
Table 2.2 Performance of Fisheries by Asian Sub-regions
Source: Calculated from FAOSTAT data 2004a and US Census Bureau, International Data Base 2004b. The State of World Fisheries and Aquaculture (FAO 2002b).
1 Many countries have recorded the output from brackishwater capture fisheries under marine (coastal) capture production.
10 Strategies and Options for Increasing and Sustaining Fisheries and Aquaculture Production to Benefit Poorer Households in Asia
Table 2.3 Contribution of Fisheries at the National Level, Selected Asian Countries
CountryTotal area (000’ ha)
Marine Brackishwater InlandCapture Culture Capture Culture Capture Culture
Bangladesh
China
India
Indonesia
Malaysia
Philippines
Sri Lanka
Thailand
Vietnam
16,000
47,000
202,000
580,000
55,000
194,000
52,000
37,000
72,000
-
-
-
0.29
97.70
-
-
-
-
-
-
1,940.0
-
-
-
-
-
-
141.3
-
1,200.0
411.0
140.0
239.3
4.0
2,018.0
446.2
4,047.3
15,983.0
2,300.0
-
-
496.0
162.0
1,743.0
306.0
247.5
2,145.0
2,380.0
210.0
255.0
254.0
100.0
-
596.7
Table 2.4 Area under Different Ecosystems, Selected Asian Countries a
a Source: ADB-RETA 5945 Country Reports.
Country
Total productionContribution to GDP (%)
Employment (000’s) Per capita fish
consumption (kg/yr)
Total foreign
earnings (US$
million)
Quantity (million t)
Value (US$ million)
Direct Indirect
Bangladesh
China
India
Indonesia (2000)
Malaysia (2000)
Philippines
Sri Lanka
Thailand (1999)
Vietnam
1.9
43.7
6.0
5.7
1.5
3.4
0.3
3.6
-
-
34,022
-
-
1,413
1,775
378
3,079
-
5.2
2.9
1.0
1.8
1.6
2.2
2.3
2.5
-
1,200
6,600
-
5,300
104
1,000
150
800
-
12,000
6,529
-
>10,000
na
-
100
1,200
-
20.4
25.0
5.6
22.0
45.4
27.0
17.0
32.7
19.0
-
4,190
-
1,670
-
507
-
-
-
Source: ADB-RETA 5945 Country Reports. Figures are for 2001, unless noted otherwise.
11CHAPTER 2 | Overview
CountryFish production (million t)
Marine Brackishwater Inland
Capture Culture Culture Capture Culture
Bangladesh (2001)
China (2001)
India
Indonesia (2000)
Malaysia (2000)
Philippines (2002)
Sri Lanka (2000)
Thailand (1999)
Vietnam (2001)
0.45
17.01
2.83
3.80
1.29
2.03
0.25
2.70
-
-
4.93
-
0.20
0.92
0.92
-
-
0.08
0.10
6.37
0.10
0.43
0.12
0.25
0.01
0.44
-
0.69
3.65
0.50
0.30
0.00
-
0.03
0.21
0.88
0.69
12.3
2.50
0.99
0.15
0.15
-
0.25
-
Table 2.5 Contribution to Fish Production of Different Ecosystems, Selected Asian Countries
a Source: ADB-RETA 5945 Country Reports.
significant increases in quantity, quality, and efficiency in fish production.
With the leveling off of marine landings, compared with the potential for further increases in aquaculture production, it is not surprising to see a general shift in interest and allocation of research funding from capture fisheries to aquaculture, especially in China, Thailand, and Malaysia. As its share in R & D funding declines, capture fisheries research has shifted focus towards post-harvest handling, product quality, and restoration of resources.
The private sector has played a vital role in technological change. This is especially evident in the case of commercial aquaculture; likewise, private marine fleets have aggressively modernized. Nevertheless, it is the public sector
that plays a key role in R & D systems throughout Asia. The scientific capabilities of the systems vary among countries as well as institutions within the same country; nevertheless, these systems and institutions are looked upon as leading sources of innovation in their respective countries.
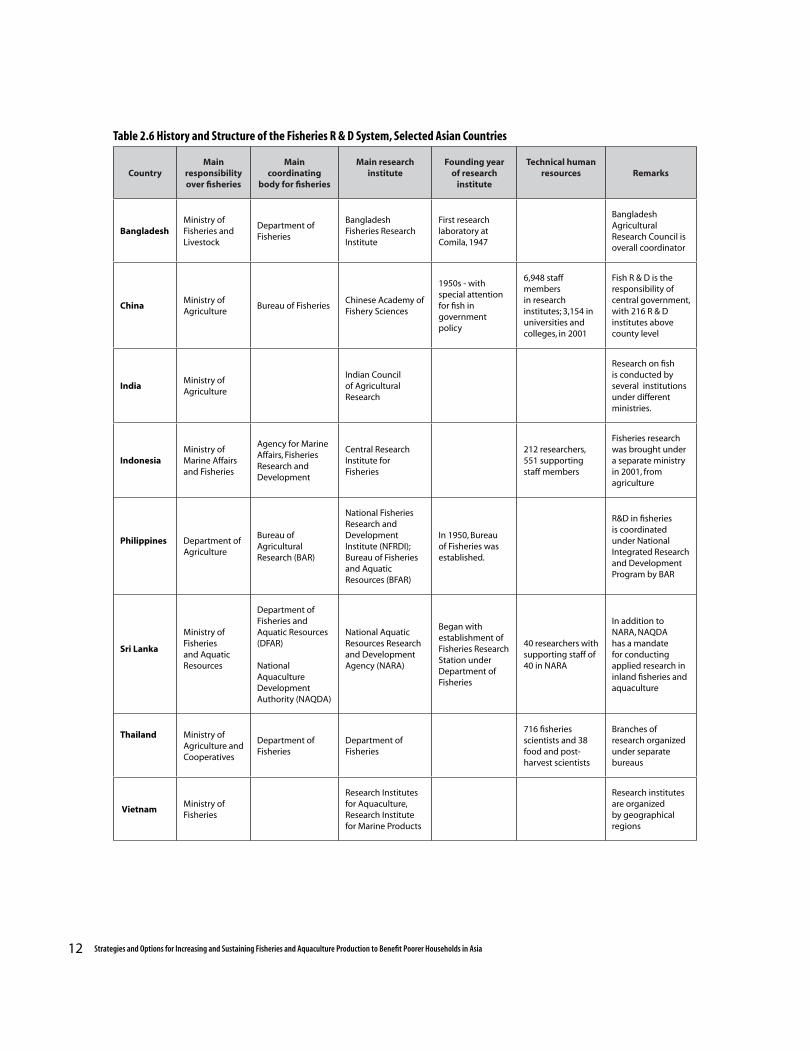
The history and structure of fisheries R & D systems are summarized in Table 2.6. Most of these systems evolved as offshoots of agricultural research systems. In five out of the nine countries (China, India, Malaysia, the Philippines and Thailand), fisheries research falls under the agriculture ministry, while the remaining countries have a separate fisheries ministry independently overseeing fisheries research.
The approach to fisheries research varies greatly across the countries studied. China has a large
12 Strategies and Options for Increasing and Sustaining Fisheries and Aquaculture Production to Benefit Poorer Households in Asia
Table 2.6 History and Structure of the Fisheries R & D System, Selected Asian Countries
CountryMain
responsibilityover fisheries
Main coordinating
body for fisheries
Main researchinstitute
Founding year of research
institute
Technical human resources Remarks
BangladeshMinistry of Fisheries and Livestock
Department of Fisheries
Bangladesh Fisheries Research Institute
First research laboratory at Comila, 1947
Bangladesh Agricultural Research Council is overall coordinator
ChinaMinistry of Agriculture
Bureau of FisheriesChinese Academy of Fishery Sciences
1950s - with special attention for fish in government policy
6,948 staff members in research institutes; 3,154 in universities and colleges, in 2001
Fish R & D is the responsibility of central government, with 216 R & D institutes above county level
India Ministry of Agriculture
Indian Council of Agricultural Research
Research on fish is conducted by several institutions under different ministries.
IndonesiaMinistry of Marine Affairs and Fisheries
Agency for Marine Affairs, Fisheries Research and Development
Central Research Institute for Fisheries
212 researchers, 551 supporting staff members
Fisheries research was brought under a separate ministry in 2001, from agriculture
Philippines Department of Agriculture
Bureau of Agricultural Research (BAR)
National Fisheries Research and Development Institute (NFRDI); Bureau of Fisheries and Aquatic Resources (BFAR)
In 1950, Bureau of Fisheries was established.
R&D in fisheries is coordinated under National Integrated Research and Development Program by BAR
Sri Lanka
Ministry of Fisheries and Aquatic Resources
Department of Fisheries and Aquatic Resources (DFAR)
National Aquaculture Development Authority (NAQDA)
National Aquatic Resources Research and Development Agency (NARA)
Began with establishment of Fisheries Research Station under Department of Fisheries
40 researchers with supporting staff of 40 in NARA
In addition to NARA, NAQDA has a mandate for conducting applied research in inland fisheries and aquaculture
Thailand Ministry of Agriculture and Cooperatives
Department of Fisheries
Department of Fisheries
716 fisheries scientists and 38 food and post- harvest scientists
Branches of research organized under separate bureaus
Vietnam Ministry of Fisheries
Research Institutes for Aquaculture, Research Institute for Marine Products
Research institutes are organized by geographical regions
13CHAPTER 2 | Overview
Country Total annual allocation of research funds (US$ million)
Year
BangladeshChinaIndiaIndonesiaMalaysiaPhilippinesSri LankaThailandVietnam
-50-6096.49
35.81.03
-2.1
11.81.95
--
20011998/99
1996-
200220022002
Table 2.7 Public Investment in Research and Development, Selected Asian Countries
Source: ADB-RETA 5945 Country Reports.
Country Fisheries R & D investment as a percentage of fisheries GDP
Bangladesh 0.100
China 0.009
Malaysia0.020
Sri Lanka0.550
Thailand 0.410
Table 2.8 Investment in R & D as a Percentage of the Fishery GDP
Source: ADB-RETA 5945 Country Reports.
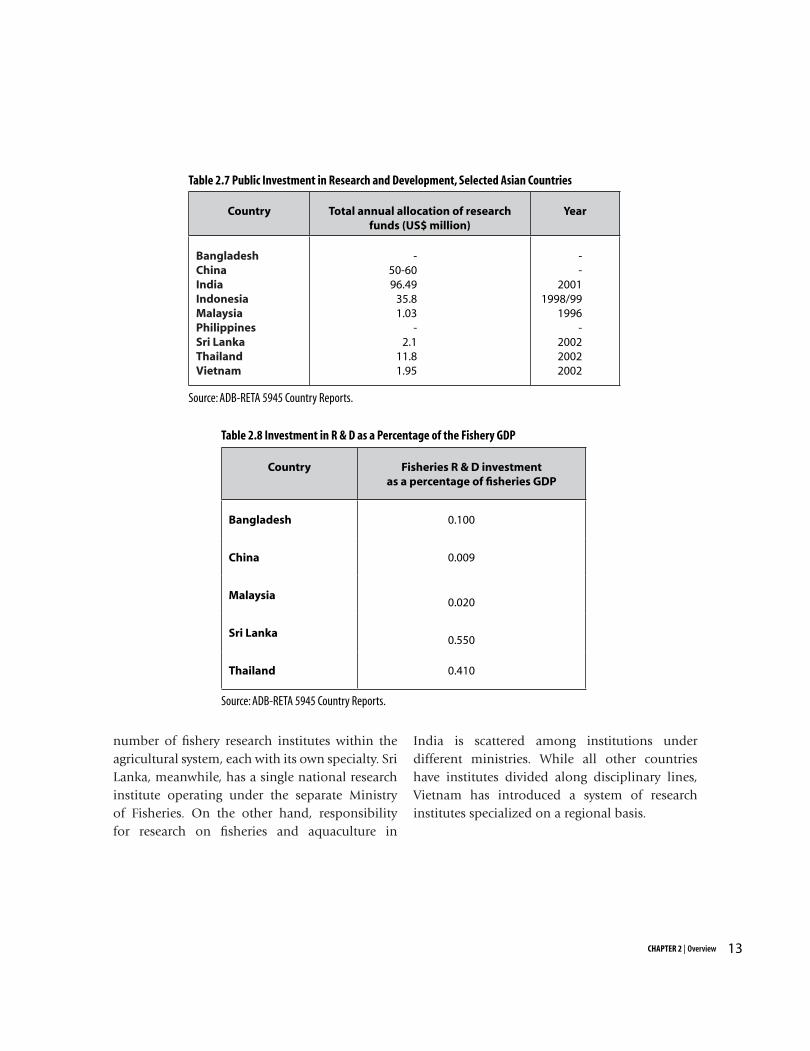
number of fishery research institutes within the agricultural system, each with its own specialty. Sri Lanka, meanwhile, has a single national research institute operating under the separate Ministry of Fisheries. On the other hand, responsibility for research on fisheries and aquaculture in
India is scattered among institutions under different ministries. While all other countries have institutes divided along disciplinary lines, Vietnam has introduced a system of research institutes specialized on a regional basis.
14 Strategies and Options for Increasing and Sustaining Fisheries and Aquaculture Production to Benefit Poorer Households in Asia
In addition to government research agencies, universities also play a vital role in research on fisheries and aquaculture in all the nine countries. Typically, universities with specialized faculties/departments/institutes on fisheries and aquaculture serve as the breeding ground for skilled human resources in government research agencies. Further, the academe often carries out either independent or collaborative research programs for fisheries research funded by local and international donors.
Despite variations found in R & D structures, many countries seem to have a leading body or institute that acts as the focal point. Such bodies can take leadership and/or coordinating roles, rallying out the efforts of other organizations that are engaged in research, such as other national or subnational government agencies and universities. The level of coordination among these organizations and other stakeholders, such as the private sector and nongovernmental organizations (NGOs), is not very clear. However, as already mentioned, the existence of relatively efficient mechanisms for spreading scientific knowledge and technology transfer is apparent in significant adoption rates by the private sector. While NGOs have begun to play an important role in such mechanisms, the core diffusion system is still the extension network managed by lead agencies such as national fisheries departments.
Data on R & D investment are scarce and, when available, usually represent commitments instead of actual allocations from the public budgets; hence, they may be overestimated (Table 2.7). On the other hand, these R & D agencies also receive research funds in addition to their budget allocations. While countries with developed aquaculture industries, such as Thailand and China, receive more than
50 percent of their funds from the government, the low-income countries (Bangladesh, Sri Lanka, and Vietnam) are entirely government-dependent and rely also on contributions from international agencies. Other than state research centers, universities also conduct research using their own funds, or funds from international agencies and private donors. The private sector itself carries out much R & D although investment data for such entities are seldom available.
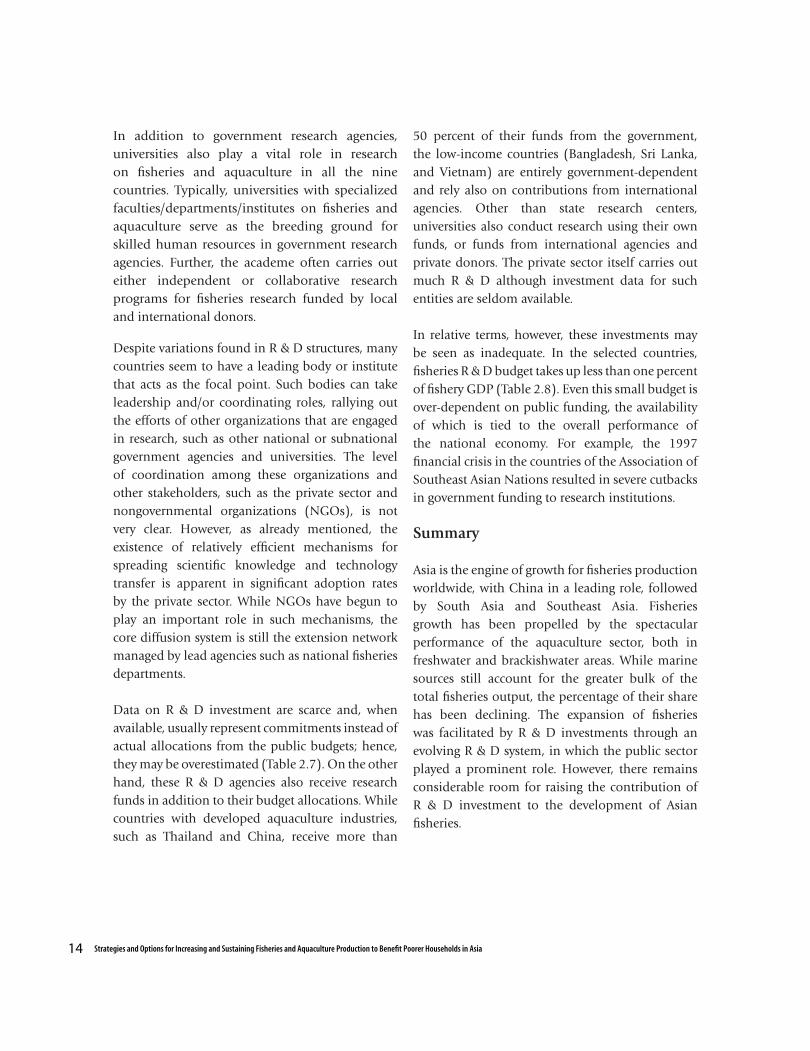
In relative terms, however, these investments may be seen as inadequate. In the selected countries, fisheries R & D budget takes up less than one percent of fishery GDP (Table 2.8). Even this small budget is over-dependent on public funding, the availability of which is tied to the overall performance of the national economy. For example, the 1997 financial crisis in the countries of the Association of Southeast Asian Nations resulted in severe cutbacks in government funding to research institutions.
Summary
Asia is the engine of growth for fisheries production worldwide, with China in a leading role, followed by South Asia and Southeast Asia. Fisheries growth has been propelled by the spectacular performance of the aquaculture sector, both in freshwater and brackishwater areas. While marine sources still account for the greater bulk of the total fisheries output, the percentage of their share has been declining. The expansion of fisheries was facilitated by R & D investments through an evolving R & D system, in which the public sector played a prominent role. However, there remains considerable room for raising the contribution of R & D investment to the development of Asian fisheries.

15CHAPTER 3 | Profile of Technologies
This chapter builds a profile of technologies in aquaculture, capture fisheries, and related industries. A diverse set of methods, target species, costs and returns, and factor shares are catalogued and discussed. The chapter is organized as follows: the first section is devoted to aquaculture, covering the major production environments (freshwater, brackishwater, and marine); the second, to capture fisheries; the third, to post-harvest and processing; and the fourth, to hatchery technologies, which are crucial input suppliers to fish farming.
In the economic analysis of this chapter, costs are based on market prices. Fishing and fish farming impose a wider set of costs than those revealed by the market, e.g., through pollution and destruction of aquatic habitats. However, unavailability of information on these external and long-term costs precludes a more comprehensive definition of cost.
Aquaculture
Aquaculture has been developed in Asia for many centuries. Traditionally, it was devoted to ornamental fish (China) or practiced for subsistence (e.g., naturally stocked water catchments). In modern times, aquaculture has progressed rapidly in the region. Technologies range from sophisticated fish growing to more traditional practices that tend to be integrated with crop farming or animal husbandry (e.g., rice-fish or duck-fish systems).
Freshwater aquaculture
Table 3.1 is a summary of the major freshwater aquaculture technologies in the selected countries1. Pond systems are the dominant aquaculture technologies, with production shares in total freshwater production ranging from 58 percent (Indonesia) to 85 percent (Bangladesh).
Polyculture of Indian and Chinese carps, along with a few other exotic species, is the most dominant system in Bangladesh, accounting for 63 percent of freshwater aquaculture production. A strikingly high proportion (73%) of rural households are involved in this type of culture system (Mazid 1999), due to the floodplain environment throughout the country. Other practices include pond monoculture of Thai pangus, polyculture of Nile tilapia and carps in seasonal ponds (ditches), and polyculture of carps (mainly mirror carp) and silver barb in ricefields. Monoculture of genetically improved Nile tilapia in ponds is also becoming popular, particularly among commercial producers.
The most popular freshwater aquaculture technologies in China are polyculture of Chinese carps in ponds and monoculture of tilapia in ponds and cages. Monoculture of carp is becoming popular for intensive culture in cages, ponds, and running water systems. In India, meanwhile, the
Chapter 3
PROFILE AND ECONOMICS OF AQUACULTURE AND FISHERIES TECHNOLOGIES
1 Sri Lanka is omitted in the following discussion due to the negligible size of its freshwater aquaculture sector.

16 Strategies and Options for Increasing and Sustaining Fisheries and Aquaculture Production to Benefit Poorer Households in Asia
System Bangladesh China India Indonesia Philippines Thailand Vietnam
Pond
Polyculture of carp and other species; polyculture of Nile tilapia and exotic carp or barb in seasonal ponds; monoculture ofThai pangus
Polyculture of carp and other species; monoculture of prawn, tilapia, carp, Chinese mitten-handed crab, Mandarin fish, eel
Polyculture of carp; monoculture of prawn
Monoculture of common carp; polyculture ofNile tilapia and other local species
Polyculture of carp; monoculture of tilapia, carp, catfish
Polyculture of carp, tilapia, and other species; monoculture of walking catfish, snakehead, prawn, and sand goby
Polyculture of carp and other species; monoculture of red tilapia
Cage or pen
Polyculture of carp; monoculture of prawn, tilapia, carp, Mandarin fish, eel, Chinese mitten-handed crab
Monoculture of carp and catfish
Single-cage common carp,tilapia; double-cage common carp, tilapia
Monoculture of tilapia
Monoculture ofPangasiusbocourti, common carp, snakehead
RicefieldPolyculture of carp and tilapia
Polyculture of carp, prawn and Chinese mitten-handed crab
Polyculture of carp
Polyculture (mostly carp)
Monoculture ofMacrobrachium rosenbergii(prawn)
Integrated fish culture
Integrated fish (mostly polyculture of carp, duck, poultry and pig)
Integrated farming of fish (mostly polyculture of carp and catfish) with pig, chicken, or duck
VAC system -integrated farming of fish (mostly polyculture of carp) with home garden and pig
TanksMonoculture of tilapia and catfish
Sewage feed
Polyculture of Labeo bata and Cyprinus reba
Culture of air-breathing fish in shallow water
Monoculture of Clarias batrachus and Heteropneustes fossilis
Table 3.1 Major Freshwater Aquaculture Technologies in the Selected Countries
Source: ADB-RETA 5945 Country Reports.
17CHAPTER 3 | Profile of Technologies
dominant technology is composite fish culture, a distinct polyculture method of Indian major carps and exotic carps. Other prominent technologies in India include monoculture of air-breathing fish, monoculture and polyculture of freshwater prawns, cage culture, pen culture, running water fish culture, and pearl culture.
In Indonesia, freshwater aquaculture areas occupy only four percent of the estimated potential (DGA 2002). The most important species cultured are carp, tilapia, catfish, gourami, and prawn. The most important freshwater aquaculture technologies are the running water system in ponds, floating net cage aquaculture, and culture of fish in paddy fields. The floating net cage aquaculture system has two packages: single and double. Most of these technologies are monoculture of either tilapia or common carp. Polyculture is limited to a few species like tilapia, common carp, gourami, catfish, river eel, etc.
Monoculture of tilapia in ponds and cages is the most popular freshwater aquaculture technology in the Philippines. Meanwhile, polyculture of omnivorous species like tilapia, silver barb, common carp, Chinese carp, and mrigal in ponds and monoculture of carnivorous species like walking catfish, snakehead, freshwater prawn, and sand goby in ponds are the most widespread freshwater aquaculture practices in Thailand (Dey et al. 2005a; ICLARM 2001).
In Vietnam, a small-scale, integrated farming system known as VAC combines three different farming components. These are: vegetable or fruit garden (vuon), fish/shrimp pond (ao) and livestock pen (chuong). VAC is the most common freshwater technology in Vietnam, especially in the northern and Mekong Delta regions. Ponds and lakes are among the most productive systems
in the country, accounting for 60 percent of the total aquaculture production in 1996 while occupying only 10 percent of the aquaculture area (Lovatelli 1997).
In summary, freshwater aquaculture technologies and culture systems in the region include a wide range of techniques and methods. Although both monoculture and polyculture are commonly practiced, polyculture of carps (with other species in some cases) is the most dominant form of freshwater aquaculture in Bangladesh, China, India, Thailand, and Vietnam while monoculture is the major form of freshwater aquaculture in the Philippines (for tilapia) and Indonesia (tilapia and carp)
Brackishwater and marine aquaculture
Shrimp culture in pond is the most popular species for brackishwater aquaculture technologies. Thailand, Indonesia, India, Malaysia, the Philippines, and Vietnam are major shrimp-producing countries and more advanced in culture technologies. Vietnam, Bangladesh, and India have developed a system of shrimp-rice rotation, a common practice in rural areas. Marine aquaculture using sea ranching is popular in the Philippines for seaweed, and in Malaysia and Thailand for molluscs. The Philippines, Indonesia, and Malaysia lead in cage and pen culture of milkfish. In the Philippines, catfish, prawn, tilapia, and milkfish are cultured in pond enclosures located in estuarine water and brackishwater. See Table 3.2 for details.
Aquaculture species
There are innumerable freshwater fish species in Asia as shown in Table 3.3. China alone has about 800 species, over 40 of which are cultured (Cen

18 Strategies and Options for Increasing and Sustaining Fisheries and Aquaculture Production to Benefit Poorer Households in Asia
Country Culture system Main species cultured Management system
Bangladesh Mono/mixed in ricefields; poldersGiant sea perchmullet (yellow-tailed, large-scaled, green back)
Extensive
China
Monoculture in brackishwater ponds Monoculture in marine cages
Snapper, grouper, mullet
Seabass, grouper, snapper
Semi-intensive, intensive
Semi-intensive, intensive
IndiaMonoculture in marine cages/tanks
Mullet, grouper, seabass, milkfish Extensive
Indonesia
Polyculture in ricefields
Monoculture and polyculture in brackishwater ponds
Monoculture in cages
Polyculture in cages
Milkfish
Tilapia, milkfish
Snapper, milkfish
Grouper, seabass
Intensive, semi-intensive, extensive
Semi-intensive and extensive
Intensive, semi-intensive
Intensive, semi-intensive
Malaysia
Monoculture in brackishwater ponds, pens and marine cages
Monoculture in marine cages and pens
Seabass, snapper
Grouper, tilapia, threadfin, pomfret
Intensive, semi-intensive
Intensive, semi-intensive
PhilippinesMonoculture and polyculture in brackishwater ponds and marine cages
Milkfish, grouper, tilapia, seabass, pomfret
Extensive, semi-intensive and intensive
Sri Lanka Monoculture in brackishwater pond and pens
Milkfish Extensive
Thailand
Monoculture in brackishwater ponds and cages
Polyculture in brackishwater ponds
Grouper (Epinephelus coioides and E. malabaricus)
SeabassMullet
Extensive, semi-intensive, intensive
Extensive, semi-intensive, intensive
Vietnam
Monoculture and polyculture in brackishwater ponds
Monoculture in cages
Polyculture in brackishwater ponds
Seabass, grouper (E. coioides, E. malabaricus and E. bleekeeri)
Snapper
Tilapia, mullet, milkfish
Extensive, semi-intensive, intensive
Extensive and semi-intensive
Table 3.2 Marine Finfish Farming Technology in the Selected Countries
Source: ADB-RETA 5945 Country Reports.
19CHAPTER 3 | Profile of Technologies
and Zhang 1998). Silver carp (Hypophthalmichthys molitrix), grass carp (Ctenopharyngodon idellus), common carp (Cyprinus carpio carpio), and bighead carp (Aristichthys nobilis) together accounted for about 67 percent of the total national freshwater aquaculture production in 2000 (FAO 2002b). Crucian carp (Carassius carsius) is also an economically important species in the country (Huang et al. 2004; ICLARM 2001).
In India, Indian major carps, namely, rohu (Labeo rohita), catla (Catla catla), and mrigal (Cirrhinus mrigala), accounted for 87 percent of the total freshwater aquaculture production in 2000 (FAO 2002). Other economically important freshwater aquaculture species in India include silver carp, grass carp, common carp and kalbasu.
The inland freshwaters of Bangladesh are inhabited by 60 indigenous and 13 exotic species of fish, and 20 species of shrimp, the majority of which are available in impounded water bodies.The Indian major carps, together with silver carp, account for more than 78 percent of the total pond production in Bangladesh (FAO 2002a). Other major species in Bangladesh include grass carp, rohu and common carp.
Common carp is the most popular freshwater species in Indonesia, accounting for almost 40 percent of the total freshwater aquaculture production in 2000. Other freshwater species are tilapia, Nile carp (Osteochilus hasseltii), and Java barb (Barbodes gonionotus). River eel is an emerging freshwater cultured species with a growth rate of 45 percent in the last decade (FAO 2002b).
Freshwater aquaculture practice is one of the most diversified systems in Malaysia, producing 20 species and employing 4-5 different culture
techniques. Culture in ponds is the most popular, followed by in cages and pens. Pond culture mainly concentrates on polyculture of carp, tilapia, catfish and prawn. In the Philippines, tilapia is the major freshwater cultured species, accounting for 63 percent of the total freshwater aquaculture production. Production of milkfish (Chanos chanos) in freshwater environment is decreasing at an average annual rate of two percent. Since its introduction in the Philippines, carp culture has been expanding at an average annual growth rate of 55 percent during 1993-1997 (Dey et al. 2005a; Olalo 2005).
Nile tilapia (Oreochromis niloticus niloticus), catfish, gourami and Thai silver barb (Barbodes gonionotus) are the most popular freshwater species in Thailand. These species contributed around 38, 27, and 16 percent, respectively, to the total freshwater aquaculture production in 2000. Production of these species has been expanding steadily at the annual rates of 17, 11, and 16 percent, respectively (FAO 2002b). In Vietnam, a number of freshwater fish species have been cultured. Carp contributed 29 percent to the country’s fish production in 1996 (ICLARM 1998; 2001). Other important freshwater species in the country are tilapia, catfish, and Thai silver barb.
For brackishwater and marine culture, China, India, Indonesia, and Thailand have similar numbers of culture species. In these countries, however, the most popular species is shrimp—produced mostly for export. China is the only country in the region producing shrimp mainly for domestic markets.
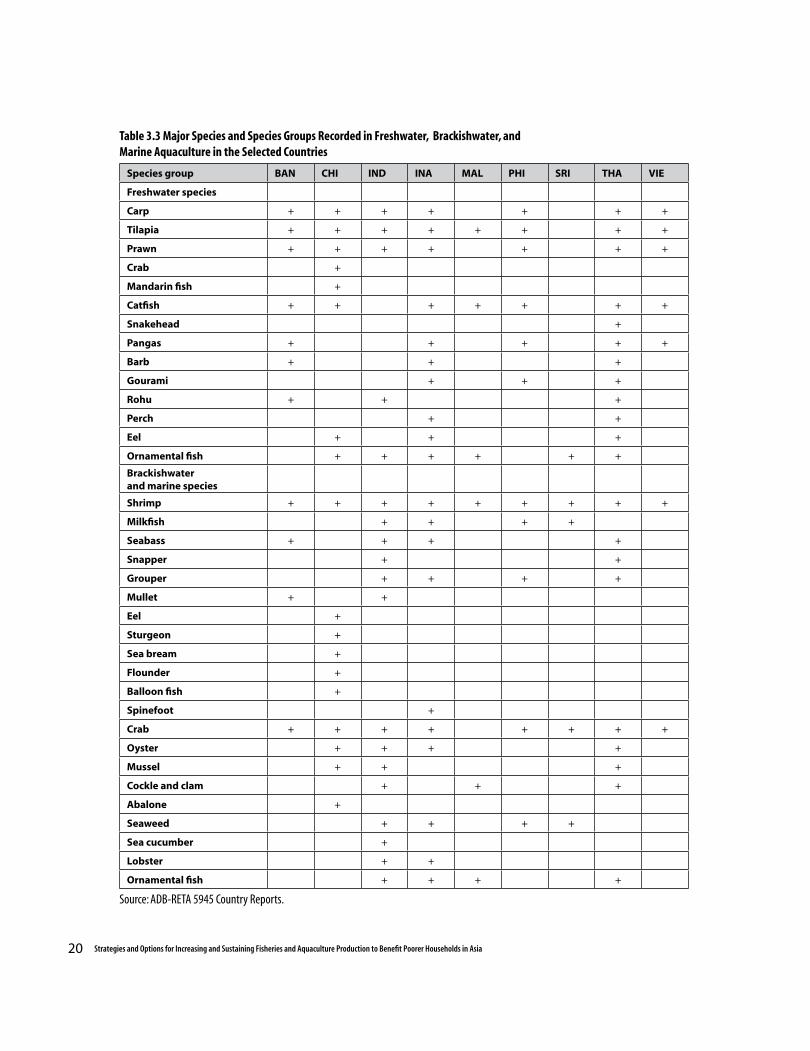
20 Strategies and Options for Increasing and Sustaining Fisheries and Aquaculture Production to Benefit Poorer Households in Asia
Species group BAN CHI IND INA MAL PHI SRI THA VIE
Freshwater species
Carp + + + + + + +
Tilapia + + + + + + + +
Prawn + + + + + + +
Crab +
Mandarin fish +
Catfish + + + + + + +
Snakehead +
Pangas + + + + +
Barb + + +
Gourami + + +
Rohu + + +
Perch + +
Eel + + +
Ornamental fish + + + + + +
Brackishwater and marine species
Shrimp + + + + + + + + +
Milkfish + + + +
Seabass + + + +
Snapper + +
Grouper + + + +
Mullet + +
Eel +
Sturgeon +
Sea bream +
Flounder +
Balloon fish +
Spinefoot +
Crab + + + + + + + +
Oyster + + + +
Mussel + + +
Cockle and clam + + +
Abalone +
Seaweed + + + +
Sea cucumber +
Lobster + +
Ornamental fish + + + +
Table 3.3 Major Species and Species Groups Recorded in Freshwater, Brackishwater, and Marine Aquaculture in the Selected Countries
Source: ADB-RETA 5945 Country Reports.
21CHAPTER 3 | Profile of Technologies
Farming practices and productivity
Table 3.4 contains a summary of information on farming practices and productivity in the selected countries. In comparing the figures, one must bear in mind the differing cycle durations, corresponding to the various culture species and systems. For example, the cycle of typical tilapia culture is less than a year while that of carp culture lasts 6 to 24 months.
China and Thailand stocked many more fingerlings per hectare of water area (27,900 pieces/ha in China and 67,300 pieces/ha in Thailand), and used greater amounts of supplementary feeds and fertilizers. Most of the fish farmers in China produce their own fingerlings. In Bangladesh and India, fingerlings are available from private and public hatcheries, and from intermediary fingerling traders. Fingerlings in Vietnam are largely produced by private hatcheries – only about a quarter of the sample respondents in northern Vietnam produce their own fingerlings. In the Philippines, cage operators get their fingerlings from private hatcheries. Pond operators in the Philippines and Indonesia obtain fingerlings from private and government hatcheries. Many fish farmers (such as in India) cite the unavailiability of quality fish seeds as a major problem in their operations.
Intensive culture uses complete feed, with proportionally more protein and less carbohydrate content than what is used in semi-intensive and extensive culture (Panayotou et al. 1982; Edwards 1993; Tacon and de Silva 1997). Farmers in Bangladesh, India, and Vietnam use relatively less supplementary feed and fewer other inputs in fish farming than farmers in China and Thailand. Input application suggests that most of the farms
in Bangladesh and India are extensive. In China, there are no extensive farms; most farms practice at least semi-intensive production. Dey et al. (2000a) reported that freshwater cage culture in China is highly intensive.
In the Philippines, culture systems are semi-intensive and intensive operations, with almost no small-scale or extensive culture systems (Felsing and Baticados 2001). In Indonesia, running water systems are semi-intensive and intensive while rice-fish systems are extensive (Kontara and Maswardi 1999). Running water systems are heavily dependent on input. Pond culture systems use various types of inputs. Average stocking density in ponds is between 10,300 and 67,000 pieces/ha. Fish are fed commercial feed, rice bran, oil cake, and others. Both organic and inorganic fertilizers are used. Lime is used only in Bangladesh and Thailand.
Yields vary considerably among countries. This can be attributed to the variation in production intensity levels, production environments, farming systems and culture practices. For tilapia production, cage culture is more productive than pond culture. In general, fish yield is significantly higher in China than in Bangladesh, India, Thailand, and northern Vietnam.
Production within a country may vary by area. Veerina et al. (1993) reported that in some parts of India, particularly in Andhra Pradesh, where 94 percent of the fish ponds were previously used for shrimp culture, farmers have successfully adopted semi-intensive production practices. They can reach annual yields of 6-8 t/ha using organic and inorganic fertilizers and plant-based diets, such as rice bran, cottonseed meal, de-oiled bran and groundnut cake as supplementary feeds. The yield

Cat
ego
ry
Ban
gla
des
hC
hin
aIn
dia
Ind
on
esia
Ph
ilip
pin
esTh
aila
nd
N. V
ietn
am
Car
p p
oly
p
on
d(A
nn
ual
)
Car
p p
oly
p
on
d(A
nn
ual
)
Tila
pia
mo
no
p
on
d (<
1
year
)
Tila
pia
mo
no
ca
ge
(< 1
yea
r)
Car
p p
oly
po
nd
(An
nu
al)
Co
mm
on
car
p
RW
S 2/
(An
nu
al)
Co
mm
on
car
p
cag
e(A
nn
ual
)
Tila
pia
m
on
o
po
nd
(An
nu
al)
Tila
pia
m
on
o c
age
(An
nu
al)
Car
p p
oly
p
on
d(A
nn
ual
)
Car
p p
oly
po
nd
(An
nu
al)
Yie
ld (k
g/h
a) 3
,262
12,0
85 5
,860
6,5
93 3
,214
482
1,01
22,
959
540
3,
777
3,64
7
See
d (p
iece
s/u
nit
are
a)1/
10,2
6127
,867
23,9
5014
,200
18,4
0857
13
723
,700
6,75
767
,328
5,43
2
Fee
d (k
g/u
nit
a
rea)
2,2
3238
,251
12,8
9811
,431
9,0
3680
81,
494
5,50
853
310
,989
1,72
4
Ric
e b
ran
1,
728
4
42 9
,472
8,2
443,
172
2,02
01,
724
Co
mm
erci
al fe
ed
19,2
202,
811
11,4
3180
81,
494
2,33
653
31,
229
Oil
cake
50
516
,380
4
74
Oth
ers
2,
209
615
31
87,
740
Fer
tiliz
er (
kg/u
nit
are
a)72
5
2,29
35,
607
--
2,91
01,
875
Org
anic
43
9
1,17
15,
470
7,17
52,
681
1,87
5
In
org
anic
28
6
1,12
2
137
2
13
229
Tri
ple
su
per
p
ho
sph
ate
65
Ure
a22
1
150
56
Oth
ers
9
72
81
--
Lim
e93
28
565
Med
ical
/ch
emic
al/
pes
tici
de
1,3
54
19
--
2
Lab
or (
wo
rkd
ays)
324
2
9380
124
27
765
187
15
913
3
Fam
ily la
bo
r18
460
89
150
2911
122
Hir
ed la
bo
r13
9
293
2035
12
741
1211
22 Strategies and Options for Increasing and Sustaining Fisheries and Aquaculture Production to Benefit Poorer Households in Asia
Tabl
e 3.
4 In
puts
and
Out
puts
Use
d by
Fre
shw
ater
Fis
h Pr
oduc
ers i
n th
e Se
lect
ed C
ount
ries
Note
s: 1 U
nit a
rea i
s one
hec
tare
for p
ond
and
100
m2 fo
r cag
e; se
ed is
in kg
/ha f
or Ch
ina,
kg/1
00 m
2 for I
ndon
esia
, and
pie
ce/h
a for
the o
ther
coun
tries
.
2 RW
S – ru
nnin
g w
ater
syste
m.
Sour
ces:
For t
ilapi
a cul
ture
: Dey
et al
. (200
0a) a
nd D
issem
inat
ion
and
Eval
uatio
n of
Gen
etica
lly Im
prov
ed Ti
lapi
a (DE
GITA
) fiel
d su
rvey
(ICL
ARM
199
8).
For
oth
er co
untri
es: c
arp
gene
tics fi
eld
surv
ey (
ICLA
RM 2
001)
.

23CHAPTER 3 | Profile of Technologies
of pond culture system varies from 1,200 kg/ha in Uttar Pradesh and 1,500 kg/ha in Madhya Pradesh. In general, however, carp yields in India and Bangladesh are relatively similar. Yields in Thailand and northern Vietnam are also relatively similar and are higher than those in Bangladesh and India. In Indonesia, cage culture systems produce significantly higher yields than running water systems.
Yields also vary according to pond sizes. In India, freshwater fish farmers report an average production of 1,698 kg/ha on farms smaller than one hectare and the production can go up to 2,624 kg/ha on farms larger than two hectares. For brackishwater and marine aquaculture, farmers in India obtain the highest yields from medium farms (793 kg/ha/crop) and the lowest from large farms (730 kg/ha/crop). Small-scale farmers produce 765 kg/ha/crop, with the cycle typically running twice a year.
Cost and returns
Costs and returns of freshwater aquaculture technologies are calculated for different culture systems (e.g., monoculture, polyculture, cage culture, and integrated fish culture of different types) and levels of intensity. The definitions of intensity level follow Edwards (1993) and Dey et al. (2000b), as follows:
• Extensive systems rely on natural food produced in the waterbody without supplementary inputs.• Semi-intensive systems supplement natural feed with additional feed and fertilizers.• Intensive systems rely on nutritionally complete, concentrate feed and fertilizers.
Variable costs are available for almost all species in all countries, unlike fixed costs; fixed costs can, however, be imputed from the available information. Dey et al. (2000a) reported that fixed cost of freshwater culture in the reference countries accounted for 9-35 percent of the total cost. In the context of Bangladesh and Vietnam, fixed cost is a relatively unimportant component (McConnel and Dillon 1997); therefore, gross margin may have been a good measure of profitability.
Another important indicator is cost-effectiveness, measured here by the ratio of the gross margin to variable cost, i.e., the net income that one unit of current outlay is expected to earn within one production cycle. If cost-effectiveness is low, one needs a larger outlay to hit the same gross margin, which may be a problem if there are limits to expansion due to credit constraints, for example.
Freshwater aquaculture
Costs and returns of freshwater aquaculture production in the selected countries are presented in Table 3.5. The data are grouped by species, then by intensity level and gross cost. As expected, when intensity increases, cost as well as revenue rises (though the pattern may be obscured by differences across countries). Profitability also exhibits a tendency to rise with intensity, but the pattern is much less obvious.
It is noteworthy that cost-effectiveness appears to be unrelated to intensity; if at all, increasing intensity seems to be associated with lower cost-effectiveness. What is evident is that extensive systems peform relatively poorly in terms of profitability and cost-effectiveness. However, moderate increments in intensity can make a big difference in profitability and cost-effectiveness
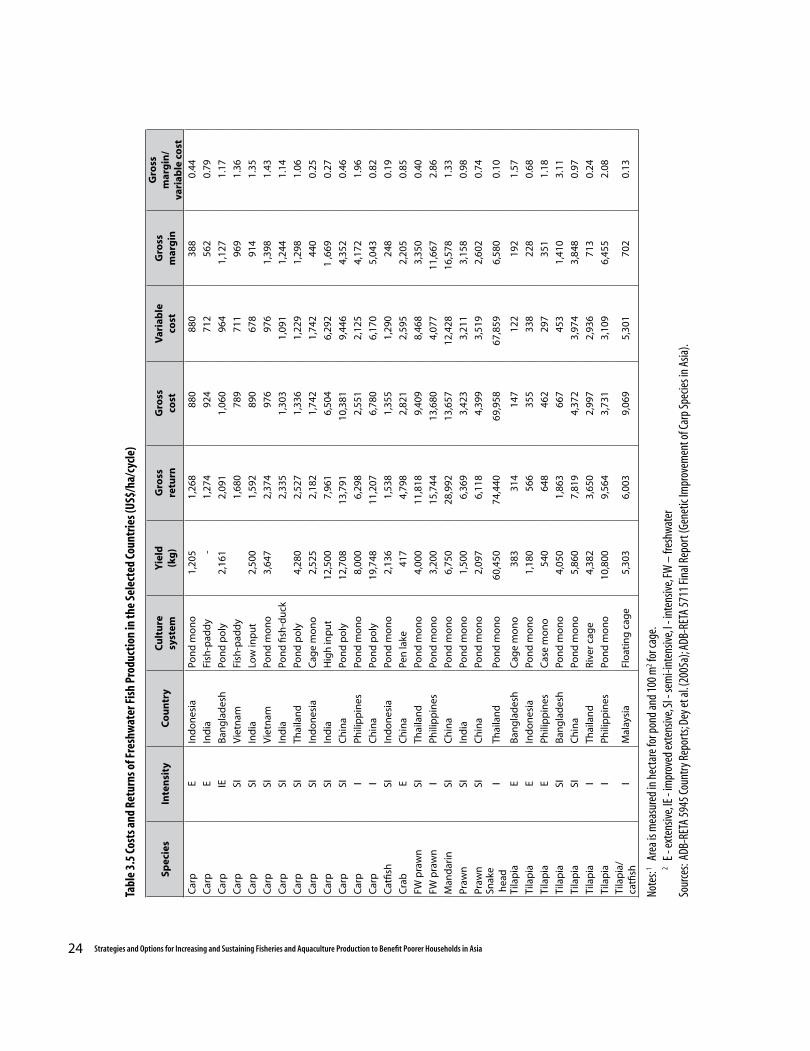
24 Strategies and Options for Increasing and Sustaining Fisheries and Aquaculture Production to Benefit Poorer Households in Asia
Spec
ies
Inte
nsi
tyC
ou
ntr
yC
ult
ure
sy
stem
Yie
ld(k
g)
Gro
ssre
turn
Gro
ssco
stV
aria
ble
cost
Gro
ssm
arg
in
Gro
ss
mar
gin
/ va
riab
le c
ost
Car
pE
Ind
on
esia
Pon
d m
on
o1,
205
1,26
8
880
880
38
80.
44
Car
pE
Ind
iaFi
sh-p
add
y-
1,27
4
924
712
56
20.
79
Car
pIE
Ban
gla
des
hPo
nd
po
ly2,
161
2,09
11,
060
964
1,1
271.
17
Car
pSI
Vie
tnam
Fish
-pad
dy
1,68
0
789
711
9
691.
36
Car
pSI
Ind
iaLo
w in
pu
t2,
500
1,59
2
890
678
91
41.
35
Car
pSI
Vie
tnam
Pon
d m
on
o 3
,647
2,37
4
976
976
1,3
981.
43
Car
pSI
Ind
iaPo
nd
fish
-du
ck2,
335
1,30
31,
091
1,2
441.
14
Car
pSI
Thai
lan
dPo
nd
po
ly 4
,280
2,52
71,
336
1,22
9 1
,298
1.06
Car
pSI
Ind
on
esia
Cag
e m
on
o 2
,525
2,18
21,
742
1,74
2
440
0.25
Car
pSI
Ind
iaH
igh
inp
ut
12,5
007,
961
6,50
46,
292
1 ,6
690.
27
Car
pSI
Ch
ina
Pon
d p
oly
12,7
0813
,791
10,3
819,
446
4,3
520.
46
Car
pI
Phili
pp
ines
Pon
d m
on
o 8
,000
6,29
82,
551
2,12
5 4
,172
1.96
Car
pI
Ch
ina
Pon
d p
oly
19,7
4811
,207
6,78
06,
170
5,0
430.
82
Cat
fish
SIIn
do
nes
iaPo
nd
mo
no
2,1
361,
538
1,35
51,
290
2
480.
19
Cra
bE
Ch
ina
Pen
lake
4
174,
798
2,82
12,
595
2,2
050.
85
FW p
raw
nSI
Thai
lan
dPo
nd
mo
no
4,0
0011
,818
9,40
98,
468
3,3
500.
40
FW p
raw
nI
Phili
pp
ines
Pon
d m
on
o 3
,200
15,7
4413
,680
4,07
711
,667
2.86
Man
dar
inSI
Ch
ina
Pon
d m
on
o 6
,750
28,9
9213
,657
12,4
2816
,578
1.33
Praw
nSI
Ind
iaPo
nd
mo
no
1,5
006,
369
3,4
233,
211
3,1
580.
98
Praw
nSI
Ch
ina
Pon
d m
on
o 2
,097
6,11
8 4
,399
3,51
9 2
,602
0.74
Snak
e h
ead
ITh
aila
nd
Pon
d m
on
o60
,450
74,4
4069
,958
67,8
59 6
,580
0.10
Tila
pia
EB
ang
lad
esh
Cag
e m
on
o
383
3
14
147
1
22
192
1.57
Tila
pia
EIn
do
nes
iaPo
nd
mo
no
1,1
80
566
35
5
338
2
280.
68
Tila
pia
EPh
ilip
pin
esC
ase
mo
no
5
40
648
46
2
297
3
511.
18
Tila
pia
SIB
ang
lad
esh
Pon
d m
on
o 4
,050
1,86
3
667
4
53 1
,410
3.11
Tila
pia
SIC
hin
aPo
nd
mo
no
5,8
607,
819
4,37
23,
974
3,8
480.
97
Tila
pia
ITh
aila
nd
Riv
er c
age
4,3
823,
650
2,99
72,
936
7
130.
24
Tila
pia
IPh
ilip
pin
esPo
nd
mo
no
10,8
009,
564
3,73
13,
109
6,4
552.
08
Tila
pia
/ca
tfish
IM
alay
sia
Flo
atin
g c
age
5,3
036,
003
9,06
95,
301
7
020.
13
Tabl
e 3.
5 Co
sts a
nd R
etur
ns o
f Fre
shw
ater
Fis
h Pr
oduc
tion
in th
e Se
lect
ed C
ount
ries (
US$/
ha/c
ycle
)
Note
s: 1 A
rea i
s mea
sure
d in
hec
tare
for p
ond
and
100
m2 fo
r cag
e.
2 E -
exte
nsive
, IE -
impr
oved
exte
nsive
, SI -
sem
i-int
ensiv
e, I -
inte
nsive
, FW
– fr
eshw
ater
Sour
ces:
ADB
-RET
A 59
45 Co
untry
Rep
orts
; Dey
et al
. (200
5a);
ADB-
RETA
571
1 Fin
al R
epor
t (Ge
netic
Impr
ovem
ent o
f Car
p Sp
ecie
s in
Asia
).
25CHAPTER 3 | Profile of Technologies
although this improvement does not necessarily continue with increasing level of intensity.
Across species, cost-effectiveness is highest for tilapia under semi-intensive pond monoculture in Bangladesh. In China, even though mandarin culture had the highest gross margin, followed by polyculture of carp and tilapia, variable costs of these enterprises are higher, thereby reducing cost-effectiveness. In India, carp polyculture in ponds with low inputs has the highest return per dollar of operating capital while ponds with high inputs has the lowest return. In Thailand, although snakehead culture has one of the highest gross margins, cost-effectiveness is among the lowest. Both monoculture of carp and fish-paddy culture are moderately cost-effective in Vietnam.
Brackishwater and marine aquaculture
Costs and returns data for brackishwater fish culture in the selected Asian countries are presented in Table 3.6; they are grouped and ordered in the same way as in Table 3.5. Similar patterns are observed as in freshwater culture, although cost, returns, and profits are on a higher level, given the higher unit value of brackishwater species. It is noteworthy that extensive shrimp culture in Thailand is highly cost-effective, and semi-intensive culture is even more so, but cost-effectiveness is mediocre for intensive systems (despite higher gross margins).
As for species, shrimp under extensive, improved extensive and semi-intensive monoculture in India appears to be a good performer in terms of both gross margin and cost-effectiveness. Improved extensive mud crab farming in the Philippines also had reasonably high gross margin and cost-effectiveness. Overall, the data suggest that the
technologies which were more profitable and cost-effective were extensive and semi-intensive. Such technologies involve lower operating costs and appear to be more affordable from the viewpoint of resource-poor farmers.
Factor shares and investment requirements
Freshwater aquaculture
Factor shares (i.e., percentages in gross return) for the major inputs in freshwater aquaculture are presented in Table 3.7. Aquaculture intensity would a priori be positively associated with capital intensity, an expectation that is met by the tabulation. It should be noted that high capital intensity implies a greater investment need; hence, the large outlays required for fixed and working capital raise entry barriers for the poor.
A notable exception is the case of Indonesia, where extensive and semi-intensive pond monocultures of tilapia and catfish are associated with very low use of labor and high use of feed and seed. The other exception is the labor-intensive pond monoculture of carp and tilapia in the Philippines.
Intensive culture is also associated with a higher proportion of feed cost to the total cost. This is illustrated by intensive and semi-intensive pond polyculture of carp and pond monoculture of prawn in China, intensive floating cage culture of tilapia in Malaysia, intensive freshwater prawn monoculture in the Philippines, and intensive pond monoculture of snakehead, river cage culture of tilapia, and semi-intensive freshwater pond monoculture of prawn in Thailand. The technologies that require a higher share of labor
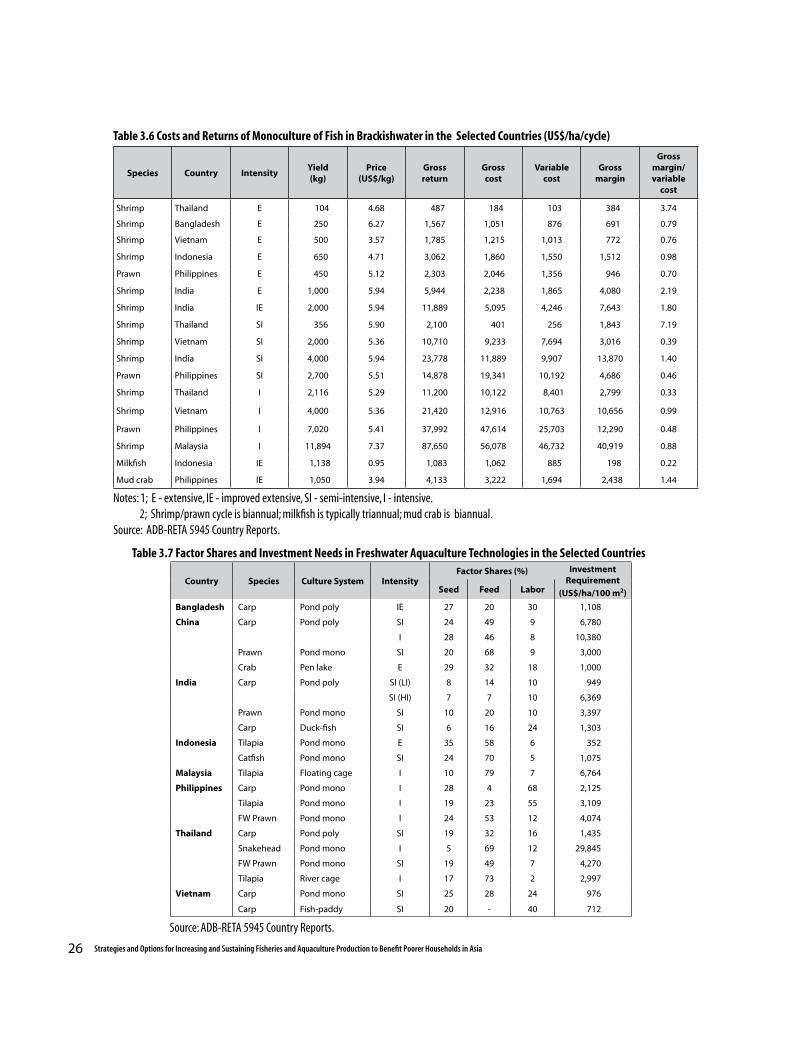
Species Country IntensityYield(kg)
Price(US$/kg)
Grossreturn
Grosscost
Variablecost
Grossmargin
Gross margin/ variable
cost
Shrimp Thailand E 104 4.68 487 184 103 384 3.74
Shrimp Bangladesh E 250 6.27 1,567 1,051 876 691 0.79
Shrimp Vietnam E 500 3.57 1,785 1,215 1,013 772 0.76
Shrimp Indonesia E 650 4.71 3,062 1,860 1,550 1,512 0.98
Prawn Philippines E 450 5.12 2,303 2,046 1,356 946 0.70
Shrimp India E 1,000 5.94 5,944 2,238 1,865 4,080 2.19
Shrimp India IE 2,000 5.94 11,889 5,095 4,246 7,643 1.80
Shrimp Thailand SI 356 5.90 2,100 401 256 1,843 7.19
Shrimp Vietnam SI 2,000 5.36 10,710 9,233 7,694 3,016 0.39
Shrimp India SI 4,000 5.94 23,778 11,889 9,907 13,870 1.40
Prawn Philippines SI 2,700 5.51 14,878 19,341 10,192 4,686 0.46
Shrimp Thailand I 2,116 5.29 11,200 10,122 8,401 2,799 0.33
Shrimp Vietnam I 4,000 5.36 21,420 12,916 10,763 10,656 0.99
Prawn Philippines I 7,020 5.41 37,992 47,614 25,703 12,290 0.48
Shrimp Malaysia I 11,894 7.37 87,650 56,078 46,732 40,919 0.88
Milkfish Indonesia IE 1,138 0.95 1,083 1,062 885 198 0.22
Mud crab Philippines IE 1,050 3.94 4,133 3,222 1,694 2,438 1.44
26 Strategies and Options for Increasing and Sustaining Fisheries and Aquaculture Production to Benefit Poorer Households in Asia
Country Species Culture System IntensityFactor Shares (%) Investment
Requirement(US$/ha/100 m2)Seed Feed Labor
Bangladesh Carp Pond poly IE 27 20 30 1,108
China Carp Pond poly SI 24 49 9 6,780
I 28 46 8 10,380
Prawn Pond mono SI 20 68 9 3,000
Crab Pen lake E 29 32 18 1,000
India Carp Pond poly SI (LI) 8 14 10 949
SI (HI) 7 7 10 6,369
Prawn Pond mono SI 10 20 10 3,397
Carp Duck-fish SI 6 16 24 1,303
Indonesia Tilapia Pond mono E 35 58 6 352
Catfish Pond mono SI 24 70 5 1,075
Malaysia Tilapia Floating cage I 10 79 7 6,764
Philippines Carp Pond mono I 28 4 68 2,125
Tilapia Pond mono I 19 23 55 3,109
FW Prawn Pond mono I 24 53 12 4,074
Thailand Carp Pond poly SI 19 32 16 1,435
Snakehead Pond mono I 5 69 12 29,845
FW Prawn Pond mono SI 19 49 7 4,270
Tilapia River cage I 17 73 2 2,997
Vietnam Carp Pond mono SI 25 28 24 976
Carp Fish-paddy SI 20 - 40 712
Table 3.6 Costs and Returns of Monoculture of Fish in Brackishwater in the Selected Countries (US$/ha/cycle)
Notes: 1; E - extensive, IE - improved extensive, SI - semi-intensive, I - intensive. 2; Shrimp/prawn cycle is biannual; milkfish is typically triannual; mud crab is biannual. Source: ADB-RETA 5945 Country Reports.
Table 3.7 Factor Shares and Investment Needs in Freshwater Aquaculture Technologies in the Selected Countries
Source: ADB-RETA 5945 Country Reports.
27CHAPTER 3 | Profile of Technologies
in the production cost are extensive/improved extensive pond polyculture of carp in Bangladesh, duck-fish culture in India, extensive lake pen culture of crab in China, and semi-intensive pond monoculture of carp and fish-paddy culture in Vietnam.
Brackishwater aquaculture
With respect to factor shares in the brackishwater aquaculture technologies in the nine Asian countries, in almost all cases, the species is shrimp/prawn and the culture system is pond monoculture. Irrespective of the intensity of culture, seed constitutes a major share in the total production cost, except in the case of semi-intensive and intensive shrimp/prawn culture in Vietnam and the Philippines, where seed constitutes relatively a smaller share in the total cost of production.
Moreover, intensive culture is also associated with higher use of feed inputs, as in the case of intensive and semi-intensive shrimp/prawn culture in Malaysia, Vietnam, and the Philippines. In contrast, extensive culture tends to be labor-intensive, as in the cases of extensive pond monoculture and shrimp-rice culture in Bangladesh, and extensive pond monoculture of shrimp in Indonesia and Vietnam.
Policymakers face the challenge of promoting the aquaculture industry without compromising the health of the coastal environment. Coastal shrimp farming is very widespread in Vietnam, Thailand, and China. However, the industry is still in its infant stage in Sri Lanka and India, where 80 percent of the potential aquaculture land remains untapped. Developmental pressures pose an important policy question regarding the zoning of coastal lands for aquaculture and other uses (e.g., crop farming).
Potential and pipeline technologies
Aquaculture technologies currently under development offer great potential for raising productivity and farm incomes. New culture methods are being disseminated, as in India, where the emerging technology is the flow-through aquaculture system. This may mark the beginning of a shift to industrial aquaculture using canal water2. Improved fish strains, particularly carp and tilapia (following the successful development of the GIFT strain) are also being introduced, using conventional breeding. Breeding has been directed primarily towards increasing growth rates, although pest and disease resistance, flesh quality, and other objectives are also being studied. Genetically modified fish and other biotechnology applications are in the pipeline, but considerable work still needs to be done in the area of risk assessment and biosafety regulation.
The biology and economics of new cultured species in various countries are being developed, such as indigenous finfish and freshwater prawns in Sri Lanka, and organic farming of freshwater prawn in Thailand. In commercial shrimp farming, P. vannamei has been introduced as an alternative to P. monodon. Technologies are also being developed on the input side. Malaysia and other countries are aiming to develop indigenous feed sources to substitute for expensive imported fish meal.
Capture Fisheries
In the tropical belt, fishing targets multiple species using multigear and multivessel technologies. Traditional, small-scale, and municipal fisheries are generally limited to nearshore waters and inland waterbodies, and use labor-intensive
2 This was designed by the Central Institute of Freshwater Aquaculture (Saha and Paul 2000).
28 Strategies and Options for Increasing and Sustaining Fisheries and Aquaculture Production to Benefit Poorer Households in Asia
fishing technologies. In most of the countries in the region, traditional fishing technologies are typically family-based, using small non-motorized vessels and fishing gear types, such as beach seines, gill nets, hook and line, traps and other stationary gears, scoop nets, push nets, and cast nets. Industrial, large-scale, and commercial fisheries utilize mechanized boats ranging from 15 to 30 m in length, or from 30 to 600 GT in weight. This type of fisheries employs relatively capital-intensive and high-fishing technologies, such as trawl, long line, push net, and purse seine.
Catalogue of existing fisheries technologies
Classifications of capture fisheries may be based on the type of fishing gear (surrounding net, seine net, trawl, gill net, lift net, trap, hook and line, push net, cast net, scoop net, shell fish collection, and other miscellaneous methods) or type of vessel (fishing without a vessel, non-motorized vessel fishing, motorized vessel fishing, mechanized vessel fishing). All forms of fishing in inland water, brackishwater and coastal waters are confined to single-day fishing operations. Offshore and deep-sea fishing operations are mostly multi-day in nature, extending up to several weeks in some cases. Fishing practices tend to be more diverse in brackish and coastal environments, except in China, where diversity of capture fishing is higher in inland fisheries.
Inland capture fisheries
Some 30 different technologies and 43 practices in inland capture fisheries can be identified (Table 3.9). These may be grouped into three broad categories based on fishing gear types operated, namely, without a vessel, with a vessel, and with a motorized fishing vessel. Up to 90 percent of all
fishing is done with non-motorized vessels. Few details on the sizes of vessels for this sector are available, but from the available information it is clear that the majority of them are small fishing vessels of 3-6 m in length. In some countries, the very poor engage in inland subsistence fishing without a vessel.
Brackishwater and marine capture fisheries
At least 49 technologies and 72 practices can be found in the brackishwater and marine fisheries sectors (Table 3.10). They are grouped under four main categories based on the way they are operated, namely, fishing without a vessel, with a non-motorized vessel, with a motorized vessel, and with a mechanized vessel. In India, Bangladesh, Sri Lanka, Indonesia, Vietnam, and the Philippines, the highest catch comes from non-motorized boats, whereas in Thailand, Malaysia, and China, this comes from motorized boats.
Target species
Major fish groups recorded in the region are listed in Table 3.11. According to the official statistics, there are about 17 broad groups of fish living in the freshwater environment. Species diversity is very high in some countries; for instance, in China, over 800 freshwater species are recorded. Meanwhile, species diversity is also evident in tropical coastal waters. In Bangladesh, there are 511 species, of which 475 are fish and 36 are shrimp species. Of all these species, however, only 40-50 are important to commercial fishery.
In most of the countries, fishing technologies are well-developed, targeting high-value species, such as Penaeid shrimps, lobsters, crabs, and squids. Some tuna and other large pelagics are less
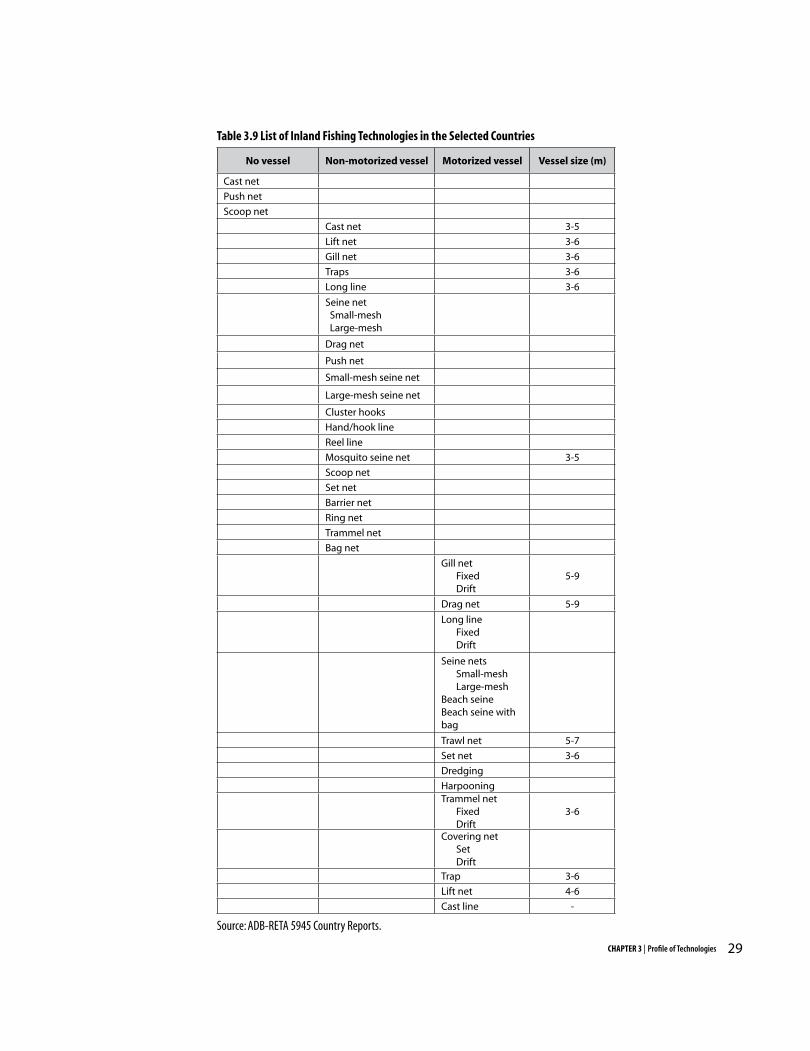
29CHAPTER 3 | Profile of Technologies
No vessel Non-motorized vessel Motorized vessel Vessel size (m)
Cast net
Push net
Scoop net
Cast net 3-5
Lift net 3-6
Gill net 3-6
Traps 3-6
Long line 3-6
Seine net Small-mesh Large-mesh
Drag net
Push net
Small-mesh seine net
Large-mesh seine net
Cluster hooks
Hand/hook line
Reel line
Mosquito seine net 3-5
Scoop net
Set net
Barrier net
Ring net
Trammel net
Bag net
Gill netFixedDrift
5-9
Drag net 5-9
Long lineFixedDrift
Seine netsSmall-meshLarge-mesh
Beach seineBeach seine with bag
Trawl net 5-7
Set net 3-6
Dredging
HarpooningTrammel net
FixedDrift
3-6
Covering netSetDrift
Trap 3-6
Lift net 4-6
Cast line -
Table 3.9 List of Inland Fishing Technologies in the Selected Countries
Source: ADB-RETA 5945 Country Reports.

Table 3.10 Fishing Gear Types Operated in the Brackish- and Marine Waters of the Selected Countries
30 Strategies and Options for Increasing and Sustaining Fisheries and Aquaculture Production to Benefit Poorer Households in Asia
Without vessel
With non-motorized
vessel
With motorized
vessel
With mechanized
vessel
Vessel length
(m)
Vessel HP
Country
Angling
Cast net
Push net
Drag net
Drag net 3-5
Cast net 3-5
Push net Small
Sluice gate netting
3-6
Gill net BSGN 4-6
Surrounding net Small
Hook and line Small
Fish trap Small
Beach seine Small -
Estuarine set bag net
Small
Trammel net Small
Trawl net 8-9
Cast net 6-10 25-40
Push net Medium 25-40
Gill net 9-12 10-25
Surroundingnet
Small 15-40
Hook and line/ hand line
Small 10-40
Fish trap 6-9 10-40
Bag net ESBN MSBN LMSBN FBN
Shore seine 4-11
Purse seine 15-40
Pole and line 15-40
Squid jigging 15-40
Trawl net 10-40 10-40
Long line Small 10-40
Bottom long line Small 10-40
Boat seine Small 25-40
Lift net Small 10-40
Ring net 8-20 85-120
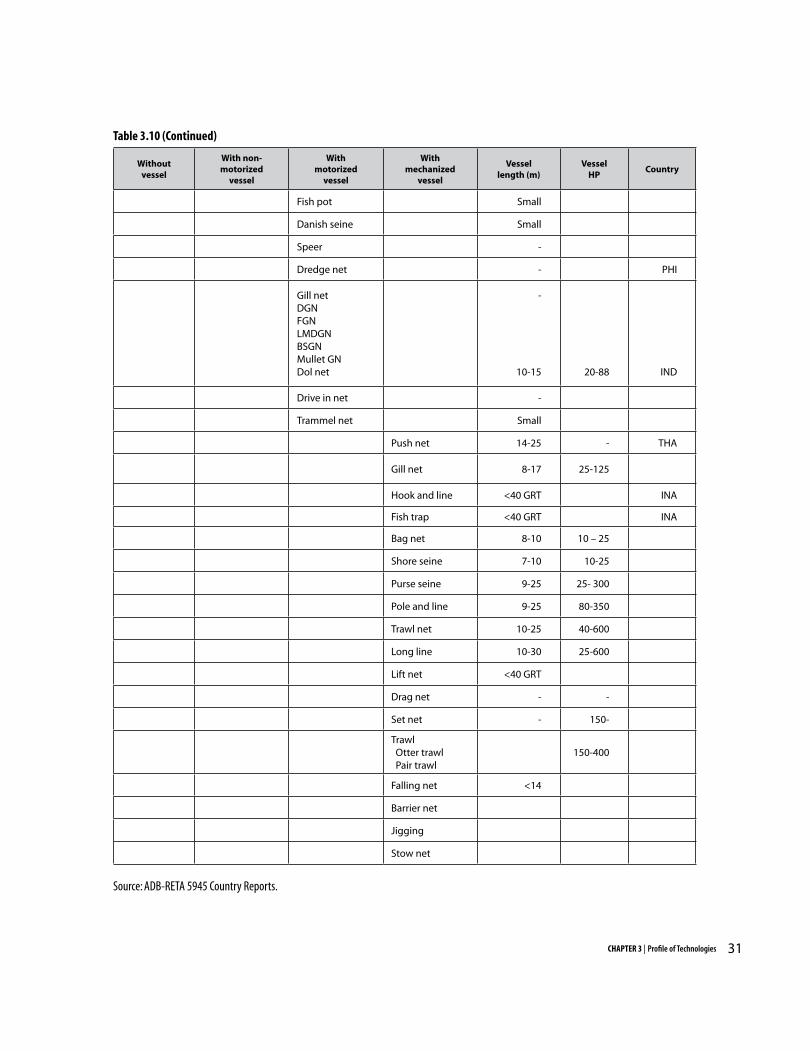
Table 3.10 (Continued)
Without vessel
With non-motorized
vessel
With motorized
vessel
With mechanized
vessel
Vessel length (m)
Vessel HP
Country
Fish pot Small
Danish seine Small
Speer -
Dredge net - PHI
Gill netDGNFGNLMDGNBSGNMullet GNDol net
-
10-15 20-88 IND
Drive in net -
Trammel net Small
Push net 14-25 - THA
Gill net 8-17 25-125
Hook and line <40 GRT INA
Fish trap <40 GRT INA
Bag net 8-10 10 – 25
Shore seine 7-10 10-25
Purse seine 9-25 25- 300
Pole and line 9-25 80-350
Trawl net 10-25 40-600
Long line 10-30 25-600
Lift net <40 GRT
Drag net - -
Set net - 150-
Trawl Otter trawl Pair trawl
150-400
Falling net <14
Barrier net
Jigging
Stow net
31CHAPTER 3 | Profile of Technologies
Source: ADB-RETA 5945 Country Reports.
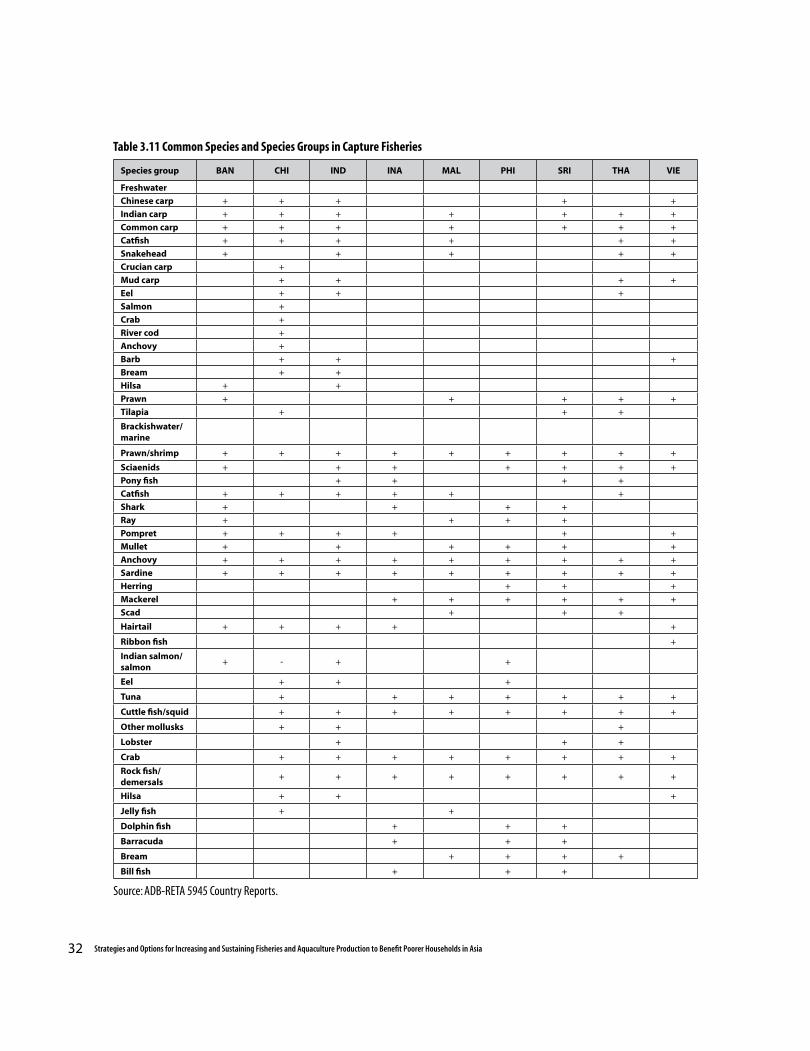
32 Strategies and Options for Increasing and Sustaining Fisheries and Aquaculture Production to Benefit Poorer Households in Asia
Species group BAN CHI IND INA MAL PHI SRI THA VIE
Freshwater
Chinese carp + + + + +
Indian carp + + + + + + +
Common carp + + + + + + +
Catfish + + + + + +
Snakehead + + + + +
Crucian carp +
Mud carp + + + +
Eel + + +
Salmon +
Crab +
River cod +
Anchovy +
Barb + + +
Bream + +
Hilsa + +
Prawn + + + + +
Tilapia + + +
Brackishwater/marine
Prawn/shrimp + + + + + + + + +
Sciaenids + + + + + + +
Pony fish + + + +
Catfish + + + + + +
Shark + + + +
Ray + + + +
Pompret + + + + + +
Mullet + + + + + +
Anchovy + + + + + + + + +
Sardine + + + + + + + + +
Herring + + +
Mackerel + + + + + +
Scad + + +
Hairtail + + + + +
Ribbon fish +
Indian salmon/salmon
+ - + +
Eel + + +
Tuna + + + + + + +
Cuttle fish/squid + + + + + + + +
Other mollusks + + +
Lobster + + +
Crab + + + + + + + +
Rock fish/demersals
+ + + + + + + +
Hilsa + + +
Jelly fish + +
Dolphin fish + + +
Barracuda + + +
Bream + + + +
Bill fish + + +
Table 3.11 Common Species and Species Groups in Capture Fisheries
Source: ADB-RETA 5945 Country Reports.
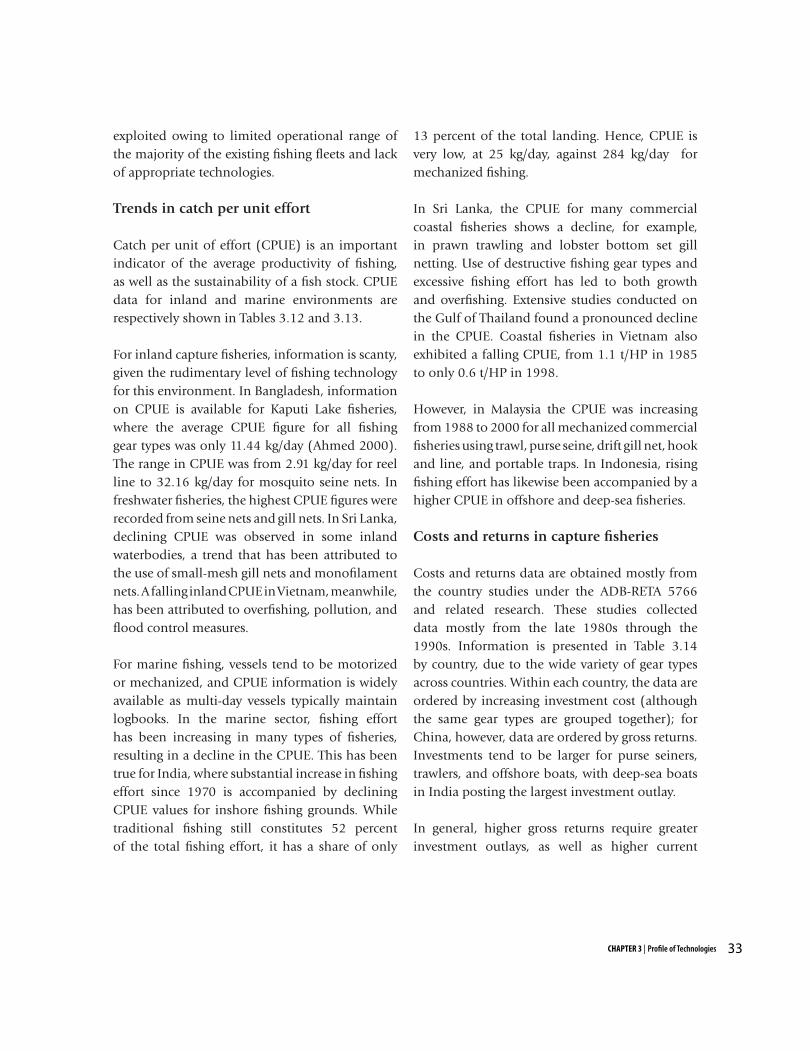
33CHAPTER 3 | Profile of Technologies
exploited owing to limited operational range of the majority of the existing fishing fleets and lack of appropriate technologies.
Trends in catch per unit effort
Catch per unit of effort (CPUE) is an important indicator of the average productivity of fishing, as well as the sustainability of a fish stock. CPUE data for inland and marine environments are respectively shown in Tables 3.12 and 3.13.
For inland capture fisheries, information is scanty, given the rudimentary level of fishing technology for this environment. In Bangladesh, information on CPUE is available for Kaputi Lake fisheries, where the average CPUE figure for all fishing gear types was only 11.44 kg/day (Ahmed 2000). The range in CPUE was from 2.91 kg/day for reel line to 32.16 kg/day for mosquito seine nets. In freshwater fisheries, the highest CPUE figures were recorded from seine nets and gill nets. In Sri Lanka, declining CPUE was observed in some inland waterbodies, a trend that has been attributed to the use of small-mesh gill nets and monofilament nets. A falling inland CPUE in Vietnam, meanwhile, has been attributed to overfishing, pollution, and flood control measures.
For marine fishing, vessels tend to be motorized or mechanized, and CPUE information is widely available as multi-day vessels typically maintain logbooks. In the marine sector, fishing effort has been increasing in many types of fisheries, resulting in a decline in the CPUE. This has been true for India, where substantial increase in fishing effort since 1970 is accompanied by declining CPUE values for inshore fishing grounds. While traditional fishing still constitutes 52 percent of the total fishing effort, it has a share of only
13 percent of the total landing. Hence, CPUE is very low, at 25 kg/day, against 284 kg/day for mechanized fishing.
In Sri Lanka, the CPUE for many commercial coastal fisheries shows a decline, for example, in prawn trawling and lobster bottom set gill netting. Use of destructive fishing gear types and excessive fishing effort has led to both growth and overfishing. Extensive studies conducted on the Gulf of Thailand found a pronounced decline in the CPUE. Coastal fisheries in Vietnam also exhibited a falling CPUE, from 1.1 t/HP in 1985 to only 0.6 t/HP in 1998.
However, in Malaysia the CPUE was increasing from 1988 to 2000 for all mechanized commercial fisheries using trawl, purse seine, drift gill net, hook and line, and portable traps. In Indonesia, rising fishing effort has likewise been accompanied by a higher CPUE in offshore and deep-sea fisheries.
Costs and returns in capture fisheries
Costs and returns data are obtained mostly from the country studies under the ADB-RETA 5766 and related research. These studies collected data mostly from the late 1980s through the 1990s. Information is presented in Table 3.14 by country, due to the wide variety of gear types across countries. Within each country, the data are ordered by increasing investment cost (although the same gear types are grouped together); for China, however, data are ordered by gross returns. Investments tend to be larger for purse seiners, trawlers, and offshore boats, with deep-sea boats in India posting the largest investment outlay.
In general, higher gross returns require greater investment outlays, as well as higher current
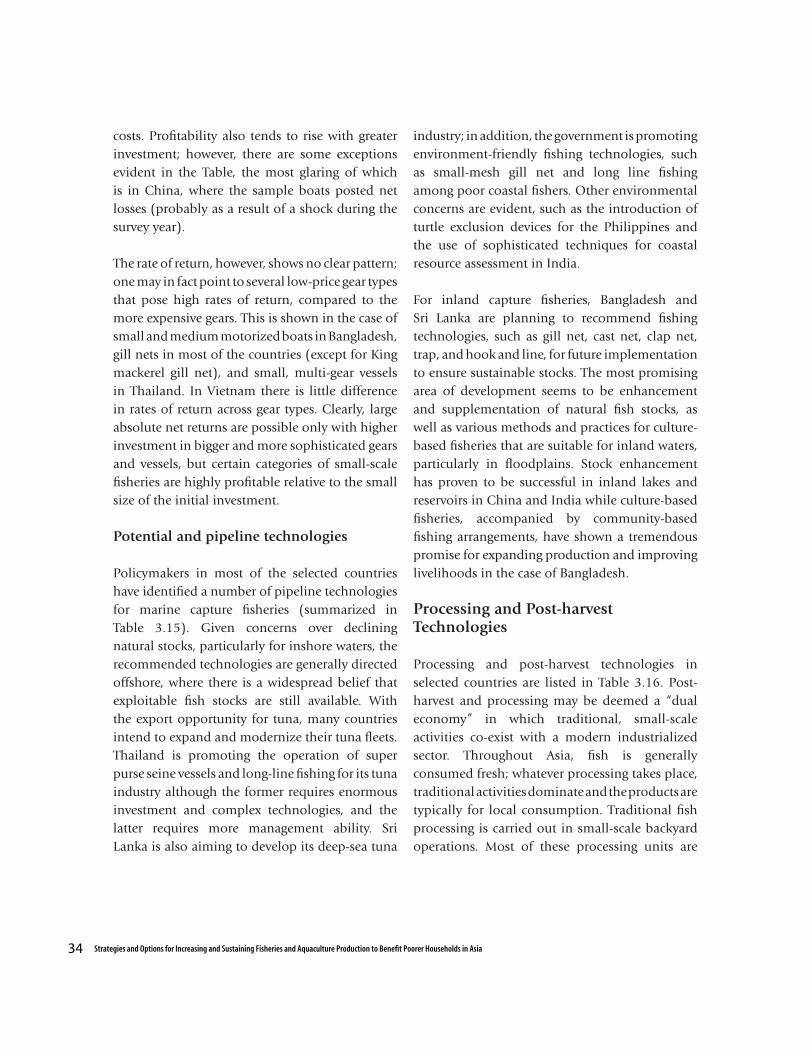
34 Strategies and Options for Increasing and Sustaining Fisheries and Aquaculture Production to Benefit Poorer Households in Asia
costs. Profitability also tends to rise with greater investment; however, there are some exceptions evident in the Table, the most glaring of which is in China, where the sample boats posted net losses (probably as a result of a shock during the survey year).
The rate of return, however, shows no clear pattern; one may in fact point to several low-price gear types that pose high rates of return, compared to the more expensive gears. This is shown in the case of small and medium motorized boats in Bangladesh, gill nets in most of the countries (except for King mackerel gill net), and small, multi-gear vessels in Thailand. In Vietnam there is little difference in rates of return across gear types. Clearly, large absolute net returns are possible only with higher investment in bigger and more sophisticated gears and vessels, but certain categories of small-scale fisheries are highly profitable relative to the small size of the initial investment.
Potential and pipeline technologies
Policymakers in most of the selected countries have identified a number of pipeline technologies for marine capture fisheries (summarized in Table 3.15). Given concerns over declining natural stocks, particularly for inshore waters, the recommended technologies are generally directed offshore, where there is a widespread belief that exploitable fish stocks are still available. With the export opportunity for tuna, many countries intend to expand and modernize their tuna fleets. Thailand is promoting the operation of super purse seine vessels and long-line fishing for its tuna industry although the former requires enormous investment and complex technologies, and the latter requires more management ability. Sri Lanka is also aiming to develop its deep-sea tuna
industry; in addition, the government is promoting environment-friendly fishing technologies, such as small-mesh gill net and long line fishing among poor coastal fishers. Other environmental concerns are evident, such as the introduction of turtle exclusion devices for the Philippines and the use of sophisticated techniques for coastal resource assessment in India.
For inland capture fisheries, Bangladesh and Sri Lanka are planning to recommend fishing technologies, such as gill net, cast net, clap net, trap, and hook and line, for future implementation to ensure sustainable stocks. The most promising area of development seems to be enhancement and supplementation of natural fish stocks, as well as various methods and practices for culture-based fisheries that are suitable for inland waters, particularly in floodplains. Stock enhancement has proven to be successful in inland lakes and reservoirs in China and India while culture-based fisheries, accompanied by community-based fishing arrangements, have shown a tremendous promise for expanding production and improving livelihoods in the case of Bangladesh.
Processing and Post-harvest Technologies
Processing and post-harvest technologies in selected countries are listed in Table 3.16. Post-harvest and processing may be deemed a “dual economy” in which traditional, small-scale activities co-exist with a modern industrialized sector. Throughout Asia, fish is generally consumed fresh; whatever processing takes place, traditional activities dominate and the products are typically for local consumption. Traditional fish processing is carried out in small-scale backyard operations. Most of these processing units are
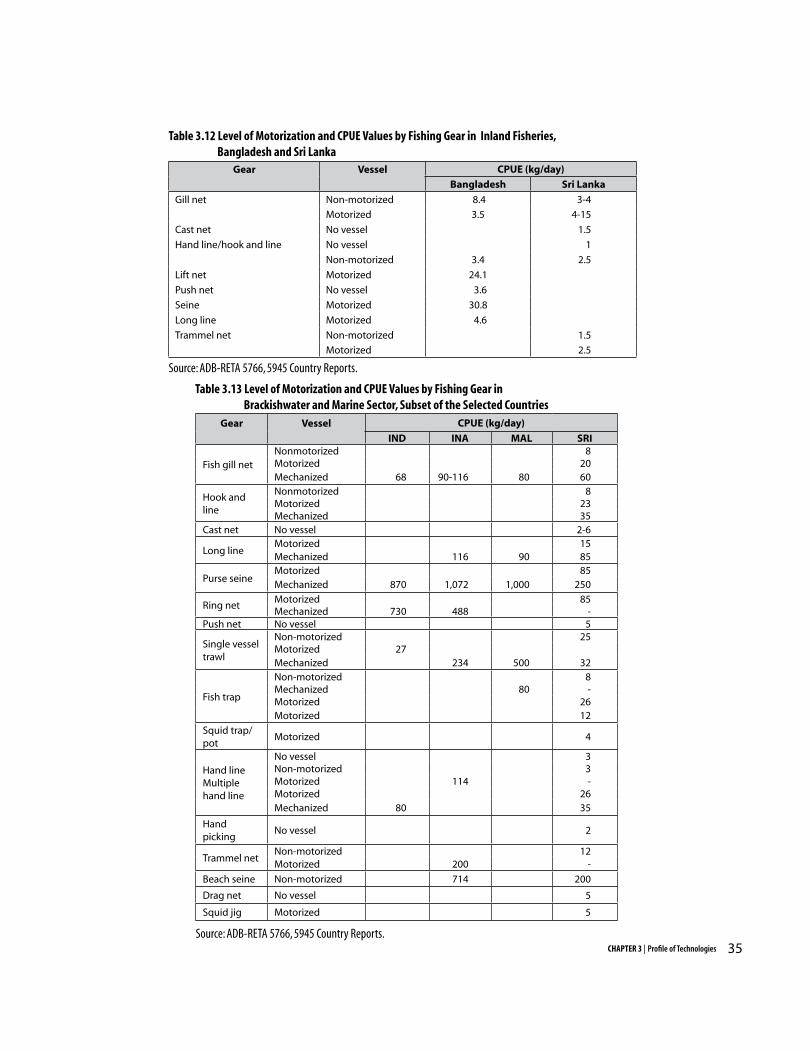
Gear Vessel CPUE (kg/day)
IND INA MAL SRI
Fish gill netNonmotorized 8Motorized 20Mechanized 68 90-116 80 60
Hook and line
Nonmotorized 8Motorized 23Mechanized 35
Cast net No vessel 2-6
Long lineMotorized 15Mechanized 116 90 85
Purse seineMotorized 85Mechanized 870 1,072 1,000 250
Ring netMotorized 85Mechanized 730 488 -
Push net No vessel 5
Single vessel trawl
Non-motorized 25Motorized 27Mechanized 234 500 32
Fish trap
Non-motorized 8Mechanized 80 -Motorized 26Motorized 12
Squid trap/pot
Motorized 4
Hand lineMultiple hand line
No vessel 3Non-motorized 3Motorized 114 -Motorized 26Mechanized 80 35
Hand picking
No vessel 2
Trammel netNon-motorized 12Motorized 200 -
Beach seine Non-motorized 714 200
Drag net No vessel 5
Squid jig Motorized 5
35CHAPTER 3 | Profile of Technologies
Gear Vessel CPUE (kg/day)
Bangladesh Sri Lanka
Gill net Non-motorized 8.4 3-4
Motorized 3.5 4-15
Cast net No vessel 1.5
Hand line/hook and line No vessel 1
Non-motorized 3.4 2.5
Lift net Motorized 24.1
Push net No vessel 3.6
Seine Motorized 30.8
Long line Motorized 4.6
Trammel net Non-motorized 1.5
Motorized 2.5
Table 3.12 Level of Motorization and CPUE Values by Fishing Gear in Inland Fisheries, Bangladesh and Sri Lanka
Source: ADB-RETA 5766, 5945 Country Reports.
Source: ADB-RETA 5766, 5945 Country Reports.
Table 3.13 Level of Motorization and CPUE Values by Fishing Gear in Brackishwater and Marine Sector, Subset of the Selected Countries
36 Strategies and Options for Increasing and Sustaining Fisheries and Aquaculture Production to Benefit Poorer Households in Asia
located in coastal areas close to fish landing ports, often with family labor tapped for the activities. The processing industry is characterized by the application of low-level technology, thus producing relatively poor-quality, low-value products. Traditional processing and post-harvest treatment methods include sun-drying, salting and drying, smoking, curing, and making fish sauce and fish paste. Modern processing and post-harvest handling have recently developed in response to a growing export market and rising living standards. Icing, freezing, and canning are popular modern technologies.
In countries where export of fisheries products is predominant, such as Bangladesh, India, Indonesia, the Philippines, Thailand, and Vietnam, processing and post-harvest technology is in line with the demand of importing countries. For instance, production of ready-made food, such as fish finger/cutlet, prawn tempura, canned seafood soup, sandwich spreads, and TV dinners, has become popular. In addition, ethnic Asians in developed countries have stimulated demand for more traditional products such as fish sauce, fish/shrimp paste, and fermented fish. There is great diversity in traditional technologies across countries. As modern technologies are mainly applied to export products, they are fairly standardized across countries.
Traditional processing is even more widespread for inland capture fisheries than for marine fisheries. The case of Sri Lanka may serve as a typical example. Fish caught from inland reservoirs is sold fresh at fish landing sites. Ice is not normally available in most of the remote areas; so the fish is not chilled but simply carried in noninsulated boxes for sale the same morning while it is still fresh. Ice is used at bigger landing sites. There are
practically no freezing or cold storage facilities for fish in inland areas. Virtually no processing is done on freshwater fish as there are no surpluses in production and hardly any spoiled fish on landing. The few who process fish do so on a limited scale, using traditional methods such as smoking, drying, and curing.
Traditional processes result in products that meet domestic food needs and require minimal investments; hence, these activities are undertaken by the poor, many of whom are women. However, unlike in modern processing business, value added tends to be very small, and the products handled and processed by traditional means are unable to enter world markets. This characterizes a bulk of production carried out in aquaculture and capture areas of the region, with the exception of high-value species (e.g., shrimp and tuna). Thailand has an advanced post-harvest and processing sector in the region. Unlike in other countries, a large proportion of fish production is processed, showing a thriving downstream sector. About 30 percent of the marine fish catch is trash fish; this is used mainly as raw material in fish meal industry. Of the remaining amount (70 percent of the catch) , 80 percent is processed while 20 percent is used as food fish. Meanwhile, all freshwater fish is used as food fish, some in processed form. Evidence of the replacement of traditional technologies by modern ones in recent decades may be seen in Table 3.17.
Both basic labor-intensive and advanced automation technologies are employed to produce a wide variety of frozen fish products. These products are manufactured in large factories, each employing 100-2,000 workers. The frozen products include shrimp, fish fillet, surimi and surimi-based products, and fish sausage and ham.
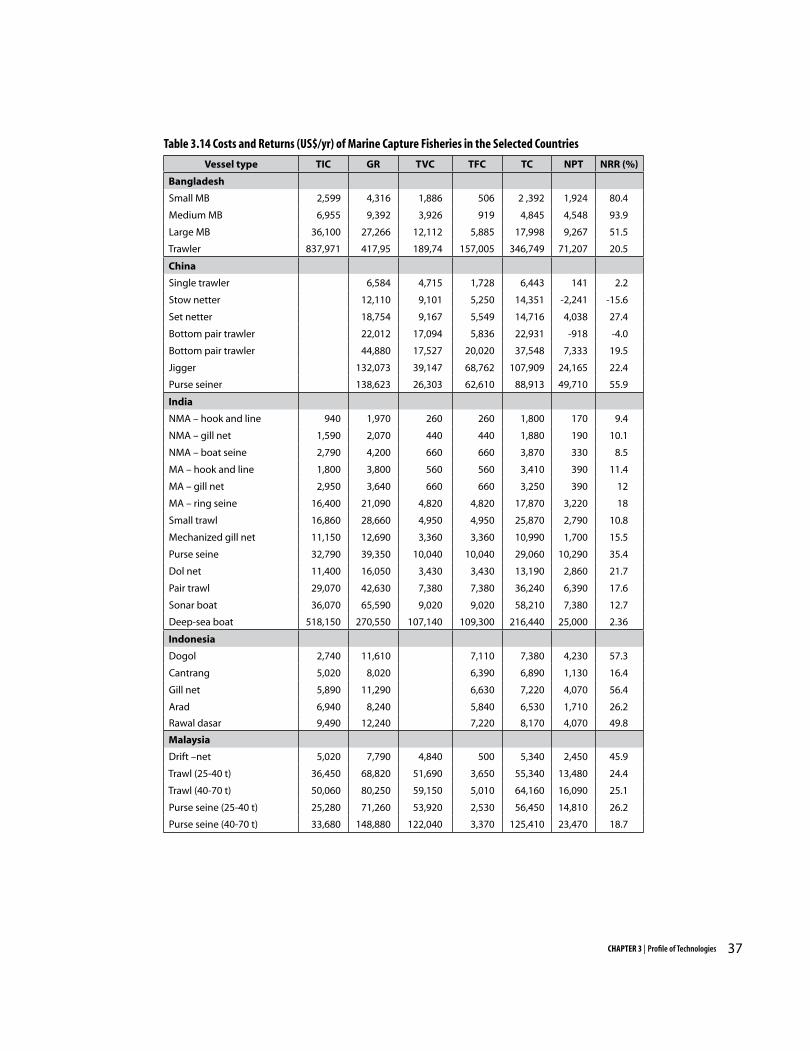
Vessel type TIC GR TVC TFC TC NPT NRR (%)
Bangladesh
Small MB 2,599 4,316 1,886 506 2 ,392 1,924 80.4
Medium MB 6,955 9,392 3,926 919 4,845 4,548 93.9
Large MB 36,100 27,266 12,112 5,885 17,998 9,267 51.5
Trawler 837,971 417,95 189,74 157,005 346,749 71,207 20.5
China
Single trawler 6,584 4,715 1,728 6,443 141 2.2
Stow netter 12,110 9,101 5,250 14,351 -2,241 -15.6
Set netter 18,754 9,167 5,549 14,716 4,038 27.4
Bottom pair trawler 22,012 17,094 5,836 22,931 -918 -4.0
Bottom pair trawler 44,880 17,527 20,020 37,548 7,333 19.5
Jigger 132,073 39,147 68,762 107,909 24,165 22.4
Purse seiner 138,623 26,303 62,610 88,913 49,710 55.9
India
NMA – hook and line 940 1,970 260 260 1,800 170 9.4
NMA – gill net 1,590 2,070 440 440 1,880 190 10.1
NMA – boat seine 2,790 4,200 660 660 3,870 330 8.5
MA – hook and line 1,800 3,800 560 560 3,410 390 11.4
MA – gill net 2,950 3,640 660 660 3,250 390 12
MA – ring seine 16,400 21,090 4,820 4,820 17,870 3,220 18
Small trawl 16,860 28,660 4,950 4,950 25,870 2,790 10.8
Mechanized gill net 11,150 12,690 3,360 3,360 10,990 1,700 15.5
Purse seine 32,790 39,350 10,040 10,040 29,060 10,290 35.4
Dol net 11,400 16,050 3,430 3,430 13,190 2,860 21.7
Pair trawl 29,070 42,630 7,380 7,380 36,240 6,390 17.6
Sonar boat 36,070 65,590 9,020 9,020 58,210 7,380 12.7
Deep-sea boat 518,150 270,550 107,140 109,300 216,440 25,000 2.36
Indonesia
Dogol 2,740 11,610 7,110 7,380 4,230 57.3
Cantrang 5,020 8,020 6,390 6,890 1,130 16.4
Gill net 5,890 11,290 6,630 7,220 4,070 56.4
Arad 6,940 8,240 5,840 6,530 1,710 26.2
Rawal dasar 9,490 12,240 7,220 8,170 4,070 49.8
Malaysia
Drift –net 5,020 7,790 4,840 500 5,340 2,450 45.9
Trawl (25-40 t) 36,450 68,820 51,690 3,650 55,340 13,480 24.4
Trawl (40-70 t) 50,060 80,250 59,150 5,010 64,160 16,090 25.1
Purse seine (25-40 t) 25,280 71,260 53,920 2,530 56,450 14,810 26.2
Purse seine (40-70 t) 33,680 148,880 122,040 3,370 125,410 23,470 18.7
37CHAPTER 3 | Profile of Technologies
Table 3.14 Costs and Returns (US$/yr) of Marine Capture Fisheries in the Selected Countries
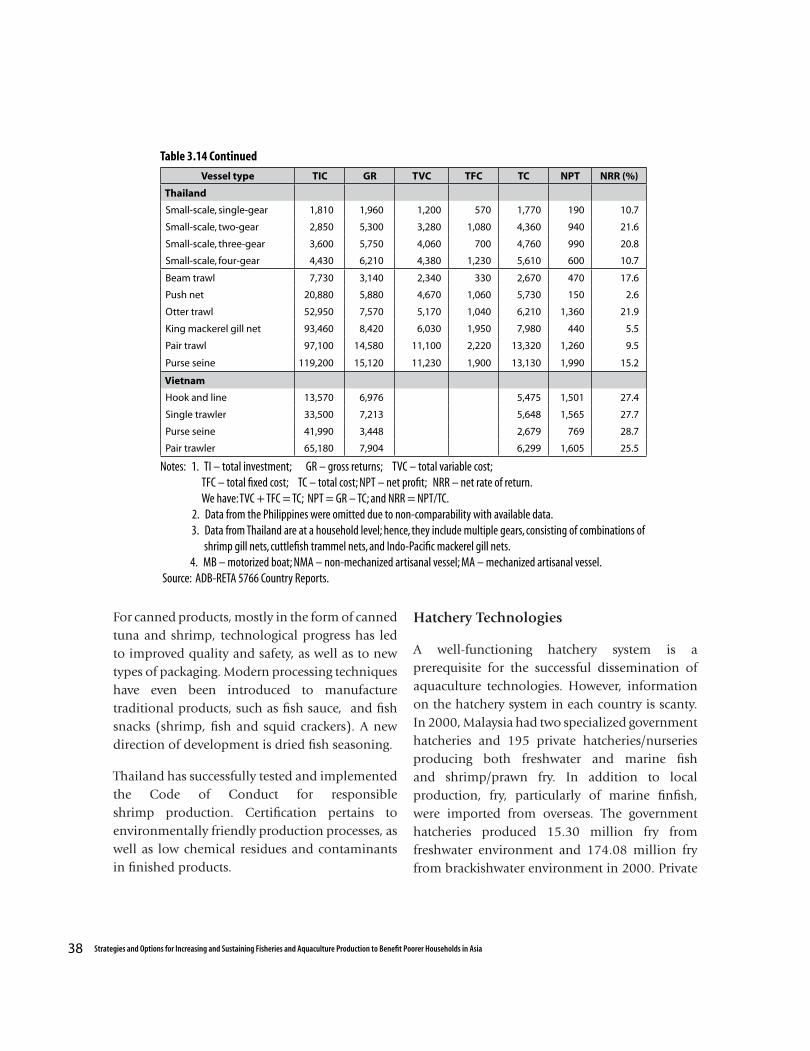
38 Strategies and Options for Increasing and Sustaining Fisheries and Aquaculture Production to Benefit Poorer Households in Asia
Vessel type TIC GR TVC TFC TC NPT NRR (%)
Thailand
Small-scale, single-gear 1,810 1,960 1,200 570 1,770 190 10.7
Small-scale, two-gear 2,850 5,300 3,280 1,080 4,360 940 21.6
Small-scale, three-gear 3,600 5,750 4,060 700 4,760 990 20.8
Small-scale, four-gear 4,430 6,210 4,380 1,230 5,610 600 10.7
Beam trawl 7,730 3,140 2,340 330 2,670 470 17.6
Push net 20,880 5,880 4,670 1,060 5,730 150 2.6
Otter trawl 52,950 7,570 5,170 1,040 6,210 1,360 21.9
King mackerel gill net 93,460 8,420 6,030 1,950 7,980 440 5.5
Pair trawl 97,100 14,580 11,100 2,220 13,320 1,260 9.5
Purse seine 119,200 15,120 11,230 1,900 13,130 1,990 15.2
Vietnam
Hook and line 13,570 6,976 5,475 1,501 27.4
Single trawler 33,500 7,213 5,648 1,565 27.7
Purse seine 41,990 3,448 2,679 769 28.7
Pair trawler 65,180 7,904 6,299 1,605 25.5
.
Table 3.14 Continued
Notes: 1. TI – total investment; GR – gross returns; TVC – total variable cost; TFC – total fixed cost; TC – total cost; NPT – net profit; NRR – net rate of return. We have: TVC + TFC = TC; NPT = GR – TC; and NRR = NPT/TC. 2. Data from the Philippines were omitted due to non-comparability with available data. 3. Data from Thailand are at a household level; hence, they include multiple gears, consisting of combinations of shrimp gill nets, cuttlefish trammel nets, and Indo-Pacific mackerel gill nets. 4. MB – motorized boat; NMA – non-mechanized artisanal vessel; MA – mechanized artisanal vessel. Source: ADB-RETA 5766 Country Reports.
For canned products, mostly in the form of canned tuna and shrimp, technological progress has led to improved quality and safety, as well as to new types of packaging. Modern processing techniques have even been introduced to manufacture traditional products, such as fish sauce, and fish snacks (shrimp, fish and squid crackers). A new direction of development is dried fish seasoning.
Thailand has successfully tested and implemented the Code of Conduct for responsible shrimp production. Certification pertains to environmentally friendly production processes, as well as low chemical residues and contaminants in finished products.
Hatchery Technologies
A well-functioning hatchery system is a prerequisite for the successful dissemination of aquaculture technologies. However, information on the hatchery system in each country is scanty. In 2000, Malaysia had two specialized government hatcheries and 195 private hatcheries/nurseries producing both freshwater and marine fish and shrimp/prawn fry. In addition to local production, fry, particularly of marine finfish, were imported from overseas. The government hatcheries produced 15.30 million fry from freshwater environment and 174.08 million fry from brackishwater environment in 2000. Private
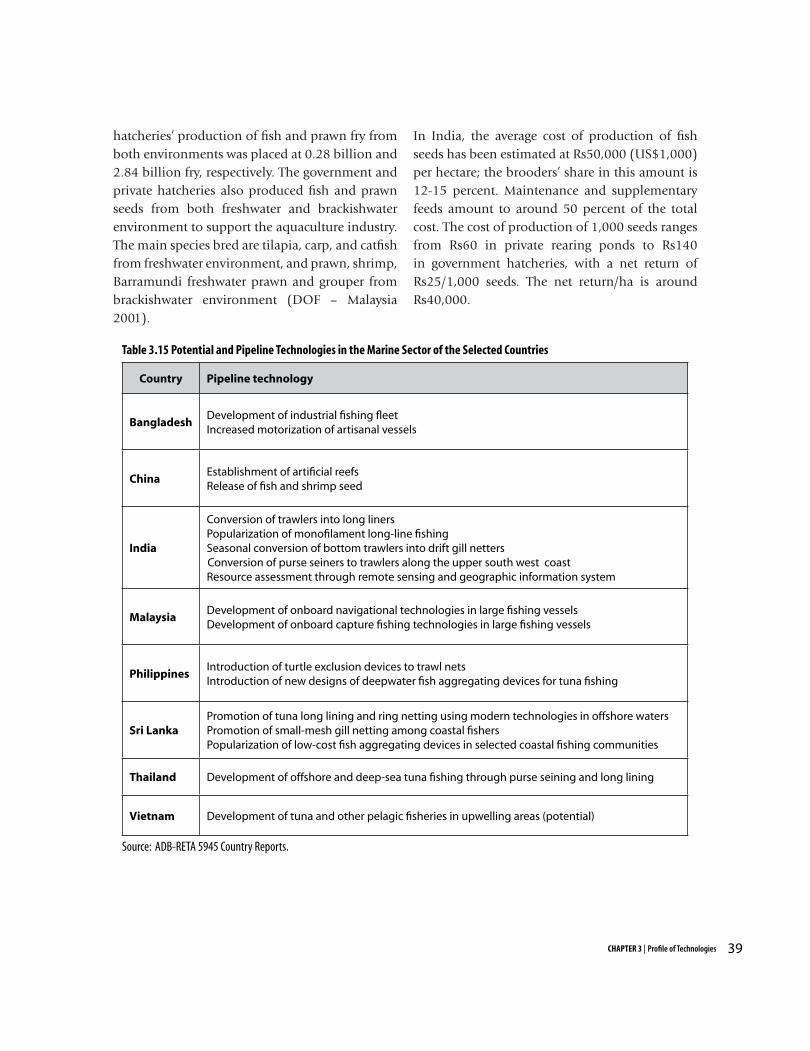
39CHAPTER 3 | Profile of Technologies
Country Pipeline technology
BangladeshDevelopment of industrial fishing fleetIncreased motorization of artisanal vessels
ChinaEstablishment of artificial reefsRelease of fish and shrimp seed
India
Conversion of trawlers into long liners Popularization of monofilament long-line fishingSeasonal conversion of bottom trawlers into drift gill nettersConversion of purse seiners to trawlers along the upper south west coastResource assessment through remote sensing and geographic information system
MalaysiaDevelopment of onboard navigational technologies in large fishing vesselsDevelopment of onboard capture fishing technologies in large fishing vessels
PhilippinesIntroduction of turtle exclusion devices to trawl netsIntroduction of new designs of deepwater fish aggregating devices for tuna fishing
Sri LankaPromotion of tuna long lining and ring netting using modern technologies in offshore watersPromotion of small-mesh gill netting among coastal fishersPopularization of low-cost fish aggregating devices in selected coastal fishing communities
Thailand Development of offshore and deep-sea tuna fishing through purse seining and long lining
Vietnam Development of tuna and other pelagic fisheries in upwelling areas (potential)
Table 3.15 Potential and Pipeline Technologies in the Marine Sector of the Selected Countries
Source: ADB-RETA 5945 Country Reports.
hatcheries’ production of fish and prawn fry from both environments was placed at 0.28 billion and 2.84 billion fry, respectively. The government and private hatcheries also produced fish and prawn seeds from both freshwater and brackishwater environment to support the aquaculture industry. The main species bred are tilapia, carp, and catfish from freshwater environment, and prawn, shrimp, Barramundi freshwater prawn and grouper from brackishwater environment (DOF – Malaysia 2001).
In India, the average cost of production of fish seeds has been estimated at Rs50,000 (US$1,000) per hectare; the brooders’ share in this amount is 12-15 percent. Maintenance and supplementary feeds amount to around 50 percent of the total cost. The cost of production of 1,000 seeds ranges from Rs60 in private rearing ponds to Rs140 in government hatcheries, with a net return of Rs25/1,000 seeds. The net return/ha is around Rs40,000.
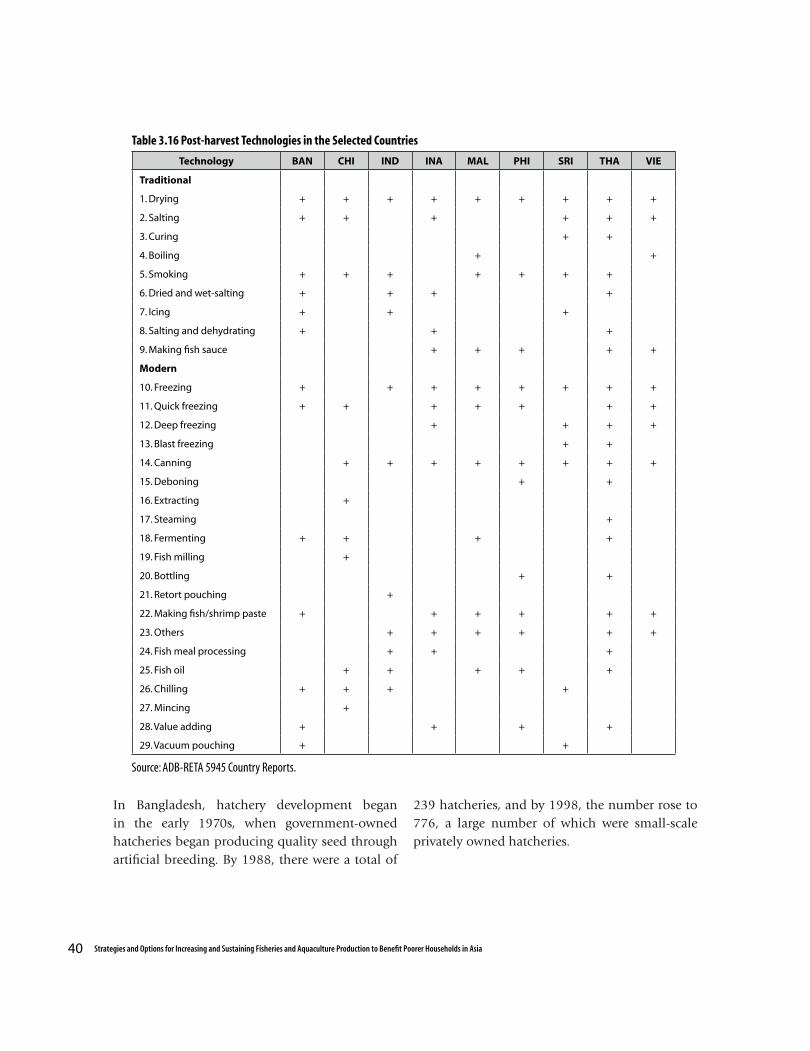
40 Strategies and Options for Increasing and Sustaining Fisheries and Aquaculture Production to Benefit Poorer Households in Asia
Table 3.16 Post-harvest Technologies in the Selected Countries
Technology BAN CHI IND INA MAL PHI SRI THA VIE
Traditional
1. Drying + + + + + + + + +
2. Salting + + + + + +
3. Curing + +
4. Boiling + +
5. Smoking + + + + + + +
6. Dried and wet-salting + + + +
7. Icing + + +
8. Salting and dehydrating + + +
9. Making fish sauce + + + + +
Modern
10. Freezing + + + + + + + +
11. Quick freezing + + + + + + +
12. Deep freezing + + + +
13. Blast freezing + +
14. Canning + + + + + + + +
15. Deboning + +
16. Extracting +
17. Steaming +
18. Fermenting + + + +
19. Fish milling +
20. Bottling + +
21. Retort pouching +
22. Making fish/shrimp paste + + + + + +
23. Others + + + + + +
24. Fish meal processing + + +
25. Fish oil + + + + +
26. Chilling + + + +
27. Mincing +
28. Value adding + + + +
29. Vacuum pouching + +
Source: ADB-RETA 5945 Country Reports.
In Bangladesh, hatchery development began in the early 1970s, when government-owned hatcheries began producing quality seed through artificial breeding. By 1988, there were a total of
239 hatcheries, and by 1998, the number rose to 776, a large number of which were small-scale privately owned hatcheries.
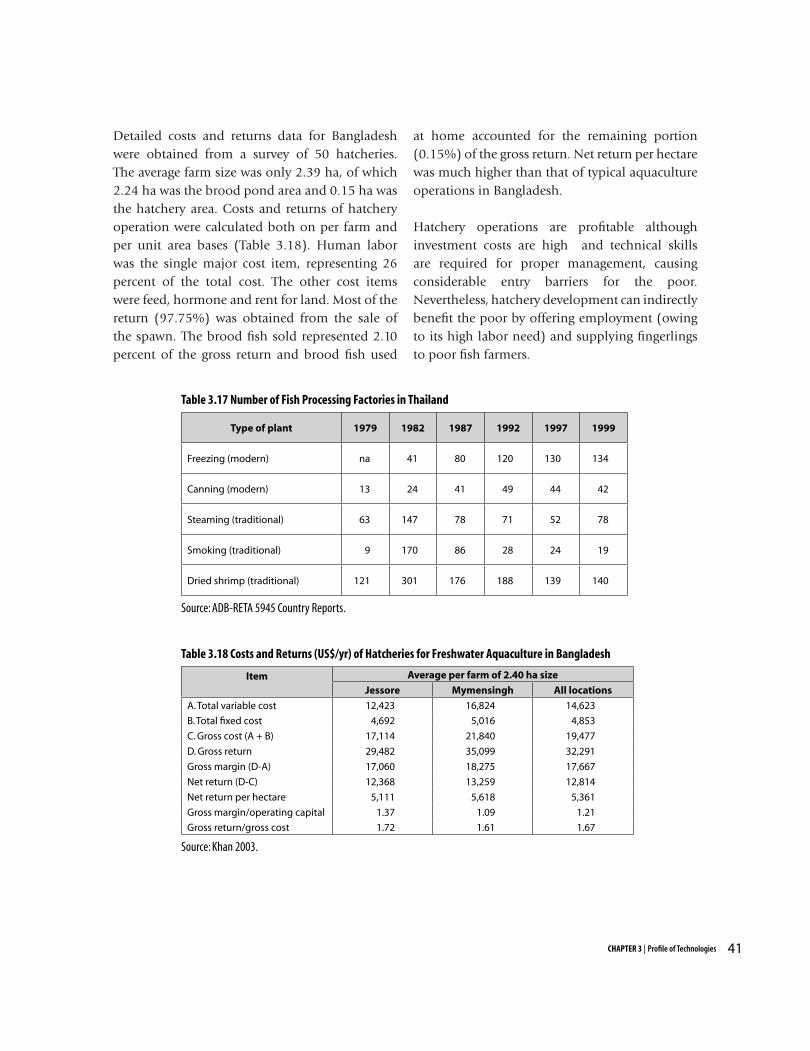
41CHAPTER 3 | Profile of Technologies
Type of plant 1979 1982 1987 1992 1997 1999
Freezing (modern) na 41 80 120 130 134
Canning (modern) 13 24 41 49 44 42
Steaming (traditional) 63 147 78 71 52 78
Smoking (traditional) 9 170 86 28 24 19
Dried shrimp (traditional) 121 301 176 188 139 140
Table 3.17 Number of Fish Processing Factories in Thailand
Source: ADB-RETA 5945 Country Reports.
Item Average per farm of 2.40 ha size
Jessore Mymensingh All locations
A. Total variable cost 12,423 16,824 14,623
B. Total fixed cost 4,692 5,016 4,853
C. Gross cost (A + B) 17,114 21,840 19,477
D. Gross return 29,482 35,099 32,291
Gross margin (D-A) 17,060 18,275 17,667
Net return (D-C) 12,368 13,259 12,814
Net return per hectare 5,111 5,618 5,361
Gross margin/operating capital 1.37 1.09 1.21
Gross return/gross cost 1.72 1.61 1.67
Table 3.18 Costs and Returns (US$/yr) of Hatcheries for Freshwater Aquaculture in Bangladesh
Source: Khan 2003.
Detailed costs and returns data for Bangladesh were obtained from a survey of 50 hatcheries. The average farm size was only 2.39 ha, of which 2.24 ha was the brood pond area and 0.15 ha was the hatchery area. Costs and returns of hatchery operation were calculated both on per farm and per unit area bases (Table 3.18). Human labor was the single major cost item, representing 26 percent of the total cost. The other cost items were feed, hormone and rent for land. Most of the return (97.75%) was obtained from the sale of the spawn. The brood fish sold represented 2.10 percent of the gross return and brood fish used
at home accounted for the remaining portion (0.15%) of the gross return. Net return per hectare was much higher than that of typical aquaculture operations in Bangladesh.
Hatchery operations are profitable although investment costs are high and technical skills are required for proper management, causing considerable entry barriers for the poor. Nevertheless, hatchery development can indirectly benefit the poor by offering employment (owing to its high labor need) and supplying fingerlings to poor fish farmers.
Introduction
The biophysical potential for growth in aquaculture in the region is still far from being exhausted. At the national level, Asian countries continue to search for technological breakthroughs such as developing genetically improved freshwater fish species to increase productivity. In general, the production potential of fish farming can be realized through the following options: (1) more efficient use of farmers’ resources and inputs given existing technology; (2) further development and adoption of new technologies; (3) increase in the use of inputs; and (4) expansion of area for fish production. The fourth option is feasible only if a country still has unexploited area suitable for aquaculture. Similarly, intensification is a feasible option only if farmers are using inputs below economically and environmentally optimal levels. However, reducing the inefficiency of farmers (option 1) is a potential strategy for increasing fish production without resorting to increased use of inputs. Often, farmers are not efficient in their production due to lack of knowledge in the proper use of inputs; this problem can be traced back to inadequate extension services and improper adoption of an existing technology.
The state of adoption of existing aquaculture technologies in the region presents enormous potential for increasing productivity of fish farmers beyond the average yield currently achieved. It is often the case that the output of fish farmers
applying a certain technology differs considerably, with some producing close to the potential while others fall short by varying amounts (Arjumanara 2002; Dey et al. 2004a). Dey et al. (2004a) reported that the ratio of the average farm yield to the maximum farm yield of carp polyculture in Bangladesh was 0.46, suggesting a significant potential for carp farmers to increase their outputs and incomes. It is, therefore, important to examine the level of technical efficiency (i.e., the ability of a farmer to obtain the maximum yield from a given set of inputs) of the fish farmers in Asia in order to assess the potential by which aquaculture production can be increased without necessarily increasing the use of physical inputs1.
Among various approaches to estimate farm efficiency, the most popular is still the stochastic frontier production function approach (Aigner et al. 1977; Meeusen and van den Broeck 1977). This technique is appropriate in fisheries and agricultural applications, especially in developing countries, as data from these sectors are likely to be heavily influenced by measurement errors and effects of weather conditions, diseases, etc. (Jaforullah and Devlin 1996; Coelli et al. 1998; Kirkley et al. 1998). Recent applications of frontier analysis in Asian aquaculture have mostly used the stochastic frontier production approach (Gunaratne and Leung 1996, 1997; Sharma 1999; Sharma and Leung 1998, 2000a, 2000b; Bimbao et al. 2000; Bimbao et al. 2000; Dey et al. 2000b; and Irz and McKenzie 2003).
Chapter 4
TECHNICAL EFFICIENCY OF AQUACULTURE SYSTEMS IN ASIA
42 Strategies and Options for Increasing and Sustaining Fisheries and Aquaculture Production to Benefit Poorer Households in Asia
1 For a detailed discussion on the concept of technical efficiency, refer to Coelli et al. (1998).
Consolidated in this chapter are the results of technical efficiency studies conducted by the WorldFish Center for Asian aquaculture systems. The authors compare farm-level technical efficiencies of various aquaculture systems in seven major producers of farmed fish in Asia, namely, China, India, Thailand, Vietnam, the Philippines, Bangladesh and Indonesia, by using the stochastic frontier production function approach. They also investigate the determinants of technical efficiency beyond the contribution of physical inputs to identify other key variables (such as socioeconomic or demographic variables) that cause differences in farmer efficiency. These variables may offer important clues to developing strategies for increasing production of fish farms in the region.
Given the inherent differences among the participating countries in terms of productivity and intensity levels, factor prices, production environment, climatic and ecological features, species combination, farming systems, and culture practices, the estimated technical efficiency indices may not be directly comparable. Nevertheless, the absolute estimated efficiency index per culture system may reveal the state of adoption and adaptation of aquaculture technologies in the countries being studied.
Analytical Framework
Farrrel’s (1957) seminal article on efficiency measurement led to the development of several approaches to efficiency and productivity analysis. Among these, the stochastic production function approach (Aigner et al. 1977; Meeusen and van den Broeck 1977) and Data Envelopment Analysis (DEA) (Charnes et al. 1978) are the two principal methods. It has been noted that the stochastic frontier is considered more appropriate than the DEA in fisheries and agricultural applications,
especially in developing countries where the data are likely to be heavily influenced by measurement errors and effects of weather conditions, diseases, etc (Coelli et al. 1998; Kirkley et al; 1998; Jaforullah and Devlin 1996).
The stochastic frontier production function used in this study, following Aigner et al. (1977) and Meeusen and van den Broeck (1977), assumes that the relationship between output and inputs can be modeled as follows: (1)
where Yi is the production of the ith farm (i = 1, 2, 3……n), Xi is the vector of input quantities applied by the ith farm, and βi is the vector of unknown parameters to be estimated. The expression (V
i - U
i) is the random error term of
the model, divided into Vi and Ui. The error term Vi is associated with the usual exogenous shocks that are beyond the control of the farmer and is assumed to be independently and identically distributed with zero mean and variance equal to σ2
v, i.e., V ∼ [N (0, σ2v)].
On the other hand, Ui is assumed to be a non-negative random error term associated with technical efficiency effects in the production of farm i. Following Battese and Coelli (1995), Ui is assumed to be independently and identically distributed as a half-normal random variable truncated at zero with mean µi and variance σ2
u, namely, | U∼ N (µi, σ
2U)|.
The technical efficiency index (TE) of the ith sample farm is derived as follows:
(2)
The TE index can be estimated on a per farm basis using the predictor variables included in equation (1) and is based on the conditional expectation of
43CHAPTER 4 | Technical Efficiency

exp(-U) (Battese and Coelli 1998). The variance of the model σ2 is computed as the sum of the variances of the two error terms V and U, that is, σ2 = (σ2
U + σ2V), while the parameter γ is computed
as the ratio of the half-normal variance to the total variance, that is, γ = (σ2
U/σ2 ). This parameter (γ) measures the relative size of the efficiency effect of a given specific production system with respect to the total random component of the model. The value of γ ranges from 0 to 1, where values close to 1 suggest that more variations in the farmers’ output are associated to the efficiency effects instead of the random effects. The maximum likelihood estimate (MLE) of the parameters of the model defined by equation (1) and the generation of farm-specific technical efficiency (TE) defined by (2) are estimated by using the FRONTIER 4.1 package (Coelli 1994).
Empirical Model
Despite its restrictiveness, the Cobb-Douglas (CD) functional form has performed well in several studies of the aquaculture production function (i.e., Dey et al. 2000b; Bimbao et al. 2000). In this study, the researchers used the CD specification to estimate the stochastic production frontier function of the different levels of intensity of freshwater pond polyculture production in each country. In general, the frontier production function is specified by relating yield Yi as a function of the physical inputs Xi, such as stocking density, feeding rate, fertilization rate (nitrogen/phosphorus), depth of pond, size of pond/cage and pre-harvest labor. Where actual quantities of the inputs are unavailable, either their monetary equivalents or representative dummy variables D for utilizing such inputs can be used. The CD model for different levels of intensity of each country is specified. The country-specific frontier production function is formulated by the following translog model:
(3) (Subscripts for country and household operators were suppressed to simplify notation.) The model includes the linear and squared forms of the input variables, as well as their interaction effects, represented by the cross products of the input variables. The effects of the interaction and squared terms were jointly tested using the likelihood ratio. Where the effects of the interaction and squared terms are not significant, the translog reduces to the Cobb-Douglas model.
To determine the effects of the non-input variables in the TE of fish farmers, the following model is specified: (4)(Subscripts for country and household operators were omitted for simplicity.) The Z-variables refer to the measures of human capital (as represented by age, education and years of experience of farmers), total farm size (a proxy of income), distance of farm from the nearest market/seed supplier, and chemical application for disease prevention. The D-variables for the TE model are dummy variables representing regional location and tenurial status. Definitions of all the variables used in the CD frontier production function and TE models for different levels of farming intensity of each country are presented in Table 4.1.
Data
This study uses country data collected by the WorldFish Center and its partner institutions under two ADB-funded projects, namely, “Genetic Improvement of Carp Species in Asia” conducted in 1998-99, and “Strategies and Options for Increasing and Sustaining Fisheries and Aquaculture Production to Benefit Poor Households in Asia” conducted in 2001-2004.
44 Strategies and Options for Increasing and Sustaining Fisheries and Aquaculture Production to Benefit Poorer Households in Asia
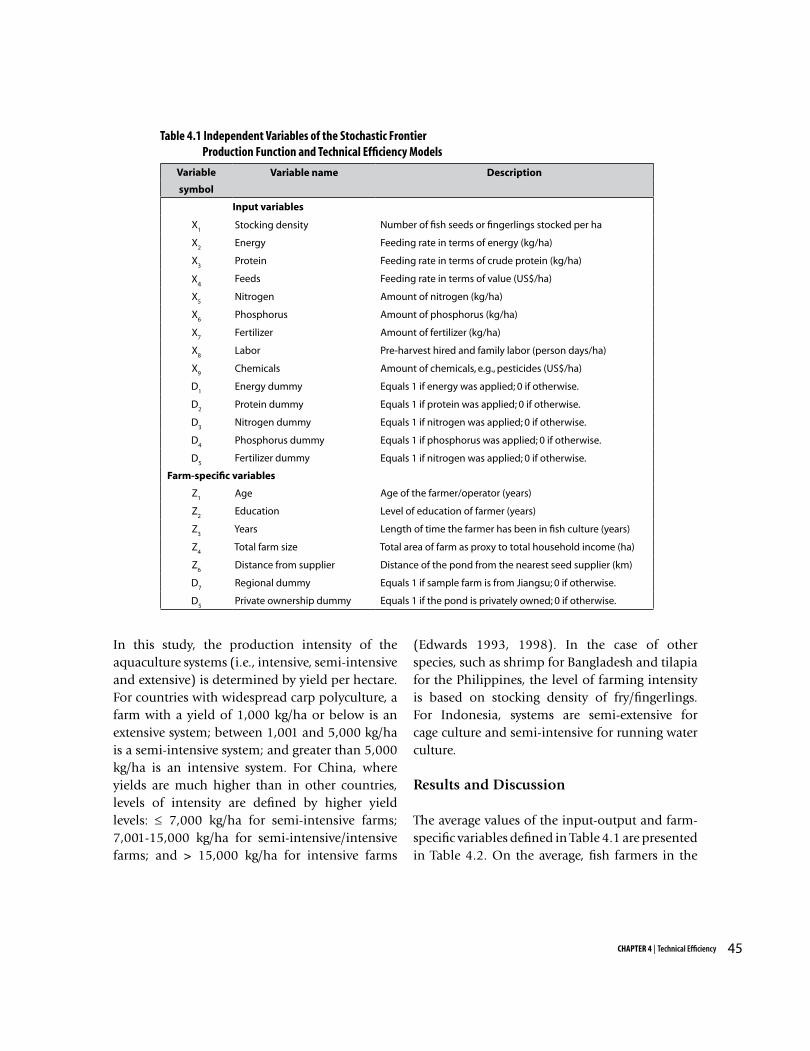
Variable Variable name Description
symbol
Input variables
X1
Stocking density Number of fish seeds or fingerlings stocked per ha
X2
Energy Feeding rate in terms of energy (kg/ha)
X3
Protein Feeding rate in terms of crude protein (kg/ha)
X4
Feeds Feeding rate in terms of value (US$/ha)
X5
Nitrogen Amount of nitrogen (kg/ha)
X6
Phosphorus Amount of phosphorus (kg/ha)
X7
Fertilizer Amount of fertilizer (kg/ha)
X8
Labor Pre-harvest hired and family labor (person days/ha)
X9
Chemicals Amount of chemicals, e.g., pesticides (US$/ha)
D1
Energy dummy Equals 1 if energy was applied; 0 if otherwise.
D2
Protein dummy Equals 1 if protein was applied; 0 if otherwise.
D3
Nitrogen dummy Equals 1 if nitrogen was applied; 0 if otherwise.
D4
Phosphorus dummy Equals 1 if phosphorus was applied; 0 if otherwise.
D5
Fertilizer dummy Equals 1 if nitrogen was applied; 0 if otherwise.
Farm-specific variables
Z1
Age Age of the farmer/operator (years)
Z2
Education Level of education of farmer (years)
Z3
Years Length of time the farmer has been in fish culture (years)
Z4
Total farm size Total area of farm as proxy to total household income (ha)
Z6
Distance from supplier Distance of the pond from the nearest seed supplier (km)
D7
Regional dummy Equals 1 if sample farm is from Jiangsu; 0 if otherwise.
D5
Private ownership dummy Equals 1 if the pond is privately owned; 0 if otherwise.
Table 4.1 Independent Variables of the Stochastic Frontier Production Function and Technical Efficiency Models
In this study, the production intensity of the aquaculture systems (i.e., intensive, semi-intensive and extensive) is determined by yield per hectare. For countries with widespread carp polyculture, a farm with a yield of 1,000 kg/ha or below is an extensive system; between 1,001 and 5,000 kg/ha is a semi-intensive system; and greater than 5,000 kg/ha is an intensive system. For China, where yields are much higher than in other countries, levels of intensity are defined by higher yield levels: ≤ 7,000 kg/ha for semi-intensive farms; 7,001-15,000 kg/ha for semi-intensive/intensive farms; and > 15,000 kg/ha for intensive farms
(Edwards 1993, 1998). In the case of other species, such as shrimp for Bangladesh and tilapia for the Philippines, the level of farming intensity is based on stocking density of fry/fingerlings. For Indonesia, systems are semi-extensive for cage culture and semi-intensive for running water culture.
Results and Discussion
The average values of the input-output and farm-specific variables defined in Table 4.1 are presented in Table 4.2. On the average, fish farmers in the
45CHAPTER 4 | Technical Efficiency
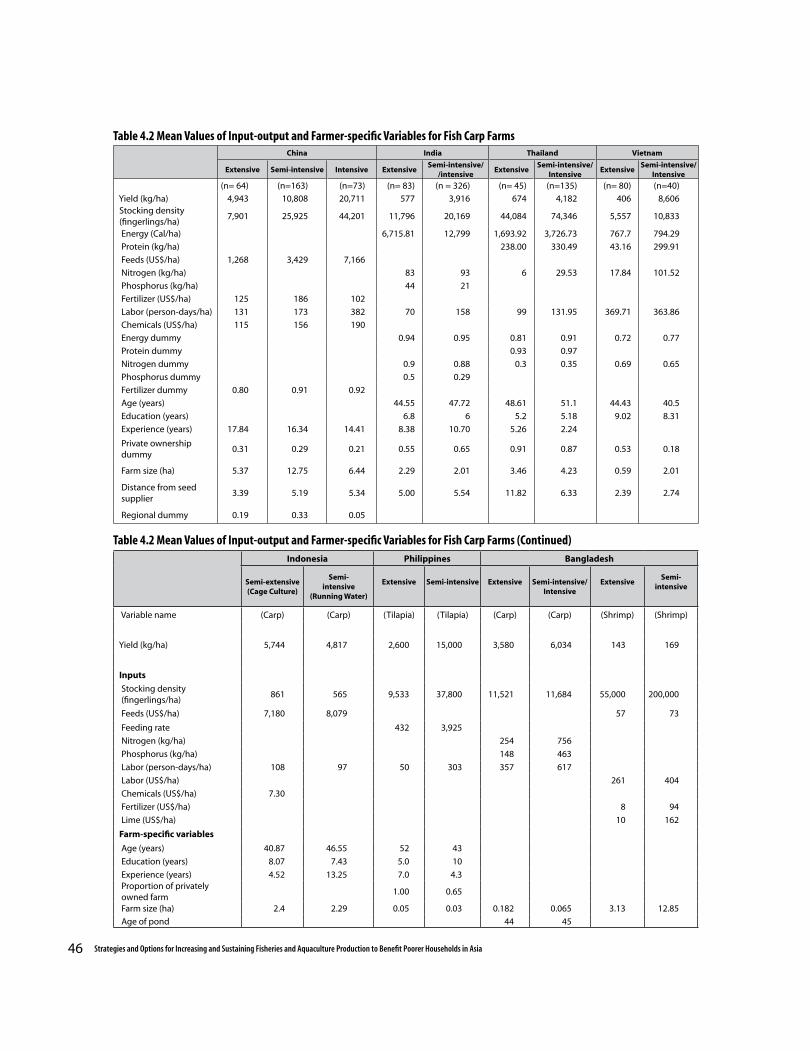
Table 4.2 Mean Values of Input-output and Farmer-specific Variables for Fish Carp Farms
46 Strategies and Options for Increasing and Sustaining Fisheries and Aquaculture Production to Benefit Poorer Households in Asia
China India Thailand Vietnam
Extensive Semi-intensive Intensive ExtensiveSemi-intensive/
/intensiveExtensive
Semi-intensive/Intensive
ExtensiveSemi-intensive/
Intensive
(n= 64) (n=163) (n=73) (n= 83) (n = 326) (n= 45) (n=135) (n= 80) (n=40)
Yield (kg/ha) 4,943 10,808 20,711 577 3,916 674 4,182 406 8,606 Stocking density (fingerlings/ha)
7,901 25,925 44,201 11,796 20,169 44,084 74,346 5,557 10,833
Energy (Cal/ha) 6,715.81 12,799 1,693.92 3,726.73 767.7 794.29
Protein (kg/ha) 238.00 330.49 43.16 299.91
Feeds (US$/ha) 1,268 3,429 7,166
Nitrogen (kg/ha) 83 93 6 29.53 17.84 101.52
Phosphorus (kg/ha) 44 21
Fertilizer (US$/ha) 125 186 102
Labor (person-days/ha) 131 173 382 70 158 99 131.95 369.71 363.86
Chemicals (US$/ha) 115 156 190
Energy dummy 0.94 0.95 0.81 0.91 0.72 0.77
Protein dummy 0.93 0.97
Nitrogen dummy 0.9 0.88 0.3 0.35 0.69 0.65
Phosphorus dummy 0.5 0.29
Fertilizer dummy 0.80 0.91 0.92
Age (years) 44.55 47.72 48.61 51.1 44.43 40.5
Education (years) 6.8 6 5.2 5.18 9.02 8.31
Experience (years) 17.84 16.34 14.41 8.38 10.70 5.26 2.24
Private ownership dummy
0.31 0.29 0.21 0.55 0.65 0.91 0.87 0.53 0.18
Farm size (ha) 5.37 12.75 6.44 2.29 2.01 3.46 4.23 0.59 2.01
Distance from seed supplier
3.39 5.19 5.34 5.00 5.54 11.82 6.33 2.39 2.74
Regional dummy 0.19 0.33 0.05
Indonesia Philippines Bangladesh
Semi-extensive(Cage Culture)
Semi-intensive
(Running Water)
Extensive Semi-intensive Extensive Semi-intensive/Intensive
ExtensiveSemi-
intensive
Variable name (Carp) (Carp) (Tilapia) (Tilapia) (Carp) (Carp) (Shrimp) (Shrimp)
Yield (kg/ha) 5,744 4,817 2,600 15,000 3,580 6,034 143 169
Inputs
Stocking density (fingerlings/ha)
861 565 9,533 37,800 11,521 11,684 55,000 200,000
Feeds (US$/ha) 7,180 8,079 57 73
Feeding rate 432 3,925
Nitrogen (kg/ha) 254 756
Phosphorus (kg/ha) 148 463
Labor (person-days/ha) 108 97 50 303 357 617
Labor (US$/ha) 261 404
Chemicals (US$/ha) 7.30
Fertilizer (US$/ha) 8 94
Lime (US$/ha) 10 162
Farm-specific variables
Age (years) 40.87 46.55 52 43
Education (years) 8.07 7.43 5.0 10
Experience (years) 4.52 13.25 7.0 4.3 Proportion of privately owned farm
1.00 0.65
Farm size (ha) 2.4 2.29 0.05 0.03 0.182 0.065 3.13 12.85
Age of pond 44 45
Table 4.2 Mean Values of Input-output and Farmer-specific Variables for Fish Carp Farms (Continued)
47CHAPTER 4 | Technical Efficiency
region are between 40 and 52 years old, with 5-10 years of schooling and a wide range of farming experience, from 2 to 18 years. In general, fish farmers who are younger are often more educated, as found in the case of Vietnam, Indonesia and the Philippines; and this is particularly the case with carp farmers in Thailand2. Fish farmers in China are found to be relatively more experienced than other farmers in the region.
Most of the aquaculture farms in Thailand and the Philippines are privately owned. In China, where many farms are state-owned, large-scale enterprises, the average farm size (about 10 ha) is much bigger than in other countries3. In Vietnam, however, fish farms are often part of the integrated VAC systems; therefore, they are relatively small, ranging from 0.57 among extensive farms to 2.01 among intensive farms4. The smallest farm sizes are found in Bangladesh and the Philippines5; they only range from 0.03 to 0.182 hectare.
Grow-out operators depend on the capacity of the seed suppliers to supply fingerlings that enable them to sustain their operations. Their productivity and efficiency also depend on the accessibility of available inputs from the market and other infrastructure amenities related to production and marketing of their produce. A greater distance from input supply tends to reduce efficiency. On the production side, it means additional cost for transporting the inputs from the market to the farm and, in some cases, untimely application of these inputs. On the marketing side, storage facilities are required to keep the harvested fish fresh because fish is a perishable commodity. The shortest distances between fish farms and the market and seed suppliers are found in Vietnam (about 2-3 km) while the longest are found in Thailand (6-12 km).
Yield and input structure fish culture varies across the countries. In China, levels of yield and input are much higher than those in other countries. In general, yields and inputs increase in line with levels of intensity. This is in accordance to the generalization that fish farmers practicing intensive culture used complete fish feed with proportionally more protein (energy in terms of Cal) and less carbohydrate content than those operating under semi-intensive and extensive culture systems (Panayotou et al. 1982; Edwards 1993; Tacon 1997).
Stocking density varies considerably as farmers shift from extensive to intensive systems. On the average, the stocking density of an extensive farm is about 6 times smaller than that of an intensive farm and 4 times smaller than that of a semi-intensive farm. The level of intensity of fish farms is often proportional to stocking density, supplemental feeding and scale of operation. This is exemplified by the case of Vietnam, Thailand, and Bangladesh, where operations of the intensive farms are larger than those of the extensive farms.
Empirical results
The maximum-likelihood estimates of the parameters for the frontier production function and those for the TE model are presented in Tables 4.3 - 4.9. Most of the parameter estimates of both functions are statistically significant with the expected signs, which is evidence of an adequate model fit. In general, proper stocking density, feeding rate, pond depth, labor, and fertilization (nitrogen) significantly increase aquaculture output.
Results from the fitted TE model reveal that different sets of factors influence technical efficiency of
2 Though the general level of literacy is quite high in Thailand compared to many other Asian countries, the educational attainment of carp-based fresh water fish farmers is comparatively low. Commercial fish farmers from the Central Plain of Thailand have much higher educational attainment.3 The state-owned fisheries sub-sector used to dominate the supply side (production, procurement and rationing to consumer) of fishery economy until the late 1970s, when market reforms were initiated (Li and Huang 2001).4 Around 70 percent of the total national aquaculture in the country is carried out by smallholders (Luu 1999).5 Fish cages in Lake Taal, Philippines, are stipulated at 100 m2 by local government regulation (Tan and Navarez 2004).
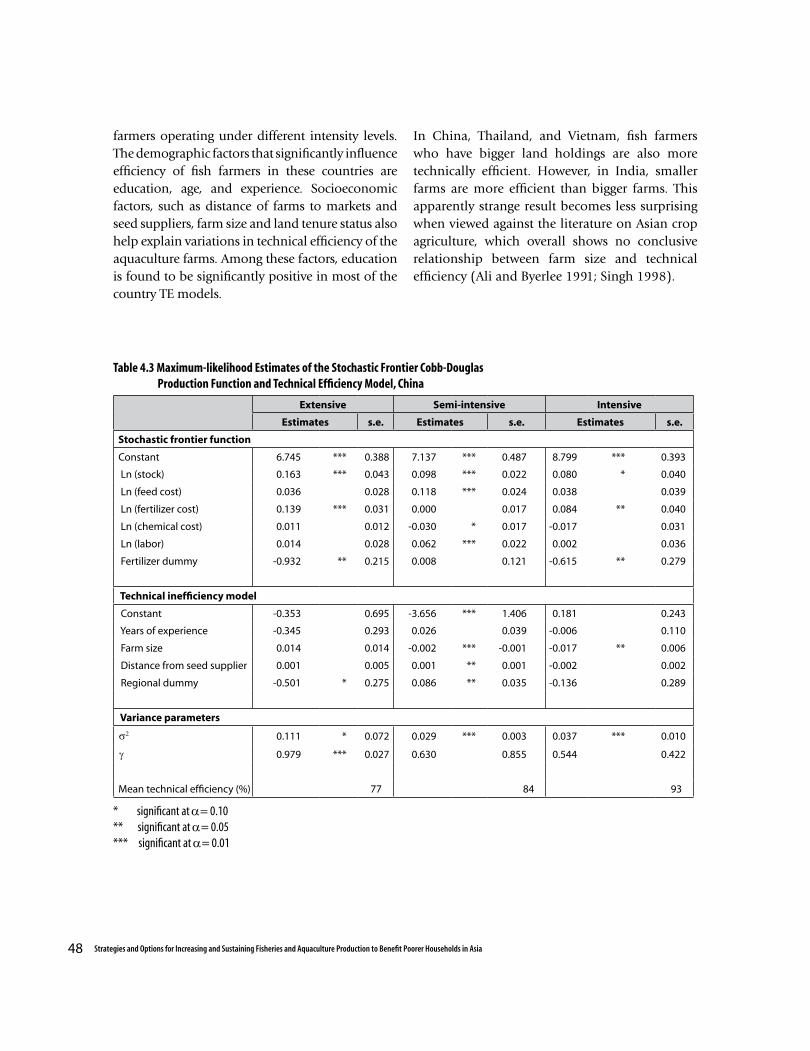
48 Strategies and Options for Increasing and Sustaining Fisheries and Aquaculture Production to Benefit Poorer Households in Asia
farmers operating under different intensity levels. The demographic factors that significantly influence efficiency of fish farmers in these countries are education, age, and experience. Socioeconomic factors, such as distance of farms to markets and seed suppliers, farm size and land tenure status also help explain variations in technical efficiency of the aquaculture farms. Among these factors, education is found to be significantly positive in most of the country TE models.
In China, Thailand, and Vietnam, fish farmers who have bigger land holdings are also more technically efficient. However, in India, smaller farms are more efficient than bigger farms. This apparently strange result becomes less surprising when viewed against the literature on Asian crop agriculture, which overall shows no conclusive relationship between farm size and technical efficiency (Ali and Byerlee 1991; Singh 1998).
Extensive Semi-intensive Intensive
Estimates s.e. Estimates s.e. Estimates s.e.
Stochastic frontier function
Constant 6.745 *** 0.388 7.137 *** 0.487 8.799 *** 0.393
Ln (stock) 0.163 *** 0.043 0.098 *** 0.022 0.080 * 0.040
Ln (feed cost) 0.036 0.028 0.118 *** 0.024 0.038 0.039
Ln (fertilizer cost) 0.139 *** 0.031 0.000 0.017 0.084 ** 0.040
Ln (chemical cost) 0.011 0.012 -0.030 * 0.017 -0.017 0.031
Ln (labor) 0.014 0.028 0.062 *** 0.022 0.002 0.036
Fertilizer dummy -0.932 ** 0.215 0.008 0.121 -0.615 ** 0.279
Technical inefficiency model
Constant -0.353 0.695 -3.656 *** 1.406 0.181 0.243
Years of experience -0.345 0.293 0.026 0.039 -0.006 0.110
Farm size 0.014 0.014 -0.002 *** -0.001 -0.017 ** 0.006
Distance from seed supplier 0.001 0.005 0.001 ** 0.001 -0.002 0.002
Regional dummy -0.501 * 0.275 0.086 ** 0.035 -0.136 0.289
Variance parameters
σ2 0.111 * 0.072 0.029 *** 0.003 0.037 *** 0.010
γ 0.979 *** 0.027 0.630 0.855 0.544 0.422
Mean technical efficiency (%) 77 84 93
Table 4.3 Maximum-likelihood Estimates of the Stochastic Frontier Cobb-Douglas Production Function and Technical Efficiency Model, China
* significant at α= 0.10** significant at α= 0.05*** significant at α= 0.01
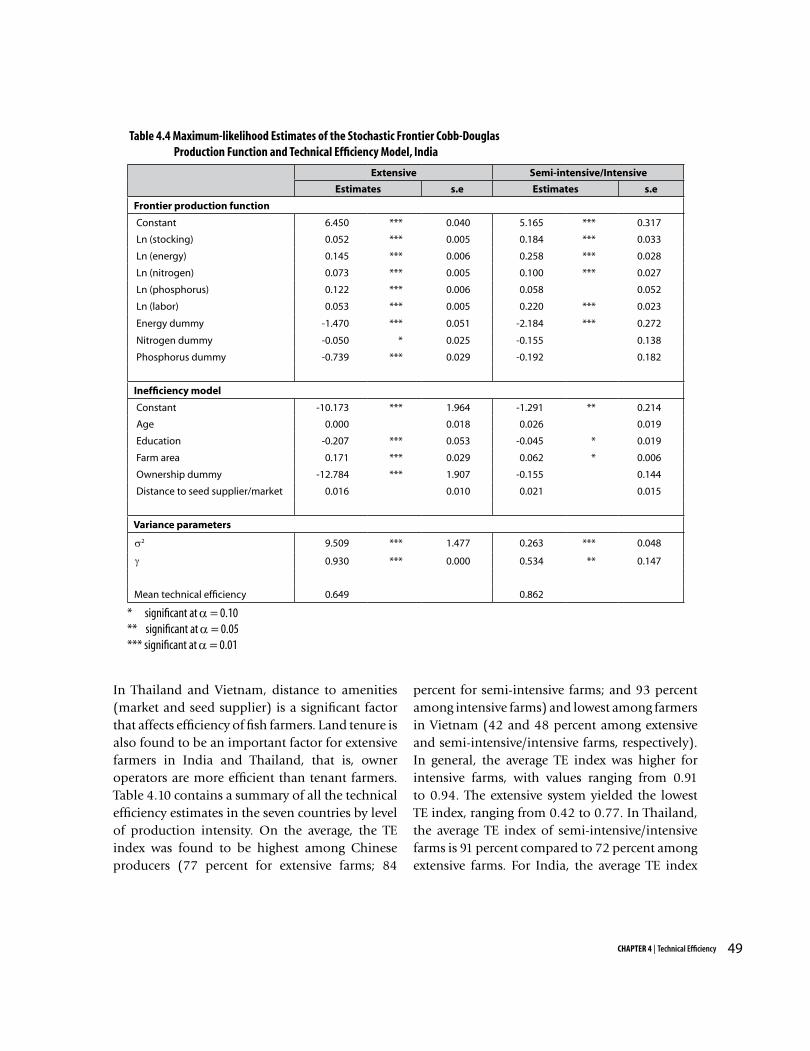
49CHAPTER 4 | Technical Efficiency
Extensive Semi-intensive/Intensive
Estimates s.e Estimates s.e
Frontier production function
Constant 6.450 *** 0.040 5.165 *** 0.317
Ln (stocking) 0.052 *** 0.005 0.184 *** 0.033
Ln (energy) 0.145 *** 0.006 0.258 *** 0.028
Ln (nitrogen) 0.073 *** 0.005 0.100 *** 0.027
Ln (phosphorus) 0.122 *** 0.006 0.058 0.052
Ln (labor) 0.053 *** 0.005 0.220 *** 0.023
Energy dummy -1.470 *** 0.051 -2.184 *** 0.272
Nitrogen dummy -0.050 * 0.025 -0.155 0.138
Phosphorus dummy -0.739 *** 0.029 -0.192 0.182
Inefficiency model
Constant -10.173 *** 1.964 -1.291 ** 0.214
Age 0.000 0.018 0.026 0.019
Education -0.207 *** 0.053 -0.045 * 0.019
Farm area 0.171 *** 0.029 0.062 * 0.006
Ownership dummy -12.784 *** 1.907 -0.155 0.144
Distance to seed supplier/market 0.016 0.010 0.021 0.015
Variance parameters
σ2 9.509 *** 1.477 0.263 *** 0.048
γ 0.930 *** 0.000 0.534 ** 0.147
Mean technical efficiency 0.649 0.862
Table 4.4 Maximum-likelihood Estimates of the Stochastic Frontier Cobb-Douglas Production Function and Technical Efficiency Model, India
* significant at α = 0.10 ** significant at α = 0.05 *** significant at α = 0.01
In Thailand and Vietnam, distance to amenities (market and seed supplier) is a significant factor that affects efficiency of fish farmers. Land tenure is also found to be an important factor for extensive farmers in India and Thailand, that is, owner operators are more efficient than tenant farmers.Table 4.10 contains a summary of all the technical efficiency estimates in the seven countries by level of production intensity. On the average, the TE index was found to be highest among Chinese producers (77 percent for extensive farms; 84
percent for semi-intensive farms; and 93 percent among intensive farms) and lowest among farmers in Vietnam (42 and 48 percent among extensive and semi-intensive/intensive farms, respectively). In general, the average TE index was higher for intensive farms, with values ranging from 0.91 to 0.94. The extensive system yielded the lowest TE index, ranging from 0.42 to 0.77. In Thailand, the average TE index of semi-intensive/intensive farms is 91 percent compared to 72 percent among extensive farms. For India, the average TE index
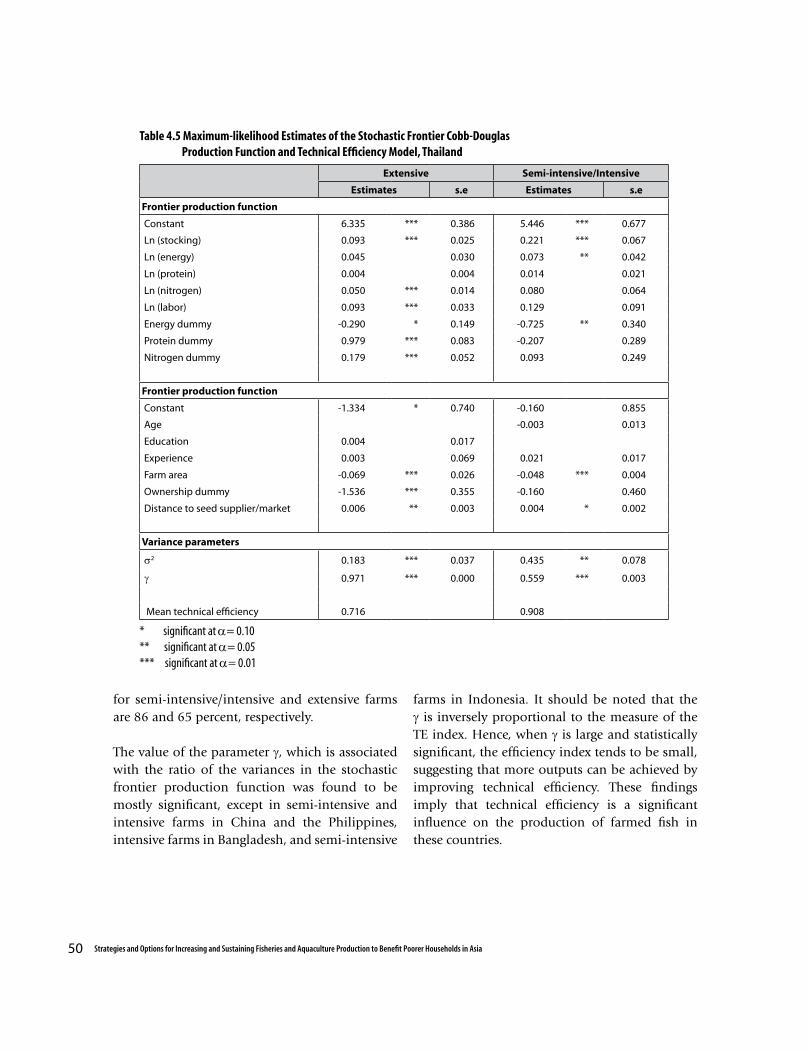
50 Strategies and Options for Increasing and Sustaining Fisheries and Aquaculture Production to Benefit Poorer Households in Asia
Extensive Semi-intensive/Intensive
Estimates s.e Estimates s.e
Frontier production function
Constant 6.335 *** 0.386 5.446 *** 0.677
Ln (stocking) 0.093 *** 0.025 0.221 *** 0.067
Ln (energy) 0.045 0.030 0.073 ** 0.042
Ln (protein) 0.004 0.004 0.014 0.021
Ln (nitrogen) 0.050 *** 0.014 0.080 0.064
Ln (labor) 0.093 *** 0.033 0.129 0.091
Energy dummy -0.290 * 0.149 -0.725 ** 0.340
Protein dummy 0.979 *** 0.083 -0.207 0.289
Nitrogen dummy 0.179 *** 0.052 0.093 0.249
Frontier production function
Constant -1.334 * 0.740 -0.160 0.855
Age -0.003 0.013
Education 0.004 0.017
Experience 0.003 0.069 0.021 0.017
Farm area -0.069 *** 0.026 -0.048 *** 0.004
Ownership dummy -1.536 *** 0.355 -0.160 0.460
Distance to seed supplier/market 0.006 ** 0.003 0.004 * 0.002
Variance parameters
σ2 0.183 *** 0.037 0.435 ** 0.078
γ 0.971 *** 0.000 0.559 *** 0.003
Mean technical efficiency 0.716 0.908
Table 4.5 Maximum-likelihood Estimates of the Stochastic Frontier Cobb-Douglas Production Function and Technical Efficiency Model, Thailand
* significant at α= 0.10** significant at α= 0.05*** significant at α= 0.01
for semi-intensive/intensive and extensive farms are 86 and 65 percent, respectively.
The value of the parameter γ, which is associated with the ratio of the variances in the stochastic frontier production function was found to be mostly significant, except in semi-intensive and intensive farms in China and the Philippines, intensive farms in Bangladesh, and semi-intensive
farms in Indonesia. It should be noted that the γ is inversely proportional to the measure of the TE index. Hence, when γ is large and statistically significant, the efficiency index tends to be small, suggesting that more outputs can be achieved by improving technical efficiency. These findings imply that technical efficiency is a significant influence on the production of farmed fish in these countries.
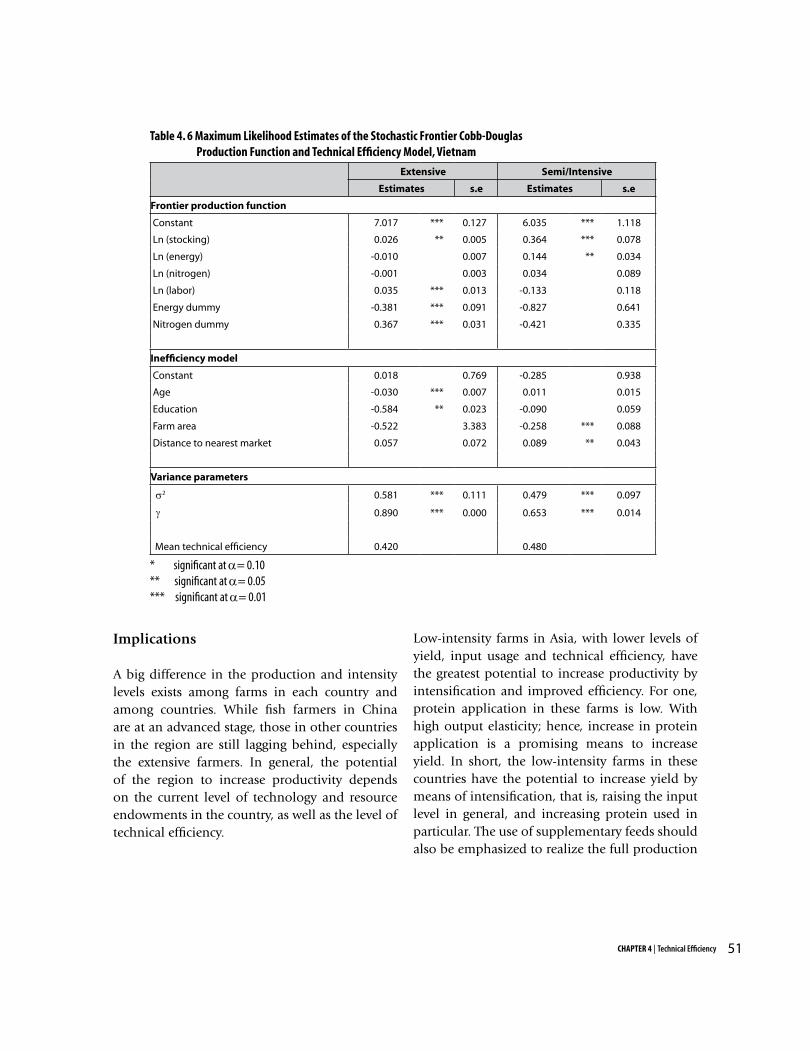
51CHAPTER 4 | Technical Efficiency
Extensive Semi/Intensive
Estimates s.e Estimates s.e
Frontier production function
Constant 7.017 *** 0.127 6.035 *** 1.118
Ln (stocking) 0.026 ** 0.005 0.364 *** 0.078
Ln (energy) -0.010 0.007 0.144 ** 0.034
Ln (nitrogen) -0.001 0.003 0.034 0.089
Ln (labor) 0.035 *** 0.013 -0.133 0.118
Energy dummy -0.381 *** 0.091 -0.827 0.641
Nitrogen dummy 0.367 *** 0.031 -0.421 0.335
Inefficiency model
Constant 0.018 0.769 -0.285 0.938
Age -0.030 *** 0.007 0.011 0.015
Education -0.584 ** 0.023 -0.090 0.059
Farm area -0.522 3.383 -0.258 *** 0.088
Distance to nearest market 0.057 0.072 0.089 ** 0.043
Variance parameters
σ2 0.581 *** 0.111 0.479 *** 0.097
γ 0.890 *** 0.000 0.653 *** 0.014
Mean technical efficiency 0.420 0.480
Table 4. 6 Maximum Likelihood Estimates of the Stochastic Frontier Cobb-Douglas Production Function and Technical Efficiency Model, Vietnam
* significant at α= 0.10** significant at α= 0.05*** significant at α= 0.01
Implications
A big difference in the production and intensity levels exists among farms in each country and among countries. While fish farmers in China are at an advanced stage, those in other countries in the region are still lagging behind, especially the extensive farmers. In general, the potential of the region to increase productivity depends on the current level of technology and resource endowments in the country, as well as the level of technical efficiency.
Low-intensity farms in Asia, with lower levels of yield, input usage and technical efficiency, have the greatest potential to increase productivity by intensification and improved efficiency. For one, protein application in these farms is low. With high output elasticity; hence, increase in protein application is a promising means to increase yield. In short, the low-intensity farms in these countries have the potential to increase yield by means of intensification, that is, raising the input level in general, and increasing protein used in particular. The use of supplementary feeds should also be emphasized to realize the full production
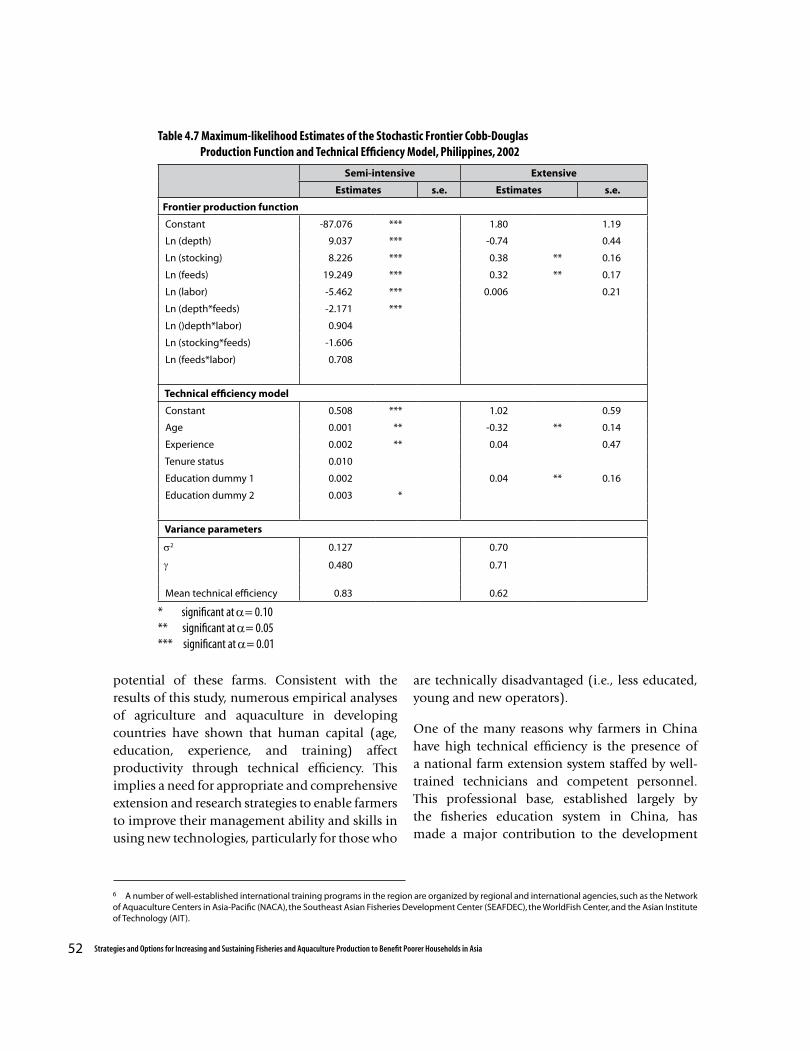
6 A number of well-established international training programs in the region are organized by regional and international agencies, such as the Network of Aquaculture Centers in Asia-Pacific (NACA), the Southeast Asian Fisheries Development Center (SEAFDEC), the WorldFish Center, and the Asian Institute of Technology (AIT).
52 Strategies and Options for Increasing and Sustaining Fisheries and Aquaculture Production to Benefit Poorer Households in Asia
Table 4.7 Maximum-likelihood Estimates of the Stochastic Frontier Cobb-Douglas Production Function and Technical Efficiency Model, Philippines, 2002
* significant at α= 0.10** significant at α= 0.05*** significant at α= 0.01
Semi-intensive Extensive
Estimates s.e. Estimates s.e.
Frontier production function
Constant -87.076 *** 1.80 1.19
Ln (depth) 9.037 *** -0.74 0.44
Ln (stocking) 8.226 *** 0.38 ** 0.16
Ln (feeds) 19.249 *** 0.32 ** 0.17
Ln (labor) -5.462 *** 0.006 0.21
Ln (depth*feeds) -2.171 ***
Ln ()depth*labor) 0.904
Ln (stocking*feeds) -1.606
Ln (feeds*labor) 0.708
Technical efficiency model
Constant 0.508 *** 1.02 0.59
Age 0.001 ** -0.32 ** 0.14
Experience 0.002 ** 0.04 0.47
Tenure status 0.010
Education dummy 1 0.002 0.04 ** 0.16
Education dummy 2 0.003 *
Variance parameters
σ2 0.127 0.70
γ 0.480 0.71
Mean technical efficiency 0.83 0.62
potential of these farms. Consistent with the results of this study, numerous empirical analyses of agriculture and aquaculture in developing countries have shown that human capital (age, education, experience, and training) affect productivity through technical efficiency. This implies a need for appropriate and comprehensive extension and research strategies to enable farmers to improve their management ability and skills in using new technologies, particularly for those who
are technically disadvantaged (i.e., less educated, young and new operators).
One of the many reasons why farmers in China have high technical efficiency is the presence of a national farm extension system staffed by well-trained technicians and competent personnel. This professional base, established largely by the fisheries education system in China, has made a major contribution to the development

53CHAPTER 4 | Technical Efficiency
Table 4.8 Maximum-likelihood Estimates of the Stochastic Frontier Cobb-Douglas Production Function and Technical Efficiency Model, Bangladesh
* significant at α= 0.10** significant at α= 0.05*** significant at α= 0.01
Extensive Intensive
Estimates s.e Estimates s.e
Frontier production function
Constant 3.141 * 0.258 0.58 0.98
Ln (stocking) 0.592 *** 0.028 0.51 *** 0.18
Ln (depth) -0.048 * 0.026
Ln (pond age) 0.078 * 0.037
Ln (labor) -0.014 0.022 0.44 *** 0.19
Ln (feeding rate) -0.03 0.24
Ln (fertilizer) -0.09 0.50
Ln (chemical use) 0.09 0.55
Feed dummy 0.002 0.030
Fertilizer dummy 0.002 0.004
Technical efficiency model
Constant 0.570 *** 0.111
Pond size -0.009 0.064
Age -0.00002 0.00002
Education -0.004 0.002
Income 0.116 * 0.058
Training of operator -0.203 ** 0.066
Regional dummy -0.090 * 0.046
Variance parameters
σ2 0.120 *** 0.21 ***
γ 0.689 *** 0.05
Mean technical efficiency 0.70 0.94
of fisheries and aquaculture in the country (see Chapter 5). Unfortunately, the state of extension services in other countries suffers from inadequate support programs implemented by inexperienced personnel. The establishment and strengthening of training and extension programs in these countries, particularly at the grassroots level, are crucial to improving technical efficiency and productivity6.
In this study, owner farmers were found to be more technically efficient than tenant farmers. Results showed that pond owners are relatively more efficient. This could be explained by the fact that owners have freedom in production decisions and are motivated to adopt and invest in recommended technologies.
Under the threats of insecure rights for land and water use, farmers may opt to use these resources

54 Strategies and Options for Increasing and Sustaining Fisheries and Aquaculture Production to Benefit Poorer Households in Asia
Table 4.9 Maximum-likelihood Estimates of the Stochastic Frontier Cobb-Douglas Production Function and Technical Efficiency Model, Indonesia
* significant at α= 0.10** significant at α= 0.05*** significant at α= 0.01
Semi-extensive Semi-intensive
Estimates s.e Estimates s.e
Frontier production function
Constant 1.15 1.04 -0.26 0.75
Ln (stocking) 0.22 *** 0.05 0.15 *** 0.00
Ln (labor) 0.03 0.07 0.17 *** 0.04
Ln (feeds) 0.68 *** 0.08 0.76 *** 0.03
Ln (medicine) -0.03 0.07
Medicine dummy 0.41 1.08
Technical efficiency model
Constant 0.21 0.26 0.28 ** 0.16
Age 0.00 0.00 0.00 0.00
Education -0.04 0.02 0.00 0.00
Experience -0.01 0.06 -0.05 *** 0.02
Farm area 0.01 0.02 0.00 0.00
Training dummy 0.05 0.18 -0.05 0.04
Variance parameters
σ2 0.01 0.02 0.01 *** 0.00
γ 0.21 1.40 0.99 *** 0.00
Mean technical efficiency 0.79 0.96
Country ExtensiveSemi-intensive /Semi-extensive
Intensive
China 0.77 0.84 0.93
India 0.65 0.86
Thailand 0.72 0.91
Vietnam 0.42 0.48
Philippines 0.62 0.83
Bangladesh 0.70 0.94
Indonesia 0.79/ 0.96
Table 4.10 Summary of the Average Technical Efficiency Indices of Aquaculture Production by Country and Intensity of Operation
55CHAPTER 4 | Technical Efficiency
in a sub-optimal way. Investment in infrastructure might be insufficient and long-term productivity growth could be hindered. On the whole, insecurity of tenure not only affects technical efficiency but also exists as a constraint for development.
Compared to extensive and semi-intensive farms, high-intensity farms, especially in China, have less potential to increase productivity by raising technical efficiency levels since the TE levels are already high. Therefore, higher productivity of intensive farms in China will have to come from development of new technologies, such as genetic enhancement, improvement of pond and water management, and feed and disease control. However, in many Asian countries, reducing technical inefficiency still offers a huge potential in increasing aquaculture production. ICLARM (2001) and Dey et al. (2004b) analyzed various technical (both biotic and abiotic) constraints contributing to total yield losses in pond polyculture of carps in Asia. These studies reported that poor water quality and disease infestations are the two major technical constraints to carp production in the region. In particular, fish diseases are responsible for more than 30 percent of the total estimated yield losses in China, India, and Vietnam.
Conclusion
This study estimates and compares the magnitudes and determinants of farm-level technical efficiencies for several aquaculture systems in selected Asian countries, namely, China, India, Thailand, Vietnam, Indonesia, the Philippines, and Bangladesh. Technical efficiency (TE) indexes were estimated for different intensity levels of aquaculture farms in each country by estimating respective stochastic frontier production functions.
The findings suggest that yield, input levels, and TE increase as farming system intensifies. On the average, productivity in China is much higher than in the six other countries as indicated by their high levels of technical efficiency index for all intensity categories.
Regression analysis of the determinants of technical efficiency shows that different sets of factors influence technical efficiency among farmers operating at different levels of intensity. One clear pattern that emerges is that the education attainment of fish farmers plays an important role in increasing aquaculture production.
The data reveal sizable inefficiency among extensive/semi-intensive farms in Bangladesh, Vietnam, India, and the Philippines. The decision makers in these countries can use extension service and education as policy tools to achieve higher degree of efficiency. This is aimed not at downplaying the importance of new technologies for the long-term development of aquaculture, but rather at pointing out other cost-effective options to realize gains in productivity. As Shultz (1975) maintained a decade after enunciating the “poor but efficient hypothesis”, the twin approaches of improved farm efficiency and technological change form a continuum of strategies towards agricultural development. Because intensive fish farmers are already quite efficient in utilizing their existing resources and technology, there is a fresh need to develop and disseminate new technology to help increase productivity of these farmers.
56 Strategies and Options for Increasing and Sustaining Fisheries and Aquaculture Production to Benefit Poorer Households in Asia
The development of fisheries is dependent on the policy and institutional environment, which spans a wide range of laws, regulations, administrative directives, institutions, services, infrastructure support, and incentives. This chapter reviews and evaluates policies, institutions, and support services related to fisheries in the selected countries. It begins with a discussion of fisheries-specific policies and sectoral development plans, followed by policies related to trade and macroeconomy. The support service system and the institutional environment are also examined.
Sectoral Policies
Overview
Fisheries policies remain embedded in the broader framework of national and agricultural development strategies. Nevertheless, in all the countries considered, fisheries constitute a priority sub-sector within agriculture because of their significant contribution to livelihoods, food security, gross domestic product (GDP), and foreign exchange. Globalization trends, the liberalization of domestic and foreign markets, and the pressures of global competition have in the past two decades driven sectoral policies and institutional support.
Bangladesh
The primary goal of Bangladesh is to attain food self-sufficiency. (At present, self-sufficiency
has been achieved for food grains, but not for other food including fish). The government of Bangladesh has declared fisheries as one of the thrust sectors of the economy. Under its agricultural sector policy incentives, subsidized credit was provided to investors in agriculture (including fisheries) at the interest rates of 10-14 percent, and to exporters of agricultural and fish products at the interest rates of 8-10 percent. During the same period, the commercial lending rate was between 15 and 18 percent. However, Bangladesh normally has no distinct credit or input incentives for fisheries as such.
Consistent with a market-friendly stance, the government encourages private entrepreneurship in fisheries. As a result, the private sector now provides a much higher share of investment in fish feed processing, manufacturing, and fish seed production. There are 711 fish/shrimp hatcheries and 3,441 nurseries in the private sector, in comparison to a total of 113 fish and 6 shrimp/prawn hatcheries in the public sector. Nevertheless, the public sector maintains a lead role in research and infrastructure development.
Public investments, however, are biased towards shrimp, which accounts for the bulk of the foreign exchange earnings of the sector. For instance, there are 7 fish/shrimp training centers, 21 shrimp service centers, 9 fish landing centers, 7 fisheries research stations, and only 3 quality control laboratories in the public sector. Still government
Chapter 5
POLICIES, SUPPORT SERVICES, AND INSTITUTIONAL ENVIRONMENT IN FISHERIES
57CHAPTER 5 | Policies and Institutions
investment may still be inadequate because the share of public investment in the fisheries sector declined during the period of 1992-1999, when fisheries contribution to GDP was rising rapidly.
China
Food self-sufficiency has been a central goal of China’s policy. The Tenth Five-year Plan (2000-2005), anchored on market-based approaches, called for agricultural production growth, raising farm incomes, and eliminating poverty. Like other sectors in the Chinese economy, the fisheries sector has also benefited from the reform efforts towards market liberalization. The first policy milestone for this sector is the renewal of the long-term land lease (30-50 years) introduced in 1994-95. This made a tremendous impact on an overall agricultural productivity as it removes a major disincentive to making long-term investments in lands and ponds. This, combined with rising demand, has led fish farmers to expand aquaculture areas.
The government has targeted support for fisheries at 8.5 percent of fisheries GDP, much higher than the historical record of public investment. Two important policy measures have been identified, namely: (a) institutional reform and (b) measures in response to technical barriers to trade and sanitary and phyto-sanitary (SPS) aspects. China is now focusing its aquaculture development policy on fish diseases control and prevention by identifying appropriate number and density of sea cages, improvement of seawater systems for indoor tanks, and development of effective vaccines.
After accession to the World Trade Organization (WTO) in 2005, the country has been reconsidering its existing policies to remain competitive in
the world market. The Standing Committee of the National People’s Congress has approved a new Rural Land Contract Law, effective since 1 March 2003. A new approach in water surface tenure has been encouraged and is now under trial to promote investment in infrastructure for aquaculture production, storage, processing, and delivery.
China considers investment in biotechnology as one of the most important measures to improve fish feed production, and to raise both marine and inland fish productivity. Recently, public investment in biotechnology research has increased much faster than in other sectors. The Chinese government has also aimed at improving the efficiency of domestic market by increasing investment in market infrastructure. As part of tax policy reform, the government of China has experimented with a bold rural tax reform in Anhui province, starting in 2000. The reform converts existing fees into taxes that will reduce the direct and indirect burdens imposed upon rural farmers. Another competitiveness measure is the quality standardization of aquatic products in the world market.
India
Currently, India is on its Tenth Five-year National Plan (2002-2007). The Plan states the following goals for fisheries: enhancing production and productivity, generating employment and higher income, improving socioeconomic conditions of fishers and fish farmers, augmenting exports, increasing fish capita consumption, adopting integrated management, and conserving aquatic resources and genetic diversity. With the country’s deepening involvement in world trade, policies have been directed at upgrading domestic processing and post-harvest technologies to international standards.
58 Strategies and Options for Increasing and Sustaining Fisheries and Aquaculture Production to Benefit Poorer Households in Asia
Investments in the sector have been focused on infrastructure development, joint ventures in deep-sea fisheries, and shrimp aquaculture. The country is also implementing a National Program for Fish Seed Development. Credit policies are another window for sectoral promotion. Domestic banks are required to allocate 12 percent of loans for exports, on top of priority sector lending regulations; for preferred sectors, they are also prohibited from charging more than 1.5 percent points below the prime-lending rate. Export taxes on fisheries products and minimum export prices are not imposed.
Indonesia
With the growing importance of fisheries in the national economy, the Indonesian government created a separate Ministry of Marine Affairs and Fisheries (MAF) in 2000. The major theme of sectoral development is the creation of integrated aquaculture zones for both freshwater and brackishwater fisheries. The zoning strategy aims at intensifying aquaculture through the development of entrepreneurship among fishing communities. The strategic aquaculture development program intends to provide quality fish seed supply by developing private hatcheries, creating distribution and marketing channels of seeds, providing training to fish seed farmers, and creating a network of seed information systems. The program also proposes a support system for providing aquaculture technology, product certification, and capital.
Historically, the policy regime has encouraged domestic consumption and fisheries exports. Presidential Decree No. 23 of 1982 promotes mariculture with explicitly higher priority to small-scale farmers and cooperatives. It also allows private investment, both foreign and domestic, to
encourage modern technology adoption; however, foreign investment is restricted in some cases (e.g., shrimp hatchery). From 1980 to 1999, the fisheries sector had been able to mobilize a sizable amount of foreign investment totaling US$ 169.8 million, compared to a public investment of US$ 118.9 million during the same period.
After the economic turmoil of 1997-98, the rescue program “PROTEKAN 1999-2003” identified both capture fisheries and aquaculture as potential growth areas. Infrastructure support, product development, and product diversification were elements of the rescue program. Under the program, capture fisheries was targeted to contribute one-fourth of the total foreign exchange earnings of the entire fisheries sector.
Malaysia
Currently, fisheries have been identified as a priority sector in Malaysia under the Third National Agricultural Policy, covering the period 1999-2010. The policy aims at transforming fisheries into an efficient commercial industry by promoting intensive aquaculture technology through private sector participation and creation of fisheries zones, with necessary infrastructure and support services from the government. It also pledges to intensify research and development to promote new culture systems, genetically improved fish species, and fish feed and fry production. The policy targets a production level of 0.6 million tonnes by the end of 2010; for this purpose, 50,000 hectares of land have been identified as potential areas to be developed as aquaculture industrial zones.
The statutory body on fisheries industry development is the Fisheries Development Authority of Malaysia. Its major responsibility is to regulate fish marketing, develop entrepreneurship,
59CHAPTER 5 | Policies and Institutions
and provide infrastructure support. Fisheries management and regulation fall under the ambit of the Ministry of Fisheries, as well as the State Ministries of Fisheries.
Under the Promotion of Investment Act 1986 and the Income Tax Act 1967, the government provides tax and other investment incentives for certain fishery activities, including spawning, breeding, and farming of aquatic, offshore fisheries, harvesting and processing of aquatic products, and processing of aquaculture feeds. Fishers and fish farmers are eligible to obtain credit from financial institutions, such as the Agricultural Bank Malaysia, through the Agricultural Credit Financing and the Fund for Food schemes.
Philippines
Government planning in the Philippines is centralized and put under the National Economic and Development Authority, which formulates the Medium-term Development Plan. This Plan consolidates all sectoral plans and provides the blueprint for economic and social development, both nationally and by sector. The Plan emphasizes the achievement of food security, reversing the recent trend of net food importation. Priority is given to the fisheries sector, a net food exporter. The Bureau of Fisheries and Aquatic Resources (BFAR) under the Department of Agriculture, together with the local government units, implement fisheries regulations. However, the overall management of coastal resources (including land use decisions, control of polluting activities, and so on) is the responsibility of the Department of Environment and Natural Resources, a separate line agency.
Under the Agricultural and Fisheries Modernization Act of 1997, the government pledges greater access to credit for production, processing and trading of agricultural and aquatic products. The
Philippine Fisheries Code of 1998 provides at least 10 percent of the total available credit and guarantees funds for post-harvest and marketing projects to enhance fish farmers’ competitiveness. The code also grants input incentives in the form of subsidized credit and tax exemption. Under the scheme, the commercial fishers are eligible to obtain subsidized long-term loans as well as tax and duty exemptions to procure or improve fishing vessels and related equipment. The duty and tax rebates are also applicable on fuel consumption for commercial fisheries.
Currently in place is the Ginintuang Masaganang Ani - Countrywide Assistance for Rural Employment and Services Program for fisheries. The credit component of the program includes: (a) income augmentation and livelihood for the self-reliant farmer/fisher; (b) seaweed and fish culture program; and (c) agro-fishery mechanization credit and guarantee program. This credit program provides loans to agro-based small-scale fishers, producers, manufacturers, and traders of fish and seaweed for the acquisition of machines and equipment. The loan amount, depending on the acquisition costs of fishery equipment, is provided with an interest rate of 12 percent.
Sri Lanka
The latest fisheries policy in Sri Lanka is contained in the National Policy and Development Plan of 2002, under the Fisheries and Ocean Resources Sector. The focus of the Plan is on increasing production, improving nutritional status, generating employment opportunities, increasing foreign exchange earnings, and conserving and managing the coastal environment and living aquatic resources. The fisheries plan is implemented by the Department of Fisheries and Aquatic Resources (DFAR).
60 Strategies and Options for Increasing and Sustaining Fisheries and Aquaculture Production to Benefit Poorer Households in Asia
The government encourages joint-venture cooperation with foreign vessels to fish in offshore and high-sea areas. The government-owned Ceylon Fisheries Corporation also enters into partnerships with foreign vessels. The Ceylon-Norway (Cey-Nor) Development Foundation is a government-owned public company engaged in producing fishing boats, nets and input supply.
Currently, the private sector, in cooperation with local communities, is encouraged to initiate investment and entrepreneurship activities whereas the government facilitates and regulates them to ensure best environmental and production practices. The Sri Lankan Board of Investment provides incentives as well as facilitates access to natural resources for the private sector to develop aquaculture.
Management of coastal areas (under a Coastal Zone Management Plan) is implemented by the Coast Conservation Department. The exclusive economic zone (EEZ) is reserved entirely for local fishers. Labor benefits for fishers (pension and social security) are provided for by the Social Division of the DFAR. The government also protects and safeguards fishing rights of inland fishers by relying on stakeholder communities and local authorities.
Thailand
Long a world leader in fisheries exports, Thailand emphasizes fisheries in its national planning process, which is administered by the National Economic and Social Development Board (NESDB). The national fisheries development policy, covering the period 2002-2006, had five principal components, namely, development of fisheries and related organizations; fishery resources and environmental management; aquaculture development, policy on fisheries
beyond Thai waters; and fisheries industry and business development.
The private sector is the principal source of investment in the fisheries industry. The government is active in facilitating raw material acquisition, product certification and regulation to maintain global standards, international trade promotion, and so forth. Fisheries policies highlight the provision of fish feed and seed, labor, capital, and subsidies. Investment in fisheries aims to strengthen the fishers’ community, provide infrastructure for deep-sea fishing, develop advanced aquaculture technology including new species, and enhance efficiency in production and marketing.
The National Board of Investment (BOI) lists aquaculture (except shrimp culture), deep-sea fishing, fish feed manufacturing, trading centers for fisheries products, agro-industry processing zones, and aquariums and ocean marine services as priority activities for investment promotion. As the domestic supply of high-quality fishmeal (with protein content of over 60 percent) is insufficient, the government has reduced tariffs for importing quality fishmeal, along with those of maize and soybeans; the tariff rate stands at 5 percent for imports for sources within the Association of Southeast Asian Nations Free Trade Area (AFTA), and 15 percent from non-AFTA sources.
Current policy on fish seed emphasizes standardization and controls over hatcheries. The Thai government has been providing resources to coastal and freshwater fisheries research stations to develop seed production techniques. There are also species-specific research centers as well as fisheries centers in provinces where fisheries are dominant. Importation of foreign species for breeding and reproduction purposes is tax-exempted.
61CHAPTER 5 | Policies and Institutions
Small-scale fishers (using vessels smaller than 18m in length), as well as commercial fishers who register for a change of damaged gear, are eligible for a diesel fuel subsidy. The government also provides subsidized credit for and price support to tuna fisheries cooperatives for their acquisition of fishing boats at the interest rate of 4 percent, and for long-line tuna fishers at various rates. There is also a special low-interest credit scheme for target fishers at a lower-than-market rate of interest to buy and renovate boats, fishing gears, cages and ponds.
Vietnam
The fisheries sector is now being recognized in the public policy, and its importance grows in terms of earning foreign exchange and alleviating rural poverty. While the fisheries sectoral development remains at its infancy, Vietnam is shifting away from the traditional reliance on inshore capture fisheries towards aquaculture and rationalized exploitation of marine resources. Sustainable fisheries are being guided by the precautionary approach. Aquaculture is the prime target of investment, along with related industries, such as feed production and broodstock hatcheries. Aquaculture development is guided by the following targets: increased production of finfish, shrimp, and other aquatic animals and plants from marine habitats; improved and enhanced shrimp farming technologies; and increased production of freshwater aquaculture, particularly of the high-value species.
A high priority is placed on human resource development in fisheries to strengthen domestic capacity for fisheries research and development, resource management, and aquaculture development. User rights and obligation towards fisheries resources are currently a key issue and
the co-management and community-based management concepts have been tested. Results have so far favored the expansion of these institutional arrangements although the concepts have yet to be incorporated into legislation.
Despite moves towards market liberalization, the private sector remains under considerable government controls by a system of quotas and is obscured by large public investments in fisheries processing. While the government has relaxed its investment policies, slow bureaucratic procedures and inefficient handling of cases, common to many countries in transition, continue to impede investment growth.
Trade and macroeconomic policies
Overview
The recent export surge from developing Asian countries was driven in part by the international trade liberalization, as tariff and non-tariff barriers were lowered, and preferential agreements, such as the generalized system of preferences (GSP), were implemented. Although there is still room for further tariff reduction, it is unlikely that current tariffs are or will be a major constraint on the growth of fish exports from developing countries to developed countries. The future of fish exports from these countries will depend mainly on compliance with food safety standards in the form of Sanitary and Phyto-sanitary (SPS) measures and other standards under the Technical Barriers to Trade (TBT) Agreement. For countries in which post-harvest and processing sectors are dominated by traditional methods, these standards adopted in developed and even developing countries pose as disturbing impediments for future expansion of North-South as well as South-South trade.

62 Strategies and Options for Increasing and Sustaining Fisheries and Aquaculture Production to Benefit Poorer Households in Asia
Country Legal status/National regulations Implementing agency
Bangladesh1 Fish and Fish Products (Inspection on Quality Control) Ordinance 83/89/97
Ministry of Fisheries, Directorate of Fisheries
India2 VoluntaryExport Inspection Council, Marine Products Export Development Authority
Indonesia2 Ministerial Decree 41/1998Department of Fisheries (DOF) Decree 4128/1998
Ministry of Fisheries, Provincial Laboratories
Philippines2 Philippine Fisheries Code, 1998 (and various Fisheries Administrative Orders)
BFAR
Malaysia2 Voluntary Department of Health (on request)
Sri Lanka2 Fish Product (Export) Regulations, 1998 DOF, Sri Lanka Standard Institution
Thailand2 VoluntaryDOF, Food and Drug Administration, National Food Institute, private laboratories
Vietnam2 Voluntary National Fisheries Inspection and Quality Assurance Center, private firms
Table 5.1 Legal Status of HACCP Implementation in the Selected Countries
Sources: 1 Ali and Islam 2002. Standard in fisheries sector vis-à-vis international standard and its role for promoting export. Paper presented at the National Workshop on Sanitary and Phyto-sanitary Measures, Tariff Commission, Dhaka, Bangladesh, May 2002. 2 Based on field visits by the authors.
CountryPre-WTO Post-WTO
Year Tariff rate Year Tariff rate
China 1991 47.2 2001 11.7-23.3
Thailand 1995 60 1999 5-30
Philippines 1994 10-60 2000 3-5
India 1993-94 60 2002/3 35.20
Bangladesh 1991-92 59.33 2000/1 28.23
Malaysia na na 2010 5
Table 5.2 Average Tariff Rates (%) of Fisheries Products in Selected Developing Countries Before and After WTO Accession
Source: Compiled from WTO and official documents.
63CHAPTER 5 | Policies and Institutions
The implementation of SPS for fisheries products has largely shifted from product inspection to certification methods based on hazard analysis and critical control points (HACCP). This approach requires that harvest, post-harvest, and processing standards are observed along key stages of the production-processing-distribution pathway. Institutional responses within the selected countries to maintain HACCP compliance are summarized in Table 5.1.
Despite the initial setup costs, clearly the selected countries have been making considerable headway in HACCP implementation. They now come under the top compliance category based on classifications of the European Union (EU) and the Food and Agriculture Organization (FAO) (Dey et al. 2004b). Compliance rates are highest in Malaysia and Thailand, the two most developed countries in the region, despite the fact that HACCP compliance remains voluntary. Nonetheless, major difficulties in overcoming technical barriers to trade exist in all countries.
WTO membership has compelled developing countries to liberalize their domestic markets. Tariff reductions undertaken in a subset of the selected countries are shown in Table 5.2. Along with these cuts, many of the developing countries have also taken initiatives to eliminate quotas and subsidies. China and Thailand have already eliminated quotas and subsidies from the production and processing of fisheries products. Nevertheless, significant tariffs remain for some fisheries products (except for the Philippines).
India and Bangladesh in particular still maintain high tariff walls due to fears of dislocation for affected sector. The WTO has, therefore, extended the deadline for full compliance to 2005. The following review discusses the progress and
setbacks of individual countries with respect to trade reforms and implementation of international trade standards.
Bangladesh
Over the last decade, the government of Bangladesh has been focusing on increasing non-traditional exports, such as fish and fisheries products, and textile and garments. The public sector subsidizes interest rates on working capital of exportable commodities, extends an export performance bonus scheme, and exempts the import of machinery for export-oriented industries from import duties and excise taxes. During the last couple of years, the government devalued its currency against the US dollar several times, culminating in the free float of the exchange rate.
In 1997, the government amended its Fish and Fish Product (Inspection and Quality Control) Ordinance of 1983 and related rules of 1989 in order to accommodate HACCP procedures (Ali and Islam 2002). Currently, there are 129 fish processing plants in Bangladesh, producing for both domestic markets and for export to the EU, USA, and Japan. Sixty of those in operation have the capacity to process 250,000 tonnes of fish annually. However, due to scarcity of raw materials, only 20-25 percent of the installed capacity can be utilized. Fifty-three of these plants have an approval to export to the EU.
Bangladesh exports continue to be vulnerable to regulatory barriers in foreign markets. For instance, in 2002, Bangladesh experienced a 10 percent decline in its shrimp exports because of perceived quality differences, resulting in a loss of US$30 million in value. Another threat is the imminent withdrawal of the GSP treatment it receives from the EU, after the full implementation of WTO rules from 2005 onwards.
64 Strategies and Options for Increasing and Sustaining Fisheries and Aquaculture Production to Benefit Poorer Households in Asia
China
China has pursued a tariff reduction program, with the average tariff rates expected to fall to between 10 and 12 percent by 2005 (Table 5.3). Until 2004, a few aquatic products, such as live prawns and fresh or chilled fish fillets, faced protective tariff rates of 24 percent; from 2005 onwards, these rates are expected to be cut by half.
These moderate reductions (accompanying China’s accession to WTO) are not expected to subject most of the fisheries sector to large import shocks. However, specific sectors may be subject to strain, as in the case of live prawn and fillets. A major policy gap in China is the absence of legislation to address HACCP implementation; the country has been considering institutional reforms to deal with SPS-HACCP and TBT.
India
India is another country that has rapidly reduced tariffs on fisheries products, from 60 percent in 1993-94 to 24 percent in 1998/99. In 2000, it removed quality restrictions on 715 items, including fisheries products (more than 120 items). However, in 2000/01 the tariff rate was momentarily raised to 44 percent, and quickly cut back to 35 percent after a year.
The quality and food safety measures are maintained under a number of rules and regulations that are enforced by many different agencies. The Bureau of Indian Standards has been designated as the WTO-TBT enquiry point, and the Ministry of Commerce is responsible for implementing and administering the WTO agreements on TBT. India also has accepted the Code of Good Practices in 1995.
The competitiveness of fisheries exports of India has been substantially eroded with the SPS
compliance because the costs of restructuring the industries are higher than in other countries, such as Thailand and Malaysia. Across the subcontinent, many processing plants are relatively small and geographically dispersed, making full implementation of HACCP problematic. For instance, its exports to the USA have faced rejection due to the presence of Salmonella bacteria.
Indonesia
Although a deregulation policy was announced in Indonesia in May 1995, there has been little progress with respect to the elimination of government interventions in the market. The 15 percent or more tariff and import charges imposed on a number of commodities were reduced to 11 percent after 1995. While tariffs on fisheries products were planned to reach a maximum of 5 percent by 2002, implementation had been severely delayed. Recently, however a deregulation package reaffirmed its commitments to AFTA through implementing major tariff cuts by 2003.
Compliance with international product standards has also been a top concern of government policies. Harmonization and direct negotiations with importing countries have been pursued, resulting in a Memorandum of Understanding with Canada on quality control systems, a similar agreement with the EU, and a de facto acknowledgment by the USA’s Food and Drug Administration.
Malaysia
Although Malaysia is a net importer of fish in terms of quantity, it is a net exporter in terms of value. Over the period 1989-98, the value of fish exports almost doubled. Its penetration of foreign markets may be linked to its handling of international food safety regulations. The EU and the USA have recognized the HACCP certificate issued by
65CHAPTER 5 | Policies and Institutions
the Malaysian Ministry of Health. While HACCP compliance remains voluntary, applications are numerous. Twenty out of 50 applications have been approved, with more companies being anticipated to apply for certification in the near future. The government has also taken measures to ensure that fish catches from the sea are of high quality and safe for consumption. It has identified 33 sampling sites in the coastal zones to test for freshness and level of contaminants.
Philippines
The Philippines continues to enjoy the GSP privilege for certain products in the major fish importing countries, such as the USA, EU, and Japan over the period 1995-2005. It will continue to enjoy the maximum GSP advantage from the USA for its export of shrimp/prawn and tuna at the tariff rate 0 per cent and 3.2 percent for seaweeds. Specifically, for shrimp and tuna exported to Japan, tariffs are only 4.8 and 3.5 percent, respectively, and no tariff for seaweeds. However, the rates are much higher for the EU countries, i.e., shrimp/prawns and tuna face rates of 12 and 22 percent, respectively, during the same period; seaweeds are again tax-free. As for other countries, the Philippines has to comply with non-tariff barriers, such as HACCP and SPS measures. The BFAR acts as the accrediting agency, as authorized by the major importing countries.
Public sector investments on the infrastructure of these food safety and health regulatory institutions are constrained by the centralized administrative structure. Besides, the BFAR is slow in accelerating the process of inspection of plants and in providing certification to fish and fish product exporters. By 2001, BFAR had only certified 36 processing plants, a crucial step in the process of obtaining EU approval.
Sri Lanka
Substandard handling and processing technologies have seriously impeded Sri Lankan fisheries exports. About 30-40 percent of catch landed by the fishing boats is of low quality; the major causes of this loss are poor handling and ineffective post-harvest technologies. The Department of Fisheries (DOF) addresses this problem through its Fishery Product Quality Control Division to achieve HACCP compliance. The government has also published hygiene and safety regulations to guide exporters of processed fisheries products.
Thailand
The government of Thailand has taken a number of steps to open its domestic markets to foreign trade. Tariffs on maize and soybean feeds from AFTA countries have been reduced; importation of foreign species for breeding and reproduction purposes is likewise tax-exempt. Since 2002, selected fish and fishery products have been exempted from import duties and taxes. These measures have stimulated fisheries imports from adjacent countries, such as Myanmar, Vietnam and Cambodia, for processing and subsequent export to developed countries.
Externally, Thai fisheries have been facing tariff and non-tariff barriers as well. Since 1999, it has lost the GSP offered by the EU and has faced the tariff rate of 14.4 percent while its competitors are tax-free. As a result, the Thai prawn industry has lost about 50 percent of its market share. The EU also subsidizes European canned tuna, the measure that also decreases the share of Thai canned tuna in the US market. With higher tariff rates and requirement for product standardization, competitiveness of Thai canned and processed seafood for exports may further
66 Strategies and Options for Increasing and Sustaining Fisheries and Aquaculture Production to Benefit Poorer Households in Asia
erode. Nevertheless, Thailand remains optimistic that WTO membership will secure further reduction in both tariff and non-tariff barriers.
Thailand’s seafood industries have generally adopted SPS measures. Almost all export-oriented fish processing industries have complied with HACCP as well as requirements imposed by importing countries. Thailand pioneered in setting up a two-step method of quality control. Under this system, fish processing plants become eligible for HACCP certification after satisfying the conditions set for the good manufacturing practices.
The domestic fish processing industry has undergone rapid technical change, switching to semi-automated processes since 1991 to achieve higher yields, better quality and faster production cycles. Processing and post-harvest technologies have been developed and improved for frozen, canned, retort pouch, and comminuted products. Preservation technology for dried and fermented products uses modern equipment and technology to extend shelf life and to improve their quality standards.
However, modern processing plants have been plagued by intermittent excess capacity, as supplies of raw materials remain unstable in terms of timeliness, quantity, and quality. Smaller plants, furthermore, have difficulties adopting new technologies, partly due to difficulties in securing access to credit to fund the requisite investments. Even Thailand is not immune to arbitrary changes of safety standards in importing countries. In addition, there is still much to do to improve internal standards compliance. A major problem is the dispersal of the authority to issue HACCP certification to different government agencies
(DOF and Ministry of Health), as well as to a semi-public institute (National Food Institute) and accredited private laboratories. This has resulted in procedural overlap, interagency competition, and confusion on the part of processors.
Vietnam
Vietnam plans to join the WTO in the near future. Export regulations have been made more transparent, and the role of private exporters, more important. The government has already implemented measures to promote HACCP, resulting in the certification in 2000 of 51 fisheries processing firms, or about 21 percent of the total number of such firms. Three concerns being addressed are: equivalence with domestic standards of importing countries; building capacity in certification bodies and private sector processors; and strengthening post-harvest and processing industries. The government has also attempted to raise global awareness of Vietnamese fisheries products, spending US$ 170,000 in 2001 for international trade promotion. Support Services
Development and growth in the fisheries sector are sustainable only if complemented by adequate support services. Training, extension, credit, skilled human resource, and market infrastructure lay the groundwork for increasing productivity and competitiveness. However, the establishment of an adequate support system is a daunting task because it requires considerable investments, meticulous planning, and integration of activities to assure quality and timeliness in service delivery over the entire supply chain. Traditionally, support services were focused on capture fisheries, but recently service delivery has been shifting to aquaculture.

67CHAPTER 5 | Policies and Institutions
Extension
In the selected countries, extension systems have been at the forefront of disseminating techno-logical innovations to enhance productivity. The availability and quality of such support services vary across Asian countries, depending on sector importance and government priorities. China has the most effective extension service, consisting of 2,792 stations and employing over 15,000 field staff. In the other countries, extension and training activities are proactive to facilitate quick adoption of new technologies.
The flow of new knowledge or information to fish producers follows more or less the same trend in most countries, that is, from the source (national) to provincial (state) and municipal (district) offices. In national systems where fisheries fall under the agriculture ministry, overlapping and competition on service delivery are inevitable under a pooled support system, in which the same resources and facilities are shared among several departments of a ministry.
Credit
Credit support is essential for development and growth of any industry. In fisheries, both formal credit sources (commercial banks, finance companies, and government-initiated institutions and schemes) and informal ones (money lenders, traders, relatives, and others) are available to fishing communities for production, processing, and marketing. However, small fisheries investors reported difficulties in gaining access to the formal sector, even prior to Asia’s financial crisis in 1997. The perceived risks of fisheries investments vis-à-vis agricultural loans, along with inadequate collateral, are two main reasons for this difficulty, especially for small-loan applications. Hence,
poor fishers remain dependent on informal credit, which is far easier to obtain but charges a hefty interest rate. In contrast, large firms and listed companies that have been drawn into the fish sector have had good access to bank borrowings in recent years.
Most Asian governments (Malaysia, Bangladesh, Indonesia, and Thailand) assist fishers through the provision of loans, often subsidized, channeled to fisheries associations, special agencies (agricultural banks, Indonesian Peoples’ Bank) and loan schemes (Special Agricultural Credit Scheme and Fund for Food Scheme in Malaysia). In Thailand, Indonesia, and the Philippines, contract farming of prawns and tilapia awarded to small-scale farmers by big firms has enabled the disadvantaged poor to reap some of the benefits of large-scale operators.
The recent aquaculture and export boom has prompted international funding agencies to extend more loans to developing countries than in the past. The ADB, World Bank, and various bilateral institutions (such as the United States Agency for International Development (USAID), UK Department for International Development (DFID), and Danish International Development Agency (Danida) have been active in funding resource management, aquaculture development, and post-harvest and processing projects.
Ancillary Support Services
Ancillary support services, such as administration, input delivery, and market infrastructure, are important complements to the present production-oriented support services. However, these support services have received little attention from planners and are generally weakly organized or at the rudimentary stages of development.

68 Strategies and Options for Increasing and Sustaining Fisheries and Aquaculture Production to Benefit Poorer Households in Asia
Aquatic productsTariff rate (as of December 2001)
Final bound tariff rateYear of final bound
tariff rate
Live eels 16 10 2004
Other live fish 12 10.5 2002
Fresh or chilled fish - Trout
- Pacific salmon- Herrings
1211.7
16
121012
200220022003
Frozen fish- Trout- Eels- Pacific salmon
121616
121210
200220032004
Fresh or chilled fish fillets 24 12 2005
Frozen fish fillets 23.3 10 2005
Frozen shelled shrimp and prawn
Frozen unshelled shrimp and prawn
17.5 5 2003
Frozen crabs 23.3 10 2005
Table 5.3 Tariff Rates (%) on Selected Aquatic Products in China
Source: China’s WTO Protocol of Accession, November 2001.
Country R & DExtension
and training
Human resource
skillCredit
AdministrationInput Market
Bangladesh F F F P F F P
China S S S S F F S
India S F F P P F P
Indonesia F F F F P F F
Malaysia S S S S F F F
Philippines S S S P F F F
Sri Lanka F P F P P P P
Thailand S S S S F F S
Vietnam P F P P P P P
Table 5.4 Adequacy of Support Services for Fisheries in the Selected Countries
Note: S - strong (well-defined goals, institutional infrastructure in operation, and beneficial to the target groups); F - fair (services available but yet to make significant impact on target groups); P - poor (absent or uncoordinated effort with little impact on target groups);Source: Expert opinion elicited during the ADB-RETA 5945 Regional Workshop in Penang, 1-16 June 2004.
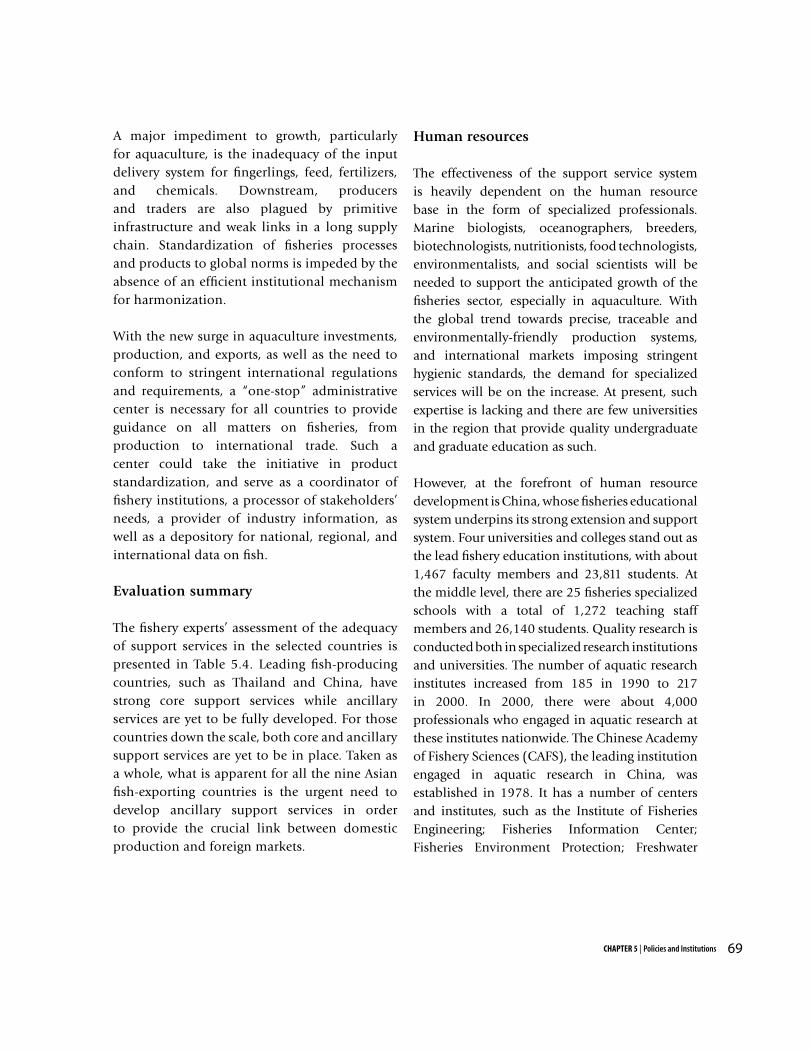
69CHAPTER 5 | Policies and Institutions
A major impediment to growth, particularly for aquaculture, is the inadequacy of the input delivery system for fingerlings, feed, fertilizers, and chemicals. Downstream, producers and traders are also plagued by primitive infrastructure and weak links in a long supply chain. Standardization of fisheries processes and products to global norms is impeded by the absence of an efficient institutional mechanism for harmonization.
With the new surge in aquaculture investments, production, and exports, as well as the need to conform to stringent international regulations and requirements, a “one-stop” administrative center is necessary for all countries to provide guidance on all matters on fisheries, from production to international trade. Such a center could take the initiative in product standardization, and serve as a coordinator of fishery institutions, a processor of stakeholders’ needs, a provider of industry information, as well as a depository for national, regional, and international data on fish.
Evaluation summary
The fishery experts’ assessment of the adequacy of support services in the selected countries is presented in Table 5.4. Leading fish-producing countries, such as Thailand and China, have strong core support services while ancillary services are yet to be fully developed. For those countries down the scale, both core and ancillary support services are yet to be in place. Taken as a whole, what is apparent for all the nine Asian fish-exporting countries is the urgent need to develop ancillary support services in order to provide the crucial link between domestic production and foreign markets.
Human resources
The effectiveness of the support service system is heavily dependent on the human resource base in the form of specialized professionals. Marine biologists, oceanographers, breeders, biotechnologists, nutritionists, food technologists, environmentalists, and social scientists will be needed to support the anticipated growth of the fisheries sector, especially in aquaculture. With the global trend towards precise, traceable and environmentally-friendly production systems, and international markets imposing stringent hygienic standards, the demand for specialized services will be on the increase. At present, such expertise is lacking and there are few universities in the region that provide quality undergraduate and graduate education as such.
However, at the forefront of human resource development is China, whose fisheries educational system underpins its strong extension and support system. Four universities and colleges stand out as the lead fishery education institutions, with about 1,467 faculty members and 23,811 students. At the middle level, there are 25 fisheries specialized schools with a total of 1,272 teaching staff members and 26,140 students. Quality research is conducted both in specialized research institutions and universities. The number of aquatic research institutes increased from 185 in 1990 to 217 in 2000. In 2000, there were about 4,000 professionals who engaged in aquatic research at these institutes nationwide. The Chinese Academy of Fishery Sciences (CAFS), the leading institution engaged in aquatic research in China, was established in 1978. It has a number of centers and institutes, such as the Institute of Fisheries Engineering; Fisheries Information Center; Fisheries Environment Protection; Freshwater

70 Strategies and Options for Increasing and Sustaining Fisheries and Aquaculture Production to Benefit Poorer Households in Asia
Aquatic Research Center; and Aquatic Research Institutes of Eastern China Sea, of Huanghai, of Yangtze River, and of Zhujiang River; etc.
Given the vast potential for increasing aquaculture output in the nine Asian fish-exporting countries, it is not premature to propose the establishment of a regional center (such as the Asian Institute of Management and the Asian Institute of Technology) for advanced education, research, and training in tropical fisheries sciences and management. Furthermore, such a center can provide an avenue to pool the regions’ brainpower and experiences and to promote regional collaboration.
Fisheries Institutions
Overview
Aquatic resources are vulnerable to over-exploitation due to their open access and common pool properties. Institutional arrangements at the local, regional, and international levels are essential to sustain the resource base. These arrangements determine the allocation of rights as well as the implementation of rules.
Previously, the problem of overfishing was interpreted in terms of international encroachment. However, in 1982, coastal countries ratified the United Nations Convention on the Law of the Sea, which demarcates the EEZ of each marine state. Problems of encroachment (intentional or unintentional) still exist, as EEZs at certain points may be unclear, unmarked and overlapping with other claims. However, fisheries management has practically been nationalized worldwide; nevertheless, overexploitation remains a problem, highlighting the complexity of interactions among users, institutional arrangements, and the resource base. This complexity poses tremendous challenges for institutional policies and design.
Fisheries laws and regulations
A list of fisheries laws, regulations, and informal rules in the selected countries is presented in Appendix 2, Table 1. In countries where formal laws and regulations are extensively applied, informal laws seem to be less significant. In a situation when formal rules are not covering dominant aspects of fisheries management or when enforcement of formal laws is weak, the gaps are filled by informal rules. China, Indonesia, Malaysia, Sri Lanka, and Thailand are examples where formal laws extensively cover the most important aspects of fisheries management. In Bangladesh, the Philippines, and Vietnam, informal rules, such as customary and traditional knowledge, play equally important roles especially at the grassroots level. India has fairly sufficient formal laws, but these laws cover few extensive topics on fisheries management.
An assessment of the fisheries laws and regulations in the selected countries is summarized in Table 5.5. All the countries seem to have sufficient implementing agencies equipped with all necessary legal instruments. However, in all these countries implementation effectiveness is questionable due to institutional capability, overlapping tasks, and implementation transparency. Corruption remains an endemic problem in some countries. Countries plagued by weak institutions at the national level are also poor at the enforcement of fisheries regulations.
Property and access rights to fisheries
Fisheries rights have been used as effective instruments for the allocation and conservation of fisheries resources. As shown in Appendix 2, Table 2, all the countries clearly define their fisheries resources rights. Sri Lanka has a slightly more

71CHAPTER 5 | Policies and Institutions
complicated assignment of rights. Bangladesh, India, and Sri Lanka have defined their fisheries rights to benefit primarily disadvantaged groups. Indonesia, Malaysia, the Philippines, and Thailand have applied zoning to clarify fisheries rights, with zones bordering the coast reserved for local communities. In the Philippines, fisheries rights are clearly defined and assured by legal and formal institutions. An assessment of the property rights framework in the selected countries is summarized in Table 5.6. In all these countries, formal and legal instruments are sufficient to guarantee fisheries rights. However, informal instruments tend to be overshadowed by legal and formal institutions, such as in China and Vietnam, or otherwise weak as in Bangladesh, India, and Thailand. In the case of Sri Lanka and the Philippines, the informal assurance of rights is recognized more than in the other countries.
Local governments and communities
Management approaches in development are increasingly adopting the principle of “subsidiarity”, i.e., the delegating of authority to the unit closest to the resource or organization being managed. This is concretely expressed by moves towards decentralization, co-management, and community-based management. Appendix 2, Table 3 summarizes the decentralization policy and management arrangements at the community level in the nine Asian fish-exporting countries. The Philippines is the most advanced country in this respect as it has legally devolved central authority to the local level since 1991. Indonesia and Thailand have followed the trend. China and Vietnam have strong centralized policy in public administration, which is reflected in state-controlled management. Other countries, such as Bangladesh, India, and Sri Lanka, are unclear on their decentralization policies.
Table 5.7 contains a summary of a qualitative assessment of the progress made in the area of community management and decentralization. All the countries, which have actively sponsored decentralization, have also officially supported community-based management of fisheries, whether in the form of community management or co-management. This management system is being tested in Bangladesh and Indonesia, is in the process of being legally recognized in Vietnam, is being encouraged or promoted in Sri Lanka and Thailand, has advanced considerably in the Philippines, but is not promoted in China, India, and Malaysia.
The private sector and the international community
A summary of the roles of local organizations, the private sector, and NGOs in fisheries management in the nine Asian fish-exporting countries is provided in Appendix 2, Table 4. In all the countries, the private sector is uniformly dominant in the investment side of fisheries production, processing, and trade, while local organizations show varying degrees of involvement in fisheries management; they are considered very important in Indonesia, the Philippines, Sri Lanka, and Vietnam and are becoming increasingly important in Bangladesh, China, India, and Thailand. As may be seen in Table 5.8, the roles of NGOs are very important in Bangladesh and the Philippines, fairly important in Sri Lanka and Thailand, but not so in China, India, Indonesia, Malaysia, and Vietnam.
As shown in Appendix 2, Table 5, most of the nine Asian fish-exporting countries are active in international involvement, either receiving or providing technical and financial support, but the degrees of involvement vary (Table 5.9). While
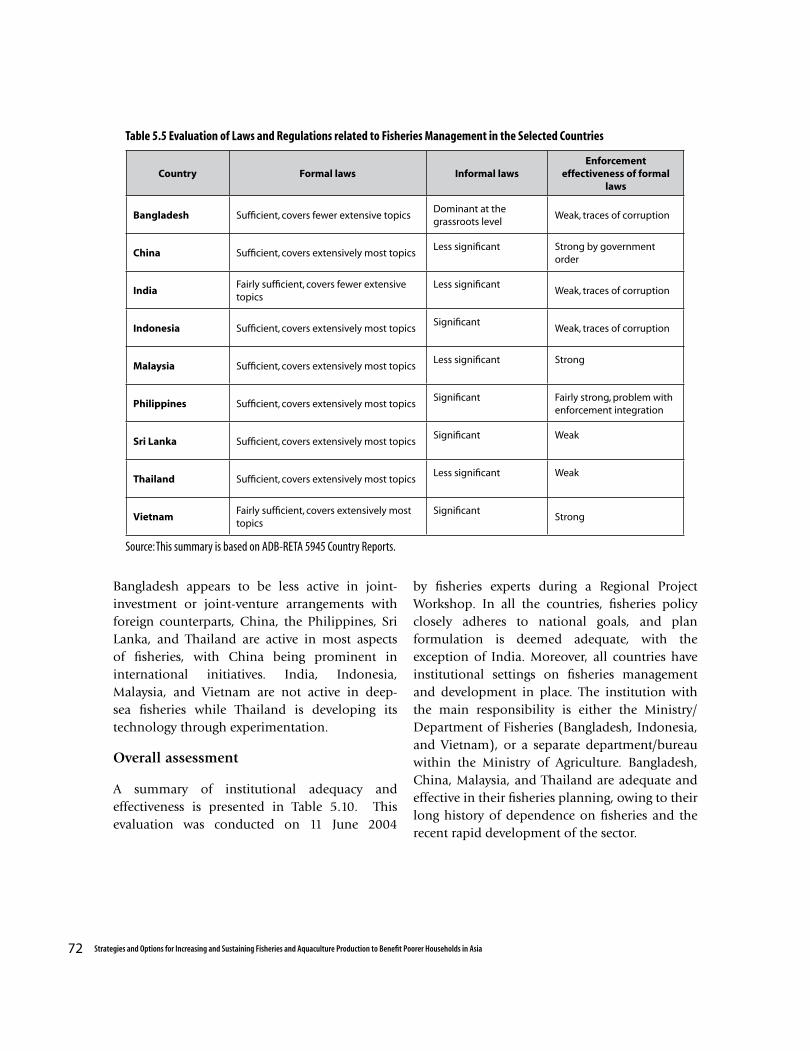
72 Strategies and Options for Increasing and Sustaining Fisheries and Aquaculture Production to Benefit Poorer Households in Asia
Country Formal laws Informal lawsEnforcement
effectiveness of formal laws
Bangladesh Sufficient, covers fewer extensive topicsDominant at the grassroots level
Weak, traces of corruption
China Sufficient, covers extensively most topicsLess significant Strong by government
order
IndiaFairly sufficient, covers fewer extensive topics
Less significantWeak, traces of corruption
Indonesia Sufficient, covers extensively most topicsSignificant
Weak, traces of corruption
Malaysia Sufficient, covers extensively most topicsLess significant Strong
Philippines Sufficient, covers extensively most topicsSignificant Fairly strong, problem with
enforcement integration
Sri Lanka Sufficient, covers extensively most topicsSignificant Weak
Thailand Sufficient, covers extensively most topicsLess significant Weak
VietnamFairly sufficient, covers extensively most topics
SignificantStrong
Table 5.5 Evaluation of Laws and Regulations related to Fisheries Management in the Selected Countries
Source: This summary is based on ADB-RETA 5945 Country Reports.
Bangladesh appears to be less active in joint-investment or joint-venture arrangements with foreign counterparts, China, the Philippines, Sri Lanka, and Thailand are active in most aspects of fisheries, with China being prominent in international initiatives. India, Indonesia, Malaysia, and Vietnam are not active in deep-sea fisheries while Thailand is developing its technology through experimentation.
Overall assessment
A summary of institutional adequacy and effectiveness is presented in Table 5.10. This evaluation was conducted on 11 June 2004
by fisheries experts during a Regional Project Workshop. In all the countries, fisheries policy closely adheres to national goals, and plan formulation is deemed adequate, with the exception of India. Moreover, all countries have institutional settings on fisheries management and development in place. The institution with the main responsibility is either the Ministry/Department of Fisheries (Bangladesh, Indonesia, and Vietnam), or a separate department/bureau within the Ministry of Agriculture. Bangladesh, China, Malaysia, and Thailand are adequate and effective in their fisheries planning, owing to their long history of dependence on fisheries and the recent rapid development of the sector.
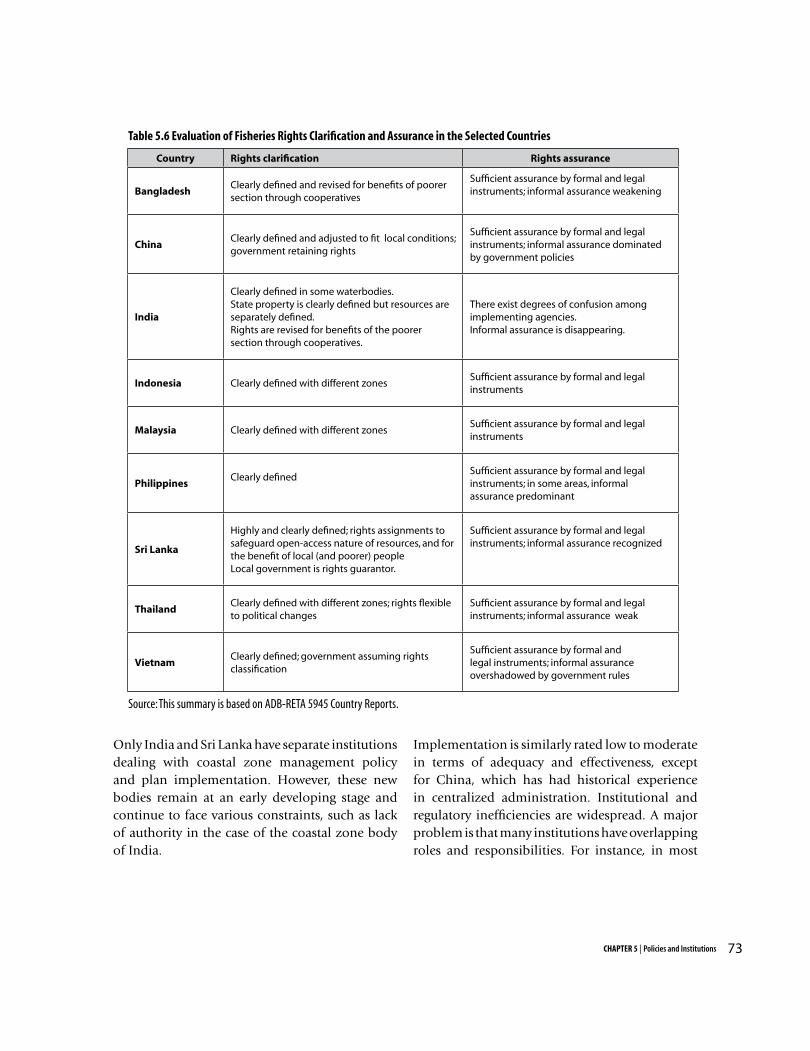
73CHAPTER 5 | Policies and Institutions
Country Rights clarification Rights assurance
BangladeshClearly defined and revised for benefits of poorer section through cooperatives
Sufficient assurance by formal and legal instruments; informal assurance weakening
ChinaClearly defined and adjusted to fit local conditions; government retaining rights
Sufficient assurance by formal and legal instruments; informal assurance dominated by government policies
India
Clearly defined in some waterbodies. State property is clearly defined but resources are separately defined. Rights are revised for benefits of the poorer section through cooperatives.
There exist degrees of confusion among implementing agencies.Informal assurance is disappearing.
Indonesia Clearly defined with different zonesSufficient assurance by formal and legal instruments
Malaysia Clearly defined with different zonesSufficient assurance by formal and legal instruments
PhilippinesClearly defined
Sufficient assurance by formal and legal instruments; in some areas, informal assurance predominant
Sri Lanka
Highly and clearly defined; rights assignments to safeguard open-access nature of resources, and for the benefit of local (and poorer) people Local government is rights guarantor.
Sufficient assurance by formal and legal instruments; informal assurance recognized
ThailandClearly defined with different zones; rights flexible to political changes
Sufficient assurance by formal and legal instruments; informal assurance weak
VietnamClearly defined; government assuming rights classification
Sufficient assurance by formal and legal instruments; informal assurance overshadowed by government rules
Table 5.6 Evaluation of Fisheries Rights Clarification and Assurance in the Selected Countries
Source: This summary is based on ADB-RETA 5945 Country Reports.
Only India and Sri Lanka have separate institutions dealing with coastal zone management policy and plan implementation. However, these new bodies remain at an early developing stage and continue to face various constraints, such as lack of authority in the case of the coastal zone body of India.
Implementation is similarly rated low to moderate in terms of adequacy and effectiveness, except for China, which has had historical experience in centralized administration. Institutional and regulatory inefficiencies are widespread. A major problem is that many institutions have overlapping roles and responsibilities. For instance, in most
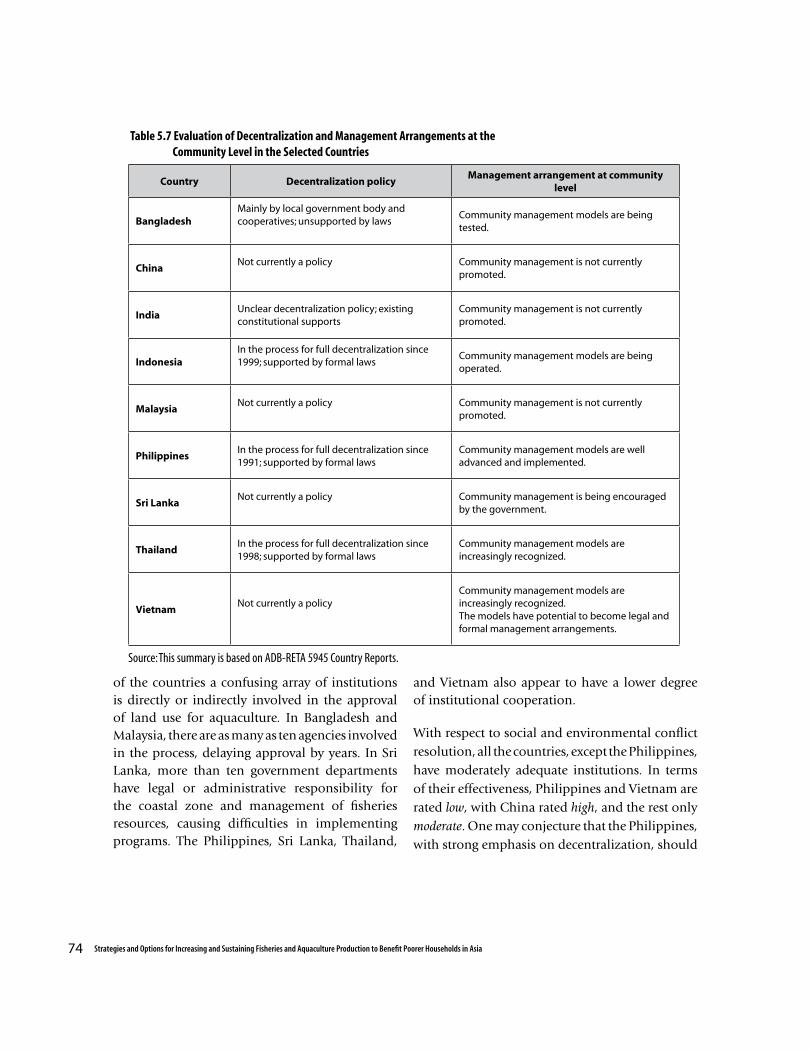
74 Strategies and Options for Increasing and Sustaining Fisheries and Aquaculture Production to Benefit Poorer Households in Asia
Country Decentralization policyManagement arrangement at community
level
BangladeshMainly by local government body and cooperatives; unsupported by laws
Community management models are being tested.
ChinaNot currently a policy Community management is not currently
promoted.
IndiaUnclear decentralization policy; existing constitutional supports
Community management is not currently promoted.
IndonesiaIn the process for full decentralization since 1999; supported by formal laws
Community management models are being operated.
MalaysiaNot currently a policy Community management is not currently
promoted.
PhilippinesIn the process for full decentralization since 1991; supported by formal laws
Community management models are well advanced and implemented.
Sri LankaNot currently a policy Community management is being encouraged
by the government.
ThailandIn the process for full decentralization since 1998; supported by formal laws
Community management models are increasingly recognized.
VietnamNot currently a policy
Community management models are increasingly recognized.The models have potential to become legal and formal management arrangements.
Table 5.7 Evaluation of Decentralization and Management Arrangements at the Community Level in the Selected Countries
Source: This summary is based on ADB-RETA 5945 Country Reports.
of the countries a confusing array of institutions is directly or indirectly involved in the approval of land use for aquaculture. In Bangladesh and Malaysia, there are as many as ten agencies involved in the process, delaying approval by years. In Sri Lanka, more than ten government departments have legal or administrative responsibility for the coastal zone and management of fisheries resources, causing difficulties in implementing programs. The Philippines, Sri Lanka, Thailand,
and Vietnam also appear to have a lower degree of institutional cooperation.
With respect to social and environmental conflict resolution, all the countries, except the Philippines, have moderately adequate institutions. In terms of their effectiveness, Philippines and Vietnam are rated low, with China rated high, and the rest only moderate. One may conjecture that the Philippines, with strong emphasis on decentralization, should
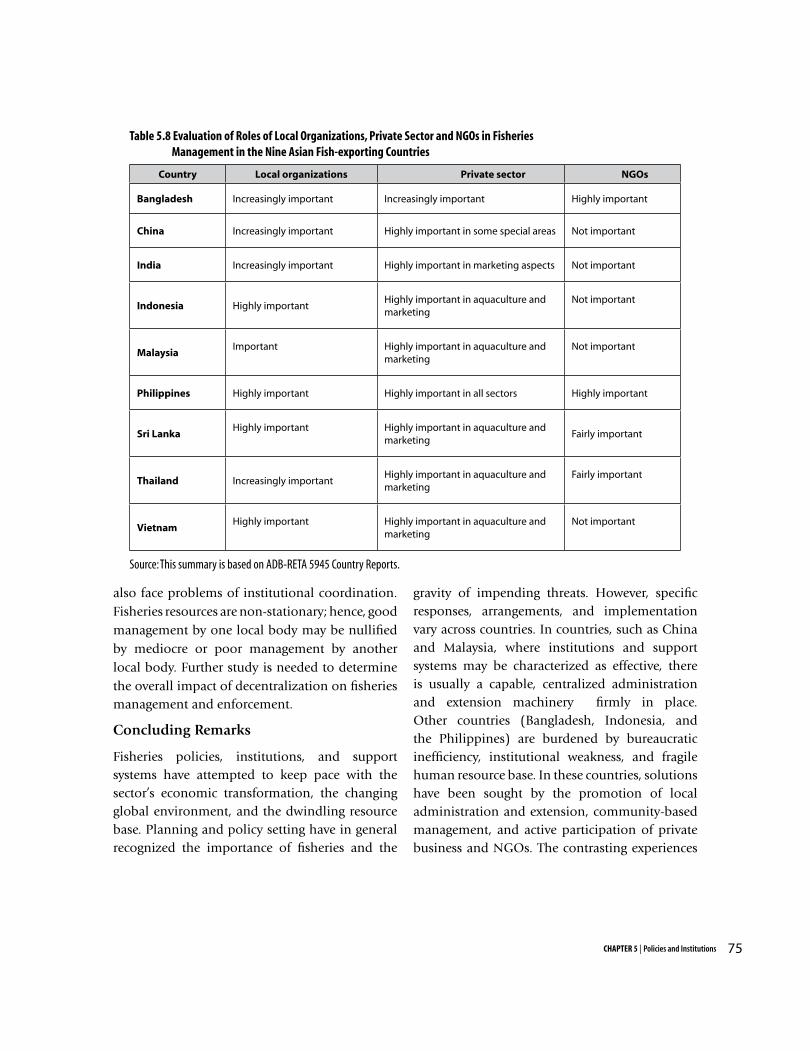
75CHAPTER 5 | Policies and Institutions
Country Local organizations Private sector NGOs
Bangladesh Increasingly important Increasingly important Highly important
China Increasingly important Highly important in some special areas Not important
India Increasingly important Highly important in marketing aspects Not important
Indonesia Highly importantHighly important in aquaculture and marketing
Not important
MalaysiaImportant Highly important in aquaculture and
marketingNot important
Philippines Highly important Highly important in all sectors Highly important
Sri LankaHighly important Highly important in aquaculture and
marketingFairly important
Thailand Increasingly importantHighly important in aquaculture and marketing
Fairly important
VietnamHighly important Highly important in aquaculture and
marketingNot important
Table 5.8 Evaluation of Roles of Local Organizations, Private Sector and NGOs in Fisheries Management in the Nine Asian Fish-exporting Countries
Source: This summary is based on ADB-RETA 5945 Country Reports.
also face problems of institutional coordination. Fisheries resources are non-stationary; hence, good management by one local body may be nullified by mediocre or poor management by another local body. Further study is needed to determine the overall impact of decentralization on fisheries management and enforcement.
Concluding Remarks
Fisheries policies, institutions, and support systems have attempted to keep pace with the sector’s economic transformation, the changing global environment, and the dwindling resource base. Planning and policy setting have in general recognized the importance of fisheries and the
gravity of impending threats. However, specific responses, arrangements, and implementation vary across countries. In countries, such as China and Malaysia, where institutions and support systems may be characterized as effective, there is usually a capable, centralized administration and extension machinery firmly in place. Other countries (Bangladesh, Indonesia, and the Philippines) are burdened by bureaucratic inefficiency, institutional weakness, and fragile human resource base. In these countries, solutions have been sought by the promotion of local administration and extension, community-based management, and active participation of private business and NGOs. The contrasting experiences
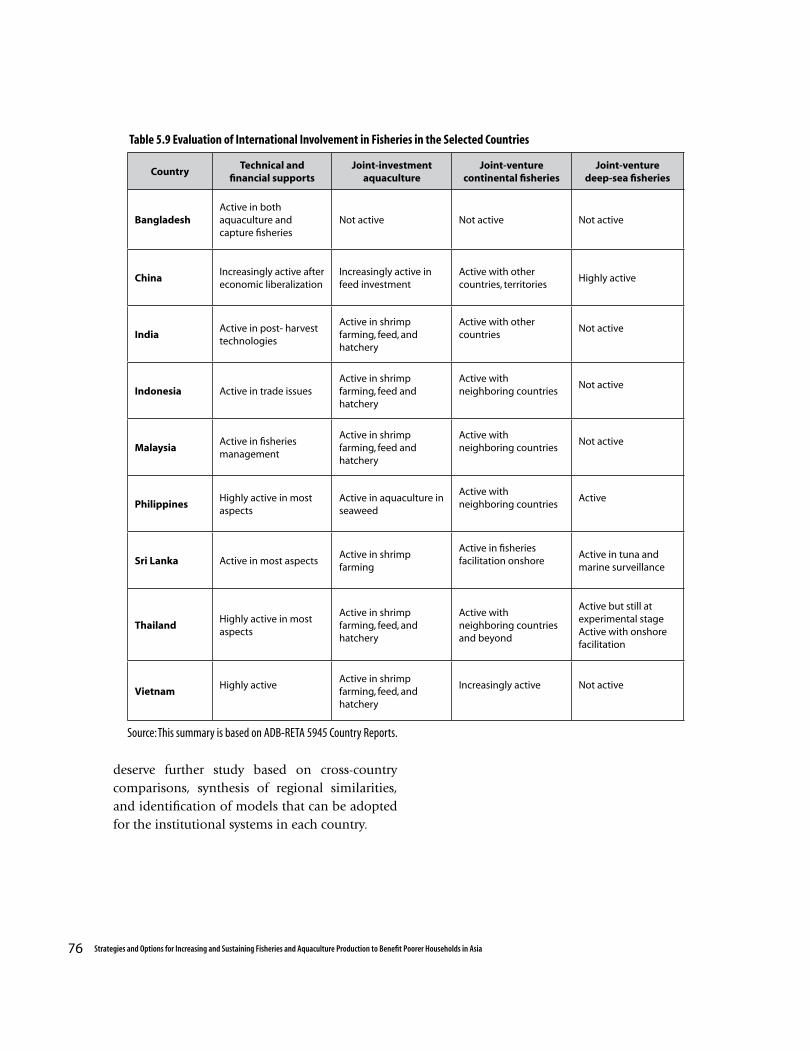
76 Strategies and Options for Increasing and Sustaining Fisheries and Aquaculture Production to Benefit Poorer Households in Asia
CountryTechnical and
financial supportsJoint-investment
aquacultureJoint-venture
continental fisheriesJoint-venture
deep-sea fisheries
BangladeshActive in both aquaculture and capture fisheries
Not active Not active Not active
ChinaIncreasingly active after economic liberalization
Increasingly active in feed investment
Active with other countries, territories
Highly active
IndiaActive in post- harvest technologies
Active in shrimp farming, feed, and hatchery
Active with other countries
Not active
Indonesia Active in trade issuesActive in shrimp farming, feed and hatchery
Active with neighboring countries
Not active
MalaysiaActive in fisheries management
Active in shrimp farming, feed and hatchery
Active with neighboring countries
Not active
PhilippinesHighly active in most aspects
Active in aquaculture in seaweed
Active with neighboring countries
Active
Sri Lanka Active in most aspectsActive in shrimp farming
Active in fisheries facilitation onshore
Active in tuna and marine surveillance
ThailandHighly active in most aspects
Active in shrimp farming, feed, and hatchery
Active with neighboring countries and beyond
Active but still at experimental stageActive with onshore facilitation
VietnamHighly active
Active in shrimp farming, feed, and hatchery
Increasingly active Not active
Table 5.9 Evaluation of International Involvement in Fisheries in the Selected Countries
Source: This summary is based on ADB-RETA 5945 Country Reports.
deserve further study based on cross-country comparisons, synthesis of regional similarities, and identification of models that can be adopted for the institutional systems in each country.
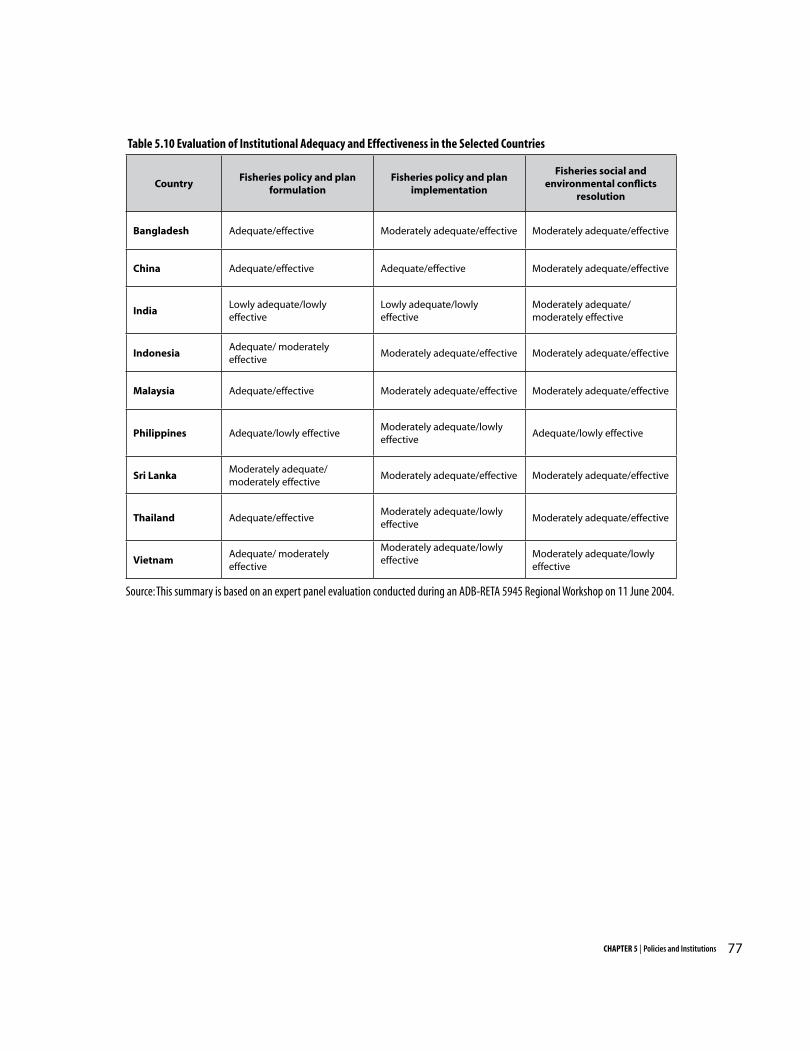
77CHAPTER 5 | Policies and Institutions
CountryFisheries policy and plan
formulationFisheries policy and plan
implementation
Fisheries social and environmental conflicts
resolution
Bangladesh Adequate/effective Moderately adequate/effective Moderately adequate/effective
China Adequate/effective Adequate/effective Moderately adequate/effective
IndiaLowly adequate/lowly effective
Lowly adequate/lowly effective
Moderately adequate/ moderately effective
IndonesiaAdequate/ moderately effective
Moderately adequate/effective Moderately adequate/effective
Malaysia Adequate/effective Moderately adequate/effective Moderately adequate/effective
Philippines Adequate/lowly effectiveModerately adequate/lowly effective
Adequate/lowly effective
Sri LankaModerately adequate/ moderately effective
Moderately adequate/effective Moderately adequate/effective
Thailand Adequate/effectiveModerately adequate/lowly effective
Moderately adequate/effective
VietnamAdequate/ moderately effective
Moderately adequate/lowly effective
Moderately adequate/lowly effective
Table 5.10 Evaluation of Institutional Adequacy and Effectiveness in the Selected Countries
Source: This summary is based on an expert panel evaluation conducted during an ADB-RETA 5945 Regional Workshop on 11 June 2004.
78 Strategies and Options for Increasing and Sustaining Fisheries and Aquaculture Production to Benefit Poorer Households in Asia
Introduction
This chapter provides a socioeconomic profile of different stakeholders in fish production. The profile covers income, employment, scale of operation, degree of subsistence production, and so forth. While some of the discussions on costs and earnings may overlap with the material in Chapter 3, here the household perspective is emphasized. Aside from actual fish producers, this chapter also includes the profile of other stakeholders that are directly or indirectly related to fishing, such as fish seed producers and collectors, processors, and traders.
Fish producers fall into two groups: capture fishers and aquaculture farmers. The former refers to those who harvest from natural fish stocks, whether marine or inland, under open (or nominally restricted) access rights. The latter refers to farmers who culture fish either in freshwater or brackishwater ponds and cages, which are operated with full private ownership/rights. A grey area is culture-based inland fisheries, in which the natural productivity of the aquatic ecosystem is utilized, although fishers need to acquire access rights (to community tanks, ponds, and reservoirs). In this system, fingerlings are stocked on communal ponds and fish harvesting is done collectively or individually.
In the process of transition from small-scale traditional fishing to commercial fishing, a dual
economy has been observed within fisheries. That is, a small-scale, traditional sub-sector coexists with modern farmers and fishers operating with modern technology and at industrial scales. The heterogeneity of the sector highlights the need for multi-faced policy approaches focusing on the divergent problems of the stakeholders. In particular, policies in fisheries that target the poor would have to locate where the poor are in the sector.
Data are drawn from both secondary and primary sources, collected by researchers from published fisheries data or through the use of different social research methods, respectively. Primary information makes use of household surveys based on questionnaires, participatory rural appraisal, focus group discussions, and key-informant consultations. Secondary informa-tion is obtained through published data reported by various state and central fisheries directorates of the respective countries, which contains informa-tion on production, distribution, marketing, price, and consumption of fish in respective countries.
Freshwater Fish Farmers
Freshwater fish farmers can be classified into pond fish farmers and cage culture farmers. Throughout Asia, pond farmers far outnumber cage farmers. Fish farming on private land is undertaken in addition to crop farming and has become one of the important sources of livelihood
Chapter 6
PROFILE OF FISH FARMERS, FISHERS, AND TRADERS
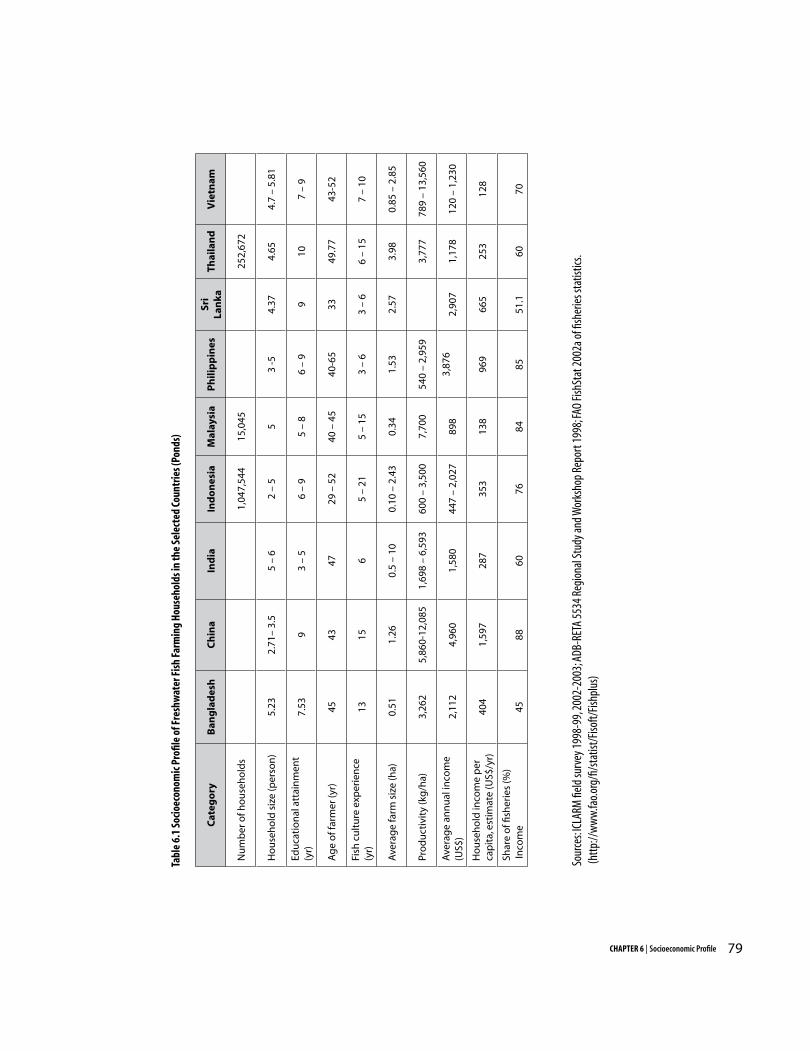
79CHAPTER 6 | Socioeconomic Profile
Cat
ego
ryB
ang
lad
esh
Ch
ina
Ind
iaIn
do
nes
iaM
alay
sia
Ph
ilip
pin
esSr
i La
nka
Thai
lan
dV
ietn
am
Nu
mb
er o
f ho
use
ho
lds
1,04
7,54
415
,045
252,
672
Ho
use
ho
ld s
ize
(per
son
)5.
232.
71–
3.5
5 –
62
– 5
53
-54.
374.
654.
7 –
5.81
Edu
cati
on
al a
ttai
nm
ent
(yr)
7.53
93
– 5
6 –
95
– 8
6 –
99
107
– 9
Ag
e o
f far
mer
(yr)
4543
4729
– 5
240
– 4
540
-65
3349
.77
43-5
2
Fish
cu
ltu
re e
xper
ien
ce
(yr)
1315
65
– 21
5 –
153
– 6
3 –
66
– 15
7 –
10
Ave
rag
e fa
rm s
ize
(ha)
0.51
1.26
0.5
– 10
0.10
– 2
.43
0.34
1.53
2.57
3.98
0.85
– 2
.85
Pro
du
ctiv
ity
(kg
/ha)
3,26
25,
860-
12,0
851,
698
– 6,
593
600
– 3,
500
7,70
054
0 –
2,95
93,
777
789
– 13
,560
Ave
rag
e an
nu
al in
com
e (U
S$)
2,11
24,
960
1,58
044
7 –
2,02
789
83,
876
2,90
71,
178
120
– 1,
230
Ho
use
ho
ld in
com
e p
er
cap
ita,
est
imat
e (U
S$/y
r)40
41,
597
287
353
138
969
665
253
128
Shar
e o
f fish
erie
s (%
) In
com
e 45
8860
7684
8551
.160
70
Tabl
e 6.
1 So
cioe
cono
mic
Pro
file
of F
resh
wat
er F
ish
Farm
ing
Hous
ehol
ds in
the
Sele
cted
Cou
ntrie
s (Po
nds)
Sour
ces:
ICLA
RM fi
eld
surv
ey 1
998-
99, 2
002-
2003
; ADB
-RET
A 55
34 R
egio
nal S
tudy
and W
orks
hop
Repo
rt 19
98; F
AO Fi
shSt
at 2
002a
of fi
sher
ies s
tatis
tics.
(http
://w
ww.
fao.
org/
fi/st
atist
/Fiso
ft/Fis
hplu
s)
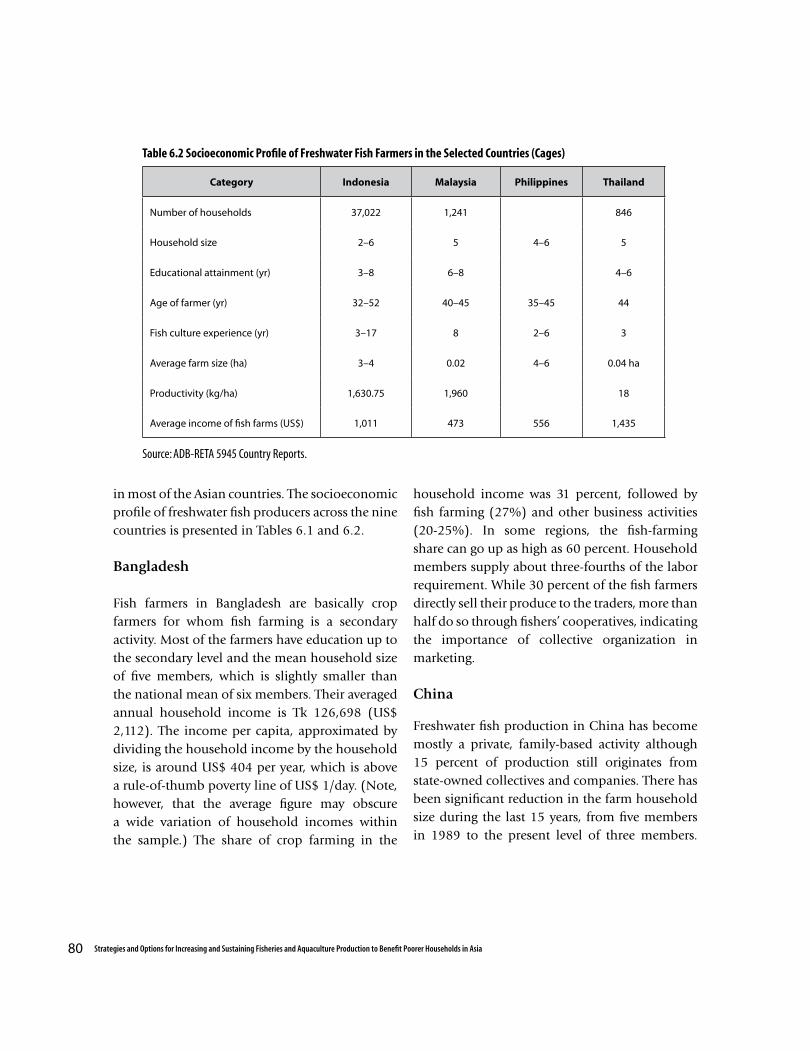
80 Strategies and Options for Increasing and Sustaining Fisheries and Aquaculture Production to Benefit Poorer Households in Asia
in most of the Asian countries. The socioeconomic profile of freshwater fish producers across the nine countries is presented in Tables 6.1 and 6.2.
Bangladesh
Fish farmers in Bangladesh are basically crop farmers for whom fish farming is a secondary activity. Most of the farmers have education up to the secondary level and the mean household size of five members, which is slightly smaller than the national mean of six members. Their averaged annual household income is Tk 126,698 (US$ 2,112). The income per capita, approximated by dividing the household income by the household size, is around US$ 404 per year, which is above a rule-of-thumb poverty line of US$ 1/day. (Note, however, that the average figure may obscure a wide variation of household incomes within the sample.) The share of crop farming in the
household income was 31 percent, followed by fish farming (27%) and other business activities (20-25%). In some regions, the fish-farming share can go up as high as 60 percent. Household members supply about three-fourths of the labor requirement. While 30 percent of the fish farmers directly sell their produce to the traders, more than half do so through fishers’ cooperatives, indicating the importance of collective organization in marketing.
China
Freshwater fish production in China has become mostly a private, family-based activity although 15 percent of production still originates from state-owned collectives and companies. There has been significant reduction in the farm household size during the last 15 years, from five members in 1989 to the present level of three members.
Category Indonesia Malaysia Philippines Thailand
Number of households 37,022 1,241 846
Household size 2–6 5 4–6 5
Educational attainment (yr) 3–8 6–8 4–6
Age of farmer (yr) 32–52 40–45 35–45 44
Fish culture experience (yr) 3–17 8 2–6 3
Average farm size (ha) 3–4 0.02 4–6 0.04 ha
Productivity (kg/ha) 1,630.75 1,960 18
Average income of fish farms (US$) 1,011 473 556 1,435
Table 6.2 Socioeconomic Profile of Freshwater Fish Farmers in the Selected Countries (Cages)
Source: ADB-RETA 5945 Country Reports.
81CHAPTER 6 | Socioeconomic Profile
The average age of fish farmer is 43 years, with the average of 9 years of schooling. Very few have a graduate degree or technical training. The average farm size of freshwater ponds is 1.5 ha, yielding 12,000 kg/ha. The household income of fish farmers could be as high as US$ 8,000/ha/season.
Fish farmers in China obtain 70 percent of their total annual household income of US$4,960 from fish farming; the rest comes from salaries, businesses, and other sources. Hence, specialization in fish farming is very evident, in contrast to the findings for other countries. Over the period 1990-2002, the fish farming income share has been rising, suggesting an increasing level of specialization and intensity.
India
Across the regions of India, freshwater fish producers differ in the scale of operation, intensity, and culture technology. The educational attainment of fish farmers is one of the lowest among the nine countries included in the study, registering only up to three-five years of schooling, with no supplementary technical training. The family size varies between five and six members, with two-three earning members. The average size of the farm also varies from 0.5 to 10 hectares.
The average income from fish farming varies from US$ 1,246 to US$ 1,780, which constitutes about 60 percent of the annual household income. The majority of the fish farmers generate 20-25 percent of their income from crops and livestock. Per capita income falls below the US$ 1/day poverty threshold. In fact, upon further examination of the sample data, freshwater fish producers appear to be mostly poor, with as many as three-fourths of them earning below this threshold.
Indonesia
Freshwater fish culture contributes 8 percent to the national fish production but employs 53 percent of fish-dependent households. The average household size ranges from two to five persons for pond culture families and from 2 to 6 persons for cage culture families. The pond fish farmers’ ages are between 30 and 50 years, and they have up to 9 years of schooling. The cage farmers have a similar age profile (32-52 years), but they have less schooling (3-8 years). Pond sizes per household range from 0.10 to 2.43 ha, while cage sizes are between 9 and 49 m2.
The average national productivity of fish farming is 2,761 kg/ha/yr (pond); 1,610 kg/unit/yr (cage); and 591 kg/ha/yr (paddy field). The productivity per household is 287 kg/ha/yr; 1,631 kg/ha/yr; and 310 kg/ha/yr for ponds, cages, and paddy fields, respectively. The freshwater aquaculture industry generates an average annual income of US$ 2,027/ha/yr (ponds); US$ 1,024/ha/yr (cages); and US$ 447/ha/yr (rice-fish farms). The annual income per household practicing freshwater fish farming in ponds, cages, and paddy fields is, respectively, US$ 211; US$ 1,024; and US$ 234. Households doing pond culture are mostly poor, averaging only US$ 353/capita/yr.
Malaysia
There are 17,604 fish farmers in the country with a total area of 6,835 ha. In the pond system environment, the level of education, farmers’ age, and farm experience are 5-8 years, 40-45 years, and 5-15 years, respectively. In the cage system environment, the level of education, farmers’ age, and culture experience are 6-8 years, 40-45 years, and 8 years, respectively. The average farm size and productivity are 0.34 ha and 7,700 kg/ha,
82 Strategies and Options for Increasing and Sustaining Fisheries and Aquaculture Production to Benefit Poorer Households in Asia
respectively, for pond culture; and 0.02 ha and 19.6 kg/m2, respectively, for cage culture. The total value of the fish produced is RM 304,538 with an average quantity of 50,688 tonnes. This translates into an average annual income of RM 18,500 or US$ 4,830 per household.
Philippines
In the Philippines, cage culture is common. Cages are operated mainly by owners. An average cage operator is mostly educated up to the high school level, and has a household ranging from three to six members. The male members generally supervise and monitor the culture operations while the female members take care of stocking, feeding, and harvesting activities. The women are also involved in keeping records of farm operations, finding the source of fingerlings, and marketing of fish produce. The cage owners also employ laborers to help in culture operations at the rate of PhP250-350 (US$ 5-6) per day.
The average stocking density in tilapia cages ranges from 33 to 611 fingerlings/m2. The stocking density depends on water temperature, price of fingerlings, harvest price of fish, availability of credit, etc. The culture period is 3-5 months for tilapia and 6 months for milkfish. The average yield for tilapia cages ranges from 6 kg/m2 to 42 kg/m2. For milkfish, the average yield is 27 kg/m2. The main capital investment of the cage operators is on the construction of cages and the acquisition of craft and gears required for harvesting the fish. Initial investment for cage construction ranges from US$ 500 to US$ 2,000, depending on the size of the farm. The highest gross return has been found for tilapia grow-out operators at US$ 4,760/yr or US$ 1,250/cycle of 4-5 months. Milkfish producers receive a net income of US$ 980/cycle of 6 months.
Sri Lanka
Freshwater fish producers in Sri Lanka are almost entirely dependent on inland culture-based and capture fisheries, with only a handful of pond farmers among them. The pond farmers have an average family size of five members and average education up to the high school level. They are basically crop farmers, with an average land holding of 1-1.5 ha. These fish farmers have better access to public utilities than seasonal tank fishers and inland fishers. Their average annual income is three times higher than that of the other freshwater fish producers (US$ 2,350), with a possible maximum of US$ 21,850. About 51 percent of their income comes from fish farming. Because the annual household income of rural households is only US$ 1,020, it is clear that fish farming has helped pond farmers to generate a substantial part of their total income.
Thailand
Freshwater aquaculture in Thailand is one of the important farming activities, second only to crop farming. Although it is mostly reported as a secondary activity, farmers engaged in fish farming claim it is an important source of income and employment. Most of the fish farmers have primary education, and a few have high school and college education.
The average total farm size is four hectares, with 90 percent of the farms being privately owned. The average size of the fishponds is one hectare. Fish farming constitutes around 20 percent of the total annual family income of B 87,600 (US$ 2,185). The average per capita income is around US$ 1.20/day. However, the net income of a small-scale farmer could be as low as US$ 175/ha/yr.
83CHAPTER 6 | Socioeconomic Profile
Vietnam
Among the farm households in Vietnam, 15-20 percent are involved in fishing, fish farming and fishery-related activities. The average fishing household has five members, with the household head having between 7 and 9 years of schooling. In many provinces, aquaculture farms are located close to the district centers, indicating the importance of fish farms over other farm enterprises. The hatchery farms are also found close to fish farms with distances ranging from 1.8 km to 4.5 km.
The average size of land holding by fish farmers ranges from 0.85 hectare to 2.85 hectares. Less than 1 percent of the farms are privately owned while the rest are rented. The farmers normally practice polyculture and integrated fish culture system, i.e., fish-swine-poultry. Fish farmers purchase seeds from private nursery operators and national hatcheries, with a small percentage of farmers growing their own seeds. A fishing household normally harvests 789-13,560 kg from their ponds. The net household income from aquaculture production varies from VN$ 1,817,000 to 19,285,000 (US$ 120-1230). The common problems faced by fish farmers in Vietnam are pollution, natural disasters, poor seed quality, and lack of capital. Most of the farmers are finding it difficult to expand their aquaculture operations.
Brackishwater and Coastal Aquaculture Farmers
Shrimp aquaculture has emerged to become an important contributor to income and employment of many Asian economies. Some socioeconomic indicators of shrimp producers under a brackishwater environment are presented in Tables 6.3 and 6.4.
Bangladesh
Shrimp farming in Bangladesh is one of the lucrative enterprises, which has complex backward and forward production and marketing linkages. The departure from predominantly rice-based farming system to commercial culture has created a new employment structure involving both skilled and unskilled rural labor. Shrimp farming also has opened up avenues for female employment through shrimp depots and processing companies.
Households engaged in shrimp farming earn most of their income from this activity. Only around 10-15 percent of the farmers also engage in crop farming. The income from shrimp farming constitutes 75-80 percent of the total annual household income. A survey conducted during 2003 showed the annual household income reaching US$ 14,250, which was higher than incomes of similar operators in China, India, and Indonesia. However, the bulk of this goes to owner operators while the annual household income of leasehold operators is only US$ 2,300. Among the industry stakeholders, it is the shrimp fry/seed collecting households that count among the poorest. Their household incomes average only US$ 250 per year.
China
Shrimp farmers in China mostly adopt a semi-intensive culture system. Gross yields average 2,100 kg/ha. Shrimp farming households earn a gross annual income of US$ 6,176 from shrimp farming, plus a net income of US$ 1,740/crop. On average, farmers operate two crops per year.
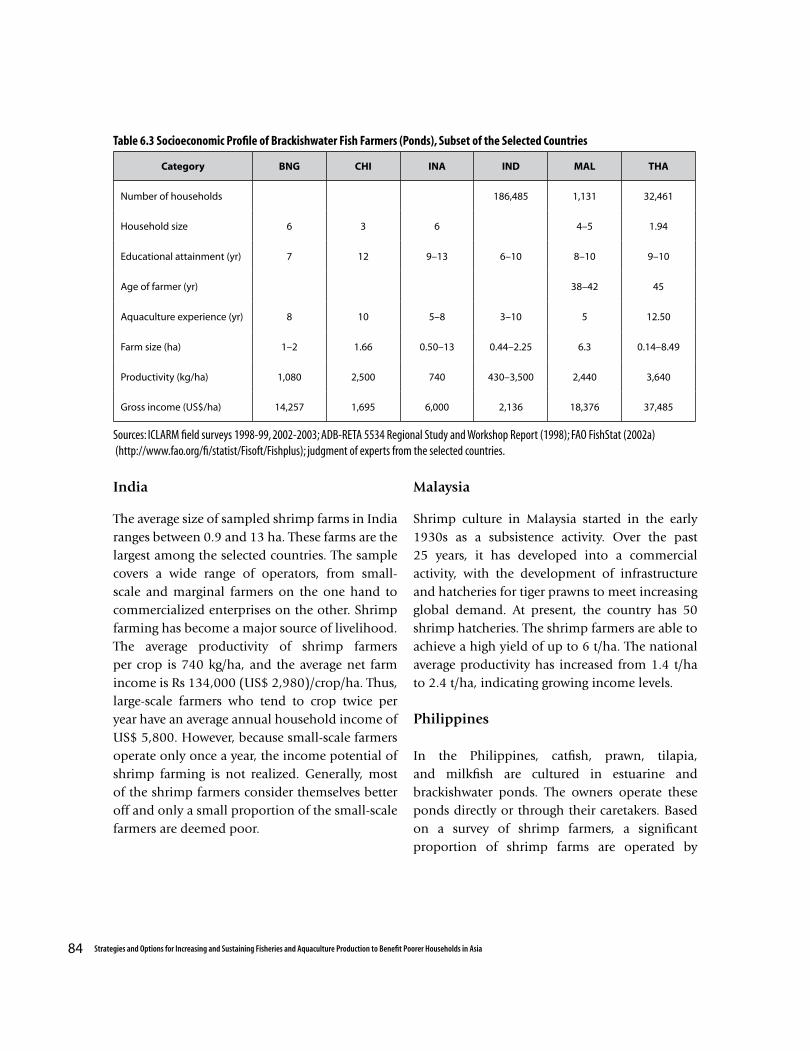
84 Strategies and Options for Increasing and Sustaining Fisheries and Aquaculture Production to Benefit Poorer Households in Asia
Category BNG CHI INA IND MAL THA
Number of households 186,485 1,131 32,461
Household size 6 3 6 4–5 1.94
Educational attainment (yr) 7 12 9–13 6–10 8–10 9–10
Age of farmer (yr) 38–42 45
Aquaculture experience (yr) 8 10 5–8 3–10 5 12.50
Farm size (ha) 1–2 1.66 0.50–13 0.44–2.25 6.3 0.14–8.49
Productivity (kg/ha) 1,080 2,500 740 430–3,500 2,440 3,640
Gross income (US$/ha) 14,257 1,695 6,000 2,136 18,376 37,485
Table 6.3 Socioeconomic Profile of Brackishwater Fish Farmers (Ponds), Subset of the Selected Countries
Sources: ICLARM field surveys 1998-99, 2002-2003; ADB-RETA 5534 Regional Study and Workshop Report (1998); FAO FishStat (2002a) (http://www.fao.org/fi/statist/Fisoft/Fishplus); judgment of experts from the selected countries.
India
The average size of sampled shrimp farms in India ranges between 0.9 and 13 ha. These farms are the largest among the selected countries. The sample covers a wide range of operators, from small-scale and marginal farmers on the one hand to commercialized enterprises on the other. Shrimp farming has become a major source of livelihood. The average productivity of shrimp farmers per crop is 740 kg/ha, and the average net farm income is Rs 134,000 (US$ 2,980)/crop/ha. Thus, large-scale farmers who tend to crop twice per year have an average annual household income of US$ 5,800. However, because small-scale farmers operate only once a year, the income potential of shrimp farming is not realized. Generally, most of the shrimp farmers consider themselves better off and only a small proportion of the small-scale farmers are deemed poor.
Malaysia
Shrimp culture in Malaysia started in the early 1930s as a subsistence activity. Over the past 25 years, it has developed into a commercial activity, with the development of infrastructure and hatcheries for tiger prawns to meet increasing global demand. At present, the country has 50 shrimp hatcheries. The shrimp farmers are able to achieve a high yield of up to 6 t/ha. The national average productivity has increased from 1.4 t/ha to 2.4 t/ha, indicating growing income levels.
Philippines
In the Philippines, catfish, prawn, tilapia, and milkfish are cultured in estuarine and brackishwater ponds. The owners operate these ponds directly or through their caretakers. Based on a survey of shrimp farmers, a significant proportion of shrimp farms are operated by
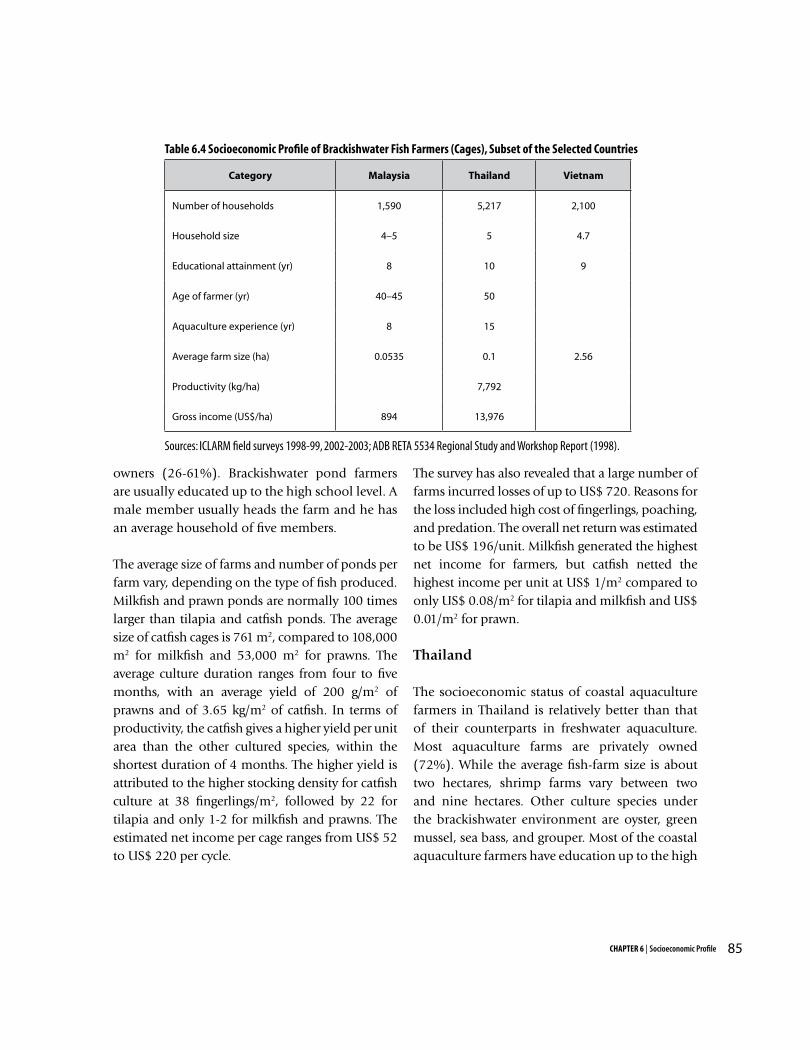
85CHAPTER 6 | Socioeconomic Profile
Table 6.4 Socioeconomic Profile of Brackishwater Fish Farmers (Cages), Subset of the Selected Countries
Sources: ICLARM field surveys 1998-99, 2002-2003; ADB RETA 5534 Regional Study and Workshop Report (1998).
owners (26-61%). Brackishwater pond farmers are usually educated up to the high school level. A male member usually heads the farm and he has an average household of five members.
The average size of farms and number of ponds per farm vary, depending on the type of fish produced. Milkfish and prawn ponds are normally 100 times larger than tilapia and catfish ponds. The average size of catfish cages is 761 m2, compared to 108,000 m2 for milkfish and 53,000 m2 for prawns. The average culture duration ranges from four to five months, with an average yield of 200 g/m2 of prawns and of 3.65 kg/m2 of catfish. In terms of productivity, the catfish gives a higher yield per unit area than the other cultured species, within the shortest duration of 4 months. The higher yield is attributed to the higher stocking density for catfish culture at 38 fingerlings/m2, followed by 22 for tilapia and only 1-2 for milkfish and prawns. The estimated net income per cage ranges from US$ 52 to US$ 220 per cycle.
The survey has also revealed that a large number of farms incurred losses of up to US$ 720. Reasons for the loss included high cost of fingerlings, poaching, and predation. The overall net return was estimated to be US$ 196/unit. Milkfish generated the highest net income for farmers, but catfish netted the highest income per unit at US$ 1/m2 compared to only US$ 0.08/m2 for tilapia and milkfish and US$ 0.01/m2 for prawn.
Thailand
The socioeconomic status of coastal aquaculture farmers in Thailand is relatively better than that of their counterparts in freshwater aquaculture. Most aquaculture farms are privately owned (72%). While the average fish-farm size is about two hectares, shrimp farms vary between two and nine hectares. Other culture species under the brackishwater environment are oyster, green mussel, sea bass, and grouper. Most of the coastal aquaculture farmers have education up to the high
Category Malaysia Thailand Vietnam
Number of households 1,590 5,217 2,100
Household size 4–5 5 4.7
Educational attainment (yr) 8 10 9
Age of farmer (yr) 40–45 50
Aquaculture experience (yr) 8 15
Average farm size (ha) 0.0535 0.1 2.56
Productivity (kg/ha) 7,792
Gross income (US$/ha) 894 13,976
86 Strategies and Options for Increasing and Sustaining Fisheries and Aquaculture Production to Benefit Poorer Households in Asia
school level and a few have college education and professional training.
The productivity of shrimp farming could be as low as 381 kg/ha in extensive farms and as high as 5,000 kg/ha in intensive farms. In terms of net farm income, the intensive farmers make the highest income, followed by semi-intensive and extensive farmers. The net income per hectare of intensive shrimp farms is US$ 5,300 compared to only US$ 2,195 in the extensive farms. In the case of cage culture of sea bass and grouper, the net returns per square meter are Baht 987 and Baht 750, respectively.
Vietnam
Shrimp culture is now one of the most important aquaculture activities in Vietnam in terms of area, production, employment, and foreign exchange earnings. This is particularly the case in the Mekong Delta, where 80 percent of the total shrimp production is being carried out. While saline water shrimp farming in the Mekong Delta has been expanded in the coastal zone or estuarine areas by mainly following the extensive farming system, some shrimp farming has transformed from an extensive system to an intensive one. Farming is practiced either in the monoculture system or in combination with rice.
The gross income from rice growing is Dong 8,800,000/crop, compared to Dong 33,000,000 from shrimp monoculture and Dong 48,500,000 from shrimp-rice farming practice. In the Mekong Delta, the vast expanse of flooded areas during the wet season offers considerable potential for rice-aquaculture activities that have been practiced by Vietnamese farmers for a long time. These integrated farming systems include rice-fish,
rice-freshwater shrimp, rice-saline water shrimp, mangrove forestry-shrimp, coconut-shrimp, salt-shrimp, artemia-shrimp, and crop-livestock-fish. However, the net family income per crop for shrimp monoculture farmers (US$ 195) is much lower than for rice monoculture (US$ 350) and rice-shrimp farmers (US$ 1,100). The rice-shrimp farming system also allows diversification of farm output and production activities. Aside from aquaculture production of mud crab and fish, farmers can also produce perennial upland cash crops (such as chili, tomatoes, cassava, sweet potato, sugarcane, and palm) and raise livestock (pigs, ducks, and chickens).
Marine Aquaculture
Marine aquaculture had shown remarkable growth over the last five years in countries that have adopted the technology. Various culture techniques are currently in use, such as rafts, cages, and pens. However, the most important are cages for cultivating species of grouper, snapper, sea perch, and sea bass, and rafts for cultivating seaweeds. Statistics and official data from Indonesia indicate that the current area under marine aquaculture covers only about six percent of the potential area, estimated at 2,002,680 ha 1. In 2000, the culture industry contributed 197,114 tonnes to the total national production. The marine fish culture industry provides a large annual income of US$ 9,431 per household (see Table 6.5).
Marine Capture Fishers
Marine capture fisheries, being an open access resource, provide one of the greatest opportunities for equitable distribution of benefits. However, owing to technological change and the rise of industrialized fishing, access to the resource
1 This figure was calculated from 20 percent of total marine water area of < 5 km coastline that was estimated by the Directorate General of Aquaculture, Ministry of Marine Affairs and Fisheries of Indonesia in 2002.
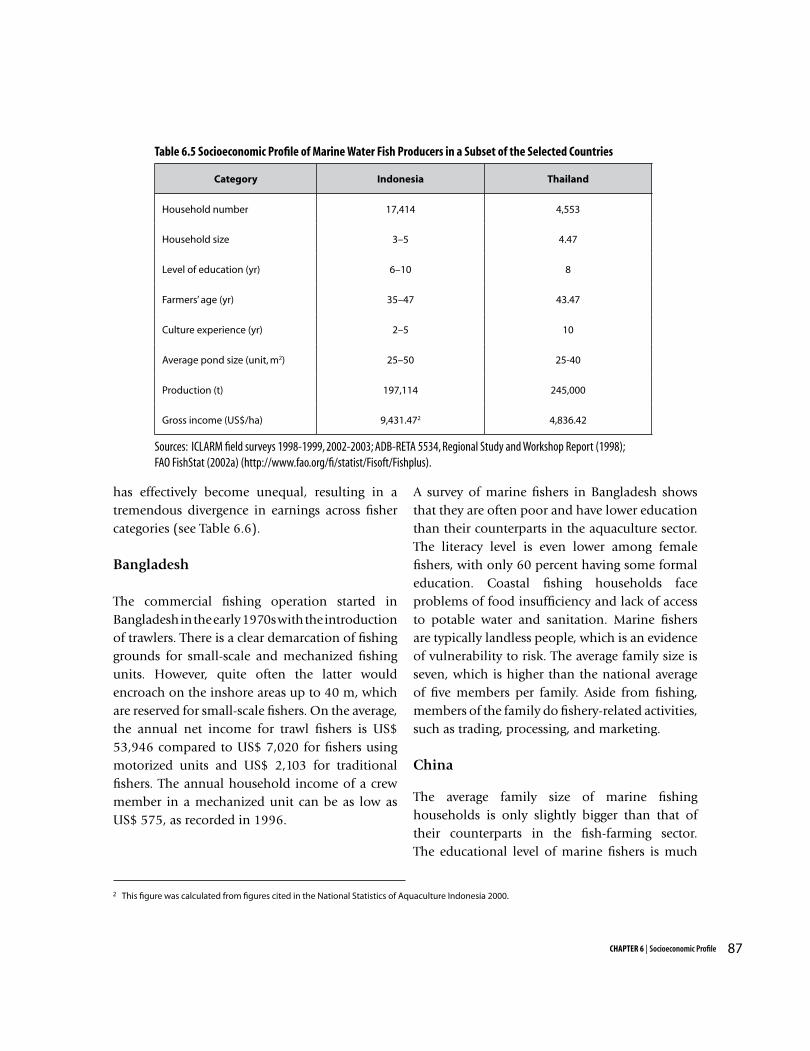
87CHAPTER 6 | Socioeconomic Profile
has effectively become unequal, resulting in a tremendous divergence in earnings across fisher categories (see Table 6.6).
Bangladesh
The commercial fishing operation started in Bangladesh in the early 1970s with the introduction of trawlers. There is a clear demarcation of fishing grounds for small-scale and mechanized fishing units. However, quite often the latter would encroach on the inshore areas up to 40 m, which are reserved for small-scale fishers. On the average, the annual net income for trawl fishers is US$ 53,946 compared to US$ 7,020 for fishers using motorized units and US$ 2,103 for traditional fishers. The annual household income of a crew member in a mechanized unit can be as low as US$ 575, as recorded in 1996.
A survey of marine fishers in Bangladesh shows that they are often poor and have lower education than their counterparts in the aquaculture sector. The literacy level is even lower among female fishers, with only 60 percent having some formal education. Coastal fishing households face problems of food insufficiency and lack of access to potable water and sanitation. Marine fishers are typically landless people, which is an evidence of vulnerability to risk. The average family size is seven, which is higher than the national average of five members per family. Aside from fishing, members of the family do fishery-related activities, such as trading, processing, and marketing.
China
The average family size of marine fishing households is only slightly bigger than that of their counterparts in the fish-farming sector. The educational level of marine fishers is much
Category Indonesia Thailand
Household number 17,414 4,553
Household size 3–5 4.47
Level of education (yr) 6–10 8
Farmers’ age (yr) 35–47 43.47
Culture experience (yr) 2–5 10
Average pond size (unit, m2) 25–50 25-40
Production (t) 197,114 245,000
Gross income (US$/ha) 9,431.472 4,836.42
Table 6.5 Socioeconomic Profile of Marine Water Fish Producers in a Subset of the Selected Countries
Sources: ICLARM field surveys 1998-1999, 2002-2003; ADB-RETA 5534, Regional Study and Workshop Report (1998); FAO FishStat (2002a) (http://www.fao.org/fi/statist/Fisoft/Fishplus).
2 This figure was calculated from figures cited in the National Statistics of Aquaculture Indonesia 2000.
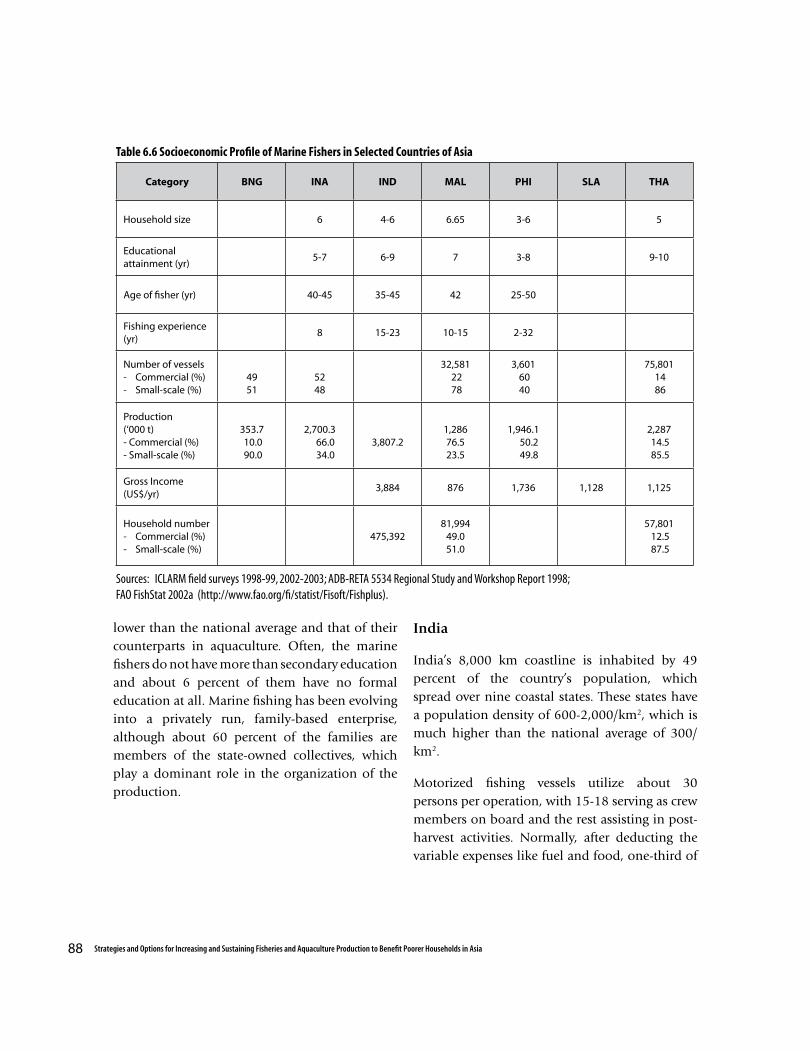
88 Strategies and Options for Increasing and Sustaining Fisheries and Aquaculture Production to Benefit Poorer Households in Asia
Category BNG INA IND MAL PHI SLA THA
Household size 6 4-6 6.65 3-6 5
Educational attainment (yr)
5-7 6-9 7 3-8 9-10
Age of fisher (yr) 40-45 35-45 42 25-50
Fishing experience (yr)
8 15-23 10-15 2-32
Number of vessels- Commercial (%)- Small-scale (%)
4951
5248
32,581 22 78
3,601 60 40
75,801 14 86
Production (‘000 t)- Commercial (%)- Small-scale (%)
353.7 10.0 90.0
2,700.3 66.0 34.0
3,807.21,28676.523.5
1,946.1 50.2 49.8
2,287 14.5 85.5
Gross Income (US$/yr)
3,884 876 1,736 1,128 1,125
Household number- Commercial (%)- Small-scale (%)
475,39281,994
49.051.0
57,801 12.5 87.5
Table 6.6 Socioeconomic Profile of Marine Fishers in Selected Countries of Asia
Sources: ICLARM field surveys 1998-99, 2002-2003; ADB-RETA 5534 Regional Study and Workshop Report 1998; FAO FishStat 2002a (http://www.fao.org/fi/statist/Fisoft/Fishplus).
lower than the national average and that of their counterparts in aquaculture. Often, the marine fishers do not have more than secondary education and about 6 percent of them have no formal education at all. Marine fishing has been evolving into a privately run, family-based enterprise, although about 60 percent of the families are members of the state-owned collectives, which play a dominant role in the organization of the production.
India
India’s 8,000 km coastline is inhabited by 49 percent of the country’s population, which spread over nine coastal states. These states have a population density of 600-2,000/km2, which is much higher than the national average of 300/km2.
Motorized fishing vessels utilize about 30 persons per operation, with 15-18 serving as crew members on board and the rest assisting in post-harvest activities. Normally, after deducting the variable expenses like fuel and food, one-third of

89CHAPTER 6 | Socioeconomic Profile
the catch value is divided among craft and gear operators; the remaining catch value is shared equally among the crew.
A survey shows that the educational level of mechanized fishers is improving over the years as many graduates are entering this sector in the absence of alternative employment opportunities. Meanwhile, the educational level appears to be lowering among traditional fishers. Similarly, access to clean drinking water, ownership of LPG ranges, transport vehicles, and television sets are better among mechanized fishers than traditional fishers. The percentages of actual fishing individuals in a family are 26 percent among mechanized fishers and 35 percent among traditional fishers, indicating higher dependence of the latter on marine resources. Very few women in mechanized fishing families are involved in fish vending (1.68%) compared to those from traditional fishing families (6.58%). Further, 20 percent of members of the former live in other villages while only 3 per cent of members of the latter do so.
Mechanized fishing families also have more diversified sources of income. Some 16 percent of them have income from other sources, compared to only 2 percent of motorized fishing families. The net household annual income of mechanized fishers is around US$ 1,200-1,400, compared to only US$ 500-1,200 for small-scale, motorized fishers.
Indonesia
In 2000, small-scale fisheries accounted for 95 per cent of the total number of vessels in the country, and 475,392 households were engaged in fishing. The estimated productivity of the capture fishery is
8,009 kg/yr per household. The average household had four to six members, with six to nine years of schooling. The fishers were 35-45 years of age and their fishing experience ranged from 15 to 23 years. Marine capture fishery provides an annual income of US$ 4,661 per household. Problems commonly experienced by fishers included limited capital, presence of too many small-scale fishers, high cost, especially of fuel, and low price at landing site.
Malaysia
There is a clear distinction between commercial and small-scale fishers in Malaysia. The commercial fishers mainly use trawl and purse seine nets while the traditional fishers use drift/gill nets, hook and line, and portable traps. Aside from non-mechanized boats, some small-scale fishers also use mechanized boats with outboard and onboard engines. The regular catch per unit of effort (CPUE) for a trawl net operator is 100 tonnes, followed by 207 tonnes for a purse seine operator. The harvest by gill nets is only 8 tonnes, indicating the vulnerability of their operators.
Although there is a substantial increase in CPUE of gill nets with the use of bigger engines, fishers still earn considerably less than trawlers and purse seiners. The net profit per year of a trawler is RM 30,000-142,000 (US$ 7,893-37,360), depending on the scale of operation. The purse seiners earn substantially higher net profit per unit compared to trawlers. Their average annual net profit is US$ 52,620-99,978. The gill net operators earn a net profit of US$ 14,112 per year. The net income of the fishing crew varies from US$ 1,127 among trawlers to US$ 8,227 among gill-netters and hook-and-liners. Thus, the income of the fishing crew is substantially higher in small-scale fishing than
90 Strategies and Options for Increasing and Sustaining Fisheries and Aquaculture Production to Benefit Poorer Households in Asia
commercial fishing, indicating that the transition from small-scale to commercial fisheries may not always benefit the laborers.
In the trawl fishery of Malaysia, net income is divided among the different parties involved in fishing according to the contributions to capital, skills, and responsibilities. For example, out of 8 shares on a 4-member trawler, 4.75 shares go to the boat owner; 1.25 to the skipper; and the 2 crew members receive 1 share each. In the purse seine fishery, the sharing system is more complicated. In the case of a purse seiner with 14 people on board, the first 450 kg of catch goes to the workers. Net operating income, calculated by deducting operating costs from catch in excess of 450 kg, is divided into 20 shares. The boat owner receives 5 shares; the skipper, 1.5; the engine operator, 1.25; and the rest of the crew, 1 each. For the anchovy purse seiner, the crew receives a fixed wage, plus a commission per basket of catch. The skipper is awarded a bonus of about 3 percent of the net value of the catch. The sharing system is also practiced in traditional fishing. A boat owner normally receives 20-60 percent of the total catch.
Philippines
Marine fishers in the Philippines are broadly classified into municipal and commercial fishers. The municipal fishers operate small-scale fishing units with an average initial capital investment of US$ 440, while commercial fishers require US$ 4,256, or about ten times as much. The majority of municipal fishers use motorized boats with 5-16 HP engines. There are some non-motorized traditional crafts that cost US$ 14–50 and are operated by poor fishers in inshore areas. A survey done for this study shows that the average net
return per trip for municipal fishers is US$ 4.90-9.30 while commercial fishers earn US$ 622 per trip. In general, commercial fishers, despite their higher capital investment in vessels and gears, are better off compared to municipal fishers.
Sri Lanka
The marine fishing communities in Sri Lanka consist of multi-ethnic and multi-religious groups. The coastal fishing households are distributed in 1,300 fishing villages, with 25 percent of the households engaged in fishing. The majority of these fishing households are Christians, although Buddhists and those from other religious groups are also involved in fishing on a smaller scale. Fishing is the major source of income in these coastal communities (90%), but their employment is becoming more diversified. The fishers’ levels of education differ with respect to their occupation. Most of the boat owners and skippers have education up to the high school level.
Boat owners have a yearly income of about US$ 2,130; this constitutes 78 per cent of their total income. Thus, the annual household income of boat owners from all sources is US$ 2,500–3,000. The annual income of skippers and crew are only US$ 1,250 and US$ 1,000, respectively.
The households depending on fishing as a sole source of income declined from 82 percent in 1972 to 70 percent in 1996. The average annual net income of commercial and small-scale fishers with different fishing gears shows wide differences in their socioeconomic status. The annual net income of a household from a multi-day fishing unit is around US$ 3,000, compared to US$ 668 from a traditional motorized craft and US$ 200 from a traditional non-motorized craft. It should
91CHAPTER 6 | Socioeconomic Profile
be noted that the income of fishers using non-motorized vessels is comparable to the income of workers in agricultural estates and urban informal employment sectors.
Some of these traditional fishers also earn a part of their income from working as crew in commercial fishing vessels. The crew in a multi-day fishing vessel normally receives US$ 1,800-2,000 per year; this indicates that the households with family members working in a commercial vessel are relatively better off.
Thailand
Marine fishing in Thailand is traditionally a family-based enterprise. Eighty-five per cent of the fishing households (75,800) are engaged in small-scale fisheries. Most of the fishers have primary education; only 4 percent of them are without any formal education.
These families are mainly dependent on fishing, which contributes 75-80 percent to their total income. During the last 15 years, there has been a substantial increase in the number of small-scale fishers while that of commercial fishers has declined. However, the annual income of small-scale fishers (US$ 2,242) is substantially lower than their commercial counterparts (US$ 11,800). For small-scale fishers, fishery-related incomes account for 18 percent of their total income, compared to 24 percent for that of commercial fishers.
As discussed in Chapter 3, the financial profitability of small-scale fishing gears such as gill nets for harvesting shrimp and mackerel is very attractive due to low capital investment. Daily wages of laborers in small-scale fisheries are lowest (US$ 3.5) in the three-gear fishing vessel and highest
(US$5.9) in the two-gear one. Meanwhile, most commercial fisheries offer daily wages of US$ 5-7.5. The highest daily wage of US$ 12.50 is paid in push net operations and the lowest, in otter trawl units.
The mode of payments in the fisheries sector of Thailand varies among types and sizes of fishing gear. For example, about 80 percent of small otter trawls with length less than 14 m pay fixed wages to crew. Medium-sized and large otter trawls, and 50-75 percent of the pair trawls use both the fixed wage system and the benefit sharing method. Most beam trawlers and push netters employ sharing systems, whereby net income is divided at a ratio of 70:30 between boat owners and crew. The crew share is again divided according to rank and responsibility. Most purse seiners and gill-netters rely on mixed systems of fixed monthly wages and sharing the catch value.
Vietnam
Small-scale fishers who employ multi-species/multi-gear traditional fishing techniques dominate capture fishery in Vietnam. Often, fishers have limited capital investment. Fishing boats with less than 84 HP constitute 94 percent of the total fishing fleet, and almost all fisheries activities have been conducted in coastal waters. In recent years, the number of fishing boats and the size of the engines used have continuously increased. From 1987 to 1997, the total horsepower capacity of fishing boats has increased 200 percent, from 597,022 HP to 1,880,000 HP. However, the total catch only increased 100 percent, from 624,445 tonnes to 1,130,660 tonnes. During this period as well, the number of fishing households and fishing vessels in inshore areas has increased to the point of overexploitation.

92 Strategies and Options for Increasing and Sustaining Fisheries and Aquaculture Production to Benefit Poorer Households in Asia
Trawl fishing is the dominant fishing technology in coastal waters. It contributes 45 percent of total marine fish production, followed by purse seine fishing, which contributes about 20 percent. The net annual income of a single trawler ranges from US$ 5,000 to US$ 25,000/yr while a pair of trawlers could earn as much as US$ 7,000-60,000/yr. The purse seine fishers can earn an annual net income of about US$ 1,500-30,000. The small-scale hook-and-line fishers make an income in the range of US$ 5,000 to US$ 40,000/yr. On the other hand, the gill net fishers are relatively poor and have low investment and income; many of these traditional fishers operate in coastal waters, harvesting demersal fish.
Inland Capture Fishers
Inland capture fisheries production from Asia was 5.8 million tonnes, contributing 65 percent to the world production in 2000. In 2001, production reached 2.1 million tonnes in China, 1 million tonnes in India, and 0.7 million tonnes in Bangladesh. These countries are recognized as important geographical points in inland fisheries, together with Indonesia, Thailand, Vietnam, and the Philippines (FAO 2003).
Unlike freshwater fish from culture systems, production from inland capture fisheries is consumed mostly within the region. FAO (2003) reported that the inland capture fish production is increasing slowly in most of the Asian countries. The inland open waterbodies, consisting of rivers, floodplains, reservoirs, lakes, small and medium seasonal/perennial tanks, covered 4 million hectares, which contributed 80 percent of the total inland fish production during the 1960s. However, the contribution of these waterbodies to the total fish production has declined over the
years. At present, the average productivity is as low as 12 kg/ha. Hence, households dependent on inland fishing are counted among the poorest of the rural poor. Often, they have unprotected access rights, and need to move from one waterbody to another. Owing to their migrating behavior, it is often difficult to assess the socioeconomic status of these fishers.
China
Reservoir fishing in China is one of the major sources of employment for poor fishing families who are often located in remote rural areas. The average annual income per capita ranges from US$ 250 to US$ 800.
India
Wage employment is one of the main occupations of inland fishers. Most fishing families own their houses; basic amenities, such as toilets and piped-in water source, are absent. About 80 percent of the fishers either depend on public toilets or do not have any facility at all. For drinking water, households normally depend on multiple sources like public tube wells, piped water, and nearby waterbodies. Only 65 percent of the fishers have education up to the high school level. Land ownership of the sampled households varies from 0.9 to 3.5 hectares. The gross annual income of the fishers’ family fishers varies from Rs 32,000 to Rs 22, 400 (US$ 500-800).
Indonesia
Inland capture fisheries in Indonesia are practiced in floodplains, rivers, lakes, and reservoirs. Fish from inland capture fisheries provides an important source of protein in the diets of a large number of households, both in rural areas and
93CHAPTER 6 | Socioeconomic Profile
urban centers. In 2000, inland fisheries contribute five percent of the total fish production, and 14 per cent of the total fishers are dependent on inland fishing activities. Inland fisheries are small-scale subsistence activities and the fishing pattern reflects social, cultural, and ecological dimensions in the locality (Welcomme 1985; Koeshendrajana 1997). For example, rules on leasing, auction, and lottery of fishery resources vary across communities.
The average fisher household has from three to six members. On the average, these fishers have 4 to 7 years of schooling and 5 to 10 years of fishing experience. Their annual income from fishing is US$ 67–518/household.
Malaysia
The inland open waterbodies of Malaysia, such as lakes and reservoirs, offer a high potential for fishery exploitation. The total area of such open water resources includes 141,500 hectares, constituting nearly 30 percent of the total area available for inland fisheries and aquaculture. However, the contribution to total production from these waterbodies is insignificant (only 0.2%) and has been declining over the years. This suggests the vast potential available for increasing the productivity and revenue of the fishers through better utilization and management of the inland fishery resources.
Sri Lanka
The inland fishers of Sri Lanka are basically small crop farmers who also engage in capture or culture-based fisheries as a secondary occupation. They operate in small reservoirs and other common waterbodies, catching mainly tilapia
and carps introduced through stocking. The productivity of these reservoirs is often very low. The fishing communities of these reservoirs are basically migratory in nature, shifting from tank to tank during the season. The average household size varies according to the ethnic background; 45 percent of household members are female. Most of the fishers have high school education, with very few college graduates among them, and about five to seven percent of them have no formal education. The fisher households also cultivate 0.5-2 hectares of cropland. Although most of them have access to drinking water and sanitation, only 50 percent have access to electricity.
The income of the fishers varies with the productivity of the tank and the cropland. The average annual household income of seasonal tank fishers is relatively higher than that of reservoir fishers. The pond operators make twice as much as the seasonal tank fishers (US$ 2,200 vs. US$ 1,280). Unlike seasonal tank and pond fishers, reservoir fishers are fulltime professional fishers and they do not have any alternative sources of income. Their annual income is less than the national average of US$ 1,630; this indicates that they are the most disadvantaged among the inland fishers. Despite the marginal income derived from inland fishing, 90 percent of Sri Lanka’s total freshwater fish production originates from this resource.
Thailand
Inland capture fishing is an important livelihood in Thailand. A case study conducted in one of the largest reservoirs (Ubolratana) in the country revealed that the culture-based fishers are normally rice growers and also dependent on farm labor employment. They engage in fishing regularly
94 Strategies and Options for Increasing and Sustaining Fisheries and Aquaculture Production to Benefit Poorer Households in Asia
and sometimes migrate to other waterbodies. Men are often in-charge of fishing activities while women are involved in post-harvest and marketing activities. During the off-season, these fishers also migrate to nearby urban areas to find employment as construction workers. They have an annual family income of US$ 3,964.
Seed Producers
The fish seed producers can be classified into hatchery operators and seed rearing farmers. Artificial breeding of fish in Asia, started in China in the 1950s, was initially designed for carp species. This practice has later been carried out with other freshwater species such as catfish, tilapia, gourami, milkfish, and prawn. The grow-out industry has also been rapidly expanded in conjunction with the development of the hatchery sub-sector.
In South Asian countries, such as India and Bangladesh, the public sector previously provided the investment for hatcheries operation, while commercial production and marketing of the fingerlings were undertaken by the private sector. However, since the 1990s, the private sector has participated in the propagation of hatcheries and today a major supply of fry comes from the private sector.
The seed industry includes small-scale (backyard) hatcheries, medium- to large-scale water-based hatcheries, pond nursery systems, and integrated rice-fish in the paddy field technology. Freshwater hatcheries are typically small-scale operations whereas the brackishwater and marine hatcheries are usually operated at a large scale.
Bangladesh
The hatchery owners in Bangladesh are often around the average age of 40 years. They have relatively high educational background and ample training in fish hatchery and nursery. The hatchery owners spent 75 percent of the total production cost on variable inputs, such as fish eggs and feeds. Their average net return amounts to US$ 4,960/ha, with revenues exceeding costs by nearly 70 percent.
China
The well-established artificial breeding and hatchery technologies of fish fueled the rapid development of aquaculture industry in China. Currently, the breeding and hatchery technologies that have been developed were extensively adopted for most of the cultured species in the country. Hatcheries for different cultured species are operated by different bodies. For example, large state-owned farms usually run carp hatcheries; hatcheries for freshwater crabs and prawns are often operated by private farms; and commercial companies or research institutes often operate marine fish hatcheries.
India
Fish seed production in India started with state support, but it has now developed into a major sub-sector of the aquaculture industry with large private sector participation. However, while fish seed production is still mostly in the hands of the small-scale producers, shrimp seeds are produced by large private companies or in partnership with government agencies. Although most farmers procure fish seed directly from the seed producers, seed traders have been emerging as a major source
95CHAPTER 6 | Socioeconomic Profile
during the last five years. Sometimes, large-scale fish operators purchase seeds in bulk for sale to fellow farmers. The West Bengal is the hub of seed production, supplying seeds to Bihar, Uttar Pradesh and even up to Punjab. Andhra Pradesh is one of the leading states supplying fish seeds to neighboring states through private seed producers.
The average income of private seed growers is about Rs 176,000/million seeds (US$ 3,826). Shrimp seed production is highly capital-intensive and is mostly undertaken by private companies or in partnership with local government agencies. With increasing risks of disease outbreaks, these hatcheries are equipped with diagnostic facilities and laboratories.
Fish Traders
Fish traders form another major group of stakeholders in the fish business. In the selected countries, trading arrangements and systems diverge widely across countries, fish types, and destination markets (e.g., domestic versus foreign markets). This section provides an overview of these arrangements, together with some information about marketing margins and earnings in the trading sector.
Bangladesh
Three types of intermediaries handle fish marketing in Bangladesh, namely: beparies, artdars, and retailers. The beparies are professional fish traders who buy from farmers and sell to artdars and retailers. The artdars are basically commission agents who facilitate transaction between retailers and traders. A breakdown of the total marketing expenses shows that 20 percent goes to transportation cost and 22 percent to
commission charges. A survey of traders shows that the price spread ranges from US$ 0.45/kg to US$ 0.58/kg and the farmer’s share in the final consumer price varies from 63-69 percent, depending on the length of the marketing channel.
The marketing network for shrimp and other export-oriented products is different from that for domestic commodities. The shrimp passes through depot owners/traders, commission agents/wholesalers, and then to processing companies. The price spread ranges from US$ 2.7/kg to 4.9/kg, depending on the marketing channel. The producer’s share in the export price ranges from 60 to 70 percent. Female workers in the different sections of the shrimp industry are relatively poor and suffer from labor market discrimination, receiving lower wages for identical work.
China
Fish trading in China, like fish farming, is also a family-based enterprise although there are some companies and collectives involved in large-scale, wholesale trade that is controlled by the state. About 75 percent of the overall trading expenditure is integrated vertically into the retail business. However, rent, trade license, and tax constitute 44 percent of the total cost, and the rest is shared by transport and labor. Fish retailers in China have the average annual household income of US$ 4,883, with 30 percent of them having an annual income less than US$ 2,440. In general, 78 percent of the total income of fish traders comes from the trading business and the rest from other sources. The role of women in fish trading is very prominent, with women accounting for 40-45 percent of the retailers. The profit margin of fish retailers is around 22 percent of the selling price. Women in coastal communities are also involved in small-
96 Strategies and Options for Increasing and Sustaining Fisheries and Aquaculture Production to Benefit Poorer Households in Asia
scale processing, but not in fishing; this is unlike in aquaculture where women contribute to labor and management of farms as well.
India
A survey of fish wholesalers and retailers finds marketing margins to be quite high, which suggests the presence of high risk, and possibly an oligopolistic market structure. Within localities, the number of competing players is very few, with only a handful of families active at wholesale and retail levels, particularly in the case of inland fish marketing. The retail price of fish in a local market may double the ex-vessel price, e.g., fish purchased at Rs 19/kg by the wholesaler is sold at Rs 39/kg in the local market with a price spread of Rs 20/kg. The cost of transport, ice, packing, handling losses, plus other fixed costs for both wholesaling and retailing is only around Rs 8/kg. Hence, there is a vast scope to reduce the price spread and increase the producer share from the consumer price by improving efficiencies and competition in marketing. In the case of exportable species, the producers’ share in export proceeds varies from 31 to more than 83 percent. It is possible that in the case of items with low processing cost, the share of the producers in the export proceeds is higher. In general, however, the producers’ share in the final consumer price is relatively low, around 45-50 percent for most of the marine and inland markets. However, because of the relatively higher marketing efficiency with respect to exportable varieties and keen competition among processors in this sub-sector, the fishing households receive up to 70 percent of the export price.
Indonesia
Fish traders play an important role in the fisheries industry of Indonesia, both in the domestic and
international markets. In the domestic market, patron-client relationships are often formed, with the traders acting as the patron. Although the farm gate fish price is decided through negotiation, fish traders play an influential role in price setting. Local fish traders consist of fish collectors, wholesalers, and retailers. The majority of the local fish traders handle more than one type of fish species, especially from capture fisheries. Normally, fish from various producers in the local area are sold to a fish trader who in turn sells to the local and neighboring markets. Marketing margins are between 30–70 percent of the farm gate price.
Malaysia
Fish trade in Malaysia is generally handled by the private sector. These trading companies are registered with the Fishery Development Authority. From a survey of 88 traders located along the west coast of Malaysia, it was found that the majority of them handled one or two types of products, such as fresh fish, frozen fish, and prawns. Large-scale dealers with an investment of RM 890,000 conduct trade of both local fish and fish imported from Thailand and Indonesia. Normally, they depend on multiple supply sources. Apart from selling in domestic supermarkets and other outlets, the traders also export fish to other countries. Eighty-five percent of the traders operate in the domestic market while the rest are in export trade. Each trader, on an average, employs 20 workers and incurs RM 821,570/yr on marketing cost. The majority of the traders reported that the profitability of fish trading has been increasing over the years.
97CHAPTER 6 | Socioeconomic Profile
Philippines
Fish trade in the Philippines is normally carried out through a multiple layer of intermediaries, such as wholesalers, retailers, brokers, and commission agents. They specialize both in fresh fish and dried fish marketing. In many provinces of the country, women sellers dominate the retail marketing. The educational level of the members of this trading community is low, with most having only elementary education and a few having high school education. The traders are between 40-50 years of age and have 4-6 members in their households. On the average, the monthly gross and net incomes of traders are around US$ 1,374 and US$ 348, respectively. Their biggest expense is for the procurement of fresh fish and labor. The dried fish sellers earn a net income of US$ 220/month. Problems faced by the traders in general include natural disasters that disrupt their operations, uneven size of fish, high transportation cost, and irregular supply.
Sri Lanka
In Sri Lanka, a relatively simple marketing system prevails, consisting of wholesalers, retailers and intermediaries. The absence of commission agents may be partly explained by the low quantity of fish per trader, and the preference for direct relationships with fishers. Fish is transported to the landing centers either by bicycle or motorcycles. The trader normally employs one or two boys to collect and transport fish from scattered landing centers. During the fishing season when there are large landings, the wholesale traders transport fish by trucks. The average quantity handled by an individual trader is around 150 kg/day, with a marketing margin of 20-25 percent.
Fish traders are often personally funded. To expand their business, they may borrow from finance companies or friends. The fish trader’s annual household income from all sources ranges from US$ 650-US$ 800, indicating the small scale of the trade transactions. A survey conducted for the study shows that while approximately eight percent of the traders have no formal education, the national average is up to high school level. On the income side, around 80 percent of the wholesalers earn an annual household income greater than US$ 1,500 while the majority of the retailers make an annual household income of US$ 700-800, reflecting the disadvantaged position of this sector in the marketing chain.
Thailand
Fish trading in Thailand is complex and consists of a large number of intermediaries, including women, particularly as retailers. The marketing margin depends on several factors, such as species, freshness, competition, distance traveled, etc. The marketing margin in the case of freshwater fish varies from 25-40 percent, depending on the type of species traded. Similarly, the producers’ share in consumer price ranges from 60-70 percent. The market structure of marine fisheries is relatively simple in the sense that the marine fishers themselves undertake a part of the marketing activity especially in the case of small-scale fisheries. Usually fishers establish a long-standing relationship with the merchants. The producers’ share in consumer price is 52 percent in the case of non-fish species, such as cephalopods, cuttlefish, and squids. In the case of export-oriented products, the traders normally earn a profit of 18 percent.
98 Strategies and Options for Increasing and Sustaining Fisheries and Aquaculture Production to Benefit Poorer Households in Asia
Vietnam
In Vietnam, fish trading is basically a family enterprise, combined with crop farming and animal husbandry. Normally one to two family members are engaged in fish trading activities, such as retail/wholesale trade, transport, processing, and storage. The wholesale trade in each province is often controlled by few big enterprises. However, the retail trade is relatively competitive and involves a large number of small-scale sellers. The average net annual income of wholesale traders is Dong 65 million (US$ 4,200) from an average annual sale of 128 tonnes. The small-scale retailers have the annual net income of Dong 7.2 million (from an average annual sale of 8.4 tonnes). The traders normally depend on regular suppliers for their trading operations through credit linkages. The producers’ share is estimated at 78-80 percent of the consumer price, indicating higher marketing efficiency. Fish trading is regarded as a profitable business.
Conclusion
The foregoing socioeconomic profile deals with the capabilities and economic well being of households engaged in fish production. In most cases, the average household head has limited education (secondary education for a few, with primary education being the most common). This is a serious constraint on the adoption of technologies for generating incomes. The household size does not differ greatly from the overall average for the rural sector, e.g., fairly large households in South Asia and smaller ones in China.
There is a wide variation in the standard of living within fisheries communities, depending on
country, production system, and technology used. The average pond fish farmer in India, Indonesia, Malaysia, Thailand, and Vietnam tends to be poor, but not so in Bangladesh, China, the Philippines, and Sri Lanka. Meanwhile, households engaged in freshwater cage culture in the Philippines are poorer than those in pond culture, but this is not the case in Indonesia, Malaysia, and Thailand. Households in brackishwater and marine culture are doing relatively well. In marine fisheries, households equipped with small vessels and fishing gears tend to be poor in India, the Philippines, Sri Lanka, and Vietnam. The poorest socioeconomic conditions are found among households dependent on inland fishing.
Poverty also exists among households engaged in fish production-related activities, such as wage earners in commercial fisheries (Bangladesh), fry collectors for shrimp hatcheries (India), and workers in labor-intensive components of shrimp processing, particularly female workers (Bangladesh). Entrepreneurs in fry production and trading seem to be better off than their production counterparts, even in sub-sectors where the scale of activity is small (e.g., freshwater fish hatcheries).
Dependency on fish production also varies substantially. In China and India, fish farming households carry out the activity as their primary occupation, though with different outcomes (i.e., high incomes in the former and relatively low incomes in the latter). Small-scale fishers in coastal communities are often highly dependent on fishing as the sole income source. This is true in the case of South Asia, but there are exceptions, like in Thailand. Such high dependence, combined with marginal socioeconomic conditions, indicates a high degree of vulnerability to shocks – as experienced by coastal communities in the
99CHAPTER 6 | Socioeconomic Profile
region in the extreme case of the December 2004 tsunami tragedy.
Information from the socioeconomic profile is valuable in designing pro-poor strategies for fisheries development. The review confirms that poverty is a serious problem among fishery-dependent households. However, careful targeting is essential as there is a large heterogeneity of living standards within fisheries. To optimize anti-poverty assistance, top priority should be accorded to inland fishers in all countries, as well as to small-scale marine fishers and freshwater fish farmers in most of the developing member countries studied. However, economic linkages dictate that large-scale operators and people in related sectors should not be ignored either. For example, assistance should be extended to development of hatcheries for freshwater aquaculture, market competition and infrastructures in fisheries trade, as well as to conditions for workers in commercial fisheries and labor-intensive fish processing activities.
Promotion of aquaculture is highlighted in the developing member countries both to improve the plight of the rural poor and to provide alternative livelihoods for marine fishers facing resource depletion. However, in designing programs to enhance productivity, the capabilities and acceptability of recommended technologies should be taken into account. The socioeconomic profile presented here is consistent with the analysis in Chapter 4, which shows that low levels of education and training impede the maximization of productivity potential in aquaculture. Another major obstacle is the inability to access formal credit, a market failure that is probably compounded by the perceived riskiness of lending to poor households already eking out a marginal existence. This calls for a two-pronged strategy of safety net provision and of expanded availability of credit.
100 Strategies and Options for Increasing and Sustaining Fisheries and Aquaculture Production to Benefit Poorer Households in Asia
Introduction
This chapter includes a detailed discussion of the patterns of demand, supply, and trade, as well as the structure of supply and demand behavior. This behavior is quantitatively analyzed in terms of measuring response parameters to changes in price, income, and other economic factors. Clearly, estimates of behavioral response are essential in obtaining supply and demand projections for fisheries.
One of the main arguments here is the importance of disaggregated analysis. In contrast, the literature on fish and food security tends to aggregate fish into broad categories, or even as a single commodity altogether (Williams 1996). Doing so obscures the tremendous heterogeneity within the fish sector, concerning types of fish, sources of its production, and behavioral response, thus blunting the usefulness of the analysis for designing and targeting anti-poverty programs.
In the demand section of this chapter, data on fish consumption are provided to ascertain its contribution to food security and well-being of the poor. Estimates of demand elasticities are then presented, along with implications for policy. In the supply section, the analysis dwells on the price response of various production systems and fish types. Supply response analyses are also useful in addressing fishery policy concerns regarding the pace of output growth, the alteration of output
composition, and the flow of marketed surplus (Rao 1989). Lastly, the trade section rounds up the discussion by discussing fish exports and imports in the selected countries. Given the globalization of the fisheries economy in recent years, a discussion of foreign sources of demand and supply is essential for a comprehensive understanding of the overall structure of production and consumption of fish. Documentation of the estimation procedures for demand and supply is unavoidably technical, hence material of interest to specialists is provided separately in Appendix 3.
Demand
Overview
Fish consumption in the selected countries is the highest among the world’s most populous nations (Table 7.1). In contrast, in 1997 per capita fish consumption in the US was below 20 kg/yr, and that in the EU was below 24 kg/yr (Delgado et al. 2003). Fish consumption in the selected countries has been rising at a relatively high rate. Based on data from the Food and Agriculture Organization (FAO), annual per capita consumption during 1985-97 for China, Southeast Asia, India, and other countries in South Asia increased at 10.4, 1.3, and 0.9 percent, respectively, whereas for the developing world (except China), per capita annual consumption shrank by 0.1 percent (Delgado et al. 2003).
Chapter 7
ANALYSIS OF FISH DEMAND, SUPPLY, AND TRADE

101CHAPTER 7 | Fish Demand, Supply, and Trade
The following analysis probes deeper into the structure of fish consumption in two ways. First, household survey data are used to compare with information from the indirect approach (as in FAO datasets) that is prone to measurement error1. Appendix 3, Table 1 documents the sources of data for fish consumption used in this study. It may be seen in Table 7.1 how household survey data may lead to revisions of per capita consumption figures for Malaysia, Bangladesh, and India. In poor countries, food fish obtained from various sources (e.g., subsistence production) may be omitted, hence leading to an underestimation of the importance of fish in food security. Dey et al. (2005b) showed that, in fact, fish is an important source of animal protein for the selected countries, especially for the poor.
For example, the share of fish in animal protein intake exceeds 70 percent for countries such as Thailand, China, and Bangladesh. For India and the Philippines, the share of fish in expenditures on animal protein is about 30 percent higher for the first quartile than the fourth quartile (Dey et al. 2005b).
Second, the analysis here is highly disaggregated. In Asia, fish is consumed as a whole or in pieces; this practice is unlike in the West (where fillet is popular). Hence, consumers distinguish among the various types of fish, and even a particular type can be characterized by various traits (size, color, flesh quality, etc.) Unfortunately, most of the past studies of demand and consumption in Asia rarely differentiated fish according to species or fish types, a gap that is remedied in the present study. Further disaggregation is conducted by
examining demand responses by income group and region.
Contribution of fish to food security
The allocation of the food budget on various food groups commonly purchased by Asian households is presented in Table 7.2. Cereal generally assumes the largest expenditure, share ranging from 24 to 38 percent of the total food budget across the nine countries. This is followed by meat and fish. In most countries, the proportion of the budget spent on fish is larger for consumers belonging to the higher income group than for the lower income group (Table 7.3). Similarly, the share of fish expenditure is found to be higher for consumers in the urban areas than in the rural areas (except for India). This suggests that increasing affluence and urbanization will lead to higher demand for fish.
In the case of Bangladesh, the average monthly household expenditure on food for 1996 was Tk 4,026. The annual per capita fish consumption varied from 13 kg for the lowest income group to 34 kg for the highest income group, with an average of 22 kg for all groups. Apparently, the share of fish in the total food expenditure increased with increasing income.
A typical household in China consists of three members, and earns about US$ 3,487/yr. Up to 70 percent of the income originates from salaries while the rest comes from business and other sources. The household in the lowest income group earns less than US$ 1,830 annually while that in the highest income group earns more
1 FAO figures on per capita fish consumption (and many national estimates) simply take the production data, add net exports, and subtract non-food uses of fish to estimate total food consumption. This is then divided by the total population.
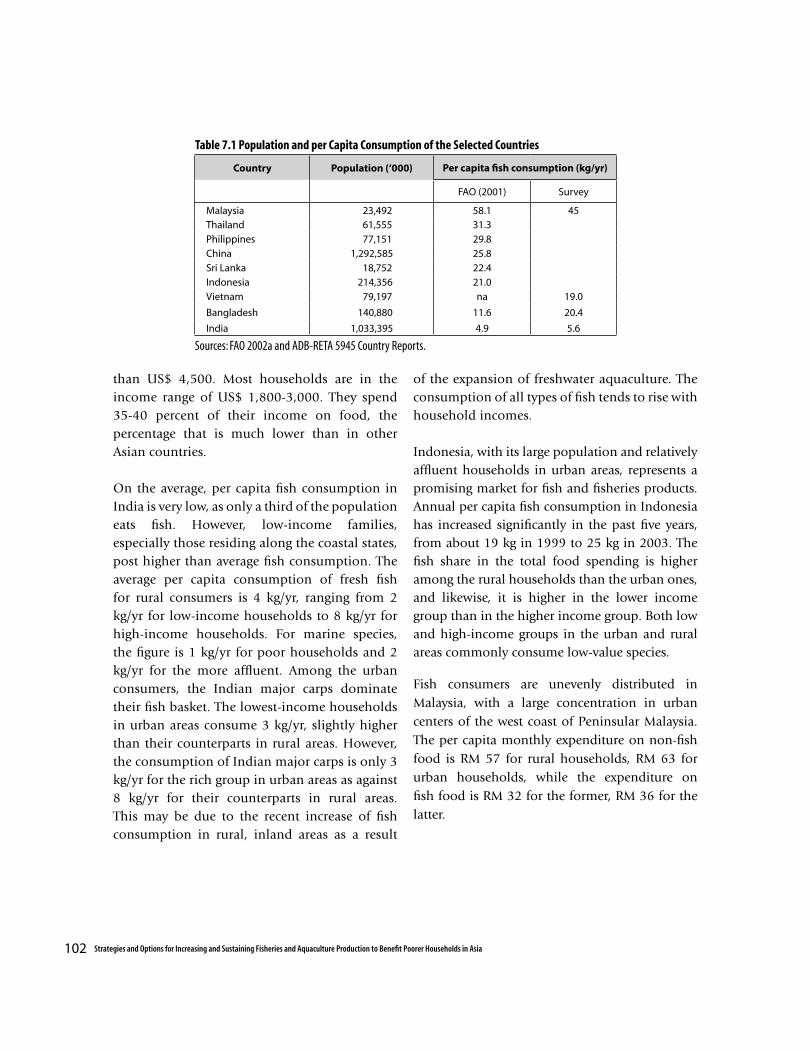
102 Strategies and Options for Increasing and Sustaining Fisheries and Aquaculture Production to Benefit Poorer Households in Asia
than US$ 4,500. Most households are in the income range of US$ 1,800-3,000. They spend 35-40 percent of their income on food, the percentage that is much lower than in other Asian countries.
On the average, per capita fish consumption in India is very low, as only a third of the population eats fish. However, low-income families, especially those residing along the coastal states, post higher than average fish consumption. The average per capita consumption of fresh fish for rural consumers is 4 kg/yr, ranging from 2 kg/yr for low-income households to 8 kg/yr for high-income households. For marine species, the figure is 1 kg/yr for poor households and 2 kg/yr for the more affluent. Among the urban consumers, the Indian major carps dominate their fish basket. The lowest-income households in urban areas consume 3 kg/yr, slightly higher than their counterparts in rural areas. However, the consumption of Indian major carps is only 3 kg/yr for the rich group in urban areas as against 8 kg/yr for their counterparts in rural areas. This may be due to the recent increase of fish consumption in rural, inland areas as a result
of the expansion of freshwater aquaculture. The consumption of all types of fish tends to rise with household incomes.
Indonesia, with its large population and relatively affluent households in urban areas, represents a promising market for fish and fisheries products. Annual per capita fish consumption in Indonesia has increased significantly in the past five years, from about 19 kg in 1999 to 25 kg in 2003. The fish share in the total food spending is higher among the rural households than the urban ones, and likewise, it is higher in the lower income group than in the higher income group. Both low and high-income groups in the urban and rural areas commonly consume low-value species.
Fish consumers are unevenly distributed in Malaysia, with a large concentration in urban centers of the west coast of Peninsular Malaysia. The per capita monthly expenditure on non-fish food is RM 57 for rural households, RM 63 for urban households, while the expenditure on fish food is RM 32 for the former, RM 36 for the latter.
Country Population (‘000) Per capita fish consumption (kg/yr)
FAO (2001) Survey
Malaysia 23,492 58.1 45Thailand 61,555 31.3Philippines 77,151 29.8China 1,292,585 25.8Sri Lanka 18,752 22.4Indonesia 214,356 21.0Vietnam 79,197 na 19.0
Bangladesh 140,880 11.6 20.4
India 1,033,395 4.9 5.6
Table 7.1 Population and per Capita Consumption of the Selected Countries
Sources: FAO 2002a and ADB-RETA 5945 Country Reports.
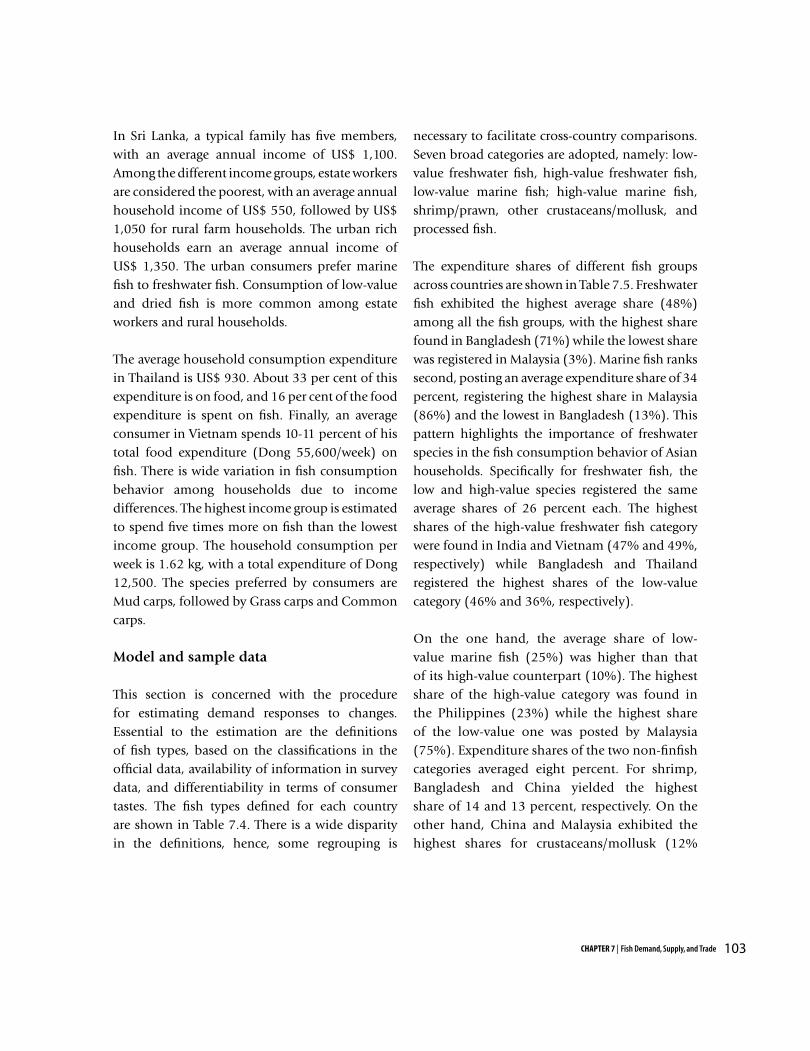
103CHAPTER 7 | Fish Demand, Supply, and Trade
In Sri Lanka, a typical family has five members, with an average annual income of US$ 1,100. Among the different income groups, estate workers are considered the poorest, with an average annual household income of US$ 550, followed by US$ 1,050 for rural farm households. The urban rich households earn an average annual income of US$ 1,350. The urban consumers prefer marine fish to freshwater fish. Consumption of low-value and dried fish is more common among estate workers and rural households. The average household consumption expenditure in Thailand is US$ 930. About 33 per cent of this expenditure is on food, and 16 per cent of the food expenditure is spent on fish. Finally, an average consumer in Vietnam spends 10-11 percent of his total food expenditure (Dong 55,600/week) on fish. There is wide variation in fish consumption behavior among households due to income differences. The highest income group is estimated to spend five times more on fish than the lowest income group. The household consumption per week is 1.62 kg, with a total expenditure of Dong 12,500. The species preferred by consumers are Mud carps, followed by Grass carps and Common carps.
Model and sample data
This section is concerned with the procedure for estimating demand responses to changes. Essential to the estimation are the definitions of fish types, based on the classifications in the official data, availability of information in survey data, and differentiability in terms of consumer tastes. The fish types defined for each country are shown in Table 7.4. There is a wide disparity in the definitions, hence, some regrouping is
necessary to facilitate cross-country comparisons. Seven broad categories are adopted, namely: low-value freshwater fish, high-value freshwater fish, low-value marine fish; high-value marine fish, shrimp/prawn, other crustaceans/mollusk, and processed fish.
The expenditure shares of different fish groups across countries are shown in Table 7.5. Freshwater fish exhibited the highest average share (48%) among all the fish groups, with the highest share found in Bangladesh (71%) while the lowest share was registered in Malaysia (3%). Marine fish ranks second, posting an average expenditure share of 34 percent, registering the highest share in Malaysia (86%) and the lowest in Bangladesh (13%). This pattern highlights the importance of freshwater species in the fish consumption behavior of Asian households. Specifically for freshwater fish, the low and high-value species registered the same average shares of 26 percent each. The highest shares of the high-value freshwater fish category were found in India and Vietnam (47% and 49%, respectively) while Bangladesh and Thailand registered the highest shares of the low-value category (46% and 36%, respectively).
On the one hand, the average share of low-value marine fish (25%) was higher than that of its high-value counterpart (10%). The highest share of the high-value category was found in the Philippines (23%) while the highest share of the low-value one was posted by Malaysia (75%). Expenditure shares of the two non-finfish categories averaged eight percent. For shrimp, Bangladesh and China yielded the highest share of 14 and 13 percent, respectively. On the other hand, China and Malaysia exhibited the highest shares for crustaceans/mollusk (12%
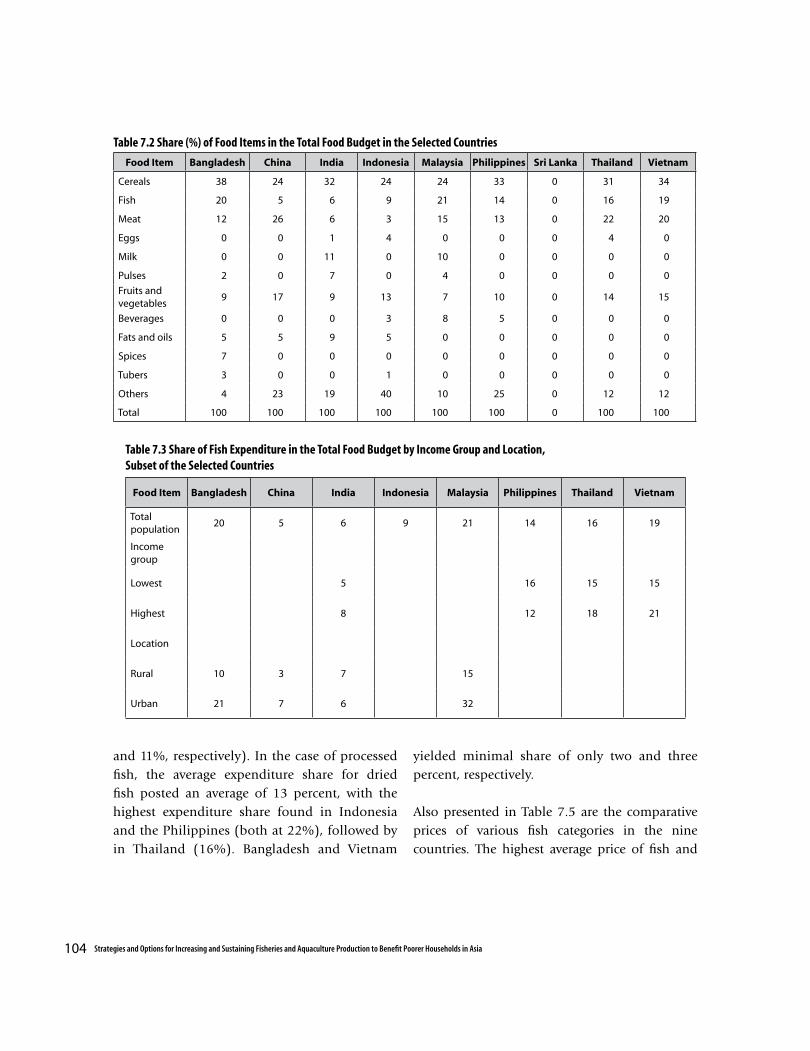
104 Strategies and Options for Increasing and Sustaining Fisheries and Aquaculture Production to Benefit Poorer Households in Asia
Food Item Bangladesh China India Indonesia Malaysia Philippines Sri Lanka Thailand Vietnam
Cereals 38 24 32 24 24 33 0 31 34
Fish 20 5 6 9 21 14 0 16 19
Meat 12 26 6 3 15 13 0 22 20
Eggs 0 0 1 4 0 0 0 4 0
Milk 0 0 11 0 10 0 0 0 0
Pulses 2 0 7 0 4 0 0 0 0
Fruits and vegetables
9 17 9 13 7 10 0 14 15
Beverages 0 0 0 3 8 5 0 0 0
Fats and oils 5 5 9 5 0 0 0 0 0
Spices 7 0 0 0 0 0 0 0 0
Tubers 3 0 0 1 0 0 0 0 0
Others 4 23 19 40 10 25 0 12 12
Total 100 100 100 100 100 100 0 100 100
Table 7.2 Share (%) of Food Items in the Total Food Budget in the Selected Countries
Table 7.3 Share of Fish Expenditure in the Total Food Budget by Income Group and Location, Subset of the Selected Countries
Food Item Bangladesh China India Indonesia Malaysia Philippines Thailand Vietnam
Total population
20 5 6 9 21 14 16 19
Income group
Lowest 5 16 15 15
Highest 8 12 18 21
Location
Rural 10 3 7 15
Urban 21 7 6 32
and 11%, respectively). In the case of processed fish, the average expenditure share for dried fish posted an average of 13 percent, with the highest expenditure share found in Indonesia and the Philippines (both at 22%), followed by in Thailand (16%). Bangladesh and Vietnam
yielded minimal share of only two and three percent, respectively.
Also presented in Table 7.5 are the comparative prices of various fish categories in the nine countries. The highest average price of fish and
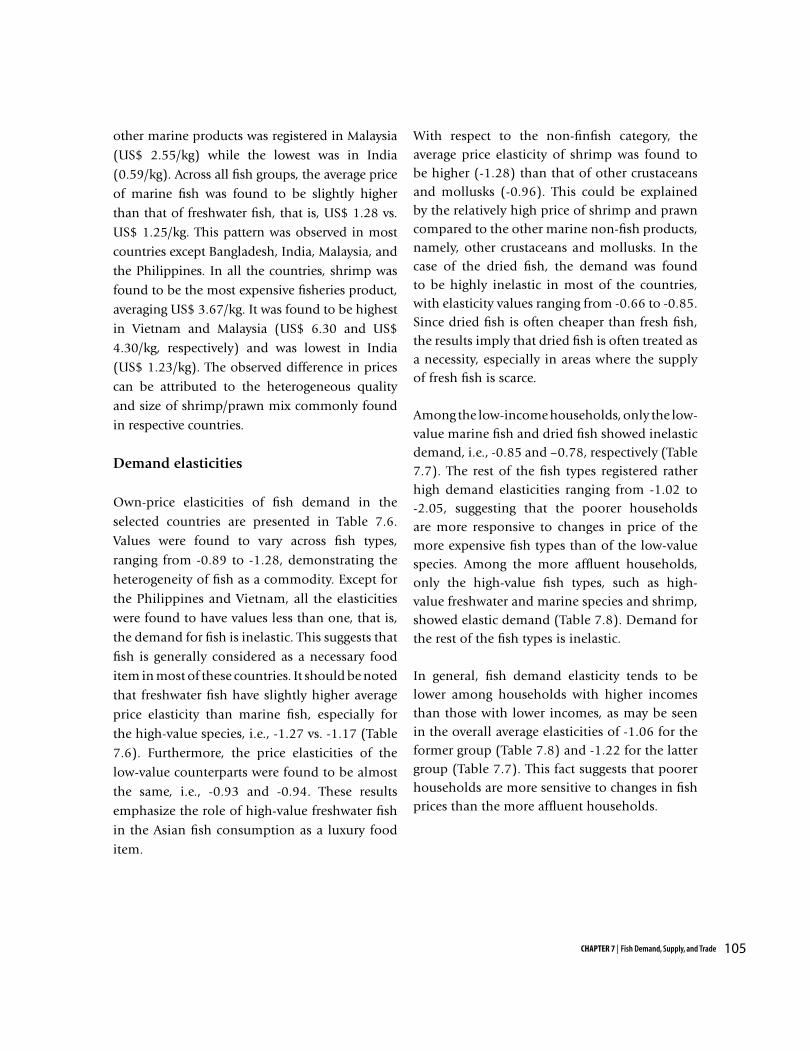
105CHAPTER 7 | Fish Demand, Supply, and Trade
other marine products was registered in Malaysia
(US$ 2.55/kg) while the lowest was in India
(0.59/kg). Across all fish groups, the average price
of marine fish was found to be slightly higher
than that of freshwater fish, that is, US$ 1.28 vs.
US$ 1.25/kg. This pattern was observed in most
countries except Bangladesh, India, Malaysia, and
the Philippines. In all the countries, shrimp was
found to be the most expensive fisheries product,
averaging US$ 3.67/kg. It was found to be highest
in Vietnam and Malaysia (US$ 6.30 and US$
4.30/kg, respectively) and was lowest in India
(US$ 1.23/kg). The observed difference in prices
can be attributed to the heterogeneous quality
and size of shrimp/prawn mix commonly found
in respective countries.
Demand elasticities
Own-price elasticities of fish demand in the
selected countries are presented in Table 7.6.
Values were found to vary across fish types,
ranging from -0.89 to -1.28, demonstrating the
heterogeneity of fish as a commodity. Except for
the Philippines and Vietnam, all the elasticities
were found to have values less than one, that is,
the demand for fish is inelastic. This suggests that
fish is generally considered as a necessary food
item in most of these countries. It should be noted
that freshwater fish have slightly higher average
price elasticity than marine fish, especially for
the high-value species, i.e., -1.27 vs. -1.17 (Table
7.6). Furthermore, the price elasticities of the
low-value counterparts were found to be almost
the same, i.e., -0.93 and -0.94. These results
emphasize the role of high-value freshwater fish
in the Asian fish consumption as a luxury food
item.
With respect to the non-finfish category, the average price elasticity of shrimp was found to be higher (-1.28) than that of other crustaceans and mollusks (-0.96). This could be explained by the relatively high price of shrimp and prawn compared to the other marine non-fish products, namely, other crustaceans and mollusks. In the case of the dried fish, the demand was found to be highly inelastic in most of the countries, with elasticity values ranging from -0.66 to -0.85. Since dried fish is often cheaper than fresh fish, the results imply that dried fish is often treated as a necessity, especially in areas where the supply of fresh fish is scarce.
Among the low-income households, only the low-value marine fish and dried fish showed inelastic demand, i.e., -0.85 and –0.78, respectively (Table 7.7). The rest of the fish types registered rather high demand elasticities ranging from -1.02 to -2.05, suggesting that the poorer households are more responsive to changes in price of the more expensive fish types than of the low-value species. Among the more affluent households, only the high-value fish types, such as high-value freshwater and marine species and shrimp, showed elastic demand (Table 7.8). Demand for the rest of the fish types is inelastic.
In general, fish demand elasticity tends to be lower among households with higher incomes than those with lower incomes, as may be seen in the overall average elasticities of -1.06 for the former group (Table 7.8) and -1.22 for the latter group (Table 7.7). This fact suggests that poorer households are more sensitive to changes in fish prices than the more affluent households.

106 Strategies and Options for Increasing and Sustaining Fisheries and Aquaculture Production to Benefit Poorer Households in Asia
The income elasticities of the seven fish types in the nine countries all showed positive values (Table 7.9). This implies that fish in general (whether fresh or dried) is considered a normal commodity in the Asian countries. The average elasticities were found to be mostly high, with values greater than one in Bangladesh, China, India, Indonesia, and the Philippines, suggesting that fish is considered a luxury item in these countries. Malaysia, Sri Lanka, Thailand, and Vietnam yielded inelastic values, indicating that fish is a necessity there. Overall, the average value 1.08 for all the nine countries, indicating an almost uniform elastic demand for fish with respect to income.
On the average, marine fish, especially the high-value species, indicated higher income elasticity than freshwater fish (1.21 vs. 0.98). The low-value species of both types, however, registered almost the same income elasticities (1.08 and 1.04, respectively). At the same time, income elasticities for all the fish types were quite high among the low-income households, with values raging from 1.21 to 2.43 (Table 7.10). Conversely, the high-income households yielded inelastic values for all the fish types ranging from 0.61 to 0.92 (Table 7.11). This suggests that fish consumption among the poorer households respond more to income than the richer households, and that increases in incomes of the poorer households will boost demand for fish in Asia.
Implications
Two important points emerge from this analysis. First, fish is clearly a heterogeneous product, as shown by the wide disparity in the estimated income and price elasticities for the different fish types. Second, the estimated price and income
elasticities vary across income groups. Specifically, both price and income elasticities for all fish types tend to be higher among the poorer members of the society than among the more affluent members. This implies that the poor often consider fish as a luxury commodity while the rich consider it as an ordinary food item.
A simple, “back-of-the-envelope” analysis suggests that as per capita incomes and populations grow in most Asian countries, there will be tremendous increases in fish demand. If there is no increase in the supply of fish to meet the demand, then prices of fish in the market will go up, and this will hurt consumers, with worrisome consequences on the protein intake of the poor. However, if fish supply increases dramatically, probably from aquaculture sources, then prices will fall, and with other factors being constant, this may be disadvantageous to fish farmers. The fact that demand is elastic (particularly for freshwater species) suggests that a price decline shall be followed by rising gross incomes of fish suppliers. This reasoning however will need to be confirmed by a rigorous projection exercise based on a multi-product supply and demand system (see Chapter 8).

107CHAPTER 7 | Fish Demand, Supply, and Trade
Co
un
trie
sFi
sh S
pec
ies/
Typ
es a
nd
Nu
mb
er
Ban
gla
des
hIn
dia
n m
ajo
r car
p, o
ther
car
p, t
ilap
ia, p
ang
as, l
ive
fish
, hils
ha,
fres
hw
ater
fish
, sh
rim
p, h
igh
-val
ue
fish
, ass
ort
ed s
mal
l fish
, an
d d
ried
fish
(1
1)
Ch
ina
Yello
w c
rock
er, h
airt
ail,
Gra
ss c
arp
, Silv
er c
arp
, Cru
cian
car
p, C
om
mo
n c
arp
, sh
rim
p, f
resh
wat
er fi
sh, m
arin
e fis
h, a
nd
oth
er a
qu
atic
p
rod
uct
s (1
0)
Ind
iaIn
dia
n m
ajo
r car
p, o
ther
fres
hw
ater
fish
, sh
rim
p, p
elag
ic h
igh
-val
ue
fish
, pel
agic
low
-val
ue
fish
, dem
ersa
l hig
h-v
alu
e fis
h, d
emer
sal
low
-val
ue
fish
, an
d m
ollu
sks
(8)
Ind
on
esia
Hig
h-v
alu
e fis
h, m
ediu
m-v
alu
e fis
h, l
ow
-val
ue
fish
, cru
stac
ean
s, o
ther
fres
hw
ater
fish
, dri
ed fi
sh, a
nd
pre
serv
ed fi
sh (7
)
Mal
aysi
aFr
esh
wat
er fi
sh, l
ow
-val
ue
fish
, hig
h-v
alu
e fis
h, c
rust
acea
ns,
mo
llusk
s, an
chov
y, a
nd
oth
er fi
sh (7
)
Phili
pp
ines
An
chov
y, m
ilkfis
h, r
ou
nd
scad
, tila
pia
, sh
rim
p, s
qu
id, s
hel
ls/c
rab
s, o
ther
fres
h fi
sh, a
nd
pro
cess
ed fi
sh (9
)
Sri L
anka
Larg
e p
elag
ic fi
sh, s
mal
l pel
agic
fish
, dem
ersa
l fish
, oth
er m
arin
e fis
h, f
resh
wat
er fi
sh, a
nd
pro
cess
ed fi
sh (6
)
Thai
lan
dTi
lap
ia, S
ilver
bar
b, c
atfis
h, s
nak
ehea
d, In
do
-Pac
ific
mac
kere
l, d
ried
fish
, sh
rim
p, o
ther
hig
h-v
alu
e fis
h, a
nd
oth
er lo
w-v
alu
e fis
h (9
)
Vie
tnam
Snak
ehea
d, t
ilap
ia, c
arp
, cat
fish
, sh
rim
p, S
ilver
bar
b, lo
w-v
alu
e fr
esh
wat
er fi
sh, h
igh
-val
ue
fres
hw
ater
fish
, lo
w-v
alu
e m
arin
e fis
h, a
nd
h
igh
-val
ue
mar
ine
fish
(10)
Tabl
e 7.
4 Fi
sh D
isag
greg
atio
n an
d Fi
sh p
er C
apita
Con
sum
ptio
n in
the
Dem
and
Mod
el
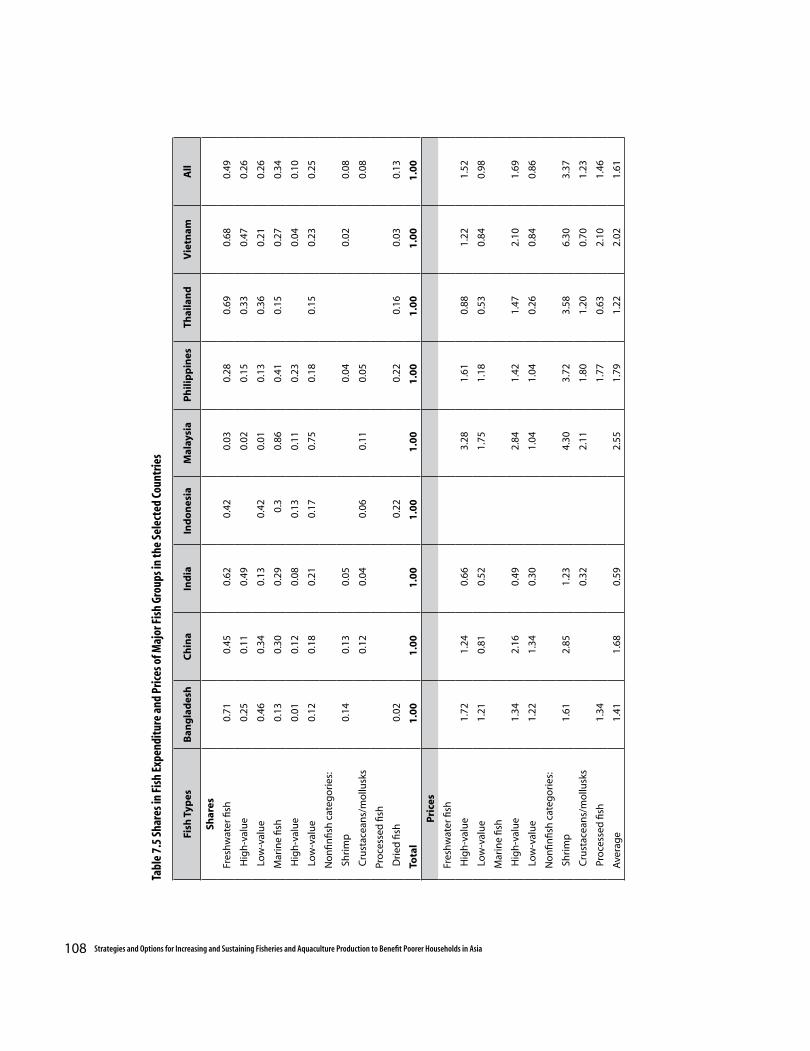
108 Strategies and Options for Increasing and Sustaining Fisheries and Aquaculture Production to Benefit Poorer Households in Asia
Fish
Typ
esB
ang
lad
esh
Ch
ina
Ind
iaIn
do
nes
iaM
alay
sia
Ph
ilip
pin
esTh
aila
nd
Vie
tnam
All
Shar
es
Fres
hw
ater
fish
0.71
0.45
0.62
0.42
0.03
0.28
0.69
0.68
0.49
Hig
h-v
alu
e 0.
250.
110.
490.
020.
150.
330.
470.
26
Lo
w-v
alu
e 0.
460.
340.
130.
420.
010.
130.
360.
210.
26
Mar
ine
fish
0.13
0.30
0.29
0.3
0.86
0.41
0.15
0.27
0.34
Hig
h-v
alu
e0.
010.
120.
080.
130.
110.
230.
040.
10
Lo
w-v
alu
e 0.
120.
180.
210.
170.
750.
180.
150.
230.
25
No
nfin
fish
cat
ego
ries
:
Sh
rim
p0.
140.
130.
050.
040.
020.
08
Cru
stac
ean
s/m
ollu
sks
0.12
0.04
0.06
0.11
0.05
0.08
Pro
cess
ed fi
sh
Dri
ed fi
sh0.
020.
220.
220.
160.
030.
13
Tota
l1
.00
1.0
01
.00
1.0
01
.00
1.0
01
.00
1.0
01
.00
Pri
ces
Fres
hw
ater
fish
Hig
h-v
alu
e 1.
721.
240.
663.
281.
610.
881.
221.
52
Lo
w-v
alu
e 1.
210.
810.
521.
751.
180.
530.
840.
98
Mar
ine
fish
Hig
h-v
alu
e1.
342.
160.
492.
841.
421.
472.
101.
69
Lo
w-v
alu
e1.
221.
340.
301.
041.
040.
260.
840.
86
No
nfin
fish
cat
ego
ries
:
Sh
rim
p1.
612.
851.
234.
303.
723.
586.
303.
37
Cru
stac
ean
s/m
ollu
sks
0.32
2.11
1.80
1.20
0.70
1.23
Pro
cess
ed fi
sh1.
341.
770.
632.
101.
46
Ave
rag
e1.
411.
680.
592.
551.
791.
222.
021.
61
Tabl
e 7.
5 Sh
ares
in F
ish
Expe
nditu
re a
nd P
rices
of M
ajor
Fis
h Gr
oups
in th
e Se
lect
ed C
ount
ries
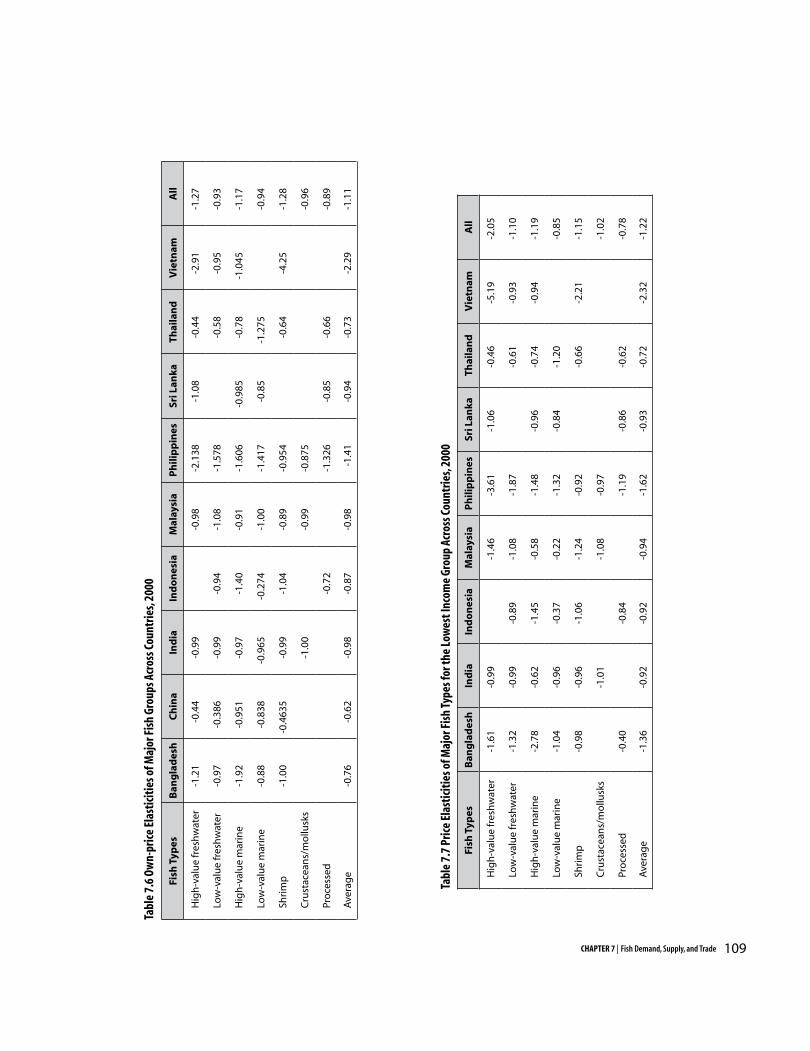
109CHAPTER 7 | Fish Demand, Supply, and Trade
Fish
Typ
esB
ang
lad
esh
Ch
ina
Ind
iaIn
do
nes
iaM
alay
sia
Ph
ilip
pin
esSr
i Lan
kaTh
aila
nd
Vie
tnam
All
Hig
h-v
alu
e fr
esh
wat
er
-1.2
1-0
.44
-0.9
9-0
.98
-2.1
38-1
.08
-0.4
4-2
.91
-1.2
7
Low
-val
ue
fres
hw
ater
-0.9
7-0
.386
-0.9
9-0
.94
-1.0
8-1
.578
-0.5
8-0
.95
-0.9
3
Hig
h-v
alu
e m
arin
e-1
.92
-0.9
51-0
.97
-1.4
0-0
.91
-1.6
06-0
.985
-0.7
8-1
.045
-1.1
7
Low
-val
ue
mar
ine
-0.8
8-0
.838
-0.9
65-0
.274
-1.0
0-1
.417
-0.8
5-1
.275
-0.9
4
Shri
mp
-1.0
0-0
.463
5-0
.99
-1.0
4-0
.89
-0.9
54-0
.64
-4.2
5-1
.28
Cru
stac
ean
s/m
ollu
sks
-1.0
0-0
.99
-0.8
75-0
.96
Pro
cess
ed
-0.7
2-1
.326
-0.8
5-0
.66
-0.8
9
Ave
rag
e-0
.76
-0.6
2-0
.98
-0.8
7-0
.98
-1.4
1-0
.94
-0.7
3-2
.29
-1.1
1
Tabl
e 7.
6 Ow
n-pr
ice
Elas
ticiti
es o
f Maj
or F
ish
Grou
ps A
cros
s Cou
ntrie
s, 20
00
Tabl
e 7.
7 Pr
ice
Elas
ticiti
es o
f Maj
or F
ish
Type
s for
the
Low
est I
ncom
e Gr
oup
Acro
ss C
ount
ries,
2000
Fish
Typ
esB
ang
lad
esh
Ind
iaIn
do
nes
iaM
alay
sia
Ph
ilip
pin
esSr
i Lan
kaTh
aila
nd
Vie
tnam
All
Hig
h-v
alu
e fr
esh
wat
er
-1.6
1-0
.99
-1.4
6-3
.61
-1.0
6-0
.46
-5.1
9-2
.05
Low
-val
ue
fres
hw
ater
-1.3
2-0
.99
-0.8
9-1
.08
-1.8
7-0
.61
-0.9
3-1
.10
Hig
h-v
alu
e m
arin
e-2
.78
-0.6
2-1
.45
-0.5
8-1
.48
-0.9
6-0
.74
-0.9
4-1
.19
Low
-val
ue
mar
ine
-1.0
4-0
.96
-0.3
7-0
.22
-1.3
2-0
.84
-1.2
0-0
.85
Shri
mp
-0.9
8-0
.96
-1.0
6-1
.24
-0.9
2-0
.66
-2.2
1-1
.15
Cru
stac
ean
s/m
ollu
sks
-1.0
1-1
.08
-0.9
7-1
.02
Pro
cess
ed
-0.4
0-0
.84
-1.1
9-0
.86
-0.6
2-0
.78
Ave
rag
e-1
.36
-0.9
2-0
.92
-0.9
4-1
.62
-0.9
3-0
.72
-2.3
2-1
.22
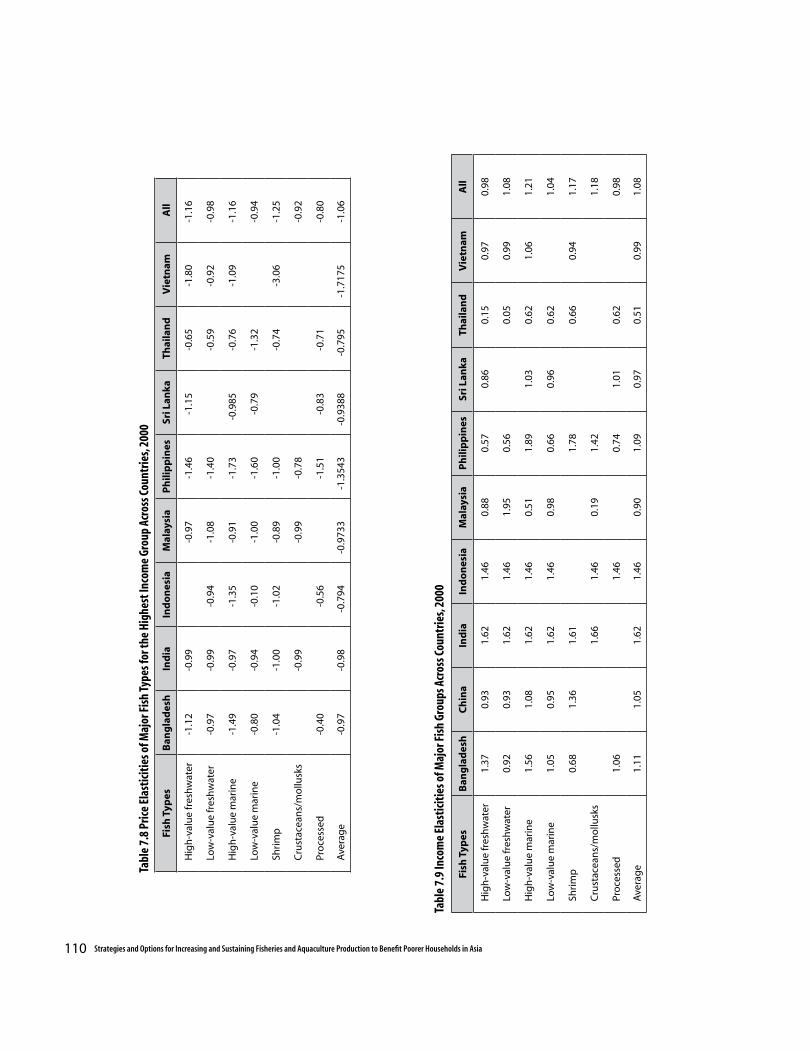
110 Strategies and Options for Increasing and Sustaining Fisheries and Aquaculture Production to Benefit Poorer Households in Asia
Tabl
e 7.
8 Pr
ice
Elas
ticiti
es o
f Maj
or F
ish
Type
s for
the
High
est I
ncom
e Gr
oup
Acro
ss C
ount
ries,
2000
Tabl
e 7.
9 In
com
e El
astic
ities
of M
ajor
Fis
h Gr
oups
Acr
oss C
ount
ries,
2000
Fish
Typ
esB
ang
lad
esh
Ind
iaIn
do
nes
iaM
alay
sia
Ph
ilip
pin
esSr
i Lan
kaTh
aila
nd
Vie
tnam
All
Hig
h-v
alu
e fr
esh
wat
er
-1.1
2-0
.99
-0.9
7-1
.46
-1.1
5-0
.65
-1.8
0-1
.16
Low
-val
ue
fres
hw
ater
-0.9
7-0
.99
-0.9
4-1
.08
-1.4
0-0
.59
-0.9
2-0
.98
Hig
h-v
alu
e m
arin
e-1
.49
-0.9
7-1
.35
-0.9
1-1
.73
-0.9
85-0
.76
-1.0
9-1
.16
Low
-val
ue
mar
ine
-0.8
0-0
.94
-0.1
0-1
.00
-1.6
0-0
.79
-1.3
2-0
.94
Shri
mp
-1.0
4-1
.00
-1.0
2-0
.89
-1.0
0-0
.74
-3.0
6-1
.25
Cru
stac
ean
s/m
ollu
sks
-0.9
9-0
.99
-0.7
8-0
.92
Pro
cess
ed
-0.4
0-0
.56
-1.5
1-0
.83
-0.7
1-0
.80
Ave
rag
e-0
.97
-0.9
8-0
.794
-0.9
733
-1.3
543
-0.9
388
-0.7
95-1
.717
5-1
.06
Fish
Typ
esB
ang
lad
esh
Ch
ina
Ind
iaIn
do
nes
iaM
alay
sia
Ph
ilip
pin
esSr
i Lan
kaTh
aila
nd
Vie
tnam
All
Hig
h-v
alu
e fr
esh
wat
er
1.37
0.93
1.62
1.46
0.88
0.57
0.86
0.15
0.97
0.98
Low
-val
ue
fres
hw
ater
0.92
0.93
1.62
1.46
1.95
0.56
0.05
0.99
1.08
Hig
h-v
alu
e m
arin
e1.
561.
081.
621.
460.
511.
891.
030.
621.
061.
21
Low
-val
ue
mar
ine
1.05
0.95
1.62
1.46
0.98
0.66
0.96
0.62
1.04
Shri
mp
0.68
1.36
1.61
1.78
0.66
0.94
1.17
Cru
stac
ean
s/m
ollu
sks
1.66
1.46
0.19
1.42
1.18
Pro
cess
ed
1.06
1.46
0.74
1.01
0.62
0.98
Ave
rag
e1.
111.
051.
621.
460.
901.
090.
970.
510.
991.
08
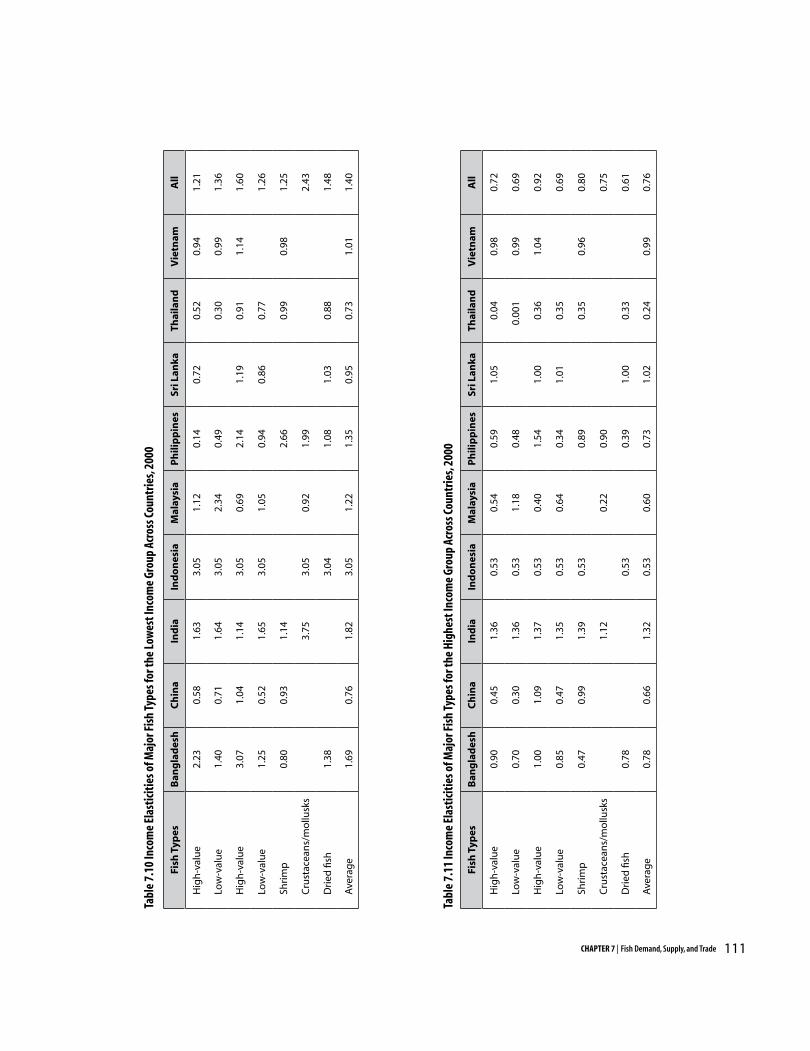
111CHAPTER 7 | Fish Demand, Supply, and Trade
Tabl
e 7.
10 In
com
e El
astic
ities
of M
ajor
Fis
h Ty
pes f
or th
e Lo
wes
t Inc
ome
Grou
p Ac
ross
Cou
ntrie
s, 20
00
Tabl
e 7.
11 In
com
e El
astic
ities
of M
ajor
Fis
h Ty
pes f
or th
e Hi
ghes
t Inc
ome
Grou
p Ac
ross
Cou
ntrie
s, 20
00
Fish
Typ
esB
ang
lad
esh
Ch
ina
Ind
iaIn
do
nes
iaM
alay
sia
Ph
ilip
pin
esSr
i Lan
kaTh
aila
nd
Vie
tnam
All
Hig
h-v
alu
e 2.
230.
581.
633.
051.
120.
140.
720.
520.
941.
21
Lo
w-v
alu
e 1.
400.
711.
643.
052.
340.
490.
300.
991.
36
Hig
h-v
alu
e 3.
071.
041.
143.
050.
692.
141.
190.
911.
141.
60
Lo
w-v
alu
e 1.
250.
521.
653.
051.
050.
940.
860.
771.
26
Sh
rim
p0.
800.
931.
142.
660.
990.
981.
25
Cru
stac
ean
s/m
ollu
sks
3.75
3.05
0.92
1.99
2.43
Dri
ed fi
sh1.
383.
041.
081.
030.
881.
48
Ave
rag
e1.
690.
761.
823.
051.
221.
350.
950.
731.
011.
40
Fish
Typ
esB
ang
lad
esh
Ch
ina
Ind
iaIn
do
nes
iaM
alay
sia
Ph
ilip
pin
esSr
i Lan
kaTh
aila
nd
Vie
tnam
All
Hig
h-v
alu
e 0.
900.
451.
360.
530.
540.
591.
050.
040.
980.
72
Lo
w-v
alu
e 0.
700.
301.
360.
531.
180.
480.
001
0.99
0.69
Hig
h-v
alu
e 1.
001.
091.
370.
530.
401.
541.
000.
361.
040.
92
Lo
w-v
alu
e 0.
850.
471.
350.
530.
640.
341.
010.
350.
69
Sh
rim
p0.
470.
991.
390.
530.
890.
350.
960.
80
Cru
stac
ean
s/m
ollu
sks
1.12
0.22
0.90
0.75
Dri
ed fi
sh0.
780.
530.
391.
000.
330.
61
Ave
rag
e0.
780.
661.
320.
530.
600.
731.
020.
240.
990.
76
112 Strategies and Options for Increasing and Sustaining Fisheries and Aquaculture Production to Benefit Poorer Households in Asia
Supply
The supply side of fisheries is crucial to evaluating the market outlook, addressing requirements of demand and food security, and the long-term prospects of fish producers. Provided in Table 7.12 is a breakdown of global output trends (mentioned earlier in Chapter 2) by production source in 1997-2001. Marine capture output has reached a plateau at around 70 million t/yr; in Asia, a similar stable trend is observed at around 30 million tonnes. Prospects for growth in fisheries are evident only outside marine capture fisheries, particularly in aquaculture. The inland capture and culture outputs have risen to 50-60 million tonnes in just five years, with their share in the total world output climbing from 40 to 46 percent. A large part of this expansion comes from Asia, which holds a stable share in global aquaculture and inland capture fisheries at around 80 percent. Within Asia, the nine selected countries, which account for a large bulk of Asia’s output, have posted rapid growth over the past decade (1991-2001), at an average of 7.8 percent/yr. This rate is more than twice as high as the growth rate of the world fish production (2.9%). Only Thailand (at 2%) and the Philippines (at 0.3%) recorded growth rates slower than the world pace.
As pointed out earlier, disaggregated analysis should be undertaken on the supply side, due to differences in production systems and input-output relations across fish types. As with the demand side, the definitions of fish types on the supply side rely on economic criteria, as well as the availability of data in official statistics. Data sources are provided in Appendix 3, Table 2.
The fish types adopted for discussions of the supply side in the study are identified in Table
7.13. Capture fisheries are typically subdivided into marine and inland fisheries. With a few exceptions, aquaculture is disaggregated into freshwater and brackishwater categories (with marine being occasionally distinct). Many countries make a distinction between high-value and low-value fish. It should be noted that the differences in fish type definitions on both supply and demand sides entail a special technique for matching the fish types, in order to balance supply and demand in each market (see Chapter 8).
Data on the shares of different fish types in the total production are shown in Table 7.14. Inland culture systems in India, Bangladesh, and China are dominated by carp; other freshwater species, such as tilapia and catfish, become important in Southeast Asian countries (Indonesia, the Philippines, Malaysia, Thailand, and Vietnam).Brackishwater aquaculture is dominated by shrimp; other brackishwater species include mollusks (Malaysia) and milkfish (Philippines). Marine capture fisheries produce multi-species, although low-value fish are typically captured in greater quantities.
Supply estimation
A significant feature of fish production in most of Asia is its multi-product, joint input technology. This is true for marine capture fisheries (especially in the tropics), as well as in aquaculture, which is dominated by polyculture systems. An example of a multi-product approach is seen in an application of the normalized quadratic profit function, which yields a system of related supply functions that are linear in normalized prices. (Details are given in Appendix 3.) This functional form is used in the supply estimation procedure for this study.
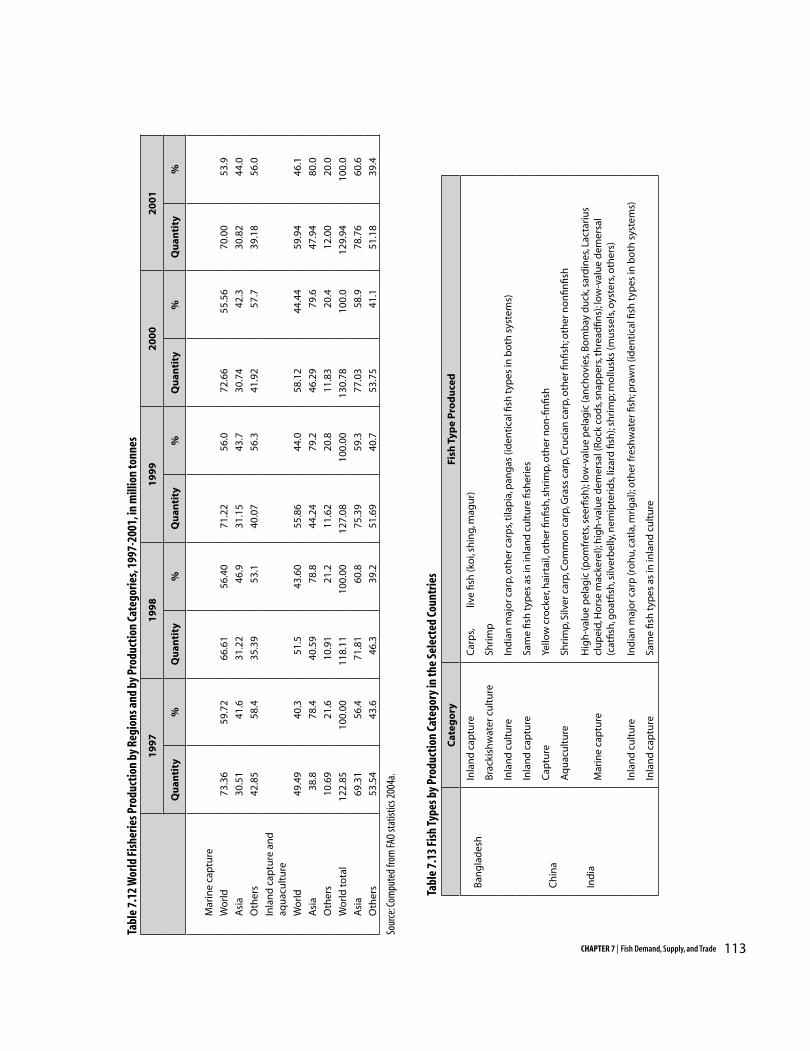
113CHAPTER 7 | Fish Demand, Supply, and Trade
19
97
19
98
19
99
20
00
20
01
Qu
anti
ty%
Qu
anti
ty%
Qu
anti
ty%
Qu
anti
ty%
Qu
anti
ty%
Mar
ine
cap
ture
Wo
rld
73.3
659
.72
66.6
156
.40
71.2
256
.072
.66
55.5
670
.00
53.9
Asi
a30
.51
41.6
31.2
246
.931
.15
43.7
30.7
442
.330
.82
44.0
Oth
ers
42.8
558
.435
.39
53.1
40.0
756
.341
.92
57.7
39.1
856
.0
Inla
nd
cap
ture
an
d
aqu
acu
ltu
re
Wo
rld
49.4
940
.351
.543
.60
55.8
644
.058
.12
44.4
459
.94
46.1
Asi
a38
.878
.440
.59
78.8
44.2
479
.246
.29
79.6
47.9
480
.0
Oth
ers
10.6
921
.610
.91
21.2
11.6
220
.811
.83
20.4
12.0
020
.0
Wo
rld
tota
l12
2.85
100.
0011
8.11
100.
0012
7.08
100.
0013
0.78
100.
012
9.94
100.
0
Asi
a69
.31
56.4
71.8
160
.875
.39
59.3
77.0
358
.978
.76
60.6
Oth
ers
53.5
443
.646
.339
.251
.69
40.7
53.7
541
.151
.18
39.4
Tabl
e 7.
12 W
orld
Fis
herie
s Pro
duct
ion
by R
egio
ns a
nd b
y Pr
oduc
tion
Cate
gorie
s, 19
97-2
001,
in m
illio
n to
nnes
Sour
ce: C
ompu
ted
from
FAO
stat
istics
200
4a.
Cat
ego
ryFi
sh T
ype
Pro
du
ced
Ban
gla
des
hIn
lan
d c
aptu
reC
arp
s,
live
fish
(ko
i, sh
ing,
mag
ur)
Bra
ckis
hw
ater
cu
ltu
reSh
rim
p
Inla
nd
cu
ltu
reIn
dia
n m
ajo
r car
p, o
ther
car
ps,
tila
pia
, pan
gas
(id
enti
cal fi
sh t
ypes
in b
oth
sys
tem
s)
Inla
nd
cap
ture
Sa
me
fish
typ
es a
s in
inla
nd
cu
ltu
re fi
sher
ies
Ch
ina
Cap
ture
Ye
llow
cro
cker
, hai
rtai
l, o
ther
fin
fish
, sh
rim
p, o
ther
no
n-fi
nfis
h
Aq
uac
ult
ure
Sh
rim
p, S
ilver
car
p, C
om
mo
n c
arp
, Gra
ss c
arp
, Cru
cian
car
p, o
ther
fin
fish
; oth
er n
on
finfis
h In
dia
Mar
ine
cap
ture
Hig
h-v
alu
e p
elag
ic (p
om
fret
s, se
erfis
h);
low
-val
ue
pel
agic
(an
chov
ies,
Bo
mb
ay d
uck
, sar
din
es, L
acta
riu
s cl
up
eid,
Ho
rse
mac
kere
l); h
igh
-val
ue
dem
ersa
l (R
ock
co
ds,
snap
per
s, th
read
fins)
; lo
w-v
alu
e d
emer
sal
(cat
fish
, go
atfis
h, s
ilver
bel
ly, n
emip
teri
ds,
lizar
d fi
sh);
shri
mp
; mo
llusk
s (m
uss
els,
oyst
ers,
oth
ers)
Inla
nd
cu
ltu
reIn
dia
n m
ajo
r car
p (r
oh
u, c
atla
, mri
gal
); o
ther
fres
hw
ater
fish
; pra
wn
(id
enti
cal fi
sh t
ypes
in b
oth
sys
tem
s)
Inla
nd
cap
ture
Sa
me
fish
typ
es a
s in
inla
nd
cu
ltu
re
Tabl
e 7.
13 F
ish
Type
s by
Prod
uctio
n Ca
tego
ry in
the
Sele
cted
Cou
ntrie
s
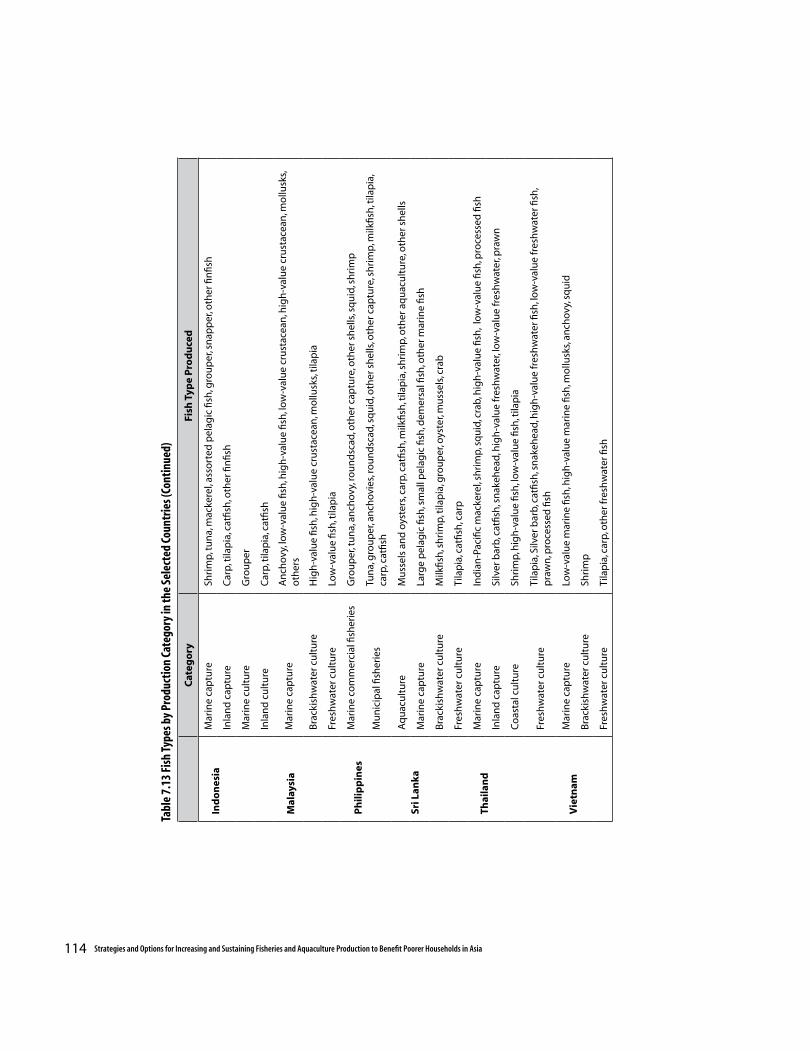
114 Strategies and Options for Increasing and Sustaining Fisheries and Aquaculture Production to Benefit Poorer Households in Asia
Cat
ego
ryFi
sh T
ype
Pro
du
ced
Ind
on
esia
Mar
ine
cap
ture
Shri
mp
, tu
na,
mac
kere
l, as
sort
ed p
elag
ic fi
sh, g
rou
per
, sn
app
er, o
ther
fin
fish
Inla
nd
cap
ture
Car
p, t
ilap
ia, c
atfis
h, o
ther
fin
fish
Mar
ine
cult
ure
Gro
up
er
Inla
nd
cu
ltu
reC
arp
, tila
pia
, cat
fish
Mal
aysi
aM
arin
e ca
ptu
reA
nch
ovy,
low
-val
ue
fish
, hig
h-v
alu
e fis
h, l
ow
-val
ue
cru
stac
ean
, hig
h-v
alu
e cr
ust
acea
n, m
ollu
sks,
oth
ers
Bra
ckis
hw
ater
cu
ltu
reH
igh
-val
ue
fish
, hig
h-v
alu
e cr
ust
acea
n, m
ollu
sks,
tila
pia
Fres
hw
ater
cu
ltu
reLo
w-v
alu
e fis
h, t
ilap
ia P
hili
pp
ines
Mar
ine
com
mer
cial
fish
erie
sG
rou
per
, tu
na,
an
chov
y, ro
un
dsc
ad, o
ther
cap
ture
, oth
er s
hel
ls, s
qu
id, s
hri
mp
Mu
nic
ipal
fish
erie
sTu
na,
gro
up
er, a
nch
ovie
s, ro
un
dsc
ad, s
qu
id, o
ther
sh
ells
, oth
er c
aptu
re, s
hri
mp
, milk
fish
, tila
pia
, ca
rp, c
atfis
h
Aq
uac
ult
ure
Mu
ssel
s an
d o
yste
rs, c
arp
, cat
fish
, milk
fish
, tila
pia
, sh
rim
p, o
ther
aq
uac
ult
ure
, oth
er s
hel
lsSr
i Lan
kaM
arin
e ca
ptu
reLa
rge
pel
agic
fish
, sm
all p
elag
ic fi
sh, d
emer
sal fi
sh, o
ther
mar
ine
fish
Bra
ckis
hw
ater
cu
ltu
reM
ilkfis
h, s
hri
mp
, tila
pia
, gro
up
er, o
yste
r, m
uss
els,
crab
Fres
hw
ater
cu
ltu
reTi
lap
ia, c
atfis
h, c
arp
Thai
lan
dM
arin
e ca
ptu
reIn
dia
n-P
acifi
c m
acke
rel,
shri
mp
, sq
uid
, cra
b, h
igh
-val
ue
fish
, lo
w-v
alu
e fis
h, p
roce
ssed
fish
Inla
nd
cap
ture
Silv
er b
arb,
cat
fish
, sn
akeh
ead,
hig
h-v
alu
e fr
esh
wat
er, l
ow
-val
ue
fres
hw
ater
, pra
wn
Co
asta
l cu
ltu
reSh
rim
p, h
igh
-val
ue
fish
, lo
w-v
alu
e fis
h, t
ilap
ia
Fres
hw
ater
cu
ltu
reTi
lap
ia, S
ilver
bar
b, c
atfis
h, s
nak
ehea
d, h
igh
-val
ue
fres
hw
ater
fish
, lo
w-v
alu
e fr
esh
wat
er fi
sh,
pra
wn
, pro
cess
ed fi
sh V
ietn
amM
arin
e ca
ptu
reLo
w-v
alu
e m
arin
e fis
h, h
igh
-val
ue
mar
ine
fish
, mo
llusk
s, an
chov
y, s
qu
id
Bra
ckis
hw
ater
cu
ltu
reSh
rim
p
Fres
hw
ater
cu
ltu
reTi
lap
ia, c
arp
, oth
er fr
esh
wat
er fi
sh
Tabl
e 7.
13 F
ish
Type
s by
Prod
uctio
n Ca
tego
ry in
the
Sele
cted
Cou
ntrie
s (Co
ntin
ued)
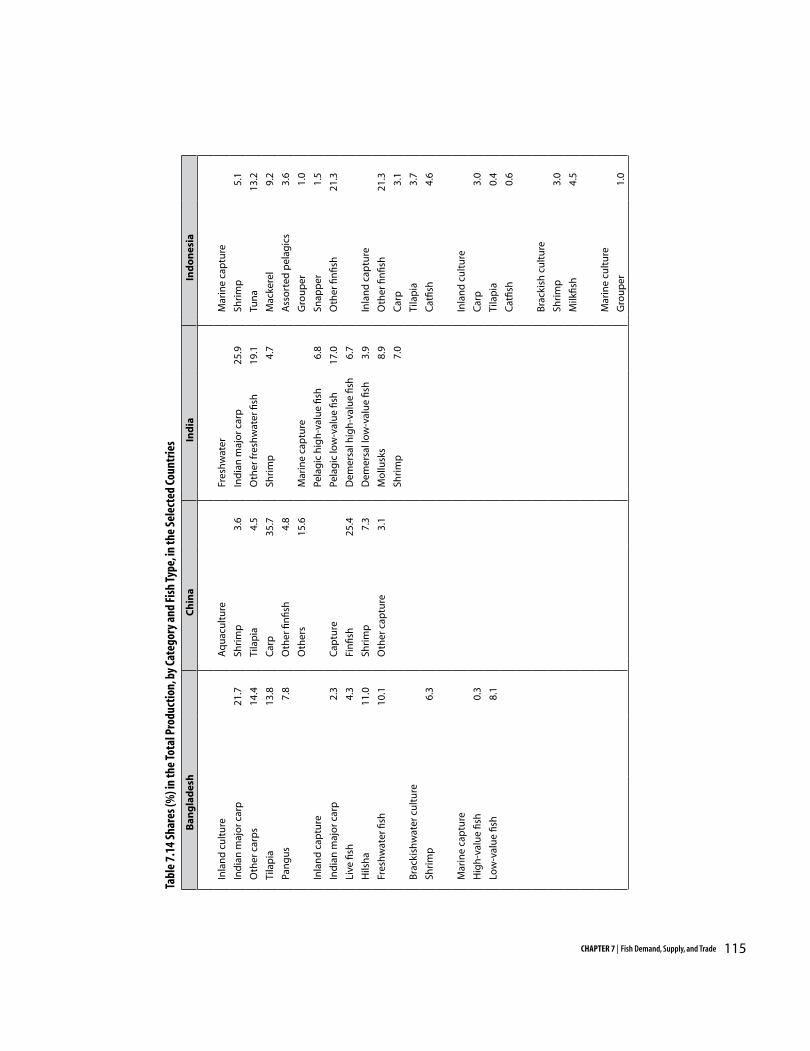
115CHAPTER 7 | Fish Demand, Supply, and Trade
Ban
gla
des
hC
hin
aIn
dia
Ind
on
esia
Inla
nd
cu
ltu
reA
qu
acu
ltu
reFr
esh
wat
erM
arin
e ca
ptu
re
Ind
ian
maj
or c
arp
21.7
Shri
mp
3.6
Ind
ian
maj
or c
arp
25.9
Shri
mp
5.1
Oth
er c
arp
s14
.4Ti
lap
ia4.
5O
ther
fres
hw
ater
fish
19.1
Tun
a13
.2
Tila
pia
13.8
Car
p35
.7Sh
rim
p4.
7M
acke
rel
9.2
Pan
gu
s7.
8O
ther
fin
fish
4.8
Ass
ort
ed p
elag
ics
3.6
Oth
ers
15.6
Mar
ine
cap
ture
Gro
up
er1.
0
Inla
nd
cap
ture
Pela
gic
hig
h-v
alu
e fis
h6.
8Sn
app
er1.
5
Ind
ian
maj
or c
arp
2.3
Cap
ture
Pela
gic
low
-val
ue
fish
17.0
Oth
er fi
nfis
h21
.3
Live
fish
4.3
Fin
fish
25.4
Dem
ersa
l hig
h-v
alu
e fis
h6.
7
Hils
ha
11.0
Shri
mp
7.3
Dem
ersa
l lo
w-v
alu
e fis
h3.
9In
lan
d c
aptu
re
Fres
hw
ater
fish
10.1
Oth
er c
aptu
re3.
1M
ollu
sks
8.9
Oth
er fi
nfis
h21
.3
Shri
mp
7.0
Car
p3.
1
Bra
ckis
hw
ater
cu
ltu
reTi
lap
ia3.
7
Shri
mp
6.3
Cat
fish
4.6
Mar
ine
cap
ture
Inla
nd
cu
ltu
re
Hig
h-v
alu
e fis
h0.
3C
arp
3.0
Low
-val
ue
fish
8.1
Tila
pia
0.4
Cat
fish
0.6
Bra
ckis
h c
ult
ure
Shri
mp
3.0
Milk
fish
4.5
Mar
ine
cult
ure
Gro
up
er1.
0
Tabl
e 7.
14 S
hare
s (%
) in
the
Tota
l Pro
duct
ion,
by
Cate
gory
and
Fis
h Ty
pe, i
n th
e Se
lect
ed C
ount
ries
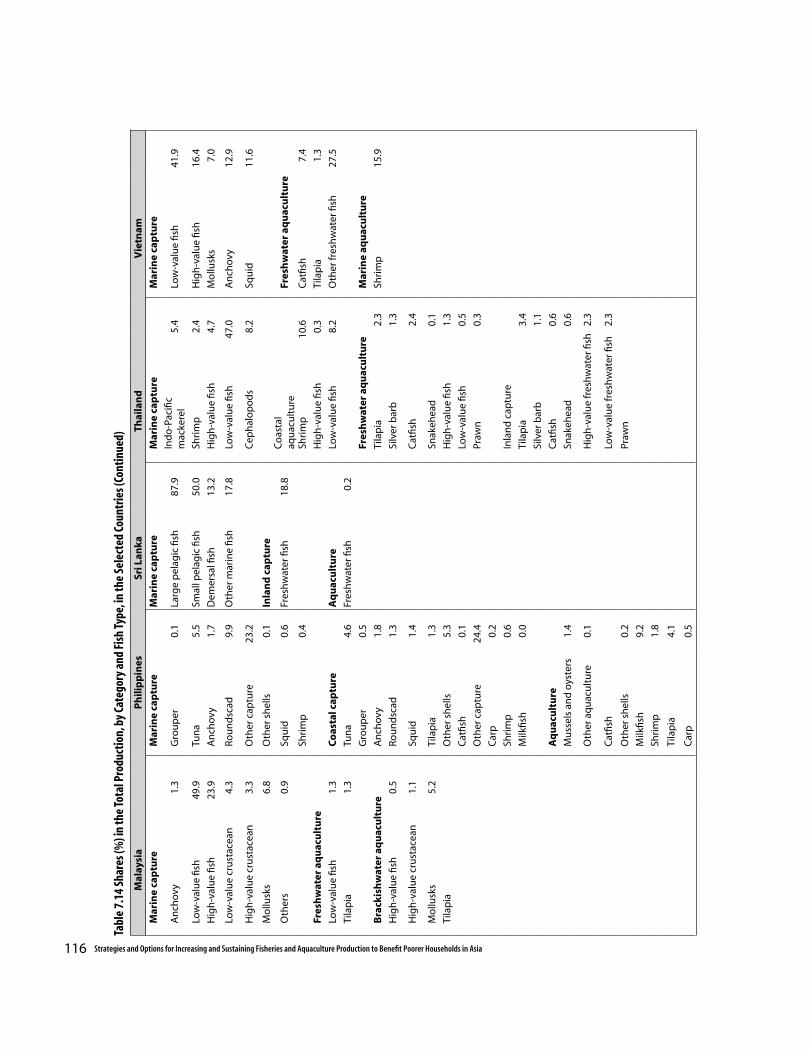
116 Strategies and Options for Increasing and Sustaining Fisheries and Aquaculture Production to Benefit Poorer Households in Asia
Mal
aysi
aP
hili
pp
ines
Sri L
anka
Thai
lan
dV
ietn
am
Mar
ine
cap
ture
Mar
ine
cap
ture
M
arin
e ca
ptu
reM
arin
e ca
ptu
reM
arin
e ca
ptu
re
An
chov
y1.
3G
rou
per
0.1
Larg
e p
elag
ic fi
sh87
.9In
do
-Pac
ific
mac
kere
l5.
4Lo
w-v
alu
e fis
h41
.9
Low
-val
ue
fish
49.9
Tun
a5.
5Sm
all p
elag
ic fi
sh50
.0Sh
rim
p2.
4H
igh
-val
ue
fish
16.4
Hig
h-v
alu
e fis
h23
.9A
nch
ovy
1.7
Dem
ersa
l fish
13.2
Hig
h-v
alu
e fis
h4.
7M
ollu
sks
7.0
Low
-val
ue
cru
stac
ean
4.3
Ro
un
dsc
ad9.
9O
ther
mar
ine
fish
17.8
Low
-val
ue
fish
47.0
An
chov
y12
.9
Hig
h-v
alu
e cr
ust
acea
n3.
3O
ther
cap
ture
23.2
Cep
hal
op
od
s8.
2Sq
uid
11.6
Mo
llusk
s6.
8O
ther
sh
ells
0.1
Inla
nd
cap
ture
Oth
ers
0.9
Squ
id0.
6Fr
esh
wat
er fi
sh18
.8C
oas
tal
aqu
acu
ltu
reFr
esh
wat
er a
qu
acu
ltu
re
Shri
mp
0.4
Shri
mp
10.6
Cat
fish
7.4
Fres
hw
ater
aq
uac
ult
ure
Hig
h-v
alu
e fis
h0.
3Ti
lap
ia1.
3
Low
-val
ue
fish
1.3
Co
asta
l cap
ture
Aq
uac
ult
ure
Low
-val
ue
fish
8.2
Oth
er fr
esh
wat
er fi
sh27
.5
Tila
pia
1.3
Tun
a4.
6Fr
esh
wat
er fi
sh0.
2
Gro
up
er0.
5Fr
esh
wat
er a
qu
acu
ltu
reM
arin
e aq
uac
ult
ure
Bra
ckis
hw
ater
aq
uac
ult
ure
An
chov
y1.
8Ti
lap
ia2.
3Sh
rim
p15
.9
Hig
h-v
alu
e fis
h0.
5R
ou
nd
scad
1.3
Silv
er b
arb
1.3
Hig
h-v
alu
e cr
ust
acea
n1.
1Sq
uid
1.4
Cat
fish
2.4
Mo
llusk
s5.
2Ti
lap
ia1.
3Sn
akeh
ead
0.1
Tila
pia
Oth
er s
hel
ls5.
3H
igh
-val
ue
fish
1.3
Cat
fish
0.1
Low
-val
ue
fish
0.5
Oth
er c
aptu
re24
.4Pr
awn
0.3
Car
p0.
2
Shri
mp
0.6
Inla
nd
cap
ture
Milk
fish
0.0
Tila
pia
3.4
Silv
er b
arb
1.1
Aq
uac
ult
ure
Cat
fish
0.6
Mu
ssel
s an
d o
yste
rs1.
4Sn
akeh
ead
0.6
Oth
er a
qu
acu
ltu
re0.
1H
igh
-val
ue
fres
hw
ater
fish
2.3
Cat
fish
Low
-val
ue
fres
hw
ater
fish
2.3
Oth
er s
hel
ls0.
2Pr
awn
Milk
fish
9.2
Shri
mp
1.8
Tila
pia
4.1
Car
p0.
5
Tabl
e 7.
14 S
hare
s (%
) in
the
Tota
l Pro
duct
ion,
by
Cate
gory
and
Fis
h Ty
pe, i
n th
e Se
lect
ed C
ount
ries (
Cont
inue
d)
117CHAPTER 7 | Fish Demand, Supply, and Trade
A priori expectation on the magnitudes and signs of the estimated parameters is important in assessing the quality of the fitted econometric model. Economic theory suggests that the relationship between the quantity supplied and its price should be positive. Cross-price relationships with other fish species can be either positive or negative, depending on whether they are rivals or jointly produced. The relationships between the quantity supplied and other exogenous variables can similarly be positive or negative, depending on whether they enhance or restrain the fish production process.
From the estimated coefficients, own and cross-price elasticities were computed using the arithmetic mean values of the model variables in the sampled data for each country. A summary of own-price fish supply elasticities by country is presented in Table 7.15 while the computed cross-price elasticities are shown in Appendix 3, Tables 4.A.1 to 4.I.4.
Parameter estimates of the supply response functions for various marine and inland capture species were found to be mostly insignificant. Nevertheless, the computed supply elasticities are indicative of the behavior of fish supply coming from these sources. In the capture categories, fish types were generally inelastic to changes in own price, except for shrimp, snakehead, and other high-value finfish. Supply elasticity for own-price of marine capture species averaged 0.40, while those from inland capture averaged slightly higher at 0.62. Fish supply from capture fisheries in the selected countries is generally non-responsive to price changes.
Because fish catch from marine and inland waters are often uncertain and highly dependent on
available fish stock in the wild, price incentives may induce more fishing effort but not necessarily fish catch. This further suggests that non-price factors (such as weather, scale of operation, type of gear, etc.) may be more important in explaining variations in fish supply.
Own-price supply elasticities of some marine capture fish species in Malaysia and Thailand were found to be negative (e.g., shrimp and other finfish). This apparent contradiction to usual theory of supply response can be explained by the possible existence of the backward bending supply curve due to the overexploitation of the fish stocks. As fishing effort increases in response to rising prices, the declining catch could be attributed to the dwindling fish stock in the wild2. On the other hand, the elasticities for low-value fish (either for direct consumption or processing) tend to have the appropriate signs, that is, price response is measurable, perhaps because these species are relatively less overexploited.
For simplicity of presentation, Table 7.15 does not include the cross-price elasticities of fish species included in the study. Positive cross-price elasticities indicate that the paired fish species are substitutes while negative values show complementary relationships in supply. Based on Appendix 3, Table 3, positive cross-price elasticities derived from significant parameters were observed between marine high-value and low-value fish. This suggests that some fishing gears are designed to catch specific fish species; when the gear is being used to catch one fish type, it may not be used for other fish types, thus making them substitutes. On the other hand, negative cross-price elasticities exist for the supply of crab, shrimp, and mackerel, especially for Thailand and Malaysia. This highlights the multi-species feature
2 This of course needs to be qualified by the time dimension, i.e., the rate at which higher fishing effort is able to impact upon fish stocks and steady yields. This hypothetical explanation warrants closer study.

118 Strategies and Options for Increasing and Sustaining Fisheries and Aquaculture Production to Benefit Poorer Households in Asia
Fish
Typ
esB
ang
lad
esh
Ch
ina
Ind
iaIn
do
nes
iaM
alay
sia
Ph
ilip
pin
esSr
i Lan
kaTh
aila
nd
Ave
rag
e
Mar
ine
cap
ture
Hig
h-v
alu
e p
elag
ic fi
sh0.
28*
0.10
0.62
0.80
0.28
0.42
Low
-val
ue
pel
agic
fish
0.33
*0.
100.
100.
100.
16
Hig
h-v
alu
e d
emer
sal fi
sh0.
45*
0.23
1.18
0.08
0.49
Low
-val
ue
dem
ersa
l fish
0.20
*0.
230.
720.
38
Yello
w c
rock
er0.
560.
56
Hai
rtai
l0.
520.
52
Mo
llusk
s0.
28*
0.08
0.18
Cru
stac
ean
s0.
230.
090.
16
Mac
kere
l0.
030.
030.
03
Squ
id0.
020.
02
Shri
mp
4.1
4*0.
49*
0.23
-0.1
81.
17
Oth
er fi
nfis
h 1
.46
0.01
30.
74
Oth
ers
5.2
7*-3
.23*
-0.9
9*0.
35
Ave
rag
e0
.40
Inla
nd
cap
ture
Car
p0.
070.
100.
08
Tila
pia
0.10
0.26
0.18
Bar
b0.
840.
84
Cat
fish
0.10
0.47
0.28
Snak
ehea
d2.
21*
2.21
Hig
h-v
alu
e fis
h1.
011.
01
Low
-val
ue
fish
0.04
0.04
Praw
n0.
280.
28
Oth
er fi
sh1.
12*
0.10
0.61
Ave
rag
e0
.62
Tabl
e 7.
15 O
wn
Pric
e Su
pply
Ela
stic
ities
by
Fish
Type
in th
e Se
lect
ed C
ount
ries
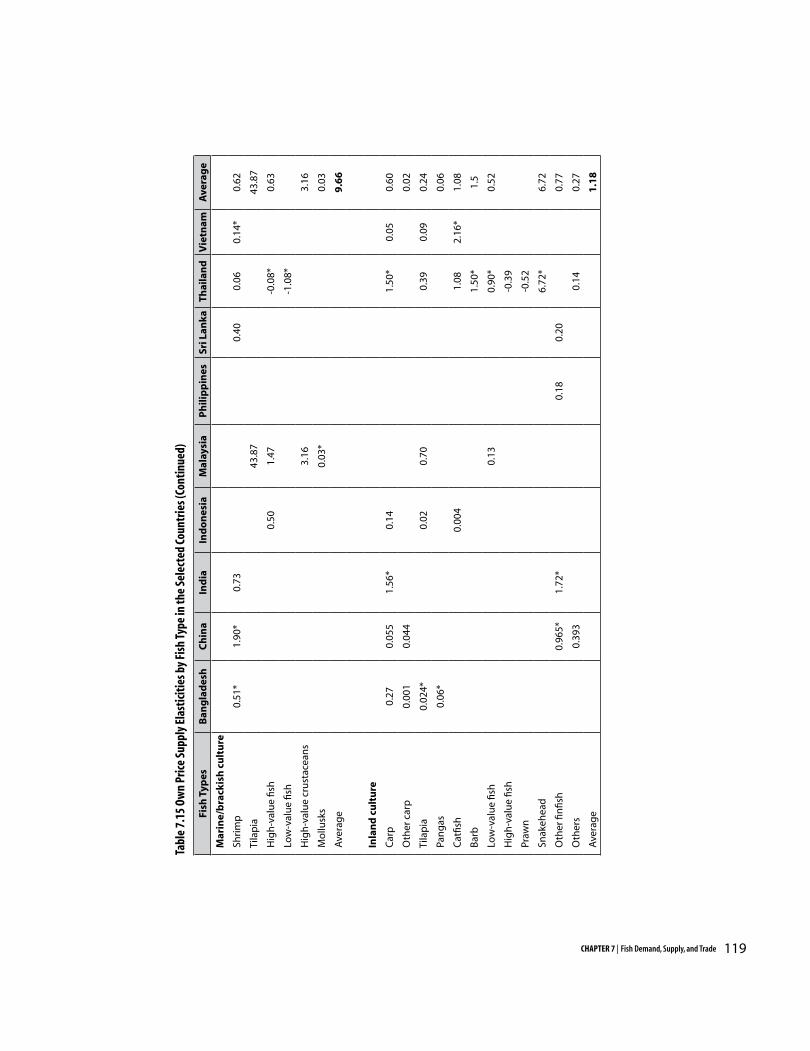
119CHAPTER 7 | Fish Demand, Supply, and Trade
Fish
Typ
esB
ang
lad
esh
Ch
ina
Ind
iaIn
do
nes
iaM
alay
sia
Ph
ilip
pin
esSr
i Lan
kaTh
aila
nd
Vie
tnam
Ave
rag
e
M
arin
e/b
rack
ish
cu
ltu
re
Sh
rim
p0.
51*
1.90
*0.
730.
400.
060.
14*
0.62
Ti
lap
ia43
.87
43.8
7
H
igh
-val
ue
fish
0.50
1.47
-0.0
8*0.
63
Lo
w-v
alu
e fis
h-1
.08*
H
igh
-val
ue
cru
stac
ean
s3.
163.
16
M
ollu
sks
0.03
*0.
03
A
vera
ge
9.6
6
In
lan
d c
ult
ure
C
arp
0.27
0.05
51.
56*
0.14
1.50
*0.
050.
60
O
ther
car
p0.
001
0.04
40.
02
Ti
lap
ia0.
024*
0.02
0.70
0.39
0.09
0.24
Pa
ng
as0.
06*
0.06
C
atfis
h0.
004
1.08
2.16
*1.
08
B
arb
1.50
*1.
5
Lo
w-v
alu
e fis
h0.
130.
90*
0.52
H
igh
-val
ue
fish
-0.3
9
Pr
awn
-0.5
2
Sn
akeh
ead
6.72
*6.
72
O
ther
fin
fish
0.96
5*1.
72*
0.18
0.20
0.77
O
ther
s0.
393
0.14
0.27
A
vera
ge
1.1
8
Tabl
e 7.
15 O
wn
Pric
e Su
pply
Ela
stic
ities
by
Fish
Type
in th
e Se
lect
ed C
ount
ries (
Cont
inue
d)
120 Strategies and Options for Increasing and Sustaining Fisheries and Aquaculture Production to Benefit Poorer Households in Asia
of some fishing gears that can capture different fish species concurrently.
Supply elasticities for aquaculture
Most of the parameters of the estimated supply response functions for marine/brackishwater and inland aquaculture species were found to be statistically significant and indicate the expected sign (Appendix 3 Tables 3.A.1 to 3.E.4). On the average, the own-price elasticities of cultured species (both marine/brackishwater and freshwater) were found to be positive (greater than one), that is, supply elasticity of marine/brackishwater culture species averaged highly at 9.66 while those of inland culture species averaged much lower at 1.18. These results suggest that price plays an important role in determining aquaculture supplies, which is quite different from capture supplies. Since production of cultured species can be controlled and managed, fish supply, therefore, become more adjustable to price changes.
Supply of tilapia, snakehead, and high-value crustaceans was found to be highly responsive to price changes with elasticities ranging from 3.16 to 43.9, while those of barb and catfish ranged from 1.08 to 1.5. Fish farmers, especially those engaged in tilapia culture (a popular species that is often grown at a commercial scale), were more flexible in adjusting production given higher prices. However, supply of shrimp was observed to be relatively inelastic (0.62). Perhaps, this could be explained by adverse culture environments, such as deteriorating water quality, disease outbreak, and salinity problems, partly brought about by the excessive expansion of shrimp ponds in marginal environments and fragile habitats.
Supply shifters
Shifter variables were also included in the models of some countries to determine the effect of non-price and non-input variables in the supply of capture and aquaculture species. Specifically, the effect of pond/cage area, household size and educational level of the fish operator, geographical location, and investment in research and development (R & D) were investigated under the aquaculture system while fishing effort and length of coastline were incorporated in the supply equation of capture species.
For Malaysian brackishwater aquaculture species, most of the parameter estimates for pond/cage area were found to be positive and statistically significant at the 5 percent level or lower. This implies that increasing the area of culture operation can significantly increase production. However, whereas the size parameter of the fish farmer’s household was found to be non-significant in all the supply equations for Vietnam and the Philippines, the education parameter was found to be highly significant. This underscores the importance of farmer’s knowledge and skill in aquaculture operations. Likewise, the parameter of investment on R & D was significant in all the supply equations of the Thai model while the regional dummy showed a significant coefficient only in some species. Aquaculture supplies can be increased by altering the shifter variables, for example, increasing pond and cage area, investing in R & D, and building up human capital.
On the other hand, shifter variables in the supply equations for capture species, such as fishing area as represented by length of coastline and fishing effort (specifically in the Thai and Malaysian models), showed positive and statistically
121CHAPTER 7 | Fish Demand, Supply, and Trade
significant parameters. The educational level of the fish operator was likewise found to be highly significant in the Philippine model. However, in contrast to the case of aquaculture supply, investment on R & D failed to generate significant parameters.
Implications
An important conclusion apparent from the results of this study is that supply elasticity of cultured species is relatively higher than that of captured species. This suggests that price plays different roles in providing incentives to fishers and fish farmers. Where production of fish can be controlled through breeding and aquaculture, price increases can trigger expansion in production. However, for capture fisheries where fish catch is uncertain, price is not the key determinant of supply; instead, non-price factors proved to be more important in increasing fish output.
Fish supply from aquaculture (both marine/brackishwater and freshwater) could be further enhanced either through price incentives or by increasing the area and intensity of the culture systems, as well as the know-how of the fish farmer. Thus, altering the shifter variables of the supply equation can be viewed as potential policy interventions that could boost fish supplies from both aquaculture and capture sectors in the nine developing member countries. The finding of growth potential and price response for aquaculture, rather than of capture fisheries, mirrors the global trend, in which supply growth is mainly originating from non-traditional fisheries sectors.
Exports and Imports
Shown in Table 7.16 are fish export values and average growth rates of the selected countries, in descending order of exports until 2001. China and Thailand were the top exporters with high rates of growth, but it is actually Vietnam that had the highest rate of growth during the period. The average growth rate of the selected countries was 14.5 percent while the rest of the world experienced export growth averaged 7.7 percent over the same period.
Net exports (exports less imports), however, provide a more complete picture of trade performance. Net exports of the top five selected countries from 1976 to 2001 are shown in Figure 7.1, with Thailand, China, and Vietnam at the top of the table as their exports outpaced their imports. However, the net exports of these countries were more erratic than their exports, especially in the case of Thailand, where the instability was compounded by the need to import raw materials for its fish processing industries. Among the bottom four exporters (Figure 7.2), Malaysia was a net importer, and Sri Lanka exports were minimal, due to the high import volume of their trade. Bangladesh net exports were quite impressive owing to a very minimal import volume.
Net exports by commodity types of the selected countries are shown in Figure 7.3. Highlighted here is the importance of crustaceans among the export commodities. The only commodities net imported are demersals (for food) and pelagic meals extensively used in the fish culture industry. A breakdown of export and import shares by fish type for each country is presented in Table 7.17.

122 Strategies and Options for Increasing and Sustaining Fisheries and Aquaculture Production to Benefit Poorer Households in Asia
1976 1981 1986 1991 1996 2001 Growth
Thailand 126,500 288,500 494,794 1,184,881 2,955,499 4,106,214 17.0
China 150,378 412,451 1,011,896 2,904,036 4,120,443 4,054,130 13.7
Vietnam 19,770 90,493 278,888 503,552 1,783,513 28.8
Indonesia 124,224 203,590 340,619 1,197,725 1,705,767 1,561,604 11.6
India 192,600 317,668 362,266 653,166 1,121,962 1,249,552 8.8
Philippines 27,869 146,163 200,099 492,725 482,309 414,976 13.8
Bangladesh 11,922 39,724 118,154 160,817 317,229 277,416 16.8
Sri Lanka 106,819 129,754 132,547 265,954 328,695 220,126 5.0
Malaysia 8,857 18,098 22,690 21,786 67,039 101,535 15.0
Table 7.16 Export Values and Average Annual Export Growth of the Selected Countries, in US $‘000 and %, 1976-2001, Selected Years
With the exception of China, the top export of all these countries is shrimp. China turns out to be more diversified regarding its export basket. However, its main export is fish from marine capture fisheries, which has limited opportunity for further expansion. Lack of diversification in the other countries is a major concern in light of the frequent fluctuations in the export market, as seen in the preceding figures.
The next major export item is marine finfish (except mollusks for India and cephalopods for
Thailand). Imports are dominated by low-value fish categories, or otherwise “other fish”, which covers a large portion of the low-value fish. They are usually marine fresh fish, either fresh or in processed form; at the extreme is Sri Lanka, where imports are almost entirely in the form of processed fish. This pattern indicates that the lower income groups within each country are demanding cheap foreign fish. There are some exceptions, however. For Thailand, imports are mostly feeds for cultured shrimp; similarly import for India importation is mostly in the form of
Figure 7.1 Value of Net Exports of the Top Five Exporters among the Selected Countries, 1976-2001
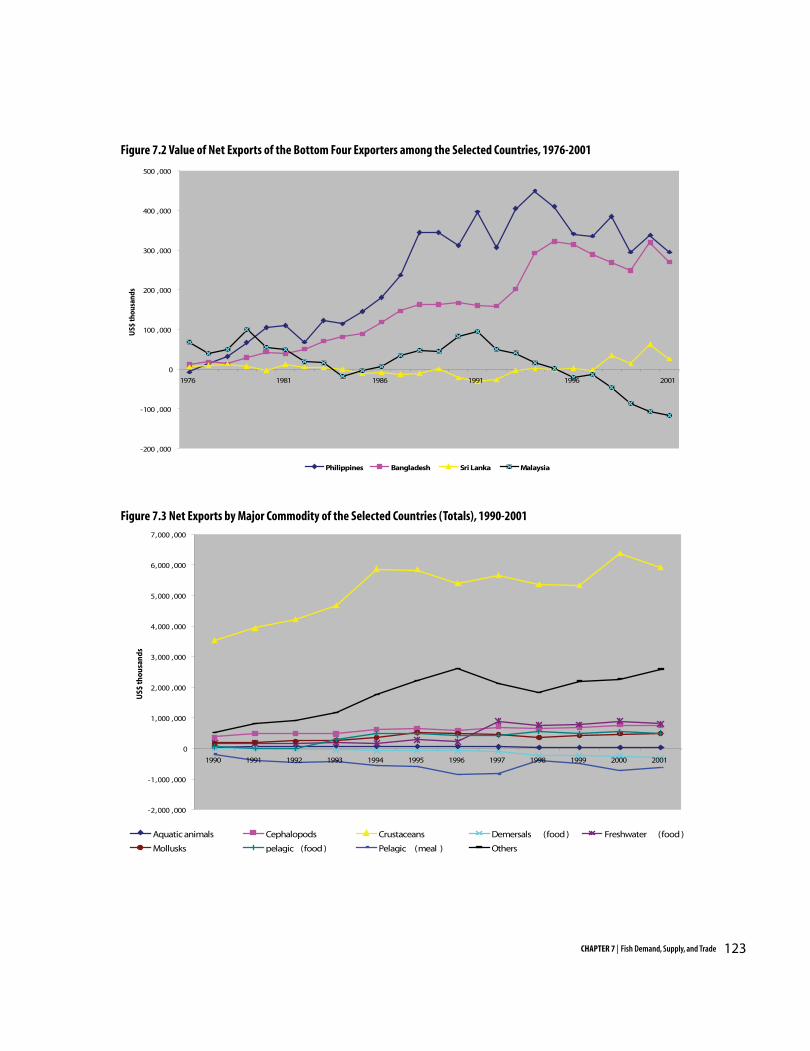
123CHAPTER 7 | Fish Demand, Supply, and Trade
Figure 7.2 Value of Net Exports of the Bottom Four Exporters among the Selected Countries, 1976-2001
Figure 7.3 Net Exports by Major Commodity of the Selected Countries (Totals), 1990-2001
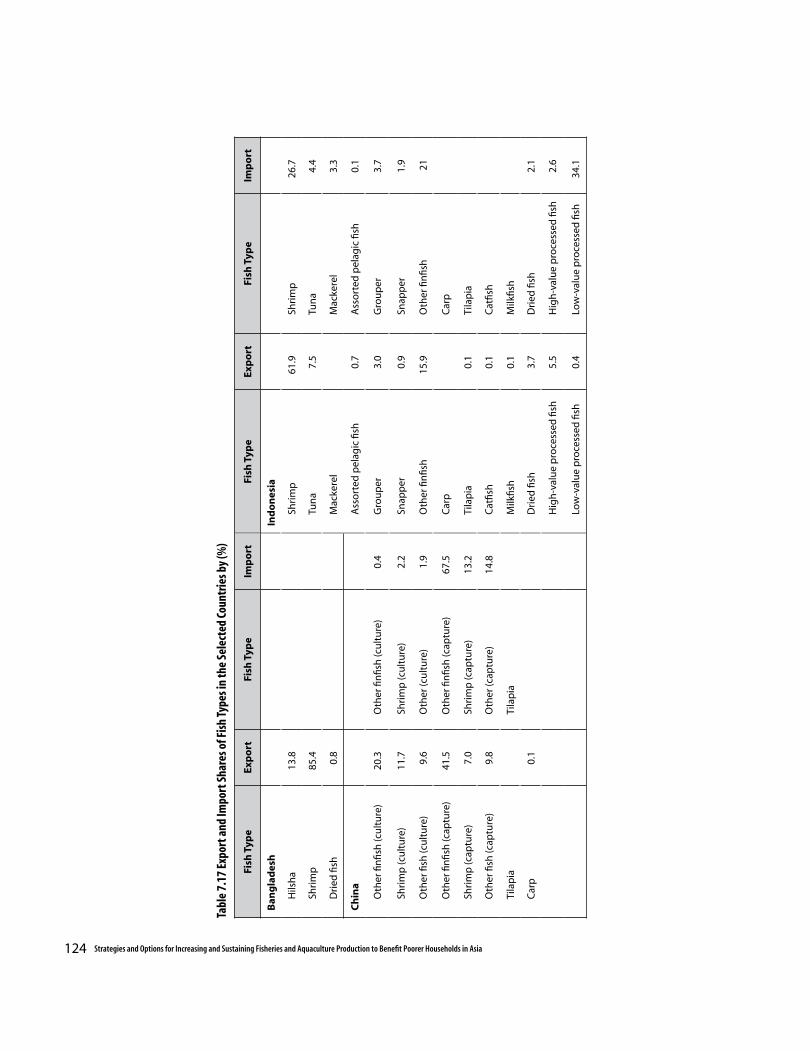
124 Strategies and Options for Increasing and Sustaining Fisheries and Aquaculture Production to Benefit Poorer Households in Asia
Tabl
e 7.
17 E
xpor
t and
Impo
rt S
hare
s of F
ish
Type
s in
the
Sele
cted
Cou
ntrie
s by
(%)
Fish
Typ
eEx
po
rtFi
sh T
ype
Imp
ort
Fish
Typ
eEx
po
rt
Fish
Typ
eIm
po
rt
Ban
gla
des
h
In
do
nes
ia
Hils
ha
13.8
Sh
rim
p61
.9Sh
rim
p26
.7
Shri
mp
85.4
Tu
na
7.5
Tun
a4.
4
Dri
ed fi
sh0.
8
M
acke
rel
M
acke
rel
3.3
Ch
ina
A
sso
rted
pel
agic
fish
0.7
Ass
ort
ed p
elag
ic fi
sh0.
1
Oth
er fi
nfis
h (c
ult
ure
)20
.3O
ther
fin
fish
(cu
ltu
re)
0.4
Gro
up
er3.
0G
rou
per
3.7
Shri
mp
(cu
ltu
re)
11.7
Shri
mp
(cu
ltu
re)
2.2
Snap
per
0.9
Snap
per
1.9
Oth
er fi
sh (c
ult
ure
)9.
6O
ther
(cu
ltu
re)
1.9
Oth
er fi
nfis
h15
.9O
ther
fin
fish
21
Oth
er fi
nfis
h (c
aptu
re)
41.5
Oth
er fi
nfis
h (c
aptu
re)
67.5
Car
p
Car
p
Shri
mp
(cap
ture
)7.
0Sh
rim
p (c
aptu
re)
13.2
Tila
pia
0.1
Tila
pia
Oth
er fi
sh (c
aptu
re)
9.8
Oth
er (c
aptu
re)
14.8
Cat
fish
0.1
Cat
fish
Tila
pia
Ti
lap
ia
Milk
fish
0.1
Milk
fish
Car
p0.
1
Dri
ed fi
sh3.
7D
ried
fish
2.1
H
igh
-val
ue
pro
cess
ed fi
sh5.
5H
igh
-val
ue
pro
cess
ed fi
sh2.
6
Low
-val
ue
pro
cess
ed fi
sh0.
4Lo
w-v
alu
e p
roce
ssed
fish
34.1
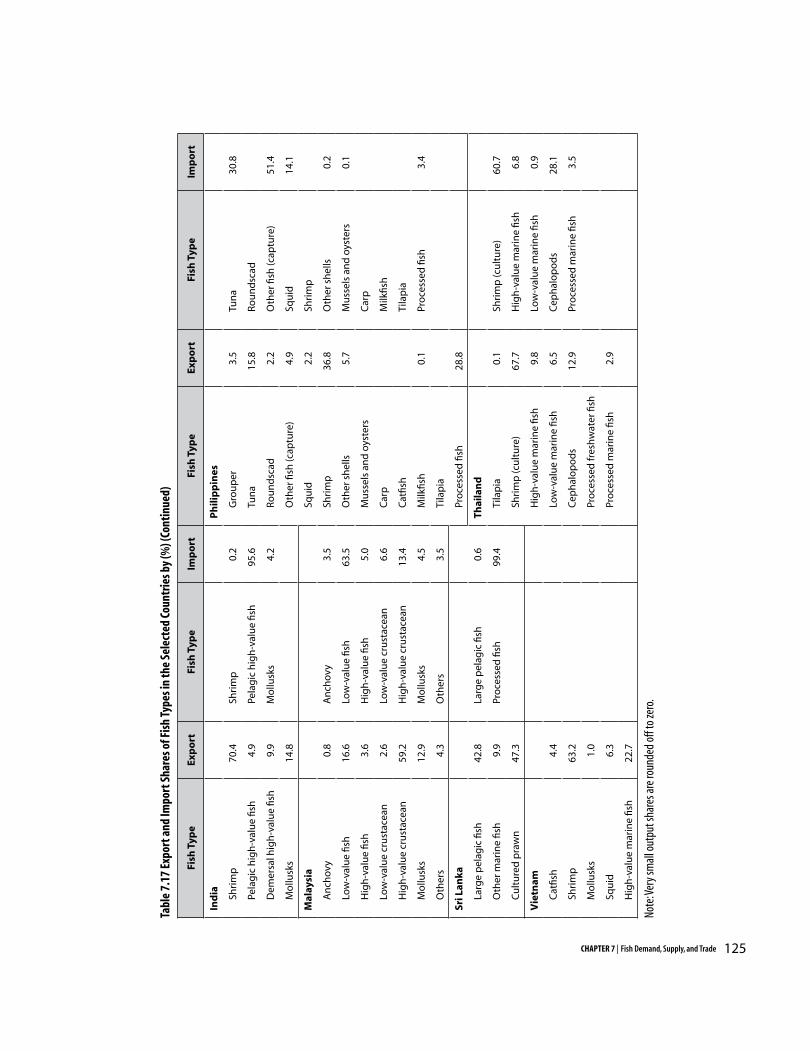
125CHAPTER 7 | Fish Demand, Supply, and Trade
Tabl
e 7.
17 E
xpor
t and
Impo
rt S
hare
s of F
ish
Type
s in
the
Sele
cted
Cou
ntrie
s by
(%) (
Cont
inue
d)
Note
: Ver
y sm
all o
utpu
t sha
res a
re ro
unde
d of
f to
zero
.
Fish
Typ
eEx
po
rtFi
sh T
ype
Imp
ort
Fish
Typ
eEx
po
rt
Fish
Typ
eIm
po
rt
Ind
ia
Ph
ilip
pin
es
Shri
mp
70.4
Shri
mp
0.2
Gro
up
er3.
5Tu
na
30.8
Pela
gic
hig
h-v
alu
e fis
h4.
9Pe
lag
ic h
igh
-val
ue
fish
95.6
Tun
a15
.8R
ou
nd
scad
Dem
ersa
l hig
h-v
alu
e fis
h9.
9M
ollu
sks
4.2
Ro
un
dsc
ad2.
2O
ther
fish
(cap
ture
)51
.4
Mo
llusk
s14
.8
O
ther
fish
(cap
ture
)4.
9Sq
uid
14.1
Mal
aysi
a
Sq
uid
2.2
Shri
mp
An
chov
y0.
8A
nch
ovy
3.5
Shri
mp
36.8
Oth
er s
hel
ls0.
2
Low
-val
ue
fish
16.6
Low
-val
ue
fish
63.5
Oth
er s
hel
ls5.
7M
uss
els
and
oys
ters
0.1
Hig
h-v
alu
e fis
h3.
6H
igh
-val
ue
fish
5.0
Mu
ssel
s an
d o
yste
rs
Car
p
Low
-val
ue
cru
stac
ean
2.6
Low
-val
ue
cru
stac
ean
6.6
Car
p
Milk
fish
Hig
h-v
alu
e cr
ust
acea
n59
.2H
igh
-val
ue
cru
stac
ean
13.4
Cat
fish
Ti
lap
ia
Mo
llusk
s12
.9M
ollu
sks
4.5
Milk
fish
0.1
Pro
cess
ed fi
sh3.
4
Oth
ers
4.3
Oth
ers
3.5
Tila
pia
Sri L
anka
Pr
oce
ssed
fish
28.8
Larg
e p
elag
ic fi
sh42
.8La
rge
pel
agic
fish
0.6
Thai
lan
d
Oth
er m
arin
e fis
h9.
9Pr
oce
ssed
fish
99.4
Tila
pia
0.1
Shri
mp
(cu
ltu
re)
60.7
Cu
ltu
red
pra
wn
47.3
Shri
mp
(cu
ltu
re)
67.7
Hig
h-v
alu
e m
arin
e fis
h6.
8
Vie
tnam
H
igh
-val
ue
mar
ine
fish
9.8
Low
-val
ue
mar
ine
fish
0.9
Cat
fish
4.4
Lo
w-v
alu
e m
arin
e fis
h6.
5C
eph
alo
po
ds
28.1
Shri
mp
63.2
C
eph
alo
po
ds
12.9
Pro
cess
ed m
arin
e fis
h3.
5
Mo
llusk
s1.
0
Pro
cess
ed fr
esh
wat
er fi
sh
Squ
id6.
3
Pro
cess
ed m
arin
e fis
h2.
9
Hig
h-v
alu
e m
arin
e fis
h22
.7
126 Strategies and Options for Increasing and Sustaining Fisheries and Aquaculture Production to Benefit Poorer Households in Asia
high-value pelagic fish, suggesting that domestic demand for foreign fish originates mostly from the middle and upper classes. The reliance on foreign markets for low-value fish, while salutary from the consumer’s viewpoint, is of concern to producers and processors of low-value fish in all developing countries of Asia.
Conclusion
In this chapter, the author evaluates supply and demand patterns and responses in the selected countries, which account for the bulk of production and consumption in developing Asian countries. A major part of the study is devoted to the disaggregation of fish into individual species groups for a more meaningful analysis and assessment of trends. Rising fish consumption
in Asia is partly explained by rising per capita incomes, as fish demand is reflective of positive income elasticities. That is, the more expensive the fish, the higher the income elasticity. Fish demand elasticity is also related to changes in own-price, particularly for the low-income groups and the fish consumed mostly by these groups. Supply has also risen sharply, with the bulk obtained in recent decades from aquaculture. Consistent with this, supply response to price is higher for aquaculture. Finally, foreign markets have driven much of the production of high-value species, with most of the selected countries becoming heavily specialized in the production of shrimp. Rising demand meanwhile has been met partly by imports of fish, with most of the selected countries apparently obtaining low-value species from abroad.

127CHAPTER 8 | Projections
Introduction
A disaggregated model of fish supply, demand, and trade is useful for making detailed projections on the potential of fish production and consumption. As such, it can answer the following important questions: Will past trends in supply, demand, and exports be sustained into the future? Can additional demand from rising populations and per capita incomes be met by fish supplies? Which types of fish offer the most promising opportunities for growth in terms of production, consumption, and trade? The last question is particularly interesting from the viewpoint of policy and investment allocation. In this vein, a quantitative model is also useful for analyzing alternative scenarios of relevance to policy, such as: What is the impact of increased investments in R & D and accelerated technological change? How great are the impacts of declines in capture supplies? What effect can increased marketing efficiency in fish trade have on production and consumption? Which fish types are most likely to be affected by these alternative scenarios?
To answer these related questions, the information collected in the previous chapters is applied in the construction of the AsiaFish model. The AsiaFish model denotes a set of multi-market, country-specific models of fisheries. It can be used to evaluate the effects of technology and policy changes on price, demand, supply and trade. Unlike in previous fish modeling exercises, the AsiaFish model takes a highly disaggregated approach; hence, it is in a better position to
highlight changes that are of direct relevance to the poor (i.e., changes in consumption and production of low-value species). Furthermore, it is to a large extent based on empirically estimated parameters. In this chapter, the author discusses the model, the parameters used, the underlying assumptions for the most likely and alternative scenarios relevant to policy and investment, and the resulting projections by fish type and category. The Asia Fish Model
Overview
The AsiaFish model consists of a set of equations, specific for a country, which can be divided into three parts or cores: producer core, consumer core, and trade core. The structure of each core reflects the descriptions made in the previous chapters (especially Chapter 7) on production systems, consumption patterns, and trade relationships. The technical reader is referred to the detailed model discussion in Dey et al. (2004b). The following is a general overview of the model structure.
The consumer core contains the demand equations, separately specified for urban and rural regions. The structure reflects the three-stage budgeting framework and the Quadratic Almost Ideal Demand System (QUAIDS). The producer core contains the supply equations, separately specified for the various capture and culture categories. For fresh fish, the functional form is
Chapter 8
PROJECTIONS FOR FISH SUPPLY AND DEMAND
128 Strategies and Options for Increasing and Sustaining Fisheries and Aquaculture Production to Benefit Poorer Households in Asia
derived from the normalized quadratic profit function. For processed fish, the supply functions contain a technology index that can be used to introduce changes in technology or productivity. A novel feature of the AsiaFish model is the trade core, which follows the tradition of Applied General Equilibrium (AGE) models that require the Armington assumption, that is, domestic and foreign goods (fish types) are treated as differentiated products. The equations suggest that the export supply of a particular fish type is a function of its (a) price in foreign markets relative to domestic markets and (b) domestic output. The import demand for a particular fish type depends on: (a) the price of imports relative to domestic goods and (b) the domestic demand. Prices in foreign markets are considered constant under the small open economy assumption.
Domestic prices in the model are determined by the aid of equilibrium conditions. These conditions require that the domestic demand for each fish type is equal to the domestic supply. In the context of the model, this is equivalent to equating the sum of domestic production and imports to the sum of household consumption, intermediate demand, and exports.
Aside from disaggregating the level of analysis, the multi-market feature of the model allows the incorporation of cross-price and feedback effects. A simple hypothetical case illustrates the need to incorporate these effects. Suppose there are only two fish types, catla and mrigal. A productivity improvement causes a rightward shift in the supply curve of mrigal. With the other factors remaining constant, mrigal output would rise and its price would fall. Consumption would also rise. Integrating the cross-price and feedback effects into
the analysis makes it more difficult to determine the responses of the fish types that were subjected to the productivity shock. If catla and mrigal were complements in supply (owing to the prevalence of polyculture systems), then the reduction in the price of mrigal might decrease the output of catla. This would be equivalent to a leftward shift in the supply curve of catla, a change that would exert upward pressure on the equilibrium price of catla. If mrigal and catla are substitutes in demand, then the consumption of catla is expected to fall. This is tantamount to a leftward shift in the demand curve for catla, which in turn would exert downward pressure on its price. Combining the effects on the demand and supply curves would suggest a decline in the equilibrium quantity of catla. However, the effect on the equilibrium price of catla would be ambiguous. Moreover, price adjustments in catla would feed back into the mrigal market. If say, catla price fell, then this might shift mrigal supply to the left, and so on.
The introduction of foreign trade multiplies the cross-price and feedback effects. This is only a simple hypothetical case – in a typical country model, there could be a dozen or so fish types, from three or four production categories, with consumers differentiated into regions. Numerical analysis through a well-specified model is, therefore, essential.
Matching fish types in the producer and consumer cores
A complication in the implementation of the equilibrium conditions arises from the inconsistency of available data in the producer and consumer cores. In many of the countries adopting the model, demand side data are often more aggregated than supply side data. Hence, there are
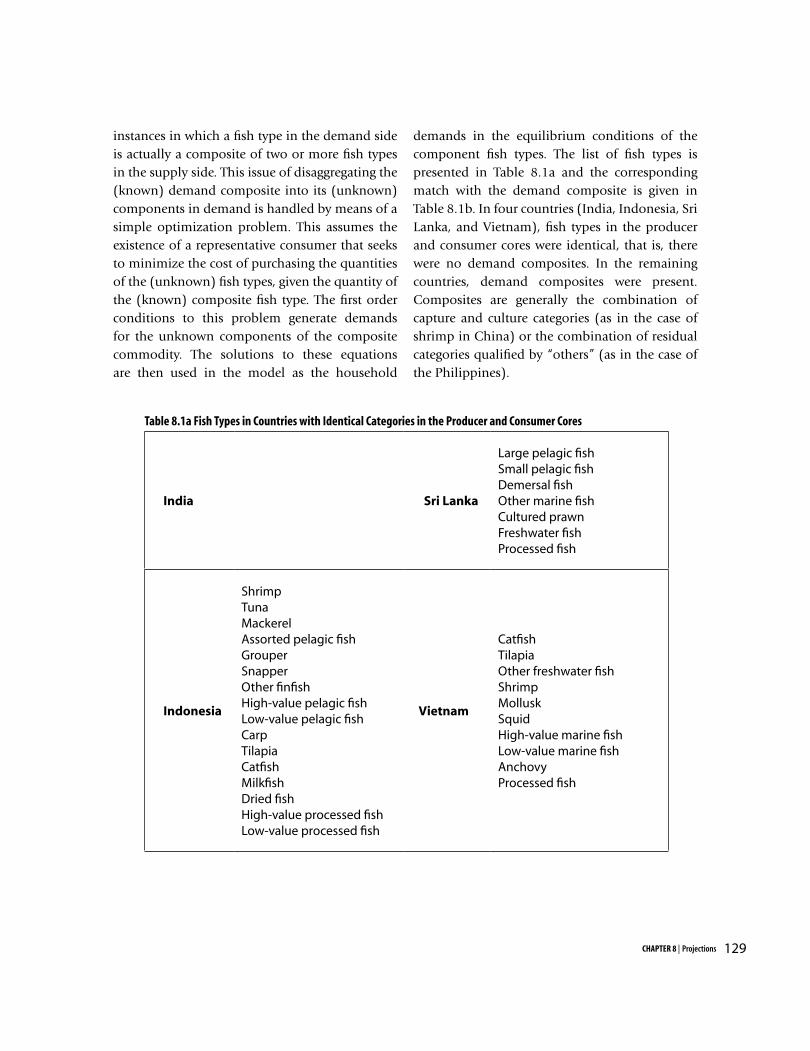
129CHAPTER 8 | Projections
instances in which a fish type in the demand side is actually a composite of two or more fish types in the supply side. This issue of disaggregating the (known) demand composite into its (unknown) components in demand is handled by means of a simple optimization problem. This assumes the existence of a representative consumer that seeks to minimize the cost of purchasing the quantities of the (unknown) fish types, given the quantity of the (known) composite fish type. The first order conditions to this problem generate demands for the unknown components of the composite commodity. The solutions to these equations are then used in the model as the household
demands in the equilibrium conditions of the component fish types. The list of fish types is presented in Table 8.1a and the corresponding match with the demand composite is given in Table 8.1b. In four countries (India, Indonesia, Sri Lanka, and Vietnam), fish types in the producer and consumer cores were identical, that is, there were no demand composites. In the remaining countries, demand composites were present. Composites are generally the combination of capture and culture categories (as in the case of shrimp in China) or the combination of residual categories qualified by “others” (as in the case of the Philippines).
India Sri Lanka
Large pelagic fishSmall pelagic fishDemersal fishOther marine fishCultured prawnFreshwater fishProcessed fish
Indonesia
ShrimpTunaMackerelAssorted pelagic fishGrouperSnapperOther finfishHigh-value pelagic fishLow-value pelagic fishCarpTilapiaCatfishMilkfishDried fishHigh-value processed fishLow-value processed fish
Vietnam
CatfishTilapiaOther freshwater fishShrimpMolluskSquidHigh-value marine fishLow-value marine fishAnchovyProcessed fish
Table 8.1a Fish Types in Countries with Identical Categories in the Producer and Consumer Cores
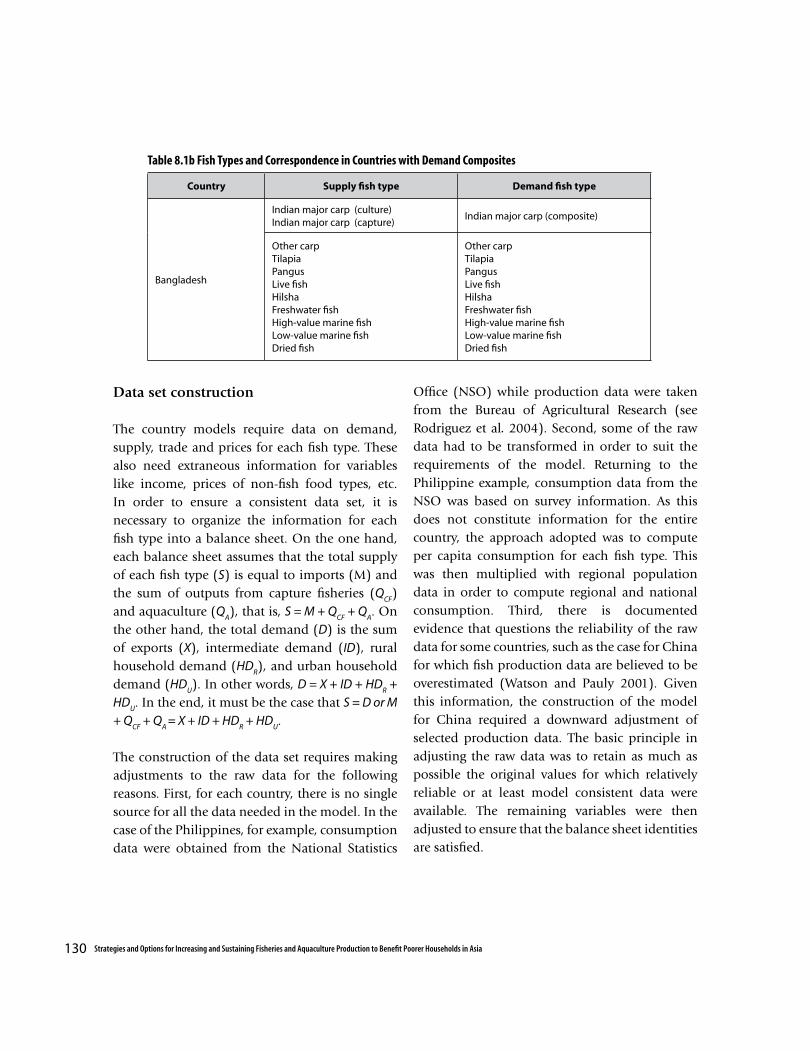
130 Strategies and Options for Increasing and Sustaining Fisheries and Aquaculture Production to Benefit Poorer Households in Asia
Data set construction
The country models require data on demand, supply, trade and prices for each fish type. These also need extraneous information for variables like income, prices of non-fish food types, etc. In order to ensure a consistent data set, it is necessary to organize the information for each fish type into a balance sheet. On the one hand, each balance sheet assumes that the total supply of each fish type (S) is equal to imports (M) and the sum of outputs from capture fisheries (Q
CF)
and aquaculture (QA), that is, S = M + Q
CF + Q
A. On
the other hand, the total demand (D) is the sum of exports (X), intermediate demand (ID), rural household demand (HD
R), and urban household
demand (HDU). In other words, D = X + ID + HD
R +
HDU. In the end, it must be the case that S = D or M
+ QCF
+ QA
= X + ID + HDR + HD
U.
The construction of the data set requires making adjustments to the raw data for the following reasons. First, for each country, there is no single source for all the data needed in the model. In the case of the Philippines, for example, consumption data were obtained from the National Statistics
Office (NSO) while production data were taken from the Bureau of Agricultural Research (see Rodriguez et al. 2004). Second, some of the raw data had to be transformed in order to suit the requirements of the model. Returning to the Philippine example, consumption data from the NSO was based on survey information. As this does not constitute information for the entire country, the approach adopted was to compute per capita consumption for each fish type. This was then multiplied with regional population data in order to compute regional and national consumption. Third, there is documented evidence that questions the reliability of the raw data for some countries, such as the case for China for which fish production data are believed to be overestimated (Watson and Pauly 2001). Given this information, the construction of the model for China required a downward adjustment of selected production data. The basic principle in adjusting the raw data was to retain as much as possible the original values for which relatively reliable or at least model consistent data were available. The remaining variables were then adjusted to ensure that the balance sheet identities are satisfied.
Country Supply fish type Demand fish type
Bangladesh
Indian major carp (culture)Indian major carp (capture)
Indian major carp (composite)
Other carpTilapiaPangusLive fishHilshaFreshwater fishHigh-value marine fishLow-value marine fishDried fish
Other carpTilapiaPangusLive fishHilshaFreshwater fishHigh-value marine fishLow-value marine fishDried fish
Table 8.1b Fish Types and Correspondence in Countries with Demand Composites
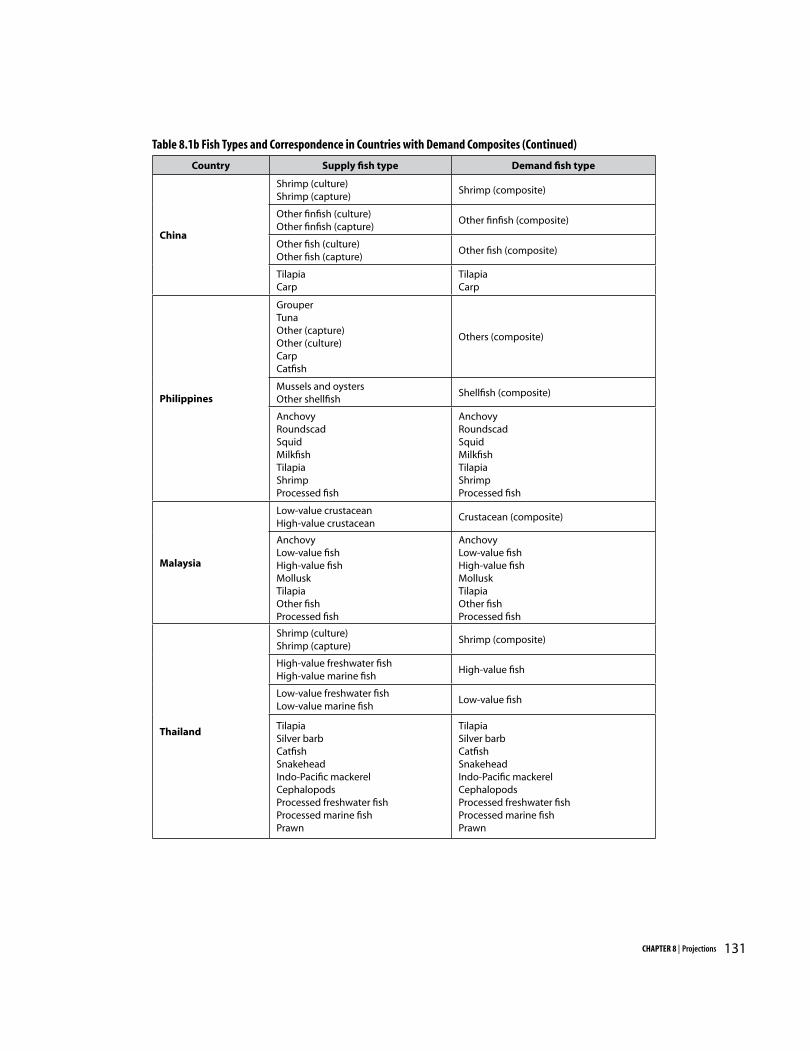
131CHAPTER 8 | Projections
Country Supply fish type Demand fish type
China
Shrimp (culture)Shrimp (capture)
Shrimp (composite)
Other finfish (culture)Other finfish (capture)
Other finfish (composite)
Other fish (culture)Other fish (capture)
Other fish (composite)
TilapiaCarp
TilapiaCarp
Philippines
GrouperTunaOther (capture)Other (culture)Carp Catfish
Others (composite)
Mussels and oystersOther shellfish
Shellfish (composite)
AnchovyRoundscadSquidMilkfishTilapiaShrimpProcessed fish
AnchovyRoundscadSquidMilkfishTilapiaShrimpProcessed fish
Malaysia
Low-value crustaceanHigh-value crustacean
Crustacean (composite)
AnchovyLow-value fishHigh-value fishMolluskTilapiaOther fishProcessed fish
AnchovyLow-value fishHigh-value fishMolluskTilapiaOther fishProcessed fish
Thailand
Shrimp (culture)Shrimp (capture)
Shrimp (composite)
High-value freshwater fishHigh-value marine fish
High-value fish
Low-value freshwater fishLow-value marine fish
Low-value fish
TilapiaSilver barbCatfishSnakeheadIndo-Pacific mackerelCephalopodsProcessed freshwater fishProcessed marine fishPrawn
TilapiaSilver barbCatfishSnakeheadIndo-Pacific mackerelCephalopodsProcessed freshwater fishProcessed marine fishPrawn
Table 8.1b Fish Types and Correspondence in Countries with Demand Composites (Continued)
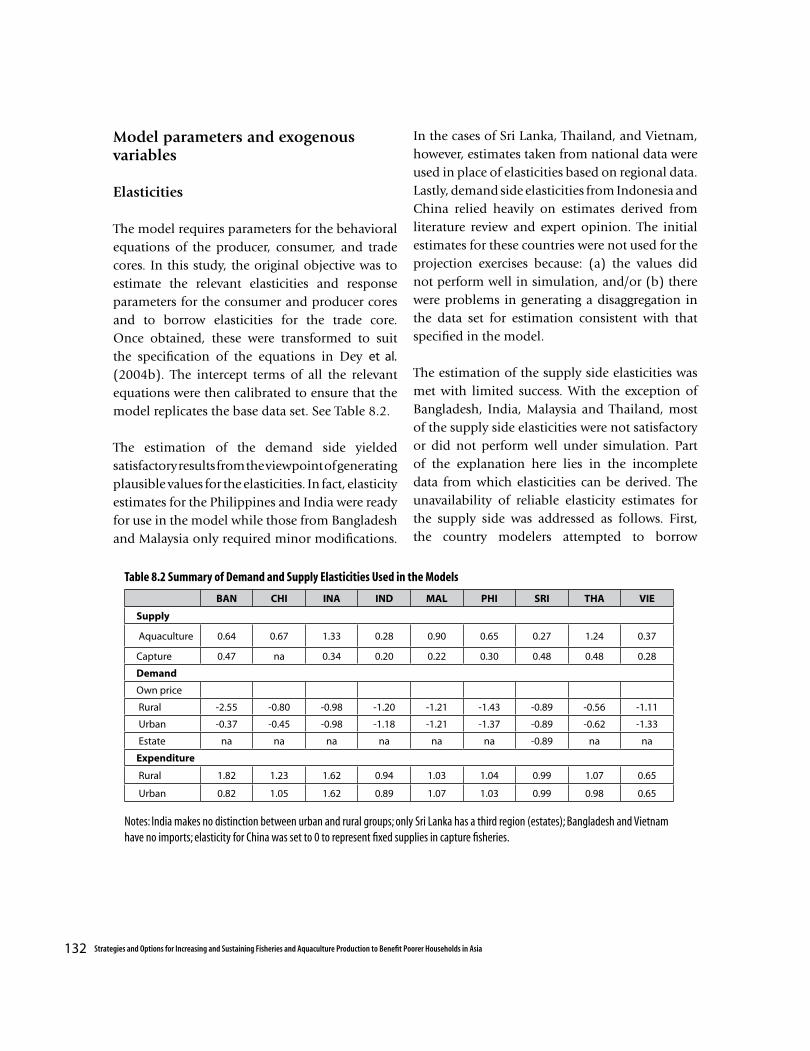
132 Strategies and Options for Increasing and Sustaining Fisheries and Aquaculture Production to Benefit Poorer Households in Asia
Model parameters and exogenous variables
Elasticities
The model requires parameters for the behavioral equations of the producer, consumer, and trade cores. In this study, the original objective was to estimate the relevant elasticities and response parameters for the consumer and producer cores and to borrow elasticities for the trade core. Once obtained, these were transformed to suit the specification of the equations in Dey et al. (2004b). The intercept terms of all the relevant equations were then calibrated to ensure that the model replicates the base data set. See Table 8.2.
The estimation of the demand side yielded satisfactory results from the viewpoint of generating plausible values for the elasticities. In fact, elasticity estimates for the Philippines and India were ready for use in the model while those from Bangladesh and Malaysia only required minor modifications.
In the cases of Sri Lanka, Thailand, and Vietnam, however, estimates taken from national data were used in place of elasticities based on regional data. Lastly, demand side elasticities from Indonesia and China relied heavily on estimates derived from literature review and expert opinion. The initial estimates for these countries were not used for the projection exercises because: (a) the values did not perform well in simulation, and/or (b) there were problems in generating a disaggregation in the data set for estimation consistent with that specified in the model.
The estimation of the supply side elasticities was met with limited success. With the exception of Bangladesh, India, Malaysia and Thailand, most of the supply side elasticities were not satisfactory or did not perform well under simulation. Part of the explanation here lies in the incomplete data from which elasticities can be derived. The unavailability of reliable elasticity estimates for the supply side was addressed as follows. First, the country modelers attempted to borrow
BAN CHI INA IND MAL PHI SRI THA VIE
Supply
Aquaculture 0.64 0.67 1.33 0.28 0.90 0.65 0.27 1.24 0.37
Capture 0.47 na 0.34 0.20 0.22 0.30 0.48 0.48 0.28
Demand
Own price
Rural -2.55 -0.80 -0.98 -1.20 -1.21 -1.43 -0.89 -0.56 -1.11
Urban -0.37 -0.45 -0.98 -1.18 -1.21 -1.37 -0.89 -0.62 -1.33
Estate na na na na na na -0.89 na na
Expenditure
Rural 1.82 1.23 1.62 0.94 1.03 1.04 0.99 1.07 0.65
Urban 0.82 1.05 1.62 0.89 1.07 1.03 0.99 0.98 0.65
Table 8.2 Summary of Demand and Supply Elasticities Used in the Models
Notes: India makes no distinction between urban and rural groups; only Sri Lanka has a third region (estates); Bangladesh and Vietnam have no imports; elasticity for China was set to 0 to represent fixed supplies in capture fisheries.
133CHAPTER 8 | Projections
elasticities from literature or other participants in the project. Second, for specific fish types in which such elasticities are not available elsewhere, the decision was to consult a panel of experts on plausible values for the elasticities.
A summary of the elasticities is given in Table 8.2. The result of the exercise yielded literally hundreds of estimates for the producer and consumer cores. The complete documentation of the numbers used is provided in Appendix 4, Tables 1.A.1 to 1.I.2. (All Appendix data provided on CD only.) In general, the elasticities used are consistent with the patterns and magnitudes found in Chapter 7.
Exogenous variables are not determined in the model but given in its formulation, are denoting external factors or drivers of fish supply and demand. This practice provides the engine for analyzing future trends, as well as undertaking impact assessment. The external factors include the biophysical environment, mix of technologies, policies, and institutions, which are represented in some form in the set of exogenous variables, as well as the data and parameters of the model (Figure 8.1). Also represented in the model structure is the socioeconomic profile of consumers and producers. Supply and demand in turn are divided into domestic and foreign components, allowing analysis of export and import trends. The interaction of supply and demand to achieve a balance determines market outcomes. The impact of changes in the external factors is simulated by introducing the corresponding changes in exogenous variables, called “shocks”, which then determine new equilibrium solutions. Previous and new solutions are then used to determine projections and impacts at the market level.
Baseline projections and scenarios
The baseline denotes the most likely case identified by the modelers with respect to trends in the exogenous variables. For the baseline projections, the country modelers in general used historical trends to project the exogenous variables, such as income, input prices, non-fish commodity prices, and regional populations (see Table 8.3).
Countries, however, differ in assumptions regarding future technological changes in the fisheries sector. At one extreme, simulations for the Philippines and Malaysia assume no productivity changes during the projection period. As such, the projections for these countries should be interpreted as one in which technology in 2020 is the same as it is at present.
At the other extreme are India and Sri Lanka, for which it is assumed that technological progress will raise the productivity of aquaculture by 3-4%/yr.
It is unlikely that all the assumptions in the baseline will actually hold in the future. Developing countries are vulnerable to internal and external shocks, and policy responses to the changing political and economic landscape are highly influential but hard to predict. The possibility for such changes to occur is made more likely by the fact that the projection exercise is conducted over a relatively long period (15 years).
The possibility of future shocks and policy changes supports the need to make projections under alternative scenarios. Such an exercise provides a plausible range of values for the projections of key variables in the fisheries sector. In addition, a comparison of the results of the different scenarios
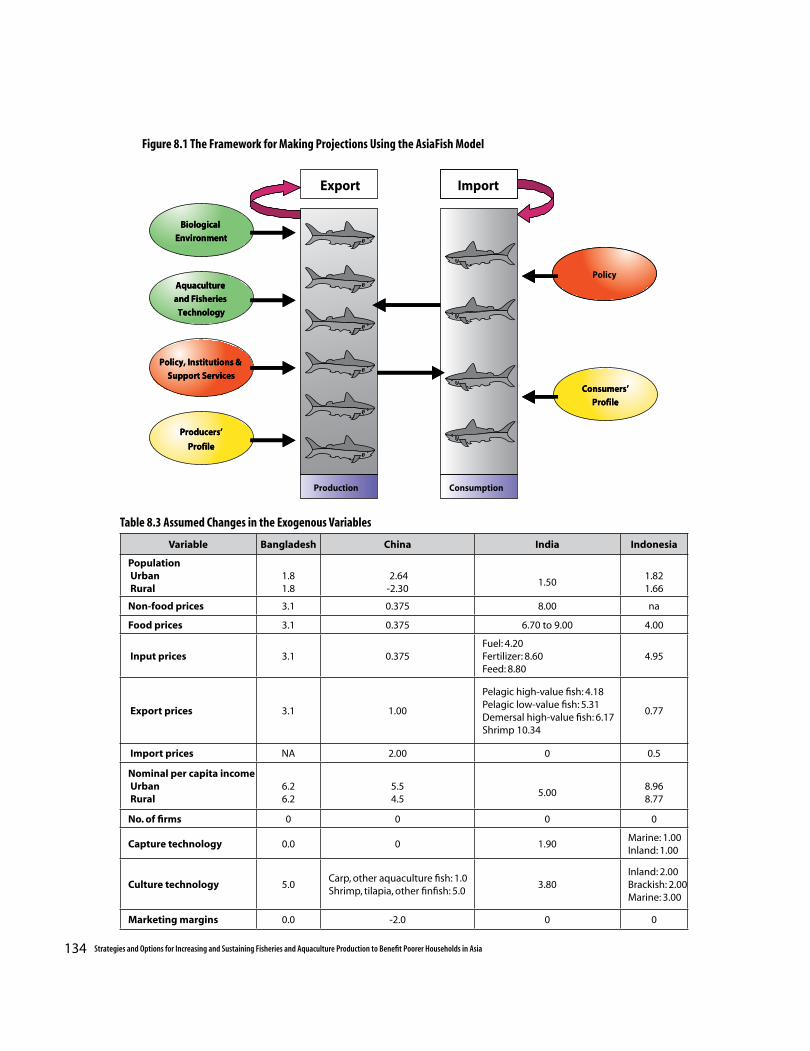
134 Strategies and Options for Increasing and Sustaining Fisheries and Aquaculture Production to Benefit Poorer Households in Asia
Policy, Institutions &
Support Services
Policy, Institutions &
Support Services
Biological Environment
Biological Environment
Aquaculture
and Fisheries
Technology
Aquaculture
and Fisheries
Technology
Producers’
Profile
Producers’
Profile
PolicyPolicy
Consumers’
Profile
Consumers’
Profile
Production Consumption
Export Import
Figure 8.1 The Framework for Making Projections Using the AsiaFish Model
Variable Bangladesh China India Indonesia
Population Urban Rural
1.81.8
2.64-2.30
1.501.821.66
Non-food prices 3.1 0.375 8.00 na
Food prices 3.1 0.375 6.70 to 9.00 4.00
Input prices 3.1 0.375Fuel: 4.20Fertilizer: 8.60 Feed: 8.80
4.95
Export prices 3.1 1.00
Pelagic high-value fish: 4.18Pelagic low-value fish: 5.31Demersal high-value fish: 6.17Shrimp 10.34
0.77
Import prices NA 2.00 0 0.5
Nominal per capita income Urban Rural
6.26.2
5.54.5
5.008.968.77
No. of firms 0 0 0 0
Capture technology 0.0 0 1.90Marine: 1.00Inland: 1.00
Culture technology 5.0Carp, other aquaculture fish: 1.0Shrimp, tilapia, other finfish: 5.0
3.80Inland: 2.00Brackish: 2.00Marine: 3.00
Marketing margins 0.0 -2.0 0 0
Table 8.3 Assumed Changes in the Exogenous Variables
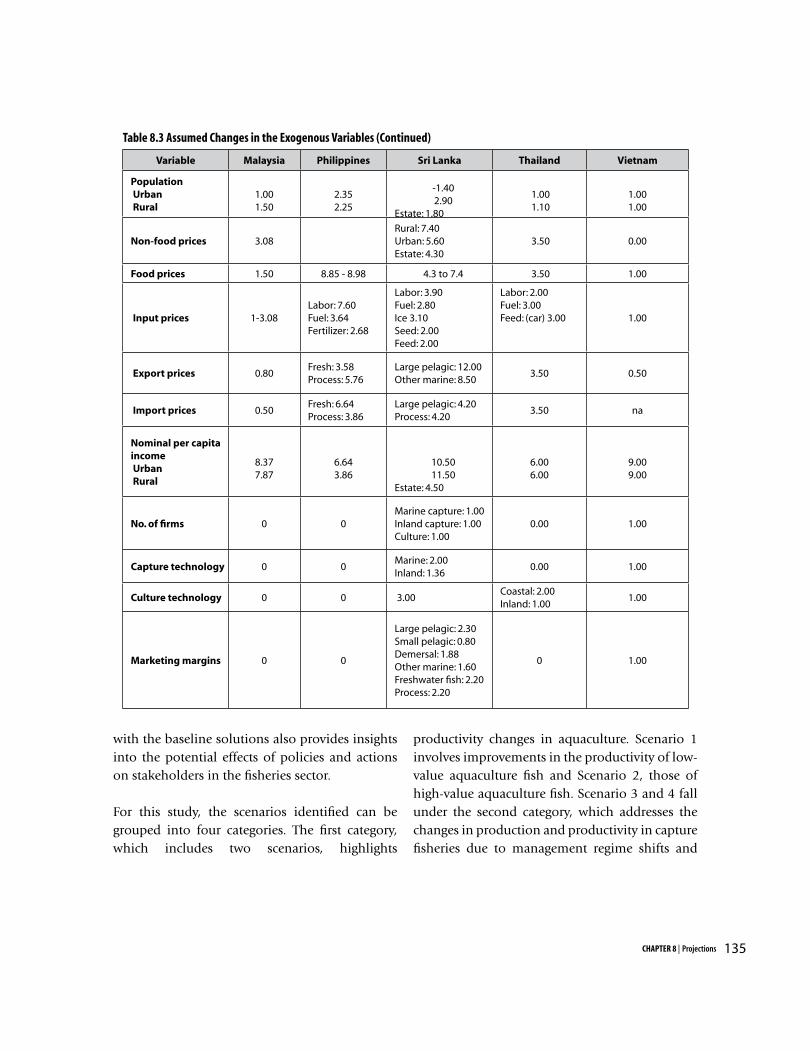
135CHAPTER 8 | Projections
with the baseline solutions also provides insights into the potential effects of policies and actions on stakeholders in the fisheries sector.
For this study, the scenarios identified can be grouped into four categories. The first category, which includes two scenarios, highlights
productivity changes in aquaculture. Scenario 1 involves improvements in the productivity of low-value aquaculture fish and Scenario 2, those of high-value aquaculture fish. Scenario 3 and 4 fall under the second category, which addresses the changes in production and productivity in capture fisheries due to management regime shifts and
Variable Malaysia Philippines Sri Lanka Thailand Vietnam
Population Urban Rural
1.001.50
2.352.25
-1.402.90
Estate: 1.80
1.00 1.10
1.001.00
Non-food prices 3.08Rural: 7.40Urban: 5.60Estate: 4.30
3.50 0.00
Food prices 1.50 8.85 - 8.98 4.3 to 7.4 3.50 1.00
Input prices 1-3.08Labor: 7.60Fuel: 3.64Fertilizer: 2.68
Labor: 3.90Fuel: 2.80Ice 3.10Seed: 2.00Feed: 2.00
Labor: 2.00Fuel: 3.00Feed: (car) 3.00 1.00
Export prices 0.80Fresh: 3.58Process: 5.76
Large pelagic: 12.00Other marine: 8.50
3.50 0.50
Import prices 0.50Fresh: 6.64Process: 3.86
Large pelagic: 4.20Process: 4.20
3.50 na
Nominal per capita income Urban Rural
8.377.87
6.643.86
10.5011.50
Estate: 4.50
6.006.00
9.009.00
No. of firms 0 0Marine capture: 1.00Inland capture: 1.00Culture: 1.00
0.00 1.00
Capture technology 0 0Marine: 2.00Inland: 1.36
0.00 1.00
Culture technology 0 0 3.00Coastal: 2.00Inland: 1.00
1.00
Marketing margins 0 0
Large pelagic: 2.30Small pelagic: 0.80Demersal: 1.88Other marine: 1.60Freshwater fish: 2.20Process: 2.20
0 1.00
Table 8.3 Assumed Changes in the Exogenous Variables (Continued)
136 Strategies and Options for Increasing and Sustaining Fisheries and Aquaculture Production to Benefit Poorer Households in Asia
adoption of resource enhancement technologies. Scenario 3 explores the effects of reducing fishing effort in capture fisheries. Scenario 4 examines the impacts of improvements in the resource base for capture fisheries. The third category, which includes scenarios 5 and 6, examines downstream interventions in fisheries, i.e., in marketing and processing. Scenario 5 focuses on compliance to multilateral agreements on food safety, while Scenario 6 examines the effect of reducing marketing margins in fish trade. The fourth and last category is a loose collection of events that are external to the fisheries sector. This represents demographic and economic events, policy-driven or otherwise, which are beyond the control of the authorities and stakeholders in the sector. There are two scenarios in this category: faster income growth (Scenario 7) and faster rate of urbanization (Scenario 8).
Scenarios 1 and 2 were implemented with an acknowledgment that fish types in aquaculture are divided into low-value and high-value species (typically the former pertains to freshwater fish and the latter to brackishwater and marine fish). Then productivity improvements were introduced by raising the value of the technology index for the identified fish types.
The resource management scenarios were implemented by means of an intercept shift. For countries that incorporated fishing effort as a supply shifter, the intercept shift was applied by reducing the level of fishing effort. This reduction implies a leftward shift in the supply curve; from a partial equilibrium perspective, this will lead to higher price and lower output. (As pointed out earlier though, one must be cautious in extending this expectation to the multi-market case.) Resource enhancement is implemented by assuming an exogenous increase in the output of
capture fisheries. Ignoring cross-price and feedback effects, this is expected to produce results that are the opposite of the reduction in fishing effort.
Expanded implementation of hazard analysis critical control points (HACCP) and sanitary and phyto-sanitary-related standards is expected to raise per unit costs in export-oriented fisheries. Alternatively, this may be seen as a reduction in the export price (interpreted as price received by exporters, net of processing costs). In practice though, a dynamic element was introduced, that is, expanded compliance over time implies increasing costs over a wider segment of the sector. Hence, HACCP compliance is implemented by adding a negative growth component to the export price trend.
The faster growth scenario is implemented simply by raising the per capita income growth. This will directly affect the demand side of the model. The magnitude and direction of these effects in turn depend on the impact of the income changes on aggregated food and fish expenditure, and the expenditure elasticities of the different fish types. However, higher income growth is expected to raise fish consumption and prices as a whole (see Figure 8.2).
Lastly, the urbanization scenario (Scenario 8) is based on recent demographic trends in the countries of this study. It is especially relevant to Bangladesh, China, Indonesia, Malaysia, and the Philippines, as the proportion of the population living in urban areas of these countries has risen significantly in recent years (see Figure 8.3). Similar to income changes, the direct effect of demographic changes is on the demand side of the model. Other things being equal, a faster increase of the population in the urban areas means that the number of fish consumers in these areas is
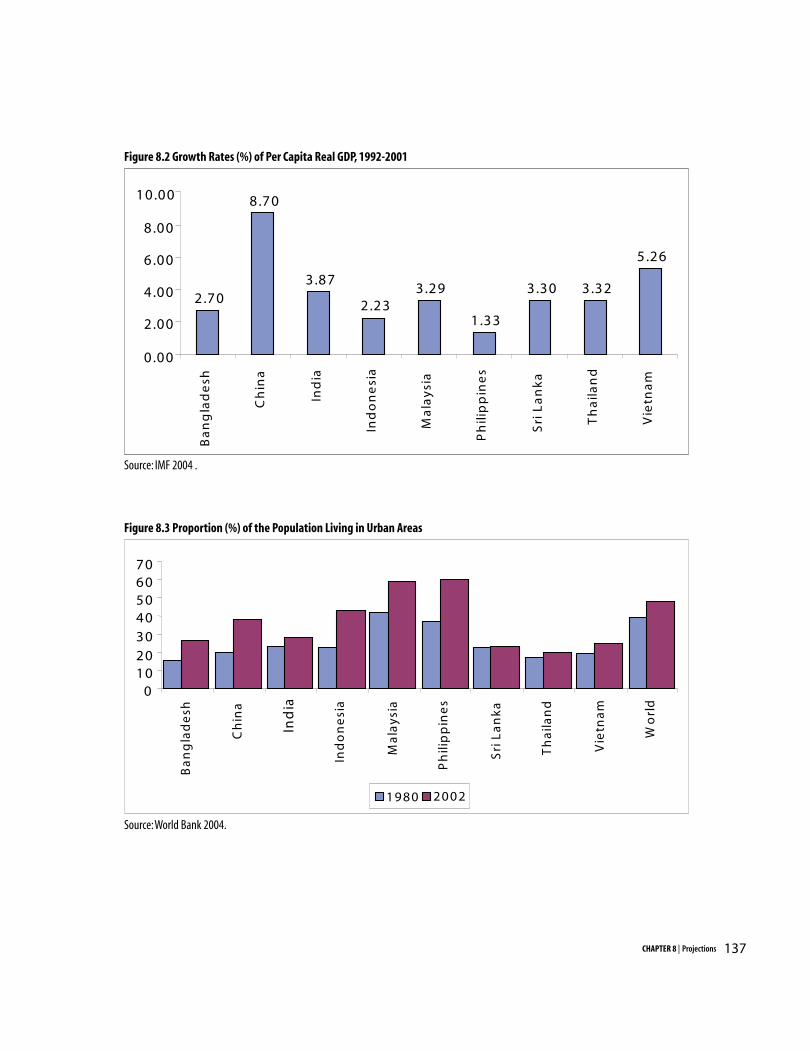
137CHAPTER 8 | Projections
Figure 8.2 Growth Rates (%) of Per Capita Real GDP, 1992-2001
Source: IMF 2004 .
Figure 8.3 Proportion (%) of the Population Living in Urban Areas
Source: World Bank 2004.

138 Strategies and Options for Increasing and Sustaining Fisheries and Aquaculture Production to Benefit Poorer Households in Asia
likely to rise faster than that in the rural areas. In other words, fish consumption in the urban areas is likely to rise while that in the rural areas is likely to fall. In addition, the contrasting responses for the urban and rural regions suggest that impact on aggregate consumption is ambiguous.
It is important to note that the country modelers were given enough latitude in the implementation of the experiments. As a consequence, there are many instances in which the modelers did not conduct the eight scenarios mentioned above. For example, only six countries participated in the simulation of Scenario 1. Moreover, the magnitude of the changes varies from one country to the next. In Scenario 8, for example, the experiments involved reducing margins by anywhere between 0.5 and 1 percent. Hence, for countries that conducted a particular experiment, no attempt was made to compare the results across countries.
Results
Aggregate trends
Discussion of the results begins with consideration of the baseline projections for production, consumption, and trade at an aggregated level. This is followed by a disaggregated, country-by-country discussion incorporating the baseline and alternative scenarios. As shown in Table 8.4, the projected changes in the output of fresh fish from 2005 to 2020 indicates that the total fisheries output is expected to rise anywhere between 0.21 percent per year in the Philippines to 3.57 percent in Sri Lanka.
While these projections are quite conservative when compared with the actual performance of these countries from 1992 to 2001, the implied
changes over the 15-year projection period are at times quite dramatic. For example, the results indicate that the outputs of fresh fish of India and Sri Lanka in 2020 will be approximately two times their values in the base year.
The same table presents the projected growth rates for the different sources of fresh fish across countries. Aquaculture is expected to expand in all countries, especially in China (4.69%/yr), Malaysia (4.45%/yr), and Thailand (4.01%/yr). The results for capture fisheries are mixed. While a majority of the countries are expected to experience an increase in the output, the opposite is true for Bangladesh (-2.02%) and the Philippines (-0.17%).
The relatively high rate of increase in aquaculture output implies an increase in its share in the total fisheries output. These changes are more pronounced for China, Bangladesh, and Thailand in which the share of aquaculture in the total fresh fish output rises by 18.9, 17.9, and 15.3 percent, respectively. In the cases of China and Bangladesh, aquaculture is expected to account for roughly three quarters of their total fresh fish output in 2020. For China and Thailand, the increase in the share of aquaculture is mostly due to the relative growth of this resource over the projection period. For Bangladesh, however, the explanation lies partly in the projected contraction of capture fisheries; and it should be noted that, in the baseline, technological change is confined to aquaculture; hence, cultured products may become cheaper and substitute for capture products.
The projected patterns for fish consumption (Table 8.5) indicate that aggregate consumption is expected to rise in all countries. The growth rates range from a low 0.22 per year in Bangladesh to
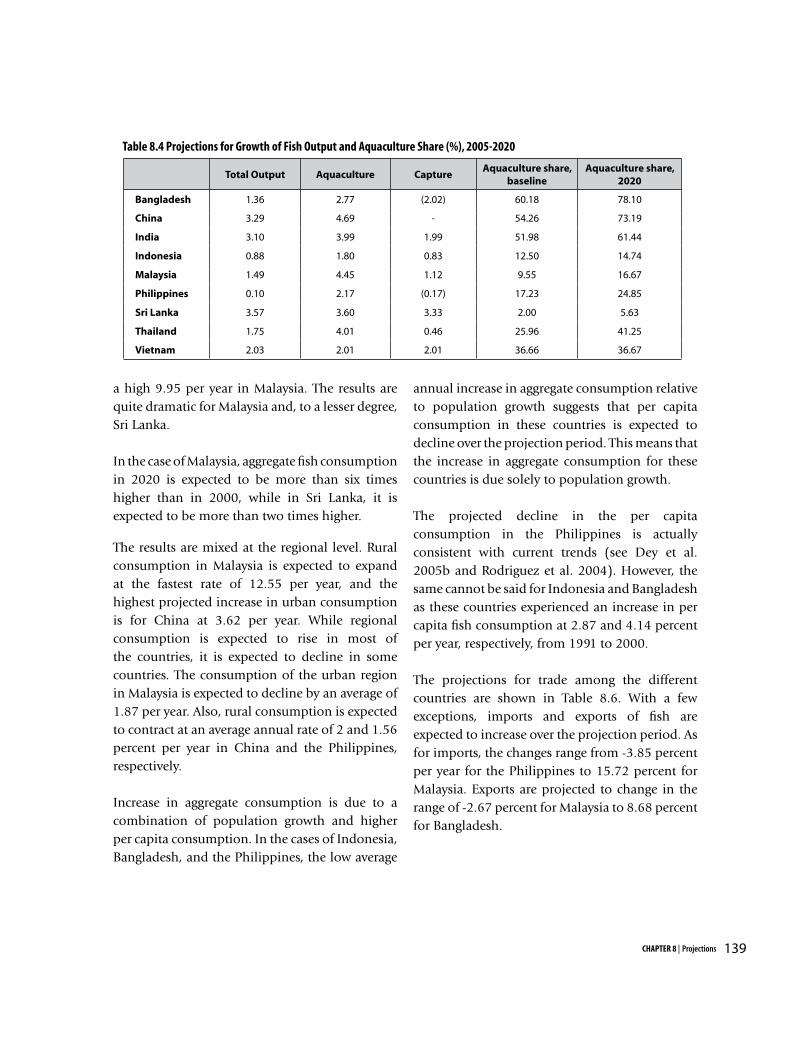
139CHAPTER 8 | Projections
a high 9.95 per year in Malaysia. The results are quite dramatic for Malaysia and, to a lesser degree, Sri Lanka.
In the case of Malaysia, aggregate fish consumption in 2020 is expected to be more than six times higher than in 2000, while in Sri Lanka, it is expected to be more than two times higher.
The results are mixed at the regional level. Rural consumption in Malaysia is expected to expand at the fastest rate of 12.55 per year, and the highest projected increase in urban consumption is for China at 3.62 per year. While regional consumption is expected to rise in most of the countries, it is expected to decline in some countries. The consumption of the urban region in Malaysia is expected to decline by an average of 1.87 per year. Also, rural consumption is expected to contract at an average annual rate of 2 and 1.56 percent per year in China and the Philippines, respectively.
Increase in aggregate consumption is due to a combination of population growth and higher per capita consumption. In the cases of Indonesia, Bangladesh, and the Philippines, the low average
annual increase in aggregate consumption relative to population growth suggests that per capita consumption in these countries is expected to decline over the projection period. This means that the increase in aggregate consumption for these countries is due solely to population growth.
The projected decline in the per capita consumption in the Philippines is actually consistent with current trends (see Dey et al. 2005b and Rodriguez et al. 2004). However, the same cannot be said for Indonesia and Bangladesh as these countries experienced an increase in per capita fish consumption at 2.87 and 4.14 percent per year, respectively, from 1991 to 2000.
The projections for trade among the different countries are shown in Table 8.6. With a few exceptions, imports and exports of fish are expected to increase over the projection period. As for imports, the changes range from -3.85 percent per year for the Philippines to 15.72 percent for Malaysia. Exports are projected to change in the range of -2.67 percent for Malaysia to 8.68 percent for Bangladesh.
Total Output Aquaculture CaptureAquaculture share,
baselineAquaculture share,
2020
Bangladesh 1.36 2.77 (2.02) 60.18 78.10
China 3.29 4.69 - 54.26 73.19
India 3.10 3.99 1.99 51.98 61.44
Indonesia 0.88 1.80 0.83 12.50 14.74
Malaysia 1.49 4.45 1.12 9.55 16.67
Philippines 0.10 2.17 (0.17) 17.23 24.85
Sri Lanka 3.57 3.60 3.33 2.00 5.63
Thailand 1.75 4.01 0.46 25.96 41.25
Vietnam 2.03 2.01 2.01 36.66 36.67
Table 8.4 Projections for Growth of Fish Output and Aquaculture Share (%), 2005-2020
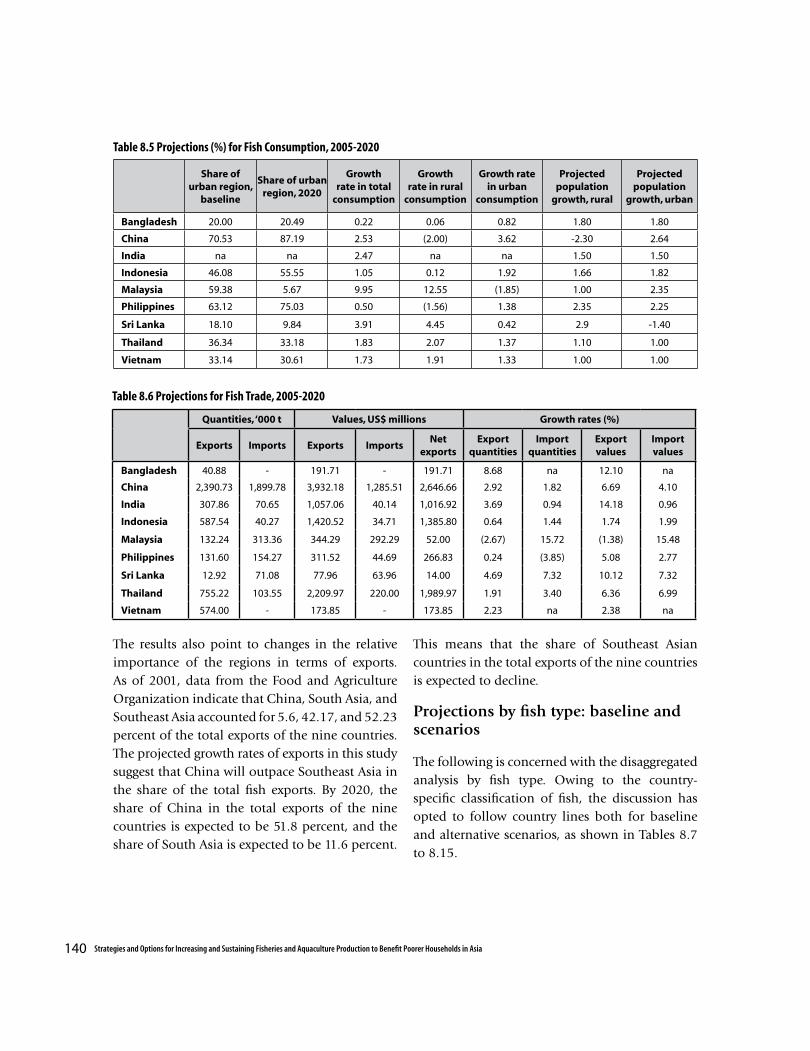
140 Strategies and Options for Increasing and Sustaining Fisheries and Aquaculture Production to Benefit Poorer Households in Asia
Share of
urban region, baseline
Share of urban region, 2020
Growth rate in total
consumption
Growth rate in rural
consumption
Growth rate in urban
consumption
Projected population
growth, rural
Projected population
growth, urban
Bangladesh 20.00 20.49 0.22 0.06 0.82 1.80 1.80
China 70.53 87.19 2.53 (2.00) 3.62 -2.30 2.64
India na na 2.47 na na 1.50 1.50
Indonesia 46.08 55.55 1.05 0.12 1.92 1.66 1.82
Malaysia 59.38 5.67 9.95 12.55 (1.85) 1.00 2.35
Philippines 63.12 75.03 0.50 (1.56) 1.38 2.35 2.25
Sri Lanka 18.10 9.84 3.91 4.45 0.42 2.9 -1.40
Thailand 36.34 33.18 1.83 2.07 1.37 1.10 1.00
Vietnam 33.14 30.61 1.73 1.91 1.33 1.00 1.00
Quantities, ‘000 t Values, US$ millions Growth rates (%)
Exports Imports Exports ImportsNet
exportsExport
quantitiesImport
quantitiesExport values
Import values
Bangladesh 40.88 - 191.71 - 191.71 8.68 na 12.10 na
China 2,390.73 1,899.78 3,932.18 1,285.51 2,646.66 2.92 1.82 6.69 4.10
India 307.86 70.65 1,057.06 40.14 1,016.92 3.69 0.94 14.18 0.96
Indonesia 587.54 40.27 1,420.52 34.71 1,385.80 0.64 1.44 1.74 1.99
Malaysia 132.24 313.36 344.29 292.29 52.00 (2.67) 15.72 (1.38) 15.48
Philippines 131.60 154.27 311.52 44.69 266.83 0.24 (3.85) 5.08 2.77
Sri Lanka 12.92 71.08 77.96 63.96 14.00 4.69 7.32 10.12 7.32
Thailand 755.22 103.55 2,209.97 220.00 1,989.97 1.91 3.40 6.36 6.99
Vietnam 574.00 - 173.85 - 173.85 2.23 na 2.38 na
The results also point to changes in the relative importance of the regions in terms of exports. As of 2001, data from the Food and Agriculture Organization indicate that China, South Asia, and Southeast Asia accounted for 5.6, 42.17, and 52.23 percent of the total exports of the nine countries. The projected growth rates of exports in this study suggest that China will outpace Southeast Asia in the share of the total fish exports. By 2020, the share of China in the total exports of the nine countries is expected to be 51.8 percent, and the share of South Asia is expected to be 11.6 percent.
This means that the share of Southeast Asian countries in the total exports of the nine countries is expected to decline.
Projections by fish type: baseline and scenarios The following is concerned with the disaggregated analysis by fish type. Owing to the country-specific classification of fish, the discussion has opted to follow country lines both for baseline and alternative scenarios, as shown in Tables 8.7 to 8.15.
Table 8.5 Projections (%) for Fish Consumption, 2005-2020
Table 8.6 Projections for Fish Trade, 2005-2020

141CHAPTER 8 | Projections
Bangladesh
The projected output growth of Bangladesh is led by brackishwater culture (i.e., for shrimp), and to a lesser extent, by inland aquaculture (Table 8.7). For the latter, the model predicts diversification, away from traditional Indian major carps to tilapia and other carp species. In fact, Indian major carps are projected to decline in output. Within the capture fisheries, trends are highly uneven, that is, high-value, marine fish post robust growth, while supply of other capture species decline. A similar trend is reflected in the demand projections. Relative to the projected inflation rate (3.1%), retail fish prices are projected to rise gradually, except for captured species from freshwater sources (Hilsha and other freshwater fish). Interestingly, the fastest growing freshwater fish type (other carps) with the highest production growth suffers an absolute fall in price. Finally, the fastest-growing export earner may be dried fish, although this finding may have to be treated with caution owing to the small base. More importantly, shrimp exports will continue to grow rapidly, outpacing the overall output and, because of its dominant volume, will drive the overall trends in fisheries exports.
The scenario of increased productivity in freshwater or low-value aquaculture is implemented by adding a one-percentage-point increase in the technology index. As expected, freshwater cultured species grow faster in both production and consumption, and experience a slower growth in consumer price (or faster decline). There is a mild substitution away from captured species (and almost none from brackishwater culture species). Exports decline slightly as a result. In general, this experiment amplifies the effect of technological change in freshwater aquaculture observed in the baseline. It should be noted, however, that the
productivity shock is not enough to overcome the declining per capita consumption, as consumption growth remains below the population growth of 1.8 percent per year.
The scenario of increased productivity in brackishwater or high-value aquaculture is implemented by a similar one-percentage-point increase in the relevant technology index. The effects are similar to the previous experiment, but veer in the direction of shrimp culture and the magnitudes tend to be more pronounced.
The inland and marine capture scenarios are implemented by a 2% change in the intercept terms of the relevant fish supply functions. An improvement in inland capture fisheries (say, by the widespread adoption of culture-based fisheries in the floodplains) will slow down the contraction of inland captured supplies, as well as the growth of inland culture output. Similarly, a reduction in marine fisheries supplies, say, by a reduction in fishing effort, will exacerbate the projected contraction in marine capture output.
Compliance with HACCP, translated here as a 1% slowdown in the growth of export prices, does indeed slow down export growth, though only mildly. The effects can also be seen in the contraction of output growth of exported fish types (i.e., shrimp and hilsha). Demand increase, however, is very minimal due to the market switching by suppliers from foreign to domestic markets.
Finally, sensitivity analysis on the projected change in income (the last scenario) is implemented by a 1% increase in the growth rate of gross domestic product (GDP) per capita income. Baseline patterns generally reflected in higher levels of output, consumption, and price; however, the
142 Strategies and Options for Increasing and Sustaining Fisheries and Aquaculture Production to Benefit Poorer Households in Asia
leading role of other carp is no longer seen. Rather, Indian major carp continues to grow and dominates production and consumption, and even shows an increase in price. Hence, this fish species should remain under serious consideration as a major contributor to freshwater aquaculture.
China
Baseline projections for China (Table 8.8) reflect the assumption that capture fisheries exhibit zero growth; hence, production increases must be generated solely from aquaculture. The fastest-growing aquaculture species is tilapia, followed closely by other cultured species, mostly brackishwater or marine. Carp output is projected to grow much more slowly (reflecting the effect of a slow rise in its technology index). Supply growth is partly motivated by export markets, although exports from capture fisheries are projected to decline. Therefore, increase in domestic demand is met not so much by domestic supply as by imports. Consumer prices are expected to rise much faster than the projected inflation rate (of only 0.6%), led by prices of tilapia and of other non-finfish aquatic products.
Productivity improvement in aquaculture is posited at a 1-6% additional growth in the technology indices of shrimp, tilapia, and other finfish. Price increases are reduced for other finfish and shrimp; quantities of demand, supply, and exports also rise.
Compliance with HACCP (also implemented by a one-percentage–point reduction in the growth of export price) results in a moderate decline in exports. Unlike in the case of Bangladesh, demand does not fall, indicating the absence of market switching, that is, there may be a high level of differentiation between foreign and domestic
markets. A 1.26 percentage-point decline in the growth rate of the marketing margin has the expected beneficial effects on output, demand, prices, imports, and exports across the various fish types. Similarly, faster income growth (1.5 percentage points higher for urban areas; 1.0, for rural areas) and urbanization (2.9 percentage points higher population growth in urban areas; 2.9 lower in rural areas) reflect the expected directions of effect, without major alterations in the composition of output across fish types.
India
In the case of India, baseline projections show a striking conformity with the technological change assumptions. A growth rate of 3 percent in the technology index for aquaculture generates a 3.9-4.0% growth in aquaculture output for Indian major carp and other freshwater fish, and a growth rate of 1.9 percent in capture fisheries generates a 2.0% or so expansion in capture fish types. Demand growth, however, varies for the capture species, with shrimp, mollusk, and high-value demersals expected to pose a decline by 2020. Consumer price rise also varies across capture fish types; however, all positive price increases are below the expected inflation rate of 8.0 percent, reflecting cheaper and more available fish. Exports will grow faster than imports, with hardly any sign of increase in mollusks and a contraction in the imports of pelagic, high-value fish.
The scenarios turn out to show very minimal changes in the baseline trends in production. This is not due to the small sizes of shock under each scenario; for example, technological change under Scenario 1 (more productive, low-value aquaculture) posits a 5-percentage-point rise in the technology index. Rather, this result reflects a structural feature of the fisheries sector as modeled.
143CHAPTER 8 | Projections
If correct, it also implies the resilience of fisheries in the face of shocks, as well as a difficulty in applying development policies to accelerate productivity.
Indonesia
In the most likely case, output growth in Indonesia will be led by marine culture, followed by freshwater and brackishwater culture. This order fully reflects the size of the productivity shocks in the baseline. Among the fish types, grouper exhibits the fastest growth (it is 50 percent cultured, according to the baseline data set), followed by some of the freshwater and brackishwater species (milkfish, catfish, tilapia, and carp).
Demand is rising faster than supply for most fish types; in addition, rising demand for processed fish further increases derived demand for the fresh fish types. However, because prices are not rising as fast as the general inflation rate (around 4-5%/yr), fish is actually becoming cheaper in relative terms. This probably results from the availability of imports, whose prices are assumed to rise very slightly in the long term (half a percentage point per annum). Exports are projected to grow more slowly than imports, with grouper leading export growth by a wide margin over the other fish types.
The higher productivity growth for low-value culture species is effected by making the technology index rise faster by 3 percentage points for inland culture species. Carp responds most forcefully to the impetus from technology. Demand growth also rises, and carp prices are projected to fall over the period. Exports also respond dramatically. The effects of the change are limited to inland culture species, with catfish and tilapia trailing carp in terms of the size of response.
Higher productivity growth for brackishwater and marine culture species (1% and 3% faster growth of the technology index for cultured shrimp and grouper, respectively) results in corresponding effects in the output of the species directly affected, but hardly affects the other fish types. Even consumption of shrimp is almost unchanged, with the demand changes apparently ending up in the export market.
A reduction in fishing effort (equivalent to a 10% drop in the use of fuel) has dramatic effects on the output of some marine species (such as tuna), but little effect on the output of other fish types. A decline in productivity of inland capture fisheries (a half percentage point drop) causes minimal changes over the baseline projection.
Meanwhile, a 1% faster growth of export prices has an appreciable impact on export growth. This, however, can hardly affect the total domestic production and consumption. Lastly, urbanization (higher population growth in urban regions, from 1.82% to 2%) has an impact going in the expected directions, but indicate minimal changes in overall supply and demand conditions.
Malaysia
The growth of output in Malaysia is projected to remain sluggish because most fish is produced by marine capture fisheries. Anchovy (produced by a highly specialized purse seine fishery) is even projected to decline over the projection period. The fastest-growing sector is brackishwater aquaculture, which produces high-value fish, high-value crustaceans, mollusks, and tilapia; the last item has by far the highest projected supply growth.
144 Strategies and Options for Increasing and Sustaining Fisheries and Aquaculture Production to Benefit Poorer Households in Asia
Projected export performance is even less impressive; the contraction in total exports is led by anchovy, followed by low-value fish, high-value fish and shellfish. However, demand is projected to grow very dramatically. As discussed earlier, this demand would have to be met by large imports, mainly of low-value fish, tilapia, and other fish. Nevertheless, a rise in consumer prices of fish will be in line with a general inflation rate of around 3 percent.
Faster technical progress in freshwater aquaculture (additional 1%/yr) can accelerate supply growth, and mitigate the export decline. Faster technical progress in brackishwater culture (also an additional 1%/yr) has a lesser effect overall. Neither a reduction in fishing effort (1% reduction in the effort variable) nor an improvement in aquatic resource productivity (implemented by intercept shifts) significantly alters trends in the sector.
Philippines
Baseline projections for outputs in the Philippines show a long-term decline in municipal capture fisheries, stagnant commercial capture fisheries, and an aquaculture sector with moderate growth. Aquaculture growth is anchored upon milkfish, tilapia, and shrimp. Among the marine capture species, only roundscad, anchovy, and tuna exhibit positive growth. Exports are also anemic, with some fish types (other capture fish, shellfish, and processed fish) posting declines. Consumption growth is also so minimal that imports are actually in decline across the board.
The scenario of increased productivity in low-value aquaculture is affected by a 5%/yr growth in the technology index to tilapia, carp, mussels and oysters. Tilapia’s response to this shock is the strongest, followed by cultured shellfish and
milkfish. Export growth of tilapia also shoots up, followed by those of mussels and oysters, carp, and milkfish. There are no appreciable changes in consumption, or in consumer price.
Lower fishing effort (a 10% drop on the intercept terms of municipal and commercial capture fisheries) hardly alters baseline trends, although the directions of effect are consistent with expectation. HACCP compliance (a one percentage point decline in export price growth) makes a big dent on the overall exports, turning a small positive growth into a small negative growth over the 15-year period. A reduction in marketing margins (by 1%/yr) has a slight but usually positive effect on both production and consumption, and a negative effect on price growth, all consistent with expectation. Finally, sensitivity analysis on per capita income trends (1% faster economic growth) or population (a 0.1% faster growth in urban areas and 0.1% slower growth in rural areas) results in a similar pattern of supply and demand corresponding to the baseline.
Sri Lanka
Baseline projections for Sri Lanka exhibit a growth in supply for all the fish types. Cultured prawn exhibits higher than average growth, along with large pelagic fish; freshwater fish also exhibits a fairly rapid growth. Demand growth is strong for pelagic fish, cultured species, and processed fish, but weak or even negative for demersal fish and other marine fish. Although consumer prices for fish will rise, fish will get cheaper in relative terms as the overall inflation rate is at 8-9 percent. Demand for other marine fish will fall, as shown by its negative price trend. Exports of fish will also rise rapidly, with an exception for other marine fish, as domestic supplies are diverted to foreign markets, while domestic demand that is also growing at a fairly rapid rate is met by imports.
145CHAPTER 8 | Projections
A critical development issue in Sri Lanka fisheries is the development of inland aquaculture that currently holds a miniscule share of output. Growth can happen here through faster technological change (implemented by a 0.6 percentage-point additional growth in the technology index), or through an area expansion (a scenario not analyzed in the other country models). The latter is implemented by an additional four percentage-point growth in firm entry into the industry. More rapid technological change does have a strong effect on the output of cultured species, but causes a contraction in some of the capture species, namely, demersals and other marine fish; thus, the overall growth is, in fact, slower under this scenario. The effects of posited area expansion on aquaculture growth are even stronger. The drop in demersals and other marine fish is faster, and even small pelagics suffer a contraction. Overall, demand growth is slower and price increases are faster under this scenario. Export growth led by cultured prawn is also higher than the average growth. Finally, moving to processing, the projection with HACCP compliance does impose a significant slowdown on exports, particularly of cultured prawn, followed by large pelagics. The overall output growth slows down while prices increase at a faster pace.
Thailand
Baseline projections for Thailand indicate a growth led by coastal and freshwater aquaculture, followed by inland capture fisheries (and remotely by marine capture fisheries). Top growth performers are freshwater fish, such as snakehead, silver barb, and tilapia; also doing well are prawn (cultured) and high-value marine fish (which is also partly cultured). Growth in demand is strongest for snakehead, silver barb, prawn, and processed freshwater fish; only catfish shows
signs of contracting demand, (corresponding to a contracting supply of the same magnitude). Most consumer prices of the various fish types rise faster than the posited inflation rate of 3.5 percent, except for tilapia, silver barb, and snakehead, which are the only fish types getting relatively cheaper over time. Exports are rising, particularly of tilapia, cultured shrimp, and high-value marine fish. However, growth in import of some marine fish is also high, indicating a need for Thailand to also seek for supply from outside the country. As domestic and foreign supplies are more than sufficient to meet demand, per capita consumption of most fish types rises throughout the period.
The promotion of low-value species raises the overall outputs from coastal and freshwater aquaculture. The species contributing to growth of coastal aquaculture are mainly low-value marine fish, and the growth of freshwater aquaculture is led by catfish, low-value freshwater fish, and prawn. Consumption of these fish types also rises, in line with lower price growth of these species. However, this scenario is not associated with an improvement in net trade. Besides, promotion of high-value aquaculture only reflects minor gains in production and consumption, but decelerates price growth, and exports.
A restriction on fishing effort (proxied by a ten-per cent increase in fuel cost both for inland and marine capture fisheries) causes a growth contraction in the overall fish output, although the contraction in the growth of capture species is to a large extent offset by the growth of culture species. The growth contraction also affects demand for and exports of capture species, although for some cultured fish (e.g., tilapia), the offsetting expansion of aquaculture ends up increasing export growth.
146 Strategies and Options for Increasing and Sustaining Fisheries and Aquaculture Production to Benefit Poorer Households in Asia
Finally, faster urbanization (1% faster growth in urban areas and only 0.5% faster growth in rural areas) does not cause dramatic changes for most of the growth trends, except for cephalopods, catfish, and processed fish. This may warrant further study on the robustness of the model to other alternative scenarios.
Vietnam
Baseline projections for output in Vietnam reveal a remarkable symmetry (all fish types increase by around 2.0%), which in part are due to the symmetry of the assumptions for the exogenous variables. Greater growth variations are observed for demand, price, and exports (there are no imports in the Vietnam model). Demand growth is highest for catfish and squid, and lowest for anchovy. Prices for four of the fish types rise faster than the general inflation rate (set very low at 0.5%), although absolute price reductions are forecasted for shrimp, tilapia, mollusks, anchovy, and processed fish. The fastest export growth is expected from shrimp, mollusks and anchovy, and the slowest, from squid.
Accelerating technical progress (one percentage point faster increase in the productivity index for catfish, tilapia, and other freshwater fish increases output growth for these fish types by about the same margin (except for other freshwater fish). Consumption and export are also faster, except for some marine capture species. Applying faster technical progress to brackishwater culture species (i.e., shrimp, and high-value fish) by the same magnitude makes only a minor impact on production, aggregate consumption, and aggregate exports. The same goes for a reduction in the marketing margin
and the impact of urbanization. The model is, therefore, robust, similar to the India model, and a straightforward partial equilibrium analysis generally works, at least for forecasting changes in production. Conclusion
In this study, it is found that income elasticities for fish products are positive; hence, rising populations and per capita incomes will ensure rising domestic demands. Global demand, a large part of which is contributed by developing Asia itself, will also continue to rise. Fish production must, therefore, also meet this rising demand. Markets regulate this supply-demand balance by a price system; its outcomes are largely determined by price responses on both supply and demand sides, which were also empirically examined by this study. The study conducts a simulation exercise using the AsiaFish model, covering the period 2005-2015, and confirms that, for the most part, supplies may indeed increase to meet this demand without painful increases in fish price, or decline in per capita consumption. The exceptions are Bangladesh and the Philippines, where consumption will apparently fall, probably due to consumers’ desire to diversify protein sources.
In general, trends in production and foreign trade will continue to rise, perhaps at a slower pace than in the previous decades when fisheries saw a spectacular and rapid transformation of supply and demand structures. As was the case, the bulk of the increased supply will originate from aquaculture on the assumption that capture fisheries will not collapse within the period.
Disaggregation of the simulation results confirms
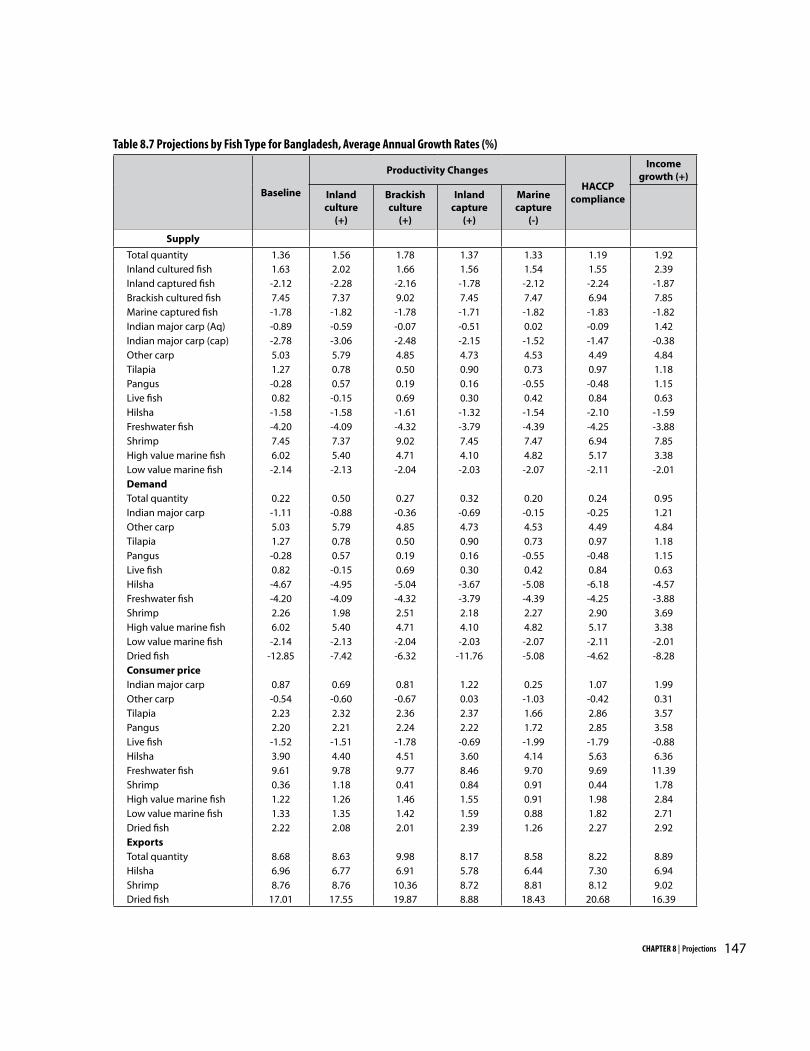
147CHAPTER 8 | Projections
Baseline
Productivity Changes
HACCP compliance
Income growth (+)
Inland culture
(+)
Brackish culture
(+)
Inland capture
(+)
Marine capture
(-)
Supply
Total quantity 1.36 1.56 1.78 1.37 1.33 1.19 1.92Inland cultured fish 1.63 2.02 1.66 1.56 1.54 1.55 2.39Inland captured fish -2.12 -2.28 -2.16 -1.78 -2.12 -2.24 -1.87Brackish cultured fish 7.45 7.37 9.02 7.45 7.47 6.94 7.85Marine captured fish -1.78 -1.82 -1.78 -1.71 -1.82 -1.83 -1.82Indian major carp (Aq) -0.89 -0.59 -0.07 -0.51 0.02 -0.09 1.42Indian major carp (cap) -2.78 -3.06 -2.48 -2.15 -1.52 -1.47 -0.38Other carp 5.03 5.79 4.85 4.73 4.53 4.49 4.84Tilapia 1.27 0.78 0.50 0.90 0.73 0.97 1.18Pangus -0.28 0.57 0.19 0.16 -0.55 -0.48 1.15Live fish 0.82 -0.15 0.69 0.30 0.42 0.84 0.63Hilsha -1.58 -1.58 -1.61 -1.32 -1.54 -2.10 -1.59Freshwater fish -4.20 -4.09 -4.32 -3.79 -4.39 -4.25 -3.88Shrimp 7.45 7.37 9.02 7.45 7.47 6.94 7.85High value marine fish 6.02 5.40 4.71 4.10 4.82 5.17 3.38Low value marine fish -2.14 -2.13 -2.04 -2.03 -2.07 -2.11 -2.01DemandTotal quantity 0.22 0.50 0.27 0.32 0.20 0.24 0.95Indian major carp -1.11 -0.88 -0.36 -0.69 -0.15 -0.25 1.21Other carp 5.03 5.79 4.85 4.73 4.53 4.49 4.84Tilapia 1.27 0.78 0.50 0.90 0.73 0.97 1.18Pangus -0.28 0.57 0.19 0.16 -0.55 -0.48 1.15Live fish 0.82 -0.15 0.69 0.30 0.42 0.84 0.63Hilsha -4.67 -4.95 -5.04 -3.67 -5.08 -6.18 -4.57Freshwater fish -4.20 -4.09 -4.32 -3.79 -4.39 -4.25 -3.88Shrimp 2.26 1.98 2.51 2.18 2.27 2.90 3.69High value marine fish 6.02 5.40 4.71 4.10 4.82 5.17 3.38Low value marine fish -2.14 -2.13 -2.04 -2.03 -2.07 -2.11 -2.01Dried fish -12.85 -7.42 -6.32 -11.76 -5.08 -4.62 -8.28Consumer price Indian major carp 0.87 0.69 0.81 1.22 0.25 1.07 1.99Other carp -0.54 -0.60 -0.67 0.03 -1.03 -0.42 0.31Tilapia 2.23 2.32 2.36 2.37 1.66 2.86 3.57Pangus 2.20 2.21 2.24 2.22 1.72 2.85 3.58Live fish -1.52 -1.51 -1.78 -0.69 -1.99 -1.79 -0.88Hilsha 3.90 4.40 4.51 3.60 4.14 5.63 6.36Freshwater fish 9.61 9.78 9.77 8.46 9.70 9.69 11.39Shrimp 0.36 1.18 0.41 0.84 0.91 0.44 1.78High value marine fish 1.22 1.26 1.46 1.55 0.91 1.98 2.84Low value marine fish 1.33 1.35 1.42 1.59 0.88 1.82 2.71Dried fish 2.22 2.08 2.01 2.39 1.26 2.27 2.92ExportsTotal quantity 8.68 8.63 9.98 8.17 8.58 8.22 8.89Hilsha 6.96 6.77 6.91 5.78 6.44 7.30 6.94Shrimp 8.76 8.76 10.36 8.72 8.81 8.12 9.02Dried fish 17.01 17.55 19.87 8.88 18.43 20.68 16.39
Table 8.7 Projections by Fish Type for Bangladesh, Average Annual Growth Rates (%)
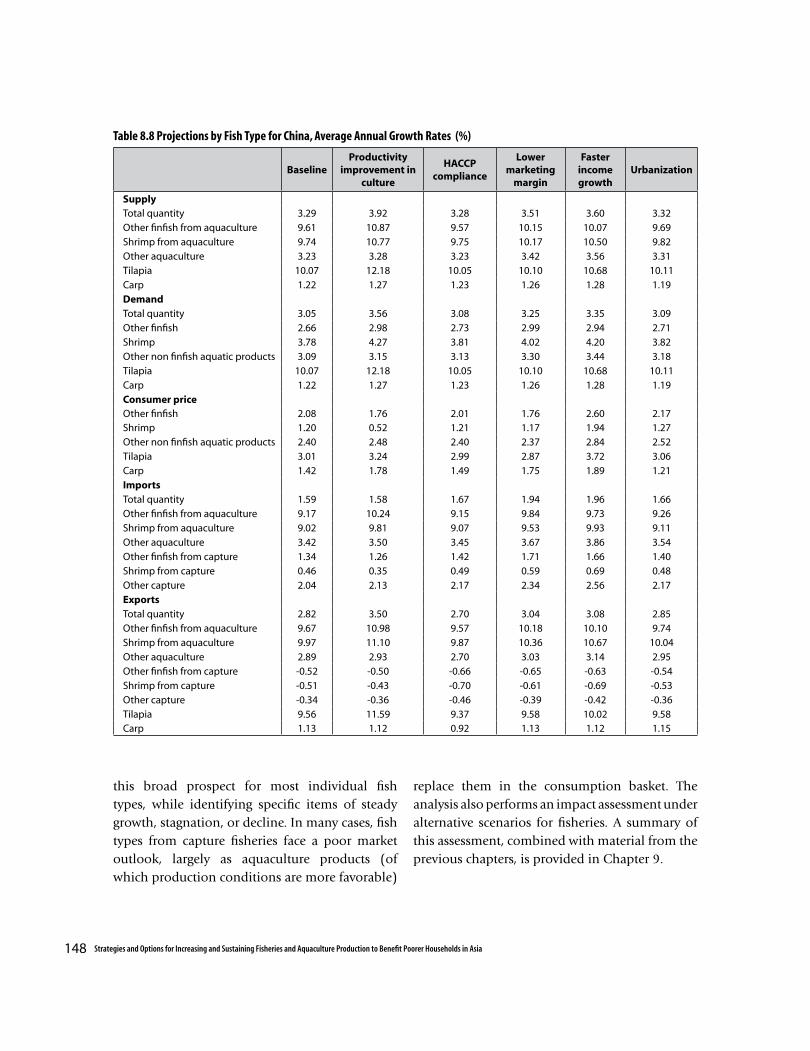
148 Strategies and Options for Increasing and Sustaining Fisheries and Aquaculture Production to Benefit Poorer Households in Asia
BaselineProductivity
improvement in culture
HACCP compliance
Lower marketing
margin
Fasterincome growth
Urbanization
SupplyTotal quantity 3.29 3.92 3.28 3.51 3.60 3.32Other finfish from aquaculture 9.61 10.87 9.57 10.15 10.07 9.69Shrimp from aquaculture 9.74 10.77 9.75 10.17 10.50 9.82Other aquaculture 3.23 3.28 3.23 3.42 3.56 3.31Tilapia 10.07 12.18 10.05 10.10 10.68 10.11Carp 1.22 1.27 1.23 1.26 1.28 1.19DemandTotal quantity 3.05 3.56 3.08 3.25 3.35 3.09Other finfish 2.66 2.98 2.73 2.99 2.94 2.71Shrimp 3.78 4.27 3.81 4.02 4.20 3.82Other non finfish aquatic products 3.09 3.15 3.13 3.30 3.44 3.18Tilapia 10.07 12.18 10.05 10.10 10.68 10.11Carp 1.22 1.27 1.23 1.26 1.28 1.19Consumer price Other finfish 2.08 1.76 2.01 1.76 2.60 2.17Shrimp 1.20 0.52 1.21 1.17 1.94 1.27Other non finfish aquatic products 2.40 2.48 2.40 2.37 2.84 2.52Tilapia 3.01 3.24 2.99 2.87 3.72 3.06Carp 1.42 1.78 1.49 1.75 1.89 1.21ImportsTotal quantity 1.59 1.58 1.67 1.94 1.96 1.66Other finfish from aquaculture 9.17 10.24 9.15 9.84 9.73 9.26Shrimp from aquaculture 9.02 9.81 9.07 9.53 9.93 9.11Other aquaculture 3.42 3.50 3.45 3.67 3.86 3.54Other finfish from capture 1.34 1.26 1.42 1.71 1.66 1.40Shrimp from capture 0.46 0.35 0.49 0.59 0.69 0.48Other capture 2.04 2.13 2.17 2.34 2.56 2.17ExportsTotal quantity 2.82 3.50 2.70 3.04 3.08 2.85Other finfish from aquaculture 9.67 10.98 9.57 10.18 10.10 9.74Shrimp from aquaculture 9.97 11.10 9.87 10.36 10.67 10.04Other aquaculture 2.89 2.93 2.70 3.03 3.14 2.95Other finfish from capture -0.52 -0.50 -0.66 -0.65 -0.63 -0.54Shrimp from capture -0.51 -0.43 -0.70 -0.61 -0.69 -0.53Other capture -0.34 -0.36 -0.46 -0.39 -0.42 -0.36Tilapia 9.56 11.59 9.37 9.58 10.02 9.58Carp 1.13 1.12 0.92 1.13 1.12 1.15
Table 8.8 Projections by Fish Type for China, Average Annual Growth Rates (%)
this broad prospect for most individual fish types, while identifying specific items of steady growth, stagnation, or decline. In many cases, fish types from capture fisheries face a poor market outlook, largely as aquaculture products (of which production conditions are more favorable)
replace them in the consumption basket. The analysis also performs an impact assessment under alternative scenarios for fisheries. A summary of this assessment, combined with material from the previous chapters, is provided in Chapter 9.
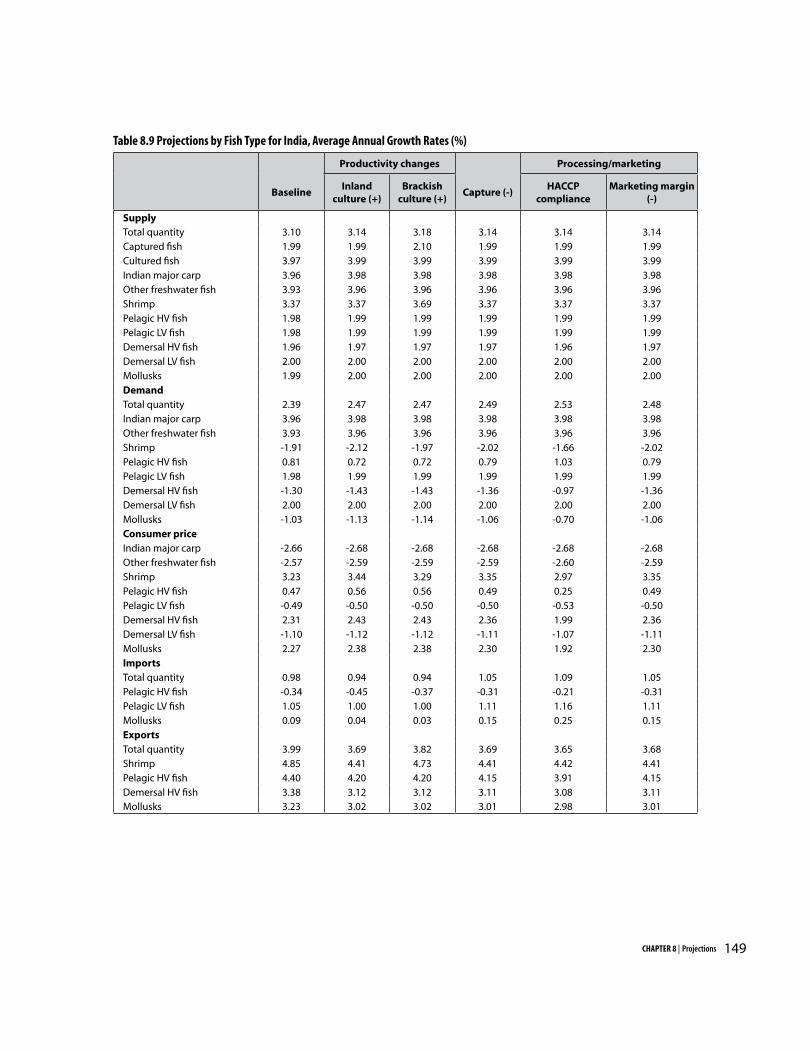
149CHAPTER 8 | Projections
Productivity changes Processing/marketing
BaselineInland
culture (+)Brackish
culture (+)Capture (-)
HACCP compliance
Marketing margin (-)
SupplyTotal quantity 3.10 3.14 3.18 3.14 3.14 3.14Captured fish 1.99 1.99 2.10 1.99 1.99 1.99Cultured fish 3.97 3.99 3.99 3.99 3.99 3.99Indian major carp 3.96 3.98 3.98 3.98 3.98 3.98Other freshwater fish 3.93 3.96 3.96 3.96 3.96 3.96Shrimp 3.37 3.37 3.69 3.37 3.37 3.37Pelagic HV fish 1.98 1.99 1.99 1.99 1.99 1.99Pelagic LV fish 1.98 1.99 1.99 1.99 1.99 1.99Demersal HV fish 1.96 1.97 1.97 1.97 1.96 1.97Demersal LV fish 2.00 2.00 2.00 2.00 2.00 2.00Mollusks 1.99 2.00 2.00 2.00 2.00 2.00DemandTotal quantity 2.39 2.47 2.47 2.49 2.53 2.48Indian major carp 3.96 3.98 3.98 3.98 3.98 3.98Other freshwater fish 3.93 3.96 3.96 3.96 3.96 3.96Shrimp -1.91 -2.12 -1.97 -2.02 -1.66 -2.02Pelagic HV fish 0.81 0.72 0.72 0.79 1.03 0.79Pelagic LV fish 1.98 1.99 1.99 1.99 1.99 1.99Demersal HV fish -1.30 -1.43 -1.43 -1.36 -0.97 -1.36Demersal LV fish 2.00 2.00 2.00 2.00 2.00 2.00Mollusks -1.03 -1.13 -1.14 -1.06 -0.70 -1.06Consumer price Indian major carp -2.66 -2.68 -2.68 -2.68 -2.68 -2.68Other freshwater fish -2.57 -2.59 -2.59 -2.59 -2.60 -2.59Shrimp 3.23 3.44 3.29 3.35 2.97 3.35Pelagic HV fish 0.47 0.56 0.56 0.49 0.25 0.49Pelagic LV fish -0.49 -0.50 -0.50 -0.50 -0.53 -0.50Demersal HV fish 2.31 2.43 2.43 2.36 1.99 2.36Demersal LV fish -1.10 -1.12 -1.12 -1.11 -1.07 -1.11Mollusks 2.27 2.38 2.38 2.30 1.92 2.30ImportsTotal quantity 0.98 0.94 0.94 1.05 1.09 1.05Pelagic HV fish -0.34 -0.45 -0.37 -0.31 -0.21 -0.31Pelagic LV fish 1.05 1.00 1.00 1.11 1.16 1.11Mollusks 0.09 0.04 0.03 0.15 0.25 0.15ExportsTotal quantity 3.99 3.69 3.82 3.69 3.65 3.68Shrimp 4.85 4.41 4.73 4.41 4.42 4.41Pelagic HV fish 4.40 4.20 4.20 4.15 3.91 4.15Demersal HV fish 3.38 3.12 3.12 3.11 3.08 3.11Mollusks 3.23 3.02 3.02 3.01 2.98 3.01
Table 8.9 Projections by Fish Type for India, Average Annual Growth Rates (%)
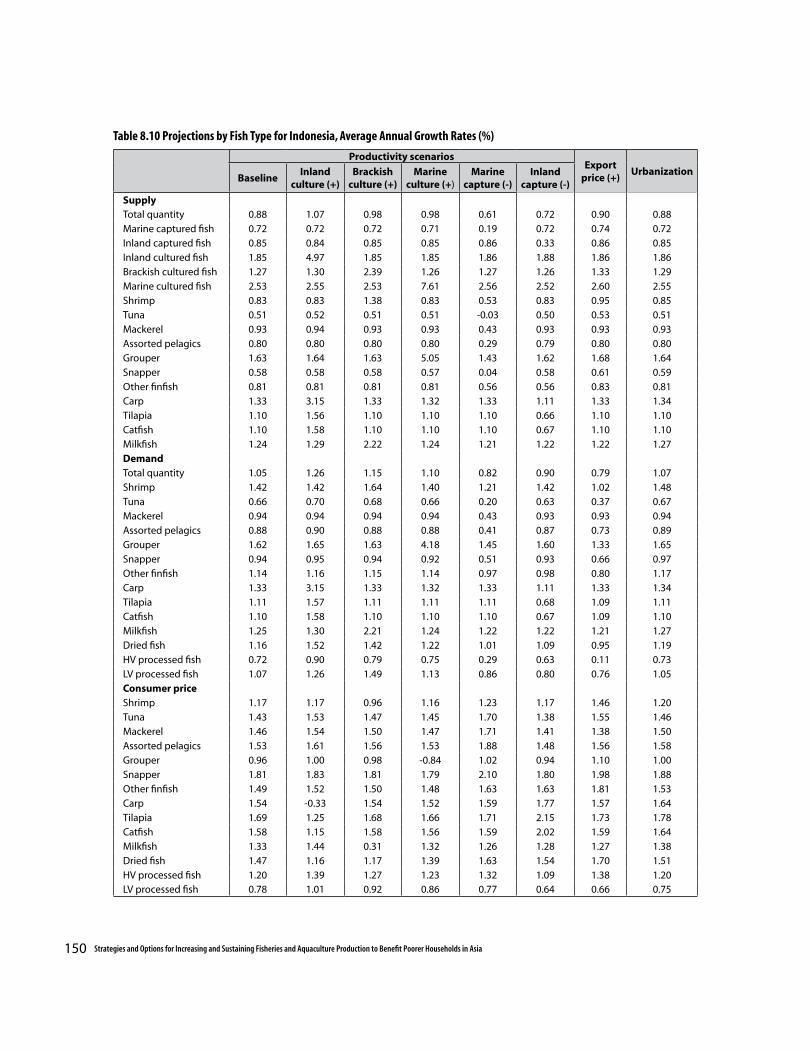
150 Strategies and Options for Increasing and Sustaining Fisheries and Aquaculture Production to Benefit Poorer Households in Asia
Productivity scenariosExport
price (+)Urbanization
BaselineInland
culture (+)Brackish
culture (+)Marine
culture (+)Marine
capture (-)Inland
capture (-)
SupplyTotal quantity 0.88 1.07 0.98 0.98 0.61 0.72 0.90 0.88Marine captured fish 0.72 0.72 0.72 0.71 0.19 0.72 0.74 0.72Inland captured fish 0.85 0.84 0.85 0.85 0.86 0.33 0.86 0.85Inland cultured fish 1.85 4.97 1.85 1.85 1.86 1.88 1.86 1.86Brackish cultured fish 1.27 1.30 2.39 1.26 1.27 1.26 1.33 1.29Marine cultured fish 2.53 2.55 2.53 7.61 2.56 2.52 2.60 2.55Shrimp 0.83 0.83 1.38 0.83 0.53 0.83 0.95 0.85Tuna 0.51 0.52 0.51 0.51 -0.03 0.50 0.53 0.51Mackerel 0.93 0.94 0.93 0.93 0.43 0.93 0.93 0.93Assorted pelagics 0.80 0.80 0.80 0.80 0.29 0.79 0.80 0.80Grouper 1.63 1.64 1.63 5.05 1.43 1.62 1.68 1.64Snapper 0.58 0.58 0.58 0.57 0.04 0.58 0.61 0.59Other finfish 0.81 0.81 0.81 0.81 0.56 0.56 0.83 0.81Carp 1.33 3.15 1.33 1.32 1.33 1.11 1.33 1.34Tilapia 1.10 1.56 1.10 1.10 1.10 0.66 1.10 1.10Catfish 1.10 1.58 1.10 1.10 1.10 0.67 1.10 1.10Milkfish 1.24 1.29 2.22 1.24 1.21 1.22 1.22 1.27DemandTotal quantity 1.05 1.26 1.15 1.10 0.82 0.90 0.79 1.07Shrimp 1.42 1.42 1.64 1.40 1.21 1.42 1.02 1.48Tuna 0.66 0.70 0.68 0.66 0.20 0.63 0.37 0.67Mackerel 0.94 0.94 0.94 0.94 0.43 0.93 0.93 0.94Assorted pelagics 0.88 0.90 0.88 0.88 0.41 0.87 0.73 0.89Grouper 1.62 1.65 1.63 4.18 1.45 1.60 1.33 1.65Snapper 0.94 0.95 0.94 0.92 0.51 0.93 0.66 0.97Other finfish 1.14 1.16 1.15 1.14 0.97 0.98 0.80 1.17Carp 1.33 3.15 1.33 1.32 1.33 1.11 1.33 1.34Tilapia 1.11 1.57 1.11 1.11 1.11 0.68 1.09 1.11Catfish 1.10 1.58 1.10 1.10 1.10 0.67 1.09 1.10Milkfish 1.25 1.30 2.21 1.24 1.22 1.22 1.21 1.27Dried fish 1.16 1.52 1.42 1.22 1.01 1.09 0.95 1.19HV processed fish 0.72 0.90 0.79 0.75 0.29 0.63 0.11 0.73LV processed fish 1.07 1.26 1.49 1.13 0.86 0.80 0.76 1.05Consumer price Shrimp 1.17 1.17 0.96 1.16 1.23 1.17 1.46 1.20Tuna 1.43 1.53 1.47 1.45 1.70 1.38 1.55 1.46Mackerel 1.46 1.54 1.50 1.47 1.71 1.41 1.38 1.50Assorted pelagics 1.53 1.61 1.56 1.53 1.88 1.48 1.56 1.58Grouper 0.96 1.00 0.98 -0.84 1.02 0.94 1.10 1.00Snapper 1.81 1.83 1.81 1.79 2.10 1.80 1.98 1.88Other finfish 1.49 1.52 1.50 1.48 1.63 1.63 1.81 1.53Carp 1.54 -0.33 1.54 1.52 1.59 1.77 1.57 1.64Tilapia 1.69 1.25 1.68 1.66 1.71 2.15 1.73 1.78Catfish 1.58 1.15 1.58 1.56 1.59 2.02 1.59 1.64Milkfish 1.33 1.44 0.31 1.32 1.26 1.28 1.27 1.38Dried fish 1.47 1.16 1.17 1.39 1.63 1.54 1.70 1.51HV processed fish 1.20 1.39 1.27 1.23 1.32 1.09 1.38 1.20LV processed fish 0.78 1.01 0.92 0.86 0.77 0.64 0.66 0.75
Table 8.10 Projections by Fish Type for Indonesia, Average Annual Growth Rates (%)
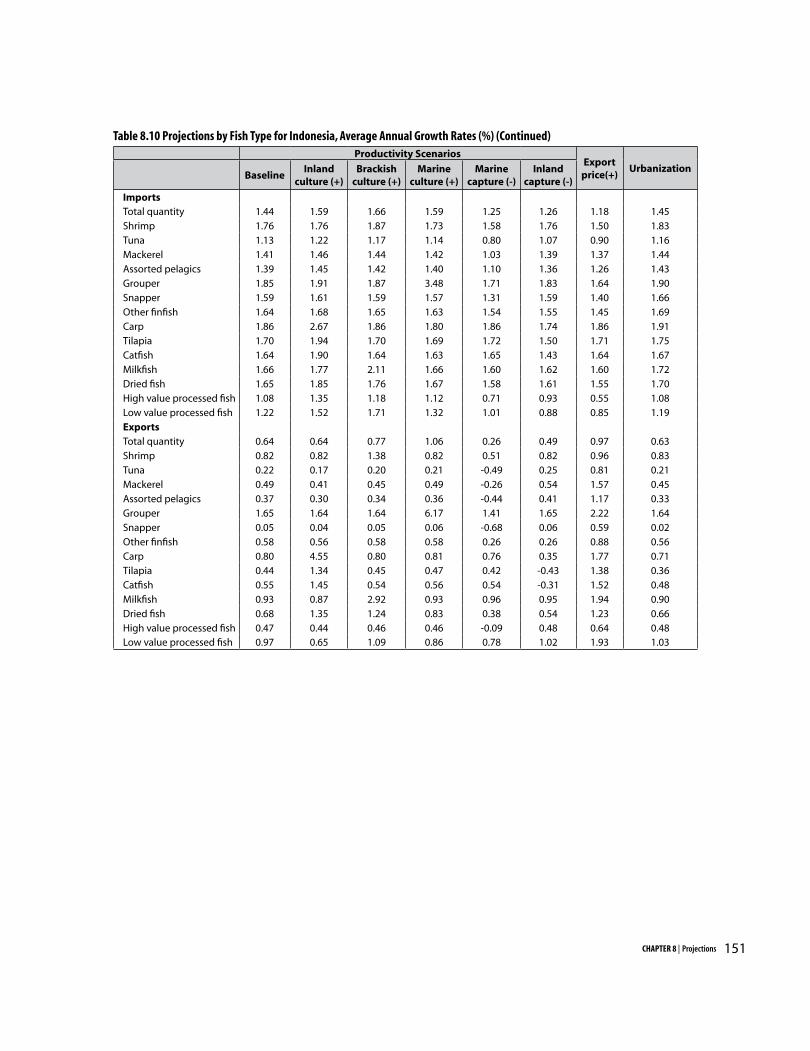
151CHAPTER 8 | Projections
Productivity ScenariosExport
price(+)Urbanization
BaselineInland
culture (+)Brackish
culture (+)Marine
culture (+)Marine
capture (-)Inland
capture (-)
ImportsTotal quantity 1.44 1.59 1.66 1.59 1.25 1.26 1.18 1.45Shrimp 1.76 1.76 1.87 1.73 1.58 1.76 1.50 1.83Tuna 1.13 1.22 1.17 1.14 0.80 1.07 0.90 1.16Mackerel 1.41 1.46 1.44 1.42 1.03 1.39 1.37 1.44Assorted pelagics 1.39 1.45 1.42 1.40 1.10 1.36 1.26 1.43Grouper 1.85 1.91 1.87 3.48 1.71 1.83 1.64 1.90Snapper 1.59 1.61 1.59 1.57 1.31 1.59 1.40 1.66Other finfish 1.64 1.68 1.65 1.63 1.54 1.55 1.45 1.69Carp 1.86 2.67 1.86 1.80 1.86 1.74 1.86 1.91Tilapia 1.70 1.94 1.70 1.69 1.72 1.50 1.71 1.75Catfish 1.64 1.90 1.64 1.63 1.65 1.43 1.64 1.67Milkfish 1.66 1.77 2.11 1.66 1.60 1.62 1.60 1.72Dried fish 1.65 1.85 1.76 1.67 1.58 1.61 1.55 1.70High value processed fish 1.08 1.35 1.18 1.12 0.71 0.93 0.55 1.08Low value processed fish 1.22 1.52 1.71 1.32 1.01 0.88 0.85 1.19ExportsTotal quantity 0.64 0.64 0.77 1.06 0.26 0.49 0.97 0.63Shrimp 0.82 0.82 1.38 0.82 0.51 0.82 0.96 0.83Tuna 0.22 0.17 0.20 0.21 -0.49 0.25 0.81 0.21Mackerel 0.49 0.41 0.45 0.49 -0.26 0.54 1.57 0.45Assorted pelagics 0.37 0.30 0.34 0.36 -0.44 0.41 1.17 0.33Grouper 1.65 1.64 1.64 6.17 1.41 1.65 2.22 1.64Snapper 0.05 0.04 0.05 0.06 -0.68 0.06 0.59 0.02Other finfish 0.58 0.56 0.58 0.58 0.26 0.26 0.88 0.56Carp 0.80 4.55 0.80 0.81 0.76 0.35 1.77 0.71Tilapia 0.44 1.34 0.45 0.47 0.42 -0.43 1.38 0.36Catfish 0.55 1.45 0.54 0.56 0.54 -0.31 1.52 0.48Milkfish 0.93 0.87 2.92 0.93 0.96 0.95 1.94 0.90Dried fish 0.68 1.35 1.24 0.83 0.38 0.54 1.23 0.66High value processed fish 0.47 0.44 0.46 0.46 -0.09 0.48 0.64 0.48Low value processed fish 0.97 0.65 1.09 0.86 0.78 1.02 1.93 1.03
Table 8.10 Projections by Fish Type for Indonesia, Average Annual Growth Rates (%) (Continued)
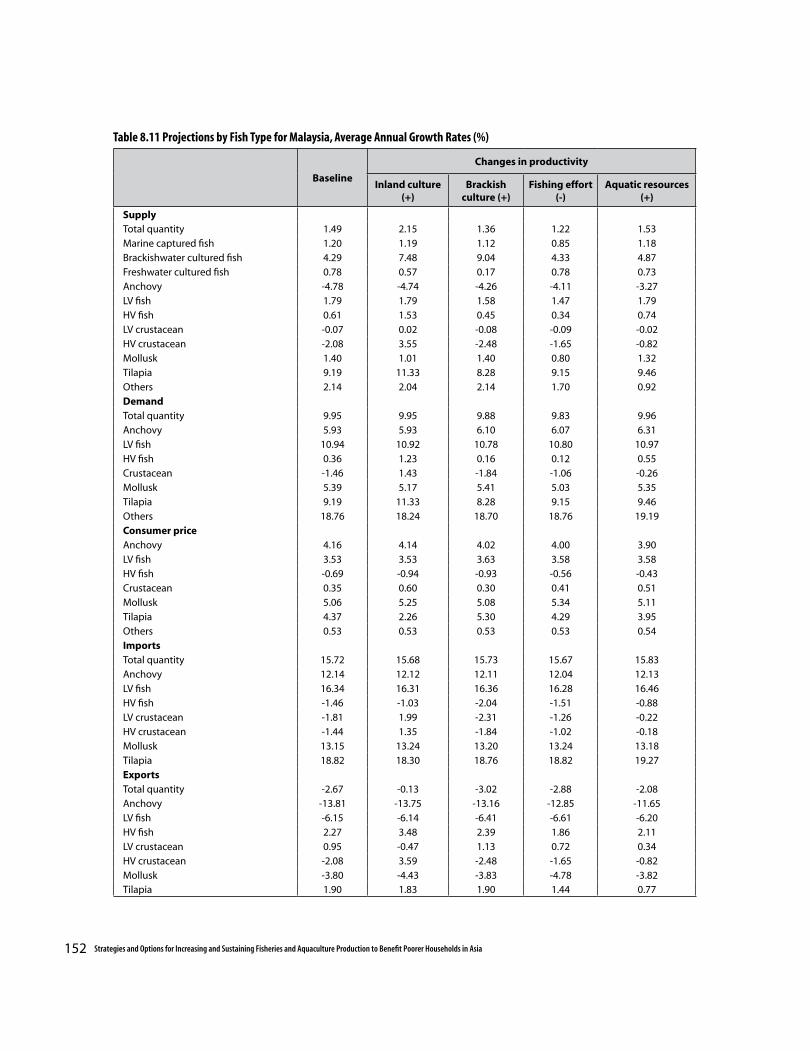
152 Strategies and Options for Increasing and Sustaining Fisheries and Aquaculture Production to Benefit Poorer Households in Asia
Baseline
Changes in productivity
Inland culture (+)
Brackish culture (+)
Fishing effort (-)
Aquatic resources (+)
SupplyTotal quantity 1.49 2.15 1.36 1.22 1.53Marine captured fish 1.20 1.19 1.12 0.85 1.18Brackishwater cultured fish 4.29 7.48 9.04 4.33 4.87Freshwater cultured fish 0.78 0.57 0.17 0.78 0.73Anchovy -4.78 -4.74 -4.26 -4.11 -3.27LV fish 1.79 1.79 1.58 1.47 1.79HV fish 0.61 1.53 0.45 0.34 0.74LV crustacean -0.07 0.02 -0.08 -0.09 -0.02HV crustacean -2.08 3.55 -2.48 -1.65 -0.82Mollusk 1.40 1.01 1.40 0.80 1.32Tilapia 9.19 11.33 8.28 9.15 9.46Others 2.14 2.04 2.14 1.70 0.92DemandTotal quantity 9.95 9.95 9.88 9.83 9.96Anchovy 5.93 5.93 6.10 6.07 6.31LV fish 10.94 10.92 10.78 10.80 10.97HV fish 0.36 1.23 0.16 0.12 0.55Crustacean -1.46 1.43 -1.84 -1.06 -0.26Mollusk 5.39 5.17 5.41 5.03 5.35Tilapia 9.19 11.33 8.28 9.15 9.46Others 18.76 18.24 18.70 18.76 19.19Consumer price Anchovy 4.16 4.14 4.02 4.00 3.90LV fish 3.53 3.53 3.63 3.58 3.58HV fish -0.69 -0.94 -0.93 -0.56 -0.43Crustacean 0.35 0.60 0.30 0.41 0.51Mollusk 5.06 5.25 5.08 5.34 5.11Tilapia 4.37 2.26 5.30 4.29 3.95Others 0.53 0.53 0.53 0.53 0.54ImportsTotal quantity 15.72 15.68 15.73 15.67 15.83Anchovy 12.14 12.12 12.11 12.04 12.13LV fish 16.34 16.31 16.36 16.28 16.46HV fish -1.46 -1.03 -2.04 -1.51 -0.88LV crustacean -1.81 1.99 -2.31 -1.26 -0.22HV crustacean -1.44 1.35 -1.84 -1.02 -0.18Mollusk 13.15 13.24 13.20 13.24 13.18Tilapia 18.82 18.30 18.76 18.82 19.27ExportsTotal quantity -2.67 -0.13 -3.02 -2.88 -2.08Anchovy -13.81 -13.75 -13.16 -12.85 -11.65LV fish -6.15 -6.14 -6.41 -6.61 -6.20HV fish 2.27 3.48 2.39 1.86 2.11LV crustacean 0.95 -0.47 1.13 0.72 0.34HV crustacean -2.08 3.59 -2.48 -1.65 -0.82Mollusk -3.80 -4.43 -3.83 -4.78 -3.82Tilapia 1.90 1.83 1.90 1.44 0.77
Table 8.11 Projections by Fish Type for Malaysia, Average Annual Growth Rates (%)
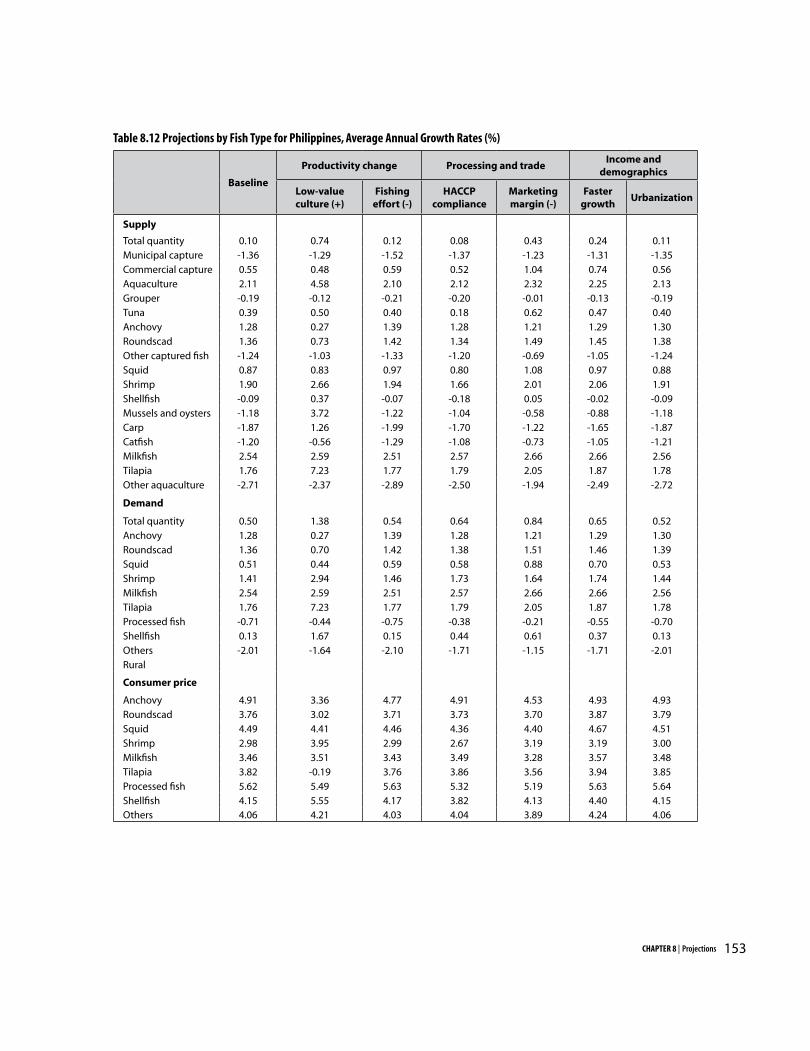
153CHAPTER 8 | Projections
Baseline
Productivity change Processing and tradeIncome and
demographics
Low-value culture (+)
Fishing effort (-)
HACCP compliance
Marketing margin (-)
Faster growth
Urbanization
Supply
Total quantity 0.10 0.74 0.12 0.08 0.43 0.24 0.11Municipal capture -1.36 -1.29 -1.52 -1.37 -1.23 -1.31 -1.35Commercial capture 0.55 0.48 0.59 0.52 1.04 0.74 0.56Aquaculture 2.11 4.58 2.10 2.12 2.32 2.25 2.13Grouper -0.19 -0.12 -0.21 -0.20 -0.01 -0.13 -0.19Tuna 0.39 0.50 0.40 0.18 0.62 0.47 0.40Anchovy 1.28 0.27 1.39 1.28 1.21 1.29 1.30Roundscad 1.36 0.73 1.42 1.34 1.49 1.45 1.38Other captured fish -1.24 -1.03 -1.33 -1.20 -0.69 -1.05 -1.24Squid 0.87 0.83 0.97 0.80 1.08 0.97 0.88Shrimp 1.90 2.66 1.94 1.66 2.01 2.06 1.91Shellfish -0.09 0.37 -0.07 -0.18 0.05 -0.02 -0.09Mussels and oysters -1.18 3.72 -1.22 -1.04 -0.58 -0.88 -1.18Carp -1.87 1.26 -1.99 -1.70 -1.22 -1.65 -1.87Catfish -1.20 -0.56 -1.29 -1.08 -0.73 -1.05 -1.21Milkfish 2.54 2.59 2.51 2.57 2.66 2.66 2.56Tilapia 1.76 7.23 1.77 1.79 2.05 1.87 1.78Other aquaculture -2.71 -2.37 -2.89 -2.50 -1.94 -2.49 -2.72
Demand
Total quantity 0.50 1.38 0.54 0.64 0.84 0.65 0.52Anchovy 1.28 0.27 1.39 1.28 1.21 1.29 1.30Roundscad 1.36 0.70 1.42 1.38 1.51 1.46 1.39Squid 0.51 0.44 0.59 0.58 0.88 0.70 0.53Shrimp 1.41 2.94 1.46 1.73 1.64 1.74 1.44Milkfish 2.54 2.59 2.51 2.57 2.66 2.66 2.56Tilapia 1.76 7.23 1.77 1.79 2.05 1.87 1.78Processed fish -0.71 -0.44 -0.75 -0.38 -0.21 -0.55 -0.70Shellfish 0.13 1.67 0.15 0.44 0.61 0.37 0.13Others -2.01 -1.64 -2.10 -1.71 -1.15 -1.71 -2.01Rural
Consumer price
Anchovy 4.91 3.36 4.77 4.91 4.53 4.93 4.93Roundscad 3.76 3.02 3.71 3.73 3.70 3.87 3.79Squid 4.49 4.41 4.46 4.36 4.40 4.67 4.51Shrimp 2.98 3.95 2.99 2.67 3.19 3.19 3.00Milkfish 3.46 3.51 3.43 3.49 3.28 3.57 3.48Tilapia 3.82 -0.19 3.76 3.86 3.56 3.94 3.85Processed fish 5.62 5.49 5.63 5.32 5.19 5.63 5.64Shellfish 4.15 5.55 4.17 3.82 4.13 4.40 4.15Others 4.06 4.21 4.03 4.04 3.89 4.24 4.06
Table 8.12 Projections by Fish Type for Philippines, Average Annual Growth Rates (%)

154 Strategies and Options for Increasing and Sustaining Fisheries and Aquaculture Production to Benefit Poorer Households in Asia
Baseline
Productivity change Processing and tradeIncome and
demographics
Low-value culture (+)
Fishing effort (-)
HACCP compliance
Marketing margin (-)
Faster growth
Urbaniza-tion
Low-value culture
(+)Imports
Total quantity -3.85 -3.44 -3.83 -3.91 -3.62 -2.65 -3.42 -3.84
Tuna -3.60 -3.14 -3.56 -3.70 -3.35 -2.46 -3.20 -3.59
Roundscad -2.10 -2.99 -2.10 -1.48 -2.10 -1.32 -1.32 -2.10
Other captured fish -4.58 -4.03 -4.53 -4.69 -4.27 -3.20 -4.10 -4.58
Squid -1.72 -1.87 -1.81 -1.67 -1.77 -0.99 -1.35 -1.68
Shrimp -2.40 0.09 -2.56 -2.34 -2.43 -2.04 -1.87 -2.35
Other shellfish -2.51 0.60 -2.74 -2.47 -2.56 -1.52 -2.02 -2.51
Mussels and oysters -0.91 -1.36 -1.10 -0.81 -0.75 -0.09 -0.50 -0.91
Carp -4.66 -6.22 -4.66 -3.97 -4.66 -3.41 -4.66 -4.66
Milkfish -0.88 -0.88 -0.65 -0.88 -0.88
-0.65 -0.65 -0.88
Tilapia -1.32 -0.63 -1.32 -1.32 -1.32 -0.63 -1.32 -1.32
Processed fish 1.14 1.28 1.18 1.11 1.16 1.81 1.32 1.18
Exports
Total quantity 0.24 0.43 0.46 0.27 -0.34 0.36 0.30 0.24
Grouper 1.14 0.94 1.13 1.24 0.54 0.60 0.96 1.14
Tuna 0.43 0.51 0.43 0.44 0.15 0.62 0.49 0.43
Roundscad 1.10 1.52 1.12 1.24 -0.31 1.00 1.04 1.08
Other captured fish -1.03 -1.14 -1.04 -1.09 -2.27 -1.30 -1.12 -1.03
Squid 0.31 0.38 0.35 0.44 -0.83 -0.01 0.15 0.29
Shrimp 2.30 2.39 3.63 2.33 1.59 2.32 2.33 2.30
Other shellfish -0.41 -1.41 -0.34 -0.41 -1.03 -0.69 -0.54 -0.41
Mussels and oysters -5.53 6.58 -5.53 -5.53 -5.53 -5.53 -5.53 -5.53
Carp -2.16 9.31 -2.16 -2.25 -3.71 -2.89 -2.36 -2.16
Catfish 0.61 1.92 0.61 0.68 -0.99 -0.64 0.01 0.61
Milkfish 2.72 2.70 2.71 2.74 1.22 2.66 2.67 2.71
Tilapia 1.37 13.35 1.37 1.53 -0.07 1.20 1.31 1.37
Processed fish -0.56 -0.10 -0.51 -0.60 -1.21 -0.27 -0.42 -0.58
Table 8.12 Projections by Fish Type for Philippines, Average Annual Growth Rates (%) (Continued)

155CHAPTER 8 | Projections
Productivity and Area Change
HACCP ComplianceBaseline Inland Culture (+)
Culture Area(+)
Supply
Total quantity 3.57 3.31 3.30 2.70
Marine captured fish 3.60 3.28 3.15 2.63
Inland captured fish 3.08 3.15 3.01 3.04
Cultured fish 4.38 5.09 8.20 3.84
Large pelagic fish 4.74 5.03 5.48 4.72
Small pelagic fish 2.56 0.94 -1.44 -0.56
Demersal fish 1.70 -1.87 -2.95 -6.12
Other marine fish 0.19 -0.05 -1.49 -1.00
Cultured prawn 4.34 5.05 8.15 3.78
Freshwater fish 3.11 3.18 3.10 3.06
Demand
Total quantity 3.91 3.68 3.36 3.49
Large pelagic fish 2.35 1.73 1.96 2.00
Small pelagic fish 3.54 2.92 1.08 2.19
Demersal fish 0.68 -1.70 -0.69 -3.68
Other marine fish -6.65 -6.99 -9.56 -6.56
Freshwater fish 3.57 3.86 3.12 4.16
Processed fish 5.31 5.34 5.47 5.17
Consumer price
Large pelagic fish 2.29 3.04 3.15 3.41
Small pelagic fish 1.07 0.88 0.69 0.60
Demersal fish 4.21 3.84 2.64 1.80
Other marine fish -1.32 -2.04 -3.64 -1.94
Freshwater fish 3.61 3.61 3.72 2.72
Processed fish 1.57 1.60 1.59 1.62
Imports
Total quantity 7.32 7.47 7.57 7.37
Large pelagic fish 6.78 8.89 9.54 10.54
Processed fish 7.32 7.46 7.56 7.35
Exports
Total quantity 4.69 4.14 5.13 2.91
Large pelagic fish 5.46 4.41 4.58 3.50
Other marine fish -1.83 -1.83 -3.75 -1.42
Cultured prawn 4.32 5.04 7.62 2.91
Table 8.13 Projections by Fish Type for Sri Lanka, Average Annual Growth Rates (%)
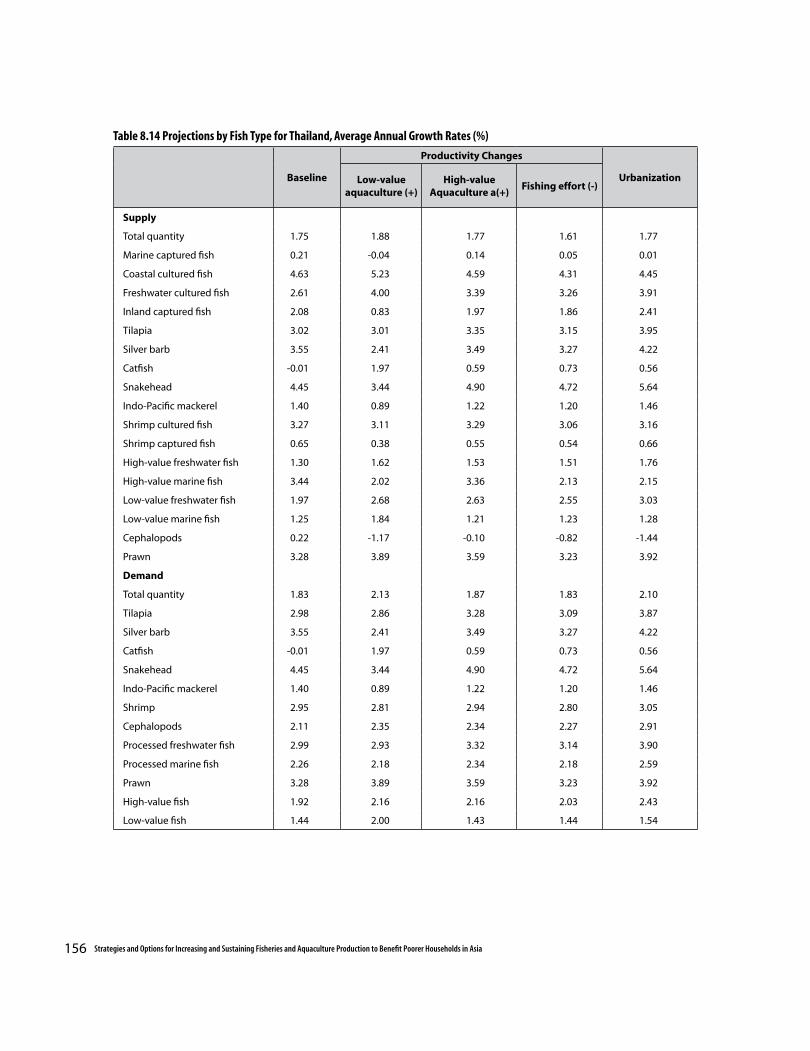
156 Strategies and Options for Increasing and Sustaining Fisheries and Aquaculture Production to Benefit Poorer Households in Asia
Baseline
Productivity Changes
UrbanizationLow-value aquaculture (+)
High-value Aquaculture a(+)
Fishing effort (-)
Supply
Total quantity 1.75 1.88 1.77 1.61 1.77
Marine captured fish 0.21 -0.04 0.14 0.05 0.01
Coastal cultured fish 4.63 5.23 4.59 4.31 4.45
Freshwater cultured fish 2.61 4.00 3.39 3.26 3.91
Inland captured fish 2.08 0.83 1.97 1.86 2.41
Tilapia 3.02 3.01 3.35 3.15 3.95
Silver barb 3.55 2.41 3.49 3.27 4.22
Catfish -0.01 1.97 0.59 0.73 0.56
Snakehead 4.45 3.44 4.90 4.72 5.64
Indo-Pacific mackerel 1.40 0.89 1.22 1.20 1.46
Shrimp cultured fish 3.27 3.11 3.29 3.06 3.16
Shrimp captured fish 0.65 0.38 0.55 0.54 0.66
High-value freshwater fish 1.30 1.62 1.53 1.51 1.76
High-value marine fish 3.44 2.02 3.36 2.13 2.15
Low-value freshwater fish 1.97 2.68 2.63 2.55 3.03
Low-value marine fish 1.25 1.84 1.21 1.23 1.28
Cephalopods 0.22 -1.17 -0.10 -0.82 -1.44
Prawn 3.28 3.89 3.59 3.23 3.92
Demand
Total quantity 1.83 2.13 1.87 1.83 2.10
Tilapia 2.98 2.86 3.28 3.09 3.87
Silver barb 3.55 2.41 3.49 3.27 4.22
Catfish -0.01 1.97 0.59 0.73 0.56
Snakehead 4.45 3.44 4.90 4.72 5.64
Indo-Pacific mackerel 1.40 0.89 1.22 1.20 1.46
Shrimp 2.95 2.81 2.94 2.80 3.05
Cephalopods 2.11 2.35 2.34 2.27 2.91
Processed freshwater fish 2.99 2.93 3.32 3.14 3.90
Processed marine fish 2.26 2.18 2.34 2.18 2.59
Prawn 3.28 3.89 3.59 3.23 3.92
High-value fish 1.92 2.16 2.16 2.03 2.43
Low-value fish 1.44 2.00 1.43 1.44 1.54
Table 8.14 Projections by Fish Type for Thailand, Average Annual Growth Rates (%)
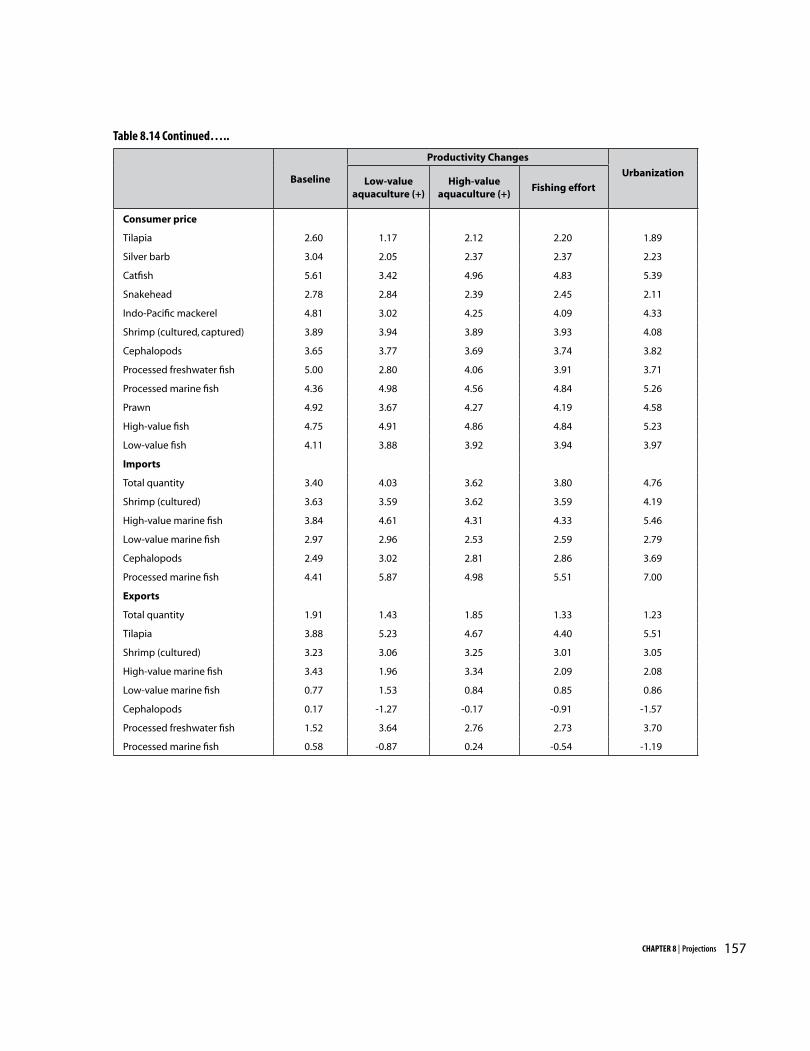
157CHAPTER 8 | Projections
Baseline
Productivity Changes
UrbanizationLow-value
aquaculture (+)High-value
aquaculture (+)Fishing effort
Consumer price
Tilapia 2.60 1.17 2.12 2.20 1.89
Silver barb 3.04 2.05 2.37 2.37 2.23
Catfish 5.61 3.42 4.96 4.83 5.39
Snakehead 2.78 2.84 2.39 2.45 2.11
Indo-Pacific mackerel 4.81 3.02 4.25 4.09 4.33
Shrimp (cultured, captured) 3.89 3.94 3.89 3.93 4.08
Cephalopods 3.65 3.77 3.69 3.74 3.82
Processed freshwater fish 5.00 2.80 4.06 3.91 3.71
Processed marine fish 4.36 4.98 4.56 4.84 5.26
Prawn 4.92 3.67 4.27 4.19 4.58
High-value fish 4.75 4.91 4.86 4.84 5.23
Low-value fish 4.11 3.88 3.92 3.94 3.97
Imports
Total quantity 3.40 4.03 3.62 3.80 4.76
Shrimp (cultured) 3.63 3.59 3.62 3.59 4.19
High-value marine fish 3.84 4.61 4.31 4.33 5.46
Low-value marine fish 2.97 2.96 2.53 2.59 2.79
Cephalopods 2.49 3.02 2.81 2.86 3.69
Processed marine fish 4.41 5.87 4.98 5.51 7.00
Exports
Total quantity 1.91 1.43 1.85 1.33 1.23
Tilapia 3.88 5.23 4.67 4.40 5.51
Shrimp (cultured) 3.23 3.06 3.25 3.01 3.05
High-value marine fish 3.43 1.96 3.34 2.09 2.08
Low-value marine fish 0.77 1.53 0.84 0.85 0.86
Cephalopods 0.17 -1.27 -0.17 -0.91 -1.57
Processed freshwater fish 1.52 3.64 2.76 2.73 3.70
Processed marine fish 0.58 -0.87 0.24 -0.54 -1.19
Table 8.14 Continued…..

158 Strategies and Options for Increasing and Sustaining Fisheries and Aquaculture Production to Benefit Poorer Households in Asia
Baseline
Productivity Changes
Margin (-) UrbanizationInland culture (+)
Brackish culture (+)
Supply
Total quantity 2.03 2.19 2.03 2.03 2.03
Captured fish 2.01 2.01 2.01 2.01 2.01
Cultured fish 2.01 2.65 2.01 2.01 2.01
Catfish 2.01 3.02 2.01 2.01 2.01
Shrimp 2.21 2.21 2.21 2.21 2.21
Tilapia 1.98 3.01 1.98 1.98 1.98
Mollusk 2.01 2.02 2.01 2.01 2.01
Squid 2.01 2.01 2.01 2.01 2.01
High-value marine fish 2.01 2.01 2.01 2.01 2.01
Low-value marine fish 2.01 2.01 2.01 2.01 2.01
Anchovy 2.01 2.01 2.01 2.01 2.01
Other freshwater fish 2.01 2.53 2.01 2.01 2.01
Demand
Total quantity 1.93 2.06 1.93 1.92 1.92
Catfish 2.23 2.58 2.23 1.97 2.08
Shrimp 1.46 1.53 1.46 1.54 1.49
Tilapia 1.98 3.01 1.98 1.98 1.98
Mollusk 1.18 1.55 1.18 1.43 1.31
Squid 2.14 2.03 2.14 2.06 2.07
High-value marine fish 1.62 1.56 1.62 1.50 1.58
Low-value marine fish 1.99 1.92 1.99 1.98 1.97
Anchovy 1.03 0.76 1.03 1.13 1.06
Other freshwater fish 2.01 2.53 2.01 2.01 2.01
Processed fish 2.01 2.01 2.01 2.01 2.01
Consumer price
Catfish 1.15 0.41 1.15 0.85 0.98
Shrimp -0.30 -0.21 -0.30 -0.20 -0.26
Tilapia -0.08 -0.38 -0.08 0.11 -0.03
Mollusk -0.91 -0.29 -0.91 -0.48 -0.69
Squid 1.13 0.79 1.13 0.86 0.92
High-value marine fish 0.09 0.01 0.09 -0.06 0.04
Low-value marine fish 0.52 0.20 0.52 0.49 0.42
Anchovy -0.56 -0.90 -0.56 -0.41 -0.51
Other freshwater fish 1.13 0.64 1.13 0.90 0.92
Processed fish -0.37 -0.33 -0.37 -0.34 -0.34
Exports
Total quantity 2.23 2.44 2.23 2.24 2.24
Catfish 1.98 3.08 1.98 2.02 2.00
Shrimp 2.52 2.49 2.52 2.49 2.51
Mollusk 2.73 2.47 2.73 2.55 2.64
Squid 1.72 1.95 1.72 1.91 1.87
High-value marine fish 2.11 2.13 2.11 2.14 2.12
Low-value marine fish 2.12 2.39 2.12 2.15 2.20
Anchovy 2.48 2.57 2.48 2.44 2.47
Table 8.15 Projections by Fish Type for Vietnam, Average Annual Growth Rates (%)

159CHAPTER 9 | Impacts of Various Technology and Policy Options
Introduction
The simulations conducted in the previous chapter are based on assumed shifts in the exogenous variables. These changes, however, do not occur in a vacuum, but are attributable to actual technology and policy interventions. This chapter takes a more detailed look at the story behind the numbers in the previous chapters to assess the potential impacts of various technology and policy options for fisheries development in the developing member countries.
Dimensions of assessment and the menu of options
The assessment will be based on economic, social, and environmental impacts. Economic impact at the micro-level depends on both profitability and return on investment. The latter is an important factor determining the scale of activity, as poor farmers lack access to resources (such as credit) for large-scale undertakings; so they must operate at the levels of investment within their reach. Export performance is also a good indicator of economic returns, given the need for foreign exchange, as well as the relatively high prices commanded by export products. The long-term market outlook becomes a critical element in the evaluation of potential economic impact at the national level.
Social and environmental impacts are additional dimensions of assessment. Social considerations
dictate a preference for pro-poor technologies and policies, to enable the poor to improve their standards of living, as well as to maintain equity in the distribution of benefits. Environmental criteria cover the long-term ecological sustainability of production activities and factor in values not typically incorporated in market prices (i.e., externalities), such as pollution and the destruction of aquatic habitats.
These dimensions of assessment can be applied to a large set of options for technology, management, and policy support. Not all of these options are mutually exclusive. However, given that exercise of each option entails commitment of resources, options must be carefully prioritized within a coherent strategy, based on a solid assessment of prospective impact. In the following analysis, the menu of options is summarized in broad categories distinguishable by options for aquaculture, capture fisheries, and upstream-downstream activities.
Aquaculture technologies may be distinguished by production environment, i.e., freshwater versus brackishwater and marine. Within each environment, technology options may be categorized by species, system (e.g., polyculture, monoculture, or integrated), intensity (extensive, semi-intensive, intensive), and by approach (i.e., dissemination of existing technology, or of new technologies through research and development [R & D]).
Chapter 9
THE POTENTIAL IMPACTS OF VARIOUS TECHNOLOGY AND POLICY OPTIONS
160 Strategies and Options for Increasing and Sustaining Fisheries and Aquaculture Production to Benefit Poorer Households in Asia
Finally, policy and production support, governing the use and development of natural resources (land, water, stocks of wild fry, etc.), capital provision, and market incentives, are also options that can prove to be pivotal in the promotion of aquaculture. For example, tariffs on fish meal used in aquaculture may generate public revenues but put a drag on aquaculture growth.
On the capture side, options can again be distinguished by environment (inland versus marine). Capture technologies can be categorized by gear type and vessel, and fishing area (inshore versus offshore, reservoirs and lakes versus rivers). Technology options also cover resource enhancement measures, such as restocking, artificial reefs, sea ranching, and so on.
The common pool nature of natural fish stocks makes the exercise of resource management a more critical factor in capture fisheries than in aquaculture. Management options cover access and use rights regimes and institutional arrangements. Use rights include open access, group-specific rights, and private ownership. These rights are administered under various institutional arrangements, ranging from command and control to reliance on user organizations under co-management or community-based management options. Exercise of state authority can remain in the hands of the national or federal government, or be decentralized to various levels of local administration.
Part of the menu of options is the set of support measures directed at the upstream and downstream activities. Aquaculture support options are diverse. These can be directed to the forward and backward linkages of the industry, that is, backward into the development of input
systems for seeds and feeds, or forward into the processing and marketing sectors. These linked sectors in turn have their respective technologies for which alternative approaches (dissemination versus R & D) are again relevant. Infrastructure support is a key ingredient in ensuring that the entire supply chain is connected, stable, and well-coordinated: for example, roads linking fishponds to markets (input or output) should exist and be maintained in good condition, port facilities and landing stations should be set up and adequate, and so on.
Freshwater aquaculture
Outlook under most likely and alternative scenarios
Within aquaculture, freshwater species account for the bulk of output, producing mostly low-value fish. This will remain true over the next 15 years. However, other freshwater culture species are expected to become prominent, introducing a much-needed diversification. This is true for carps other than Indian major carps in Bangladesh, tilapia in China and Malaysia, and snakehead and silver barb in Thailand. In other cases, traditional species remain primary, e.g., Indian major carp in India.
Technological change in freshwater or low-value aquaculture is likely to have a positive impact on the total production and consumption. The exception among the nine countries is Sri Lanka, due to the substitution effects on capture species. For the other countries, the growth could be substantial: for instance, output expansion accelerates from 1.49 to 2.15 percent in Malaysia. With more rapid technological change, the rise of new species continues to hold true. A similar
161CHAPTER 9 | Impacts of Various Technology and Policy Options
effect could be produced by expansion of pond area, as illustrated in the case of Sri Lanka, the only country to have carried out the area growth experiment.
Furthermore, the higher growth in productivity will tend to bring down prices of most fish in all the countries studied. This, combined with favorable effects on demand growth, highlights the potential contribution of freshwater aquaculture expansion on securing animal protein requirements. As noted earlier, the evidence points to the high share of low-value freshwater fish in the animal protein consumption of poor, food-insecure households. Dey et al. (2005b) showed this to be the case for Bangladesh, China, India, Thailand, Vietnam and the Philippines. In China, for example, the shares of crucian carp, grass carp, common carp and silver carp in the total fish expenditure are higher for households in the first quartile than in the other income groups.
However, great impacts on trade balance cannot be expected from the promotion of freshwater aquaculture. Because freshwater fish products are mostly consumed domestically, they play minor roles in fisheries trade. Increases in exports are, therefore, minimal, except in a few cases in which freshwater fish species are exported, namely, carp in Indonesia, tilapia in the Philippines, and catfish in Vietnam.
Evaluation of technology options
Systems and intensity
With promising species identified, attention is then turned to the species- and systems-specific technologies. For carps, the technology is mainly pond polyculture (though monoculture
is commonly practiced in Indonesia and the Philippines); for tilapia, it is either polyculture or monoculture in ponds or cages; and for snakehead and catfish, it is mostly pond or pen monoculture (as in Thailand and Vietnam).
These technologies can generate substantial incomes for farmers, depending on levels of intensity. On per hectare basis, extensive tilapia culture can net US$ 200-300/cycle, while extensive carp culture can net US$ 400–600/cycle. Intensive systems can net anywhere from US$ 3,000 to US$ 16,500 per ha/cycle.
Measures to promote freshwater aquaculture will, therefore, have different impacts on the size and distribution of farm incomes, depending on the levels of intensity of the systems promoted. A non-discriminatory policy may lead to the bulk of income gained by the affluent farmers who can afford highly intensive practices. However, if the measures concentrate on extensive and semi-intensive systems, benefits could well be greater and more equitably distributed. Returns on current variable costs typically exceed US$ 1 for each dollar investment in variable inputs in semi-intensive systems, in contrast to intensive systems, which typically have lower returns (i.e., less cost-effective).
Moreover, semi-intensive and intensive technologies are within reach of small-scale farmers. Besides, the rural poor who have no access to land and other resources can still benefit from aquaculture expansion and productivity growth through employment. A typical freshwater fish farm allocates about 30 percent of its costs on labor, much of it unskilled, which can be a source of wage benefits to rural workers.
162 Strategies and Options for Increasing and Sustaining Fisheries and Aquaculture Production to Benefit Poorer Households in Asia
Approaches
Promoting technical progress in aquaculture may be undertaken by disseminating existing technologies or introducing new ones. The R & D to create new technologies will continue to impact strongly on aquaculture production. This is particularly true for scale-neutral technologies that can be adopted by extensive farmers to increase their yields. For example, selectively bred tilapia known as GIFT strains have proved to have large impacts on yield, regardless of the scale of operation or intensity of practice (Dey 2000a). Hence, the breeding and dissemination programs can have positive impacts on incomes and household welfare, and lead to very high rates of return (Deb and Dey 2004).
The analysis in Chapter 4 suggests that there exists a large scope for increasing productivity simply by improving the management of farms and the use of more efficient practices of semi-intensive and extensive systems. This will optimize the potentials of aquaculture innovations from research stations. So far the intensive systems have been getting close to their efficiency frontier. China, for example, has illustrated the possibilities of rapid growth through the dissemination of existing technologies. This, however, is conditioned on a well-trained, responsive, and well-funded corps of extension personnel in rural areas.
However, extension systems outside of China tend to be weak and ill equipped. Substantial impacts on productivity may, therefore, be expected from improving the extension systems and directing them towards smaller-scale operators of extensive and integrated fish farms in South and Southeast Asia. This requires considerable investments upfront, particularly for human resource
development. Institutional frameworks will also need to be re-examined, i.e., the possibility of greater participation of the private sector to service intensive farmers, while focusing the efforts of the public sector on the disadvantaged, resource-poor farmers.
Brackishwater and marine aquaculture
Outlook under most likely and alternative scenarios
Brackishwater and marine aquaculture will remain a vital growth sector. Over the next 15 years, it will stay on top in terms of growth performance in most of the countries studied. The primary species group is shrimp in South and Southeast Asia, and various marine species in China. Growth of shrimp production is highest among the domestically produced fish types in Bangladesh and Malaysia. In Indonesia, grouper leads in supply growth among the cultured fish types, while in the Philippines, milkfish will continue to remain predominant.
Brackishwater and marine products also dominate the export basket of these countries. Export growth shall proceed at a high pace for Bangladesh, China, India, Sri Lanka, Thailand, and Vietnam. In Malaysia and Indonesia, however, shrimp production faces mediocre prospects for export growth and exporters in both countries may soon be diversifying to other species. In India, shrimp has only a narrow room in the domestic market.
Technological progress in brackishwater and marine aquaculture will lead to growth in production; exports will also respond favorably. However, domestic consumption response is weak, confirming the lack of direct contribution of this aquaculture sub-sector to food security. Some
163CHAPTER 9 | Impacts of Various Technology and Policy Options
countries though have adopted the argument that marine and brackishwater culture will contribute to export earnings and cushion the food import bill, thus indirectly contributing to food security.
Evaluation of technology options
Brackishwater and marine culture in ponds (e.g., shrimp), cages (e.g., milkfish) and other systems are highly profitable. The amount of net income again depends on intensity, with highly intensive systems yielding more profit per hectare. However, in terms of cost-effectiveness, even extensive systems generate relatively high returns, as in the case of Thailand. Semi-intensive systems are not clearly superior in terms of cost-effectiveness.
Investment requirements on a per-hectare basis for brackishwater and marine systems tend to be greater than for freshwater systems. This implies that poor, small-scale farmers will have some difficulty gaining access to the technology. Participation of the poor in the benefits of growth is further undermined by the low labor intensity of this system, as the bulk of costs go to feed and seed. The high feed requirement can be directly traced to reliance on carnivorous species that are highly preferred in domestic and foreign markets. Management, particularly for export markets, also tends to be more skill-intensive.
Finally, the brackishwater and marine culture system can be quite voracious in its natural resource requirement. Brackishwater ponds require operation in estuarine areas that are important habitats of wild species. The destructive nature of extensive systems in Thailand has been well documented. Hence, while extensive systems are economically profitable, and accessible to small-scale farmers, the environmental costs may end up negating their benefits (from the society’s
viewpoint). Meanwhile, intensive systems are less costly in terms of area requirement, but they also generate large amounts of effluent and waste, and are inaccessible to the poor.
It may also be said that while promotion of marine and brackishwater technologies, as currently practiced, has the potential to generate large export revenues and benefits for the industry, it makes little contribution to food security and the reduction of poverty. Moreover, threats to the environment and aquatic resources will be amplified, both domestically and abroad, where fish meal production is rapidly extracting fish stocks.
These adverse impacts may be mitigated by intensification of marine and brackishwater aquaculture regulations regarding waste products and effluents, and technological change to reduce input requirements (i.e., breeding and biotechnology applications, combined with feed technology research, to reduce the fish component of feeds). Finally, design of collective arrangements to facilitate participation of small-scale farmers and landless workers in brackishwater and marine production may also help distribute the benefits from export-oriented growth. However, little is known about the status, prospects, and design of these types of collective institutions; thus a major information gap exists, which warrants further study (Delgado et al. 2003).
Marine capture fisheries
Outlook under likely and alternative scenarios
The market outlook confirms that capture fisheries will register weak to negative growth
1 Similarly, stock enhancement technologies and “sea ranching” are possible options, and there are instances of their practice (e.g., tuna culture). How-ever, these are also large-scale commercial ventures that are not treated in detail here.
164 Strategies and Options for Increasing and Sustaining Fisheries and Aquaculture Production to Benefit Poorer Households in Asia
while aquaculture will continue its dominance in the growth of fisheries into the near future. The reason behind this is the stagnant productivity of capture fisheries in contrast to the expected productivity growth in aquaculture. Combined with information on price and income responses and a consistent data set on demand and supply, quantitative analysis shows that these assumptions are sufficient to assure this conclusion.
In fact, the zero productivity growth may even appear optimistic in the case of marine capture. Throughout Asia, marine fish stocks are known to have suffered serious declines; for some demersal fish, for example, stocks have plummeted to only 10 percent of the level in the 1970s (Silvestre et al. 2003). However, as the extent of expected productivity decline is currently unknown, the baseline assumptions reflect what is hopefully a conservative stance of zero (rather than negative) productivity growth.
In Bangladesh, marine capture as a whole is on the decline, although high-value fish may see good prospects, owing to favorable demand trends reflected in rising prices of this fish type. Simulations for China show a likely prospect of zero growth in capture fisheries, in line with government targets for the sub-sector. China exports of marine catch are expected to fall while imports continue to rise.
For India, in contrast to Bangladesh, it is the low-value species that will propel the growth of the marine sub-sector. This growth trend is mainly driven by exports because domestic demand for these fish types appears to be declining. Domestic demand is instead shifted to high-value marine fish, as reflected in rising imports for this fish type.
Indonesia and Malaysia both exhibit weak growth trends for the marine capture sub-sector as a whole, and for individual fish types, such as anchovies in Malaysia that will suffer declining supplies. The same is true for the Philippines, where the capture sub-sector, which accounts for the bulk of marine output, is projected to decline. Thailand, like Bangladesh, will see only high-value marine fish as the sole type with healthy growth. But, in contrast to Bangladesh, this growth will be driven mostly by export demand. Only Sri Lanka and, to some extent, Vietnam, will see a relatively rapid growth in marine capture fisheries. Supply contraction in fisheries, due to controls of fishing effort (or alternatively, reduction in natural stocks) will have mild to moderate adverse impacts on production, consumption, and trade, and price growth.
Evaluation of technology and management options
Trends in CPUE confirm that the average catch has been falling while fishing effort has been climbing, for example, in India, the Gulf of Thailand, and the Philippines, as well as in Sri Lanka (for shrimp trawling and lobster bottom set gill netting). Technology options for expanded productivity are directed only at offshore capture fisheries, particularly in the Indian Ocean and parts of the Western Pacific. This is based on the conjecture of unexploited or lightly exploited stocks offshore. However, these areas are accessible only to the large-scale commercial operators owing to large gears and vessels required, and sophisticated technologies employed (i.e., in deep-sea demersal fishing or tuna long-lining).1
The main thrust for coastal capture fisheries is the management of fishing effort and fishing practice
165CHAPTER 9 | Impacts of Various Technology and Policy Options
to maintain long-term sustainability and restore the health of natural stocks. Regulations are being aimed at fishing gears to reduce by-catch, particularly of non-target species and juveniles of target species. Dangerous and destructive practices, such as blast and cyanide fishing, are prohibited. It is, however, recognized that fishing capacity must be reduced drastically; to a large extent, this measure requires exit of fishers from the industry, both in the commercial and small-scale sectors.
Technology options are being directed to gears that can maintain incomes of the remaining fishers, while continuing to restrict fishing effort. In this regard, cost and return analysis (Chapter 3) points to gears that are affordable and generate high returns and net incomes to small-scale fishers. These include small and medium motorized boats in Bangladesh, gill nets in most countries, and small-scale multi-gear fishing vessels in Thailand.
Various management options are being pursued in each country. Decentralization is the route taken by the Philippines, Indonesia, and Thailand. Co-management and community-based management are also favored policies in these countries, as well as in Bangladesh, India, and Sri Lanka. In countries such as Vietnam and Malaysia, community-based management is being pilot tested in limited areas. China, however, adheres to the conventional command-and-control approach, given its history of a strong central government and effective enforcement.
The impacts of these management options will only be felt when effort is effectively managed. As the simulations suggest, the impacts at the market level are not expected to be strong, should supplies indeed be reduced to levels closer to sustainable harvest. The failure of traditional command-and-
control approaches is widely accepted. However, the jury is still out on the effectiveness of the new management regimes being introduced. There are some indications of effectiveness, for example, in the establishment and maintenance of marine protected areas for coral reef rehabilitation in Indonesia and the Philippines.
However, while these management options work for stationary aquatic systems, the effectiveness of community-based management for coastal fisheries is less convincing because multiple communities may be exploiting a single fish stock. Anecdotal evidence from the Philippines suggests that decentralization has not been beneficial due to conflicts of interest at the local level or local government indifference caused by inability to control fish exploitation outside their jurisdiction.
However, there are also indications that “scaling-up” co-management may remedy the problem. In Philippines, evidence is being gathered on the effectiveness of bay-wide or large-scale fisheries being administered under co-management institutions (Viswanathan et al. 2003).
Finally, the allocation of use-rights to restrict access, if enforced, ultimately implies a mass exodus of both small and large-scale fishers from the industry. For this, support polices are required to manage this exit and reduce economic dislocation. While aquaculture expansion can help absorb some of the exit, such capacity reduction must necessarily be channeled elsewhere in the economy. Policy options to avoid painful dislocation are discussed in the last section of this chapter.

2 This type of fishery straddles capture and culture categories. Official statistics classify it under capture.
166 Strategies and Options for Increasing and Sustaining Fisheries and Aquaculture Production to Benefit Poorer Households in Asia
Inland capture fisheries
Outlook under likely and alternative scenarios
Inland capture fisheries form a big sub-sector in Bangladesh, China, India, Indonesia, Sri Lanka, and Thailand (though negligibly small in the other countries). However, significant growth prospects for the sub-sector are found only in Sri Lanka and Thailand; in Bangladesh inland capture output is projected to actually contract, while in Indonesia the growth prospects are unimpressive. The reason is mainly the crowding out effect, as inland culture grows owing to technological change. Like in the case of marine capture fisheries, restrictions in fishing effort (or negative supply shocks) at the scenario assumptions produce little effect, except to exacerbate somewhat the negative growth trends.
Evaluation of technology and management options for inland capture fisheries
Technology options for inland capture fisheries cover various types of fishing gears and vessels. However, information on the returns, costs, and household incomes from inland fishing is unavailable in systematic form for the selected countries. Even official data on inland catch are doubtful because the rudimentary nature of the activity, which makes it difficult to monitor, as well as the reliance of many poor households on inland fishing for subsistence.
An important technology option is the application of stock enhancement and restocking methods, not usually considered viable in the case of marine capture fisheries. This is a common practice in China and India for reservoir fisheries, and in
Bangladesh for culture-based fisheries.2 However, this technology typically must be applied in conjunction with some form of use right regime and management option, such as private leasehold, community-based management, and co-management.
This type of culture-based fishery is similar to the fish culture technology employed in flood-prone rice fields in Bangladesh and Vietnam. These rice fields are seasonally flooded. Traditionally, wild fish is captured during this period; under a community-based arrangement, the flooded fields were enclosed, stocked, and protected until an agreed harvest period. Fish production in excess of the wild fish catch may reach 600 kg/ha/yr in shallow flooded areas and 1.5 t/ha/yr in deep-flooded areas. Net returns range from US$ 100 to US$ 170 per ha/yr in Vietnam, and US$ 650 to US$ 1,100 in Bangladesh (ICLARM 2002).
While these options apparently offer high returns at low investment costs, a key constraint lies in creating institutional arrangements that can sustain the productivity of inland capture fisheries. If successfully scaled up, culture-based fisheries have a significant potential for increasing the output of freshwater fish production. Evaluating options for upstream and post-harvest activities
Seed development
The unavailability of quality fish seed is a perennial problem facing grow-out aquaculture. The development of the seed industry is to help close efficiency gaps in fish farming and is, therefore, complementary to the technology options at the grow-out stage.
167CHAPTER 9 | Impacts of Various Technology and Policy Options
Hatcheries are known to be profitable activities, but they are prone to their own management inefficiencies. Systematic extension programs aimed at hatchery operators may, therefore, contribute greatly to hatchery development. Another cause of poor seed quality is genetic deterioration of broodstocks. Maintenance of quality broodstock is typically a highly technical, commercial operation. Policies that encourage increased and sustained investments in broodstock operations, which will likely come from the private sector, will also indirectly relax the constraints to growth of grow-out aquaculture.
Post-harvest activities and processing
Processed fish is an important fishery product in six of the nine countries (except China, India, and Malaysia). This product experiences contracting demand in Bangladesh, even as domestic prices and foreign demand are rising. Hence, the outlook for demand growth seems favorable, but the supply side may become a bottleneck, particularly if the bulk of raw materials are coming from capture species. In Sri Lanka, Indonesia, and Thailand, domestic consumption and exports of processed fish are expected to rise along with its price; in the Philippines, however, trends are mostly negative for processed fish.
The processing sector is, however, not limited to a “processed” fish type. Considerable processing takes place for the individual fish types, but on the demand side, these are aggregated along with the fresh form of consumption (so long as the original fish type remains unique and recognizable, e.g., canned tuna). As the model presents quantities in fresh weight, the added value from processing is absorbed into the marketing margin. Improvements in processing, say by
upgrading quality of traditional products, show up as reduced costs of the same added value, and may, therefore, be treated as a way to reduce the marketing margin (see the following subsection).
Processing for exports faces a major obstacle in the form of stringent standards known as hazard analysis critical control points (HACCP). The main option facing policymakers is to promote compliance, or to do nothing and avoid some of the requisite investments, but at the risk of exclusion from lucrative foreign markets. Simulation results for HACCP compliance do not in general indicate a major slowdown in export growth as a consequence of this policy. The exception is the Philippines, where export growth declines across the board.
These results at the industry level may, however, obscure significant structural effects within the industry. It is likely that promotion of HACCP compliance will have differential impacts depending on firm size, owing to scale economies in processing. As may be seen in data from a survey of processors in India (Table 9.1), the impact of HACCP protocols is felt at all scales of operation, in proportion to unit costs.
Clearly the traditional sector faces more daunting prospects as it takes considerable resources up front to shift from traditional processing to modern, hygienic techniques; long supply chains (owing to geographic dispersion) make food preservation and standards compliance costly on an individual basis. Hence, policies that overcome these entry barriers, which keep the poor out of the supply chain and probably entail novel collective arrangements, will contribute greatly to sharing the benefits of export-oriented growth.

168 Strategies and Options for Increasing and Sustaining Fisheries and Aquaculture Production to Benefit Poorer Households in Asia
Marketing efficiency
Options to improve marketing efficiency include improved transport infrastructure, investments in post-harvest facilities and handling, as well as market promotion, linkaging, and information. If successful, costs and rents (in the case of an uncompetitive trade services sector) at the post-harvest stage would decline, which should be reflected as smaller marketing margins. The need for improved efficiencies is indicated by the surveys on fish trade, which finds that margins can be as much as 70 percent of the retail price.
Simulation results from the relevant country studies indicate a positive, across-the-board increase in growth of production, consumption, and exports, as well as slow rise of consumer prices. Improved efficiencies and lower costs are beneficial to the trading sector itself, which in some cases (e.g., Sri Lanka) constitute part of the marginalized rural sector.
Economic support and price policies
Price and support policy options include tariffs, subsidies, and credit provision. In some countries, tariffs on some fisheries products remain high (e.g., India and Bangladesh and, to some extent, Thailand and China). Tariff reduction may significantly make imported fish cheaper and
reduce materials costs for processors (as in the case of Thailand). Such policies may also have beneficial effects on food security. A study for the Philippines, using the AsiaFish model (Rodriguez and Garcia 1994) to simulate the impacts of the tariff cuts for 2000-2004 on fisheries, found that the tariff reductions increased overall fish consumption growth. While some sub-sectors experienced a growth contraction due to import competition, the overall supply growth increased slightly over the period.
Some of the countries continue a subsidy policy for capture fisheries. This promotes intensified fishing effort and runs counter to the measures to reduce overfishing. A subsidy scheme that focuses on preferred, environmentally friendly gears would contribute to fishing sustainability.
Subsidies may also be extended on input prices for aquaculture (i.e., feeds and seeds). However, the greater consequences of pursuing all types of subsidy policies should be carefully reviewed because this measure diverts scarce government revenue that could be otherwise used for development projects, as well as adds to the fiscal burden of some deficit-prone countries in the region.
The foregoing argument applies to a popular form of subsidy, namely, cheap, direct credit. Against
Plant capacity Without compliance With compliance
Small (< 10 t/day)Medium (10-15 t/day)Large (> 15 t/day)Average
0.1420.0950.0720.093
0.1890.1310.1100.123
Table 9.1 Average Processing Cost (US$/kg) for Sample Enterprises in Asia, with and without HACCP Compliance
Source: Dey et al. (2004a).
169CHAPTER 9 | Impacts of Various Technology and Policy Options
this option is a newer form of credit program that is anchored on cost-recovery, market-based lending rates. This program is implemented by legitimate financial institutions, which are oriented towards cost-recovery practice, but also provide service for traditionally excluded clientele. The clientele includes households without land or assets to put up as collateral. Micro-credit programs of this
variety (pioneered in Bangladesh) are growing rapidly across the region. Implementing this option for small-scale aquaculture, as well as alternative enterprises for small-scale fishers, may have a strong and lasting impact on the poor, many of whom are willing and able to venture into micro-entrepreneurship, but are denied access to formal credit.
170 Strategies and Options for Increasing and Sustaining Fisheries and Aquaculture Production to Benefit Poorer Households in Asia
Overview
The previous chapters covered profiles of fisheries technologies, institutions, and stakeholders. They also assessed supply and demand trrends, as well as the impact of alternative options for policy, management, and technology. The final task involved synthesizing all the information presented earlier in order to (a) identify appropriate technologies and (b) formulate national action plans, which together would lead to increased and sustained benefits to poor households from fisheries production.
The identification of technologies to be recommended for an investment program directed at fisheries production to benefit the poor was accomplished by means of a priority-setting exercise on the numerous options that were enumerated and assessed in the foregoing chapter. The exercise was conducted by fisheries technical experts from participating research institutes.
The formulation of national action plans was achieved by a participatory process. National-level consultations were undertaken in the selected developing member countries (DMCs) in the form of national workshops participated by multisectoral representatives from industry, policy and planning, management, education, research and development (R & D), and training. The participants were presented with research findings from the project, namely, profiles of fishing and aquaculture technologies, policy and institutional
perspectives, socioeconomic profiles of the fishers and fish farmers, and fish demand-supply analysis including preliminary results of the fish projection models. These consultations concluded with the formulation of national action plans (NAPs). By nature of the process, the NAPs cover an expansive checklist of directions and thrusts for orienting fisheries development towards the long-term welfare of the poor. The specific value of each NAP is to provide a blueprint for effective planning and policymaking within the relevant participating DMC.
Priority Technologies
The identification of priority technologies for R &D investment is aimed at maximizing net benefits for the target group as well as the society. This entails a set of criteria and a systematic method of applying the criteria to evaluate technology options for aquaculture, capture fisheries, and post-harvest management.
Criteria for priority setting
The methodology for ranking and selecting the technologies was developed in a workshop where research partners from all the nine participating countries agreed to adopt five criteria for prioritizing pro-poor aquaculture and fishing technologies. These criteria are: (1) production efficiency, (2) food and nutrition security, (3) employment generation, (4) impact on the environment, and (5) acceptability by the poor. The criteria and their respective indicators are summarized in Table 10.1.
Chapter 10
PRIORITY TECHNOLOGIES AND NATIONAL STRATEGIES
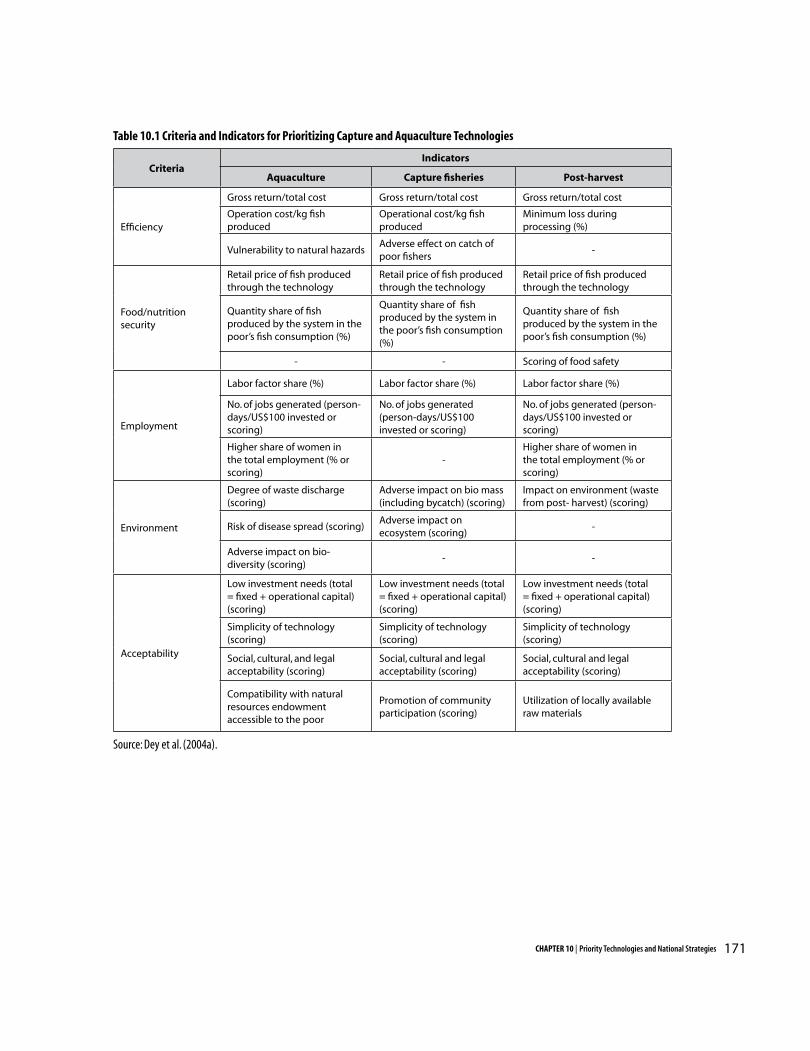
171CHAPTER 10 | Priority Technologies and National Strategies
CriteriaIndicators
Aquaculture Capture fisheries Post-harvest
Efficiency
Gross return/total cost Gross return/total cost Gross return/total cost
Operation cost/kg fish produced
Operational cost/kg fish produced
Minimum loss during processing (%)
Vulnerability to natural hazardsAdverse effect on catch of poor fishers
-
Food/nutrition security
Retail price of fish produced through the technology
Retail price of fish produced through the technology
Retail price of fish produced through the technology
Quantity share of fish produced by the system in the poor’s fish consumption (%)
Quantity share of fish produced by the system in the poor’s fish consumption (%)
Quantity share of fish produced by the system in the poor’s fish consumption (%)
- - Scoring of food safety
Employment
Labor factor share (%) Labor factor share (%) Labor factor share (%)
No. of jobs generated (person-days/US$100 invested or scoring)
No. of jobs generated (person-days/US$100 invested or scoring)
No. of jobs generated (person-days/US$100 invested or scoring)
Higher share of women in the total employment (% or scoring)
-Higher share of women in the total employment (% or scoring)
Environment
Degree of waste discharge (scoring)
Adverse impact on bio mass (including bycatch) (scoring)
Impact on environment (waste from post- harvest) (scoring)
Risk of disease spread (scoring)Adverse impact on ecosystem (scoring)
-
Adverse impact on bio-diversity (scoring)
- -
Acceptability
Low investment needs (total = fixed + operational capital) (scoring)
Low investment needs (total = fixed + operational capital) (scoring)
Low investment needs (total = fixed + operational capital) (scoring)
Simplicity of technology (scoring)
Simplicity of technology (scoring)
Simplicity of technology (scoring)
Social, cultural, and legal acceptability (scoring)
Social, cultural and legal acceptability (scoring)
Social, cultural and legal acceptability (scoring)
Compatibility with natural resources endowment accessible to the poor
Promotion of community participation (scoring)
Utilization of locally available raw materials
Table 10.1 Criteria and Indicators for Prioritizing Capture and Aquaculture Technologies
Source: Dey et al. (2004a).
172 Strategies and Options for Increasing and Sustaining Fisheries and Aquaculture Production to Benefit Poorer Households in Asia
Efficiency
The application of technology generally results in higher yield and subsequent returns from the production. Hence, as new fishing gear technology should increase fish catch with the same effort, post-harvest technology should reduce losses during processing. The adopted technology should increase profitability and give adequate rates of return for any additional investment.
Food and nutrition security
Food and nutrition security refers to accessibility to adequate food, including fish, by all houshold groups. An important issue is to provide cheap protein to a growing population. The desired technology should lead to greater availability and improve affordability of fish and fisheries products for the poor. The corresponding indicators are the retail price and consumption share (by value) of fish species produced under the given technology.
Employment
An important consideration when designing aquaculture and fisheries technologies is the generation of employment opportunities for the rural poor. Labor markets in underdeveloped countries are far from efficient, often trapping the poor in conditions of chronic underemployment. Neither does self-employment provide an outlet for the poor, due to the lack of access to capital for starting a productive enterprise. Women in particular are discriminated against even though they often are breadwinners in many poor communities and are great assets to the fishery industry, especially in the seafood processing sector. The corresponding indicators for this
criterion are labor factor shares in the total cost, the number of jobs generated per unit, and the percentage of women employment in the total labor requirement.
Environment
Most technologies interact with the surrounding environment and their potential effects must be taken into account in prioritizing them. The selected technology must be environment-friendly to make the industry sustainable in the long run. For example, in aquaculture technology, there must be adequate provision for efficient waste treatment to minimize negative impacts of wastewater discharge into the surrounding crop fields or river system. Disease outbreaks should be checked quickly to prevent a fish epidemic. Security measures need to be taken to confine invasive cultured species and protect local biodiversity. New fishing gears should not lead to biomass destruction or put undue stress on aquatic ecosystems. Likewise, implementation of a processing or post-harvest technology should not generate excessive or toxic discharges to the environment. The measurable indicators of this criterion are the degree of waste discharges, risk of contagious diseases, and impact of technology on biodiversity.
Acceptability
Any successful implementation of a fishery technology must gain wide acceptance and support of the general community. Due to inequitable access to capital, the poor cannot typically afford technologies with high investment requirements. The technology should also be compatible with the local endowments of natural resources. Simplicity of the technology means ease of adoption. The
173CHAPTER 10 | Priority Technologies and National Strategies
indicators under the acceptability criterion are: investment needs of the technology; simplicity or ease of adopting the technology; natural resource endowment of the area; and social, cultural and legal acceptability of the technology as perceived by poor fishers, fish farmers, and processors.
A systematic procedure was adopted in prioritizing the technologies using the aforementioned criteria and their corresponding indicators. First, each criterion was assigned a given weight that, in turn, was split into weights of indicators corresponding to the criterion. The weight assigned to a criterion varied according to the relevance of the criterion to the technologies applied in a particular country. Second, scores were given to each indicator of each criterion. The technology score was computed as a weighted average of indicator and criterion scores; this score was then used for ranking the technologies.
Ranking of technologies
Freshwater aquaculture technologies
Shown in Table 10.2 are ranks of major pro-poor freshwater aquaculture technologies in the nine Asian countries. The top-ranked grow-out technologies are mostly extensive, improved extensive, or semi-intensive. The top-ranked technology for Bangladesh, India, Indonesia, Thailand, and Vietnam is carp polyculture in ponds, in the extensive or improved extensive system (except Vietnam, which prioritizes the semi-intensive system). The same technology is ranked second in China. Other methods for carp rearing are ranked either second or third in China, India, and Thailand.
The prioritization of carp species is consistent with its very favorable market outlook in most
countries: demand for carp or fish categories inclusive of carp (i.e. low-value freshwater) species is projected to grow faster than the average demand for fish in Bangladesh, India, Indonesia, Malaysia, Sri Lanka, and Vietnam. Low-value aquaculture technology (with equal productivity growth rates for all relevant species) enables the output of carp species to grow faster than average output in the same countries, including Thailand (i.e., all the countries that rated carp at the top rank).
Another pro-poor technology with high priority is integrated farming, which is top-ranked in China (in the form of rice-fish culture) as well as in Malaysia (fish-duck/pig/poultry). Rice-fish is ranked second in Vietnam and Bangladesh. The other priority species are tilapia, catfish, and freshwater prawn. The Philippines ranks hatcheries of ornamental fish, tilapia, and carp in the top three.
Brackishwater and marine aquaculture technologies
The ranking of brackishwater aquaculture and mariculture technologies practiced in the nine Asian countries is shown in Table 10.3. Shrimp monoculture in ponds (in the extensive system) is top-ranked for Bangladesh, Indonesia, Thailand, and Vietnam, and is second-ranked in China. Semi-intensive culture of shrimp is second-ranked for Thailand, and shrimp with rice in rotation is second-ranked for Vietnam and Bangladesh. Again, this is broadly consistent with the projections: productivity growth of brackishwater and marine aquaculture in the same countries implies a faster growth of shrimp in relation to the supply as a whole.
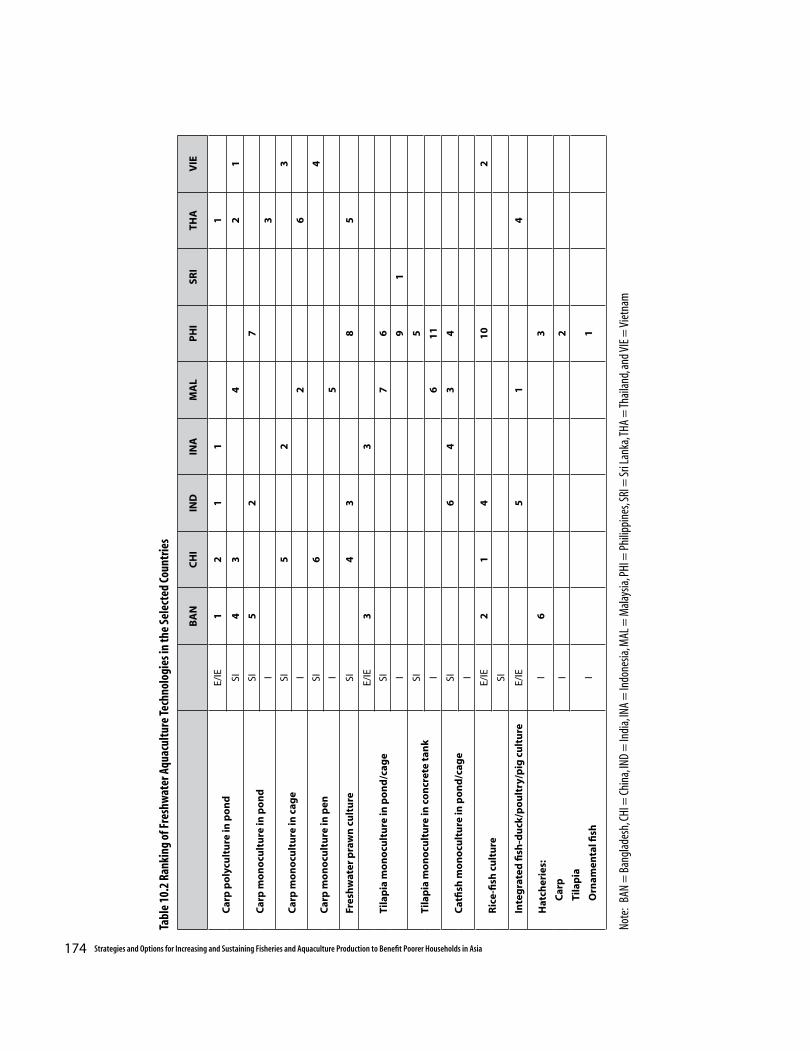
174 Strategies and Options for Increasing and Sustaining Fisheries and Aquaculture Production to Benefit Poorer Households in Asia
BA
NC
HI
IND
INA
MA
LP
HI
SRI
THA
VIE
Car
p p
oly
cult
ure
in p
on
dE/
IE1
21
11
SI4
34
21
Car
p m
on
ocu
ltu
re in
po
nd
SI5
27
I3
Car
p m
on
ocu
ltu
re in
cag
eSI
52
3
I2
6
Car
p m
on
ocu
ltu
re in
pen
SI6
4
I5
Fres
hw
ater
pra
wn
cu
ltu
reSI
43
85
Tila
pia
mo
no
cult
ure
in p
on
d/c
age
E/IE
33
SI7
6
I9
1
Tila
pia
mo
no
cult
ure
in c
on
cret
e ta
nk
SI5
I6
11
Cat
fish
mo
no
cult
ure
in p
on
d/c
age
SI6
43
4
I
Ric
e-fi
sh c
ult
ure
E/IE
21
41
02
SI
Inte
gra
ted
fish
-du
ck/p
ou
ltry
/pig
cu
ltu
reE/
IE5
14
Hat
cher
ies:
C
arp
Ti
lap
ia
O
rnam
enta
l fish
I6
3
I2
I1
Tabl
e 10
.2 R
anki
ng o
f Fre
shw
ater
Aqu
acul
ture
Tech
nolo
gies
in th
e Se
lect
ed C
ount
ries
Note
: BA
N =
Ban
glad
esh,
CHI =
Chin
a, IN
D =
Indi
a, IN
A =
Indo
nesia
, MAL
= M
alay
sia, P
HI =
Phi
lippi
nes,
SRI =
Sri L
anka
, THA
= Th
aila
nd, a
nd V
IE =
Vie
tnam
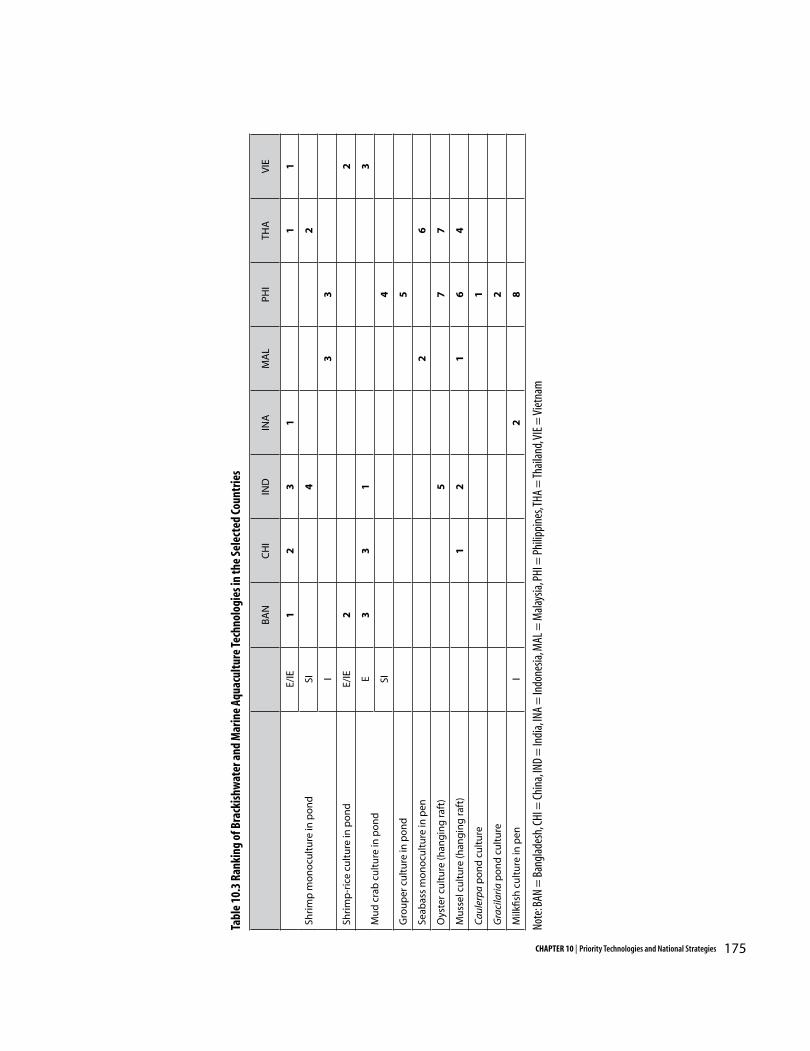
175CHAPTER 10 | Priority Technologies and National Strategies
BA
NC
HI
IND
INA
MA
LPH
ITH
AV
IE
Shri
mp
mo
no
cult
ure
in p
on
d
E/IE
12
31
11
SI4
2
I3
3
Shri
mp
-ric
e cu
ltu
re in
po
nd
E/IE
22
Mu
d c
rab
cu
ltu
re in
po
nd
E3
31
3
SI4
Gro
up
er c
ult
ure
in p
on
d5
Seab
ass
mo
no
cult
ure
in p
en2
6
Oys
ter c
ult
ure
(han
gin
g ra
ft)
57
7
Mu
ssel
cu
ltu
re (h
ang
ing
raft
)1
21
64
Cau
lerp
a p
on
d c
ult
ure
1
Gra
cila
ria
po
nd
cu
ltu
re2
Milk
fish
cu
ltu
re in
pen
I2
8
Tabl
e 10
.3 R
anki
ng o
f Bra
ckis
hwat
er a
nd M
arin
e Aq
uacu
lture
Tech
nolo
gies
in th
e Se
lect
ed C
ount
ries
Note
: BAN
= B
angl
ades
h, CH
I = Ch
ina,
IND
= In
dia,
INA
= In
done
sia, M
AL =
Mal
aysia
, PHI
= P
hilip
pine
s, THA
= Th
aila
nd, V
IE =
Vie
tnam

176 Strategies and Options for Increasing and Sustaining Fisheries and Aquaculture Production to Benefit Poorer Households in Asia
Mussel culture (with hanging rafts) is top-ranked for China and Malaysia, and is ranked second in India. Mussel culture is presently not a large sector in these countries, nor is its growth opportunities unusually promising, based on the market outlook for mollusks or other aquaculture as a whole. Nevertheless, the accessibility of this technology for the poor commends it for prioritization. For India, the top-ranked technology is extensive culture of mudcrab in ponds; although this is not practiced widely, it is gaining popularity in the southern coastal region. This technology is also ranked highly (at third place) in Bangladesh.
Seaweed culture is top-ranked in the Philippines (for Caulerpa and Gracilaria, in that order). Milkfish pen culture and seabass pen culture are ranked second both for Indonesia and Malaysia. Moderately ranked technologies are culture of grouper in ponds and oyster culture (hanging raft).
All aquaculture technologies
The final prioritization of aquaculture technology was done through a participatory exercise in which the project team members, planners, and policymakers of all the nine countries derived composite scores for all the technologies practiced under common environments in the participating countries (Table 10.4). Freshwater polyculture of carp in pond appears to takes the top rank among all technologies practiced under all environments. The second rank is taken by brackishwater polyculture of shrimp in pond. Monoculture of tilapia in cage is ranked third, and seed production of tilapia is ranked fourth. It is noteworthy that the market outlook for tilapia is highly favorable in countries such as China and the Philippines, suggesting that a ranking just behind these top two species groups is consistent with economic viability.
Integrated culture of fish with duck/livestock/horticulture is also quite popular in most of the selected countries, and it takes the fifth rank among all technologies practiced in the region. Polyculture of tilapia in pond and seed production of milkfish are ranked sixth and seventh, respectively. Polyculture of carps with noninvasive species in the floodplain is also a popular practice in the Asian region, and is ranked eighth. Brackishwater monoculture of milkfish in pond ranks ninth. The remainder of the list covers an assortment of species in various systems (tilapia, carps-mixed, seaweed, mollusks, prawns, shrimp-rice, and catfish). These are broadly the same combination of species with promising market outlook in the supply-demand forecasts.
Capture technologies
Shown in Table 10.5 is the ranking of pro-poor capture fisheries technologies for the nine Asian countries. The ranking was done separately for inland and marine capture fisheries. For inland capture fisheries technologies in Bangladesh, the gill net occupies the top rank, followed by the long line, seine net, push net, and cast net. The lift net and trap are ranked relatively low. For marine capture fisheries, the seine net and set net are ranked first and second, followed by the hook-and-line and mini-trawl.
In China, the hook-and-line and gill net are the top two fishing gears, popularly used by the poor in inland China. The push net and lift net are ranked in the middle, while the trap and cast net are relatively low in rank among the inland capture fisheries technologies. As for marine capture fisheries technologies, the push net is at the top, followed by the cast net and gill net.
177CHAPTER 10 | Priority Technologies and National Strategies
Among the inland capture fisheries technologies in India, the gill net is at the top, followed by the cast net and hook-and-line. The trap and push net are in the middle. Among the marine capture fisheries technologies, the gill net is ranked first, followed by the hook-and-line, seine net, and trap. The mini-trawl and trawl are relatively low in ranking.
Among the marine capture technologies in Malaysia, the portable trap tops the ranking, followed by the hook-and-line, gill net, and seine net. Trawl fishing is relatively capital-intensive; so both the mini-trawl and trawl have relatively lower rankings.
In the Philippines, the gill net is top-ranked, followed by the hook-and-line both for inland and marine capture technologies. The tuna hand line ranks third, followed by the set net and squid line. The mini-trawl is relatively low in ranking, particularly among pro-poor capture fisheries technologies.
Thailand also has a good number of inland and marine capture fisheries technologies. Among the former, the lift net is top-ranked, followed by the hook-and-line, gill net, and cast net. The trap and long line are ranked lower. Among the marine capture fisheries technologies, the hook-and-line is ranked first, followed by the gill net, trap, and cast net.
Among the inland capture fisheries technologies in Vietnam, the long line is at the top, followed by the gill net and hook-and-line. The set net is top-ranked among marine capture fisheries technologies, followed by the hook-and-line and trap.
Fish processing and post-harvest technologies
The ranking of fish processing and post-harvest technologies practiced in the nine Asian countries is shown in Table 10.6. The same five criteria were used, with varying distribution of weights depending on the degree of relevance of the criterion in different countries/environments. In the case of missing information on some indicators, the ranking is completed by relying on expert judgment.
The prioritization of fish processing and post-harvest technologies includes both traditional and modern technologies. Most of the traditional technologies are ranked higher than the modern technologies, due to low investment needs, simplicity, and local availability of raw materials.
In Bangladesh, the top-three technologies are icing for short period/distance preservation, solar drying, and salting. Freezing for long period/distance preservation is also ranked moderately high. Processing of fish into fish meal ranks very low because it is an industrial activity that requires high capital investment. However, the practice of this technology offers an employment opportunity due to the backward and forward linkage activities associated with it. The ranking of post-harvest technologies in India does not differ much from that of Bangladesh, with solar/electric drying top-ranked, followed by salting and drying.
In Malaysia, fish smoking is top-ranked, followed
by solar/electric drying and fish fermenting. In
the Philippines, processing and value-adding
activities, such as making shrimp crackers, rank
prominently. In Thailand, salting and drying of
fish are top-ranked, followed by fish smoking and

178 Strategies and Options for Increasing and Sustaining Fisheries and Aquaculture Production to Benefit Poorer Households in Asia
Ran
kA
ctiv
ity
Envi
ron
men
tSy
stem
Tech
no
log
ySp
ecie
sSc
ore
1G
row
-ou
tIn
lan
dPo
nd
Poly
cult
ure
Car
ps
36
2G
row
-ou
tB
rack
ish
wat
erPo
nd
Poly
cult
ure
Shri
mp
33
3G
row
-ou
tIn
lan
d
Cag
eM
on
ocu
ltu
reTi
lap
ia
30
4Se
ed p
rod
uct
ion
Ti
lap
ia30
5G
row
-ou
tIn
lan
dPo
nd
Inte
gra
ted
Fish
wit
h p
ou
ltry
/liv
esto
ck/h
ort
icu
ltu
re26
6Se
ed p
rod
uct
ion
Milk
fish
20
7G
row
-ou
tIn
lan
dPo
nd
Inte
gra
ted
Fish
wit
h p
ou
ltry
/liv
esto
ck/h
ort
icu
ltu
re20
8G
row
-ou
tIn
lan
dPo
nd
Poly
cult
ure
Car
ps
wit
h n
on
inva
sive
sp
ecie
s17
9G
row
-ou
tIn
lan
dPo
nd
Poly
cult
ure
Tila
pia
17
10G
row
-ou
tB
rack
ish
wat
erPo
nd
Mo
no
cult
ure
Milk
fish
15
11G
row
-ou
tIn
lan
dPo
nd
Mo
no
cult
ure
Tila
pia
15
12G
row
-ou
tIn
lan
dM
ixed
Poly
cult
ure
Car
ps
wit
h n
on
inva
sive
fish
sp
ecie
s15
13G
row
-ou
tM
arin
eSe
awee
d (C
aule
rpa,
Gra
cila
ria)
15
14G
row
-ou
tM
arin
eM
ollu
sks/
mu
ssel
11
15G
row
-ou
tB
rack
ish
wat
erSh
rim
p-r
ice
rota
tio
n in
sal
ine
wat
er11
16Se
ed p
rod
uct
ion
Praw
n10
17G
row
-ou
tIn
lan
dPo
nd
Poly
cult
ure
Praw
ns
and
car
ps
10
18G
row
-ou
tIn
lan
dPo
nd
Poly
cult
ure
Cat
fish
wit
h o
ther
fish
sp
ecie
s10
19Se
ed p
rod
uct
ion
Shri
mp
10
Tabl
e 10
.4 R
anki
ng A
cros
s All
Aqua
cultu
re a
nd H
atch
ery T
echn
olog
ies i
n th
e Se
lect
ed C
ount
ries
Note
: BA
N =
Ban
glad
esh,
CHI =
Chin
a, IN
D =
Indi
a, IN
A =
Indo
nesia
, MAL
= M
alay
sia, P
HI =
Phi
lippi
nes,
SRI =
Sri L
anka
, THA
= Th
aila
nd, V
IE =
Vie
tnam
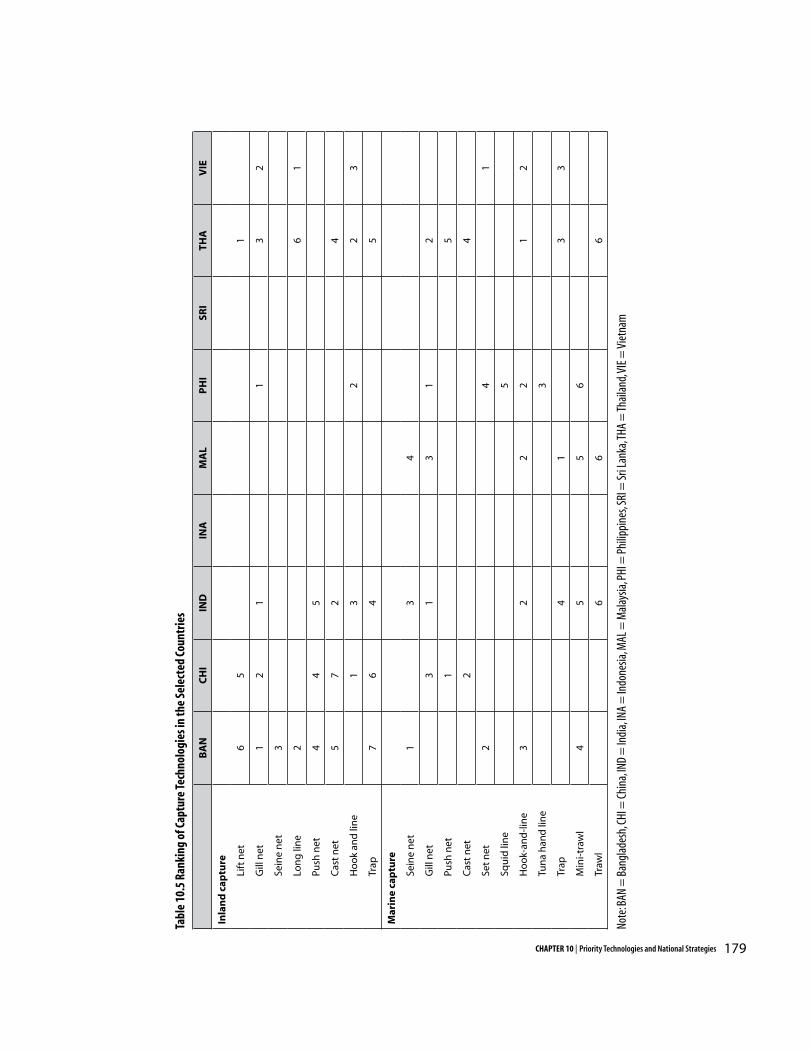
179CHAPTER 10 | Priority Technologies and National Strategies
BA
NC
HI
IND
INA
MA
LP
HI
SRI
THA
VIE
Inla
nd
cap
ture
Li
ft n
et6
51
G
ill n
et1
21
13
2
Se
ine
net
3
Lo
ng
lin
e2
61
Pu
sh n
et4
45
C
ast
net
57
24
H
oo
k an
d li
ne
13
22
3
Tr
ap7
64
5
Mar
ine
cap
ture
Se
ine
net
13
4
G
ill n
et3
13
12
Pu
sh n
et1
5
C
ast
net
24
Se
t n
et2
41
Sq
uid
lin
e5
H
oo
k-an
d-l
ine
32
22
12
Tu
na
han
d li
ne
3
Tr
ap4
13
3
M
ini-
traw
l4
55
6
Tr
awl
66
6
Tabl
e 10
.5 R
anki
ng o
f Cap
ture
Tech
nolo
gies
in th
e Se
lect
ed C
ount
ries
Note
: BAN
= B
angl
ades
h, CH
I = Ch
ina,
IND
= In
dia,
INA
= In
done
sia, M
AL =
Mal
aysia
, PHI
= P
hilip
pine
s, SR
I = Sr
i Lan
ka, T
HA =
Thai
land
, VIE
= V
ietn
am
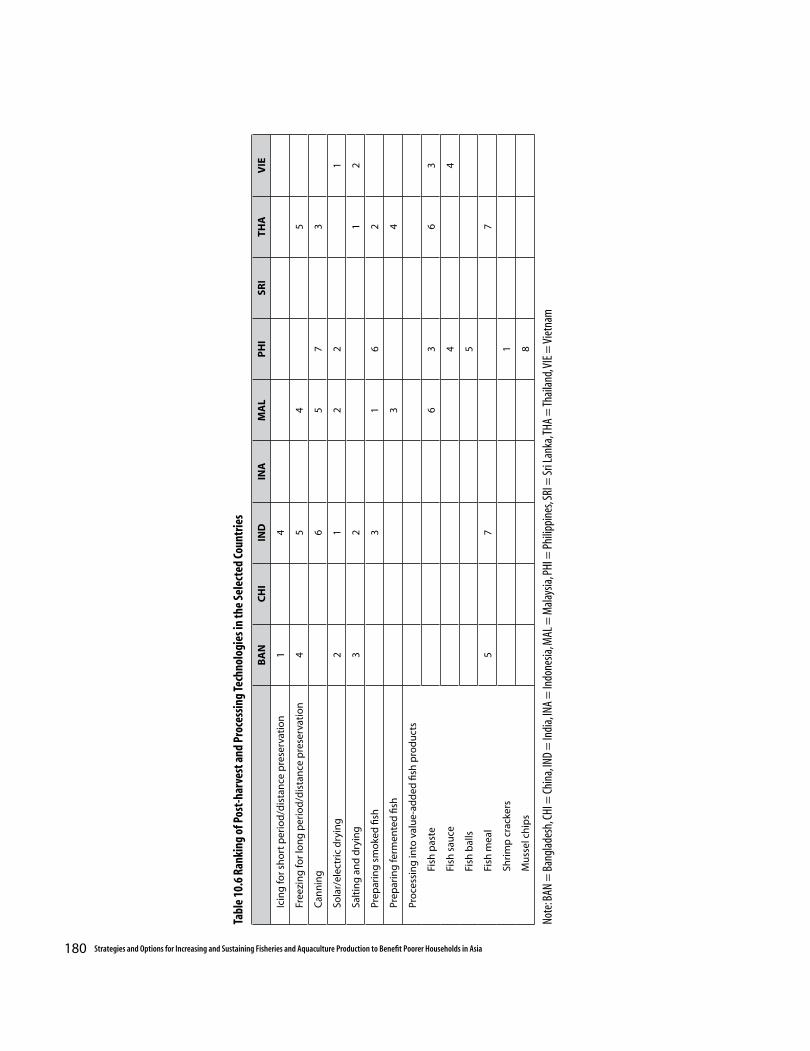
180 Strategies and Options for Increasing and Sustaining Fisheries and Aquaculture Production to Benefit Poorer Households in Asia
BA
NC
HI
IND
INA
MA
LP
HI
SRI
THA
VIE
Icin
g fo
r sh
ort
per
iod
/dis
tan
ce p
rese
rvat
ion
14
Free
zin
g fo
r lo
ng
per
iod
/dis
tan
ce p
rese
rvat
ion
45
45
Can
nin
g
65
73
Sola
r/el
ectr
ic d
ryin
g2
12
21
Salt
ing
an
d d
ryin
g3
21
2
Prep
arin
g s
mo
ked
fish
31
62
Prep
arin
g fe
rmen
ted
fish
34
Pro
cess
ing
into
val
ue-
add
ed fi
sh p
rod
uct
s
Fi
sh p
aste
63
63
Fi
sh s
auce
44
Fi
sh b
alls
5
Fi
sh m
eal
57
7
Sh
rim
p c
rack
ers
1
M
uss
el c
hip
s8
Tabl
e 10
.6 R
anki
ng o
f Pos
t-ha
rves
t and
Pro
cess
ing
Tech
nolo
gies
in th
e Se
lect
ed C
ount
ries
Note
: BAN
= B
angl
ades
h, CH
I = Ch
ina,
IND
= In
dia,
INA
= In
done
sia, M
AL =
Mal
aysia
, PHI
= P
hilip
pine
s, SR
I = Sr
i Lan
ka, T
HA =
Thai
land
, VIE
= V
ietn
am
181CHAPTER 10 | Priority Technologies and National Strategies
canning. In Vietnam, solar/electrical drying is top-
ranked, followed by salting and drying.
National Action Plans
The ranking of technology options (and their underlying methodology and data) provide valuable guidance for a pro-poor investment program on research and development (R & D) and technology promotion. Such an investment program can materialize only within an overall strategy for fisheries. The NAPs provide a broad statement of strategies and viable options for increasing and sustaining benefits from fish production for the poor. The checklists of strategies and options for the selected countries are presented in Tables 10.7 - 10.9.
Bangladesh
In the Bangladesh NAP, high priority is placed on aquaculture. The semi-integrated system of mixed type polyculture in the annually operated fishponds is expected to benefit the poor households. The family-based culture system is popularized in the seasonal ponds. Community-based culture of carps and noninvasive species is recommended for promotion in the inland culture fishery. Extension services made accessible to the poor are aimed at semi-integrated culture systems of tilapia, milkfish, and seabass in ponds, cages, openwater, and brackishwater near the coastal zone. Inland aquaculture is supported by the development of hatcheries and local feeds.
Marine capture technology is directed towards deep-sea fishing, for which marine stock assessment is mentioned as management need. The spillovers of income and employment in the deep-sea fisheries subsector are expected to benefit poor households.
Community-based management is identified as a key strategy in coastal fisheries. Finally, employment alternatives to inshore fishing are to be supported by micro-credit programs under the administration of a non-governmental organization (NGO) and government monitoring, as well as by training for poor fishers to move into agroprocessing.
For fish processing and post-harvest technology, the action plan underscores the need for quality control of fisheries products. Options to be emphasized include the improvement of fish drying and processing technologies, freshwater fish landing centers, and other marketing infrastructures, as well as observance of food safety standards in the export-oriented shrimp processing plants. Regional cooperation is recommended as a means to secure bargaining power in trade negotiations over anti-dumping, labeling, and certification requirements.
China
The NAP for China calls for increased public expenditures on aquaculture and capture fisheries R & D. The strategy for inland and marine aquaculture is based on zoning of fish farm areas and expanding the practice to the vast areas of underutilized water bodies, such as inland saline lakes, offshore seas, and cold waterbodies in the hinterlands, where the bulk of China’s remaining poor reside. There is a need to develop, disseminate, and extend existing pro-poor aquaculture technologies and managerial schemes, such as polyculture of carps, integrated paddy and fish culture, and tilapia culture. The pro-poor technologies embrace important concepts of environment-friendly practices and high quality of cultured fish products.
182 Strategies and Options for Increasing and Sustaining Fisheries and Aquaculture Production to Benefit Poorer Households in Asia
Capture fisheries in China are to be placed under closer management. Marine catch is targeted for zero increase; this is to be carried out by imposing closed seasons, widening no-take areas, reducing the number of fishing firms, and restricting fishing power of vessels. The resulting job displacement is to be mitigated by skill training and microfinance support to shift workers from capture to culture or other activities, such as the recreational fishing industry. Resource enhancement, for both inland and coastal areas, will be pursued by restocking, hatchery development, artificial reefs, and so forth.
Rather than to increase marine capture production, investments will be directed to improving port facilities and establishing an effective marketing system to provide better support and market information. The action plan calls for improving quality control management of aquatic products (production/post-harvest) to comply with food safety standards such as the hazard analysis critical control points (HACCP) and the sanitary and phyto-sanitary (SPS) measures. Tariff reduction on aquatic products should continue. Technologies for fish processing should be developed to increase value of the products and generate employment. There is a need to establish producers’ and traders’ organizations to support marketing and processing, as well as to strengthen cooperation with other concerned sectors, related government agencies, and other countries, particularly in the area of trade negotiations on nontariff barriers and anti-dumping measures.
India
The NAP for India suggests the implementation of a fisheries development strategy based on the following activities:
Adopt a people-centered approach, rather than a commodity-centered approach.
Adopt a systems approach. Prioritize technologies for the poor at
national, regional, and household levels. Build skills and human capital of poor
fishers. Maintain ecological sustainability. Enhance investment and reorient policies
to facilitate percolation of benefits from trade to all sections of society, particularly the poor and women.
Explore the domestic market, so far regarded as a “sleeping giant”.
Innovate and strengthen institutions and policies.
Monitor the development programs, make on-course corrections, and assess the impacts of all programs.
Strengthen the fisheries database and use it for better planning and policymaking in the sector.
Aquaculture should be given high priority in the national fisheries strategies. Technologies of seed production of catfish are to be improved. A hatchery system for the support of aquaculture is to be developed, especially for the domestic market. The extension service system is to be strengthened to upgrade the technical skills of fish farmers in production and processing of fish, and to promote aquaculture among the poor.
Some state governments are advised to treat fisheries at par with agriculture in all aspects, including input subsidies and income tax rebate. For other states, the strategies point at better coordination of fisheries activities with other departments, such as the Irrigation Department. There is also a problem of ownership rights in large
183CHAPTER 10 | Priority Technologies and National Strategies
watersheds that requires immediate attention. Similarly, the policy of land leasing and rights is to be rationalized. Marine aquaculture, recognized for its foreign exchange contribution and its role for reducing poverty and providing livelihood to women, should be developed in accordance with the aforementioned principles.
For capture fisheries, the action plan calls for the formation of self-help groups and cooperatives that may offer a wide range of services to fishers. Post-harvest and processing industry requires the development of infrastructure for market facilitation, fish handling and processing, as well as initiatives for market promotion. Fish drying technologies, water supplies for landing facilities, and ice making need to be improved. Supply bottlenecks in processing should be addressed (such as scarcity of polyethylene sheets for fish drying).
Indonesia
The NAP for Indonesia stresses the incorporation of aquaculture in a rural development program. Tilapia is pinpointed as an aquaculture species for the poor. Promotion will need to cover all aspects of the aquaculture sector, from hatcheries and grow-out, to infrastructure development, human resource development, and market promotion. However, more expensive and export-oriented commodities, such as shrimp, seaweed, and milkfish are still encouraged as they have a potential to generate income and employment for poor fishers and fish farmers.
For capture fisheries, the main goals are food security, income generation, optimal resource use, and economic growth. To achieve these goals, organization of self-help groups is encouraged to
handle input acquisition, market development, and support facilities. Management of fisheries is to be based on co-management, protection of the environment, and positive actions to rehabilitate and enrich resources. For processing and post-harvest activities, the action plan calls for improved fish handling, infrastructure development, and diversification of production to enhance food safety standards. Finally, price policies to be followed include reduction of domestic tariff and non-tariff barriers, as well as collaboration with other countries in the region to overcome non-tariff barriers imposed against Indonesian and other regional products. Malaysia
The current fisheries development plan of Malaysia aims at raising the annual fish production from the current 1.3 million tonnes to 2 million tonnes by the year 2010. This target is distributed as follows:
0.5 million tonnes from deep-sea fisheries;
0.6 million tonnes from aquaculture; and
0.9 million tonnes from coastal fisheries.
These targets entail an almost six-fold increase in aquaculture, but only a 30 percent increase in capture fisheries. Coastal and inland waterbodies in Malaysia are relatively untapped (less than 5% utilization) for aquaculture. Also, farm surveys indicate that the main culture systems, such as cage culture of finfish and pond culture of prawns are viable, generating an average return of over 30 percent to investment. Aquaculture development is, therefore, both a commercially viable and
184 Strategies and Options for Increasing and Sustaining Fisheries and Aquaculture Production to Benefit Poorer Households in Asia
sustainable means to meet rising demand. Private sector participation is expected to feature prominently in future growth of both capture fisheries and aquaculture.
Aquaculture expansion prioritizes high-value species (prawns, snappers, groupers, and tilapia), using proven culture systems (cages and ponds). New aquaculture technologies and species need to be developed; R & D is to be directed into input, to lower costs of feed and fish seed. Infrastructure to provide access to sites, as well as related facilities (hatcheries, cold rooms, etc.) are to be developed. Commercialization of aquaculture would require the development of human resources to provide technical skills for the sector.
The aquaculture industrial zone concept, recently proposed by the government, is a useful approach to develop the aquaculture sector. The zones are areas equipped with all the necessary support facilities (hatcheries, grow-out aquaculture systems, processing, packaging, and marketing) and infrastructure. The right incentives (e.g., pioneer status, export tax exemptions, etc.) are offererd to attract private sector involvement. Small-scale farmer organizations can participate in these ventures. The rural poor can also benefit from the spillovers and other employment opportunities arising from the new growth centers.
As for marine capture fisheries, the overexploitation of coastal fishery resources in Malaysia is well-recognized; hence, increased fish landings are to come largely from offshore fisheries. Coastal production is expected to increase only if fishing capacity can be reduced in overexploited areas. The number of inshore fishers will be reduced by freezing the issuance of new licenses, prohibiting transfer of existing
licenses, and undertaking buyback schemes to reduce fishing efforts in overexploited coastal areas (e.g., the west coast).
The private sector is encouraged to enter new fishing grounds offshore, particularly in the Indian Ocean and waters off Sabah and Sarawak. These areas require large vessels and investments that are beyond the reach of poor fishers. However, the private sector’s participation in deep-sea fishing offers employment opportunities on-board vessels for inshore and poor fishers.
For post-harvest management, processing, and marketing of fisheries products, the action plan targets the development of integrated fish landing ports to support offshore fisheries as well as to attract landings from foreign vessels (e.g., Batu Maung, Tg. Manis and Tok Bali). Inshore fishers are encouraged to participate in offshore venture, marine aquaculture, improved value addition of fisheries products, and other land-based economic activities.
As the main policy objective in increasing fish production is to generate foreign exchange earnings, fish exports must conform to the world trade requirements in terms of food quality and safety assurance. Value-adding, branding, and promoting trade of fishery products can assist penetration in new and existing markets.
Marketability of Malaysian processed and post-harvested products can be enhanced by the farm accreditation schemes for aquaculture enterprises, covering production, post-harvest, and processing aspects. Fish products should be processed in accordance with HACCP and good management practices or other international trade requirements (eco-labeling, traceability, and food security). Finally, market linkages should be established

185CHAPTER 10 | Priority Technologies and National Strategies
and encouraged by way of branding, promoting, and participating in trade fairs.
Philippines
For the Philippines, the national consultation workshop considered 41 aquaculture technology options and arrived at ten priority technologies for pro-poor fish farming. These include seaweed production in marine waters, ornamental fish, shrimp, tilapia, and milkfish. The action plan emphasizes organization of self-help groups, commodity councils and roadmapping, infrastructure and human resource development, and market promotion, all within an aquaculture zoning approach. Management of aquaculture zones shall comply with international codes of good practice. The entire length of the supply loop, from seed producing to grow-out, processing, and marketing stages, shall be targeted for development, in compliance with international product quality standards.
For marine capture fisheries, 23 capture technology options were considered. Identified priorities for the poor are handlines (for finfish, squid, tuna), set nets, and drift gill nets. Fishers’ organizations should be established and strengthened to serve as agencies for pro-poor technologies extension, provision of technical assistance, credit facilitation, and incentive and training programs, while enabling representation in forums for industry dialogues. Laws on protection and conservation require strict enforcement. Finally, options on exploiting non-traditional fishing grounds, aimed at poor fishers, need to be explored.
Under devolution, the local government, in coordination with other agencies, is responsible for fish processing and post-harvest development.
It is encouraged to implement several strategies, namely: improvement of fish processing and post-harvest facilities such as ice-making and cold storage, and village-level processing plants; and comprehensive upgrading of fish handling techniques beginning from fishing-fleet design up to processing and post-harvest management. R & D, with training programs for poor fishers and processors should be undertaken, especially on ways to add value to fish and seaweed products.
Sri Lanka
The strategies and options formulation identified major resource systems and major target groups, and prioritized broad action measures. The action plan calls for community-based organization to establish culture-based fisheries in seasonal waterbodies. Currently, seed for restocking is entirely from government-owned hatcheries, with very few entrepreneurs going into the hatchery business. For aquaculture, the strategy involves establishing a network of hatcheries and grow-out facilities for freshwater fish for urban and export markets. However, this activity should be supported by strategies to increase effective demand from urban and export markets, as well as by the promotion of locally produced feeds and inputs, through participatory R & D.
Commercial shrimp farming is the only substantial brackishwater aquaculture activity. Owing to the lucrative nature of this enterprise, its rapid development has been largely unchecked by environmental and social agencies. Presently, disease outbreaks are blocking the progress of the industry and damaging the surrounding wetland environment. Hence, a disease mitigating strategy needs to be put in place, aimed at restoring environmental health, as well as industry growth.
186 Strategies and Options for Increasing and Sustaining Fisheries and Aquaculture Production to Benefit Poorer Households in Asia
For inland capture fisheries, stakeholder analysis has indicated that regular fishing communities in perennial reservoirs are highly vulnerable to poverty. Given that these irrigation reservoirs are for multiple-use, establishing co-management systems in individual reservoirs is a major alternative solution to the problem. Supplementary measures are to be implemented to enhance fish stocks and conserve habitats where stocks appear to have been depleted.
In recent decades, Sri Lanka has witnessed a boom in its offshore fisheries, produced in both territorial and international waters. While the fisheries are mostly capital-intensive commercial operations, they have created a class of fish workers employed as crew members of multiday and single-day long distance crafts. Offshore fishing, however, requires support in terms of technical improvements and training. Measures should be introduced to enhance the employment and social security of existing workers and to upgrade their skills.
Lagoon and estuarine fisheries along the coastal belt mainly represent brackishwater capture fisheries practiced by small-scale fishing communities. Recently, the livelihoods of these fishers have been threatened mainly by urban activities spilling over into their communities. Loss of habitats and damage to fisheries due to pollution from adjacent areas have been identified as major problems preventing sustainable exploitation of the aquatic resources. Hence, pollution and land use need to be addressed from a wider perspective. The fishers themselves need to be organized in co-management institutions.
Finally, post-harvest losses have been identified by researchers as a critical issue for all types of fish products. Post-harvest problems affect all stages
of the fish supply chain, from the fishing vessel onward. Fish handling and post-harvest losses need to be addressed through a multifaceted strategy. On one hand, it is a matter of establishing a well-developed fish processing industry, which is presently in its infancy in Sri Lanka. On the other hand, it demands upgrading facilities at all levels of fish supply chains, such as cold storage facilities, starting from fishing vessels to processing plants, and finally at the retail outlets. Existing practices of fish handling should also be improved through a strict quality assurance system. As all such improvements require investments, availability of credit is an essential part of overcoming post-harvest losses. For export products, compliance with international standards for food safety is to be ensured by close supervision, monitoring, and control, which further require investment in both improved technologies and training programs.
Thailand
In Thailand, small-scale fish farmers lack capital, management knowledge and experience, as well as access to appropriate technology. They face competition from inexpensive imported fish and have limited bargaining power in product pricing. For the marine fisheries subsector, additional problems include conflicts with other agriculture activities, as well as poor water quality caused by industrial pollution. Disease outbreaks are common, input costs are continually rising, and natural brood stocks are quickly disappearing.
On the capture fisheries side, while the country has benefited greatly from rapid fisheries development, it has also borne tremendous costs of this success. Overfishing has depleted marine resources, and scarcity of supplies has been accompanied by fisheries conflicts among stakeholders. The difficulties are exacerbated by
187CHAPTER 10 | Priority Technologies and National Strategies
rising costs of fishing, particularly for fuel and labor. Shortage of labor in commercial fisheries is still an ongoing problem. For inland capture fisheries, the major problems encountered are resource deterioration and pollution due to rapid urbanization and industrialization.
The NAP for Thailand is formulated in line with the aforementioned considerations. For aquaculture, the emphasis is placed on small-scale production system along with the King’s “sufficient-economy” paradigm. Mollusk culture, intended for poor households, is targeted towards underutilized coastal areas. Credit constraints are addressed by supporting small lending schemes for fish farmers. To increase production, seed quality needs to be improved, and effective measures imposed to control and prevent diseases. Investments in R & D are required to initiate technologies on high-yielding and high-value fish, combined with more effective technology dissemination. Finally, environmental concerns need to be reconciled with regulatory decisions for the long-term development of aquaculture.
Expediting the management of capture fisheries will require speeding up amendments to fisheries laws, reducing excess capacity, and increasing participation of all people in the fishing community. For inland fisheries, the NAP calls for conservation of genetic diversity in wild and domestic stocks, continuing stock enrichment programs in public waters, and better cooperation among researchers, fisheries managers, and fishers.
The government will support post-harvest processing with the provision of facilities, such as central markets, while providing access to microcredit for small-scale fishers and fish processors. Such credit windows will increase
their bargaining power with traders. Fish handling needs to be improved by means of training on quality standards, and technical assistance on new product development. Domestic fish demand can be increased and new “niche” markets formed, through marketing and public awareness campaigns on the nutritional value of fish.
Vietnam
The NAP for Vietnam identifies the priority of pro-poor technologies for aquaculture by focusing on traditional and new species through integrated farming (of crop-fish-livestock), in both inland and marine environments. Broadening market access, providing infrastructure, and building institutional linkages are three ways to develop the fisheries market.
The overexploitation of capture fisheries resources is recognized in Vietnam; hence, management options include reducing overcapacity and enforcing proper regulations. An exit strategy for fishers is envisaged, accompanied by an alternative job generation program outside capture fisheries. The promotion of aquaculture, such as small-scale cage culture of lobster and fish, and community mollusk culture are seen as one way to absorb departing capture fishers, while the government will support a complementary microcredit scheme. Meanwhile, resource enrichment activities will include the establishment of conservation zones, artificial reefs, and fish ranching. In addition, resource enhancement will also be undertaken for reservoir and riverine fisheries. For the remaining fishers, the relevant laws and regulations (closed season, no-take zones, and so on) will be strictly enforced. The NAP recognizes community-based and co-management institutions as a means to manage fisheries resources more effectively to benefit poor households.
188 Strategies and Options for Increasing and Sustaining Fisheries and Aquaculture Production to Benefit Poorer Households in Asia
Modern fish processing and post-harvest technology will be pursued to upgrade traditional processing and post-harvest practices to meet international product and hygiene standards. This measure will require extensive support through training, technical assistance, and credit provision. The employment of female workers in processing and post-harvest handling activities is strongly encouraged.
A synthesis of priority technologies and action strategies
While the foregoing national strategies are country-specific, a number of common issues and responses can be identified. Together with the findings from the previous chapters, the following key points can be made on the national action plans for fisheries.
Demand and supply
1. Fish is a major source of nutrition for the poor in Asia. Demand for fish will continue to rise, in both domestic and foreign markets, due to increasing populations and per capita incomes in the developing world. This implies a continuous scarcity of fish, which, if not met by rapidly growing supplies, will lead to declining fish consumption and pose a threat to food security. Supply and demand projections confirm the likelihood that in at least two cases (Bangladesh and the Philippines), the per capita consumption of fish may fall over the next 15 years.
2. Expanding supplies will have to come from farmed fish rather than fish caught in the wild. The selected DMCs recognize that capture fisheries have reached or are approaching production limits. Significant expansion in
production to meet growing demand and to widen livelihood opportunities can only be sought in aquaculture. For capture fisheries, especially in marine inshore areas, the thrust is to sustain productivity of natural stocks through prudent management.
Aquaculture
3. For aquaculture, supply growth is sought through a combination of productivity improvement and area expansion. The former is pursued by a combination of R & D investment, as well as extension and technical support to close efficiency gaps, which are more prominent in the small-scale, non-intensive sector.
4. Delivering benefits of aquaculture growth to the poor entails prioritization of commodities consumed by the poor, and technologies adopted by enterprises operated by or employing them. At the same time, these commodities should have a favorable market to ensure economic viability and return on development investments. On this score, carp aquaculture and integrated-aquaculture-agriculture systems rate the highest. Depending on the country, other major species (tilapia, catfish, etc.) may also be on the list of priorities.
5. Maintaining sustainability and mitigating environmental deterioration affecting fisheries growth are key concerns. Here, low-value, freshwater aquaculture, while posing its own risks (e.g., invasive species), also rates well against the other capture and culture systems.
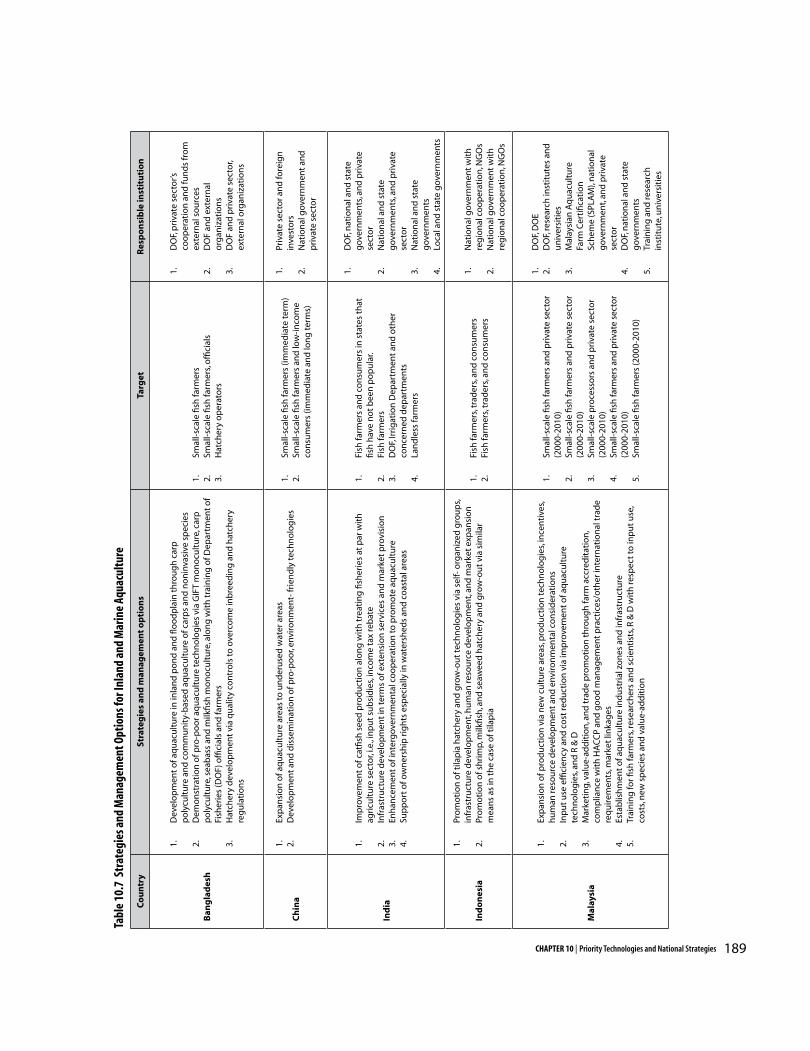
189CHAPTER 10 | Priority Technologies and National Strategies
Co
un
try
Stra
teg
ies
and
man
agem
ent
op
tio
ns
Targ
etR
esp
on
sib
le in
stit
uti
on
Ban
gla
des
h
1.
Dev
elo
pm
ent
of a
qu
acu
ltu
re in
inla
nd
po
nd
an
d fl
oo
dp
lain
th
rou
gh
car
p
po
lycu
ltu
re a
nd
co
mm
un
ity-
bas
ed a
qu
acu
ltu
re o
f car
ps
and
no
nin
vasi
ve s
pec
ies
2.
Dem
on
stra
tio
n o
f pro
-po
or a
qu
acu
ltu
re te
chn
olo
gie
s vi
a G
IFT
mo
no
cult
ure
, car
p
po
lycu
ltu
re, s
eab
ass
and
milk
fish
mo
no
cult
ure
, alo
ng
wit
h t
rain
ing
of D
epar
tmen
t o
f Fi
sher
ies
(DO
F) o
ffici
als
and
farm
ers
3.
Hat
cher
y d
evel
op
men
t vi
a q
ual
ity
con
tro
ls to
ove
rco
me
inb
reed
ing
an
d h
atch
ery
reg
ula
tio
ns
1.
Smal
l-sc
ale
fish
farm
ers
2.
Smal
l-sc
ale
fish
farm
ers,
offi
cial
s3.
H
atch
ery
op
erat
ors
1.
DO
F, p
riva
te s
ecto
r’s
coo
per
atio
n a
nd
fun
ds
fro
m
exte
rnal
so
urc
es2.
D
OF
and
ext
ern
al
org
aniz
atio
ns
3.
DO
F an
d p
riva
te s
ecto
r, ex
tern
al o
rgan
izat
ion
s
Ch
ina
1.
Exp
ansi
on
of a
qu
acu
ltu
re a
reas
to u
nd
eru
sed
wat
er a
reas
2.
Dev
elo
pm
ent
and
dis
sem
inat
ion
of p
ro-p
oo
r, en
viro
nm
ent-
frie
nd
ly te
chn
olo
gie
s1.
Sm
all-
scal
e fis
h fa
rmer
s (im
med
iate
term
)2.
Sm
all-
scal
e fis
h fa
rmer
s an
d lo
w-i
nco
me
con
sum
ers
(imm
edia
te a
nd
lon
g te
rms)
1.
Priv
ate
sect
or a
nd
fore
ign
in
vest
ors
2.
Nat
ion
al g
over
nm
ent
and
p
riva
te s
ecto
r
Ind
ia
1.
Imp
rove
men
t o
f cat
fish
see
d p
rod
uct
ion
alo
ng
wit
h t
reat
ing
fish
erie
s at
par
wit
h
agri
cult
ure
sec
tor,
i.e.,
inp
ut
sub
sid
ies,
inco
me
tax
reb
ate
2.
Infr
astr
uct
ure
dev
elo
pm
ent
in te
rms
of e
xten
sio
n s
ervi
ces
and
mar
ket
pro
visi
on
3.
Enh
ance
men
t o
f in
terg
over
nm
enta
l co
op
erat
ion
to p
rom
ote
aq
uac
ult
ure
4.
Sup
po
rt o
f ow
ner
ship
rig
hts
esp
ecia
lly in
wat
ersh
eds
and
co
asta
l are
as
1.
Fish
farm
ers
and
co
nsu
mer
s in
sta
tes
that
fis
h h
ave
no
t b
een
po
pu
lar.
2.
Fish
farm
ers
3.
DO
F, Ir
rig
atio
n D
epar
tmen
t an
d o
ther
co
nce
rned
dep
artm
ents
4.
Lan
dle
ss fa
rmer
s
1.
DO
F, n
atio
nal
an
d s
tate
g
over
nm
ents
, an
d p
riva
te
sect
or
2.
Nat
ion
al a
nd
sta
te
gov
ern
men
ts, a
nd
pri
vate
se
cto
r3.
N
atio
nal
an
d s
tate
g
over
nm
ents
4.
Loca
l an
d s
tate
gov
ern
men
ts
Ind
on
esia
1.
Pro
mo
tio
n o
f tila
pia
hat
cher
y an
d g
row
-ou
t te
chn
olo
gie
s vi
a se
lf- o
rgan
ized
gro
up
s, in
fras
tru
ctu
re d
evel
op
men
t, h
um
an re
sou
rce
dev
elo
pm
ent,
and
mar
ket
exp
ansi
on
2.
Pro
mo
tio
n o
f sh
rim
p, m
ilkfis
h, a
nd
sea
wee
d h
atch
ery
and
gro
w-o
ut
via
sim
ilar
mea
ns
as in
th
e ca
se o
f tila
pia
1.
Fish
farm
ers,
trad
ers,
and
co
nsu
mer
s2.
Fi
sh fa
rmer
s, tr
ader
s, an
d c
on
sum
ers
1.
Nat
ion
al g
over
nm
ent
wit
h
reg
ion
al c
oo
per
atio
n, N
GO
s2.
N
atio
nal
gov
ern
men
t w
ith
re
gio
nal
co
op
erat
ion
, NG
Os
Mal
aysi
a
1.
Exp
ansi
on
of p
rod
uct
ion
via
new
cu
ltu
re a
reas
, pro
du
ctio
n te
chn
olo
gie
s, in
cen
tive
s, h
um
an re
sou
rce
dev
elo
pm
ent
and
env
iro
nm
enta
l co
nsi
der
atio
ns
2.
Inp
ut
use
effi
cien
cy a
nd
co
st re
du
ctio
n v
ia im
pro
vem
ent
of a
qu
acu
ltu
re
tech
no
log
ies,
and
R &
D3.
M
arke
tin
g, v
alu
e-ad
dit
ion
, an
d t
rad
e p
rom
oti
on
th
rou
gh
farm
acc
red
itat
ion
, co
mp
lian
ce w
ith
HA
CC
P an
d g
oo
d m
anag
emen
t p
ract
ices
/oth
er in
tern
atio
nal
tra
de
req
uir
emen
ts, m
arke
t lin
kag
es4.
Es
tab
lish
men
t o
f aq
uac
ult
ure
ind
ust
rial
zo
nes
an
d in
fras
tru
ctu
re5.
Tr
ain
ing
for fi
sh fa
rmer
s, re
sear
cher
s an
d s
cien
tist
s, R
& D
wit
h re
spec
t to
inp
ut
use
, co
sts,
new
sp
ecie
s an
d v
alu
e-ad
dit
ion
1.
Smal
l-sc
ale
fish
farm
ers
and
pri
vate
sec
tor
(200
0-20
10)
2.
Smal
l-sc
ale
fish
farm
ers
and
pri
vate
sec
tor
(200
0-20
10)
3.
Smal
l-sc
ale
pro
cess
ors
an
d p
riva
te s
ecto
r (2
000-
2010
)4.
Sm
all-
scal
e fis
h fa
rmer
s an
d p
riva
te s
ecto
r (2
000-
2010
)5.
Sm
all-
scal
e fis
h fa
rmer
s (2
000-
2010
)
1.
DO
F, D
OE
2.
DO
F, re
sear
ch in
stit
ute
s an
d
un
iver
siti
es3.
M
alay
sian
Aq
uac
ult
ure
Fa
rm C
erti
ficat
ion
Sc
hem
e (S
PLA
M),
nat
ion
al
gov
ern
men
t, an
d p
riva
te
sect
or
4.
DO
F, n
atio
nal
an
d s
tate
g
over
nm
ents
5.
Trai
nin
g a
nd
rese
arch
in
stit
ute
, un
iver
siti
es
Tabl
e 10
.7 S
trat
egie
s and
Man
agem
ent O
ptio
ns fo
r Inl
and
and
Mar
ine
Aqua
cultu
re
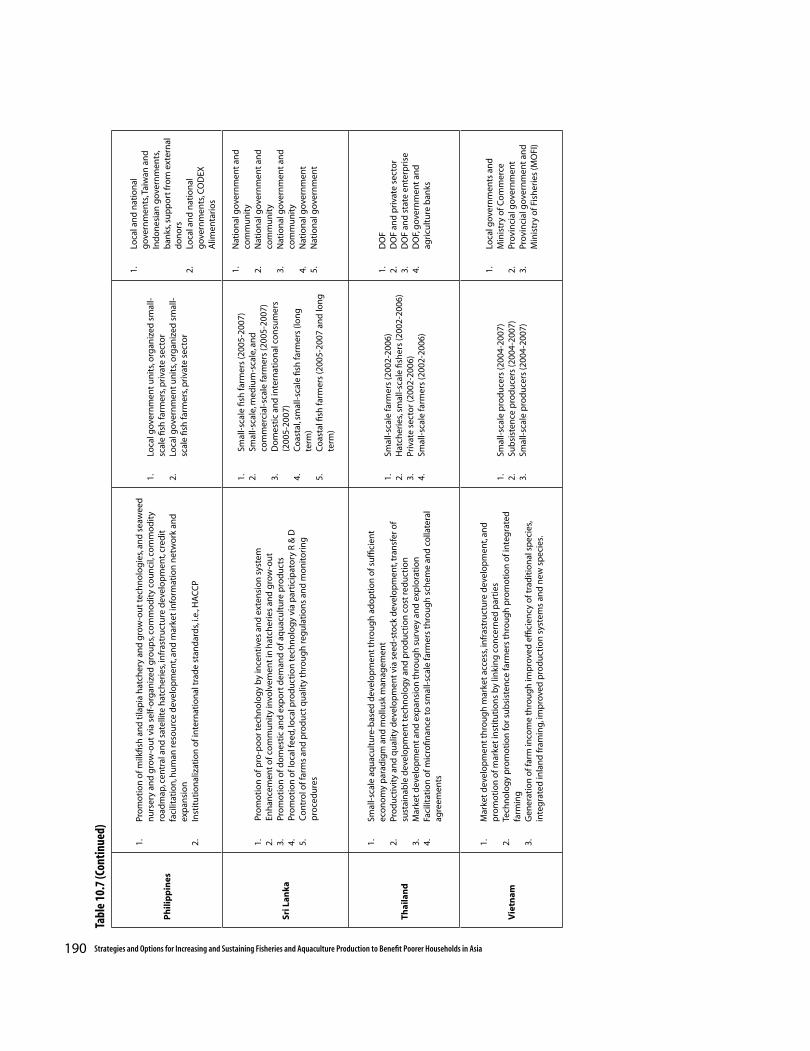
190 Strategies and Options for Increasing and Sustaining Fisheries and Aquaculture Production to Benefit Poorer Households in Asia
Ph
ilip
pin
es
1.
Pro
mo
tio
n o
f milk
fish
an
d t
ilap
ia h
atch
ery
and
gro
w-o
ut
tech
no
log
ies,
and
sea
wee
d
nu
rser
y an
d g
row
-ou
t vi
a se
lf-o
rgan
ized
gro
up
s, co
mm
od
ity
cou
nci
l, co
mm
od
ity
road
map
, cen
tral
an
d s
atel
lite
hat
cher
ies,
infr
astr
uct
ure
dev
elo
pm
ent,
cred
it
faci
litat
ion
, hu
man
reso
urc
e d
evel
op
men
t, an
d m
arke
t in
form
atio
n n
etw
ork
an
d
exp
ansi
on
2.
Inst
itu
tio
nal
izat
ion
of i
nte
rnat
ion
al t
rad
e st
and
ard
s, i.e
., H
AC
CP
1.
Loca
l gov
ern
men
t u
nit
s, o
rgan
ized
sm
all-
scal
e fis
h fa
rmer
s, p
riva
te s
ecto
r2.
Lo
cal g
over
nm
ent
un
its,
org
aniz
ed s
mal
l-sc
ale
fish
farm
ers,
pri
vate
sec
tor
1.
Loca
l an
d n
atio
nal
g
over
nm
ents
, Tai
wan
an
d
Ind
on
esia
n g
over
nm
ents
, b
anks
, su
pp
ort
fro
m e
xter
nal
d
on
ors
2.
Loca
l an
d n
atio
nal
g
over
nm
ents
, CO
DEX
A
limen
tari
os
Sri L
anka
1.
Pro
mo
tio
n o
f pro
-po
or t
ech
no
log
y b
y in
cen
tive
s an
d e
xten
sio
n s
yste
m2.
En
han
cem
ent
of c
om
mu
nit
y in
volv
emen
t in
hat
cher
ies
and
gro
w-o
ut
3.
Pro
mo
tio
n o
f do
mes
tic
and
exp
ort
dem
and
of a
qu
acu
ltu
re p
rod
uct
s4.
Pr
om
oti
on
of l
oca
l fee
d, lo
cal p
rod
uct
ion
tech
no
log
y vi
a p
arti
cip
ato
ry R
& D
5.
Co
ntr
ol o
f far
ms
and
pro
du
ct q
ual
ity
thro
ug
h re
gu
lati
on
s an
d m
on
ito
rin
g
pro
ced
ure
s
1.
Smal
l-sc
ale
fish
farm
ers
(200
5-20
07)
2.
Smal
l-sc
ale,
med
ium
-sca
le, a
nd
co
mm
erci
al-s
cale
farm
ers
(200
5-20
07)
3.
Do
mes
tic
and
inte
rnat
ion
al c
on
sum
ers
(200
5-20
07)
4.
Co
asta
l, sm
all-
scal
e fis
h fa
rmer
s (lo
ng
te
rm)
5.
Co
asta
l fish
farm
ers
(200
5-20
07 a
nd
lon
g
term
)
1.
Nat
ion
al g
over
nm
ent
and
co
mm
un
ity
2.
Nat
ion
al g
over
nm
ent
and
co
mm
un
ity
3.
Nat
ion
al g
over
nm
ent
and
co
mm
un
ity
4.
Nat
ion
al g
over
nm
ent
5.
Nat
ion
al g
over
nm
ent
Thai
lan
d
1.
Smal
l-sc
ale
aqu
acu
ltu
re-b
ased
dev
elo
pm
ent
thro
ug
h a
do
pti
on
of s
uffi
cien
t ec
on
om
y p
arad
igm
an
d m
ollu
sk m
anag
emen
t2.
Pr
od
uct
ivit
y an
d q
ual
ity
dev
elo
pm
ent
via
seed
-sto
ck d
evel
op
men
t, tr
ansf
er o
f su
stai
nab
le d
evel
op
men
t te
chn
olo
gy
and
pro
du
ctio
n c
ost
red
uct
ion
3.
Mar
ket
dev
elo
pm
ent
and
exp
ansi
on
th
rou
gh
su
rvey
an
d e
xplo
rati
on
4.
Faci
litat
ion
of m
icro
finan
ce to
sm
all-
scal
e fa
rmer
s th
rou
gh
sch
eme
and
co
llate
ral
agre
emen
ts
1.
Smal
l-sc
ale
farm
ers
(200
2-20
06)
2.
Hat
cher
ies,
smal
l-sc
ale
fish
ers
(200
2-20
06)
3.
Priv
ate
sect
or (
2002
-200
6)4.
Sm
all-
scal
e fa
rmer
s (2
002-
2006
)
1.
DO
F2.
D
OF
and
pri
vate
sec
tor
3.
DO
F an
d s
tate
en
terp
rise
4.
DO
F, g
over
nm
ent
and
ag
ricu
ltu
re b
anks
Vie
tnam
1.
Mar
ket
dev
elo
pm
ent
thro
ug
h m
arke
t ac
cess
, in
fras
tru
ctu
re d
evel
op
men
t, an
d
pro
mo
tio
n o
f mar
ket
inst
itu
tio
ns
by
linki
ng
co
nce
rned
par
ties
2.
Tech
no
log
y p
rom
oti
on
for s
ub
sist
ence
farm
ers
thro
ug
h p
rom
oti
on
of i
nte
gra
ted
fa
rmin
g3.
G
ener
atio
n o
f far
m in
com
e th
rou
gh
imp
rove
d e
ffici
ency
of t
rad
itio
nal
sp
ecie
s, in
teg
rate
d in
lan
d fr
amin
g, im
pro
ved
pro
du
ctio
n s
yste
ms
and
new
sp
ecie
s.
1.
Smal
l-sc
ale
pro
du
cers
(200
4-20
07)
2.
Sub
sist
ence
pro
du
cers
(200
4-20
07)
3.
Smal
l-sc
ale
pro
du
cers
(200
4-20
07)
1.
Loca
l gov
ern
men
ts a
nd
M
inis
try
of C
om
mer
ce2.
Pr
ovin
cial
gov
ern
men
t3.
Pr
ovin
cial
gov
ern
men
t an
d
Min
istr
y o
f Fis
her
ies
(MO
FI)
Tabl
e 10
.7 (C
ontin
ued)
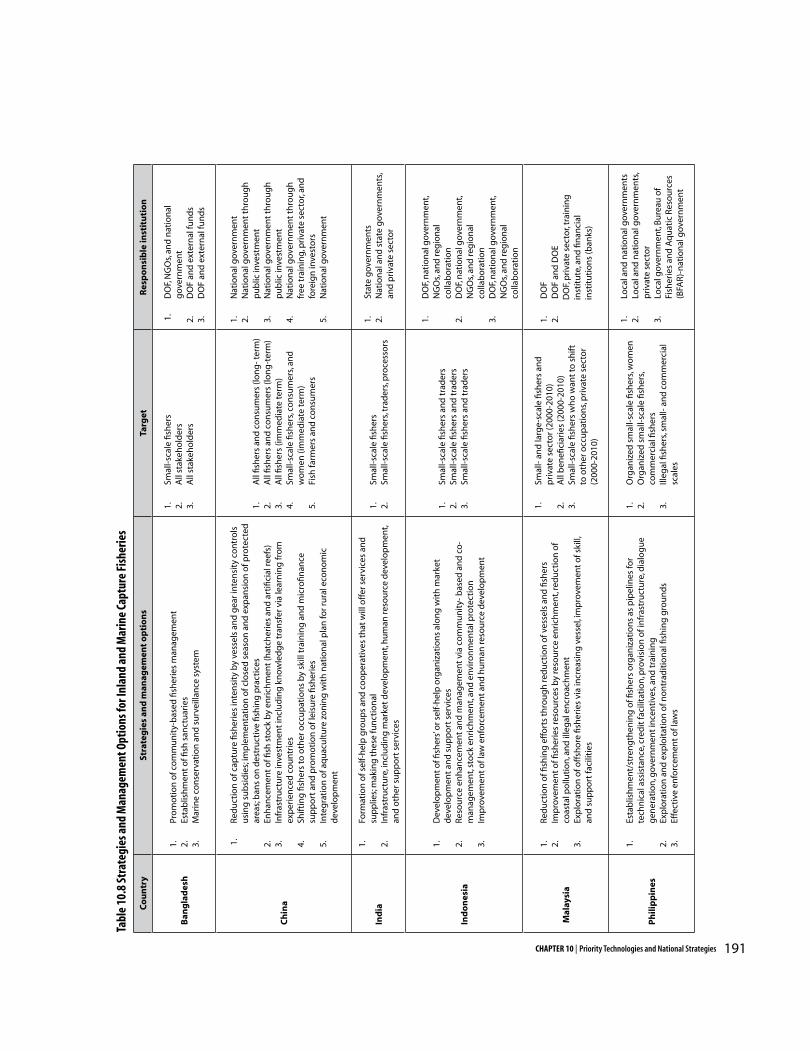
191CHAPTER 10 | Priority Technologies and National Strategies
Co
un
try
Stra
teg
ies
and
man
agem
ent
op
tio
ns
Targ
etR
esp
on
sib
le in
stit
uti
on
Ban
gla
des
h1.
Pr
om
oti
on
of c
om
mu
nit
y-b
ased
fish
erie
s m
anag
emen
t2.
Es
tab
lish
men
t o
f fish
san
ctu
arie
s3.
M
arin
e co
nse
rvat
ion
an
d s
urv
eilla
nce
sys
tem
1.
Smal
l-sc
ale
fish
ers
2.
All
stak
eho
lder
s3.
A
ll st
akeh
old
ers
1.
DO
F, N
GO
s, an
d n
atio
nal
g
over
nm
ent
2.
DO
F an
d e
xter
nal
fun
ds
3.
DO
F an
d e
xter
nal
fun
ds
Ch
ina
1.
Red
uct
ion
of c
aptu
re fi
sher
ies
inte
nsi
ty b
y ve
ssel
s an
d g
ear i
nte
nsi
ty c
on
tro
ls
usi
ng
su
bsi
die
s; im
ple
men
tati
on
of c
lose
d s
easo
n a
nd
exp
ansi
on
of p
rote
cted
ar
eas;
ban
s o
n d
estr
uct
ive
fish
ing
pra
ctic
es2.
En
han
cem
ent
of fi
sh s
tock
by
enri
chm
ent
(hat
cher
ies
and
art
ifici
al re
efs)
3.
Infr
astr
uct
ure
inve
stm
ent
incl
ud
ing
kn
ow
led
ge
tran
sfer
via
lear
nin
g fr
om
ex
per
ien
ced
co
un
trie
s4.
Sh
iftin
g fi
sher
s to
oth
er o
ccu
pat
ion
s b
y sk
ill t
rain
ing
an
d m
icro
finan
ce
sup
po
rt a
nd
pro
mo
tio
n o
f lei
sure
fish
erie
s5.
In
teg
rati
on
of a
qu
acu
ltu
re z
on
ing
wit
h n
atio
nal
pla
n fo
r ru
ral e
con
om
ic
dev
elo
pm
ent
1.
All
fish
ers
and
co
nsu
mer
s (lo
ng
- ter
m)
2.
All
fish
ers
and
co
nsu
mer
s (lo
ng
-ter
m)
3.
All
fish
ers
(imm
edia
te te
rm)
4.
Smal
l-sc
ale
fish
ers,
con
sum
ers,
and
w
om
en (i
mm
edia
te te
rm)
5.
Fish
farm
ers
and
co
nsu
mer
s
1.
Nat
ion
al g
over
nm
ent
2.
Nat
ion
al g
over
nm
ent
thro
ug
h
pu
blic
inve
stm
ent
3.
Nat
ion
al g
over
nm
ent
thro
ug
h
pu
blic
inve
stm
ent
4.
Nat
ion
al g
over
nm
ent
thro
ug
h
free
tra
inin
g, p
riva
te s
ecto
r, an
d
fore
ign
inve
sto
rs5.
N
atio
nal
gov
ern
men
t
Ind
ia
1.
Form
atio
n o
f sel
f-h
elp
gro
up
s an
d c
oo
per
ativ
es t
hat
will
off
er s
ervi
ces
and
su
pp
lies;
mak
ing
th
ese
fun
ctio
nal
2.
Infr
astr
uct
ure
, in
clu
din
g m
arke
t d
evel
op
men
t, h
um
an re
sou
rce
dev
elo
pm
ent,
and
oth
er s
up
po
rt s
ervi
ces
1.
Smal
l-sc
ale
fish
ers
2.
Smal
l-sc
ale
fish
ers,
trad
ers,
pro
cess
ors
1.
Stat
e g
over
nm
ents
2.
Nat
ion
al a
nd
sta
te g
over
nm
ents
, an
d p
riva
te s
ecto
r
Ind
on
esia
1.
Dev
elo
pm
ent
of fi
sher
s’ o
r sel
f-h
elp
org
aniz
atio
ns
alo
ng
wit
h m
arke
t d
evel
op
men
t an
d s
up
po
rt s
ervi
ces
2.
Res
ou
rce
enh
ance
men
t an
d m
anag
emen
t vi
a co
mm
un
ity-
bas
ed a
nd
co
-m
anag
emen
t, st
ock
en
rich
men
t, an
d e
nvir
on
men
tal p
rote
ctio
n3.
Im
pro
vem
ent
of l
aw e
nfo
rcem
ent
and
hu
man
reso
urc
e d
evel
op
men
t
1.
Smal
l-sc
ale
fish
ers
and
tra
der
s2.
Sm
all-
scal
e fis
her
s an
d t
rad
ers
3.
Smal
l-sc
ale
fish
ers
and
tra
der
s
1.
DO
F, n
atio
nal
gov
ern
men
t, N
GO
s, an
d re
gio
nal
co
llab
ora
tio
n2.
D
OF,
nat
ion
al g
over
nm
ent,
NG
Os,
and
reg
ion
al
colla
bo
rati
on
3.
DO
F, n
atio
nal
gov
ern
men
t, N
GO
s, an
d re
gio
nal
co
llab
ora
tio
n
Mal
aysi
a
1.
Red
uct
ion
of fi
shin
g e
ffo
rts
thro
ug
h re
du
ctio
n o
f ves
sels
an
d fi
sher
s2.
Im
pro
vem
ent
of fi
sher
ies
reso
urc
es b
y re
sou
rce
enri
chm
ent,
red
uct
ion
of
coas
tal p
ollu
tio
n, a
nd
ille
gal
en
cro
ach
men
t3.
Ex
plo
rati
on
of o
ffsh
ore
fish
erie
s vi
a in
crea
sin
g v
esse
l, im
pro
vem
ent
of s
kill,
an
d s
up
po
rt fa
cilit
ies
1.
Smal
l- a
nd
larg
e-sc
ale
fish
ers
and
p
riva
te s
ecto
r (20
00-2
010)
2.
All
ben
efici
arie
s (2
000-
2010
)3.
Sm
all-
scal
e fis
her
s w
ho
wan
t to
sh
ift
to o
ther
occ
up
atio
ns,
pri
vate
sec
tor
(200
0-20
10)
1.
DO
F2.
D
OF
and
DO
ED
OF,
pri
vate
sec
tor,
trai
nin
g
inst
itu
te, a
nd
fin
anci
al
inst
itu
tio
ns
(ban
ks)
Ph
ilip
pin
es
1.
Esta
blis
hm
ent/
stre
ng
then
ing
of fi
sher
s o
rgan
izat
ion
s as
pip
elin
es fo
r te
chn
ical
ass
ista
nce
, cre
dit
faci
litat
ion
, pro
visi
on
of i
nfr
astr
uct
ure
, dia
log
ue
gen
erat
ion
, gov
ern
men
t in
cen
tive
s, an
d t
rain
ing
2.
Exp
lora
tio
n a
nd
exp
loit
atio
n o
f no
ntr
adit
ion
al fi
shin
g g
rou
nd
s3.
Ef
fect
ive
enfo
rcem
ent
of l
aws
1.
Org
aniz
ed s
mal
l-sc
ale
fish
ers,
wo
men
2.
Org
aniz
ed s
mal
l-sc
ale
fish
ers,
com
mer
cial
fish
ers
3.
Illeg
al fi
sher
s, sm
all-
an
d c
om
mer
cial
sc
ales
1.
Loca
l an
d n
atio
nal
gov
ern
men
ts2.
Lo
cal a
nd
nat
ion
al g
over
nm
ents
, p
riva
te s
ecto
r3.
Lo
cal g
over
nm
ent,
Bu
reau
of
Fish
erie
s an
d A
qu
atic
Res
ou
rces
(B
FAR)
-nat
ion
al g
over
nm
ent
Tabl
e 10
.8 S
trat
egie
s and
Man
agem
ent O
ptio
ns fo
r Inl
and
and
Mar
ine
Capt
ure
Fish
erie
s
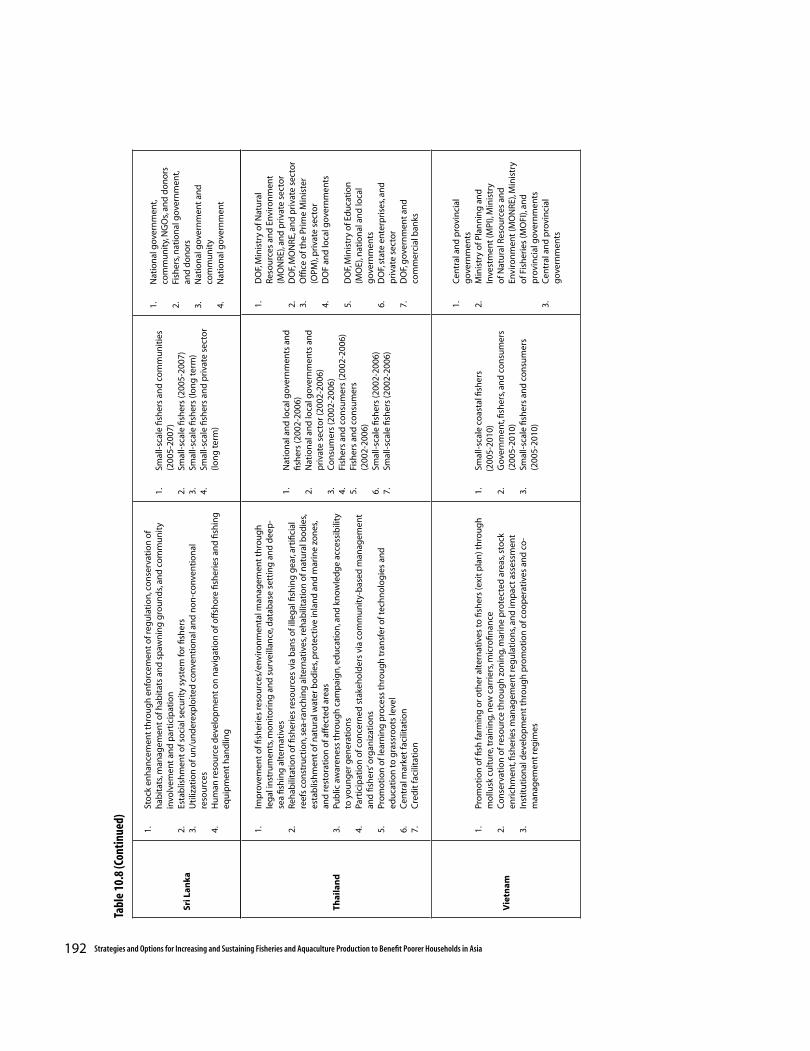
192 Strategies and Options for Increasing and Sustaining Fisheries and Aquaculture Production to Benefit Poorer Households in Asia
Sri L
anka
1.
Sto
ck e
nh
ance
men
t th
rou
gh
en
forc
emen
t o
f reg
ula
tio
n, c
on
serv
atio
n o
f h
abit
ats,
man
agem
ent
of h
abit
ats
and
sp
awn
ing
gro
un
ds,
and
co
mm
un
ity
invo
lvem
ent
and
par
tici
pat
ion
2.
Esta
blis
hm
ent
of s
oci
al s
ecu
rity
sys
tem
for fi
sher
s3.
U
tiliz
atio
n o
f un
/un
der
exp
loit
ed c
onv
enti
on
al a
nd
no
n-c
onv
enti
on
al
reso
urc
es4.
H
um
an re
sou
rce
dev
elo
pm
ent
on
nav
igat
ion
of o
ffsh
ore
fish
erie
s an
d fi
shin
g
equ
ipm
ent
han
dlin
g
1.
Smal
l-sc
ale
fish
ers
and
co
mm
un
itie
s (2
005-
2007
)2.
Sm
all-
scal
e fis
her
s (2
005-
2007
)3.
Sm
all-
scal
e fis
her
s (lo
ng
term
)4.
Sm
all-
scal
e fis
her
s an
d p
riva
te s
ecto
r (lo
ng
term
)
1.
Nat
ion
al g
over
nm
ent,
com
mu
nit
y, N
GO
s, an
d d
on
ors
2.
Fish
ers,
nat
ion
al g
over
nm
ent,
and
do
no
rs3.
N
atio
nal
gov
ern
men
t an
d
com
mu
nit
y4.
N
atio
nal
gov
ern
men
t
Tabl
e 10
.8 (C
ontin
ued)
Thai
lan
d
1.
Imp
rove
men
t o
f fish
erie
s re
sou
rces
/env
iro
nm
enta
l man
agem
ent
thro
ug
h
leg
al in
stru
men
ts, m
on
ito
rin
g a
nd
su
rvei
llan
ce, d
atab
ase
sett
ing
an
d d
eep
-se
a fis
hin
g a
lter
nat
ives
2.
Reh
abili
tati
on
of fi
sher
ies
reso
urc
es v
ia b
ans
of i
lleg
al fi
shin
g g
ear,
arti
ficia
l re
efs
con
stru
ctio
n, s
ea-r
anch
ing
alt
ern
ativ
es, r
ehab
ilita
tio
n o
f nat
ura
l bo
die
s, es
tab
lish
men
t o
f nat
ura
l wat
er b
od
ies,
pro
tect
ive
inla
nd
an
d m
arin
e zo
nes
, an
d re
sto
rati
on
of a
ffec
ted
are
as3.
Pu
blic
aw
aren
ess
thro
ug
h c
amp
aig
n, e
du
cati
on
, an
d k
no
wle
dg
e ac
cess
ibili
ty
to y
ou
ng
er g
ener
atio
ns
4.
Part
icip
atio
n o
f co
nce
rned
sta
keh
old
ers
via
com
mu
nit
y-b
ased
man
agem
ent
and
fish
ers’
org
aniz
atio
ns
5.
Pro
mo
tio
n o
f lea
rnin
g p
roce
ss t
hro
ug
h t
ran
sfer
of t
ech
no
log
ies
and
ed
uca
tio
n to
gra
ssro
ots
leve
l 6.
C
entr
al m
arke
t fa
cilit
atio
n7.
C
red
it fa
cilit
atio
n
1.
Nat
ion
al a
nd
loca
l gov
ern
men
ts a
nd
fis
her
s (2
002-
2006
)2.
N
atio
nal
an
d lo
cal g
over
nm
ents
an
d
pri
vate
sec
tor (
2002
-200
6)3.
C
on
sum
ers
(200
2-20
06)
4.
Fish
ers
and
co
nsu
mer
s (2
002-
2006
)5.
Fi
sher
s an
d c
on
sum
ers
(200
2-20
06)
6.
Smal
l-sc
ale
fish
ers
(200
2-20
06)
7.
Smal
l-sc
ale
fish
ers
(200
2-20
06)
1.
DO
F, M
inis
try
of N
atu
ral
Res
ou
rces
an
d E
nvir
on
men
t (M
ON
RE),
and
pri
vate
sec
tor
2.
DO
F, M
ON
RE, a
nd
pri
vate
sec
tor
3.
Offi
ce o
f th
e Pr
ime
Min
iste
r (O
PM),
pri
vate
sec
tor
4.
DO
F an
d lo
cal g
over
nm
ents
5.
DO
F, M
inis
try
of E
du
cati
on
(M
OE)
, nat
ion
al a
nd
loca
l g
over
nm
ents
6.
DO
F, st
ate
ente
rpri
ses,
and
p
riva
te s
ecto
r7.
D
OF,
gov
ern
men
t an
d
com
mer
cial
ban
ks
Vie
tnam
1.
Pro
mo
tio
n o
f fish
farm
ing
or o
ther
alt
ern
ativ
es to
fish
ers
(exi
t p
lan
) th
rou
gh
m
ollu
sk c
ult
ure
, tra
inin
g, n
ew c
arri
ers,
mic
rofin
ance
2.
Co
nse
rvat
ion
of r
eso
urc
e th
rou
gh
zo
nin
g, m
arin
e p
rote
cted
are
as, s
tock
en
rich
men
t, fis
her
ies
man
agem
ent
reg
ula
tio
ns,
and
imp
act
asse
ssm
ent
3.
Inst
itu
tio
nal
dev
elo
pm
ent
thro
ug
h p
rom
oti
on
of c
oo
per
ativ
es a
nd
co
-m
anag
emen
t re
gim
es
1.
Smal
l-sc
ale
coas
tal fi
sher
s(2
005-
2010
)2.
G
over
nm
ent,
fish
ers,
and
co
nsu
mer
s (2
005-
2010
)3.
Sm
all-
scal
e fis
her
s an
d c
on
sum
ers
(200
5-20
10)
1.
Cen
tral
an
d p
rovi
nci
al
gov
ern
men
ts2.
M
inis
try
of P
lan
nin
g a
nd
In
vest
men
t (M
PI),
Min
istr
y o
f Nat
ura
l Res
ou
rces
an
d
Envi
ron
men
t (M
ON
RE),
Min
istr
y o
f Fis
her
ies
(MO
FI),
and
p
rovi
nci
al g
over
nm
ents
3.
Cen
tral
an
d p
rovi
nci
al
gov
ern
men
ts
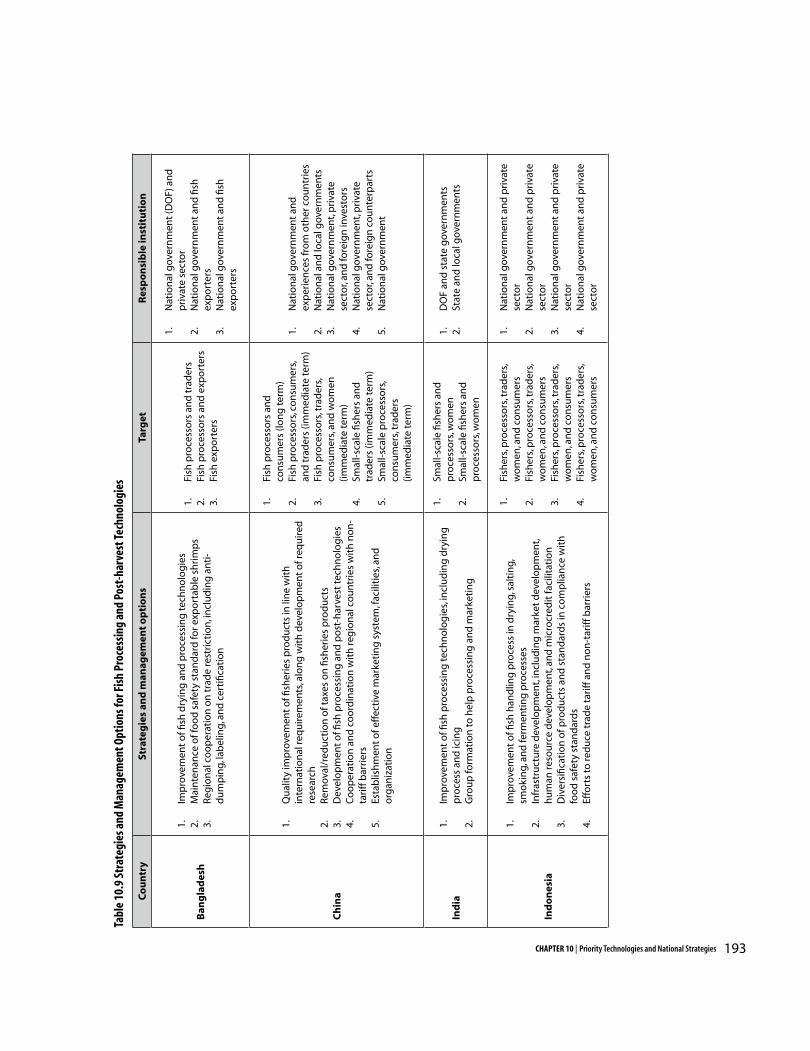
193CHAPTER 10 | Priority Technologies and National Strategies
Co
un
try
Stra
teg
ies
and
man
agem
ent
op
tio
ns
Targ
etR
esp
on
sib
le in
stit
uti
on
Ban
gla
des
h
1.
Imp
rove
men
t o
f fish
dry
ing
an
d p
roce
ssin
g te
chn
olo
gie
s2.
M
ain
ten
ance
of f
oo
d s
afet
y st
and
ard
for e
xpo
rtab
le s
hri
mp
s3.
R
egio
nal
co
op
erat
ion
on
tra
de
rest
rict
ion
, in
clu
din
g a
nti
- d
um
pin
g, la
bel
ing,
an
d c
erti
ficat
ion
1.
Fish
pro
cess
ors
an
d t
rad
ers
2.
Fish
pro
cess
ors
an
d e
xpo
rter
s3.
Fi
sh e
xpo
rter
s
1.
Nat
ion
al g
over
nm
ent
(DO
F) a
nd
p
riva
te s
ecto
r2.
N
atio
nal
gov
ern
men
t an
d fi
sh
exp
ort
ers
3.
Nat
ion
al g
over
nm
ent
and
fish
ex
po
rter
s
Ch
ina
1.
Qu
alit
y im
pro
vem
ent
of fi
sher
ies
pro
du
cts
in li
ne
wit
h
inte
rnat
ion
al re
qu
irem
ents
, alo
ng
wit
h d
evel
op
men
t o
f req
uir
ed
rese
arch
2.
Rem
oval
/red
uct
ion
of t
axes
on
fish
erie
s p
rod
uct
s3.
D
evel
op
men
t o
f fish
pro
cess
ing
an
d p
ost
-har
vest
tech
no
log
ies
4.
Co
op
erat
ion
an
d c
oo
rdin
atio
n w
ith
reg
ion
al c
ou
ntr
ies
wit
h n
on
-ta
riff
bar
rier
s5.
Es
tab
lish
men
t o
f eff
ecti
ve m
arke
tin
g s
yste
m, f
acili
ties
, an
d
org
aniz
atio
n
1.
Fish
pro
cess
ors
an
d
con
sum
ers
(lon
g te
rm)
2.
Fish
pro
cess
ors
, co
nsu
mer
s, an
d t
rad
ers
(imm
edia
te te
rm)
3.
Fish
pro
cess
ors
, tra
der
s, co
nsu
mer
s, an
d w
om
en
(imm
edia
te te
rm)
4.
Smal
l-sc
ale
fish
ers
and
tr
ader
s (im
med
iate
term
)5.
Sm
all-
scal
e p
roce
sso
rs,
con
sum
ers,
trad
ers
(imm
edia
te te
rm)
1.
Nat
ion
al g
over
nm
ent
and
ex
per
ien
ces
fro
m o
ther
co
un
trie
s2.
N
atio
nal
an
d lo
cal g
over
nm
ents
3.
Nat
ion
al g
over
nm
ent,
pri
vate
se
cto
r, an
d fo
reig
n in
vest
ors
4.
Nat
ion
al g
over
nm
ent,
pri
vate
se
cto
r, an
d fo
reig
n c
ou
nte
rpar
ts5.
N
atio
nal
gov
ern
men
t
Ind
ia1.
Im
pro
vem
ent
of fi
sh p
roce
ssin
g te
chn
olo
gie
s, in
clu
din
g d
ryin
g
pro
cess
an
d ic
ing
2.
Gro
up
form
atio
n to
hel
p p
roce
ssin
g a
nd
mar
keti
ng
1.
Smal
l-sc
ale
fish
ers
and
p
roce
sso
rs, w
om
en2.
Sm
all-
scal
e fis
her
s an
d
pro
cess
ors
, wo
men
1.
DO
F an
d s
tate
gov
ern
men
ts2.
St
ate
and
loca
l gov
ern
men
ts
Ind
on
esia
1.
Imp
rove
men
t o
f fish
han
dlin
g p
roce
ss in
dry
ing,
sal
tin
g,
smo
kin
g, a
nd
ferm
enti
ng
pro
cess
es2.
In
fras
tru
ctu
re d
evel
op
men
t, in
clu
din
g m
arke
t d
evel
op
men
t, h
um
an re
sou
rce
dev
elo
pm
ent,
and
mic
rocr
edit
faci
litat
ion
3.
Div
ersi
ficat
ion
of p
rod
uct
s an
d s
tan
dar
ds
in c
om
plia
nce
wit
h
foo
d s
afet
y st
and
ard
s4.
Ef
fort
s to
red
uce
tra
de
tari
ff a
nd
no
n-t
ariff
bar
rier
s
1.
Fish
ers,
pro
cess
ors
, tra
der
s, w
om
en, a
nd
co
nsu
mer
s2.
Fi
sher
s, p
roce
sso
rs, t
rad
ers,
wo
men
, an
d c
on
sum
ers
3.
Fish
ers,
pro
cess
ors
, tra
der
s, w
om
en, a
nd
co
nsu
mer
s4.
Fi
sher
s, p
roce
sso
rs, t
rad
ers,
wo
men
, an
d c
on
sum
ers
1.
Nat
ion
al g
over
nm
ent
and
pri
vate
se
cto
r2.
N
atio
nal
gov
ern
men
t an
d p
riva
te
sect
or
3.
Nat
ion
al g
over
nm
ent
and
pri
vate
se
cto
r4.
N
atio
nal
gov
ern
men
t an
d p
riva
te
sect
or
Tabl
e 10
.9 S
trat
egie
s and
Man
agem
ent O
ptio
ns fo
r Fis
h Pr
oces
sing
and
Pos
t-ha
rves
t Tec
hnol
ogie
s
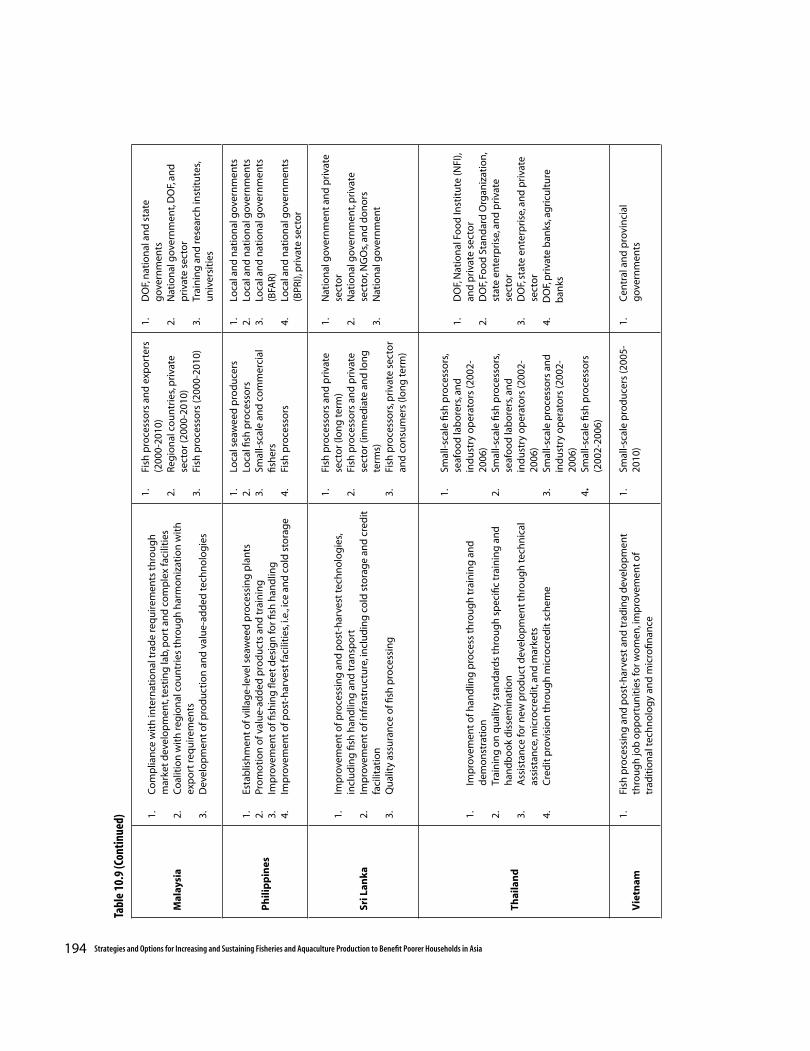
194 Strategies and Options for Increasing and Sustaining Fisheries and Aquaculture Production to Benefit Poorer Households in Asia
Mal
aysi
a
1.
Co
mp
lian
ce w
ith
inte
rnat
ion
al t
rad
e re
qu
irem
ents
th
rou
gh
m
arke
t d
evel
op
men
t, te
stin
g la
b, p
ort
an
d c
om
ple
x fa
cilit
ies
2.
Co
alit
ion
wit
h re
gio
nal
co
un
trie
s th
rou
gh
har
mo
niz
atio
n w
ith
ex
po
rt re
qu
irem
ents
3.
Dev
elo
pm
ent
of p
rod
uct
ion
an
d v
alu
e-ad
ded
tech
no
log
ies
1.
Fish
pro
cess
ors
an
d e
xpo
rter
s (2
000-
2010
)2.
R
egio
nal
co
un
trie
s, p
riva
te
sect
or (
2000
-201
0)3.
Fi
sh p
roce
sso
rs (2
000-
2010
)
1.
DO
F, n
atio
nal
an
d s
tate
g
over
nm
ents
2.
Nat
ion
al g
over
nm
ent,
DO
F, an
d
pri
vate
sec
tor
3.
Trai
nin
g a
nd
rese
arch
inst
itu
tes,
un
iver
siti
es
Ph
ilip
pin
es
1.
Esta
blis
hm
ent
of v
illag
e-le
vel s
eaw
eed
pro
cess
ing
pla
nts
2.
Pro
mo
tio
n o
f val
ue-
add
ed p
rod
uct
s an
d t
rain
ing
3.
Imp
rove
men
t o
f fish
ing
flee
t d
esig
n fo
r fish
han
dlin
g
4.
Imp
rove
men
t o
f po
st-h
arve
st fa
cilit
ies,
i.e.,
ice
and
co
ld s
tora
ge
1.
Loca
l sea
wee
d p
rod
uce
rs
2.
Loca
l fish
pro
cess
ors
3.
Smal
l-sc
ale
and
co
mm
erci
al
fish
ers
4.
Fish
pro
cess
ors
1.
Loca
l an
d n
atio
nal
gov
ern
men
ts2.
Lo
cal a
nd
nat
ion
al g
over
nm
ents
3.
Loca
l an
d n
atio
nal
gov
ern
men
ts
(BFA
R)4.
Lo
cal a
nd
nat
ion
al g
over
nm
ents
(B
PRI),
pri
vate
sec
tor
Sri L
anka
1.
Imp
rove
men
t o
f pro
cess
ing
an
d p
ost
-har
vest
tech
no
log
ies,
incl
ud
ing
fish
han
dlin
g a
nd
tra
nsp
ort
2.
Imp
rove
men
t o
f in
fras
tru
ctu
re, i
ncl
ud
ing
co
ld s
tora
ge
and
cre
dit
fa
cilit
atio
n3.
Q
ual
ity
assu
ran
ce o
f fish
pro
cess
ing
1.
Fish
pro
cess
ors
an
d p
riva
te
sect
or (
lon
g te
rm)
2.
Fish
pro
cess
ors
an
d p
riva
te
sect
or (
imm
edia
te a
nd
lon
g
term
s)3.
Fi
sh p
roce
sso
rs, p
riva
te s
ecto
r an
d c
on
sum
ers
(lon
g te
rm)
1.
Nat
ion
al g
over
nm
ent
and
pri
vate
se
cto
r2.
N
atio
nal
gov
ern
men
t, p
riva
te
sect
or,
NG
Os,
and
do
no
rs3.
N
atio
nal
gov
ern
men
t
Thai
lan
d
1.
Imp
rove
men
t o
f han
dlin
g p
roce
ss t
hro
ug
h t
rain
ing
an
d
dem
on
stra
tio
n2.
Tr
ain
ing
on
qu
alit
y st
and
ard
s th
rou
gh
sp
ecifi
c tr
ain
ing
an
d
han
db
oo
k d
isse
min
atio
n3.
A
ssis
tan
ce fo
r new
pro
du
ct d
evel
op
men
t th
rou
gh
tech
nic
al
assi
stan
ce, m
icro
cred
it, a
nd
mar
kets
4.
Cre
dit
pro
visi
on
th
rou
gh
mic
rocr
edit
sch
eme
1.
Smal
l-sc
ale
fish
pro
cess
ors
, se
afo
od
lab
ore
rs, a
nd
in
du
stry
op
erat
ors
(200
2-20
06)
2.
Smal
l-sc
ale
fish
pro
cess
ors
, se
afo
od
lab
ore
rs, a
nd
in
du
stry
op
erat
ors
(200
2-20
06)
3.
Smal
l-sc
ale
pro
cess
ors
an
d
ind
ust
ry o
per
ato
rs (2
002-
2006
)4.
Sm
all-
scal
e fis
h p
roce
sso
rs
(200
2-20
06)
1.
DO
F, N
atio
nal
Fo
od
Inst
itu
te (N
FI),
and
pri
vate
sec
tor
2.
DO
F, Fo
od
Sta
nd
ard
Org
aniz
atio
n,
stat
e en
terp
rise
, an
d p
riva
te
sect
or
3.
DO
F, st
ate
ente
rpri
se, a
nd
pri
vate
se
cto
r 4.
DO
F, p
riva
te b
anks
, ag
ricu
ltu
re
b
anks
Vie
tnam
1.
Fish
pro
cess
ing
an
d p
ost
-har
vest
an
d t
rad
ing
dev
elo
pm
ent
thro
ug
h jo
b o
pp
ort
un
itie
s fo
r wo
men
, im
pro
vem
ent
of
trad
itio
nal
tech
no
log
y an
d m
icro
finan
ce
1.
Smal
l-sc
ale
pro
du
cers
(200
5-20
10)
1.
Cen
tral
an
d p
rovi
nci
al
gov
ern
men
ts
Tabl
e 10
.9 (C
ontin
ued)
195CHAPTER 10 | Priority Technologies and National Strategies
6. Brackishwater and marine aquaculture offer very promising economic returns, particularly from foreign exchange earnings. However, as currently practiced, the poor cannot afford the scale and investment required to generate these returns.
Environmental impacts could also be adverse; hence, despite a favorable market outlook, for most countries, these sytems are rated behind low-value aquaculture as pro-poor and sustainable technologies. Nevertheless, they maintain their place in all the aquaculture development strategies. In general, the countries are optimistic about reorienting the systems towards greater participation by small entrepreneurs, and poor rural workers, in addition to setting up organizations of poor fish farmers.
Capture fisheries
7. Only offshore capture fisheries are targeted for significant increases in fishing effort,
investment, and production, in the expectation that the poor will benefit through employment on offshore vessels and related activities onshore (e.g., landing sites and processing). On the contrary, coastal capture fisheries are targeted for capacity and employment reduction, in conjunction with better resource management.
8. Capacity reduction entails a strategy for minimizing economic dislocation. Again aquaculture and related activities (e.g., processing, tourism) are to be promoted to absorb exiting fishers, although absorption outside fisheries also needs to be facilitated through credit schemes, training programs, and other support.
9. For the remaining fishers, stronger and more effective management measures should be put in place. Here the management options vary, from decentralization and co-management, to centralized administration under command-and-control. The bottom line is improved formulation and enforcement of fishing rules, which may require different institutional arrangements across countries.
10. Pro-poor technologies to be promoted are small-scale gear, such as gill net and hook-and-line. Resource rehabilitation and enrichment measures will be undertaken.
11. Inland fisheries are important due to their significant contribution to food security and livelihoods for the rural poor. Establishment of community organizations for managing common areas, as well as investments in appropriate stock enhancement and enrichment systems, are promising means of delivering benefits to the poor, particularly for countries with large inland fisheries, reservoir areas, and seasonally flooded lands.
The supply and value chain
12. All the countries recognize that fish production exists within a wider economic context, namely, a supply and value chain beginning from input supply, through post-harvest services, processing, and marketing. Constraints to growth lie at upstream and downstream portions of this chain, such that focusing only on fish production would likely yield low or even negative returns on development investments.

196 Strategies and Options for Increasing and Sustaining Fisheries and Aquaculture Production to Benefit Poorer Households in Asia
13. On the input side, the major constraint is the unavailability of quality fish seed, and lack of access to credit for poor farmers and fishers. Both problems need to be solved by hatchery and broodstock programs as well as credit schemes.
14. On the post-harvest and processing side, wastage and poor quality of the final products characterize traditional practices. To achieve better quality standards, there is a need to invest in landing and post-harvest facilities, in training of fishers and processors, and in building processing enterprises. Global food safety standards need to be enforced, particularly as the short-term consequences of increased processing costs are modest compared to repercussions on market access in case of non-compliance.
15. On the marketing side, inefficiencies and lack of competition must be addressed. Price policies, particularly on tariffs for imported products, may need to be reduced to the detriment of some fish-producing subsectors. However, tariff reforms may, on the whole, be beneficial to food security and even sectoral growth.
Institutional transformation
16. All the countries highlight the need for government agencies to get their act together in terms of coordination, policy consistency, and quality of human resources (especially in extension and research). Cooperation across agencies is critical in addressing the natural resource context of capture fisheries and culture, which requires rationalization of policies on land use, water management, and
competing demands between sectors (rural versus urban areas, agriculture versus industry, and demands within agriculture, including fisheries).
17. Organizing poor fishers, farmers, and processors is the preferred option in handling developments in global trade and technological change that tend to favor large-scale operations. A collective, pro-poor approach confronts great challenges in light of the geographic dispersal of fish producers, as well as traditional resistance to community-based institutions. Cooperation from other stakeholders, such as private investors and NGOs, may in some countries be drawn upon to meet this challenge.
18. The NAPs call for greater regional collaboration, particularly in the area of trade negotiation, to counter the arbitrary imposition of non-tariff barriers and protectionist measures in developed countries, as well as to harmonize procedures and standards in conducting South-South and North-South trade.
The foregoing issues and strategies for the development of fisheries in Asia highlight broad themes and needs for the next 15 years. The future of the poor who depend on fish hinges on these. None of the suggested options are particularly new; however, this multicountry study has, for the first time, identified requirements and responses within a framework of stakeholder analysis and consultation, backed up by systematic, quantitative analysis on the marketing prospects for fish. Stakeholders can, therefore, take these findings and strategies as a platform for change.
197CHAPTER 11 | Impacts of the Project
ADB-RETA 5945 was designed as a policy research project aimed at identifying options and appropriate strategies to increase and sustain fish production for the benefit of the poor in the selected developing member countries (DMCs). It is no small matter to quantify the effects of this type of research because policy responses and their impacts are very difficult to predict. However, if indeed policies respond favorably, such studies may well have more wide-ranging and permanent impacts than other types of research, such as commodity technology research, for which the outputs are actually tangible. In this concluding chapter, an attempt is made to qualitatively evaluate the likely impacts, based on the accomplishments of the project, as well as the outlook for stakeholder responses to project findings and recommendations.
Framework
The results of the project on the ground are envisioned to progress along the following impact pathway (Figure 11.1). The research was jointly undertaken by the WorldFish Center and national research partners. The WorldFish Center, as an international organization, is a repository of skills and resources that allow it to provide capacity-building services to its partners, especially during the research process and through specially organized training workshops.
The lynchpin for achieving impact lies on the national action plans (NAPs). The NAPs were formulated on the basis of project findings and
consultation among researchers, government agencies, and other stakeholders. These plans need to be integrated into regular processes of the planning agencies concerned, both in national development planning in general and in planning regarding fisheries in particular.
If implemented, the action plan (in conjunction with further measures identified on the basis of the other study findings, databases, catalogs, and models) would feed into actual policy actions and investment programs, financed by government funds, overseas development assistance (ODA), and participating stakeholders (i.e., the private sector). When realized, these policies and investments are expected to lead to sustainably higher fish supplies, produced under better functioning markets (i.e., with expanded access for the poor and with less distorted market prices). These in turn generate more food to be consumed by the poor, better livelihoods from fish sales, viable employment in fisheries enterprises, and better living standards of the poor who depend on fish.
Throughout the diagram, dual-pointed arrows denote the need for constant monitoring, surveillance, and impact assessment to ensure that the policies and investments are on track. Here the capacity of the national research institutions to pursue subsequent research, analysis, and even advocacy become crucial.
Chapter 11
IMPACTS OF THE PROJECT
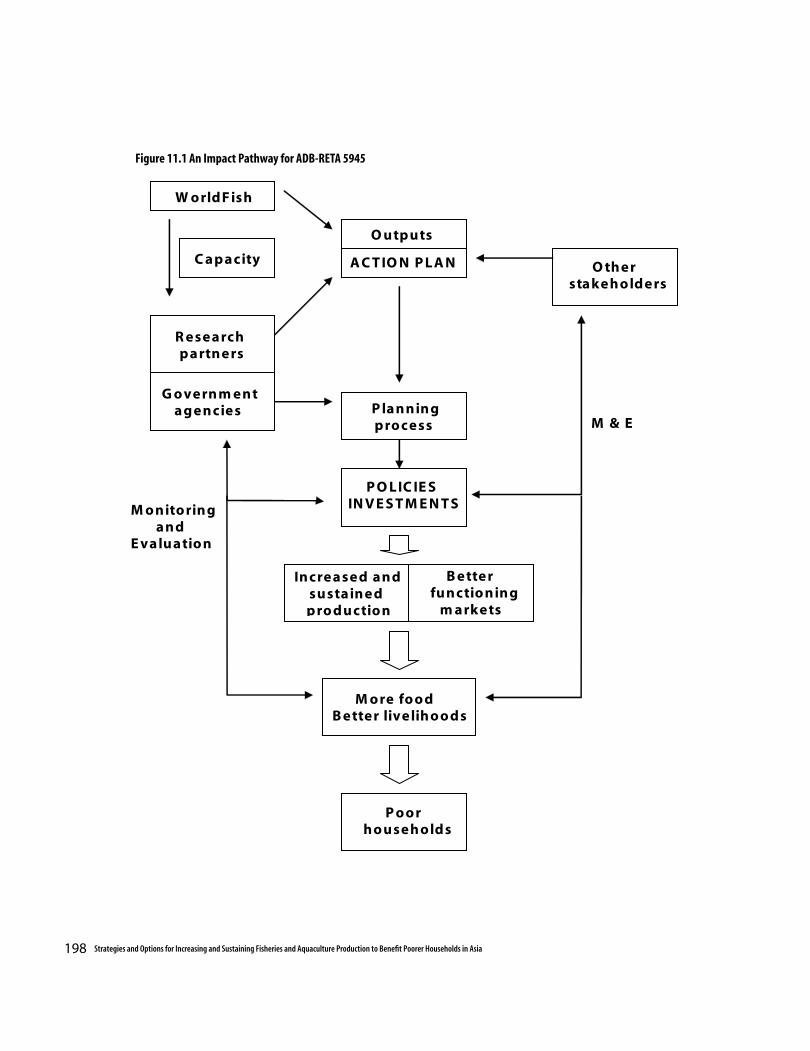
198 Strategies and Options for Increasing and Sustaining Fisheries and Aquaculture Production to Benefit Poorer Households in Asia
Figure 11.1 An Impact Pathway for ADB-RETA 5945
199CHAPTER 11 | Impacts of the Project
Project Activities and Outputs
The outputs of the research, in line with project objectives, consist of the following:1. a comprehensive catalog of current
aquaculture and fisheries technologies;
2. archetypal profiles and prioritization of aquaculture and fisheries technologies;
3. an analysis of factors determining supply, demand, trade, and consumption of fish and other aquatic products;
4. a 15-year projection of supply and demand for fish in the participating DMCs;
5. strategies and action plans for the adoption of appropriate fish species, aquaculture systems, fishing technologies, and participatory fisheries management measures for the poorest categories of producers, for increased and sustained fish production and resource management;
6. a replicable framework and consistent methodology to be used in all the DMCs, including a fish sector model to assess appropriate technologies, socioeconomic impacts, and strategy formulation; and
7. a comprehensive database consisting of biophysical, socioeconomic, and market information for policy analysis and impact assessment of changes within and outside the fisheries sector.
These outputs were generated and disseminated through a variety of activities, including workshops, special sessions during conferences, and scientific publications.
Workshops
To generate the project outputs, a number of workshops were organized. These consisted of:
1. National planning meetings: National planning meetings (generally two-day affairs) were conducted from April to July 2001 in each participating DMC. The meetings had these aims: (a) to provide an overview of the project including its research components; (b) to discuss the methodologies for each research component; (c) to review the implementation arrangements, including administrative and financial matters, workplan/timelines and the Memorandum of Agreement; and (d) to form the national project teams from the collaborating
agencies.
2. Regional Planning Workshop: The regional planning workshop was held during 21-24 August 2001, in Penang, Malaysia, with 60 participants from ten Asian countries. The workshop was the culmination of the national planning meetings. It aimed to discuss and finalize the methodologies, analytical framework, survey design, implementation arrangements and the detailed workplan of the project. The project webpage was inaugurated and activated during the Opening Session. The website URL is: www.worldfishcenter.org/demandsupply/index.htm
3. Regional Workshop: A regional workshop on “Aquaculture Technologies and Fishing Practices in Asia” was held during 17-27 March 2003, with 14 participants from nine Asian countries. The workshop aimed to finalize the fish classifications for supply and demand analysis, and draw up policies and recommendations for incorporation in the National Action Plans.
200 Strategies and Options for Increasing and Sustaining Fisheries and Aquaculture Production to Benefit Poorer Households in Asia
4. Training Workshops: Two training work-shops were held, namely: “Analysis and Projection of Fish Supply and Demand”, 21 July-11 August 2003, in Penang, Malaysia (21 participants from nine Asian countries.); and “Projection of Fish Supply and Demand Asia”, 16-22 November 2003, in Bangkok (12 participants from nine Asian countries.) The first workshop trained the partners on supply and demand estimation methods, discussed and finalized different technical issues, such as supply-demand balance, and the structure of the AsiaFish Model. The second workshop was devoted to training required for the actual construction of the AsiaFish model in each country; this will be used for making projections on baseline and alternative scenarios for supply and demand.
5. Final Workshops: At the national level, a number of final project workshops were conducted from January to March 2004. In each of these workshops, the findings of the project for each country were discussed, and national action plans to address the project objectives were drafted. The final project workshop was held during 17-20 March 2004, in Manila, Philippines, with 42 participants from nine Asian countries. During this workshop, all research findings of the project, along with the National Action Plans, were presented, and finalized for implementation in the regular planning processes of the participating DMCs.
6. Writing Workshop: A writing workshop was conducted during 1-16 June 2004, with 14 participants from nine Asian countries. The workshop generated a draft synthesis report based on the country reports prepared by the national project teams in the nine partner countries.
Special conference sessions/workshops
The project organized the following special sessions of various scientific conferences.
1. “Strategies and options for sustainable aquaculture development in Asia”, World Aquaculture Society in Beijing (23-27 April 2002, ten papers from the project)
2. “Fish in security and income in developing countries: Role of growing aquaculture and changing trade regime”, International Institute on Fisheries Economics and Trade special session in New Zealand (19-22 August 2002, six papers from the project)
3. “The outlook of global fish production, consumption, and trade: Implication and options for the developing countries”, IIFET special session in Tokyo, Japan (21-30 July 2004, four papers from the project)
4. “Fisheries trade and the reconciliation of fisheries conservation”, World Fisheries Congress in Canada (2-6 May 2004, four papers from the project)
5. “Technology needs and prospects for Asian aquaculture”, Asian Fisheries Society scientific session in Penang, Malaysia (29 November – 3 December 2004, five papers from the project)
6. “Economics of small pelagics and climate change”, SPACC Workshop in Portsmouth, UK (14 September 2004, one paper from the project)
In total, 19 scientific papers and four books were published in various conference proceedings and workshop reports.
201CHAPTER 11 | Impacts of the Project
Scientific publications
The last set of outputs is a set of scientific papers published in various peer-reviewed journals. A special issue of Aquaculture Economics and Management (vol. 9, no. 1&2, 2005) has been published. The abstracts of the papers are found in Appendix 5, with the following titles:
Special issue of Aquaculture Economics and Management
1. Dey, M. and M. Ahmed. Aquaculture for food and livelihood of the poor in Asia: a brief overview of issues.
2. Dey, M.M., M.A. Rab, F.J. Paraguas, R. Bhatta, F.M. Alam, S. Koeshendrajana and M. Ahmed. Status and economics of freshwater aquaculture in selected countries of Asia.
3. Dey, M.M., F.J. Paraguas, N. Srichantuk, X. Yuan, R. Bhatta and L.T.C. Dung. Technical efficiency of freshwater pond polyculture production in selected Asian countries: estimation and implication.
4. Dey, M.M., M. Rab, F.J. Paraguas, S. Piumsombun, R. Bhatta, M.F. Alam and M. Ahmed. Fish consumption and food security: a disaggregated analysis by types of fish and classes of consumers in selected Asian countries.
5. Garcia, Y., M.M. Dey and S. Navarez. Demand for fish in the Philippines: a disaggregated analysis.
6. Dey, M.M., M.A. Rab, K.M. Jahan, A. Nissapa, A. Kumar and M. Ahmed. WTO, food safety standards and regulatory measures: implications for selected fish exporting Asian countries.
7. Li, L. and J. Huang. China’s accession to WTO and its implications for the fishery and aquaculture sector. Also published as a report of the Center for Chinese Agricultural Policy, Institute of Geographical Sciences and Natural Resources Research, Chinese Academy of Sciences, Beijing, China.
8. Dey, M.M., R. Briones and M. Ahmed. Disaggregated analysis for fish supply, demand and trade in Asia: baseline model and estimation strategy.
9. Rodriguez, U.E, Y.T. Garcia and S. Navarez. The effects of export prices on the demand and supply for fish in the Philippines.
10. Piumsumbun, S., M. Rab, M.M. Dey and N. Srichantuk. The farming practices and policies of aquaculture in Thailand.
11. Katiha, K.P., J.K. Jena, N.G.K. Pillai, C. Chakraborty and M.M. Dey. Inland aquaculture in India: past trends, present status and future prospects.
Other refereed articles and books
1. Kumar, P. and M.M. Dey. 2004. A study on modelling of household demand for fish in India. Indian Journal of Agricultural Economics 59(3):465-475.
2. Li, L. and J. Huang. 2004. Transformation of China’s fishery economy and policy in the new era. Chinese Fisheries Economics 2004 (6):19-21.
3. Briones, R., M.M. Dey and M. Ahmed. 2004. The future for fish in the food and livelihoods of the poor in Asia. NAGA 27(3&4):48-50.
202 Strategies and Options for Increasing and Sustaining Fisheries and Aquaculture Production to Benefit Poorer Households in Asia
4. Kumar, A. 2004. Export performance of Indian fisheries sector: strengths and challenges ahead. Economic and Political Weekly 39(38):4264-4270.
5. Kumar, A., P.S. Birthal and Badruddin. 2004. Technical efficiency in shrimp farming in India: estimation and implications. Indian Journal of Agricultural Economics 59(3):413-420.
6. Kumar, P., A. Kumar and C.P. Shiji. 2004. Total factor productivity and socioeconomic impact of fisheries technology in India. Agricultural Economics Research Review Conference Issue 2004:131-144.
7. Kumar, A. and P. Kumar. 2003. Food safety measures: implications for fisheries sector in India. Indian Journal of Agricultural Economics 58(3):365-374.
8. Kumar, A., Elumalai and Badruddin. 2005. Technical efficiency in freshwater aquaculture in Uttar Pradesh. Indian Journal of Economics. (In press)
9. Mruthyunjaya. 2004. Research report on strategies and options for increasing and sustaining fish and aquaculture production to benefit poor households in India, 142 p. National Centre for Agricultural Economics and The WorldFish Center.
10. Pillai, N.G.K. and P.K. Katiha. 2004. Evolution of fisheries and aquaculture in India, 240 p. Central Marine Fisheries Research Institute, India.
11. Li, L., S. Chen, H. Liu and J. Qiu. 2004. Analysis of fish consumption pattern and projection of demand for fish in China in 2006-2010. Ministry of Agriculture, Beijing, China.
12. Garcia, Y., M.M. Dey and R.L. Tan, Editors. 2004. Sustaining fisheries and aquaculture production to benefit poor households in the Philippines, 311 p. University of the Philippines, Los Banos, and The WorldFish Center, Penang.
As the project ends at the point of generating the outputs and the action plan, the rest of the impact pathway must progress to deliver results at the national level. The prospects for the results materializing can be gauged by two criteria: (a) whether the research processes and outputs respond to a felt need of stakeholders; and (b) whether there is an effective capacity and constituency for implementing the project recommendations. The answers to these interrelated questions are discussed in the following.
Evaluation
Did research processes and outputs respond to a felt need?
Fisheries policies and management are directed to a sizable and complex sector. Decisions made are often based on inadequate information, or they are simply postponed in the absence of data. Prior to the project, major gaps were noted, in particular the absence of a coherent compilation and rigorous assessment of possible policy measures, institutional capacities, as well as options for management and technology development. Granted, the information was present, albeit in fragmentary and incoherent forms. This state is partly due to the relatively early emergence of fisheries research in the selected DMCs, particularly with respect to policy.
The project has responded to this need by providing a storehouse of information, systematically
203CHAPTER 11 | Impacts of the Project
documented in terms of profiles of technology, consumption, trade, and the policy environment. The information is consolidated in the individual country reports and the final project report. As such, the documents, papers, reports, and other outputs make them valuable references for policymakers, researchers, and stakeholders.
A common perception within fisheries agencies is that their research expertise is highly concentrated on the biological sciences, with very little in-house capacity for quality research on socioeconomic conditions and relations. The multidisciplinary approach followed by the project has produced quality research that addresses this imbalance. The quality of the research can be gauged from: a) the project-sponsored special sessions held within distinguished international conferences; and b) the scientific publications generated by the project that have successfully passed through international peer review (internal to the editorial process of the Aquaculture and Economics Management Journal).
Furthermore, the quantitative analysis undertaken in the study has integrated economic behavior into the outlook for fish supplies, whereas traditionally technical analysis of fish production has been formerly dominated by biologists, as well as aquaculture and fisheries technologists. The logic of price response, as well as the effects of economic factors (such as those that drive consumption and trade), are fully incorporated along with biological and technological considerations.
A set of quantitative projections on prices, production, and consumption further injects much-needed rigor in the formulation of sectoral development plans. Often these plans undertake forecasts and targets based on rule-of-thumb methods and analysis. Dissatisfaction with these
methods has previously been outweighed by their practicality, which is not to be discounted; nevertheless, a systematic quantitative framework will go a long way in making the assumptions behind planning targets explicit and, therefore, subject them to extensive scrutiny by researchers and stakeholders. No doubt the lasting legacy of the project will lie in infusing greater rigor, at the national and regional levels, to goal-setting and strategic planning for the fisheries sector.
Strengthening the capacity of partner institutions, particularly in socioeconomic analysis, responds strongly to the need for a sustained research program to backstop sectoral planning and policy decisions. With the compiled databases, experiences in analytical and planning methods (e.g., statistical analysis, priority setting), and self-contained decision-making tools (e.g., the AsiaFish model), the researchers in these institutions are now equipped to pursue future research along multidisciplinary lines.
Finally, the NAPs themselves offer a valuable complement to existing fisheries and agricultural development plans. They provide a concise, systematic checklist of strategies and broad statements that have been reviewed by a consultative process. Furthermore, the link between the NAPs to the other outputs of the project, i.e., the databases, surveys, analyses, and quantitative projections, buttress the credibility of the plans.
In particular, the profiles, projections, and priority-setting exercises, despite their apparently specialized content, appeal to investment planners in the business sector, donor agencies, and government budget offices, all of which are key actors in providing the financing requirements of a fisheries development plan. An investment
204 Strategies and Options for Increasing and Sustaining Fisheries and Aquaculture Production to Benefit Poorer Households in Asia
program, particularly one financed by public or donor funds, will have to confront hard choices among competing demands, particularly those supported by interest groups. The priorities identified by the project, particularly with respect to pro-poor technologies and species, credibly backed up by rigorous technical analysis, become an essential input for pushing through with the investment decisions. Ideally, the action plans, once fully fleshed-out with the information from the socioeconomic profile, would recommend investment decisions that target the species and technologies benefiting the poor most directly. Finally, the demand and supply projections and impact analysis would also ensure that the investments and policies promote financially viable investments and policies, now and into the foreseeable future.
Are the action plans supported by an effective constituency?
A number of considerations suggest that the action plans are indeed supported by an effective constituency. First, the technical workshops, national workshops (some of which have received media coverage), and the final regional workshop have served to elevate fisheries and the poor to prominence in development discussions and debates, both nationally and regionally. This has helped build up greater awareness on fisheries and will help secure its representation in broader agricultural and national development plans.
Second, within the fisheries sector, the collaborative and consultative approach taken by the project has established groups of domestic and regional “champions” that are committed in following through with the action plans. To a large extent, these plans overlap with their own development objectives, and they benefit greatly from the
research findings that have been generated. That is, few novelties have been introduced in the NAPs, which is to be expected given their broad scope and consultative background. Rather, the value of the NAPs lies in fact that commitments have been secured according to a specific agenda supported by research activities.
The first group includes fisheries agencies, government research centers, and key agency officials and other staff members. The project has been conducted under their sponsorship and active participation. They are, therefore, expected to follow-through with the recommendations and advocate the integration of the action plans and decision-making tools into the regular planning process. The second group includes academics and national institutions whose research and advocacy receive widespread dissemination and are held in high regard. Finally, regional networks and organizations (such as the Network of Aquaculture Centres in Asia-Pacific and the Southeast Asian Fisheries Development Center) are also dedicated to pushing the agenda forward, particularly those elements pertaining to regional collaboration. This constituency forms part of an alliance and network among these institutions and the WorldFish Center. Finally, the WorldFish Center itself can play a vital role in pursuing the uptake and dissemination of the research along the impact pathway, even after the close of the ADB-RETA 5945.
Future plan
The WorldFish Center and its research partners plan to continue formal and informal collaboration along the lines initiated in this project. Some of the specific steps to be taken are as follows:
205CHAPTER 11 | Impacts of the Project
1. Further work is needed in expanding and refining the outputs of the project. This entails updating and maintaining the database, particularly as new information is generated, new technologies develop, and the conditions of the stakeholders change over time. Greater disaggregation across sub-sectors and geographic areas can be undertaken for the technology and socioeconomic profiles.
2. In common with other food models that have undergone protracted development (e.g., the International Model for Policy Analysis of Commodities and Trade of the International Food Policy Research Institute), the AsiaFish model must be subjected to further testing, upgrading, as well as extension into more detailed analysis. This includes further disaggregation of fish types, incorporation of a household model for explicit welfare impacts on the distribution of income, by remodeling to increase the number of predicted variables (e.g., export and import prices), and so forth.
3. The implementation of the action plans requires further detailed planning. Specific targets and goal setting for the sectoral and sub-sectoral components can be revisited. The priority-setting exercise can be applied to a broader set of options and actions beyond the technologies that were evaluated. In
conjunction with a more detailed projection exercise, the resulting operational plans would become more valuable for investment programming purposes.
4. Finally, uptake and dissemination of the NAPs (as well as detailed operational plans) may require testing of the policy, management, and technology recommendations. The validation of the research will come with monitoring and impact assessment after sufficient time has passed for the impacts to be observed on the ground. This type of action research can take the form of piloting of recommended technologies and management options on a site-specific basis.
The last step will, of course, require considerable investments, not so much for the research component, as for the development and implementation component. Potential investors in this plan would be national governments and donor agencies, including the Asian Development Bank itself. The action and research agenda of this project are broad enough to encompass the Bank’s lending programs for fisheries in the selected DMC. Implementation of an action research approach can bring Bank investments in closer alignment with the principles of equity, sustainability, and efficiency, as pronounced in the Bank’s own strategy for fisheries in Asia.
206 Strategies and Options for Increasing and Sustaining Fisheries and Aquaculture Production to Benefit Poorer Households in Asia
Ahmed, K.K. 2000. Studies on production potentiality and management of fisheries of Kaptai Lake. Annual report 1997-1998 and 1998-1999. Bangladesh Fisheries Research Institute (BFRI).
Ahmed, M.N.U., M.M. Hossain, N.M. Humayun, M.B. Hossain, M.S. Haque, R.K. Talukder and S. Alam. 2004. Final Country Report: Bangladesh. Strategies and options for increasing and sustaining fisheries and aquaculture production to benefit poor households in Asia project (ADB-RETA 5945), 81 p. The WorldFish Center, Penang, Malaysia.
Aigner, D.J., C.A.K Lovell and P. Schmidt. 1977. Formulation and estimation of Stochastic Frontier Production Function Models. Journal of Econometrics 6:21-37.
Alam, M.F., Ishak Haji Omar and D. Squires. 2002. Sustainable fisheries development in the tropics: trawlers and licence limitation in Malaysia. Applied Economics 34: 325-337.
Ali, M. and D. Byerlee. 1991. Economic efficiency of small farmers in a changing world: a survey of recent evidence. Journal of International Development 3:1-27.
Ali and Islam. 2002. Standard in fisheries sector vis-à-vis international standard and its role for promoting export. Paper presented at the National Workshop on Sanitary and Phyto-sanitary Measures, Tariff Commission, Dhaka, Bangladesh, May 2002.
Amemiya, T. 1974. Multivariate regression and simultaneous equation models when the dependent variables are truncated normal. Econometrica 42:999-1012.
Anderson, J.L. 1985. Market interactions between aquaculture and the common property commercial fishery. Marine Resource Economics 2:1-23.
Arjumanara, L. 2002. A study of yield gaps, production losses and technical efficiency of selected groups of fish farmers in Rajshahi district. Bangladesh Agricultural University, Mymensingh, Bangladesh. M.S. Econ. (Finance) Thesis.
Asian Development Bank (ADB) and Network of Aquaculture Centres in Asia-Pacific (NACA). 1998. Aquaculture sustainability and the environment. Report on a regional study and workshop on aquaculture sustainability and the environment (RETA 5534). ADB and NACA, Bangkok, Thailand.
Athula, S., J.A.D.B. Jayasooriya, S. Ediriweera and R. Maldeniya. 2004. An analysis of fish supply and demand situation in Sri Lanka. Country Report for Sri Lanka. Strategies and options for increasing and sustaining fisheries and aquaculture production to benefit poor households in Asia project (ADB-RETA 5945). The WorldFish Center, Penang, Malaysia.
REFERENCES
207References
Ball, V.E. 1988. Modeling supply response in a multiproduct framework. American Journal of Agriculture Economics 70:813-824.
Ball, V.E., J.C. Bureau, K. Eakin and S. Agapi. 1997. Cap reform: modeling supply response subject to the land set-aside. Agricultural Economics 17:277-288.
Battese, G.E. and T.J. Coelli. 1995. A model for technical efficiency effects in a Stochastic Frontier Production Function for Panel Data. Empirical Economics 20:325-332.
Beach, R. and M. Holt. 2001. Incorporating quadratic scale curves in inverse demand systems. American Journal of Agricultural Economics 83(1):230-45.
Bimbao, G.B., F.J. Paraguas, M.M. Dey and A.E. Eknath. 2000. Socioeconomics and production efficiency of Tilapia hatchery operations in the Philippines. Aquaculture Economics and Management 4(1&2):31-46.
Blanciforti, L. and R. Green. 1983. The almost ideal demand system: a comparison and application to food groups. Agricultural Economics Research 35:1-10.
Blundell, R., P. Pashardes and G. Weber. 1993. What do we learn about consumer demand patterns from micro data? American Economic Review 83:570-97.
Brown, M. and D. Heien. 1972. The S-branch utility tree: a generalization of the linear expenditure system. Econometrica 40:737-47.
Buse, A. 1994. Evaluating the linearized almost ideal demand system. American Journal of Agricultural Economics 76:781-93.
Cen, F. and D. Zhang. 1998. Development and status of aquaculture in the People’s Republic of China. World Aquaculture 29(2):52-56.
Charnes, A., W.W. Copper and E. Rhodes. 1978. Measuring the efficiency of decision-making units. European Journal of Operational Research 2:429-444.
Cheng, H. and O. Capps. 1988. Demand analysis of fresh and frozen finfish and shellfish in the United States. American Agricultural Economics Association 70:533-42.
Christensen, L.R., D.W. Jorgenson and L.J. Lau. 1975. Transcendental logarithmic utility functions. American Economic Review 65:367-83.
Clark, C.W. and G.R. Munro. 1980. Fisheries and the processing sector: some implications for management policy. Bell Journal of Economics 11:603-616.
Coelli, T.J., D.S.P. Rao and G.E. Battese. 1998. An introduction to efficiency and productivity analysis. Kluwer Academic Publishers, Boston, Massachusetts, U.S.A.
208 Strategies and Options for Increasing and Sustaining Fisheries and Aquaculture Production to Benefit Poorer Households in Asia
Coelli, T.J. 1994. A Guide to FRONTIER Version 4.1: A Computer Program for Stochastic Frontier Production and Cost Function Estimation. Department of Econometrics, University of New England, Armidale, NSW, 2351, Australia.
Dagenais, M.G. 1973. The use of incomplete observations in multiple regression analysis. Journal of Econometrics 1:317-328.
Deaton, A.S. and J. Muellbauer. 1980. An almost ideal demand system. American Economic Review 70:359-68.
Deb, U. and M.M. Dey. 2004. The history and impacts of the “Genetic Improvement of Farmed Tilapia (GIFT)” Project and the “Dissemination and Evaluation of Genetically Improved Tilapia (DEGITA)” Project. The WorldFish Center, Penang, Malaysia.
Delgado, C., N. Wada, M. Rosegrant, S. Meijer and M. Ahmed, 2003. Fish to 2020: supply and demand in changing global environments. International Food Policy Research Institute, Washington D.C. and The WorldFish Center, Penang, Malaysia.
Department of Fisheries, Government of Malaysia. 2001. Annual Fisheries Statistics (Perangkaan Tahunan Perikanan) 2000 Volume 1. Directorate General of Fisheries, Kuala Lumpur. http://agrolink.moa.my/dof.
Devlin, N.J. 1996. Technical efficiency in the New Zealand dairy industry: a frontier production function approach. New Zealand Economic Papers 30(1):1-17.
Dey, M.M. 2000a. The impact of genetically improved farmed Nile tilapia in Asia. Aquaculture Economics and Management 4:109-26.
Dey, M.M. 2000b. Analysis of demand for fish in Bangladesh. Aquaculture Economics and Management 4:65-83.
Dey, M.M., F.J. Paraguas and M.F. Alam. 2005a. Cross-country synthesis: production, accessibility, marketing and consumption patterns of freshwater aquaculture products in Asia: a cross-country comparison. In M.M. Dey, R.P. Subasinghe and R. VanAnrooy (eds.) Production, accessibility, marketing and consumption of freshwater aquaculture products in Asia. FAO Fisheries Technical Paper. (In press)
Dey, M.M., M.A. Rab, F.J. Paraguas, S. Piumsombun, R. Bhatta, M.F. Alam and M. Ahmed. 2005b. Fish consumption and food security: a disaggregated analysis by types of fish and classes of consumers in selected Asian countries. Aquaculture Economics and Management. (In press)
Dey, M.M., R. Briones and M. Ahmed. 2004b. Projecting supply, demand and trade for specific fish types in Asia: baseline model and estimation strategy. Marine Resources Economics. (In press)
209References
Dey, M.M., M. Ahmed, M.A. Rab, A. Kumar and A. Nisapa. 2003. WTO, food safety standards and regulatory barriers: implications for selected fish exporting Asian countries. Aquaculture Economics and Management. (In press)
Dey, M.M., G.B. Bimbao, L. Yong, P. Regaspi, A.H.M. Kohinoor, N. Pongthana and F.J. Paraguas. 2000a. Current status of production and consumption of Tilapia in selected Asian countries. Aquaculture Economics and Management 4(1&2):47-62.
Dey, M., F. Paraguas, G. Bimbao and P. Regaspi. 2000b. Technical efficiency of Tilapia grow-out pond operations in the Philippines. Aquaculture Economics and Management 4:33-47.
Dickens, R., V. Fry and P. Pashardes. 1993. Non-linearities and equivalence scale. The Economics Journal 103:359-68.
Diop, H. and R.F. Kazmierczak, Jr. 1996. Technology and management in Mauritanian cephalopod fisheries. Marine Resource Economics 11:71-84.
Directorate General of Aquaculture, 2002, Statistik Perikanan Budidaya Indonesia, Indonesian Aquaculture Statistic 1999. DGA, MMOAF, Jakarta.
Directorate General of Aquaculture, 2000, Statistik Perikanan Budidaya Indonesia, Indonesian Aquaculture Statistic 1999. DGA, MMOAF, Jakarta.
Dupont, D.P. 1991. Testing for input substitution in a regulated fishery. American Journal of Agricultural Economics 73(1):155-164.
Eales, J.S. and L.J. Unnevehr. 1988. Demand for beef and chicken products: Separability and structural change. American Journal of Agricultural Economics 70:521-32.
Edwards, P. 1993. Environmental issues in integrated agriculture – aquaculture and wastewater – Fed fish culture systems, p.139-170. In R.S.V. Pullin, H. Rosenthal and J.L Maclean (eds.) Environmental Aquaculture in Developing Countries. ICLARM Conference Proceedings 31.ICLARM, Manila, Philippines.
Edwards, P. 1998. A system approach for the promotion of integrated aquaculture. Aquaculture Economics and Management 2:1-12.
Fan, S., E.L. Wailes and G.L. Cramer. 1995. Household demand in rural China: a two-stage LES-AIDS model. American Journal of Agriculture Economics 77:54-62.
Food and Agriculture Organization (FAO). 2002a. Fisheries statistics (also cited as FishStat) [Available online]: http://www.fao.org/ [Accessed August 2002]
Food and Agriculture Organization (FAO). 2002b. The State of World Fisheries and Aquaculture. FAO, Rome.
210 Strategies and Options for Increasing and Sustaining Fisheries and Aquaculture Production to Benefit Poorer Households in Asia
Food and Agriculture Organization (FAO). 2003. Review of the state of world fishery resources: inland fisheries. FAO Fisheries Circular No. 942, Rev. 1. FAO, Rome.
Food and Agriculture Organization (FAO). 2004a. FAO Statistical Databases (also cited as FishStat Data). [Available online]: http://apps.fao.org/subscriber. (Accessed June 2004)
Food and Agriculture Organization (FAO). FAO. 2004b. Fish trade for the people – toward understanding the relationship between international fish trade and food security. Report of the study on the impact of the international trade in fisheries products on food security. Food and Agriculture Organization of the United Nations and the Royal Norwegian Ministry of Foreign Affairs, Helsinki and Rome.
Farrell, M.J. 1957. The measurement of productive efficiency. Journal of Royal Statistical Society, Series A (General), Part III, 120:253-281.
Felsing, M. and D. Baticados. 2001. The role of women in aquaculture in the Philippines: obstacles and future options. In K. Kusakabe and G. Kelkar (eds.) Gender concerns in aquaculture in Southeast Asia. Asian Institute of Technology, Thailand.
Gao, X.M. and T. Spreen. 1994. A microeconometric analysis of the U.S. meat demand. American Journal of Agricultural Economics 42:397-412.
Gao, X.M., E.J. Wailes and G.L. Cramer. 1996. A two-stage rural household demand analysis: micro data evidence from Jiangsu Province, China. American Journal of Agricultural Economics 78:604-613.
Garcia, Y., M.M. Dey and S. Navarez. 2005. Demand for fish in the Philippines: a disaggregated analysis. Aquaculture Economics and Management. (In press)
Garcia, Y.T., N.A. Lopez, J.O. Dickson, R.D. Ramiscal, A.C. Costales, R.L. Tan, M.B. Lee, U.P.E. Rodriguez and S.M.M. Navarez. 2004. Final Country Report: Philippines. Strategies and options for increasing and sustaining fisheries and aquaculture production to benefit poor households in Asia project (ADB-RETA 5945), 311 p. WorldFish Center, Penang, Malaysia.
Gourieroux, C. and A. Monfort. 1981. On the problem of missing data in linear models. Review of Economics and Statistics 48:579-586.
Green, R. and J. Alston. 1990. Elasticities in AIDS models. American Agricultural Economics Association 72:442-445.
Gunaratne, L.H.P. and P.S. Leung. 1996. Asian black tiger shrimp industry: a productivity analysis. In P.S. Leung and K.R. Sharma (eds.) Economics and management of shrimp and carp farming in Asia. Network of Aquaculture Centers in the Asia-Pacific Region, Bangkok, Thailand.
211References
Gunaratne, L.H.P. and P.S. Leung. 1997. Productivity analysis of Asian shrimp industry: the case of Malaysian shrimp culture. In P.S. Leung and K.R. Sharma (eds.) Economics and management of shrimp and carp farming in Asia. Network of Aquaculture Centers in the Asia-Pacific Region, Bangkok, Thailand.
Gupta, M.V. and B.O. Acosta. 2001. Network in aquaculture genetics research, p. 1-5. In M.V. Gupta and B.O. Acosta (eds.) Fish genetics research in member countries and institutions of the International Network on Genetics in Aquaculture. ICLARM Conf. Proc. 64, 179 p. ICLARM, Manila, Philippines.
Hahn, W. 1994. Elasticities in AIDS Models: Comment. American Journal of Agricultural Economics 76:972-77.
Han, T. and T. Wahl. 1998. China’s rural household demand for fruit and vegetables. Journal of Econometrics 72:85-134.
Hao, N.V., T.T. Luu and N.M. Nien 2003. Profile of key aquaculture and fishing practices in Vietnam. ADB–RETA 5945 Project document, 76 p. (Unpublished).
Heckman, J. 1979. Sample selection bias as a specification error. Econometrica 47:153-161.
Heien, D. and C. Durham. 1991. A test of the habit formation hypothesis using household data. Review of Economics and Statistics 8:189-199.
Heien, D. and C.R. Wessells. 1990. Demand system estimation with microdata: a censored regression approach. Journal of Business and Economic Statistics 8(1):365-371.
Huang, J., J. Xu F. Qiao. 2004. Production, accessibility and consumption patterns of aquaculture products in China. In M.M. Dey, R.P. Subasinghe and R. Van Anrooy (eds.) Production, marketing, accessibility and consumption of freshwater aquaculture products in Asia. FAO Fisheries Technical Paper. FAO, Rome.
Huang, J., L. Lu, W. Miao, Y.H. Yuan and L. Liu. 2004. Final Country Report: China. Strategies and options for increasing and sustaining fisheries and aquaculture production to benefit poor households in Asia project (ADB-RETA 5945), 121 p. World Fish Center, Penang, Malaysia.
International Center for Living Aquatic Resources Management (ICLARM). 1999. Aquatic resources research in developing countries: data and evaluation by region and resource system. ICLARM Working document 4, 131 p. (Unpublished)
International Center for Living Aquatic Resources Management (ICLARM). 2001. Genetic improvement of carp species in Asia: Final Report. Asian Development Bank Regional Technical Assistance No. 5711, International Center for Living Aquatic Resources Management, Penang, Malaysia.

212 Strategies and Options for Increasing and Sustaining Fisheries and Aquaculture Production to Benefit Poorer Households in Asia
International Center for Living Aquatic Resources Management (ICLARM). 1998. Dissemination and evaluation of genetically improved Tilapia species in Asia: Final Report. Asian Development Bank Regional Technical Assistance No. 5558. ICLARM, Manila, Philippines.
International Center for Living Aquatic Resources Management (ICLARM). 2000. Genetic improvement of carp species in Asia: Final Report. Asian Development Bank Regional Technical Assistance No. 5711. ICLARM, Manila, Philippines.
Institute of Fisheries Economics and Planning. 2004. Final Country Report: Vietnam. Strategies and options for increasing and sustaining fisheries and aquaculture production to benefit poor households in Asia project (ADB-RETA 5945). The WorldFish Center, Penang, Malaysia.
International Monetary Fund (IMF). 2004. World Economic Outlook Databases. http://www.imf.org/external/ns/cs.aspx?id=28
Irz, X. and V. McKenzie. 2003. Profitability and technical efficiency of aquaculture systems in Pampanga, Philippines. Aquaculture Economics and Management 7(3&4):195-211.
Jaforullah M. and N.J. Devlin. 1996. Technical efficiency in the New Zealand dairy industry: a frontier production function approach. New Zealand Economic Papers 30(1):1-17.
Jorgenson D.W., Slesnick D.T. and Stoker T.M. 1988. Two-stage budgeting and exact aggregation. Journal of Business and Economic Statistics 6:313–325.
Just, R.E., D. Zilberman and E. Hochman. 1983. Estimation of multicrop production function. American Journal of Agricultural Economics 65:770-780.
Katiha, K.P., J.K. Jena, N.G.K. Pillai, C. Chakraborty and M.M. Dey. 2005. Inland aquaculture in India: past trends, present status and future prospects. Aquaculture Economics and Management. (In press)
Keen, M. 1986. Zero expenditures and the estimation of Engel curves. Journal of Applied Econometrics 1:277-286.
Khan, M.A. 2003. An economic analysis of fish hatchery management in selected areas of Bangladesh. Bangladesh Agricultural University, Mymensingh. M.S. thesis.
Kirkley, J.E. and I.E. Strand. 1988. The technology and management of multi-species fisheries. Applied Economics 20:1279-1292.
Kirkley, J.E., D. Squires and I.E. Strand. 1998. Characterizing managerial skill and technical efficiency in fishery. Journal of Productivity Analysis 9:145-160.
213References
Koeshendrajana, S. 1997. Management options for the inland fisheries resource in South Sumatra, Indonesia. UNE-Armidale, NSW, Australia. Ph.D. dissertation.
Koeshendrajana, S. Purwanto, Yulianto, Ismayant, K. Mintardjo and A.A. Budhiman. 2003. Aquaculture technologies and fishing practices in Indonesia. ADB–RETA 5945 Project document, 53 p. (Unpublished)
Kontara, E.K. and A. Maswardi. 1999. Present status of common carp farming in Indonesia. World Aquaculture 30(4):14-16, 60-62.
Kumar, A., Elumalai and Badruddin. 2005. Technical efficiency in freshwater aquaculture in Uttar Pradesh. Indian Journal of Economics. (In press)
Kumar, A. 2004. Export performance of Indian fisheries sector: strengths and challenges ahead. Economic and Political Weekly 39(38):4264-4270.
Kumar, A., P.S. Birthal and Badruddin. 2004. Technical efficiency in shrimp farming in India: estimation and implications. Indian Journal of Agricultural Economics 59(3):413-420.
Kumar, A. and P. Kumar. 2003. Food safety measures: implications for fisheries sector in India. Indian Journal of Agricultural Economics 58(3):365-374.
Kumar, P. and M.M. Dey. 2004. A study on modelling of household demand for fish in India. Indian Journal of Agricultural Economics 59(3):465-475.
Kumar, P. and C.P. Shiji. 2004. Fish demand and supply projections in India. Study under ICAR-ICLARM project Strategies and options for increasing and sustaining fisheries and aquaculture production to benefit the poor households in Asia, funded by the Asian Development Bank.
Kumar, P., A. Kumar and C.P. Shiji. 2004. Total factor productivity and socioeconomic impact of fisheries technology in India. Agricultural Economics Research Review Conference Issue 2004:131-144.
Lang, G. 2001. Global warming in German agriculture: impact estimations using a restricted profit function. Environmental and Resource Economics 19(1):97-112.
Lee, L.F. and M.M. Pitt. 1986. Microeconometric demand systems with binding non-negativity constraints: the dual approach. Econometrica 54:1237-1242.
214 Strategies and Options for Increasing and Sustaining Fisheries and Aquaculture Production to Benefit Poorer Households in Asia
Li, L. and J. Huang. 2005. China’s accession to the WTO and its implications for the fishery and aquaculture sector. Aquaculture Economics and Management. (In press)
Li, L. and J. Huang. 2004. Transformation of China’s fishery economy and policy in the new era. Chinese Fisheries Economics 2004 (6):19-21.
Li, L., S. Chen, H. Liu and J. Qiu. 2004. Analysis of fish consumption pattern and projection of demand for fish in China in 2006-2010. Ministry of Agriculture, Beijing, China.
Li, L. and J. Huang. 2003. China’s accession to the WTO and its implications for the fishery and aquaculture sector. A Report of the Center for Chinese Agricultural Policy, Institute of Geographical Sciences and Natural Resources Research, Chinese Academy of Sciences, Beijing, China.
Li, L. and J. Huang. 2001. Analysis of policies, institutions and support services in Chinese fisheries. Unpublished progress report submitted to ICLARM-The WorldFish Center.
Lopez, N.A., J.O. Dickson, R.V. Raruiscal, Y.T. Garcia, R.L. Tan and S.M. Navarez. 2003. Aquaculture technologies and fishing practices in the Philippines. ADB–RETA 5945 Project document, 112 p. (Unpublished)
Lovatelli, A. 1997. Status of aquaculture in Vietnam. Aquaculture Asia 2(3):18-24.
Luu, L.T. 1999. Vietnam’s small-scale aquaculture for better rural livelihood. Aquaculture Asia 4(3):14-16.
Mruthyunjaya, M. 2004. Research report on strategies and options for increasing and sustaining fish and aquaculture production to benefit poor households in India, 142 p. National Centre for Agricultural Economics and The WorldFish Center.
Mazid, M.A. 1999. Developmental needs and research priorities for fisheries in Bangladesh. In M.V. Gupta and N. Macawaris-Ele (eds.) Priorities in aquatic resources research in the Asia-Pacific Region, 39 p. ICLARM Conference Proceedings 62. ICLARM, Manila, Philippines.
McConnell, D.J. and J.L. Dillion. 1997. Farm management for Asia: a systems approach. FAO Farm Systems Management Series, No.13. FAO, Rome.
Meenakshi, J.V. and R. Ray. 1999. Regional differences in India’s food expenditure pattern: a completed demand systems approach. Journal of International Development 11:47-74.
Michalek, J. and M. Keyzer. 1992. Estimation of a two-stage LES-AIDS consumer demand system for eight EC countries. European Review of Agricultural Economics 19:137-63.
215References
Ministry of Marine Affairs and Fisheries, Indonesia. 2004. Final Country Report: Indonesia. Strategies and options for increasing and sustaining fisheries and aquaculture production to benefit poor households in Asia project (ADB-RETA 5945). The WorldFish Center, Penang, Malaysia.
Moschini, G. 1995. Units of measurement and the Stone Index in demand system estimation. American Journal of Agricultural Economics 77:63-68.
Mruthyunjaya, N.G.K., P.K. Pillai, A. Katiha, R. Kumar, R. Bhatta, R.L. Shiyani, P. Kumar and P.K. Joshi. 2004. Final Country Report: India. Strategies and options for increasing and sustaining fisheries and aquaculture production to benefit poor households in Asia project (ADB-RETA 5945), 133 p. World Fish Center, Penang, Malaysia.
Mustapha, N., R.A. Ghaffar and D. Poerwono. 1994. An almost ideal demand system analysis of fresh fish in Semarang, Indonesia. Journal of International Food and Agribusiness Marketing 6(3):91-128.
Nayga, R. 1995. Microdata expenditure analysis of disaggregate meat products. Review of Agricultural Economics 17:275-285.
Nayga, R. 1996. Wife’s labor force participation and family expenditures for prepared food, food prepared at home, and food away from home. Agricultural and Resource Economic Review 25:179-186.
Nayga, R. 1998. A sample selection model for prepared food expenditures. Applied Economics 29:345-352.
Olalo, C. 2005. Production, accessibility and consumption patterns of aquaculture products in Philippines. In M.M. Dey, R.P. Subasinghe and R. Van Anrooy (eds.) Production, marketing, accessibility and consumption of freshwater aquaculture products in Asia. FAO Fisheries Technical Paper.
Omar, H.I., S.Y. Tai, K.M. Nor, N.M.R. Abdullah and C.F. Lim. 2004. Final Country Report: Malaysia. Strategies and options for increasing and sustaining fisheries and aquaculture production to benefit poor households in Asia project (ADB-RETA 5945), 260 p. The WorldFish Center, Penang, Malaysia.
Panayotou, T., S. Wattanutchariya, S. Isvilanonda and R. Tokrisna. 1982. The economics of catfish in central Thailand. ICLARM Technical Report No.4. Kasetsart University Research and Development Institute, Bangkok, Thailand and ICLARM, Manila, Philippines.
Park, J.L., R.B. Holcomb, K.C. Raper and O. Capps, Jr. 1996. A demand systems analysis of food commodities by U.S. households segmented by income. American Journal Agricultural Economics 78:290-300.
216 Strategies and Options for Increasing and Sustaining Fisheries and Aquaculture Production to Benefit Poorer Households in Asia
Pascoe, S. and S. Mardle. 1999. Supply response in fisheries – the North Sea. Research Paper 143 – Centre for the Economics and Management of Aquatic Resources (CEMARE), Department of Economics, University of Portsmouth, U.K.
Pashardes, P. 1993. Bias in estimating the almost ideal demand system with the Stone Price Index approximation. The Economic Journal 103:908-915.
Perali, F. and J. Chavas. 2000. Estimation of censored demand equations from large cross-section data. American Journal of Agricultural Economics 82(4):1022-1037.
Pillai, N.G.K. and P.K. Katiha. 2004. Evolution of fisheries and aquaculture in India, 240 p. Central Marine Fisheries Research Institute, India.
Piumsumbun, S., M. Rab, M.M. Dey and N. Srichantuk. 2005. The farming practices and policies of aquaculture in Thailand. Aquaculture Economics and Management. (In press)
Piumsombun, S., P. Boonchuwongse, A. Nissapa and N. Srichantuk. 2004. Final Country Report: Thailand. Strategies and options for increasing and sustaining fisheries and aquaculture production to benefit poor households in Asia project (ADB-RETA 5945), 221 p. The WorldFish Center, Penang, Malaysia.
Piyasena, G., P.P.G.S.N. Siriwardane, D.S. Jayakody, A. Senaratne, J.A.D.B. Jayasooriya, R. Maldeniya, R.M.U.D.P. Pakumara and A.H.S. Ediriweera. 2004. Final Country Report: Sri Lanka. Strategies and options for increasing and sustaining fisheries and aquaculture production to benefit poor households in Asia project (ADB-RETA 5945), 164 p. The WorldFish Center, Penang, Malaysia.
Pollack, R.A. and T.J. Wales. 1981. Demographic variables in demand analysis. Econometrica 49:1533-1551.
Rao, J.M. 1989. Agricultural supply response: a survey. Agricultural Economics 3:1-22.
Rodriguez, U.E, Y.T. Garcia and S. Navarez. 2005. The effects of export prices on the demand and supply for fish in the Philippines. Aquaculture Economics and Management. (In press)
Rodriguez, U., Y. Garcia and S. Navarez. 2004. Modeling fish supply and demand in the Philippines. University of the Philippines at Los Banos, report submitted to The WorldFish Center as part of the project: Strategies and options for increasing and sustaining fisheries and aquaculture production to benefit poor households in Asia (ADB-RETA 5945).
Rosegrant, M., S. Meijer and S. Cline. 2002. International Model for Policy Analysis of Agricultural Commodities and Trade (IMPACT): Model description. International Food Policy Research Institute.
Saha, C. and Paul, B.N. 2000. Flow through system for industrial aquaculture in India. Aquaculture Asia 5(4):24-26.
217References
Salvanes, K.G. and D.J. DeVoretz. 1997. Household demand for fish and meat products: separability and demographic effects. Marine Resource Economics 12:37-55.
Salvanes, K.G. and D. Squires. 1995. Transferable quotas, enforcement costs and typical firms: an empirical application to the Norwegian trawler fleet. Environmental and Resource Economics 6:1-21.
Sampson, D.B. 1992. Fishing technology and fleet dynamics: predictions from a bioeconomic model. Marine Resource Economics 7:37-58.
Sharma, K.R. 1999. Technical efficiency of carp production in Pakistan. Aquaculture Economics and Management 3(2):131-141.
Sharma, K.R. and P.S. Leung. 1998. Technical efficiency of carp production in Nepal: an application of the stochastic frontier production function approach. Aquaculture Economics and Management 2(3):129-140.
Sharma, K.R. and P.S. Leung. 2000a. Technical efficiency of carp pond culture in South Asia: an application of a stochastic meta-production frontier model. Aquaculture Economics and Management 4(3/4):169-189.
Sharma, K.R. and P.S. Leung. 2000b. Technical efficiency of carp production in India. A stochastic frontier production function analysis. Aquaculture Research 31:937-948.
Sharma, K.R. and P.S. Leung. 2003. A review of production frontier analysis for aquaculture management. Aquaculture Economics and Management 7(1/2):15-34.
Shonkwiler, J.S. and S. Yen. 1999. Two-step estimation of a censored system of equations. American Journal of Agricultural Economics 81:972-982.
Shultz, T.W. 1975. The value of the ability to deal with disequilibria. Journal of Economic Literature 13:827-846.
Shumway, C.R. 1983. Supply, demand and technology in a multiproduct industry: Texas field crops. American Journal of Agricultural Economics 65:748-759.
Shumway, C.R., K. Jagasothy and W.P. Alexander. 1987. Production interrelationships in Sri Lankan peasant agriculture. Australian Journal of Agricultural Economics 31:16-28.
Silvestre, G.T., L.R. Garces, I. Stobutzki, M. Ahmed, R.A.V. Santos, C.Z. Luna and W. Zhou. 2003. South and South-East Asian coastal fisheries: Their status and directions for improved management: conference synopsis and recommendations, p. 1 - 40. In G. Silvestre, L. Garces, I. Stobutzki, M. Ahmed, R.A. Valmonte-Santos, C. Luna, L. Lachica-Aliño, P. Munro, V. Christensen and D. Pauly (eds.) Assessment, Management and Future Directions for Coastal Fisheries in Asian Countries. The WorldFish Center Conference Proceedings 67, 1,120 p.
218 Strategies and Options for Increasing and Sustaining Fisheries and Aquaculture Production to Benefit Poorer Households in Asia
Singh, I. 1988. Small-scale farmers in South Asia: their characteristics, productivity and efficiency. Discussion Paper No. 31. The World Bank, Washington, D.C.
Siriwardane, P.P.G.S.N and D.S. Jayakody. 2003. Aquaculture technologies and fishing practices of Sri Lanka. ADB–RETA 5945 Project document, 75 p. (Unpublished)
Squires, D. 1987. Long-run profit function for multi-product firms. American Journal of Agricultural Economics 69: 558-569.
Squires, D. 1988. Production technology, costs, and multi-product industry structure: An application of the long-run profit function to the New England fishing industry. Canadian Journal of Economics 21(2):359-378.
Squires, D. and J. Kirkley. 1991. Production quota in multi-product Pacific fisheries. Journal of Environmental Economics and Management 21:109-126.
Squires, D. and J. Kirkley. 1996. Individual transferable quotas in a multi-product common property industry. Canadian Journal of Economics 29(2): 318-342.
Swamy, G. and H. Binswanger. 1983. Flexible consumer demand systems and linear estimation: food in India. American Journal of Agricultural Economics 65(4):675-684.
Tacon, A.G.J. and S.S. De Silva. 1997. Feed preparation and feed management strategies within semi-intensive fish farming systems in the tropics. Aquaculture 151:379-404.
Tai, S.Y. and T. Heaps. 1996. Effort dynamics and alternative management policies for the small pelagic fisheries of Northwest Peninsular Malaysia. Marine Resource Economics 11(2):85-104.
Tan, R.L. and S.M.M. Navarez. 2004. Socioeconomic profile and analysis of tilapia and milkfish cage culture in Lakes Taal and Sampaloc, Philippines. In Final Country Report: Philippines. Strategies and options for increasing and sustaining fisheries and aquaculture production to benefit poor households in Asia project (ADB-RETA 5945), 311 p. World Fish Center, Penang, Malaysia. (Unpublished)
Theil, H. 1965. The information approach to demand analysis. Econometrica 33:67-87.
Thomas, R.L. 1987. Applied Demand Analysis. Longman Group Limited, Harlow, U.K.
Thunberg, E.M. 1995. Economic analysis of technical interdependencies and the value of effort in a multi-species fishery. Marine Resource Economics 10:59-76.
Tiffin, A. and R. Tiffin. 1999. Estimates of food demand elasticities for Great Britain: 1972-1994. Journal of Agricultural Economics 50:140-147.
Tobin, J. 1958. Estimation of relationships for limited dependent variables. Econometrica 26:24–36.
219References
U.S. Bureau of Census. 2004. International Data Base.
Veerina, S.S., M.C. Nandeesha and K.G. Rao. 1993. Status and technology of Indian major carp farming in Andhra Pradesh, India. Asian Fisheries Society, Mangalore, India. 52 p.
Viswanathan, K.K., J.R. Nielsen, P. Degnbol, M. Ahmed, M. Hara and N.M. Raja Abdullah. 2003. Fisheries co-management policy brief: findings from a worldwide study. The WorldFish Center Policy Brief 2, 26 p.
Wales, T.J. and A.D. Woodland. 1983. Estimation of consumer demand systems with binding non-negativity constraints. Journal of Econometrics 21:263-286.
Wang, J., X.M. Gao, E.J. Wailes and G.L. Cramer. 1996. Consumer demand for alcoholic beverages: cross-section estimation of demographic and economic effects. Review of Agricultural Economics 18:477-488.
Watson, R. and D. Pauly. 2001. Systematic distortions in world fisheries catch trends. Nature 424:534-536.
Weimin, M., Y. Xinhua and Y. Yongming. 2003. Aquaculture technologies and fishing practices in China. ADB–RETA 5945 Project document, 46 p. (Unpublished)
Wellman, K.F. 1992. The U.S. retailed demand for fish products: an application of the Almost Ideal Demand System. Applied Economics 24:445-457.
Williams, M. 1996. The transaction in the contribution of living aquatic resources to food security. Food. Agriculture and the Environment Discussion paper 13. International Food Policy Research Institute.
Welcomme, R.L. 1985. River fisheries. FAO Technical Paper 262:330. FAO, Rome.
World Bank. 2004. World development indicators 2004. World Bank, Washington.
World Trade Organization. 1995. The results of the Uruguay Round of Multilateral Trade Negotiations: the legal texts. Geneva, Switzerland.
Ye, Y. and J.R. Beddington. 1996. Bioeconomic interactions between the capture fishery and aquaculture. Marine Resource Economics 11(2):105-123.
Yen, S.T. and T. Roe. 1989. Estimation of a two-level demand system with limited dependent variables. American Journal of Agricultural Economics 71:85-99.
Related Documents