University of Southern Queensland Faculty of Engineering and Surveying An investigation into the accuracy and limitations of automatic target recognition in total stations A project appreciation submitted by Mr Ashley Weyman-Jones A.DegSpaSci (Surveying) In the fulfilment of the requirements of Bachelor of Spatial Science (Surveying) October, 2010

Welcome message from author
This document is posted to help you gain knowledge. Please leave a comment to let me know what you think about it! Share it to your friends and learn new things together.
Transcript

University of Southern Queensland
Faculty of Engineering and Surveying
An investigation into the accuracy and limitations of automatic target
recognition in total stations
A project appreciation submitted by
Mr Ashley Weyman-Jones
A.DegSpaSci (Surveying)
In the fulfilment of the requirements of
Bachelor of Spatial Science (Surveying)
October, 2010

i
Abstract
The aim of this report was to examine the accuracy and limitations of automatic target recognition
(ATR) in total stations through real-life field situations and obstructions. This was done by testing
three total stations by reading through a series of obstructions to fixed prisms.
Obstruction simulation templates were placed at various distances from the total station to obscure
the view of the fixed prism. The prism was also placed at various lengths from the total station to
assess the effect to distance. These results were then assessed and the different horizontal angle,
vertical angle, and horizontal distance deviations were graphed and compared. The resulting
deviations varied depending on the type and placement of the obstruction in front of the prism.
After completing these experiments a set of field surveying recommendations was outlined for using
ATR for electronic distance measurements. These recommendations will provide surveyors with
important information designed to assist them in determining the accuracy of ATR readings in
different obstruction environments.

ii
Disclaimer
University of Southern Queensland
Faculty of Engineering and Surveying
ENG4111 Research Project Part 1 &
ENG4112 Research Project Part 2
Limitations of Use
The Council of the University of Southern Queensland, its Faculty of Engineering and Surveying, and
the staff of the University of Southern Queensland, do not accept any responsibility for the truth,
accuracy or completeness of material contained within or associated with this dissertation.
Persons using all or any part of this material do so at their own risk, and not at the risk of the Council
of the University of Southern Queensland, its Faculty of Engineering and Surveying or the staff of the
University of Southern Queensland.
This dissertation reports an educational exercise and has no purpose or validity beyond this exercise.
The sole purpose of the course "Project and Dissertation" is to contribute to the overall education
within the student’s chosen degree programme. This document, the associated hardware, software,
drawings, and other material set out in the associated appendices should not be used for any other
purpose: if they are so used, it is entirely at the risk of the user.
Professor Frank Bullen Dean
Faculty of Engineering and Surveying

iii
Certification
I certify that the ideas, designs and experimental work, results, analyses, and conclusions set out in
this dissertation are entirely my own effort, except where otherwise indicated acknowledged.
I further certify that the work is original and has not been previously submitted for assessment in any
other course or institution, except where specifically stated.
Student Name: Ashley Scott McLeod Weyman-Jones
Student Number: 0050009367
Signature
27.10.2010
Date

iv
Acknowledgements
The author wishes to acknowledge and thank the following people whose assistance made the
completion of this project possible:
� Zhenyu Zhang, Faculty of Engineering and Surveying, USQ;
� Corey James, Director, Ahern James Naismith Surveyors;
� Karl Wieczorek, Sales Consultant- GPS/TPS, C.R Kennedy;
� Matt Thomas, Sales and Marketing, Position Partners;
� Amber James, Amber James Consulting;
� Laura Hegarty;
� Ultimate Positioning; and
� Nicholaas Michael Steyn, University of Kwazulu-Natal.
v
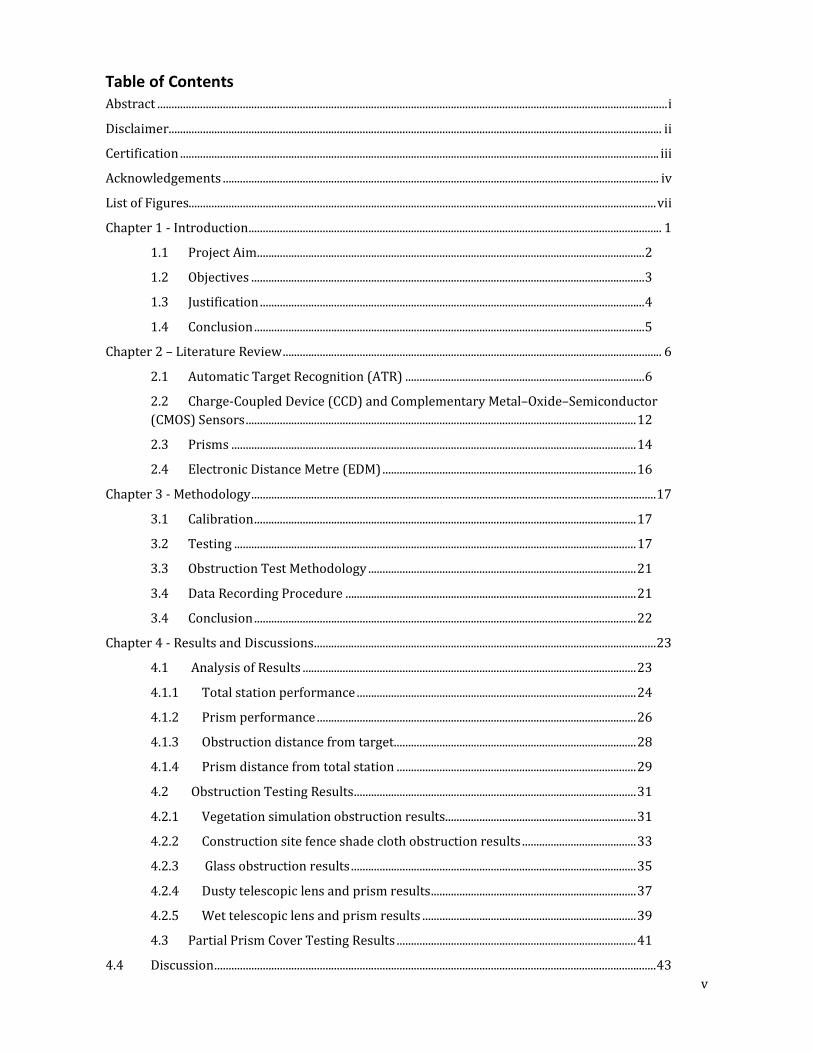
Table of Contents
Abstract ................................................................................................................................................................................... i
Disclaimer ............................................................................................................................................................................. ii
Certification ........................................................................................................................................................................ iii
Acknowledgements ......................................................................................................................................................... iv
List of Figures.................................................................................................................................................................... vii
Chapter 1 - Introduction ................................................................................................................................................. 1
1.1 Project Aim ........................................................................................................................................ 2
1.2 Objectives .......................................................................................................................................... 3
1.3 Justification ....................................................................................................................................... 4
1.4 Conclusion ......................................................................................................................................... 5
Chapter 2 – Literature Review ..................................................................................................................................... 6
2.1 Automatic Target Recognition (ATR) .................................................................................... 6
2.2 Charge-Coupled Device (CCD) and Complementary Metal–Oxide–Semiconductor
(CMOS) Sensors ......................................................................................................................................... 12
2.3 Prisms .............................................................................................................................................. 14
2.4 Electronic Distance Metre (EDM) ......................................................................................... 16
Chapter 3 - Methodology .............................................................................................................................................. 17
3.1 Calibration ...................................................................................................................................... 17
3.2 Testing ............................................................................................................................................. 17
3.3 Obstruction Test Methodology .............................................................................................. 21
3.4 Data Recording Procedure ...................................................................................................... 21
3.4 Conclusion ...................................................................................................................................... 22
Chapter 4 - Results and Discussions ........................................................................................................................ 23
4.1 Analysis of Results ..................................................................................................................... 23
4.1.1 Total station performance .................................................................................................. 24
4.1.2 Prism performance ................................................................................................................ 26
4.1.3 Obstruction distance from target ..................................................................................... 28
4.1.4 Prism distance from total station .................................................................................... 29
4.2 Obstruction Testing Results ................................................................................................... 31
4.2.1 Vegetation simulation obstruction results................................................................... 31
4.2.2 Construction site fence shade cloth obstruction results ........................................ 33
4.2.3 Glass obstruction results .................................................................................................... 35
4.2.4 Dusty telescopic lens and prism results ........................................................................ 37
4.2.5 Wet telescopic lens and prism results ........................................................................... 39
4.3 Partial Prism Cover Testing Results .................................................................................... 41
4.4 Discussion ........................................................................................................................................................... 43

vi
4.4.1 Obstruction testing summary ............................................................................................ 43
4.4.2 Partial cover testing summary .......................................................................................... 46
4.5 Conclusion .......................................................................................................................................................... 46
Chapter 5 – Conclusions and Recommendations ............................................................................................... 47
References .......................................................................................................................................................................... 48
Appendices ......................................................................................................................................................................... 50
Appendix A - Project Specification .................................................................................................... 50
Appendix B - CCD vs CMOS Feature and Performance Comparison ................................... 52
Appendix C - Obstruction free ATR Testing Results .................................................................. 53
Appendix D - Vegetation Simulation Obstruction Deviation Results .................................. 56
Appendix E - Construction Site Shade Cloth Obstruction Deviation Results ................... 59
Appendix F - Glass Obstruction Deviation Results ..................................................................... 62
Appendix G - Dusty Lens and Prism Obstruction Deviation Results ................................... 65
Appendix H - Wet Lens and Prism Obstruction Deviation Results ...................................... 68
Appendix I - Partial Prism Obstruction Deviation Results ...................................................... 71
vii
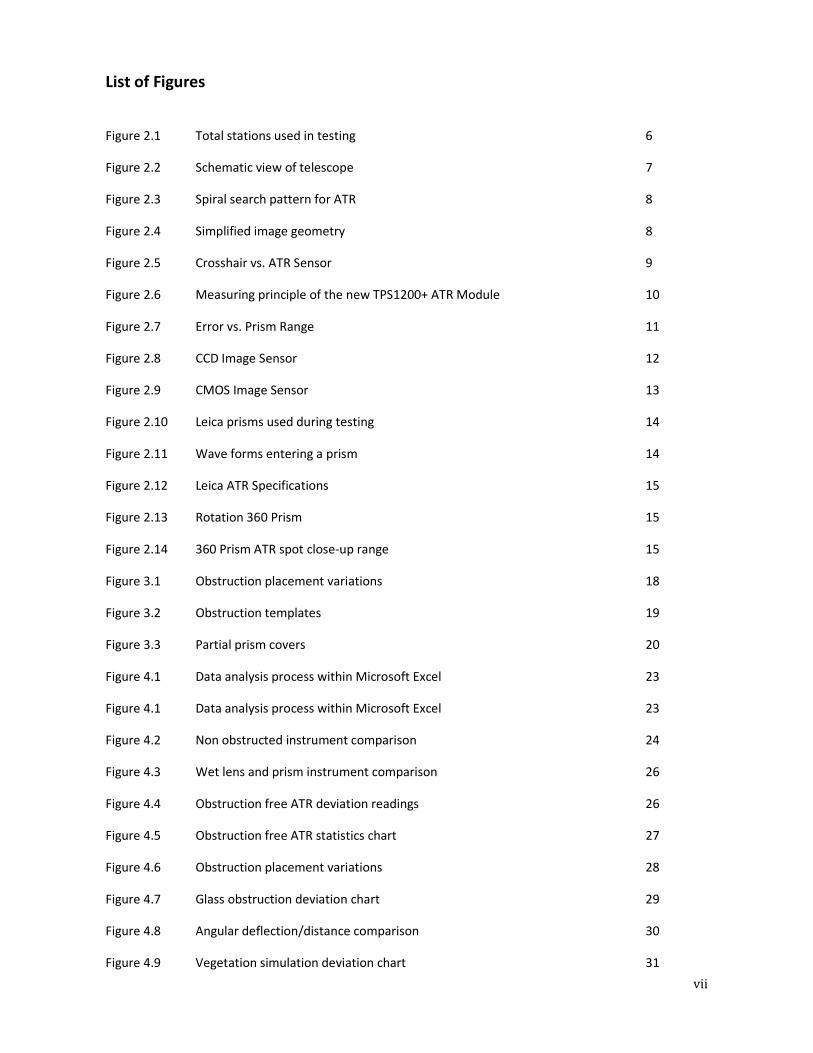
List of Figures
Figure 2.1 Total stations used in testing 6
Figure 2.2 Schematic view of telescope 7
Figure 2.3 Spiral search pattern for ATR 8
Figure 2.4 Simplified image geometry 8
Figure 2.5 Crosshair vs. ATR Sensor 9
Figure 2.6 Measuring principle of the new TPS1200+ ATR Module 10
Figure 2.7 Error vs. Prism Range 11
Figure 2.8 CCD Image Sensor 12
Figure 2.9 CMOS Image Sensor 13
Figure 2.10 Leica prisms used during testing 14
Figure 2.11 Wave forms entering a prism 14
Figure 2.12 Leica ATR Specifications 15
Figure 2.13 Rotation 360 Prism 15
Figure 2.14 360 Prism ATR spot close-up range 15
Figure 3.1 Obstruction placement variations 18
Figure 3.2 Obstruction templates 19
Figure 3.3 Partial prism covers 20
Figure 4.1 Data analysis process within Microsoft Excel 23
Figure 4.1 Data analysis process within Microsoft Excel 23
Figure 4.2 Non obstructed instrument comparison 24
Figure 4.3 Wet lens and prism instrument comparison 26
Figure 4.4 Obstruction free ATR deviation readings 26
Figure 4.5 Obstruction free ATR statistics chart 27
Figure 4.6 Obstruction placement variations 28
Figure 4.7 Glass obstruction deviation chart 29
Figure 4.8 Angular deflection/distance comparison 30
Figure 4.9 Vegetation simulation deviation chart 31
viii
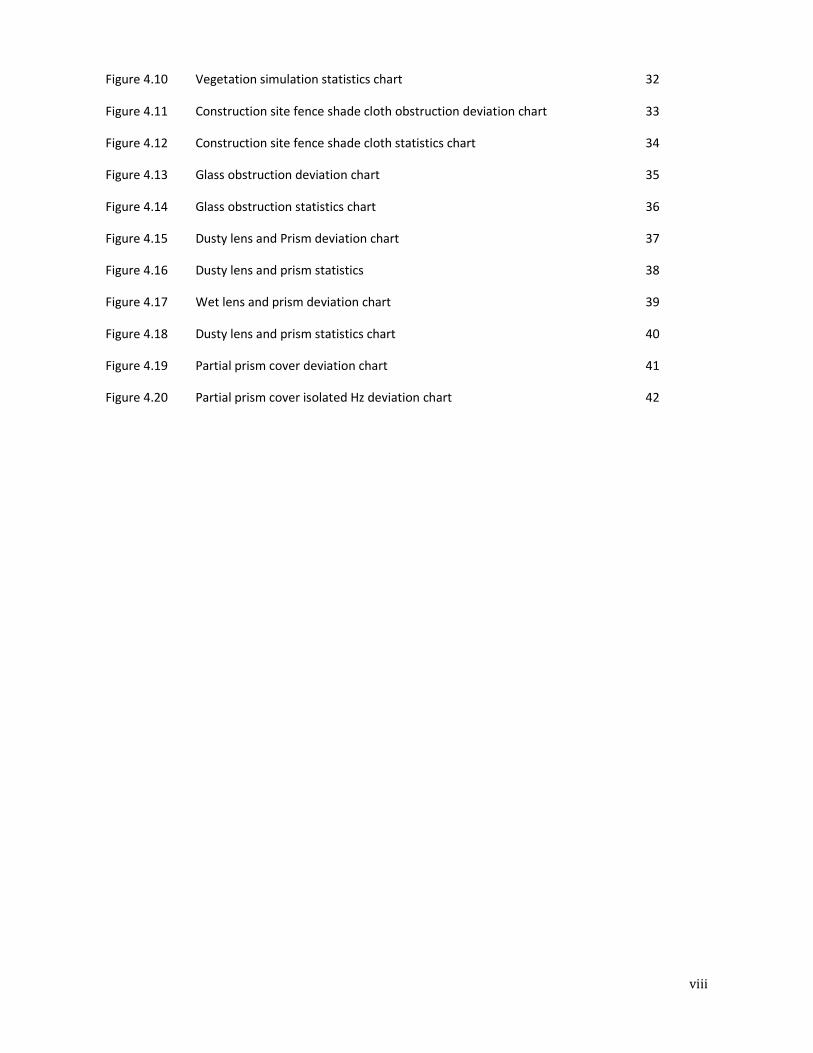
Figure 4.10 Vegetation simulation statistics chart 32
Figure 4.11 Construction site fence shade cloth obstruction deviation chart 33
Figure 4.12 Construction site fence shade cloth statistics chart 34
Figure 4.13 Glass obstruction deviation chart 35
Figure 4.14 Glass obstruction statistics chart 36
Figure 4.15 Dusty lens and Prism deviation chart 37
Figure 4.16 Dusty lens and prism statistics 38
Figure 4.17 Wet lens and prism deviation chart 39
Figure 4.18 Dusty lens and prism statistics chart 40
Figure 4.19 Partial prism cover deviation chart 41
Figure 4.20 Partial prism cover isolated Hz deviation chart 42
1
Chapter 1 - Introduction
Automatic target recognition is a system operation that has become standard in most modern total
stations. It simply allows surveyors to make EDM readings without having to look through the
telescope and manually sight and centre the target in view. This has made it possible to have robotic
control of total stations which has allowed the surveyor to be more mobile and productive on site.
ATR has different names depending on the manufacturer, some of these include:-
• ATR- Automatic Target Recognition (Leica);
• AutoLock / Fine Lock (Trimble);
• X-TRAC (Topcon);
• Focusing System (Nikon); and
• Auto Pointing (Sokkia).
Although different manufacturers give ATR different names, the process of calculating and finding
the centre of a target is the same. This involves light been reflected back from any prism and
returned to the total station. The returning light signal is converted to digital data on sensor much
like what is found in a standard video camera. This concentrated light source is used to calculate the
horizontal and vertical displacements of the prism in relation to the total station.
Surveyors have embraced this technology and use it daily in the field for all types of observations and
surveying disciplines. ATR technology has been introduced in attempt to eliminate the human errors
associated with manually sighting a prism target. Manufacturers claim that it is more accurate than
manual observations and is the preferred measurement method.
Surveyors have become comfortable and complacent with this technology and the full impacts of
their surrounding environments are sometimes not taken into consideration. Industry experience
reveals that surveyors may not be aware of the limitations of ATR and its accuracy. Commonly, a
surveyor will roughly point the telescope at the target and take the reading without stopping to
consider what is in-between them and the target.
This project assess the different,
• horizontal angle;
• vertical angle; and
• horizontal distance
deviations caused when reading through a range of different obstructions that could be encountered
in the field. By knowing this information this information a surveyor will be able to recognise what
situations will provide an opportunity for error and should be avoided.

2
1.1 Project Aim
The aim of this report is to discover the limitations of automatic target recognition (ATR) in
obstructed field situations. This will be done by completing a field study with three modern total
stations commonly used in Australia. The ATR system of each instrument will be tested by reading
through common obstructions experienced in daily work.
Through observing and recording the effects of reading through obstructions, the importance of
proper care when using ATR will be highlighted.
This report is not an instrument comparison. Three different brands of instruments were selected
and used as part of the experiment to ensure no bias was given to a particular brand. A comparison
of how each instrument performed was conducted for qualitative purposes only. The effectiveness of
individual total stations was not evaluated.
This study aims to gain a better understanding of the technical internal workings of ATR and its
limitations. The results of the testing will highlight any errors caused by taking ATR readings through
obstructions and therefore produce a set of field guidelines for using ATR electronic distance
measurements (EDM). This will provide surveyors with important information designed to assist
them in determining the accuracy of ATR readings in different obstruction environments.

3
1.2 Objectives
The objectives of this project are:-
1. Research background information on the different varieties of ATR for three major brands of
instruments and how they indentify accurate prism point positions;
2. Design a broad spectrum of field measurement experiments to simulate common
obstructions in the field;
3. Prepare an accurate test environment with a precise survey station network to complete
experiments;
4. Complete the field study and collect data using three modern total stations used in Australia;
5. Reduce and analyse the data from the multiple experiments and present in a tabulated form;
6. Evaluate the effects that each of the different test obstruction environments had on ATR
electronic distance measurement (EDM) readings; and
7. Present findings and recommendations for amended practices using ATR in the field for
accurate electronic measurements.

4
1.3 Justification
With the application of ATR and its constant use in general survey practice, it has become critical to
understand the accuracies and limitations of total stations operating in ATR mode.
During the research for this project it was discovered there is limited information available
documenting the accuracy and limitations of ATR. It is possible to take readings through obstructions
with ATR, where it is nearly impossible to manually site the centre of the prism through the
telescope. Therefore it is possible that ATR readings are luring surveyors into a false sense of
security, allowing them to believe they are getting a correct reading when they cannot see the
target.
These limitations need to be documented and surveyors need to be made aware of them as they are
critical to making informed decisions on whether they are getting correct results from their total
station. Modern construction sites now rely on surveyors and their instruments more than ever.
Large building sites now require sub-millimetre accuracies for prefabricated steel frames and hold-
down bolts. Road construction and earthworks are often required to be within tolerances of + 0.02m
when using ATR based dynamic tracking technology. For these reasons it is important to determine
whether ATR technology is capable of meeting such stringent accuracy requirements.
Furthermore we must also understand what conditions these accuracies are achieved in and how
distance affects ATR readings.
Upon completion of this project, a better understanding will be achieved for both:
• the ATR accuracies of three instruments; and
• what conditions and obstructions have a detrimental effect on ATR readings.
5
1.4 Conclusion
ATR is an essential element in modern day surveying for all types of observations whether it is a
dynamic moving target or static target. Research for this report indicated there has been little testing
in the past on the limitations of this technology in a practical sense. There is a need to validate the
true accuracy of ATR operating in obstructed field conditions. Due to the increased applications for
ATR, it has become necessary to undertake comprehensive testing into these instrument accuracies.
In order to understand each instrument’s operational accuracy, it is important to first understand
each instrument’s mechanical operation. A comprehensive literature review was undertaken in order
to provide detailed information on how total stations calculate the centre of a prism using ATR and
this is outlined in the next chapter.
6
Chapter 2 – Literature Review
To establish a good understanding of every element of this project, the literature review has been
broken into four parts:
• Automatic Target Recognition (ATR);
• Charge-Coupled Device (CCD) and Complementary Metal–Oxide–Semiconductor (CMOS)
Sensors;
• Prisms; and
• Electronic Distance Metre (EDM).
2.1 Automatic Target Recognition (ATR)
Automatic Target Recognition (ATR) is the foundation of this project and majority of the secondary
research will be conducted on this section. In order to test the instruments effectively, an
understanding into the inner workings of ATR functionality in total stations must be achieved. In
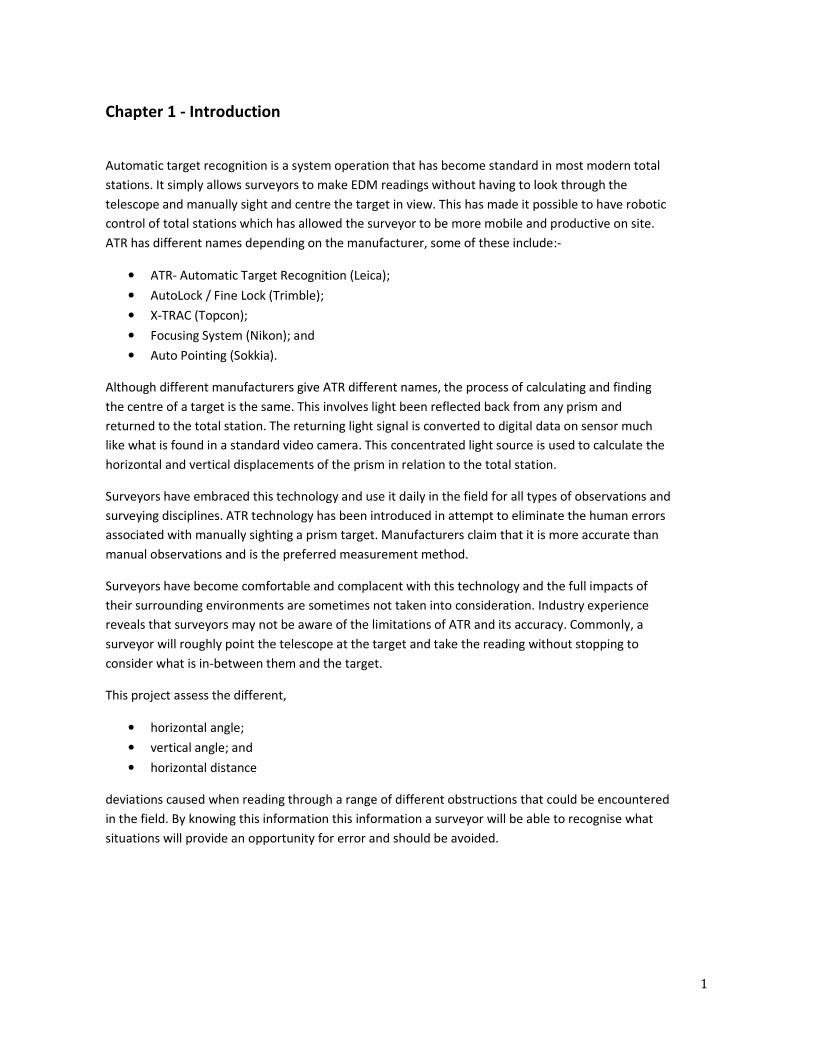
order to provide some background into the operations of an ATR, the mechanical workings of
three current modern total stations will be described and tested. These three instruments are the
Trimble S6, the Leica TCRP1203+ and the Topcon GTS-900A (see Figure 2A).
Leica TCRP1203+ Trimble S6 Topcon GTS-900A
Figure 2.1 Total stations to be used in testing
(Images from Optical Survey Equipment.com 2010, Glockner Engineering and Mining Services 2010
& Wisecracks Restoration 2010)
All three of the total stations used are 3” instruments. Through research and discussion with
technical service staff at the suppliers it was found that the three instruments all use the same
basic principle to determine the centre of the prism in ATR mode. Leica describe the principle as:

The ATR sensor transmits an invisible laser beam, which is reflected by any standard prism (no
active prisms emitting special signals are required) and is received by an internal high
CCD camera. The intensity and the “spot” characteristics of the reflected light are calculated in
respect to the CCD camera centre. The offset components from t
the vertical and horizontal planes. These offsets are then used to control the motors of the
telescope axes, which react immediately to position the instrument’s crosshairs onto the prism. To
minimize measurement time the crosshairs are only positioned within a 5 mgon tolerance (EDM
mode IR-Fine) of the actual prism centre. The remaining offsets are then mathematically applied to
the Hz and V angles (Leica Geosystems, 2008).
This is brief explanation of how the centre of t
CMOS image sensors to identify a reflected light source. This technical process is comprehensively
described in the publication from the Oregon department of transport, titled
stability check, and automatic target recognition”:
1. The operator points the telescope roughly to the target and initiates a distance
There is no need to focus the telescope to fine
the maximum range for ATR, which is 1000m.
2. The laser diode of the ATR emits an infrared laser beam, which is coaxially transmitted through
the telescope out along the line of sight. This beam has a field of view (or spot size) of 0.5 degrees.
If the prism is within the ATR field of view, it will acquire it immediately. If the prism is not within
the ATR field of view, the TCA1800 will begin a spiral search of the telescope field of view (which is
1.5 degrees) (see figure 2B). The ATR field of view is 1/3 that of the teles
the EDM. The EDM spot size is 0.1 degrees (see figure 2.2
Figure 2.2 Schematic view of Telescope, ATR and EDM fields of view (Steyn 2009)
The ATR sensor transmits an invisible laser beam, which is reflected by any standard prism (no
ve prisms emitting special signals are required) and is received by an internal high-resolution
CCD camera. The intensity and the “spot” characteristics of the reflected light are calculated in
respect to the CCD camera centre. The offset components from this reference are computed in both
the vertical and horizontal planes. These offsets are then used to control the motors of the
telescope axes, which react immediately to position the instrument’s crosshairs onto the prism. To
crosshairs are only positioned within a 5 mgon tolerance (EDM
Fine) of the actual prism centre. The remaining offsets are then mathematically applied to
(Leica Geosystems, 2008).
This is brief explanation of how the centre of the prism is found. All three instruments use CCD or
CMOS image sensors to identify a reflected light source. This technical process is comprehensively
described in the publication from the Oregon department of transport, titled “compensators,
ck, and automatic target recognition”:
1. The operator points the telescope roughly to the target and initiates a distance measurement.
There is no need to focus the telescope to fine-point the target. However, the prism must be within
or ATR, which is 1000m.
2. The laser diode of the ATR emits an infrared laser beam, which is coaxially transmitted through
the telescope out along the line of sight. This beam has a field of view (or spot size) of 0.5 degrees.
TR field of view, it will acquire it immediately. If the prism is not within
the ATR field of view, the TCA1800 will begin a spiral search of the telescope field of view (which is
1.5 degrees) (see figure 2B). The ATR field of view is 1/3 that of the telescope, and 5 times that of
ze is 0.1 degrees (see figure 2.2).
Schematic view of Telescope, ATR and EDM fields of view (Steyn 2009)
7
The ATR sensor transmits an invisible laser beam, which is reflected by any standard prism (no
resolution
CCD camera. The intensity and the “spot” characteristics of the reflected light are calculated in
his reference are computed in both
the vertical and horizontal planes. These offsets are then used to control the motors of the
telescope axes, which react immediately to position the instrument’s crosshairs onto the prism. To
crosshairs are only positioned within a 5 mgon tolerance (EDM
Fine) of the actual prism centre. The remaining offsets are then mathematically applied to
he prism is found. All three instruments use CCD or
CMOS image sensors to identify a reflected light source. This technical process is comprehensively
“compensators,
measurement.
point the target. However, the prism must be within
2. The laser diode of the ATR emits an infrared laser beam, which is coaxially transmitted through
the telescope out along the line of sight. This beam has a field of view (or spot size) of 0.5 degrees.
TR field of view, it will acquire it immediately. If the prism is not within
the ATR field of view, the TCA1800 will begin a spiral search of the telescope field of view (which is
cope, and 5 times that of
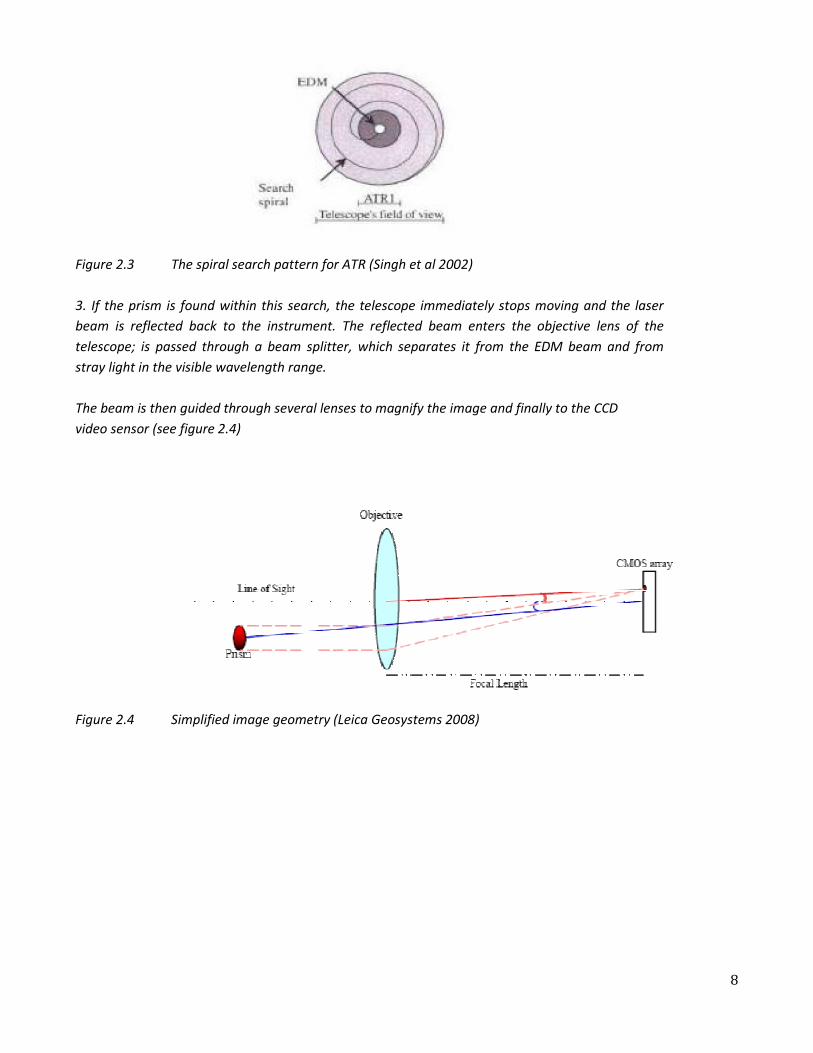
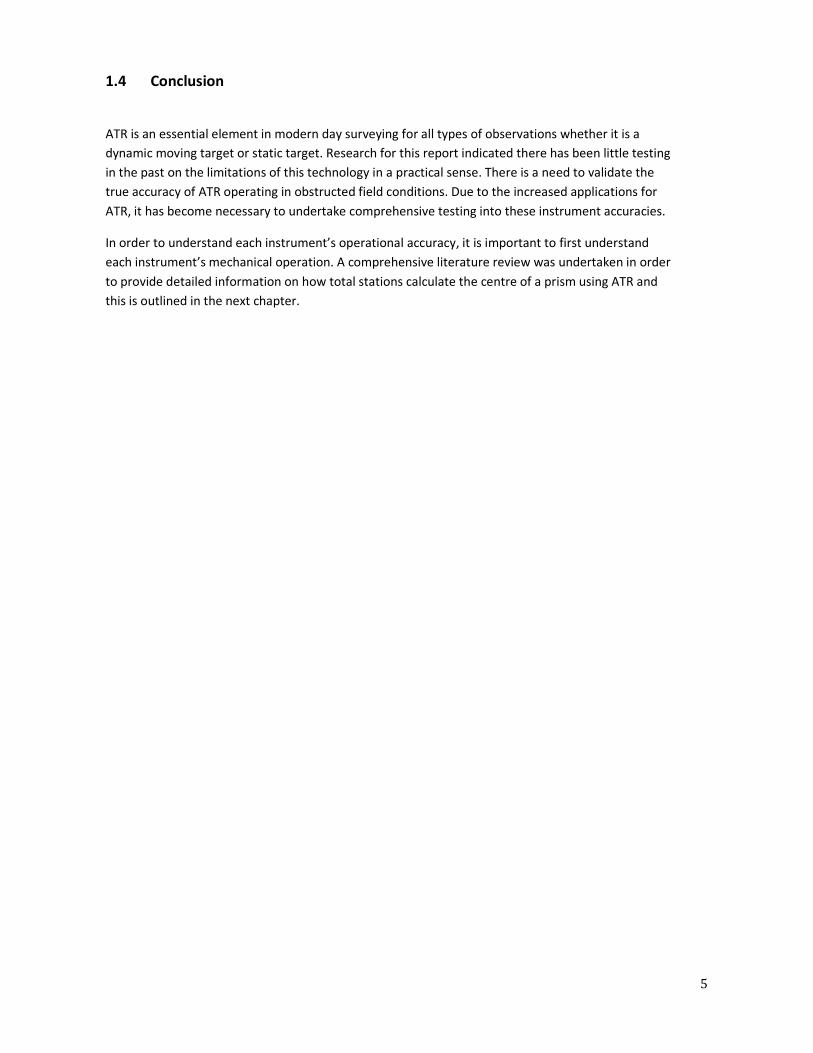
Figure 2.3 The spiral search pattern for ATR (Singh et al 200
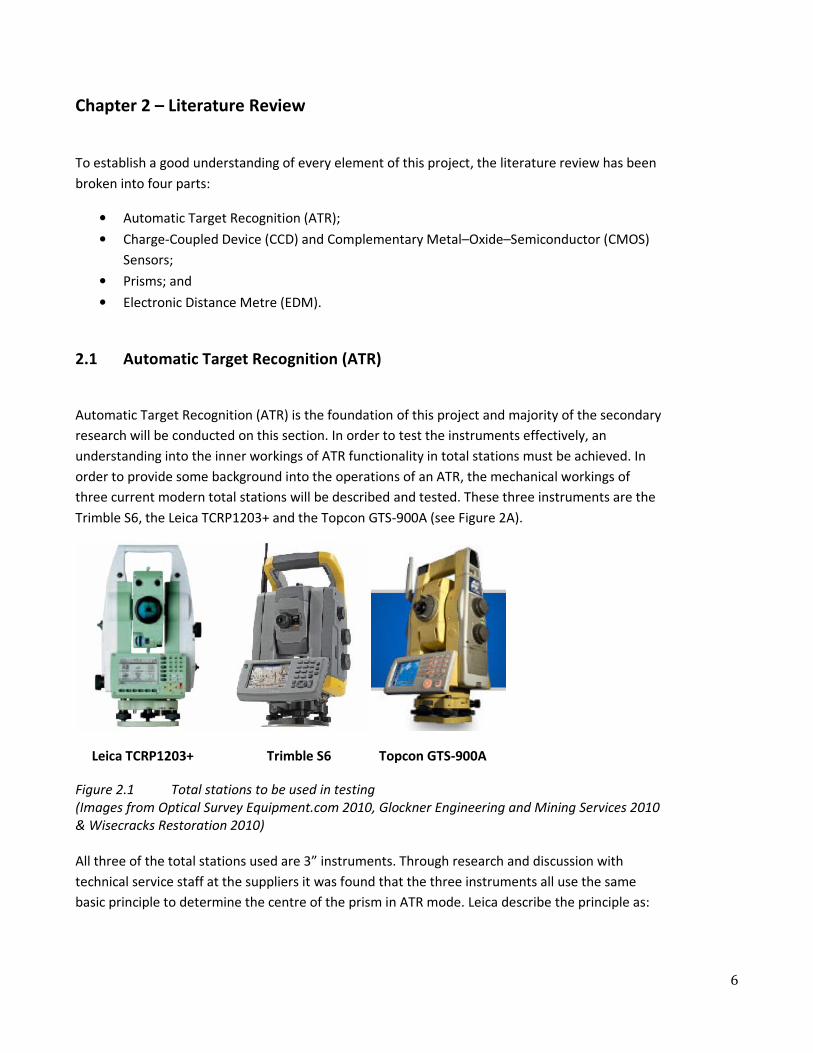
3. If the prism is found within this search, the telescope immediately stops moving and the laser
beam is reflected back to the instrument. The reflected beam enters the objective lens of the
telescope; is passed through a beam splitter, which separate
stray light in the visible wavelength range.
The beam is then guided through several lenses to magnify the image and finally to the
video sensor (see figure 2.4)
Figure 2.4 Simplified image geometry (Leica Ge
The spiral search pattern for ATR (Singh et al 2002)
3. If the prism is found within this search, the telescope immediately stops moving and the laser
beam is reflected back to the instrument. The reflected beam enters the objective lens of the
telescope; is passed through a beam splitter, which separates it from the EDM beam and from
stray light in the visible wavelength range.
The beam is then guided through several lenses to magnify the image and finally to the CCD
Simplified image geometry (Leica Geosystems 2008)
8
3. If the prism is found within this search, the telescope immediately stops moving and the laser
beam is reflected back to the instrument. The reflected beam enters the objective lens of the
s it from the EDM beam and from
CCD
9
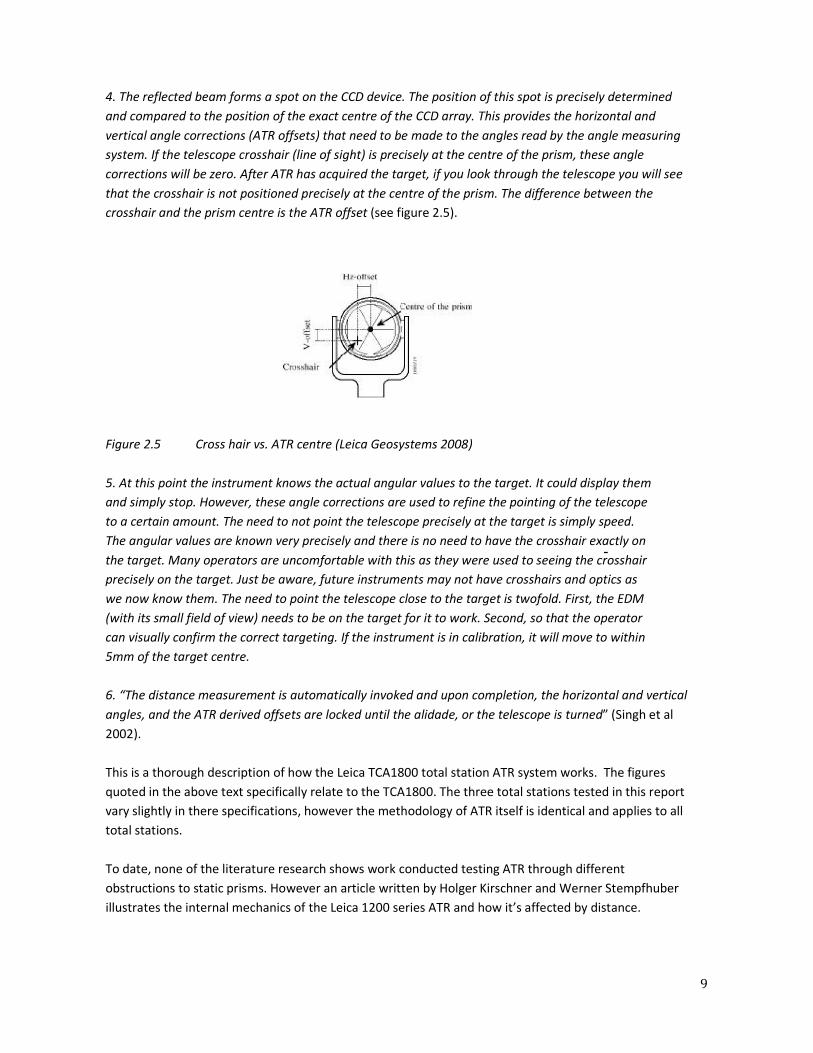
4. The reflected beam forms a spot on the CCD device. The position of this spot is precisely determined
and compared to the position of the exact centre of the CCD array. This provides the horizontal and
vertical angle corrections (ATR offsets) that need to be made to the angles read by the angle measuring
system. If the telescope crosshair (line of sight) is precisely at the centre of the prism, these angle
corrections will be zero. After ATR has acquired the target, if you look through the telescope you will see
that the crosshair is not positioned precisely at the centre of the prism. The difference between the
crosshair and the prism centre is the ATR offset (see figure 2.5).
Figure 2.5 Cross hair vs. ATR centre (Leica Geosystems 2008)
5. At this point the instrument knows the actual angular values to the target. It could display them
and simply stop. However, these angle corrections are used to refine the pointing of the telescope
to a certain amount. The need to not point the telescope precisely at the target is simply speed.
The angular values are known very precisely and there is no need to have the crosshair exactly on
the target. Many operators are uncomfortable with this as they were used to seeing the crosshair
precisely on the target. Just be aware, future instruments may not have crosshairs and optics as
we now know them. The need to point the telescope close to the target is twofold. First, the EDM
(with its small field of view) needs to be on the target for it to work. Second, so that the operator
can visually confirm the correct targeting. If the instrument is in calibration, it will move to within
5mm of the target centre.
6. “The distance measurement is automatically invoked and upon completion, the horizontal and vertical
angles, and the ATR derived offsets are locked until the alidade, or the telescope is turned” (Singh et al
2002).
This is a thorough description of how the Leica TCA1800 total station ATR system works. The figures
quoted in the above text specifically relate to the TCA1800. The three total stations tested in this report
vary slightly in there specifications, however the methodology of ATR itself is identical and applies to all
total stations.
To date, none of the literature research shows work conducted testing ATR through different
obstructions to static prisms. However an article written by Holger Kirschner and Werner Stempfhuber
illustrates the internal mechanics of the Leica 1200 series ATR and how it’s affected by distance.
10
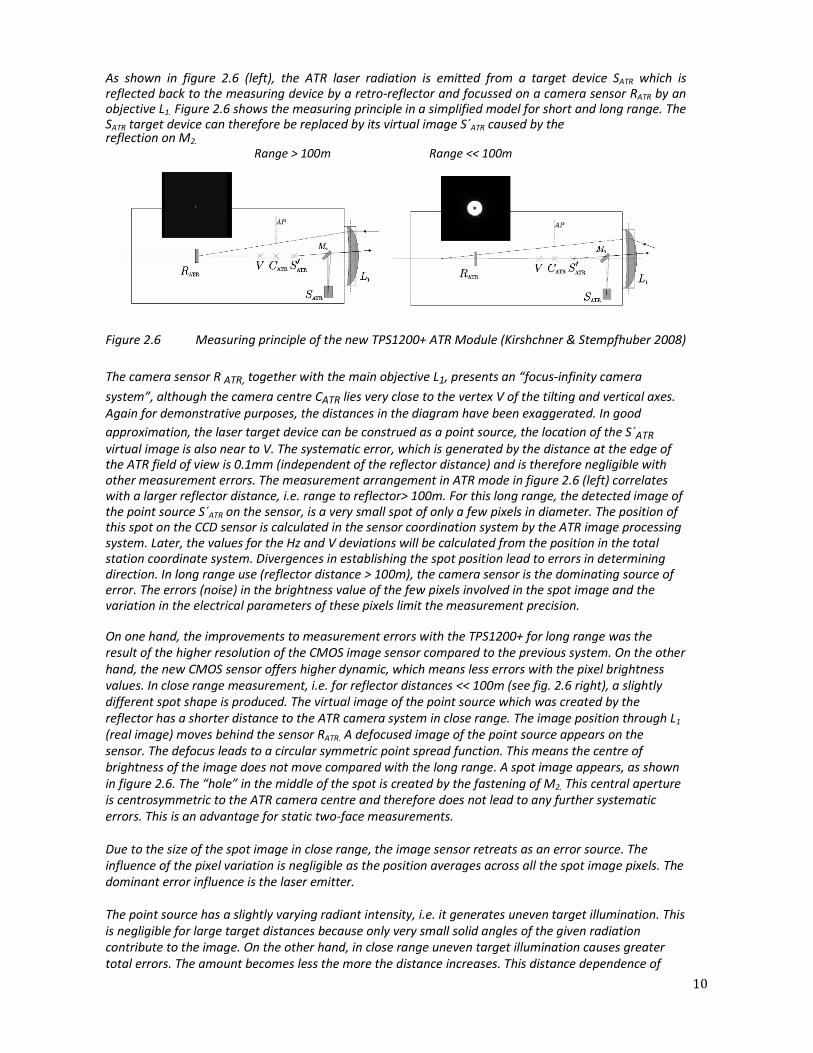
As shown in figure 2.6 (left), the ATR laser radiation is emitted from a target device SATR which is
reflected back to the measuring device by a retro-reflector and focussed on a camera sensor RATR by an objective L1. Figure 2.6 shows the measuring principle in a simplified model for short and long range. The SATR target device can therefore be replaced by its virtual image S´ATR caused by the reflection on M2.
Range > 100m Range << 100m
Figure 2.6 Measuring principle of the new TPS1200+ ATR Module (Kirshchner & Stempfhuber 2008)
The camera sensor R ATR, together with the main objective L1, presents an “focus-infinity camera
system”, although the camera centre CATR lies very close to the vertex V of the tilting and vertical axes.
Again for demonstrative purposes, the distances in the diagram have been exaggerated. In good
approximation, the laser target device can be construed as a point source, the location of the S´ATR
virtual image is also near to V. The systematic error, which is generated by the distance at the edge of
the ATR field of view is 0.1mm (independent of the reflector distance) and is therefore negligible with
other measurement errors. The measurement arrangement in ATR mode in figure 2.6 (left) correlates
with a larger reflector distance, i.e. range to reflector> 100m. For this long range, the detected image of
the point source S´ATR on the sensor, is a very small spot of only a few pixels in diameter. The position of
this spot on the CCD sensor is calculated in the sensor coordination system by the ATR image processing
system. Later, the values for the Hz and V deviations will be calculated from the position in the total
station coordinate system. Divergences in establishing the spot position lead to errors in determining
direction. In long range use (reflector distance > 100m), the camera sensor is the dominating source of
error. The errors (noise) in the brightness value of the few pixels involved in the spot image and the
variation in the electrical parameters of these pixels limit the measurement precision.
On one hand, the improvements to measurement errors with the TPS1200+ for long range was the
result of the higher resolution of the CMOS image sensor compared to the previous system. On the other
hand, the new CMOS sensor offers higher dynamic, which means less errors with the pixel brightness
values. In close range measurement, i.e. for reflector distances << 100m (see fig. 2.6 right), a slightly
different spot shape is produced. The virtual image of the point source which was created by the
reflector has a shorter distance to the ATR camera system in close range. The image position through L1
(real image) moves behind the sensor RATR. A defocused image of the point source appears on the
sensor. The defocus leads to a circular symmetric point spread function. This means the centre of
brightness of the image does not move compared with the long range. A spot image appears, as shown
in figure 2.6. The “hole” in the middle of the spot is created by the fastening of M2. This central aperture
is centrosymmetric to the ATR camera centre and therefore does not lead to any further systematic
errors. This is an advantage for static two-face measurements.
Due to the size of the spot image in close range, the image sensor retreats as an error source. The
influence of the pixel variation is negligible as the position averages across all the spot image pixels. The
dominant error influence is the laser emitter.
The point source has a slightly varying radiant intensity, i.e. it generates uneven target illumination. This
is negligible for large target distances because only very small solid angles of the given radiation
contribute to the image. On the other hand, in close range uneven target illumination causes greater
total errors. The amount becomes less the more the distance increases. This distance dependence of
11
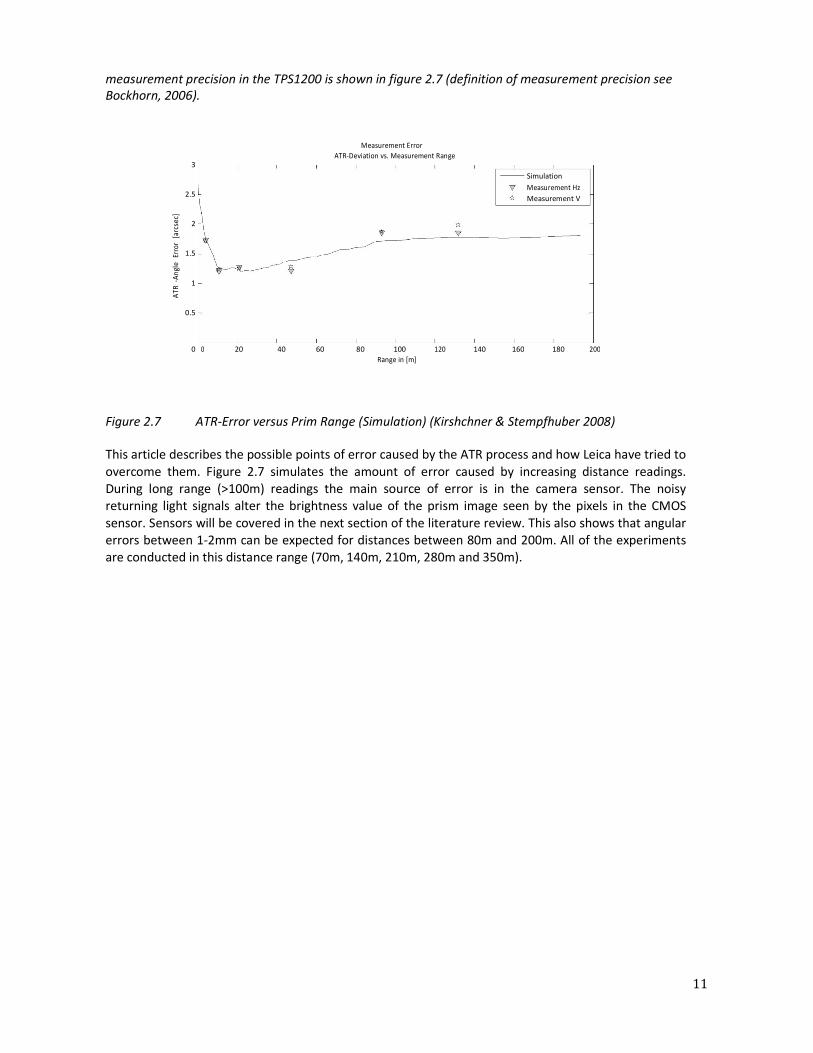
measurement precision in the TPS1200 is shown in figure 2.7 (definition of measurement precision see
Bockhorn, 2006).
Measurement Error
3 ATR-Deviation vs. Measurement Range
Simulation
2.5
Measurement Hz
Measurement V
[arc
sec]
2
Erro
r
1.5
An
gle
1
-
AT
R
0.5
0 0 20 40 60 80 100 120 140 160 180 200
Range in [m]
Figure 2.7 ATR-Error versus Prim Range (Simulation) (Kirshchner & Stempfhuber 2008)
This article describes the possible points of error caused by the ATR process and how Leica have tried to
overcome them. Figure 2.7 simulates the amount of error caused by increasing distance readings.
During long range (>100m) readings the main source of error is in the camera sensor. The noisy
returning light signals alter the brightness value of the prism image seen by the pixels in the CMOS
sensor. Sensors will be covered in the next section of the literature review. This also shows that angular
errors between 1-2mm can be expected for distances between 80m and 200m. All of the experiments
are conducted in this distance range (70m, 140m, 210m, 280m and 350m).

12
2.2 Charge-Coupled Device (CCD) and Complementary Metal–Oxide–Semiconductor
(CMOS) Sensors
Image sensors are used in all digital visual capturing devices such as digital cameras, video cameras and
total stations. Charge-Coupled Device (CCD) and Complementary Metal-Oxide-Semiconductor (CMOS)
sensors both achieve the same task of accepting, capturing and converting light into electrical signals. The
three total stations been tested in this project all use the CMOS sensor, which is now widely used as the
sensor of choice in modern total stations.
A CCD is an electrical device that is used to create images of objects, store information (analogous to the
way a computer stores information), or transfer electrical charge (as part of larger device). It receives as
input light from an object or an electrical charge. The CCD takes this optical or electronic input and converts
it into an electronic signal - the output. The electronic signal is then processed by some other equipment
and/or software to either produce an image or to give the user valuable information (Peterson 2001).
.
Figure 2.8 CCD (Charge-Coupled Device) Image Sensor (Peterson 2001)
The Complementary Metal–Oxide–Semiconductor (CMOS) is an active pixel sensor which also converts
light, using a semi-conductive process, into electric voltage signals to create digital data.

13
Figure 2.9 CMOS (Complementary Metal–Oxide–Semiconductor) Image Sensor (Peterson 2001)
Research in this area would not be beneficial as it is beyond the scope of this report to evaluate the in-
depth process and the makeup of the image sensors. A comparison of the two images sensor types is
included in Appendix B.
Leica has justified why they are now using CMOS technology in their 1200 Series Total stations:
With the TPS1200+, the imaging technology is based on Complementary Metal–Oxide–Semiconductor
(CMOS) two dimensional (2-D) array technology instead of the CCD. The advantageous of CMOS camera lies
in the clear and sharp images even with the existence of bright background lights and fast image
processing. In addition, the new ATR CMOS camera has a pixel size of 6-μm allowing higher resolution
images that guarantee superior measuring accuracy. The improvements in the ATR also allow an improved
in range (Leica Geosystems, 2008).
Research findings indicated the following reasons why CMOS sensors are now used:
• CMOS sensors have high noise immunity;
• Lower power consumption;
• Produces less heat; and
• Less expensive.
Regardless of the type of sensor or brand of instrument, the idea of this project is to highlight any errors
caused by a noisy, degraded, diffracted return signal to the CMOS sensor in the instrument. Obstructions
such as dust and grass could deplete the amount of light been received by the sensors pixels, which in turn
will distort the image of the prism and have a negative effect on the ability to centre the instrument. If the
image sensor is unable to calculate the horizontal and vertical displacements of the prism, it will also be
unable to send the correct messages to the total stations rotating positioning plates.
By testing the different effects obstructions have on the returning light signals to the total stations image
sensors, it will be possible to establish the limitations of ATR. By realising the limitations of ATR, surveyors
will be able to plan their surveys better and avoid unfortunate errors.

2.3 Prisms
Two types of prisms were used in this project to test the ATR
• Leica Circular Prism GPR1; and
• Leica 360 Prism GRZ1.
a) Leica 360 Prism GRZ1 b) Leica Circular Prism GPR1
Figure 2.10 Leica prisms used during testing
Survey prisms are the most commonly used devices to reflect a laser wav
back to the total station so that distance measurements can be produced. Manufacturers design their total
stations for the ATR function to work with prisms to create concentrated light source used for distance
measurements. Both of the Leica survey prisms are designed on the principle they will reflect an infrared
wave back to where it came from parallel to the original propagating wave without scatteri
figure 2.11).
Figure 2.11 Wave forms entering a prism and being reflected back to the source
As mentioned in the ATR information above, the instrument’s ATR function identifies a prism as a
concentrated light source. From this light source, a clear defined point image on the camera se
obtained from the returning light from the prism. This is only possible because the prism returning the
infrared wave is not scattered.
Two types of prisms were used in this project to test the ATR limitations. These were:
Leica Circular Prism GPR1
Leica prisms used during testing
Survey prisms are the most commonly used devices to reflect a laser wave emitted from a total station,
back to the total station so that distance measurements can be produced. Manufacturers design their total
stations for the ATR function to work with prisms to create concentrated light source used for distance
Both of the Leica survey prisms are designed on the principle they will reflect an infrared
wave back to where it came from parallel to the original propagating wave without scatteri
g a prism and being reflected back to the source (Steyn, 2009)
As mentioned in the ATR information above, the instrument’s ATR function identifies a prism as a
concentrated light source. From this light source, a clear defined point image on the camera se
obtained from the returning light from the prism. This is only possible because the prism returning the
14
e emitted from a total station,
back to the total station so that distance measurements can be produced. Manufacturers design their total
stations for the ATR function to work with prisms to create concentrated light source used for distance
Both of the Leica survey prisms are designed on the principle they will reflect an infrared
wave back to where it came from parallel to the original propagating wave without scattering the light (see
(Steyn, 2009)
As mentioned in the ATR information above, the instrument’s ATR function identifies a prism as a
concentrated light source. From this light source, a clear defined point image on the camera sensor is
obtained from the returning light from the prism. This is only possible because the prism returning the
15
ATR mode LOCK mode
Range
800 m (2600
ft)
Standard prism (GPR1): 1000 m (3300 ft)
360° prism (GRZ4): 600 m (2000 ft)
500 m (1600
ft)
360° mini prism (GRZ101): 350 m (1150 ft)
300 m (1000
ft)
Mini prism (GMP101): 500 m (1600 ft)
400 m (1300
ft)
Reflector tape (60 mm x
60mm): 55 m (175ft) -
Shortest measuring distance: 1.5 m 5 m
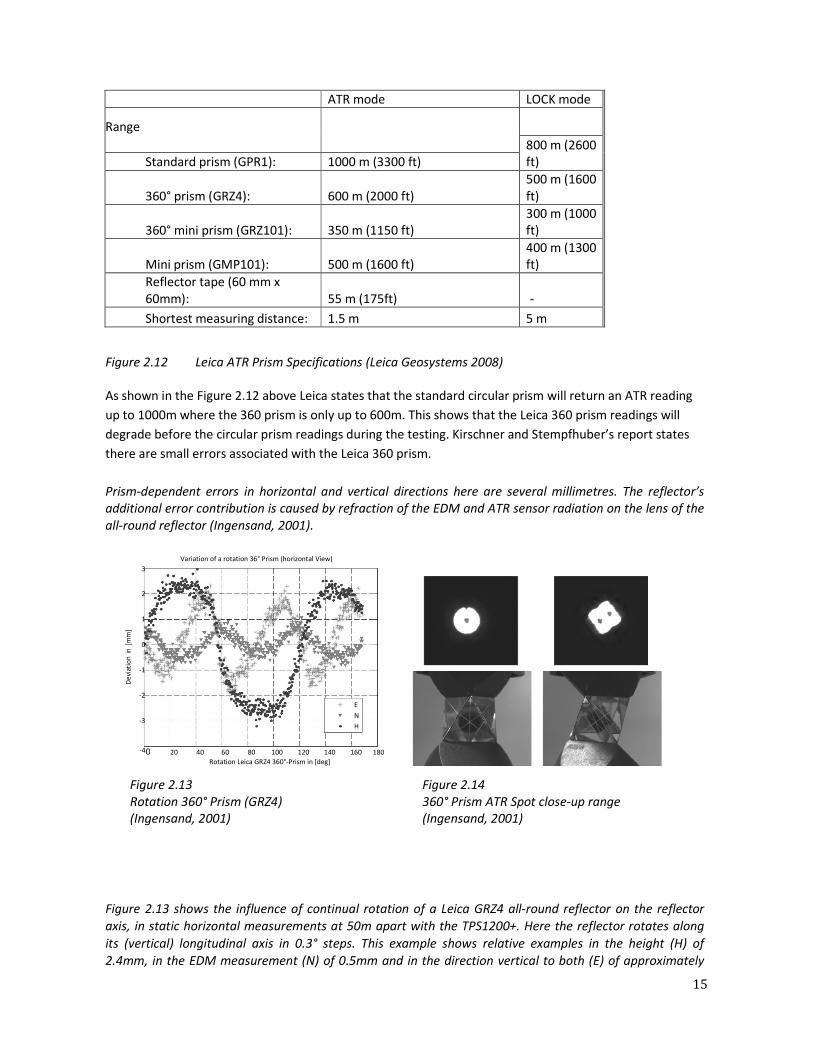
Figure 2.12 Leica ATR Prism Specifications (Leica Geosystems 2008)
As shown in the Figure 2.12 above Leica states that the standard circular prism will return an ATR reading
up to 1000m where the 360 prism is only up to 600m. This shows that the Leica 360 prism readings will
degrade before the circular prism readings during the testing. Kirschner and Stempfhuber’s report states
there are small errors associated with the Leica 360 prism.
Prism-dependent errors in horizontal and vertical directions here are several millimetres. The reflector’s
additional error contribution is caused by refraction of the EDM and ATR sensor radiation on the lens of the
all-round reflector (Ingensand, 2001).
Variation of a rotation 36° Prism (horizontal View)
3
2
1
[mm
]
0
in
De
viat
ion
-1
-2 E
-3 N
H
-40 20 40 60 80 100 120 140 160 180
Rotation Leica GRZ4 360°-Prism in [deg]
Figure 2.13
Rotation 360° Prism (GRZ4)
(Ingensand, 2001)
Figure 2.14
360° Prism ATR Spot close-up range
(Ingensand, 2001)
Figure 2.13 shows the influence of continual rotation of a Leica GRZ4 all-round reflector on the reflector
axis, in static horizontal measurements at 50m apart with the TPS1200+. Here the reflector rotates along
its (vertical) longitudinal axis in 0.3° steps. This example shows relative examples in the height (H) of
2.4mm, in the EDM measurement (N) of 0.5mm and in the direction vertical to both (E) of approximately

16
1.5mm. With steep measurements an even greater height error is produced. It is simple to estimate the
error from reflector geometry and refractive index for the EDM measurement. For ATR measurements, this
measurement error, mostly of Hz direction, is corrected by analysing several prisms of different orientation
(Ingensand, 2001).
From this information it can be determined there will be a 2-3 mm of error from the Leica 360 prism if it is
in motion. In the case of this project, the prism will be in a static position.
2.4 Electronic Distance Metre (EDM)
Electronic Distance Metre (EDM) is the distance measurement method used in all modern total stations. A
modulated microwave or infrared carrier signal is emitted from the instrument and is reflected by a prism
reflector. The time taken for the signal to be sent and received is interpreted by the computer in the total
station. The time is then used and compared with the frequency and speed of the wavelength to calculate
the distance to the prism.
17
Chapter 3 - Methodology
3.1 Calibration
The Trimble and Topcon total stations do not have user friendly manual ATR calibrations. The calibrations
have to be done by the instrument suppliers. Before testing there was assurance from the supplier the
instruments used were properly calibrated and tested to factory standards. Calibration certificates were
also supplied. The Leica 1200 series on the other hand allows for manual ATR calibration.
The process for manual ATR calibration is as follows:
The process involves precisely aiming the instrument manually at a reflector approximately 100 m away.
The ATR calibration routine allows checking or defining the alignment of the centre of the CCD camera and
the optical axis of the telescope. To determine this ATR collimation error, a reflector must be manually
targeted in horizontal and vertical directions. The angular differences in horizontal and vertical directions
between the line of sight (crosshair) and the centre of the CCD camera are calculated by the instrument. The
angular differences established during calibration are always applied to angles measured with ATR. This
procedure ensures that you obtain the same angle reading to a prism, no matter if you aim manually or you
let the ATR do it for you (McKenzie, 2002).
3.2 Testing
The testing of the total stations took place at the Moreton Bay Council (Caboolture) EDM calibration range.
This provided continuity of results and a consistent test platform for the duration of the project as the
testing was done over a period of four weekends. It should be noted that the testing days were in close
succession in order to achieve similar climatic conditions. All testing was done in the morning or late
afternoon during the Queensland winter to avoid the effects of heat and humidity. The EDM calibration
range is made up of a series on concrete plinths which are free from short term movements. The EDM
calibration range provided a clear area free from obstructions for the 350m distance being tested. It was
not in the scope of this project to assess the affect of high vertical / horizontal angle of incidence, so the
calibration range served as an ideal test area because its height changes are relatively minimal.
All instruments were tested in their base ATR mode (ignoring fine lock or long distance modes).
Temperature and pressure were also constantly monitored during testing and adjustments were made to
the instruments settings if needed.
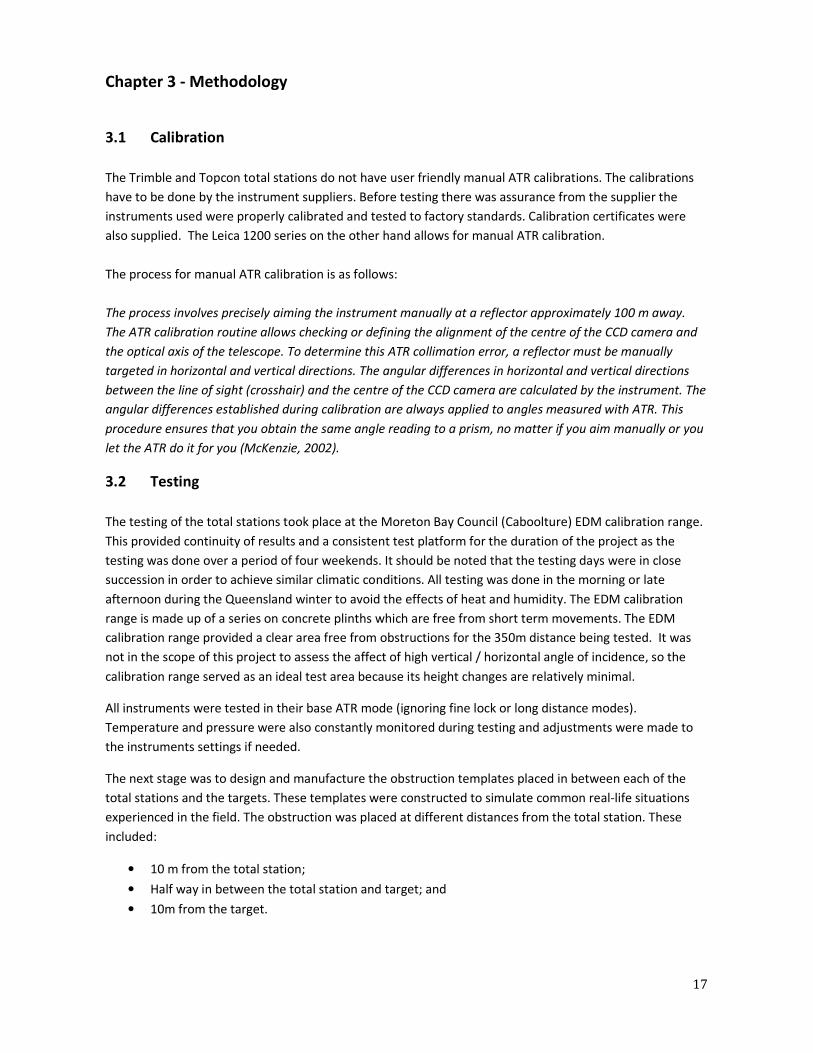
The next stage was to design and manufacture the obstruction templates placed in between each of the
total stations and the targets. These templates were constructed to simulate common real-life situations
experienced in the field. The obstruction was placed at different distances from the total station. These
included:
• 10 m from the total station;
• Half way in between the total station and target; and
• 10m from the target.
18
Figure 3.1 Obstruction placement variations
Static observations were taken to two reflector prism targets, these included:
• Leica Round Prism (GPR1); and
• Leica 360 Prism (GRZ4).
The distances the prisms were placed from the instrument included:
• 70m
• 140m
• 210m
• 280m
• 350m
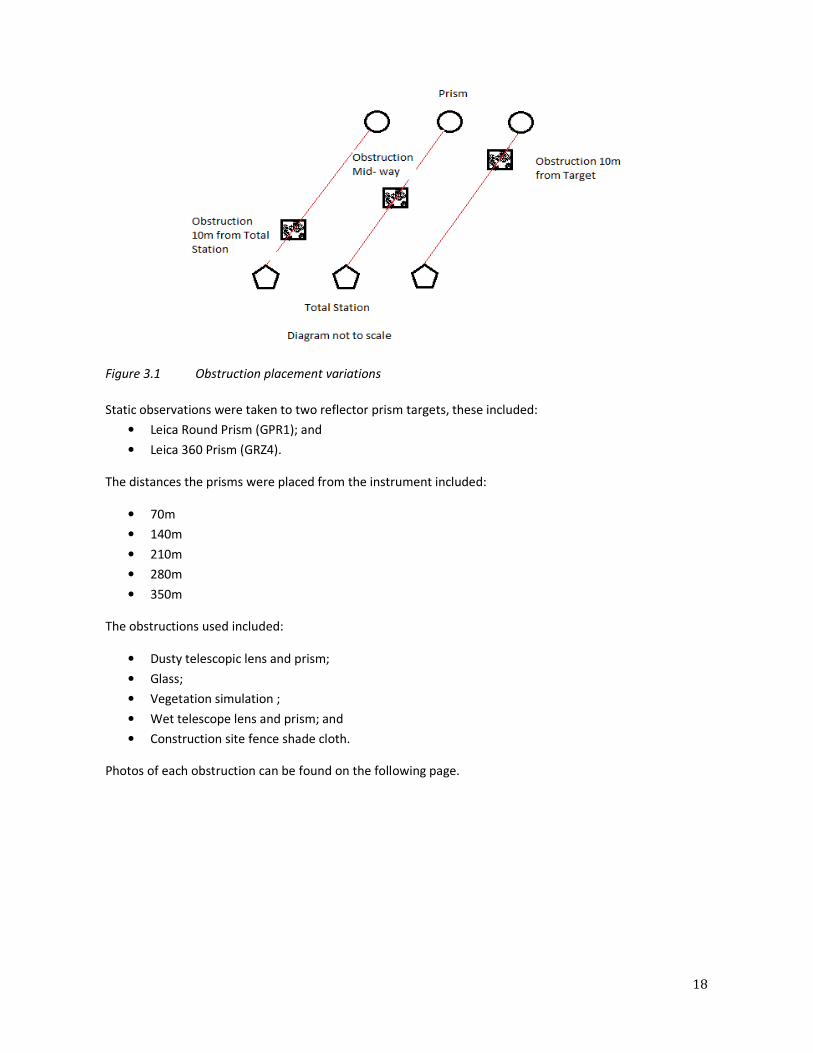
The obstructions used included:
• Dusty telescopic lens and prism;
• Glass;
• Vegetation simulation ;
• Wet telescope lens and prism; and
• Construction site fence shade cloth.
Photos of each obstruction can be found on the following page.
19
a) Shade cloth obstruction b) Glass obstruction c) Vegetation obstruction
d) Dusty total station e) Wet total station
Figure 3.2 Obstructions Templates
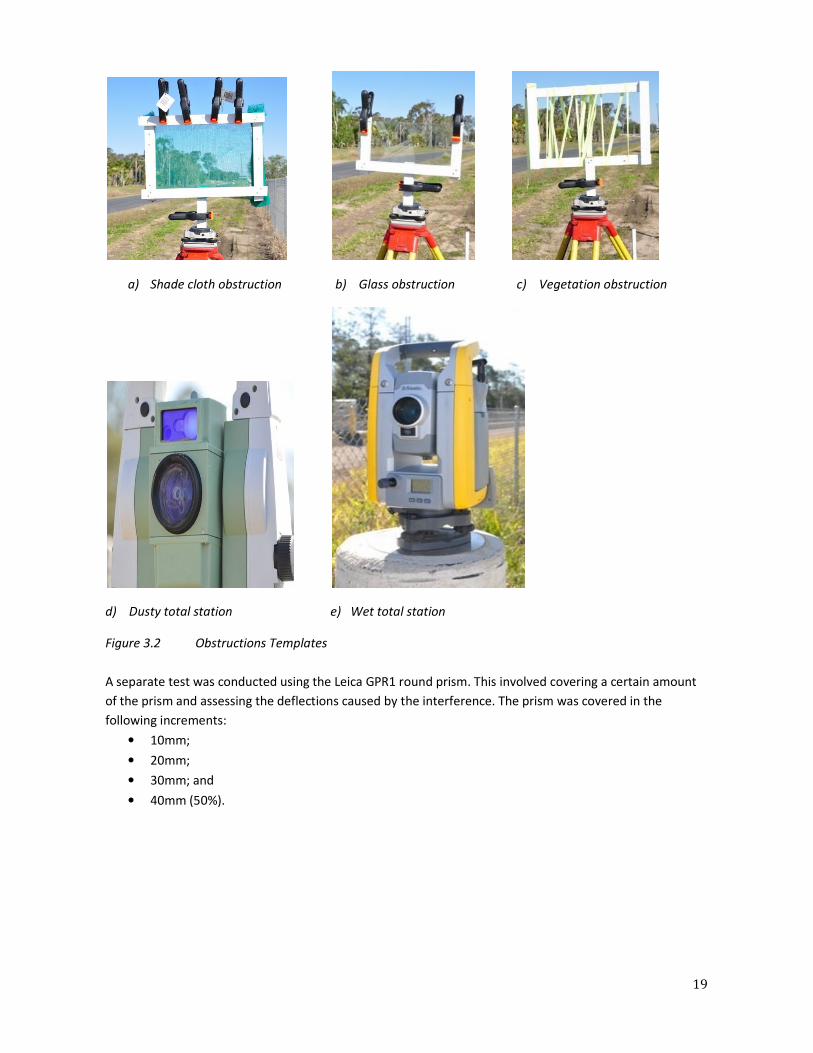
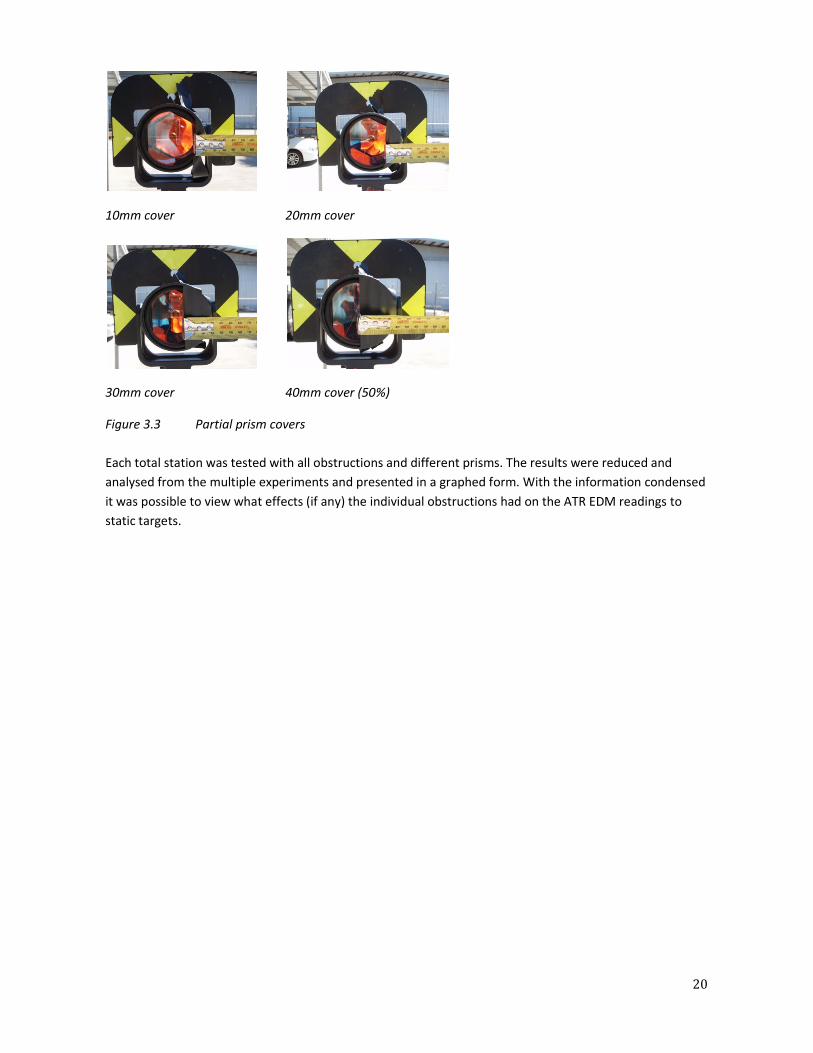
A separate test was conducted using the Leica GPR1 round prism. This involved covering a certain amount
of the prism and assessing the deflections caused by the interference. The prism was covered in the
following increments:
• 10mm;
• 20mm;
• 30mm; and
• 40mm (50%).
20
10mm cover 20mm cover
30mm cover 40mm cover (50%)
Figure 3.3 Partial prism covers
Each total station was tested with all obstructions and different prisms. The results were reduced and
analysed from the multiple experiments and presented in a graphed form. With the information condensed
it was possible to view what effects (if any) the individual obstructions had on the ATR EDM readings to
static targets.

21
3.3 Obstruction Test Methodology
This project had multiple variables that needed to be taken into consideration. These included:
• Changing the total stations;
• Changing the obstruction type;
• Altering the distance of the obstruction from the total station; and
• Changing the prism type.
Due to these variables, extensive planning was needed to ensure each obstruction variation was accurately
tested and recorded.
The field testing procedure for each total station occurred in the following order:
1. Each total station was set up at the origin point concrete plinth;
2. Each prism was set up at the predefined testing lengths;
3. The total station was set at zero degrees zenith to each prism being tested by taking a 10 shot
average reading;
4. Each obstruction was then placed in the measuring path at the following stages:
4.1. 10 m from the total station;
4.2. Half way in between the total station and target; and
4.3. 10m from the target.
5. 10 readings were taken to the target prism through each independent obstruction variable.
This process was repeated for each total station and recorded in the laptop on-site into organised
spreadsheets.
3.4 Data Recording Procedure
During the experiments the data was recorded onsite into a laptop with predefined excel spreadsheets. The
readings were read out loud by the surveyor to an assistant who entered them into the spreadsheets. The
three data readings taken from the instrument were:
1. Horizontal deviation in whole seconds;
2. Vertical deviation in whole seconds; and
3. Horizontal deviation in millimetres.
By recording only the deviations from zero degrees zenith the data was more manageable and easy to
graph in excel. By simplifying the data in this way the recording process was less susceptible to errors.

22
3.4 Conclusion
All the testing described in this chapter has been successfully completed and the resulting data will be
examined in the next chapter. All three instruments have been tested with every obstruction in cool
temperate conditions.
The next chapter will analyse the effects that each individual obstruction had on the ATR readings.
23
Chapter 4 - Results and Discussions
The operational accuracy of an ATR system within a total station is critical to any surveying task. As
discussed in earlier chapters, ATR relies on one key factor to establish the centre of a prism target. This is
the quality of the returning light reflected from the prism back to the digital sensors.
It has being proven by manufacturers that ATR is a viable and accurate technology. This allows a surveyor
to read to a prism without looking through the instrument’s telescope and take a reading, saving time and
enabling surveyors to work remotely. However, this technology can create a certain amount of
complacency in the surveyor who will then not manually check for obstructions on the reading path. The
following results demonstrate the accuracy and limitations that can be expected if an ATR reading is taken
through an obstruction.
4.1 Analysis of Results
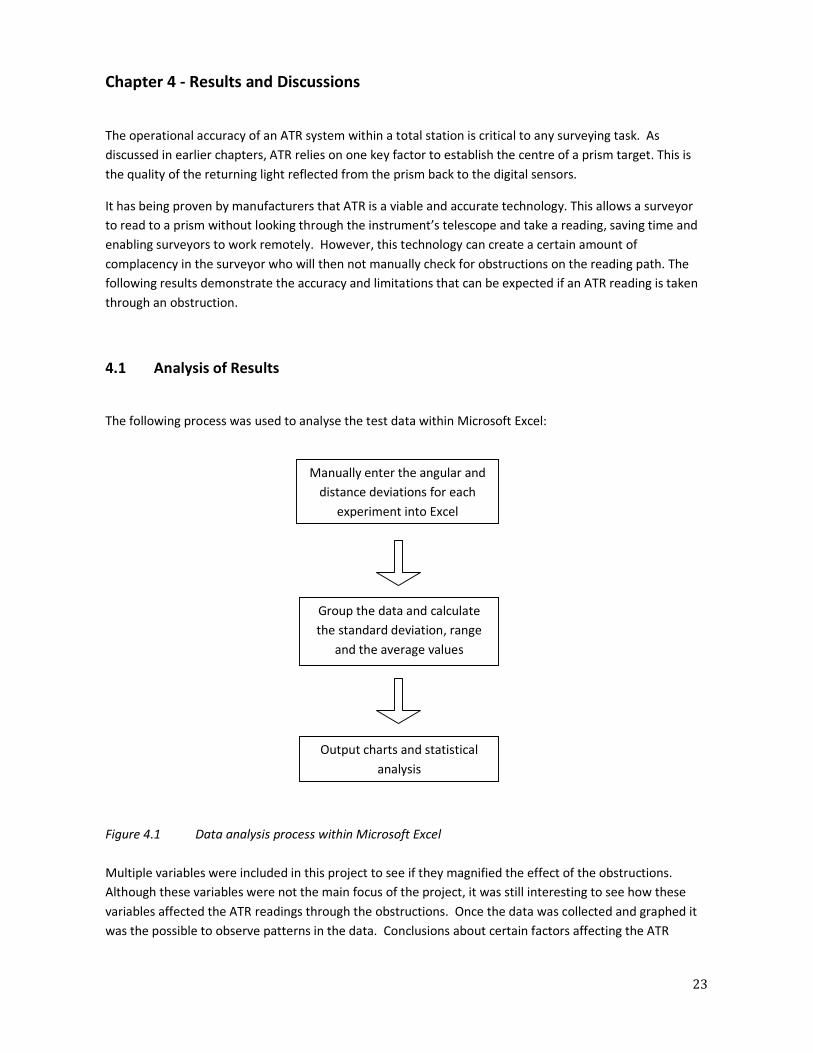
The following process was used to analyse the test data within Microsoft Excel:
Figure 4.1 Data analysis process within Microsoft Excel
Multiple variables were included in this project to see if they magnified the effect of the obstructions.
Although these variables were not the main focus of the project, it was still interesting to see how these
variables affected the ATR readings through the obstructions. Once the data was collected and graphed it
was the possible to observe patterns in the data. Conclusions about certain factors affecting the ATR
Manually enter the angular and
distance deviations for each
experiment into Excel
Group the data and calculate
the standard deviation, range
and the average values
Output charts and statistical
analysis

24
readings through the obstruction were able to be drawn from analysing these patterns. These results are
discussed in the sections below under the following headings:
• Total station performance;
• Prism performance;
• Obstruction distance from target; and
• Prism distance from total station.
4.1.1 Total station performance
Three total stations were tested for the duration of the project, these included:
• Trimble S6;
• Leica TCRP1203+; and
• Topcon GTS-900A.
This was done to ensure that no bias was shown to any particular brand. By using three instruments it also
acted as a check on the results of each instrument. All instruments use the same basic principle to
automatically recognise the centre of a target; therefore no major differences in reading results were
expected. The manufacturers all promote the same amount of accuracy as they are all 3” instruments.
It quickly became evident during the testing there was minimal difference between the results of each
instrument. These findings resonate throughout the data. These similar deviation findings and illustrated in
the chart below.
Figure 4.2 Non obstructed instrument comparison
-6
-4
-2
0
2
4
6
Ho
riz
on
tal
De
fle
cti
on
s (S
ec
on
ds
)
Instrument Comparison
Horizontal Deviations
No obstructions
Prism: Leica GPR1 Round Prism
Leica Deviations HZ
(seconds)
Trimble Deviations HZ
(seconds)
Topcon Deviations HZ
(seconds)
25
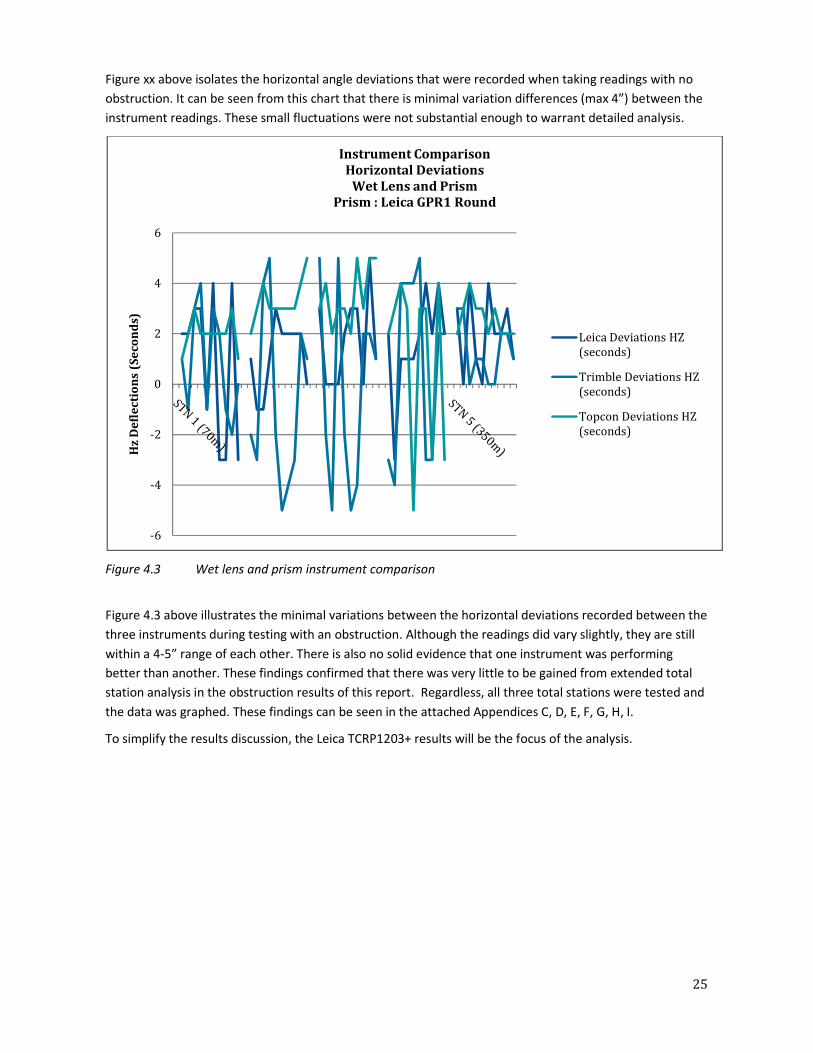
Figure xx above isolates the horizontal angle deviations that were recorded when taking readings with no
obstruction. It can be seen from this chart that there is minimal variation differences (max 4”) between the
instrument readings. These small fluctuations were not substantial enough to warrant detailed analysis.
Figure 4.3 Wet lens and prism instrument comparison
Figure 4.3 above illustrates the minimal variations between the horizontal deviations recorded between the
three instruments during testing with an obstruction. Although the readings did vary slightly, they are still
within a 4-5” range of each other. There is also no solid evidence that one instrument was performing
better than another. These findings confirmed that there was very little to be gained from extended total
station analysis in the obstruction results of this report. Regardless, all three total stations were tested and
the data was graphed. These findings can be seen in the attached Appendices C, D, E, F, G, H, I.
To simplify the results discussion, the Leica TCRP1203+ results will be the focus of the analysis.
-6
-4
-2
0
2
4
6
Hz
De
fle
cti
on
s (S
ec
on
ds)
Instrument Comparison
Horizontal Deviations
Wet Lens and Prism
Prism : Leica GPR1 Round
Leica Deviations HZ
(seconds)
Trimble Deviations HZ
(seconds)
Topcon Deviations HZ
(seconds)
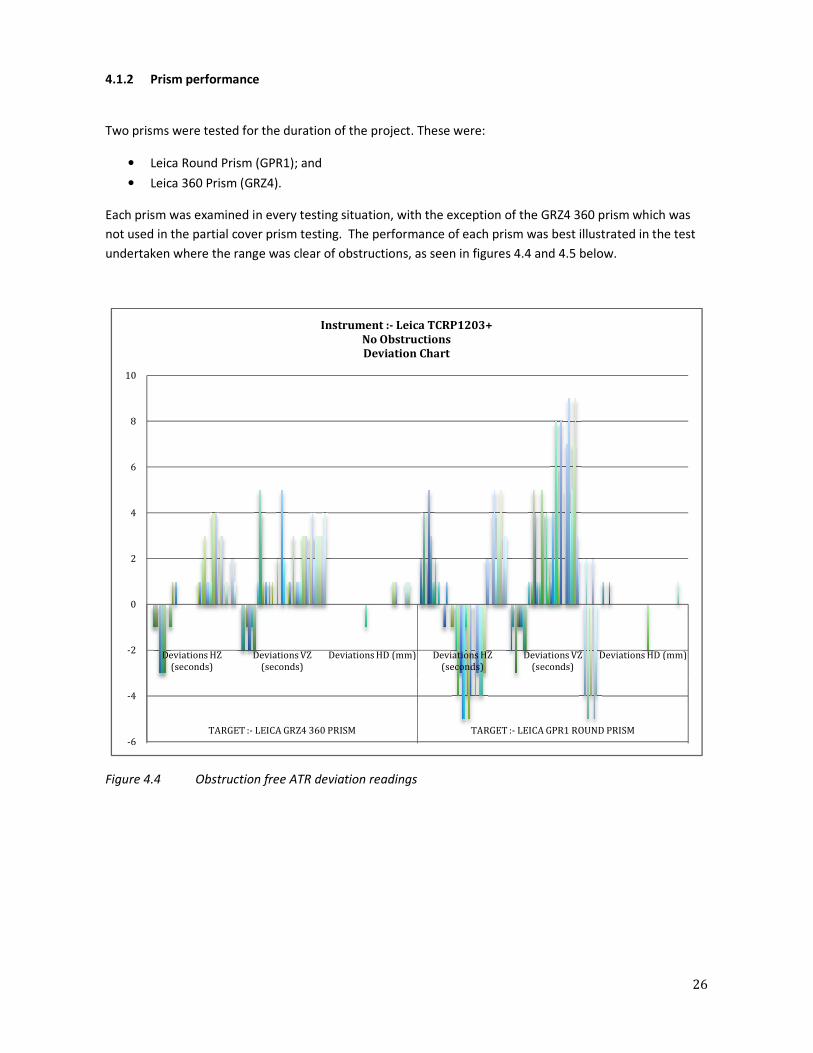
4.1.2 Prism performance
Two prisms were tested for the duration of the proj
• Leica Round Prism (GPR1); and
• Leica 360 Prism (GRZ4).
Each prism was examined in every testing situation, with the exception of the GRZ4 360 prism which was
not used in the partial cover prism testing. The performance of each prism was be
undertaken where the range was clear of obstructions, as seen in
Figure 4.4 Obstruction free ATR deviation readings
-6
-4
-2
0
2
4
6
8
10
Deviations HZ
(seconds)
Deviations VZ
(seconds)
TARGET :- LEICA GRZ4 360 PRISM
Two prisms were tested for the duration of the project. These were:
Leica Round Prism (GPR1); and
Each prism was examined in every testing situation, with the exception of the GRZ4 360 prism which was
not used in the partial cover prism testing. The performance of each prism was best illustrated in the test
undertaken where the range was clear of obstructions, as seen in figures 4.4 and 4.5 below.
Obstruction free ATR deviation readings
Deviations HD (mm) Deviations HZ
(seconds)
Deviations VZ
(seconds)
Deviations HD (mm)
LEICA GRZ4 360 PRISM TARGET :- LEICA GPR1 ROUND PRISM
Instrument :- Leica TCRP1203+
No Obstructions
Deviation Chart
26
Each prism was examined in every testing situation, with the exception of the GRZ4 360 prism which was
st illustrated in the test
below.
Deviations HD (mm)
LEICA GPR1 ROUND PRISM

27
Figure 4.5 Obstruction free ATR Statistics Chart
What came as a surprise was the GRZ4 360 prism performed better than the GPR1 round prism. This is
evident in both figures 4.4 and 4.5. These charts clearly show a spike in both horizontal and vertical
deviations when reading to the round prism. However, during the obstruction tests, the round prism
performed better in the majority of cases.
The following extremity data can be derived from figure 4B.
GRZ4 360 Prism
• Max Hz deflection = 4”= 5mm ( achieved at 280m)
• Max Vz deflection = 5” = 7mm (achieved at 210m)
• Max Hd deflection = +/-1mm
GPR1 Round Prism
• Max Hz deflection = 5” = 8mm( achieved at 350m )
• Max Vz deflection = 9” = 12mm(achieved at 280m)
• Max Hd deflection = +/-1mm
These are the most substantial deflections observed with no obstructions present. These figures are
important to highlight how much variation can occur in normal ATR readings. It is important for a surveyor
to know these figures so he/she understands there is scope for error when using these instruments in ATR
mode. These figures will also be a gauge for the readings taken through the obstruction variables.
-6
-4
-2
0
2
4
6
8
10
Deviations HZ
(seconds)
Deviations VZ
(seconds)
Deviations HD
(mm)
Deviations HZ
(seconds)
Deviations VZ
(seconds)
Deviations HD
(mm)
TARGET :- LEICA GRZ4 360 PRISM TARGET :- LEICA GPR1 ROUND PRISM
Instrument:- Leica TCRP1203+
No Obstructions
Statistics Chart
STN 1 (70m)
Std Dev
Range
Average
STN 2 (140m)
Std Dev
Range
Average
STN 3 (210m)
Std Dev
Range
Average
STN 4 (280m)
Std Dev
Range
Average
STN 5 (350m)
Std Dev
Range
Average

28
4.1.3 Obstruction distance from target
Each of the obstructions was placed at three different areas during the experiments. These are illustrated in
the figure 4D below.
Figure 4.6 Obstruction placement variations
By placing the obstructions at staged distances from the target it was then possible to monitor the effects
on deviations and how they changed. Throughout the testing and analysis it was evident the most dramatic
deflections were caused when the obstruction was 10m from the target. This is best shown in the deviation
chart below when reading through a glass panel obstruction.

Figure 4.7 Glass obstruction deviation chart
Data in the chart above indicates clearly the largest deviations in both th
deflections occur when the obstruction is placed 10m from the target. Similar results were recorded for all
tests regardless of the obstruction type. Thus, the closer the obstruction was placed to the instrument the
higher the percentage of the prism that was obscured causing a larger deflection.
4.1.4 Prism distance from total station
Both types of prisms were placed at five set distances from the instrument:
• 70m
• 140m
• 210m
• 280m
• 350m
It was noted throughout the testing that t
was closest to the instrument.
This is caused by the obstruction degrading the returning light signals returning from the prism. If half the
prism is covered the instrument will find the centre
the prism is 70m from the instrument, the instrument will have to rotate a larger angle to find the centre of
the prism’s unobstructed remains than it would if the prism was 350m away. This is illu
-40
-30
-20
-10
0
10
20
30
De
via
tio
ns
HZ
(se
con
ds)
De
via
tio
ns
VZ
(se
con
ds)
De
via
tio
ns
HD
(m
m)
De
via
tio
ns
HZ
(se
con
ds)
De
via
tio
ns
VZ
(se
con
ds)
De
via
tio
ns
HD
(m
m)
Obstruction 10m
from Station
Mid-way Obstruction
TARGET :- LEICA GRZ4 360 PRISM
Instrument:
Glass obstruction deviation chart
Data in the chart above indicates clearly the largest deviations in both the vertical and horizontal
deflections occur when the obstruction is placed 10m from the target. Similar results were recorded for all
tests regardless of the obstruction type. Thus, the closer the obstruction was placed to the instrument the
centage of the prism that was obscured causing a larger deflection.
Prism distance from total station
Both types of prisms were placed at five set distances from the instrument:
It was noted throughout the testing that the most severe angular deflections were caused when the prism
This is caused by the obstruction degrading the returning light signals returning from the prism. If half the
prism is covered the instrument will find the centre of the remaining visible part of the prism. This means if
the prism is 70m from the instrument, the instrument will have to rotate a larger angle to find the centre of
the prism’s unobstructed remains than it would if the prism was 350m away. This is illustrated in figure 4
De
via
tio
ns
HD
(m
m)
De
via
tio
ns
HZ
(se
con
ds)
De
via
tio
ns
VZ
(se
con
ds)
De
via
tio
ns
HD
(m
m)
De
via
tio
ns
HZ
(se
con
ds)
De
via
tio
ns
VZ
(se
con
ds)
De
via
tio
ns
HD
(m
m)
De
via
tio
ns
HZ
(se
con
ds)
De
via
tio
ns
VZ
(se
con
ds)
De
via
tio
ns
HD
(m
m)
way Obstruction Obstruction 10m
from Target
Obstruction 10m
from Station
Mid-way Obstruction
LEICA GRZ4 360 PRISM TARGET :- LEICA GPR1 ROUND PRISM
Instrument:- Leica TCRP1203+
Obstruction:- Glass
Deviation Chart
29
e vertical and horizontal
deflections occur when the obstruction is placed 10m from the target. Similar results were recorded for all
tests regardless of the obstruction type. Thus, the closer the obstruction was placed to the instrument the
he most severe angular deflections were caused when the prism
This is caused by the obstruction degrading the returning light signals returning from the prism. If half the
of the remaining visible part of the prism. This means if
the prism is 70m from the instrument, the instrument will have to rotate a larger angle to find the centre of
strated in figure 4.8.
De
via
tio
ns
HZ
(se
con
ds)
De
via
tio
ns
VZ
(se
con
ds)
De
via
tio
ns
HD
(m
m)
Obstruction 10m
from Target
LEICA GPR1 ROUND PRISM

30
Figure 4.8 Angular Deflection / Distance comparison
Although there is a larger amount of angular deviation when the prism is closer, it still translates into a
similar amount of error when compared to the larger distances. For example:
• Prism at 70m
Hz Deflection = 20” = 7mm
• Prism at 140m
Hz Deflection= 10” = 7mm
These figures explain why the effect of distance must be taken into account when analysing the deflection
data.
4.2 Obstruction Testing Results
The fabricated obstructions were designed to simulate obstructions that might be encountered during a
survey. Each instrument was subjected to the same obstruction tests in similar weather conditions. To
simplify the results analysis, only the Leica results will be disp
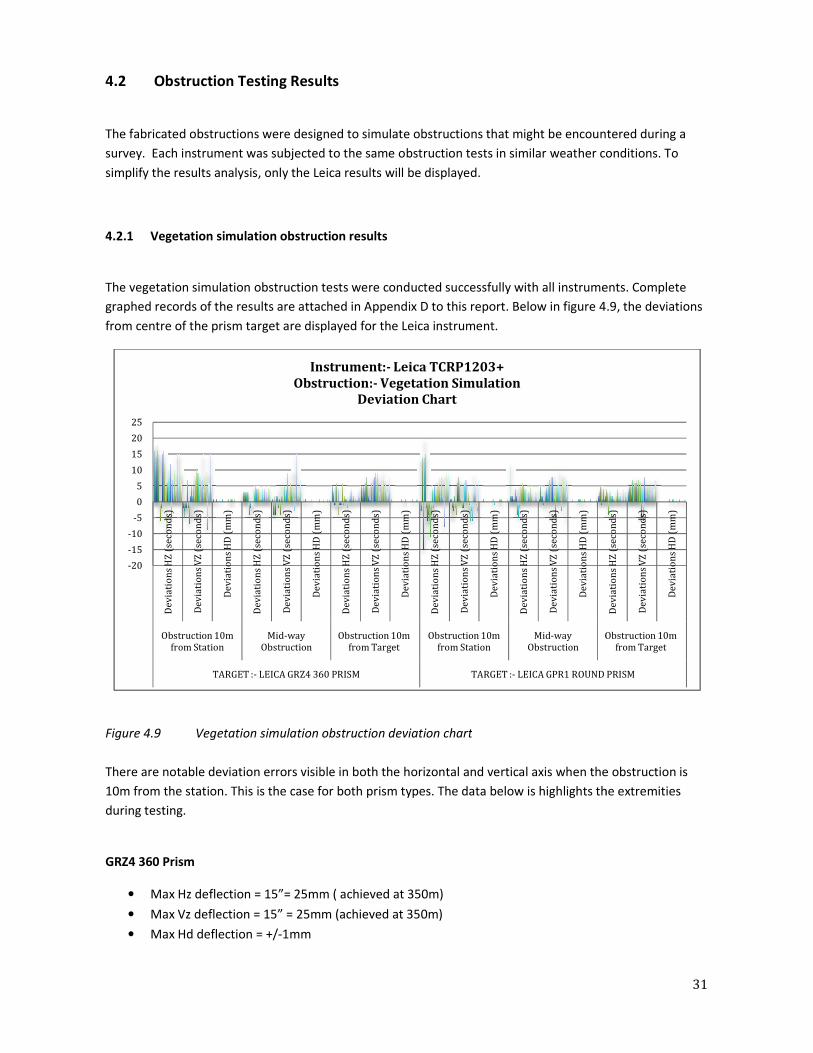
4.2.1 Vegetation simulation obstruction results
The vegetation simulation obstruction tests were conducted successfully with all instruments. Complete
graphed records of the results are attached in
from centre of the prism target are displayed for the Leica instrument.
Figure 4.9 Vegetation simulation obstruction deviation chart
There are notable deviation errors visible in both the horizontal and vertical axis when the obstructi
10m from the station. This is the case for both prism types. The data below is highlights the extremities
during testing.
GRZ4 360 Prism
• Max Hz deflection = 15”= 25mm ( achieved at 350m)
• Max Vz deflection = 15” = 25mm (achieved at 350m)
• Max Hd deflection = +/-1mm
-20
-15
-10
-5
0
5
10
15
20
25
De
via
tio
ns
HZ
(se
con
ds)
De
via
tio
ns
VZ
(se
con
ds)
De
via
tio
ns
HD
(m
m)
De
via
tio
ns
HZ
(se
con
ds)
De
via
tio
ns
VZ
(se
con
ds)
De
via
tio
ns
HD
(m
m)
Obstruction 10m
from Station
Mid-way
Obstruction
TARGET :- LEICA GRZ4 360 PRISM
Instrument:
Obstruction:
Obstruction Testing Results
obstructions were designed to simulate obstructions that might be encountered during a
survey. Each instrument was subjected to the same obstruction tests in similar weather conditions. To
simplify the results analysis, only the Leica results will be displayed.
Vegetation simulation obstruction results
The vegetation simulation obstruction tests were conducted successfully with all instruments. Complete
attached in Appendix D to this report. Below in figure 4.9
from centre of the prism target are displayed for the Leica instrument.
Vegetation simulation obstruction deviation chart
There are notable deviation errors visible in both the horizontal and vertical axis when the obstructi
10m from the station. This is the case for both prism types. The data below is highlights the extremities
Max Hz deflection = 15”= 25mm ( achieved at 350m)
Max Vz deflection = 15” = 25mm (achieved at 350m)
De
via
tio
ns
HD
(m
m)
De
via
tio
ns
HZ
(se
con
ds)
De
via
tio
ns
VZ
(se
con
ds)
De
via
tio
ns
HD
(m
m)
De
via
tio
ns
HZ
(se
con
ds)
De
via
tio
ns
VZ
(se
con
ds)
De
via
tio
ns
HD
(m
m)
De
via
tio
ns
HZ
(se
con
ds)
De
via
tio
ns
VZ
(se
con
ds)
De
via
tio
ns
HD
(m
m)
Obstruction 10m
from Target
Obstruction 10m
from Station
Mid-way
Obstruction
Obstruction 10m
LEICA GRZ4 360 PRISM TARGET :- LEICA GPR1 ROUND PRISM
Instrument:- Leica TCRP1203+
Obstruction:- Vegetation Simulation
Deviation Chart
31
obstructions were designed to simulate obstructions that might be encountered during a
survey. Each instrument was subjected to the same obstruction tests in similar weather conditions. To
The vegetation simulation obstruction tests were conducted successfully with all instruments. Complete
4.9, the deviations
There are notable deviation errors visible in both the horizontal and vertical axis when the obstruction is
10m from the station. This is the case for both prism types. The data below is highlights the extremities
De
via
tio
ns
HZ
(se
con
ds)
De
via
tio
ns
VZ
(se
con
ds)
De
via
tio
ns
HD
(m
m)
Obstruction 10m
from Target
LEICA GPR1 ROUND PRISM

32
GPR1 Round Prism
• Max Hz deflection = 9” = 15mm( achieved at 350m )
• Max Vz deflection = 9” = 15mm(achieved at 350m)
• Max Hd deflection = +/-1mm
Figure 4.10 Vegetation simulation obstruction statistics chart
In figure 4.10 above some key statistical data is displayed. The most significant figures in the chart are the
difference in range values for both prisms, especially when the obstruction is close to the instrument. This
chart gives visual confirmation of how random and sporadic the deviations were for this obstruction
experiment.
-10
-5
0
5
10
15
20
25
30
35
40
De
via
tio
ns
HZ
(se
con
ds)
De
via
tio
ns
VZ
(se
con
ds)
De
via
tio
ns
HD
(m
m)
De
via
tio
ns
HZ
(se
con
ds)
De
via
tio
ns
VZ
(se
con
ds)
De
via
tio
ns
HD
(m
m)
De
via
tio
ns
HZ
(se
con
ds)
De
via
tio
ns
VZ
(se
con
ds)
De
via
tio
ns
HD
(m
m)
De
via
tio
ns
HZ
(se
con
ds)
De
via
tio
ns
VZ
(se
con
ds)
De
via
tio
ns
HD
(m
m)
De
via
tio
ns
HZ
(se
con
ds)
De
via
tio
ns
VZ
(se
con
ds)
De
via
tio
ns
HD
(m
m)
De
via
tio
ns
HZ
(se
con
ds)
De
via
tio
ns
VZ
(se
con
ds)
De
via
tio
ns
HD
(m
m)
Obstruction 10m
from Station
Mid-way
Obstruction
Obstruction 10m
from Target
Obstruction 10m
from Station
Mid-way
Obstruction
Obstruction 10m
from Target
TARGET :- LEICA GRZ4 360 PRISM TARGET :- LEICA GPR1 ROUND PRISM
Instrument:- Leica TCRP1203+
Obstruction:- Vegetation Simulation
Statistics Chart
STN 1 (70m)
Std Dev
Range
Average
STN 2 (140m)
Std Dev
Range
Average
STN 3 (210m)
Std Dev
Range
Average
STN 4 (280m)
Std Dev
Range
Average
STN 5 (350m)
Std Dev
Range
Average

33
4.2.2 Construction site fence shade cloth obstruction results
The construction site fence shade cloth obstruction tests were conducted successfully with all instruments.
Complete graphed records of the results are attached in Appendix E. Below in figure 4.11 the deviations
from centre of the prism target are displayed for the Leica instrument.
Figure 4.11 Construction site fence shade cloth obstruction deviation chart
There are marginal deviation errors visible in both the horizontal and vertical axis when the obstruction is
10m from the station. This is the case for both prism types. The data below highlights the extremities
during testing.
GRZ4 360 Prism
• Max Hz deflection = -6”= 10mm ( achieved at 350m)
• Max Vz deflection = -8” = 14mm (achieved at 350m)
• Max Hd deflection = +/-1mm
GPR1 Round Prism
• Max Hz deflection = 8” = 14mm( achieved at 350m )
• Max Vz deflection = 6” = 8mm(achieved at 280m)
• Max Hd deflection = +/-1mm
-12
-10
-8
-6
-4
-2
0
2
4
6
8
10
De
via
tio
ns
HZ
(se
co
nd
s)
De
via
tio
ns
VZ
(se
con
ds)
De
via
tio
ns
HD
(m
m)
De
via
tio
ns
HZ
(se
co
nd
s)
De
via
tio
ns
VZ
(se
con
ds)
De
via
tio
ns
HD
(m
m)
De
via
tio
ns
HZ
(se
co
nd
s)
De
via
tio
ns
VZ
(se
con
ds)
De
via
tio
ns
HD
(m
m)
De
via
tio
ns
HZ
(se
co
nd
s)
De
via
tio
ns
VZ
(se
con
ds)
De
via
tio
ns
HD
(m
m)
De
via
tio
ns
HZ
(se
co
nd
s)
De
via
tio
ns
VZ
(se
con
ds)
De
via
tio
ns
HD
(m
m)
De
via
tio
ns
HZ
(se
co
nd
s)
De
via
tio
ns
VZ
(se
con
ds)
De
via
tio
ns
HD
(m
m)
Obstruction 10m
from Station
Mid-way Obstruction Obstruction 10m
from Target
Obstruction 10m
from Station
Mid-way Obstruction Obstruction 10m
from Target
TARGET :- LEICA GRZ4 360 PRISM TARGET :- LEICA GPR1 ROUND PRISM
Instrument:- Leica TCRP1203+
Obstruction:- Shade Cloth
Deviation Chart

34
Figure 4.12 Construction site fence shade cloth obstruction statistics chart
In figure 4.12 above key statistical data is displayed. The most significant figures were the difference in
range values for both prisms, especially when the obstruction is close to the instrument.
-10
-5
0
5
10
15
20
De
via
tio
ns
HZ
(se
con
ds)
De
via
tio
ns
VZ
(se
con
ds)
De
via
tio
ns
HD
(m
m)
De
via
tio
ns
HZ
(se
con
ds)
De
via
tio
ns
VZ
(se
con
ds)
De
via
tio
ns
HD
(m
m)
De
via
tio
ns
HZ
(se
con
ds)
De
via
tio
ns
VZ
(se
con
ds)
De
via
tio
ns
HD
(m
m)
De
via
tio
ns
HZ
(se
con
ds)
De
via
tio
ns
VZ
(se
con
ds)
De
via
tio
ns
HD
(m
m)
De
via
tio
ns
HZ
(se
con
ds)
De
via
tio
ns
VZ
(se
con
ds)
De
via
tio
ns
HD
(m
m)
De
via
tio
ns
HZ
(se
con
ds)
De
via
tio
ns
VZ
(se
con
ds)
De
via
tio
ns
HD
(m
m)
Obstruction 10m
from Station
Mid-way
Obstruction
Obstruction 10m
from Target
Obstruction 10m
from Station
Mid-way
Obstruction
Obstruction 10m
from Target
TARGET :- LEICA GRZ4 360 PRISM TARGET :- LEICA GPR1 ROUND PRISM
Instrument:- Leica TCRP1203+
Obstruction:- Shade Cloth
Statistics Chart STN 1 (70m)
Std Dev
Range
Average
STN 2 (140m)
Std Dev
Range
Average
STN 3 (210m)
Std Dev
Range
Average
STN 4 (280m)
Std Dev
Range
Average
STN 5 (350m)
Std Dev
Range
Average

4.2.3 Glass obstruction results
The glass obstruction tests were conducted successfully with all instruments. Complete
the results are attached in Appendix F. Below in figure 4
are displayed for the Leica instrument.
Figure 4.13 Glass obstruction deviation chart
There are significant deviation errors visible in both the horizontal and vertical axis where the obstruction is
10m from the station. This is the case for both prism types. The
during testing.
GRZ4 360 Prism
• Max Hz deflection = 20”= 34mm ( achieved at 350m)
• Max Vz deflection = -15” = 20mm (achieved at 280m)
• Max Hd deflection = +1 to 3mm
GPR1 Round Prism
• Max Hz deflection = 20” = 34mm( achie
• Max Vz deflection = -8” = 14mm(achieved at 350m)
• Max Hd deflection = +1 to 3 mm
-40
-30
-20
-10
0
10
20
30
De
via
tio
ns
HZ
(se
con
ds)
De
via
tio
ns
VZ
(se
co
nd
s)
De
via
tio
ns
HD
(m
m)
De
via
tio
ns
HZ
(se
con
ds)
De
via
tio
ns
VZ
(se
co
nd
s)
De
via
tio
ns
HD
(m
m)
Obstruction 10m
from Station
Mid-way
Obstruction
TARGET :- LEICA GRZ4 360 PRISM
Instrument:
The glass obstruction tests were conducted successfully with all instruments. Complete graphed
. Below in figure 4.13 the deviations from centre of the prism target
d for the Leica instrument.
Glass obstruction deviation chart
There are significant deviation errors visible in both the horizontal and vertical axis where the obstruction is
10m from the station. This is the case for both prism types. The data below highlights the extremities
Max Hz deflection = 20”= 34mm ( achieved at 350m)
15” = 20mm (achieved at 280m)
Max Hd deflection = +1 to 3mm
Max Hz deflection = 20” = 34mm( achieved at 350m )
8” = 14mm(achieved at 350m)
Max Hd deflection = +1 to 3 mm
De
via
tio
ns
HZ
(se
con
ds)
De
via
tio
ns
VZ
(se
co
nd
s)
De
via
tio
ns
HD
(m
m)
De
via
tio
ns
HZ
(se
con
ds)
De
via
tio
ns
VZ
(se
co
nd
s)
De
via
tio
ns
HD
(m
m)
De
via
tio
ns
HZ
(se
con
ds)
De
via
tio
ns
VZ
(se
co
nd
s)
De
via
tio
ns
HD
(m
m)
De
via
tio
ns
HZ
(se
con
ds)
Obstruction 10m
from Target
Obstruction 10m
from Station
Mid-way
Obstruction
Obstruction 10m
LEICA GRZ4 360 PRISM TARGET :- LEICA GPR1 ROUND PRISM
Instrument:- Leica TCRP1203+
Obstruction:- Glass
Deviation Chart
35
graphed records of
the deviations from centre of the prism target
There are significant deviation errors visible in both the horizontal and vertical axis where the obstruction is
data below highlights the extremities
De
via
tio
ns
HZ
(se
con
ds)
De
via
tio
ns
VZ
(se
co
nd
s)
De
via
tio
ns
HD
(m
m)
Obstruction 10m
from Target
LEICA GPR1 ROUND PRISM
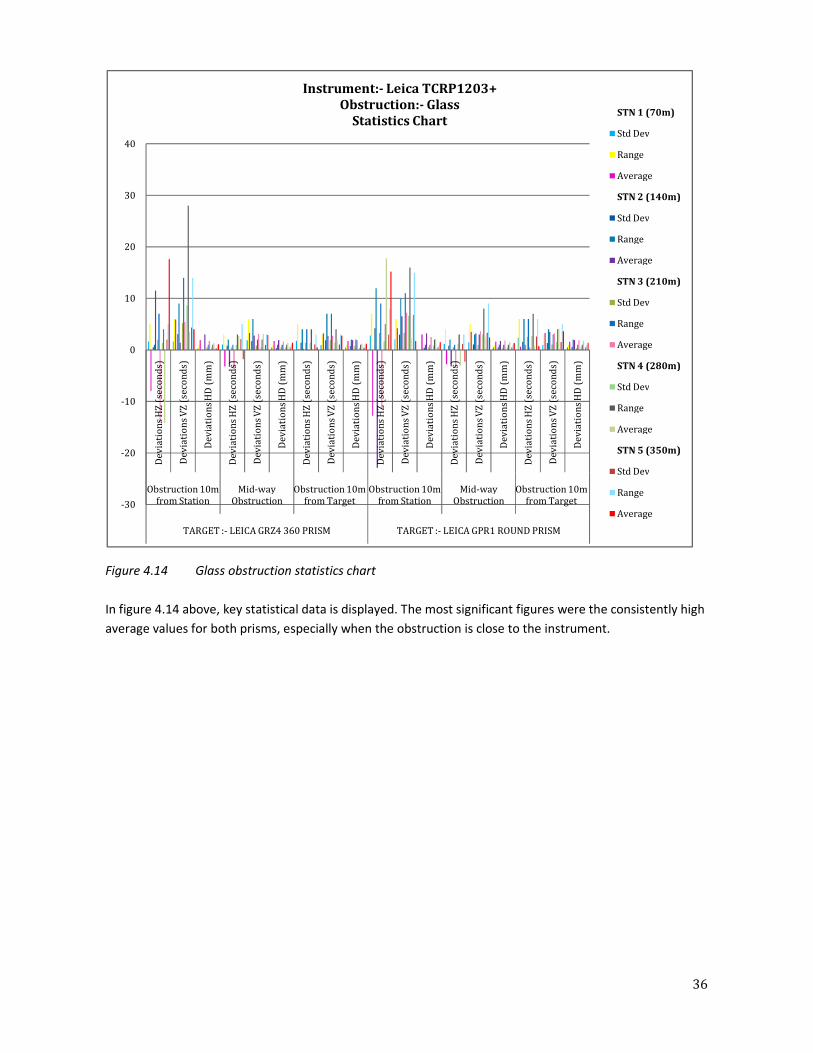
36
Figure 4.14 Glass obstruction statistics chart
In figure 4.14 above, key statistical data is displayed. The most significant figures were the consistently high
average values for both prisms, especially when the obstruction is close to the instrument.
-30
-20
-10
0
10
20
30
40
De
via
tio
ns
HZ
(se
con
ds)
De
via
tio
ns
VZ
(se
con
ds)
De
via
tio
ns
HD
(m
m)
De
via
tio
ns
HZ
(se
con
ds)
De
via
tio
ns
VZ
(se
con
ds)
De
via
tio
ns
HD
(m
m)
De
via
tio
ns
HZ
(se
con
ds)
De
via
tio
ns
VZ
(se
con
ds)
De
via
tio
ns
HD
(m
m)
De
via
tio
ns
HZ
(se
con
ds)
De
via
tio
ns
VZ
(se
con
ds)
De
via
tio
ns
HD
(m
m)
De
via
tio
ns
HZ
(se
con
ds)
De
via
tio
ns
VZ
(se
con
ds)
De
via
tio
ns
HD
(m
m)
De
via
tio
ns
HZ
(se
con
ds)
De
via
tio
ns
VZ
(se
con
ds)
De
via
tio
ns
HD
(m
m)
Obstruction 10m
from Station
Mid-way
Obstruction
Obstruction 10m
from Target
Obstruction 10m
from Station
Mid-way
Obstruction
Obstruction 10m
from Target
TARGET :- LEICA GRZ4 360 PRISM TARGET :- LEICA GPR1 ROUND PRISM
Instrument:- Leica TCRP1203+
Obstruction:- Glass
Statistics ChartSTN 1 (70m)
Std Dev
Range
Average
STN 2 (140m)
Std Dev
Range
Average
STN 3 (210m)
Std Dev
Range
Average
STN 4 (280m)
Std Dev
Range
Average
STN 5 (350m)
Std Dev
Range
Average

4.2.4 Dusty telescopic lens and prism results
The dusty lens and prism obstruction tests were conducted successfully with all instruments. Complet
graphed records of the results are attached in Appendix
of the prism target are displayed for the Leica instrument.
Figure 4.15 Dusty lens and prism deviation chart
There are marginal deviation errors noted in both the horizontal and vertical axis for the extent of this
experiment. This is the case for both prism types. The data below highlights the extremities during testing.
GRZ4 360 Prism
• Max Hz deflection = +/- 5” = 8mm ( achieved at 350m)
• Max Vz deflection = 10” = 17mm (achieved at 350m)
• Max Hd deflection = +/- 1mm
GPR1 Round Prism
• Max Hz deflection = 4” = 7mm( achieved at 350m )
• Max Vz deflection = -7” = 12mm(achieved at 350m)
• Max Hd deflection = +/- 1mm
-8
-6
-4
-2
0
2
4
6
8
10
12
Deviations HZ
(seconds)
Deviations VZ
(seconds)
TARGET :- LEICA GRZ4 360 PRISM
Instrument:
Obstruction:
Dusty telescopic lens and prism results
The dusty lens and prism obstruction tests were conducted successfully with all instruments. Complet
records of the results are attached in Appendix G. Below in figure 4.15 the deviations from centre
of the prism target are displayed for the Leica instrument.
Dusty lens and prism deviation chart
rs noted in both the horizontal and vertical axis for the extent of this
experiment. This is the case for both prism types. The data below highlights the extremities during testing.
5” = 8mm ( achieved at 350m)
Vz deflection = 10” = 17mm (achieved at 350m)
Max Hz deflection = 4” = 7mm( achieved at 350m )
7” = 12mm(achieved at 350m)
Deviations HD (mm) Deviations HZ
(seconds)
Deviations VZ
(seconds)
LEICA GRZ4 360 PRISM TARGET :- LEICA GPR1 ROUND PRISM
Instrument:- Leica TCRP1203+
Obstruction:- Dusty Lense and Prism
Deviation Chart
37
The dusty lens and prism obstruction tests were conducted successfully with all instruments. Complete
the deviations from centre
rs noted in both the horizontal and vertical axis for the extent of this
experiment. This is the case for both prism types. The data below highlights the extremities during testing.
Deviations HD (mm)
LEICA GPR1 ROUND PRISM

38
Figure 4.16 Dusty lens and prism statistics chart
In figure 4.16 above key statistical data is displayed. The most significant figures were the slightly large
range vertical deviation values for both prisms at 280m and 350m.
-4
-2
0
2
4
6
8
10
12
14
16
Deviations HZ
(seconds)
Deviations VZ
(seconds)
Deviations HD
(mm)
Deviations HZ
(seconds)
Deviations VZ
(seconds)
Deviations HD
(mm)
TARGET :- LEICA GRZ4 360 PRISM TARGET :- LEICA GPR1 ROUND PRISM
Instrument:- Leica TCRP1203+
Obstruction:- Dusty Lens and Prism
Statistics ChartSTN 1 (70m)
Std Dev
Range
Average
STN 2 (140m)
Std Dev
Range
Average
STN 3 (210m)
Std Dev
Range
Average
STN 4 (280m)
Std Dev
Range
Average
STN 5 (350m)
Std Dev
Range
Average
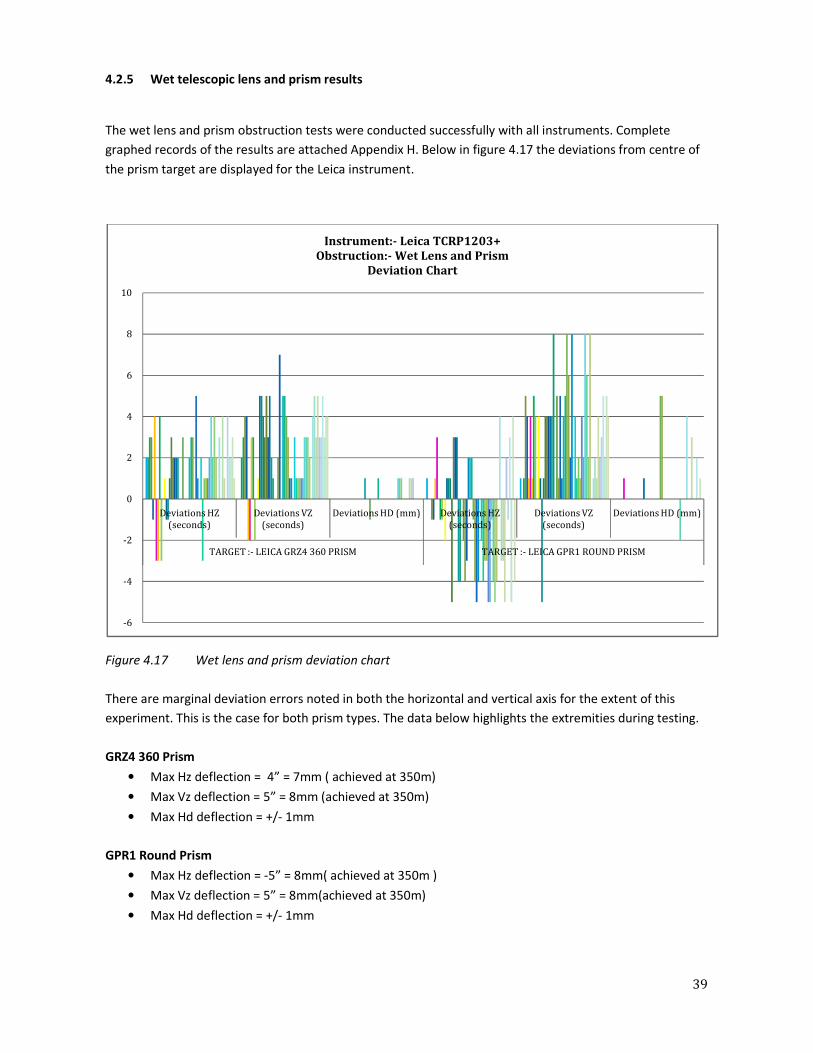
39
4.2.5 Wet telescopic lens and prism results
The wet lens and prism obstruction tests were conducted successfully with all instruments. Complete
graphed records of the results are attached Appendix H. Below in figure 4.17 the deviations from centre of
the prism target are displayed for the Leica instrument.
Figure 4.17 Wet lens and prism deviation chart
There are marginal deviation errors noted in both the horizontal and vertical axis for the extent of this
experiment. This is the case for both prism types. The data below highlights the extremities during testing.
GRZ4 360 Prism
• Max Hz deflection = 4” = 7mm ( achieved at 350m)
• Max Vz deflection = 5” = 8mm (achieved at 350m)
• Max Hd deflection = +/- 1mm
GPR1 Round Prism
• Max Hz deflection = -5” = 8mm( achieved at 350m )
• Max Vz deflection = 5” = 8mm(achieved at 350m)
• Max Hd deflection = +/- 1mm
-6
-4
-2
0
2
4
6
8
10
Deviations HZ
(seconds)
Deviations VZ
(seconds)
Deviations HD (mm) Deviations HZ
(seconds)
Deviations VZ
(seconds)
Deviations HD (mm)
TARGET :- LEICA GRZ4 360 PRISM TARGET :- LEICA GPR1 ROUND PRISM
Instrument:- Leica TCRP1203+
Obstruction:- Wet Lens and Prism
Deviation Chart

40
Figure 4.18 Dusty lens and prism statistics chart
In figure 4.18 above, some key statistical data is displayed. The most significant figures were the slightly
large range vertical deviation values for the Leica round prisms at 280m and 350m.
-6
-4
-2
0
2
4
6
8
10
12
14
Deviations HZ
(seconds)
Deviations VZ
(seconds)
Deviations HD
(mm)
Deviations HZ
(seconds)
Deviations VZ
(seconds)
Deviations HD
(mm)
TARGET :- LEICA GRZ4 360 PRISM TARGET :- LEICA GPR1 ROUND PRISM
Instrument:- Leica TCRP1203+
Obstruction:- Wet Lens and Prism
Statistics Chart
STN 1 (70m)
Std Dev
Range
Average
STN 2 (140m)
Std Dev
Range
Average
STN 3 (210m)
Std Dev
Range
Average
STN 4 (280m)
Std Dev
Range
Average
STN 5 (350m)
Std Dev
Range
Average
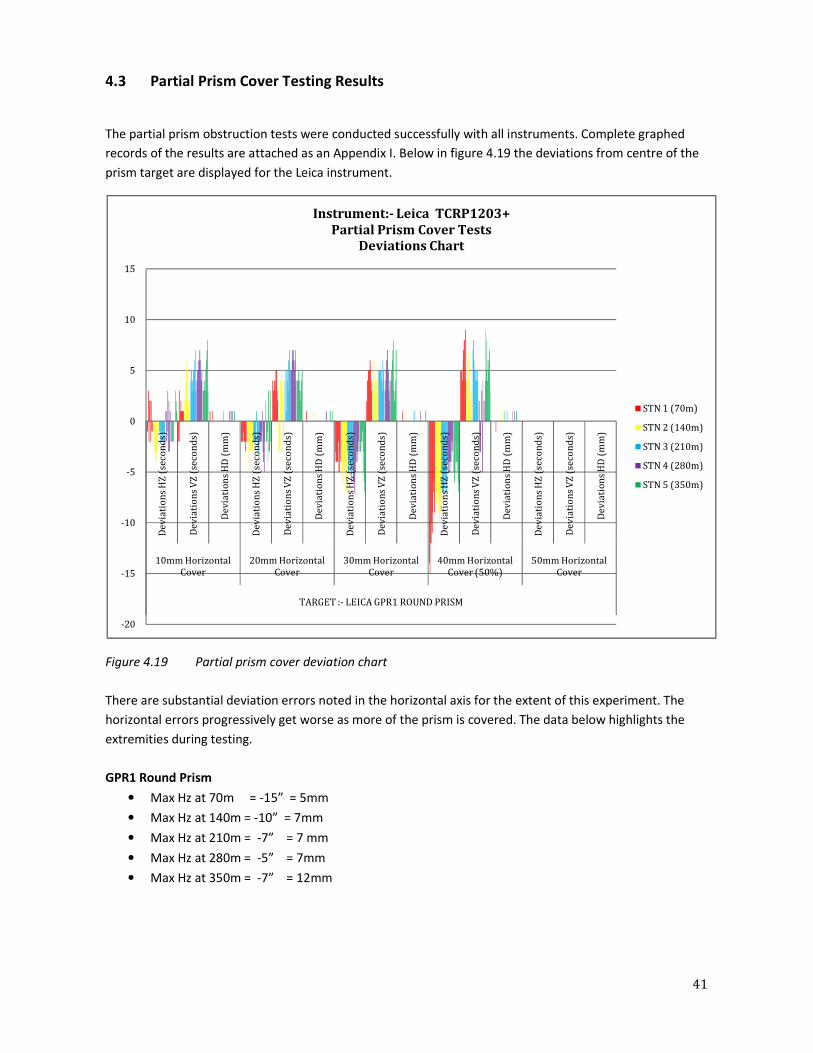
41
4.3 Partial Prism Cover Testing Results
The partial prism obstruction tests were conducted successfully with all instruments. Complete graphed
records of the results are attached as an Appendix I. Below in figure 4.19 the deviations from centre of the
prism target are displayed for the Leica instrument.
Figure 4.19 Partial prism cover deviation chart
There are substantial deviation errors noted in the horizontal axis for the extent of this experiment. The
horizontal errors progressively get worse as more of the prism is covered. The data below highlights the
extremities during testing.
GPR1 Round Prism
• Max Hz at 70m = -15” = 5mm
• Max Hz at 140m = -10” = 7mm
• Max Hz at 210m = -7” = 7 mm
• Max Hz at 280m = -5” = 7mm
• Max Hz at 350m = -7” = 12mm
-20
-15
-10
-5
0
5
10
15
De
via
tio
ns
HZ
(se
con
ds)
De
via
tio
ns
VZ
(se
con
ds)
De
via
tio
ns
HD
(m
m)
De
via
tio
ns
HZ
(se
con
ds)
De
via
tio
ns
VZ
(se
con
ds)
De
via
tio
ns
HD
(m
m)
De
via
tio
ns
HZ
(se
con
ds)
De
via
tio
ns
VZ
(se
con
ds)
De
via
tio
ns
HD
(m
m)
De
via
tio
ns
HZ
(se
con
ds)
De
via
tio
ns
VZ
(se
con
ds)
De
via
tio
ns
HD
(m
m)
De
via
tio
ns
HZ
(se
con
ds)
De
via
tio
ns
VZ
(se
con
ds)
De
via
tio
ns
HD
(m
m)
10mm Horizontal
Cover
20mm Horizontal
Cover
30mm Horizontal
Cover
40mm Horizontal
Cover (50%)
50mm Horizontal
Cover
TARGET :- LEICA GPR1 ROUND PRISM
Instrument:- Leica TCRP1203+
Partial Prism Cover Tests
Deviations Chart
STN 1 (70m)
STN 2 (140m)
STN 3 (210m)
STN 4 (280m)
STN 5 (350m)
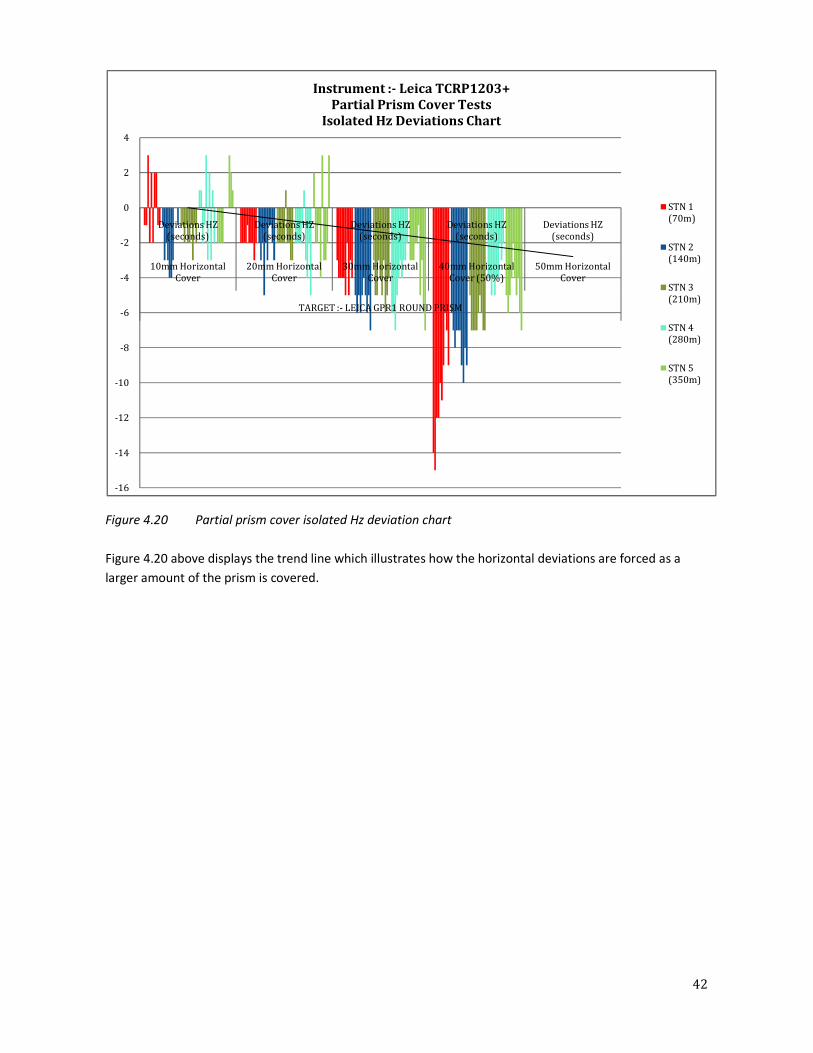
42
Figure 4.20 Partial prism cover isolated Hz deviation chart
Figure 4.20 above displays the trend line which illustrates how the horizontal deviations are forced as a
larger amount of the prism is covered.
-16
-14
-12
-10
-8
-6
-4
-2
0
2
4
Deviations HZ
(seconds)
Deviations HZ
(seconds)
Deviations HZ
(seconds)
Deviations HZ
(seconds)
Deviations HZ
(seconds)
10mm Horizontal
Cover
20mm Horizontal
Cover
30mm Horizontal
Cover
40mm Horizontal
Cover (50%)
50mm Horizontal
Cover
TARGET :- LEICA GPR1 ROUND PRISM
Instrument :- Leica TCRP1203+
Partial Prism Cover Tests
Isolated Hz Deviations Chart
STN 1
(70m)
STN 2
(140m)
STN 3
(210m)
STN 4
(280m)
STN 5
(350m)
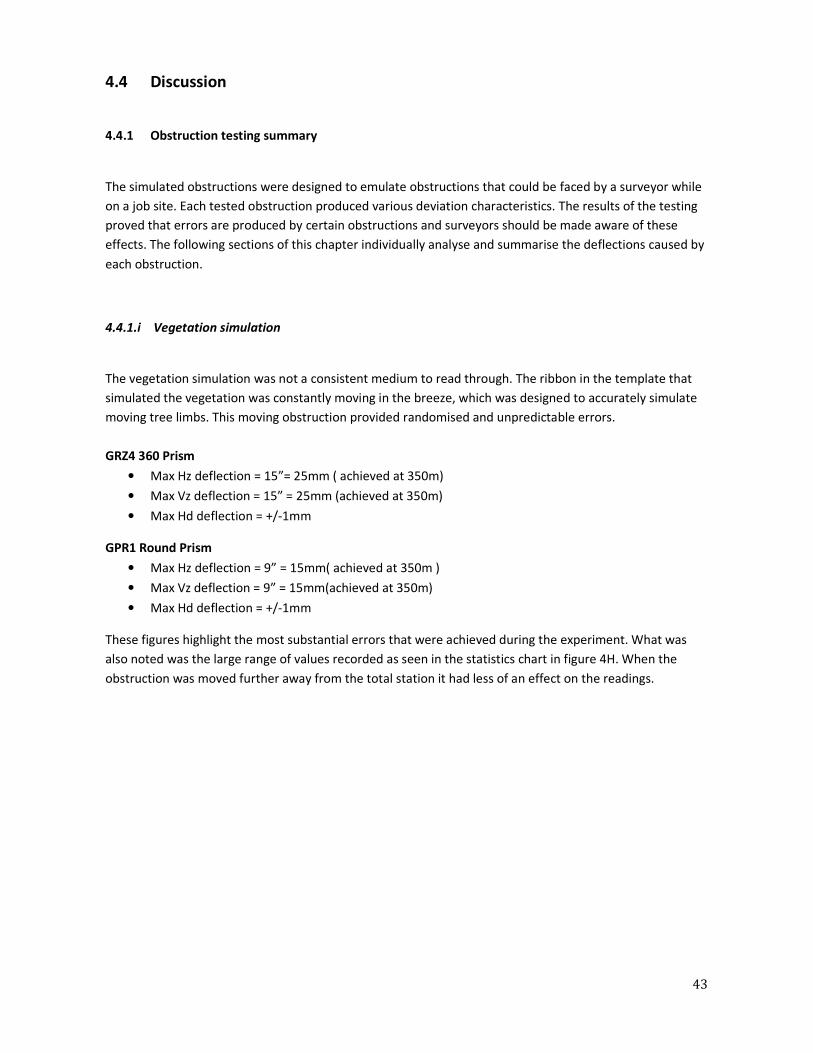
43
4.4 Discussion
4.4.1 Obstruction testing summary
The simulated obstructions were designed to emulate obstructions that could be faced by a surveyor while
on a job site. Each tested obstruction produced various deviation characteristics. The results of the testing
proved that errors are produced by certain obstructions and surveyors should be made aware of these
effects. The following sections of this chapter individually analyse and summarise the deflections caused by
each obstruction.
4.4.1.i Vegetation simulation
The vegetation simulation was not a consistent medium to read through. The ribbon in the template that
simulated the vegetation was constantly moving in the breeze, which was designed to accurately simulate
moving tree limbs. This moving obstruction provided randomised and unpredictable errors.
GRZ4 360 Prism
• Max Hz deflection = 15”= 25mm ( achieved at 350m)
• Max Vz deflection = 15” = 25mm (achieved at 350m)
• Max Hd deflection = +/-1mm
GPR1 Round Prism
• Max Hz deflection = 9” = 15mm( achieved at 350m )
• Max Vz deflection = 9” = 15mm(achieved at 350m)
• Max Hd deflection = +/-1mm
These figures highlight the most substantial errors that were achieved during the experiment. What was
also noted was the large range of values recorded as seen in the statistics chart in figure 4H. When the
obstruction was moved further away from the total station it had less of an effect on the readings.
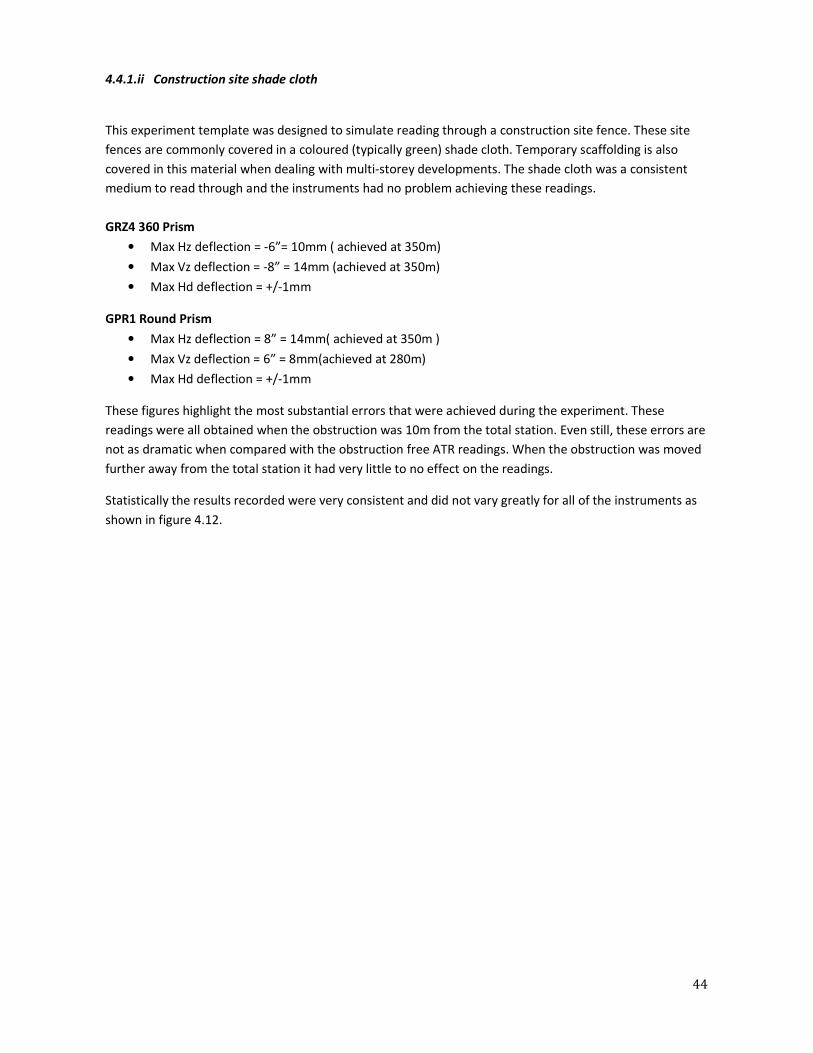
44
4.4.1.ii Construction site shade cloth
This experiment template was designed to simulate reading through a construction site fence. These site
fences are commonly covered in a coloured (typically green) shade cloth. Temporary scaffolding is also
covered in this material when dealing with multi-storey developments. The shade cloth was a consistent
medium to read through and the instruments had no problem achieving these readings.
GRZ4 360 Prism
• Max Hz deflection = -6”= 10mm ( achieved at 350m)
• Max Vz deflection = -8” = 14mm (achieved at 350m)
• Max Hd deflection = +/-1mm
GPR1 Round Prism
• Max Hz deflection = 8” = 14mm( achieved at 350m )
• Max Vz deflection = 6” = 8mm(achieved at 280m)
• Max Hd deflection = +/-1mm
These figures highlight the most substantial errors that were achieved during the experiment. These
readings were all obtained when the obstruction was 10m from the total station. Even still, these errors are
not as dramatic when compared with the obstruction free ATR readings. When the obstruction was moved
further away from the total station it had very little to no effect on the readings.
Statistically the results recorded were very consistent and did not vary greatly for all of the instruments as
shown in figure 4.12.
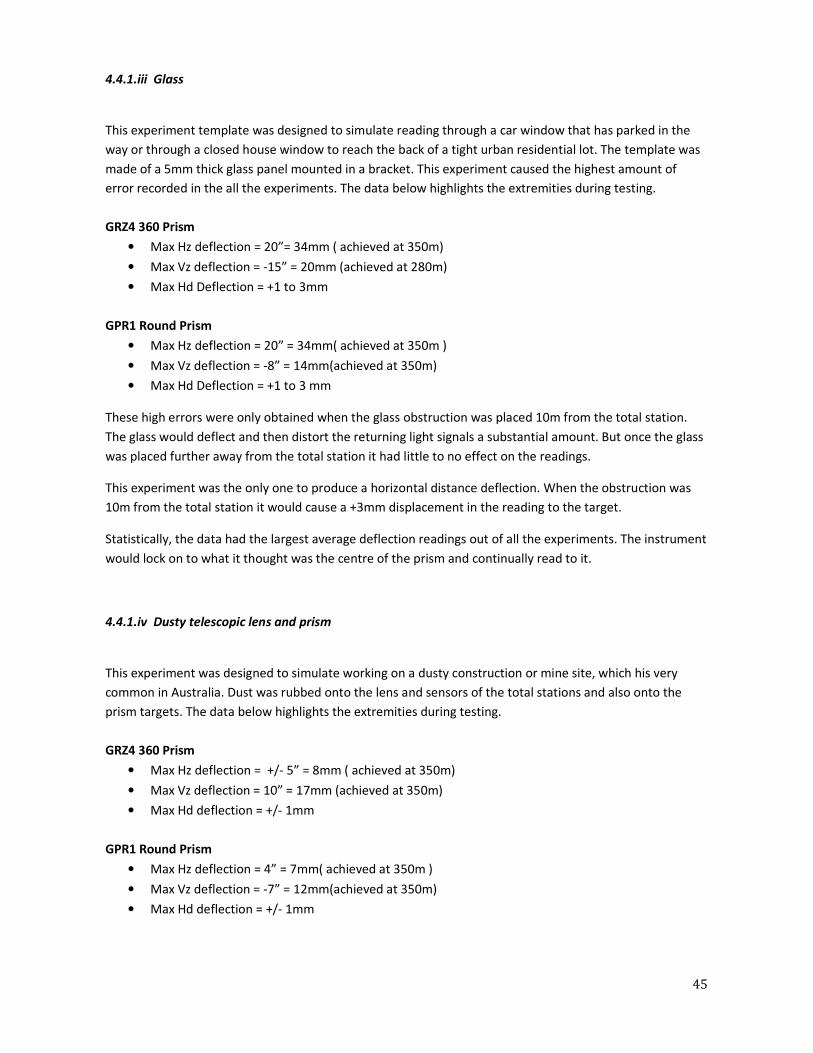
45
4.4.1.iii Glass
This experiment template was designed to simulate reading through a car window that has parked in the
way or through a closed house window to reach the back of a tight urban residential lot. The template was
made of a 5mm thick glass panel mounted in a bracket. This experiment caused the highest amount of
error recorded in the all the experiments. The data below highlights the extremities during testing.
GRZ4 360 Prism
• Max Hz deflection = 20”= 34mm ( achieved at 350m)
• Max Vz deflection = -15” = 20mm (achieved at 280m)
• Max Hd Deflection = +1 to 3mm
GPR1 Round Prism
• Max Hz deflection = 20” = 34mm( achieved at 350m )
• Max Vz deflection = -8” = 14mm(achieved at 350m)
• Max Hd Deflection = +1 to 3 mm
These high errors were only obtained when the glass obstruction was placed 10m from the total station.
The glass would deflect and then distort the returning light signals a substantial amount. But once the glass
was placed further away from the total station it had little to no effect on the readings.
This experiment was the only one to produce a horizontal distance deflection. When the obstruction was
10m from the total station it would cause a +3mm displacement in the reading to the target.
Statistically, the data had the largest average deflection readings out of all the experiments. The instrument
would lock on to what it thought was the centre of the prism and continually read to it.
4.4.1.iv Dusty telescopic lens and prism
This experiment was designed to simulate working on a dusty construction or mine site, which his very
common in Australia. Dust was rubbed onto the lens and sensors of the total stations and also onto the
prism targets. The data below highlights the extremities during testing.
GRZ4 360 Prism
• Max Hz deflection = +/- 5” = 8mm ( achieved at 350m)
• Max Vz deflection = 10” = 17mm (achieved at 350m)
• Max Hd deflection = +/- 1mm
GPR1 Round Prism
• Max Hz deflection = 4” = 7mm( achieved at 350m )
• Max Vz deflection = -7” = 12mm(achieved at 350m)
• Max Hd deflection = +/- 1mm

46
These deflection results were slightly more significant but still did not vary greatly from what was recorded
during the obstruction free testing. It can be safely stated that having dusty equipment will not
substantially alter ATR readings.
4.4.1.v Wet telescopic lens and prism
This experiment was designed to simulate using wet equipment that has been exposed to a rain shower.
The figures below represent the most extreme deviations recorded during the experiment. The data below
highlights the extremities during testing.
GRZ4 360 Prism
• Max Hz deflection = 4” = 7mm ( achieved at 350m)
• Max Vz deflection = 5” = 8mm (achieved at 350m)
• Max Hd deflection = +/- 1mm
GPR1 Round Prism
• Max Hz deflection = -5” = 8mm( achieved at 350m )
• Max Vz deflection = 5” = 8mm(achieved at 350m)
• Max Hd deflection = +/- 1mm
These results conclude that having wet equipment had little to no effect on the readings.
4.4.2 Partial cover testing summary
The obstruction tests were designed to test for random errors and assess what kind of deviations could be
expected from common elements encountered in the field. However the partial prism cover tests were
designed to assess how much horizontal deflection could be created until the total station could not read to
the prism target. These experiments were relatively simple to complete and reasonably predictable results
were obtained. By moving the prism cover progressively across the prism horizontally, the total station was
forced to divide and centre the remains of the uncovered prism. This is reflected similarly across the
readings for the three different instrument brands.
4.5 Conclusion
All experiments were completed successfully and all data was recorded. Obtaining these results was a very
lengthy process and one criticism that could be made is that too many variables were included in the
testing procedure. The data recording process took much longer than expected. Having such a large data
set made it difficult to effectively design graphs to display key information. However the large data set can
now be used to make very comprehensive conclusions. These key findings will be discussed in detail in the
next chapter.

47
Chapter 5 – Conclusions and Recommendations
From the completed experiments the following guideline information for surveyors can be provided when
using ATR in the field:
• Having a dusty lens and prism will not have a large effect on ATR readings;
• Having a wet lens and prism will not have a large effect on ATR readings;
• If reading through glass in close proximity, the surveyor should expect large angular errors and a
horizontal distance error;
• Reading directly through a construction site fence shade cloth will not have substantial effect on
ATR readings;
• Reading through vegetation will cause large randomised errors;
• The total station will still read to a half covered round prism; however it will force a deflected
reading of approximately half a prism width;
• The closer the obstruction is to the total station the more severe the effect the obstruction will
have on the ATR reading in all cases.
This report does not condone reading through obstructions at any time during a survey. The experiments
conducted do not consider the angle of incidence of the readings or differing weather conditions. These
results simply highlight the amount of error that can occur when reading through certain obstructions
directly.
This report highlights how a degraded returning light signal from a prism will result in a horizontal and
vertical deflection. By degrading and diffracting the returning light paths, their quality is reduced and
therefore causing a noisy image on the total station sensor. The size and direction of the deflection is
directly related to the area and position of the obstruction in front of the prism. Having the obstruction
closer to the instrument increased the area obstructing the prism in view.
Very little was gained by testing all three total station brands except for the ability to show that the project
was comprehensive and did not show any bias to any particular brand. The Leica results were randomly
selected to be used in the analysis. The results are also a testament to the quality of the total stations used
as they were all able to read through every obstruction.
The deflections recorded may appear insignificant however they could be highly detrimental to some
survey applications such as a cadastral survey. These angular deviation errors are only exacerbated when
traversing further. While ATR is a great technology and has a secure place in surveying today, surveyors
should always practice due care when reading to a prism target, especially when there is the possibility of
an obstruction in the field of view.

48
References
Bayoud, F. 2007, Leica TPS1200+ white paper, Leica Geosystems, Heerbrugg, accessed 15 May 2010,
<http://www.leica-geosystems.com/downloads123/zz/tps/tps1200/white-tech-
paper/TPS1200+_WhitePaper_en.pdf >
DALSA Corporation 2010, CCD vs CMOS, accessed 10 May 2010,
<http://www.dalsa.com/corp/markets/CCD_vs_CMOS.aspx >
Glockner Engineering and Mining Services 2010, Trimble s6, accessed 15 May 2010,
<www.glockner.com.au/gems/proc01/trimbleS6.jpg>
Kirschner, H. & Stempfhuber, W. 2008, The Kinematic Potential of Modern Tracking Total stations – A
State of the Art Report on the Leica TPS1200+, International Conference on Machine Control and
Guidance, Zurich, accessed 15 May 2010,
<http://www.mcg.ethz.ch/papres/Kirschner_Stempfhuber_05.pdf>
Leica Geosystems 2008, Leica 1200 Series Technical Data PDF, Heerbrugg, Switzerland.
Leica Geosystems 2008, Leica Instruction TRCP1205 User Manual, Heerbrugg, Switzerland.
Lemmon, T., Jung, R. 2005, Trimble S6 with Magdrive Servo technology, Trimble Navigation Limited,
Colarado, accessed 15 May 2010,
<http://www.geosystems.co.nz/drupal/files/u1/images/construction/Trimble_S6_MagDrive.pdf >
McKenzie, A.2002 TPS News Issue 6, Monthly newsletter on Leica Geosystems TPS, Heerbrugg, accessed
10 May 2010, < http://www.mainetechnicalsource.com/downloadfiles/TPSNewsATR.pdf >
Optical Survey Equipment.com 2010, Leica TC 1205 Total station, accessed 15 May
2010, <www.surveyequipment.com/images/tcr1205_01.jpg>
Peterson, C. (2001), How It Works: the charged-coupled device or CCD, Journal of Young Investigators
Volume 3, Georgetown, accessed 10 May 2010,
<http://www.jyi.org/volumes/volume3/issue1/features/peterson.html>

49
Singh, R., Artman, D., Brinton, D., Brow, L. (2002) Compensators, Stability Check and Automatic Target
Recognition, Oregon Department of Transport, Oregon, accessed 10 May 2010,
<http://oregon.gov/ODOT/HWY/GEOMETRONICS/docs/Compensators-Stability_Check-
ATRhandout.pdf>
Steyn, N. 2009, Automated methods of precise surveying using robotic total stations and retro
reflective tape targets, University of Kwazulu-Natal, Durban, accessed 10 May 2010,
<http://geomatics.ukzn.ac.za/Uploads/0090ba64-939c-4057-bfcf-1f107a284e93/STEYN.pdf>
Surveyors Board Queensland 2007, Code of Practice, Brisbane, accessed 10 May 2010,
<http://www.surveyorsboard.com.au/pdfdocs/SBQCodeOfPractice.pdf>
Wisecracks Restoration 2010, Restoration Products, Topcon GTS-229 220 Construction Total station
Survey, accessed 15 May 2010, < wisecracksrestoration.com/.../Topcon%20Gts.jpg>

50
Appendices
Appendix A - Project Specification

51
University of Southern Queensland (Faculty of Engineering and Surveying)
ENG4111/ENG4112 Research Project
PROJECT SPECIFICATION
FOR: Ashley Weyman-Jones (Student Number 0050009367)
TOPIC: An investigation into the Accuracy and Limitations of Automatic Target Recognition
in Total stations.
SUPERVISORS: Zhenyu Zhang (USQ)
ENROLMENT: ENG4111-S1, 2010 (EXT)
ENG4112-S2, 2010 (EXT)
PROJECT AIM: This project is designed to simulate commonly encounter conditions that a
surveyor will face when reading to prisms using ATR. Data will be collected,
analysed and recommendations will be made to improve point positioning
practices when using ATR in the field.
SPONSORSHIP: Ahern James Naismith Surveyors
PROGRAMME: Issue A, 23rd March 2010
1. Research background information on the different varieties of Automatic Target Recognition (ATR)
for the major brands of instruments and how they indentify accurate prism point positions.
2. Design a broad spectrum of field measurement experiments to simulate common real-life
situations in the field and collect the data for error analysis.
3. Prepare an accurate test environment with a precise survey station network to complete
experiments.
4. Complete the field study and collect data using two modern popular 5” instruments used in
Australia.
5. Reduce and analyse the data from the multiple experiments and present in a tabulated form.
6. Evaluate the effects on each of the different test environments had on ATR EDM readings.
7. Present findings and recommendations for amended practices for using ATR in the field for
accurate point positions.
AGREED:
______________________ ___/_ /2010 (Student), ________________________ ___/__/2010
(Supervisors)
Examiner/Co-Examiner:_______________________________________________ ___/__/2010

52
Appendix B - CCD vs CMOS Feature and Performance Comparison
Feature CCD CMOS
Signal out of pixel Electron packet Voltage
Signal out of chip Voltage (analog) Bits (digital)
Signal out of camera Bits (digital) Bits (digital)
Amplifier mismatch N/A Moderate
System Noise Low Moderate
System Complexity High Low
Sensor Complexity Low High
Camera components Sensor + multiple support
chips + lens
Sensor + lens possible, but additional support
chips common
Relative R&D cost Lower Higher
Relative system cost Depends on Application Depends on Application
Performance CCD CMOS
Responsivity Moderate Slightly better
Dynamic Range High Moderate
Uniformity High Low to Moderate
Uniform Shuttering Fast, common Poor
Uniformity High Low to Moderate
Speed Moderate to High Higher
Windowing Limited Extensive
(DALSA, 2010)

53
Appendix C - Obstruction free ATR Testing Results
Part A - Trimble S6 Graphed Deviation Results
Part B - Topcon GTS-900A Graphed Deviation Results

Part A - Trimble S6 Graphed Deviation Results
-5
-4
-3
-2
-1
0
1
2
3
4
5
6
Deviations HZ (seconds) Deviations VZ (seconds)
TARGET :- LEICA GRZ4 360 PRISM
-2
-1
0
1
2
3
4
5
6
7
8
Deviations HZ
(seconds)
Deviations VZ
(seconds)
Deviations HD (mm)
TARGET :- LEICA GRZ4 360 PRISM
mble S6 Graphed Deviation Results
Deviations VZ (seconds) Deviations HD (mm) Deviations HZ (seconds) Deviations VZ (seconds)
LEICA GRZ4 360 PRISM TARGET :- LEICA GPR1 ROUND PRISM
Instrument :- TRIMBLE S6
No Obstructions
Deviation Chart
Deviations HD (mm) Deviations HZ
(seconds)
Deviations VZ
(seconds)
Deviations HD (mm)
LEICA GRZ4 360 PRISM TARGET :- LEICA GPR1 ROUND PRISM
Instrument:- TRIMBLE S6
No Obstructions
Statistics Chart
54
Deviations VZ (seconds) Deviations HD (mm)
LEICA GPR1 ROUND PRISM
Deviations HD (mm)
LEICA GPR1 ROUND PRISM
STN 1 (70m)
Std Dev
Range
Average
STN 2 (140m)
Std Dev
Range
Average
STN 3 (210m)
Std Dev
Range
Average
STN 4 (280m)
Std Dev
Range
Average
STN 5 (350m)
Std Dev
Range
Average
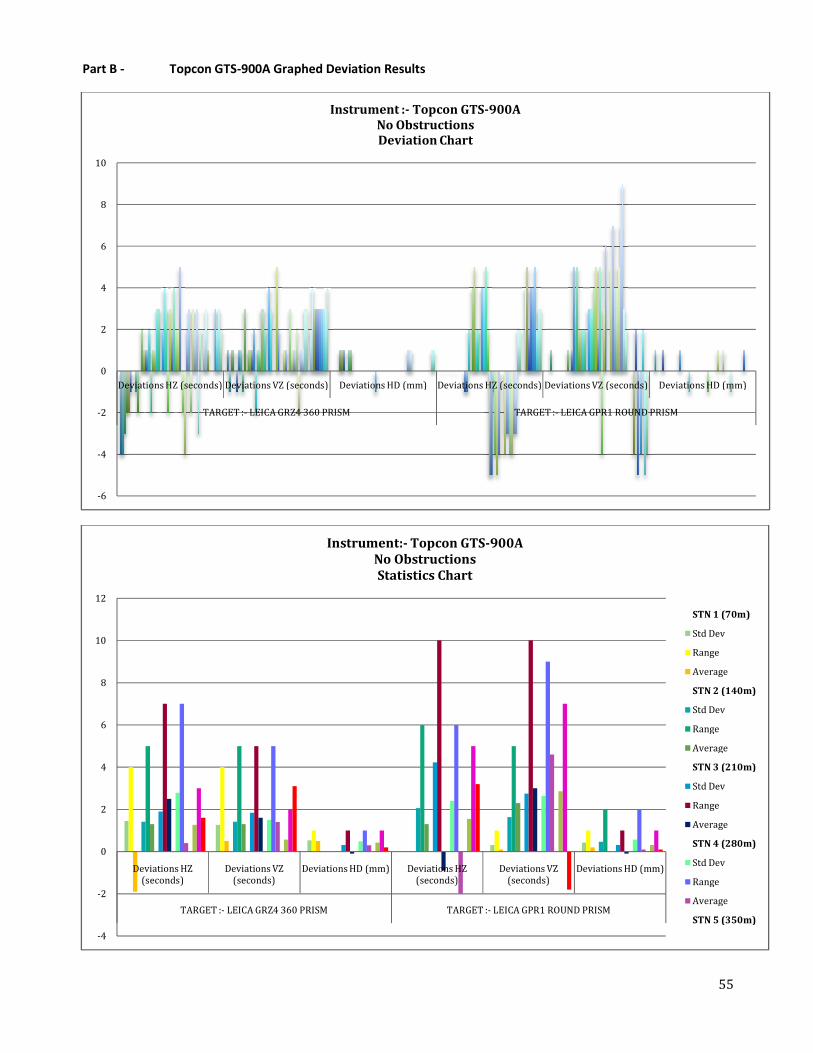
Part B - Topcon GTS-900A Graphed Deviation Results
-6
-4
-2
0
2
4
6
8
10
Deviations HZ (seconds) Deviations VZ (seconds)
TARGET :- LEICA GRZ4 360 PRISM
-4
-2
0
2
4
6
8
10
12
Deviations HZ
(seconds)
Deviations VZ
(seconds)
Deviations HD (mm)
TARGET :- LEICA GRZ4 360 PRISM
900A Graphed Deviation Results
Deviations VZ (seconds) Deviations HD (mm) Deviations HZ (seconds) Deviations VZ (seconds)
LEICA GRZ4 360 PRISM TARGET :- LEICA GPR1 ROUND PRISM
Instrument :- Topcon GTS-900A
No Obstructions
Deviation Chart
Deviations HD (mm) Deviations HZ
(seconds)
Deviations VZ
(seconds)
Deviations HD (mm)
LEICA GRZ4 360 PRISM TARGET :- LEICA GPR1 ROUND PRISM
Instrument:- Topcon GTS-900A
No Obstructions
Statistics Chart
55
Deviations VZ (seconds) Deviations HD (mm)
LEICA GPR1 ROUND PRISM
Deviations HD (mm)
LEICA GPR1 ROUND PRISM
STN 1 (70m)
Std Dev
Range
Average
STN 2 (140m)
Std Dev
Range
Average
STN 3 (210m)
Std Dev
Range
Average
STN 4 (280m)
Std Dev
Range
Average
STN 5 (350m)

56
Appendix D - Vegetation Simulation Obstruction Deviation Results
Part A - Trimble S6 Graphed Deviation Results
Part B - Topcon GTS-900A Graphed Deviation Results
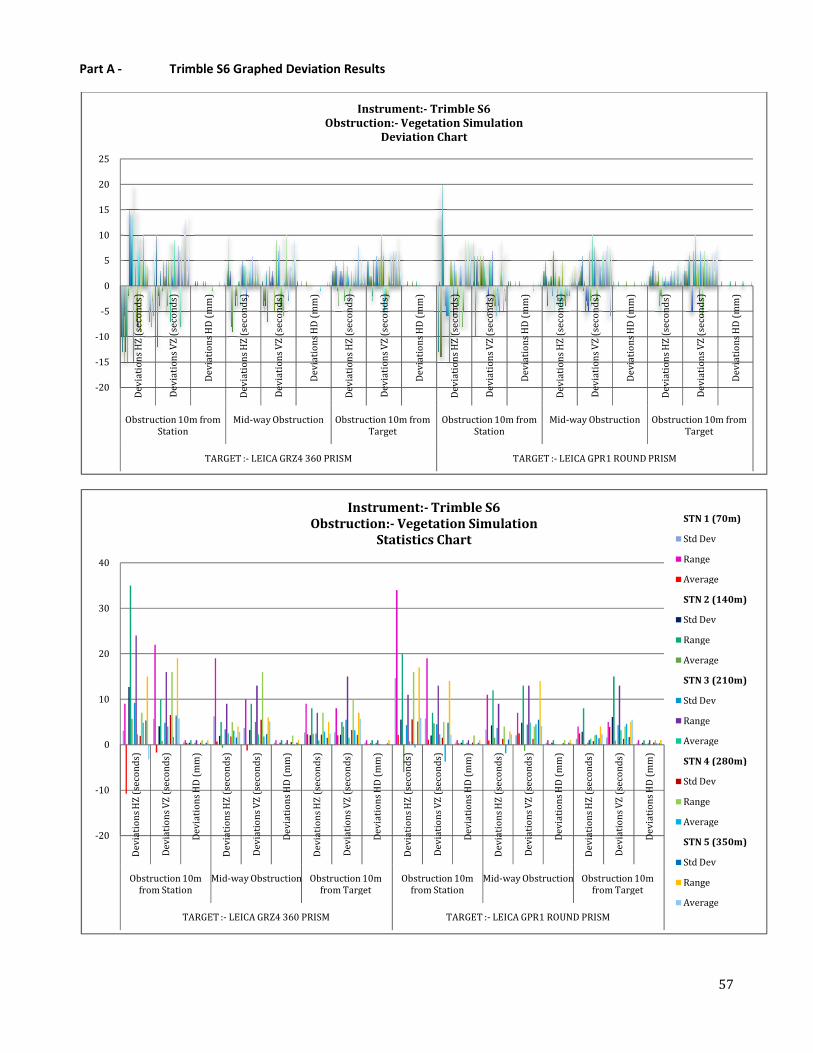
Part A - Trimble S6 Graphed Deviation Results
-20
-15
-10
-5
0
5
10
15
20
25
De
via
tio
ns
HZ
(se
co
nd
s)
De
via
tio
ns
VZ
(se
con
ds)
De
via
tio
ns
HD
(m
m)
De
via
tio
ns
HZ
(se
co
nd
s)
De
via
tio
ns
VZ
(se
con
ds)
De
via
tio
ns
HD
(m
m)
Obstruction 10m from
Station
Mid-way Obstruction
TARGET :- LEICA GRZ4 360 PRISM
-20
-10
0
10
20
30
40
De
via
tio
ns
HZ
(se
con
ds)
De
via
tio
ns
VZ
(se
con
ds)
De
via
tio
ns
HD
(m
m)
De
via
tio
ns
HZ
(se
con
ds)
De
via
tio
ns
VZ
(se
con
ds)
De
via
tio
ns
HD
(m
m)
De
via
tio
ns
HZ
(se
con
ds)
Obstruction 10m
from Station
Mid-way Obstruction Obstruction 10m
from Target
TARGET :- LEICA GRZ4 360 PRISM
Obstruction:
Trimble S6 Graphed Deviation Results
De
via
tio
ns
HZ
(se
co
nd
s)
De
via
tio
ns
VZ
(se
con
ds)
De
via
tio
ns
HD
(m
m)
De
via
tio
ns
HZ
(se
co
nd
s)
De
via
tio
ns
VZ
(se
con
ds)
De
via
tio
ns
HD
(m
m)
De
via
tio
ns
HZ
(se
co
nd
s)
De
via
tio
ns
VZ
(se
con
ds)
way Obstruction Obstruction 10m from
Target
Obstruction 10m from
Station
Mid-way Obstruction
LEICA GRZ4 360 PRISM TARGET :- LEICA GPR1 ROUND PRISM
Instrument:- Trimble S6
Obstruction:- Vegetation Simulation
Deviation Chart
De
via
tio
ns
HZ
(se
con
ds)
De
via
tio
ns
VZ
(se
con
ds)
De
via
tio
ns
HD
(m
m)
De
via
tio
ns
HZ
(se
con
ds)
De
via
tio
ns
VZ
(se
con
ds)
De
via
tio
ns
HD
(m
m)
De
via
tio
ns
HZ
(se
con
ds)
De
via
tio
ns
VZ
(se
con
ds)
De
via
tio
ns
HD
(m
m)
De
via
tio
ns
HZ
(se
con
ds)
Obstruction 10m
from Target
Obstruction 10m
from Station
Mid-way Obstruction Obstruction 10m
from Target
LEICA GRZ4 360 PRISM TARGET :- LEICA GPR1 ROUND PRISM
Instrument:- Trimble S6
Obstruction:- Vegetation Simulation
Statistics Chart
57
De
via
tio
ns
HD
(m
m)
De
via
tio
ns
HZ
(se
co
nd
s)
De
via
tio
ns
VZ
(se
con
ds)
De
via
tio
ns
HD
(m
m)
way Obstruction Obstruction 10m from
Target
LEICA GPR1 ROUND PRISM
De
via
tio
ns
VZ
(se
con
ds)
De
via
tio
ns
HD
(m
m)
Obstruction 10m
from Target
LEICA GPR1 ROUND PRISM
STN 1 (70m)
Std Dev
Range
Average
STN 2 (140m)
Std Dev
Range
Average
STN 3 (210m)
Std Dev
Range
Average
STN 4 (280m)
Std Dev
Range
Average
STN 5 (350m)
Std Dev
Range
Average
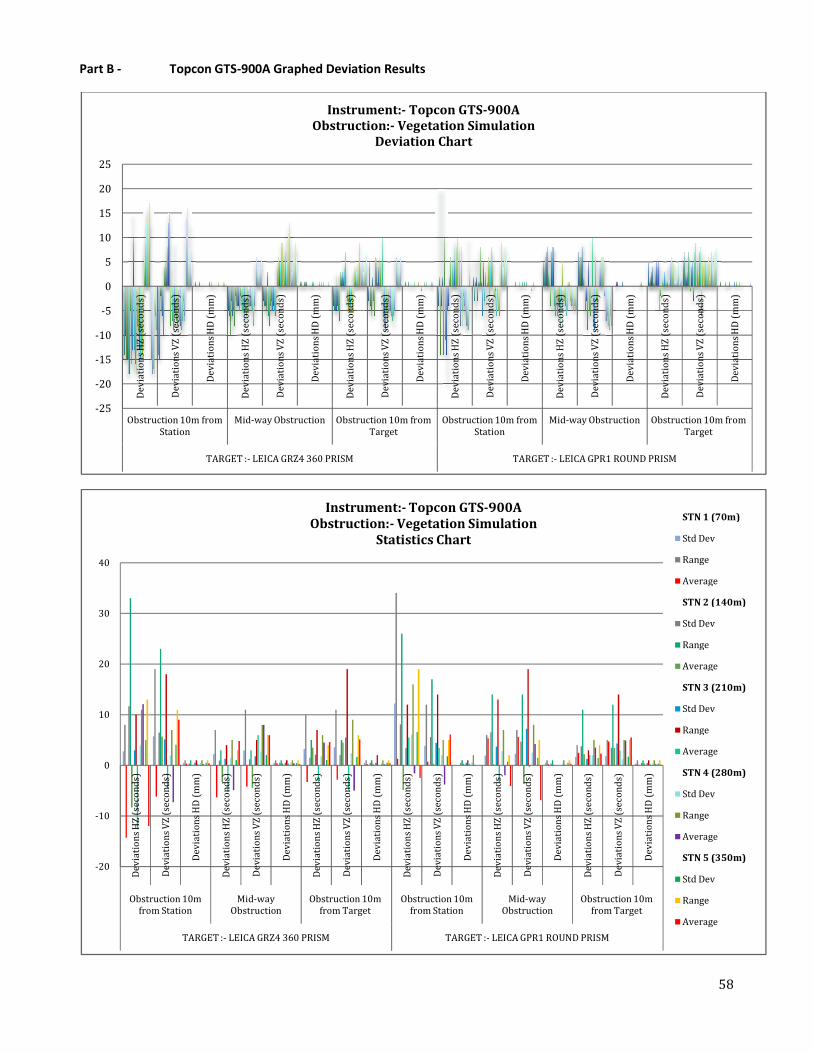
Part B - Topcon GTS-900A Graphed Deviation Results
-25
-20
-15
-10
-5
0
5
10
15
20
25
De
via
tio
ns
HZ
(se
con
ds)
De
via
tio
ns
VZ
(se
co
nd
s)
De
via
tio
ns
HD
(m
m)
De
via
tio
ns
HZ
(se
con
ds)
De
via
tio
ns
VZ
(se
co
nd
s)
De
via
tio
ns
HD
(m
m)
Obstruction 10m from
Station
Mid-way Obstruction
TARGET :- LEICA GRZ4 360 PRISM
Obstruction:
-20
-10
0
10
20
30
40
De
via
tio
ns
HZ
(se
con
ds)
De
via
tio
ns
VZ
(se
co
nd
s)
De
via
tio
ns
HD
(m
m)
De
via
tio
ns
HZ
(se
con
ds)
De
via
tio
ns
VZ
(se
co
nd
s)
De
via
tio
ns
HD
(m
m)
De
via
tio
ns
HZ
(se
con
ds)
Obstruction 10m
from Station
Mid-way
Obstruction
Obstruction 10m
from Target
TARGET :- LEICA GRZ4 360 PRISM
Obstruction:
900A Graphed Deviation Results
De
via
tio
ns
HD
(m
m)
De
via
tio
ns
HZ
(se
con
ds)
De
via
tio
ns
VZ
(se
co
nd
s)
De
via
tio
ns
HD
(m
m)
De
via
tio
ns
HZ
(se
con
ds)
De
via
tio
ns
VZ
(se
co
nd
s)
De
via
tio
ns
HD
(m
m)
De
via
tio
ns
HZ
(se
con
ds)
De
via
tio
ns
VZ
(se
co
nd
s)
way Obstruction Obstruction 10m from
Target
Obstruction 10m from
Station
Mid-way Obstruction
LEICA GRZ4 360 PRISM TARGET :- LEICA GPR1 ROUND PRISM
Instrument:- Topcon GTS-900A
Obstruction:- Vegetation Simulation
Deviation Chart
De
via
tio
ns
HZ
(se
con
ds)
De
via
tio
ns
VZ
(se
co
nd
s)
De
via
tio
ns
HD
(m
m)
De
via
tio
ns
HZ
(se
con
ds)
De
via
tio
ns
VZ
(se
co
nd
s)
De
via
tio
ns
HD
(m
m)
De
via
tio
ns
HZ
(se
con
ds)
De
via
tio
ns
VZ
(se
co
nd
s)
De
via
tio
ns
HD
(m
m)
De
via
tio
ns
HZ
(se
con
ds)
Obstruction 10m
from Target
Obstruction 10m
from Station
Mid-way
Obstruction
Obstruction 10m
from Target
LEICA GRZ4 360 PRISM TARGET :- LEICA GPR1 ROUND PRISM
Instrument:- Topcon GTS-900A
Obstruction:- Vegetation Simulation
Statistics Chart
58
De
via
tio
ns
HD
(m
m)
De
via
tio
ns
HZ
(se
con
ds)
De
via
tio
ns
VZ
(se
co
nd
s)
De
via
tio
ns
HD
(m
m)
way Obstruction Obstruction 10m from
Target
LEICA GPR1 ROUND PRISM
De
via
tio
ns
VZ
(se
co
nd
s)
De
via
tio
ns
HD
(m
m)
Obstruction 10m
from Target
LEICA GPR1 ROUND PRISM
STN 1 (70m)
Std Dev
Range
Average
STN 2 (140m)
Std Dev
Range
Average
STN 3 (210m)
Std Dev
Range
Average
STN 4 (280m)
Std Dev
Range
Average
STN 5 (350m)
Std Dev
Range
Average

59
Appendix E - Construction Site Shade Cloth Obstruction Deviation Results
Part A - Trimble S6 Graphed Deviation Results
Part B - Topcon GTS-900A Graphed Deviation Results

60
Part A - Trimble S6 Graphed Deviation Results
-10
-8
-6
-4
-2
0
2
4
6
8
10
De
via
tio
ns
HZ
(se
con
ds)
De
via
tio
ns
VZ
(se
co
nd
s)
De
via
tio
ns
HD
(m
m)
De
via
tio
ns
HZ
(se
con
ds)
De
via
tio
ns
VZ
(se
co
nd
s)
De
via
tio
ns
HD
(m
m)
De
via
tio
ns
HZ
(se
con
ds)
De
via
tio
ns
VZ
(se
co
nd
s)
De
via
tio
ns
HD
(m
m)
De
via
tio
ns
HZ
(se
con
ds)
De
via
tio
ns
VZ
(se
co
nd
s)
De
via
tio
ns
HD
(m
m)
De
via
tio
ns
HZ
(se
con
ds)
De
via
tio
ns
VZ
(se
co
nd
s)
De
via
tio
ns
HD
(m
m)
De
via
tio
ns
HZ
(se
con
ds)
De
via
tio
ns
VZ
(se
co
nd
s)
De
via
tio
ns
HD
(m
m)
Obstruction 10m from
Station
Mid-way Obstruction Obstruction 10m from
Target
Obstruction 10m from
Station
Mid-way Obstruction Obstruction 10m from
Target
TARGET :- LEICA GRZ4 360 PRISM TARGET :- LEICA GPR1 ROUND PRISM
Instrument:- Trimble S6
Obstruction:- Shade Cloth
Deviation Chart
-6
-4
-2
0
2
4
6
8
10
12
14
16
De
via
tio
ns
HZ
(se
con
ds)
De
via
tio
ns
VZ
(se
co
nd
s)
De
via
tio
ns
HD
(m
m)
De
via
tio
ns
HZ
(se
con
ds)
De
via
tio
ns
VZ
(se
co
nd
s)
De
via
tio
ns
HD
(m
m)
De
via
tio
ns
HZ
(se
con
ds)
De
via
tio
ns
VZ
(se
co
nd
s)
De
via
tio
ns
HD
(m
m)
De
via
tio
ns
HZ
(se
con
ds)
De
via
tio
ns
VZ
(se
co
nd
s)
De
via
tio
ns
HD
(m
m)
De
via
tio
ns
HZ
(se
con
ds)
De
via
tio
ns
VZ
(se
co
nd
s)
De
via
tio
ns
HD
(m
m)
De
via
tio
ns
HZ
(se
con
ds)
De
via
tio
ns
VZ
(se
co
nd
s)
De
via
tio
ns
HD
(m
m)
Obstruction 10m
from Station
Mid-way Obstruction Obstruction 10m
from Target
Obstruction 10m
from Station
Mid-way Obstruction Obstruction 10m
from Target
TARGET :- LEICA GRZ4 360 PRISM TARGET :- LEICA GPR1 ROUND PRISM
Instrument:- Trimble S6
Obstruction:- Shade Cloth
Statistics Chart
STN 1 (70m)
Std Dev
Range
Average
STN 2 (140m)
Std Dev
Range
Average
STN 3 (210m)
Std Dev
Range
Average
STN 4 (280m)
Std Dev
Range
Average
STN 5 (350m)
Std Dev
Range
Average
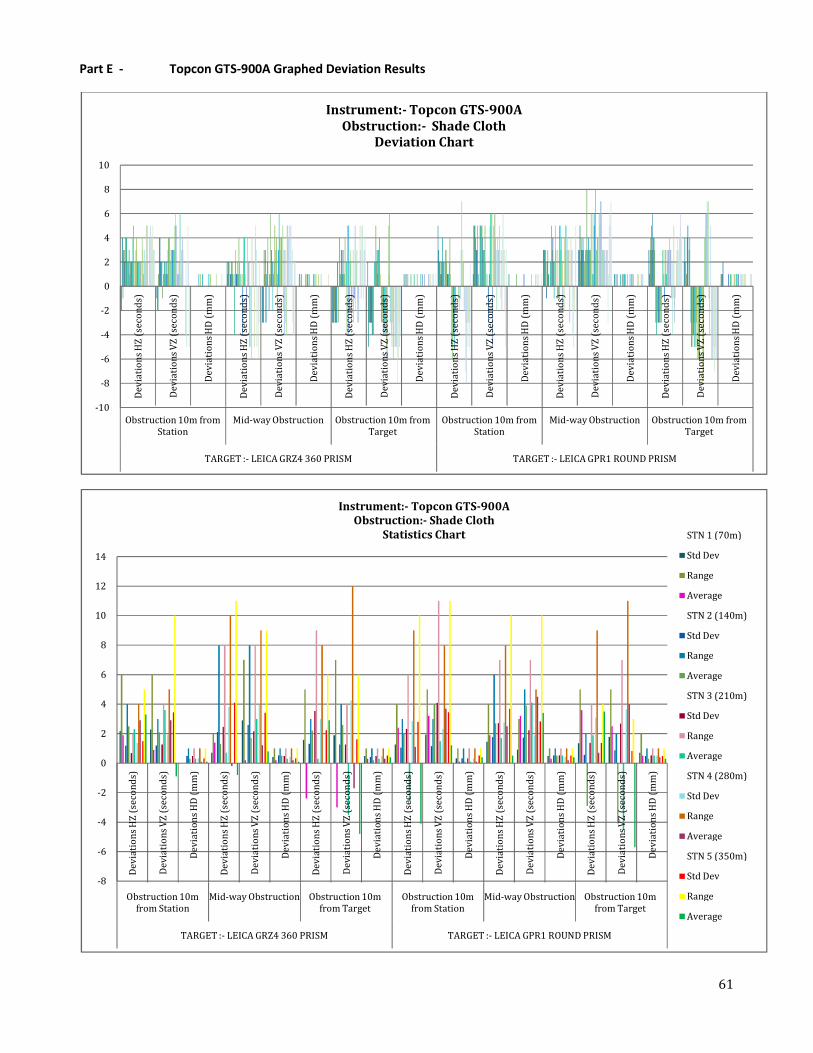
61
Part E - Topcon GTS-900A Graphed Deviation Results
-10
-8
-6
-4
-2
0
2
4
6
8
10
De
via
tio
ns
HZ
(se
con
ds)
De
via
tio
ns
VZ
(se
co
nd
s)
De
via
tio
ns
HD
(m
m)
De
via
tio
ns
HZ
(se
con
ds)
De
via
tio
ns
VZ
(se
co
nd
s)
De
via
tio
ns
HD
(m
m)
De
via
tio
ns
HZ
(se
con
ds)
De
via
tio
ns
VZ
(se
co
nd
s)
De
via
tio
ns
HD
(m
m)
De
via
tio
ns
HZ
(se
con
ds)
De
via
tio
ns
VZ
(se
co
nd
s)
De
via
tio
ns
HD
(m
m)
De
via
tio
ns
HZ
(se
con
ds)
De
via
tio
ns
VZ
(se
co
nd
s)
De
via
tio
ns
HD
(m
m)
De
via
tio
ns
HZ
(se
con
ds)
De
via
tio
ns
VZ
(se
co
nd
s)
De
via
tio
ns
HD
(m
m)
Obstruction 10m from
Station
Mid-way Obstruction Obstruction 10m from
Target
Obstruction 10m from
Station
Mid-way Obstruction Obstruction 10m from
Target
TARGET :- LEICA GRZ4 360 PRISM TARGET :- LEICA GPR1 ROUND PRISM
Instrument:- Topcon GTS-900A
Obstruction:- Shade Cloth
Deviation Chart
-8
-6
-4
-2
0
2
4
6
8
10
12
14
De
via
tio
ns
HZ
(se
con
ds)
De
via
tio
ns
VZ
(se
co
nd
s)
De
via
tio
ns
HD
(m
m)
De
via
tio
ns
HZ
(se
con
ds)
De
via
tio
ns
VZ
(se
co
nd
s)
De
via
tio
ns
HD
(m
m)
De
via
tio
ns
HZ
(se
con
ds)
De
via
tio
ns
VZ
(se
co
nd
s)
De
via
tio
ns
HD
(m
m)
De
via
tio
ns
HZ
(se
con
ds)
De
via
tio
ns
VZ
(se
co
nd
s)
De
via
tio
ns
HD
(m
m)
De
via
tio
ns
HZ
(se
con
ds)
De
via
tio
ns
VZ
(se
co
nd
s)
De
via
tio
ns
HD
(m
m)
De
via
tio
ns
HZ
(se
con
ds)
De
via
tio
ns
VZ
(se
co
nd
s)
De
via
tio
ns
HD
(m
m)
Obstruction 10m
from Station
Mid-way Obstruction Obstruction 10m
from Target
Obstruction 10m
from Station
Mid-way Obstruction Obstruction 10m
from Target
TARGET :- LEICA GRZ4 360 PRISM TARGET :- LEICA GPR1 ROUND PRISM
Instrument:- Topcon GTS-900A
Obstruction:- Shade Cloth
Statistics Chart STN 1 (70m)
Std Dev
Range
Average
STN 2 (140m)
Std Dev
Range
Average
STN 3 (210m)
Std Dev
Range
Average
STN 4 (280m)
Std Dev
Range
Average
STN 5 (350m)
Std Dev
Range
Average

62
Appendix F - Glass Obstruction Deviation Results
Part A - Trimble S6 Graphed Deviation Results
Part B - Topcon GTS-900A Graphed Deviation Results
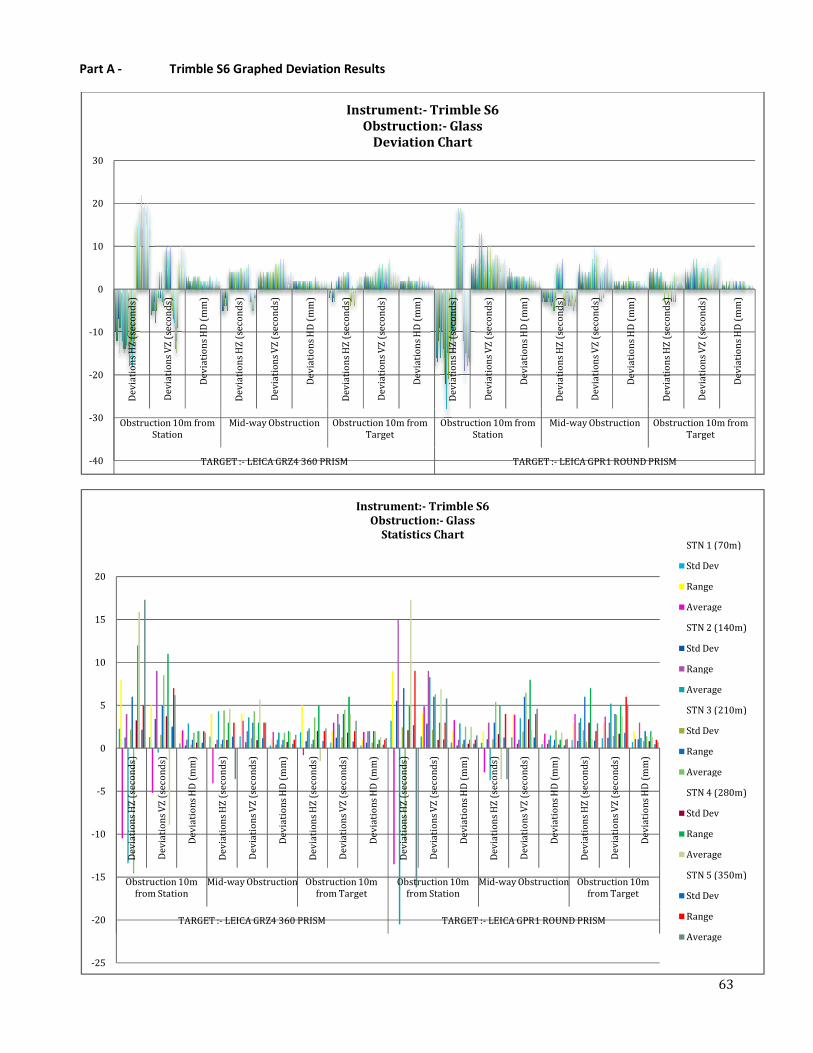
Part A - Trimble S6 Graphed Deviation Results
-40
-30
-20
-10
0
10
20
30
De
via
tio
ns
HZ
(se
co
nd
s)
De
via
tio
ns
VZ
(se
con
ds)
De
via
tio
ns
HD
(m
m)
De
via
tio
ns
HZ
(se
co
nd
s)
De
via
tio
ns
VZ
(se
con
ds)
De
via
tio
ns
HD
(m
m)
Obstruction 10m from
Station
Mid-way Obstruction
TARGET :- LEICA GRZ4 360 PRISM
-25
-20
-15
-10
-5
0
5
10
15
20
De
via
tio
ns
HZ
(se
con
ds)
De
via
tio
ns
VZ
(se
co
nd
s)
De
via
tio
ns
HD
(m
m)
De
via
tio
ns
HZ
(se
con
ds)
De
via
tio
ns
VZ
(se
co
nd
s)
De
via
tio
ns
HD
(m
m)
De
via
tio
ns
HZ
(se
con
ds)
Obstruction 10m
from Station
Mid-way Obstruction Obstruction 10m
from Target
TARGET :- LEICA GRZ4 360 PRISM
ed Deviation Results
De
via
tio
ns
HZ
(se
co
nd
s)
De
via
tio
ns
VZ
(se
con
ds)
De
via
tio
ns
HD
(m
m)
De
via
tio
ns
HZ
(se
co
nd
s)
De
via
tio
ns
VZ
(se
con
ds)
De
via
tio
ns
HD
(m
m)
De
via
tio
ns
HZ
(se
co
nd
s)
De
via
tio
ns
VZ
(se
con
ds)
Obstruction 10m from
Target
Obstruction 10m from
Station
Mid-way Obstruction
LEICA GRZ4 360 PRISM TARGET :- LEICA GPR1 ROUND PRISM
Instrument:- Trimble S6
Obstruction:- Glass
Deviation Chart
De
via
tio
ns
VZ
(se
co
nd
s)
De
via
tio
ns
HD
(m
m)
De
via
tio
ns
HZ
(se
con
ds)
De
via
tio
ns
VZ
(se
co
nd
s)
De
via
tio
ns
HD
(m
m)
De
via
tio
ns
HZ
(se
con
ds)
De
via
tio
ns
VZ
(se
co
nd
s)
De
via
tio
ns
HD
(m
m)
De
via
tio
ns
HZ
(se
con
ds)
Obstruction 10m
from Target
Obstruction 10m
from Station
Mid-way Obstruction Obstruction 10m
from Target
LEICA GRZ4 360 PRISM TARGET :- LEICA GPR1 ROUND PRISM
Instrument:- Trimble S6
Obstruction:- Glass
Statistics Chart
63
De
via
tio
ns
HD
(m
m)
De
via
tio
ns
HZ
(se
co
nd
s)
De
via
tio
ns
VZ
(se
con
ds)
De
via
tio
ns
HD
(m
m)
way Obstruction Obstruction 10m from
Target
LEICA GPR1 ROUND PRISM
De
via
tio
ns
VZ
(se
co
nd
s)
De
via
tio
ns
HD
(m
m)
Obstruction 10m
from Target
STN 1 (70m)
Std Dev
Range
Average
STN 2 (140m)
Std Dev
Range
Average
STN 3 (210m)
Std Dev
Range
Average
STN 4 (280m)
Std Dev
Range
Average
STN 5 (350m)
Std Dev
Range
Average
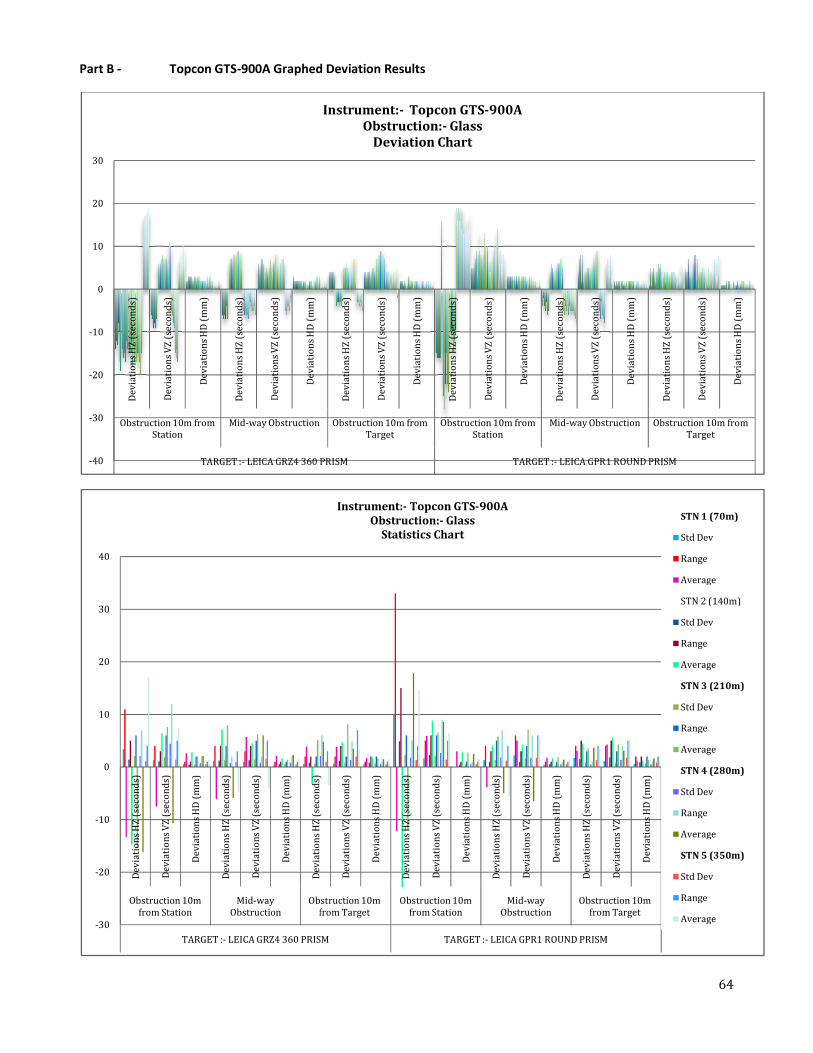
Part B - Topcon GTS-900A Graphed Deviation Results
-40
-30
-20
-10
0
10
20
30
De
via
tio
ns
HZ
(se
co
nd
s)
De
via
tio
ns
VZ
(se
con
ds)
De
via
tio
ns
HD
(m
m)
De
via
tio
ns
HZ
(se
co
nd
s)
De
via
tio
ns
VZ
(se
con
ds)
De
via
tio
ns
HD
(m
m)
Obstruction 10m from
Station
Mid-way Obstruction
TARGET :- LEICA GRZ4 360 PRISM
-30
-20
-10
0
10
20
30
40
De
via
tio
ns
HZ
(se
con
ds)
De
via
tio
ns
VZ
(se
con
ds)
De
via
tio
ns
HD
(m
m)
De
via
tio
ns
HZ
(se
con
ds)
De
via
tio
ns
VZ
(se
con
ds)
De
via
tio
ns
HD
(m
m)
De
via
tio
ns
HZ
(se
con
ds)
Obstruction 10m
from Station
Mid-way
Obstruction
Obstruction 10m
from Target
TARGET :- LEICA GRZ4 360 PRISM
900A Graphed Deviation Results
De
via
tio
ns
HZ
(se
co
nd
s)
De
via
tio
ns
VZ
(se
con
ds)
De
via
tio
ns
HD
(m
m)
De
via
tio
ns
HZ
(se
co
nd
s)
De
via
tio
ns
VZ
(se
con
ds)
De
via
tio
ns
HD
(m
m)
De
via
tio
ns
HZ
(se
co
nd
s)
De
via
tio
ns
VZ
(se
con
ds)
Obstruction 10m from
Target
Obstruction 10m from
Station
Mid-way Obstruction
LEICA GRZ4 360 PRISM TARGET :- LEICA GPR1 ROUND PRISM
Instrument:- Topcon GTS-900A
Obstruction:- Glass
Deviation Chart
De
via
tio
ns
HZ
(se
con
ds)
De
via
tio
ns
VZ
(se
con
ds)
De
via
tio
ns
HD
(m
m)
De
via
tio
ns
HZ
(se
con
ds)
De
via
tio
ns
VZ
(se
con
ds)
De
via
tio
ns
HD
(m
m)
De
via
tio
ns
HZ
(se
con
ds)
De
via
tio
ns
VZ
(se
con
ds)
De
via
tio
ns
HD
(m
m)
De
via
tio
ns
HZ
(se
con
ds)
Obstruction 10m
from Target
Obstruction 10m
from Station
Mid-way
Obstruction
Obstruction 10m
from Target
LEICA GRZ4 360 PRISM TARGET :- LEICA GPR1 ROUND PRISM
Instrument:- Topcon GTS-900A
Obstruction:- Glass
Statistics Chart
64
De
via
tio
ns
HD
(m
m)
De
via
tio
ns
HZ
(se
co
nd
s)
De
via
tio
ns
VZ
(se
con
ds)
De
via
tio
ns
HD
(m
m)
way Obstruction Obstruction 10m from
Target
LEICA GPR1 ROUND PRISM
De
via
tio
ns
VZ
(se
con
ds)
De
via
tio
ns
HD
(m
m)
Obstruction 10m
from Target
LEICA GPR1 ROUND PRISM
STN 1 (70m)
Std Dev
Range
Average
STN 2 (140m)
Std Dev
Range
Average
STN 3 (210m)
Std Dev
Range
Average
STN 4 (280m)
Std Dev
Range
Average
STN 5 (350m)
Std Dev
Range
Average

65
Appendix G - Dusty Lens and Prism Obstruction Deviation Results
Part A - Trimble S6 Graphed Deviation Results
Part B - Topcon GTS-900A Graphed Deviation Results

Part A - Trimble S6 Graphed Deviation Results
-10
-8
-6
-4
-2
0
2
4
6
8
10
Deviations HZ (seconds) Deviations VZ (seconds)
TARGET :- LEICA GRZ4 360 PRISM
Obstruction:
-10
-5
0
5
10
15
Deviations HZ
(seconds)
Deviations VZ
(seconds)
Deviations HD (mm)
TARGET :- LEICA GRZ4 360 PRISM
ed Deviation Results
Deviations VZ (seconds) Deviations HD (mm) Deviations HZ (seconds) Deviations VZ (seconds)
LEICA GRZ4 360 PRISM TARGET :- LEICA GPR1 ROUND PRISM
Instrument:- Trimble S6
Obstruction:- Dusty Lense and Prism
Deviation Chart
Deviations HD (mm) Deviations HZ
(seconds)
Deviations VZ
(seconds)
Deviations HD (mm)
LEICA GRZ4 360 PRISM TARGET :- LEICA GPR1 ROUND PRISM
Instrument:- Trimble S6
Obstruction:- Dusty Lens and Prism
Statistics Chart
66
Deviations VZ (seconds) Deviations HD (mm)
LEICA GPR1 ROUND PRISM
Deviations HD (mm)
LEICA GPR1 ROUND PRISM
STN 1 (70m)
Std Dev
Range
Average
STN 2 (140m)
Std Dev
Range
Average
STN 3 (210m)
Std Dev
Range
Average
STN 4 (280m)
Std Dev
Range
Average
STN 5 (350m)
Std Dev
Range
Average
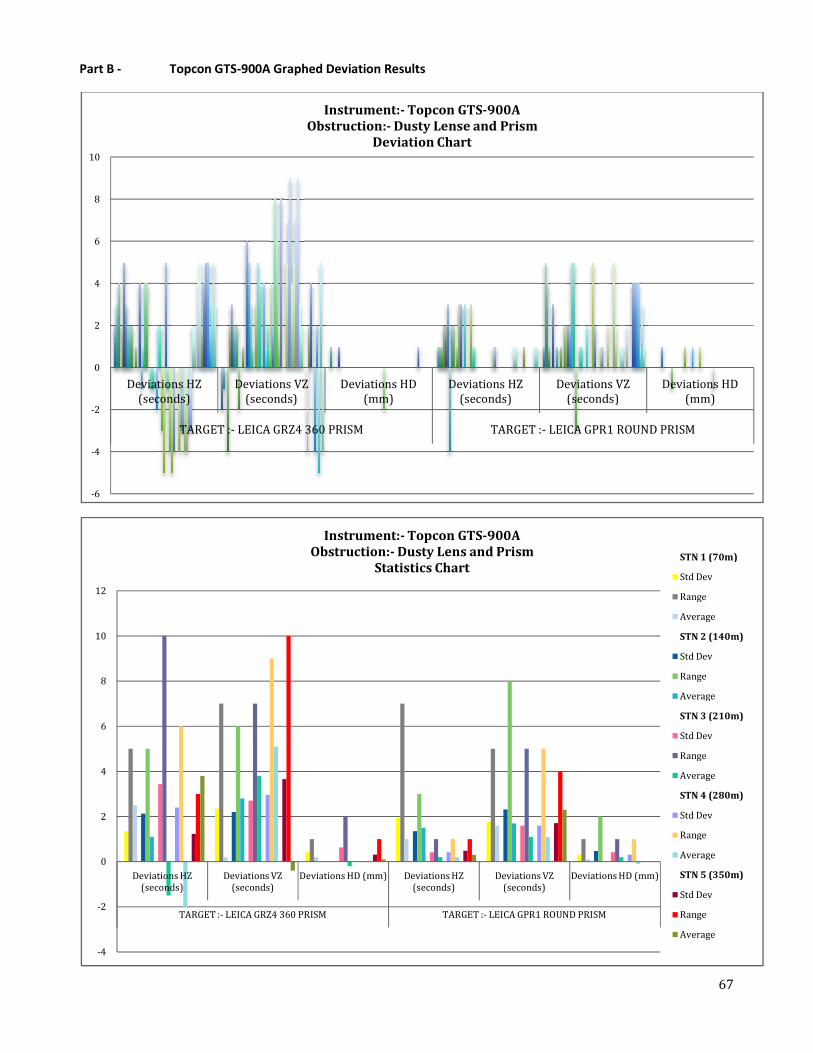
Part B - Topcon GTS-900A Graphed Deviation Results
-6
-4
-2
0
2
4
6
8
10
Deviations HZ
(seconds)
Deviations VZ
(seconds)
TARGET :- LEICA GRZ4 360 PRISM
Obstruction:
-4
-2
0
2
4
6
8
10
12
Deviations HZ
(seconds)
Deviations VZ
(seconds)
Deviations HD (mm)
TARGET :- LEICA GRZ4 360 PRISM
Obstruction:
900A Graphed Deviation Results
Deviations HD
(mm)
Deviations HZ
(seconds)
Deviations VZ
(seconds)
LEICA GRZ4 360 PRISM TARGET :- LEICA GPR1 ROUND PRISM
Instrument:- Topcon GTS-900A
Obstruction:- Dusty Lense and Prism
Deviation Chart
Deviations HD (mm) Deviations HZ
(seconds)
Deviations VZ
(seconds)
Deviations HD (mm)
LEICA GRZ4 360 PRISM TARGET :- LEICA GPR1 ROUND PRISM
Instrument:- Topcon GTS-900A
Obstruction:- Dusty Lens and Prism
Statistics Chart
67
Deviations VZ
(seconds)
Deviations HD
(mm)
LEICA GPR1 ROUND PRISM
Deviations HD (mm)
STN 1 (70m)
Std Dev
Range
Average
STN 2 (140m)
Std Dev
Range
Average
STN 3 (210m)
Std Dev
Range
Average
STN 4 (280m)
Std Dev
Range
Average
STN 5 (350m)
Std Dev
Range
Average

68
Appendix H - Wet Lens and Prism Obstruction Deviation Results
Part A - Trimble S6 Graphed Deviation Results
Part B - Topcon GTS-900A Graphed Deviation Results
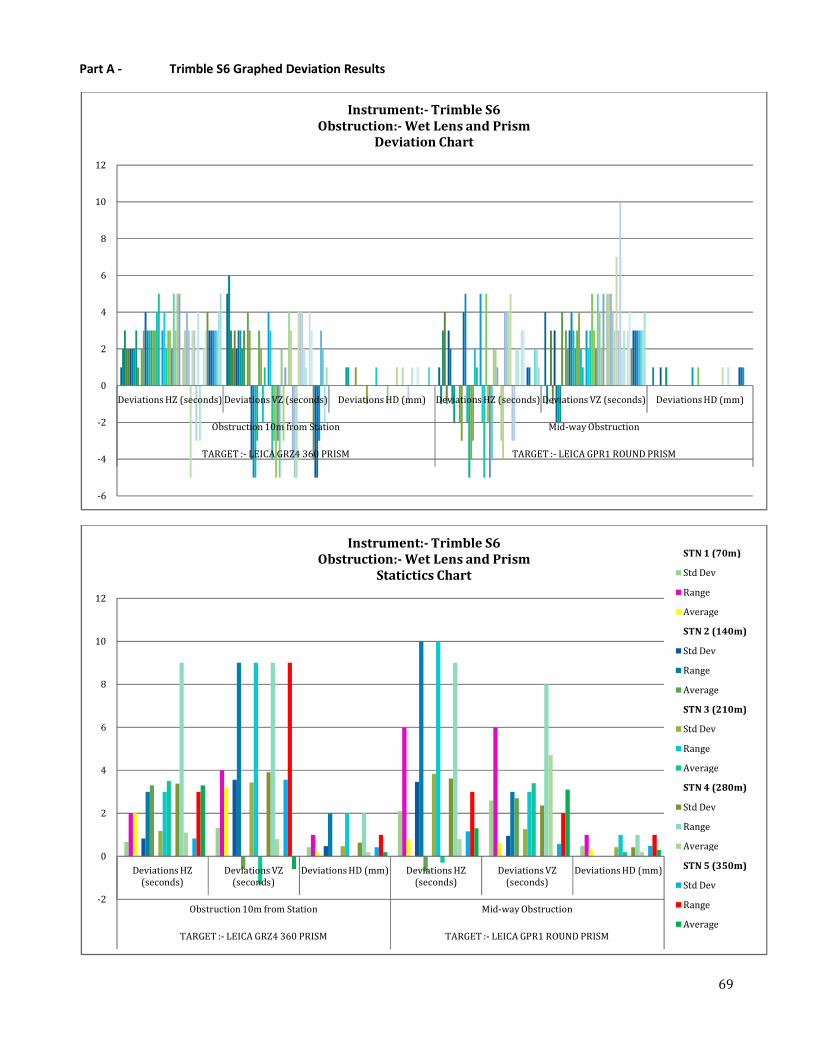
69
Part A - Trimble S6 Graphed Deviation Results
-6
-4
-2
0
2
4
6
8
10
12
Deviations HZ (seconds) Deviations VZ (seconds) Deviations HD (mm) Deviations HZ (seconds) Deviations VZ (seconds) Deviations HD (mm)
Obstruction 10m from Station Mid-way Obstruction
TARGET :- LEICA GRZ4 360 PRISM TARGET :- LEICA GPR1 ROUND PRISM
Instrument:- Trimble S6
Obstruction:- Wet Lens and Prism
Deviation Chart
-2
0
2
4
6
8
10
12
Deviations HZ
(seconds)
Deviations VZ
(seconds)
Deviations HD (mm) Deviations HZ
(seconds)
Deviations VZ
(seconds)
Deviations HD (mm)
Obstruction 10m from Station Mid-way Obstruction
TARGET :- LEICA GRZ4 360 PRISM TARGET :- LEICA GPR1 ROUND PRISM
Instrument:- Trimble S6
Obstruction:- Wet Lens and Prism
Statictics Chart
STN 1 (70m)
Std Dev
Range
Average
STN 2 (140m)
Std Dev
Range
Average
STN 3 (210m)
Std Dev
Range
Average
STN 4 (280m)
Std Dev
Range
Average
STN 5 (350m)
Std Dev
Range
Average

70
Part B - Topcon GTS-900A Graphed Deviation Results
-6
-4
-2
0
2
4
6
8
Deviations HZ (seconds) Deviations VZ (seconds) Deviations HD (mm) Deviations HZ (seconds) Deviations VZ (seconds) Deviations HD (mm)
Obstruction 10m from Station Mid-way Obstruction
TARGET :- LEICA GRZ4 360 PRISM TARGET :- LEICA GPR1 ROUND PRISM
Instrument:- Topcon GTS-900A
Obstruction:- Wet Lens and Prism
Deviation Chart
-2
0
2
4
6
8
10
12
Deviations HZ
(seconds)
Deviations VZ
(seconds)
Deviations HD (mm) Deviations HZ
(seconds)
Deviations VZ
(seconds)
Deviations HD (mm)
Obstruction 10m from Station Mid-way Obstruction
TARGET :- LEICA GRZ4 360 PRISM TARGET :- LEICA GPR1 ROUND PRISM
Instrument:- Topcon GTS-900A
Obstruction:- Wet Lens and Prism
Statistics Chart STN 1 (70m)
Std Dev
Range
Average
STN 2 (140m)
Std Dev
Range
Average
STN 3 (210m)
Std Dev
Range
Average
STN 4 (280m)
Std Dev
Range
Average
STN 5 (350m)
Std Dev
Range
Average

71
Appendix I - Partial Prism Obstruction Deviation Results
Part A - Trimble S6 Graphed Deviation Results
Part B - Topcon GTS-900A Graphed Deviation Results
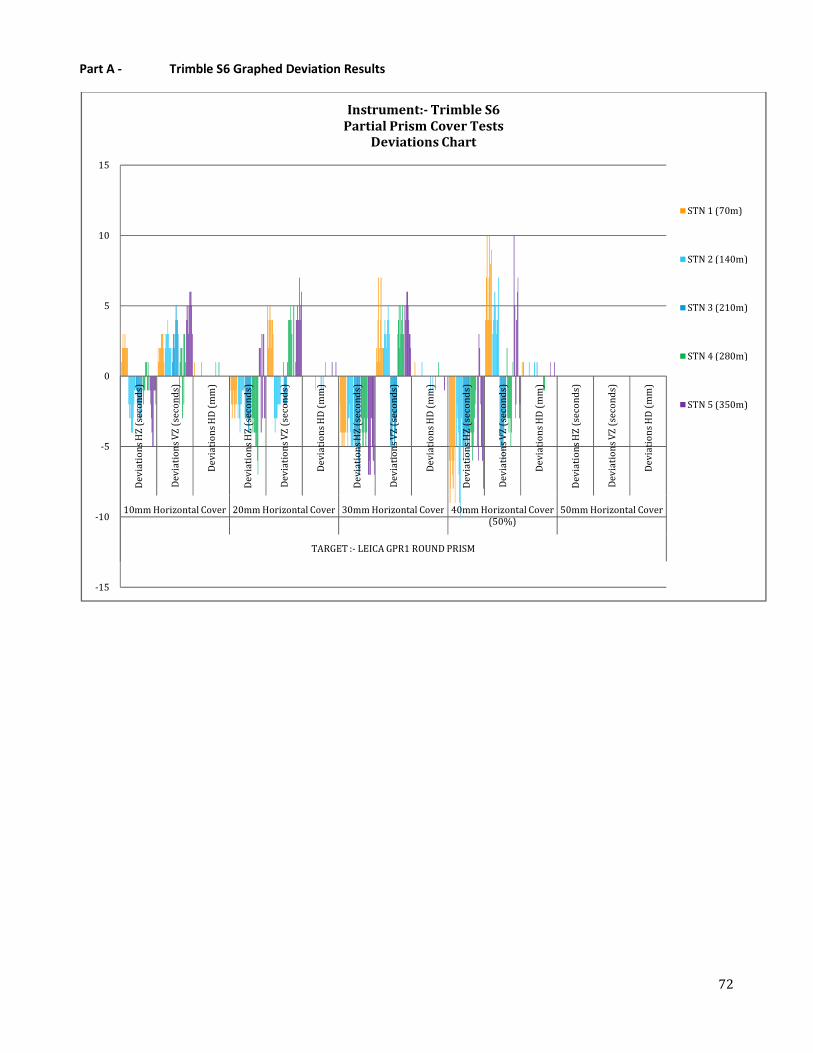
72
Part A - Trimble S6 Graphed Deviation Results
-15
-10
-5
0
5
10
15
De
via
tio
ns
HZ
(se
con
ds)
De
via
tio
ns
VZ
(se
con
ds)
De
via
tio
ns
HD
(m
m)
De
via
tio
ns
HZ
(se
con
ds)
De
via
tio
ns
VZ
(se
con
ds)
De
via
tio
ns
HD
(m
m)
De
via
tio
ns
HZ
(se
con
ds)
De
via
tio
ns
VZ
(se
con
ds)
De
via
tio
ns
HD
(m
m)
De
via
tio
ns
HZ
(se
con
ds)
De
via
tio
ns
VZ
(se
con
ds)
De
via
tio
ns
HD
(m
m)
De
via
tio
ns
HZ
(se
con
ds)
De
via
tio
ns
VZ
(se
con
ds)
De
via
tio
ns
HD
(m
m)
10mm Horizontal Cover 20mm Horizontal Cover 30mm Horizontal Cover 40mm Horizontal Cover
(50%)
50mm Horizontal Cover
TARGET :- LEICA GPR1 ROUND PRISM
Instrument:- Trimble S6
Partial Prism Cover Tests
Deviations Chart
STN 1 (70m)
STN 2 (140m)
STN 3 (210m)
STN 4 (280m)
STN 5 (350m)
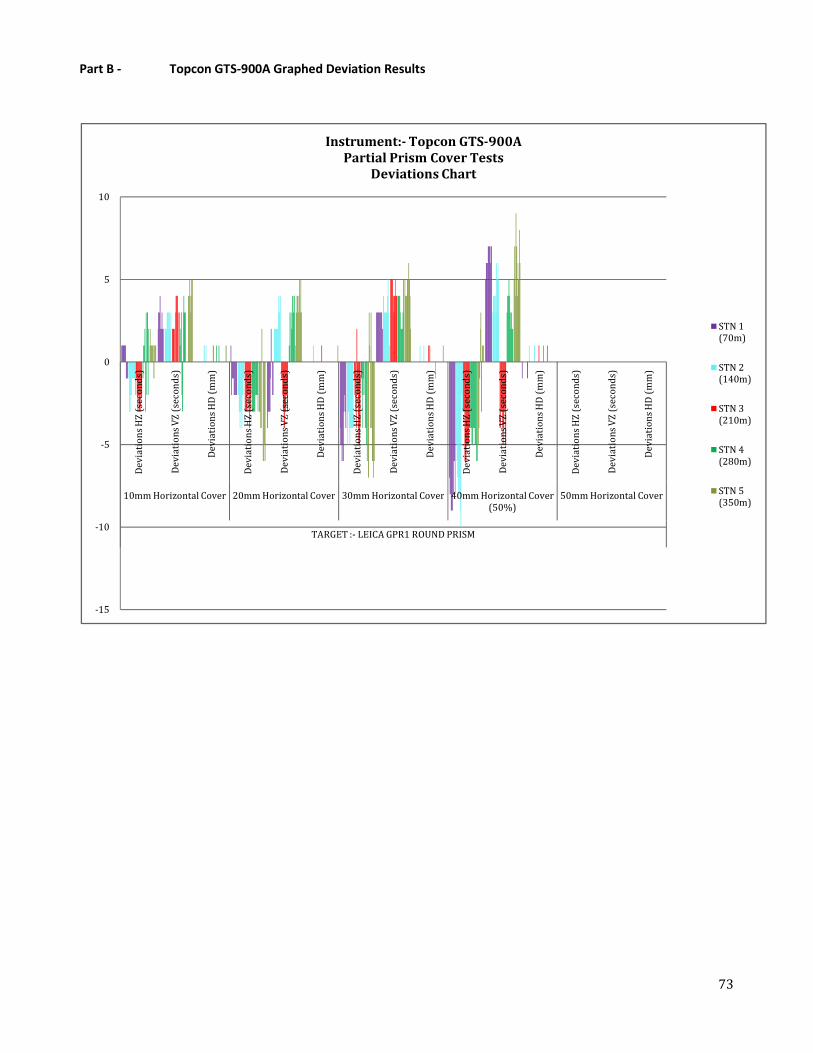
73
Part B - Topcon GTS-900A Graphed Deviation Results
-15
-10
-5
0
5
10
De
via
tio
ns
HZ
(se
con
ds)
De
via
tio
ns
VZ
(se
co
nd
s)
De
via
tio
ns
HD
(m
m)
De
via
tio
ns
HZ
(se
con
ds)
De
via
tio
ns
VZ
(se
co
nd
s)
De
via
tio
ns
HD
(m
m)
De
via
tio
ns
HZ
(se
con
ds)
De
via
tio
ns
VZ
(se
co
nd
s)
De
via
tio
ns
HD
(m
m)
De
via
tio
ns
HZ
(se
con
ds)
De
via
tio
ns
VZ
(se
co
nd
s)
De
via
tio
ns
HD
(m
m)
De
via
tio
ns
HZ
(se
con
ds)
De
via
tio
ns
VZ
(se
co
nd
s)
De
via
tio
ns
HD
(m
m)
10mm Horizontal Cover 20mm Horizontal Cover 30mm Horizontal Cover 40mm Horizontal Cover
(50%)
50mm Horizontal Cover
TARGET :- LEICA GPR1 ROUND PRISM
Instrument:- Topcon GTS-900A
Partial Prism Cover Tests
Deviations Chart
STN 1
(70m)
STN 2
(140m)
STN 3
(210m)
STN 4
(280m)
STN 5
(350m)
Related Documents