WETLANDS GHG STATE OF THE SCIENCE Sacramento-San Joaquin Delta Water Commission Presentation May 15, 2013

Welcome message from author
This document is posted to help you gain knowledge. Please leave a comment to let me know what you think about it! Share it to your friends and learn new things together.
Transcript
WETLANDS GHG STATE OF THE SCIENCE
Sacramento-San Joaquin Delta
Water Commission Presentation May 15, 2013
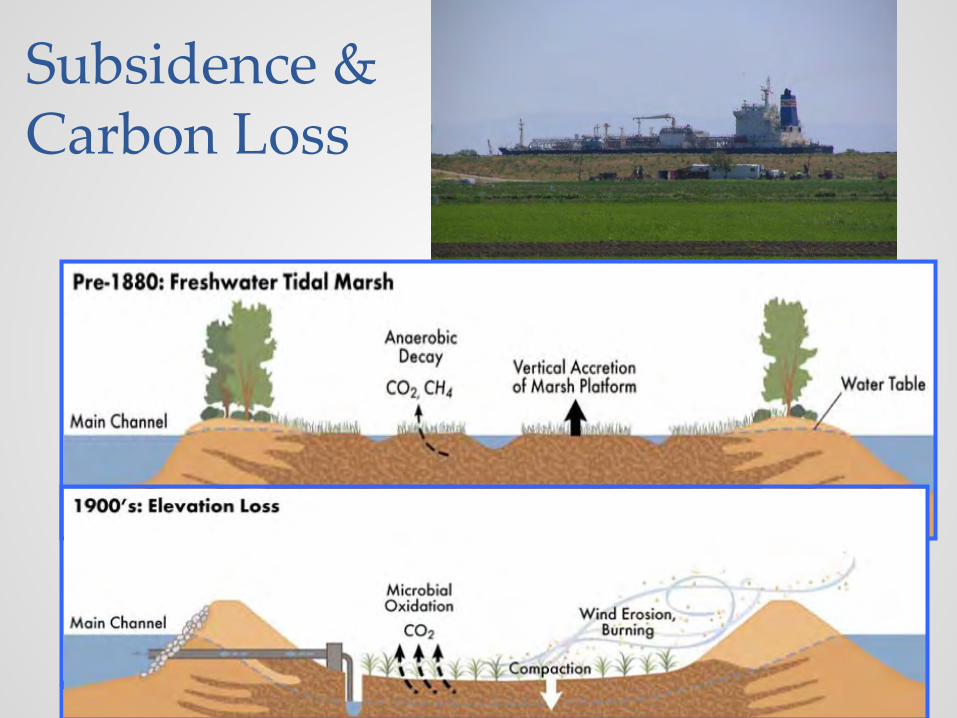
Subsidence & Carbon Loss
2
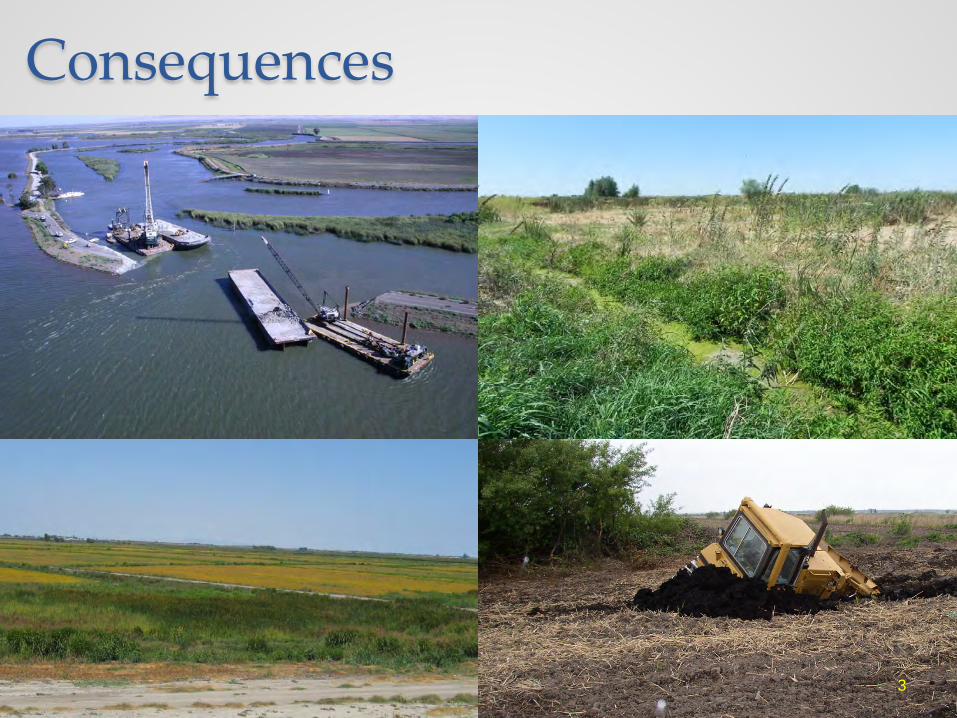
Consequences
3
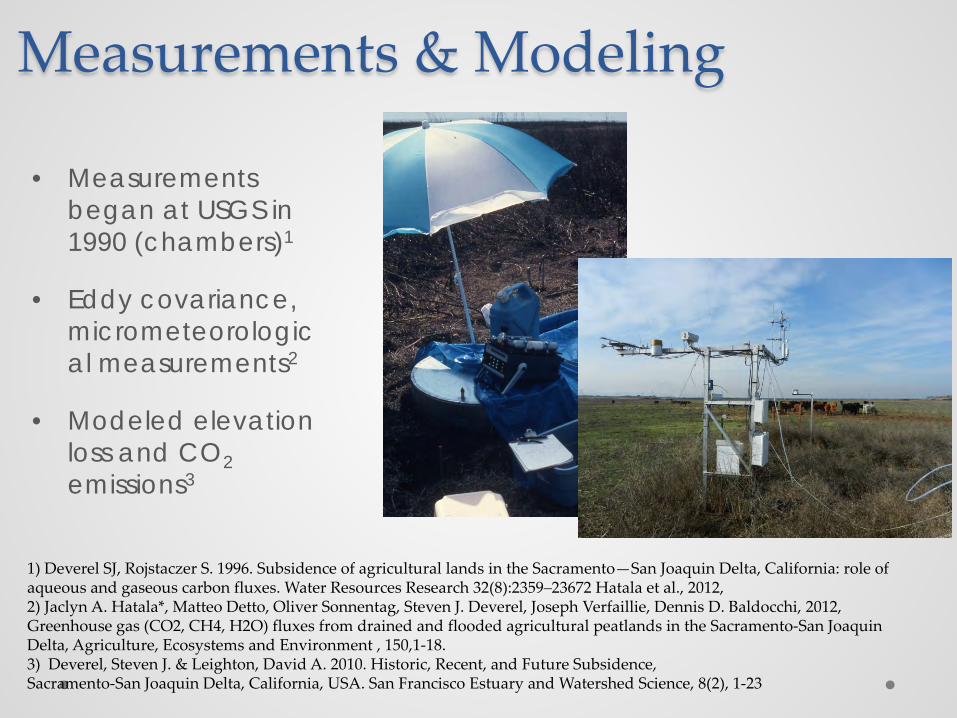
Measurements & Modeling
• Measurements began at USGS in 1990 (chambers)1
• Eddy covariance, micrometeorological measurements2
• Modeled elevation loss and CO2 emissions3
1) Deverel SJ, Rojstaczer S. 1996. Subsidence of agricultural lands in the Sacramento—San Joaquin Delta, California: role of aqueous and gaseous carbon fluxes. Water Resources Research 32(8):2359–23672 Hatala et al., 2012, 2) Jaclyn A. Hatala*, Matteo Detto, Oliver Sonnentag, Steven J. Deverel, Joseph Verfaillie, Dennis D. Baldocchi, 2012, Greenhouse gas (CO2, CH4, H2O) fluxes from drained and flooded agricultural peatlands in the Sacramento-San Joaquin Delta, Agriculture, Ecosystems and Environment , 150,1-18. 3) Deverel, Steven J. & Leighton, David A. 2010. Historic, Recent, and Future Subsidence, Sacramento-San Joaquin Delta, California, USA. San Francisco Estuary and Watershed Science, 8(2), 1-23
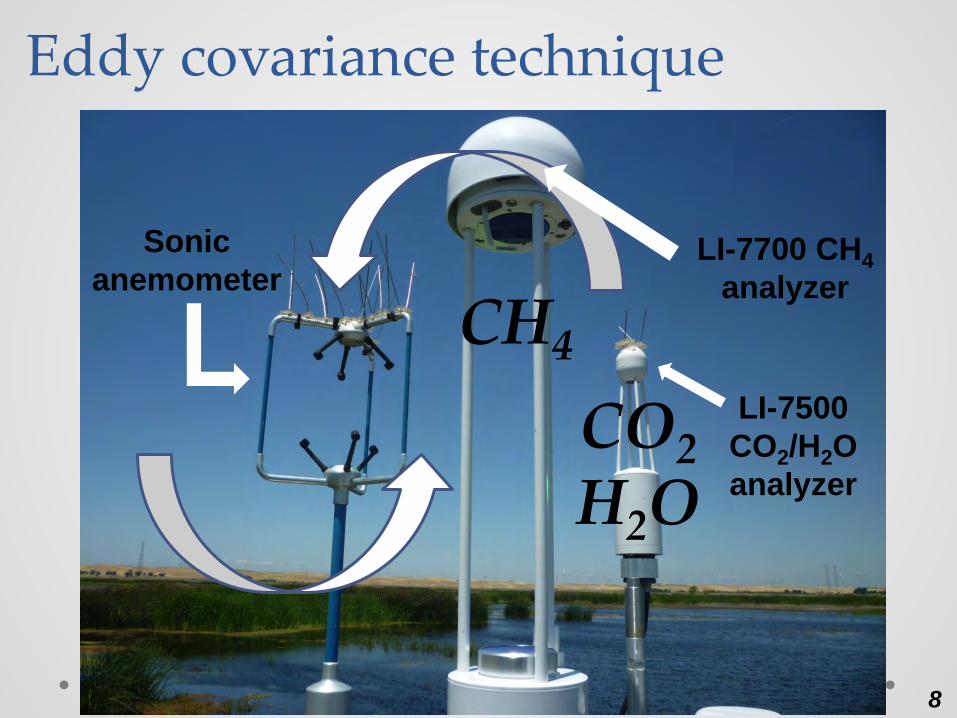
Eddy covariance technique
CH4 CO2 H2O
Sonic anemometer
LI-7700 CH4 analyzer
LI-7500 CO2/H2O analyzer
8
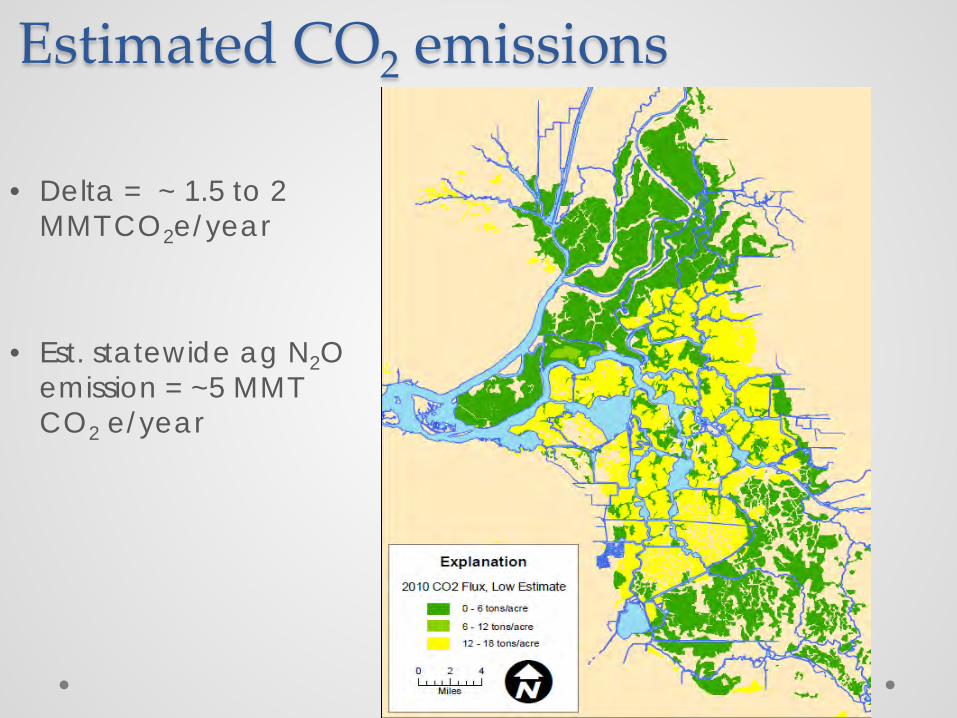
Estimated CO2 emissions
• Delta = ~ 1.5 to 2 MMT CO2e/year
• Est. statewide ag N2O emission = ~5 MMT CO2 e/year
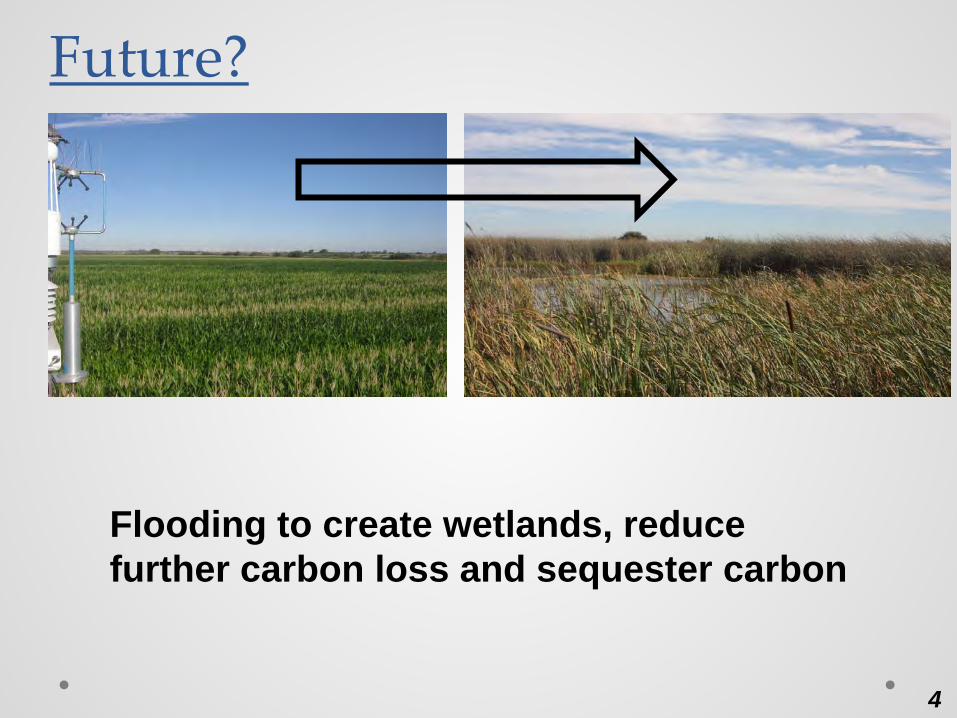
Future?
Flooding to create wetlands, reduce further carbon loss and sequester carbon
4
Wetlands
Drained agriculture
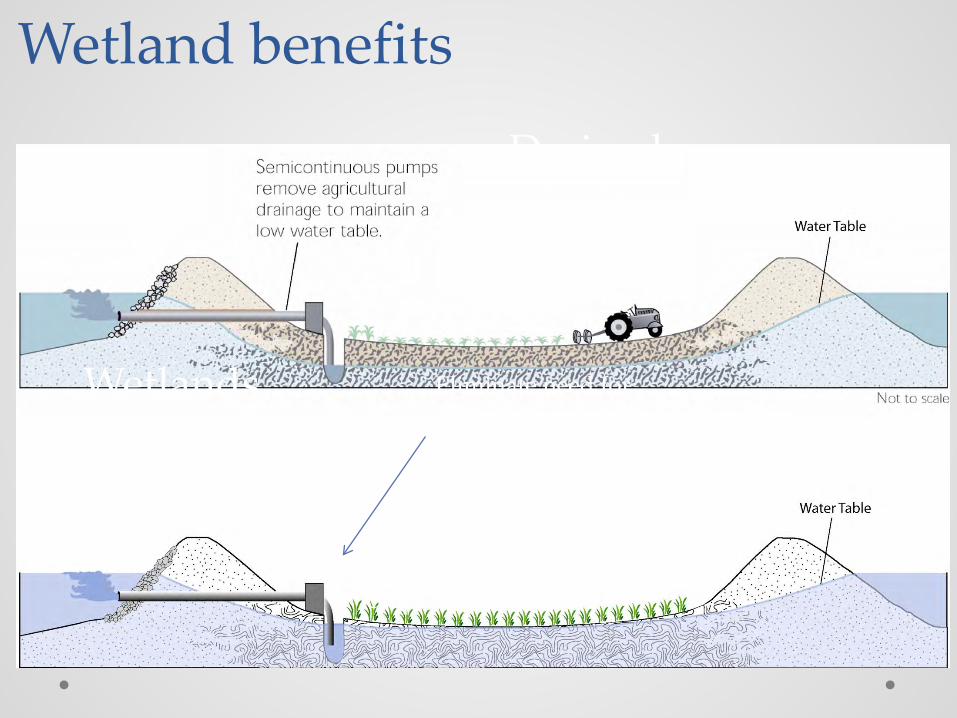
Wetland benefits
Saturated conditions can allow for greater drainage discharge control and load reductions
Eliminate need for deepening drainage ditches Reduces threat to levee stability
Reduce seepage and hydraulic force on levees
Stops volume loss
Deverel, S.J., Wang, Bronwen, Rojstaczer, Stuart 1998, Subsidence in the Sacramento-San Joaquin Delta, in (Borchers, J.W., ed.) Proceedings of the Joseph Poland Subsidence Symposium, Association of Engineering Geologists, Special Publication No. 8, Star Publishing, Belmont, California, pp. 489-502. Miller, R.L., Hastings, L., Fujii, R., 2000. Hydrologic treatments affect gaseous carbon loss from organic soils, Twitchell Island, California, October 1995- December 1997. U.S. Geological Survey Water-Resources Investigations Report 2000-4042, 21p.
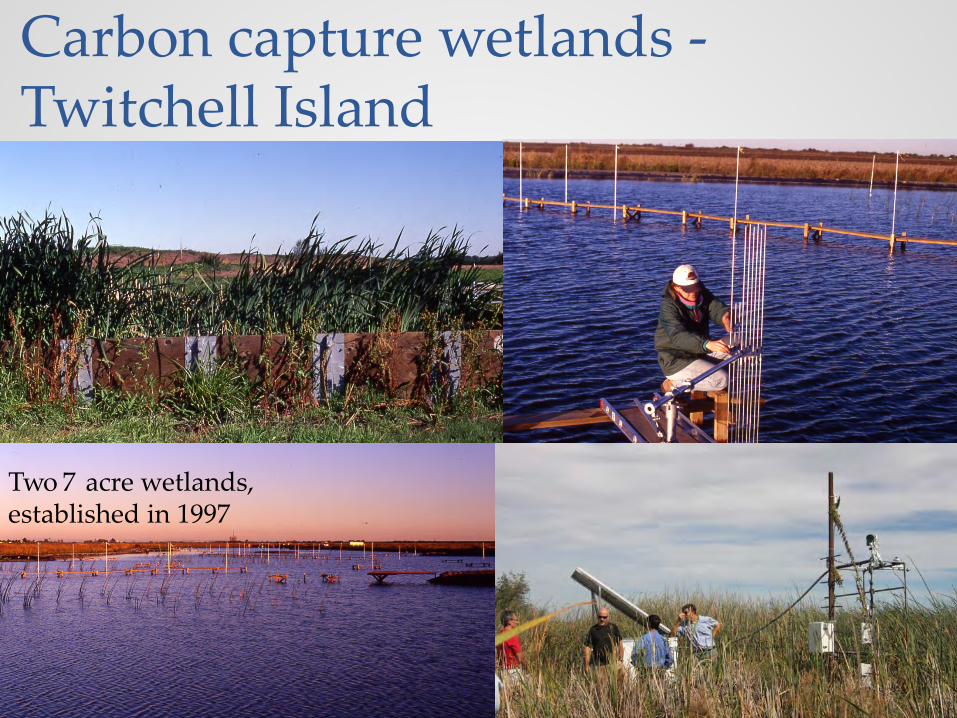
Two 7 acre wetlands, established in 1997
Carbon capture wetlands - Twitchell Island
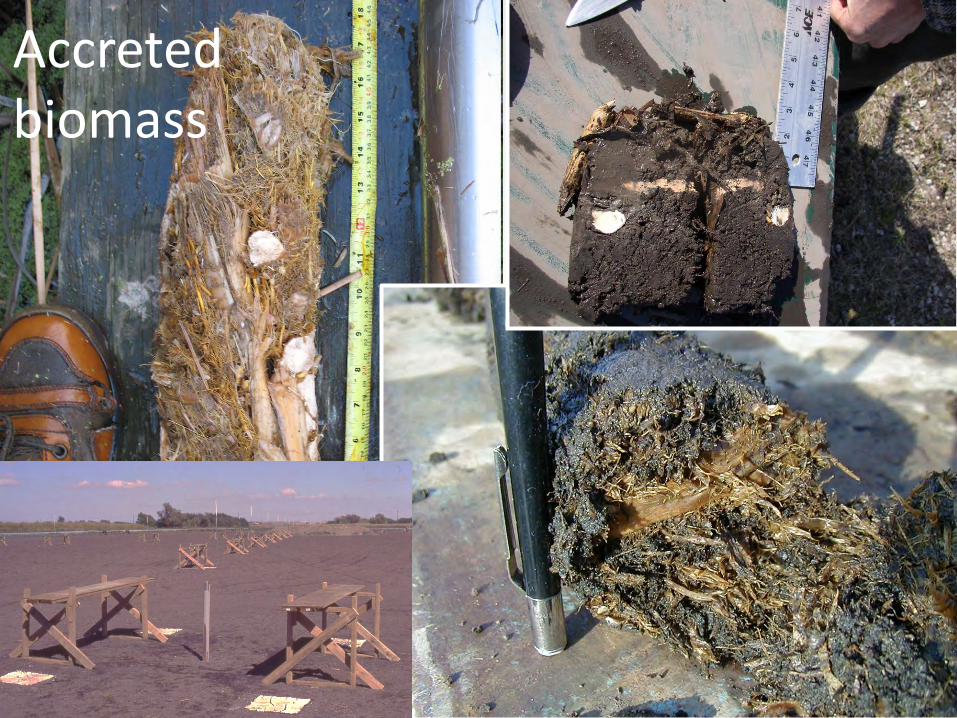
Accreted biomass
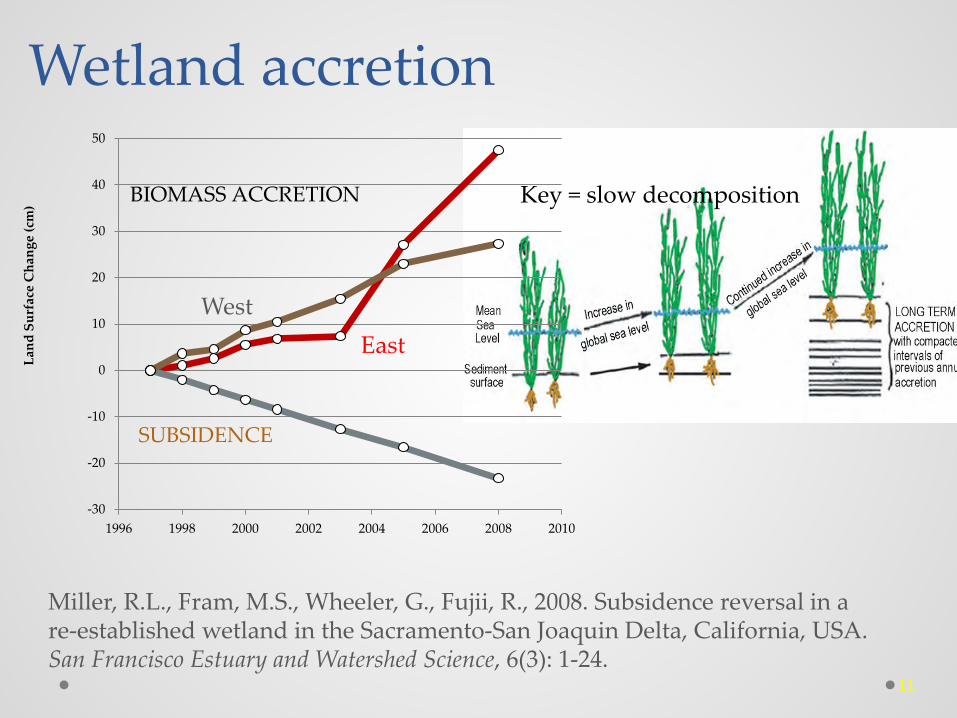
Wetland accretion
-30
-20
-10
0
10
20
30
40
50
1996 1998 2000 2002 2004 2006 2008 2010
Land
Sur
face
Cha
nge
(cm
) BIOMASS ACCRETION
SUBSIDENCE
East West
Miller, R.L., Fram, M.S., Wheeler, G., Fujii, R., 2008. Subsidence reversal in a re-established wetland in the Sacramento-San Joaquin Delta, California, USA. San Francisco Estuary and Watershed Science, 6(3): 1-24.
Key = slow decomposition
11
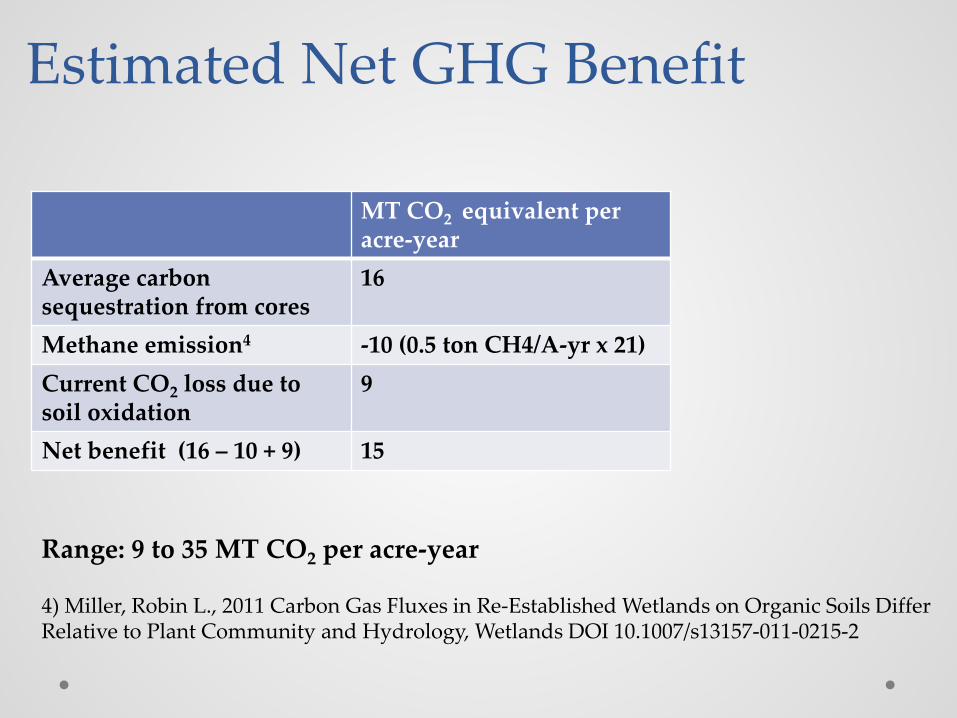
Range: 9 to 35 MT CO2 per acre-year 4) Miller, Robin L., 2011 Carbon Gas Fluxes in Re-Established Wetlands on Organic Soils Differ Relative to Plant Community and Hydrology, Wetlands DOI 10.1007/s13157-011-0215-2
Estimated Net GHG Benefit
MT CO2 equivalent per acre-year
Average carbon sequestration from cores
16
Methane emission4 -10 (0.5 ton CH4/A-yr x 21) Current CO2 loss due to soil oxidation
9
Net benefit (16 – 10 + 9) 15
-20
-10
0
10
20
30
40
50
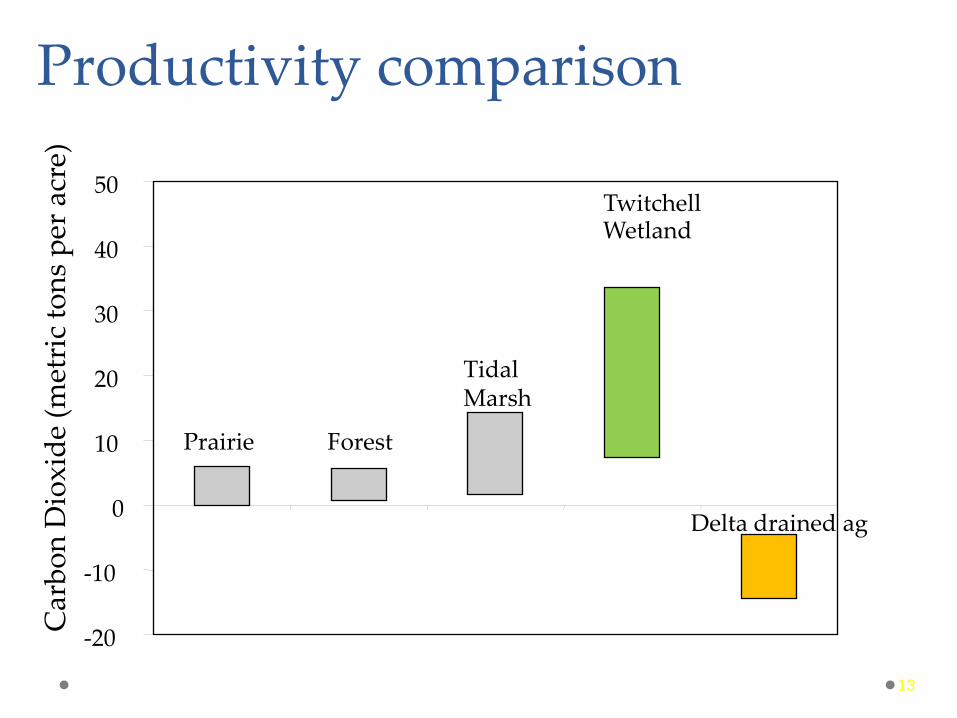
Prairie Forest
Tidal Marsh
Twitchell Wetland
Delta drained ag
Car
bon
Dio
xide
(met
ric
tons
per
acr
e)
Productivity comparison
13
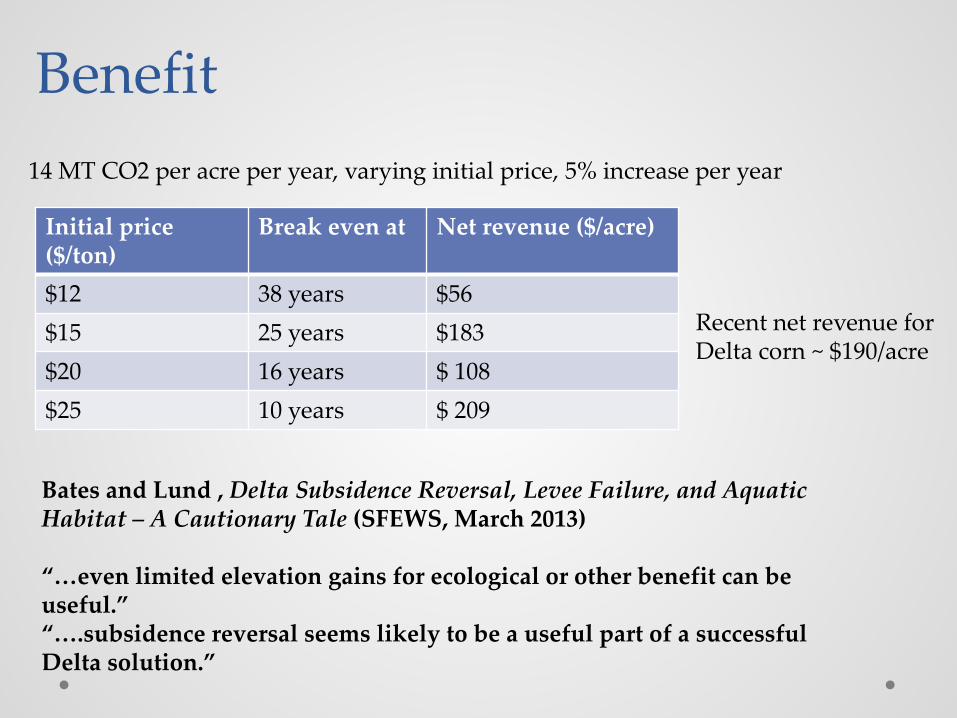
Benefit 14 MT CO2 per acre per year, varying initial price, 5% increase per year
Recent net revenue for Delta corn ~ $190/acre
Initial price ($/ton)
Break even at Net revenue ($/acre)
$12 38 years $56 $15 25 years $183 $20 16 years $ 108 $25 10 years $ 209
Bates and Lund , Delta Subsidence Reversal, Levee Failure, and Aquatic Habitat – A Cautionary Tale (SFEWS, March 2013) “…even limited elevation gains for ecological or other benefit can be useful.” “….subsidence reversal seems likely to be a useful part of a successful Delta solution.”
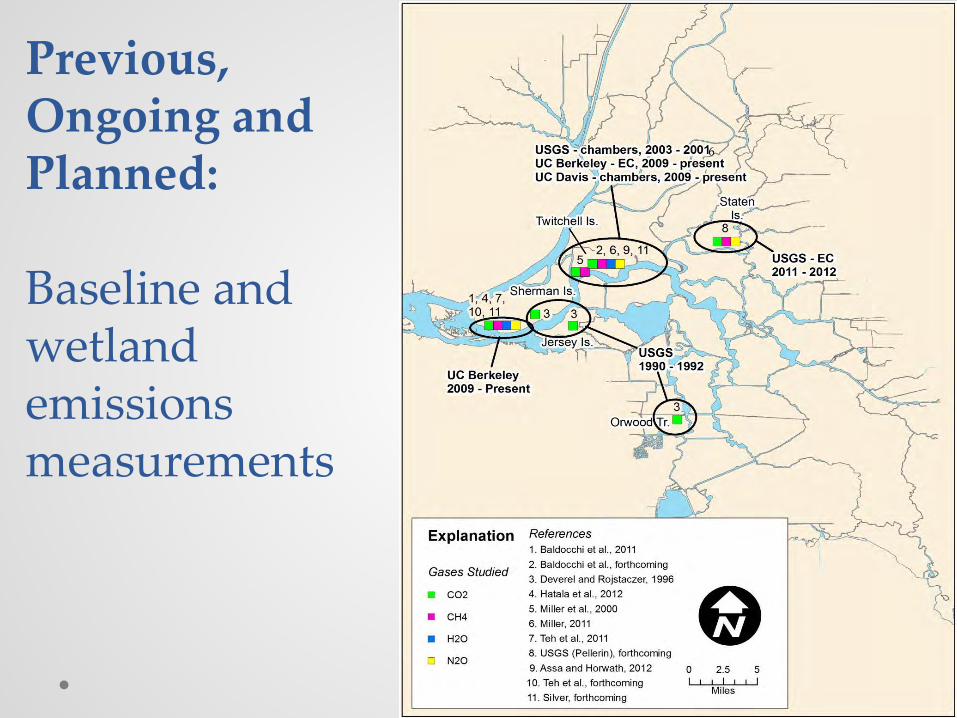
Previous, Ongoing and Planned: Baseline and wetland emissions measurements
6
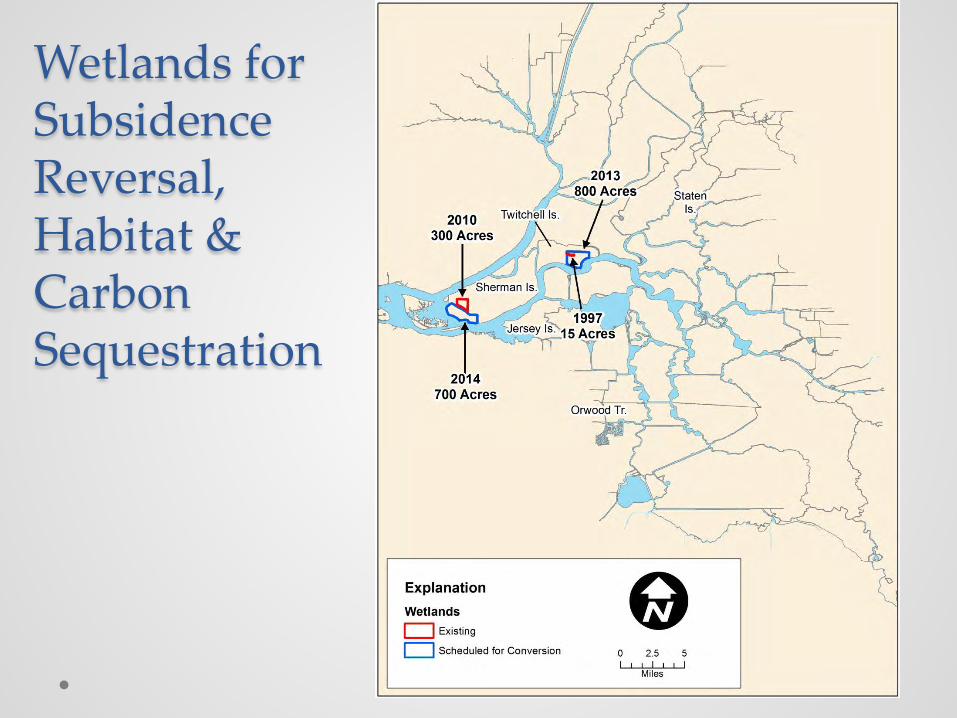
Wetlands for Subsidence Reversal, Habitat & Carbon Sequestration
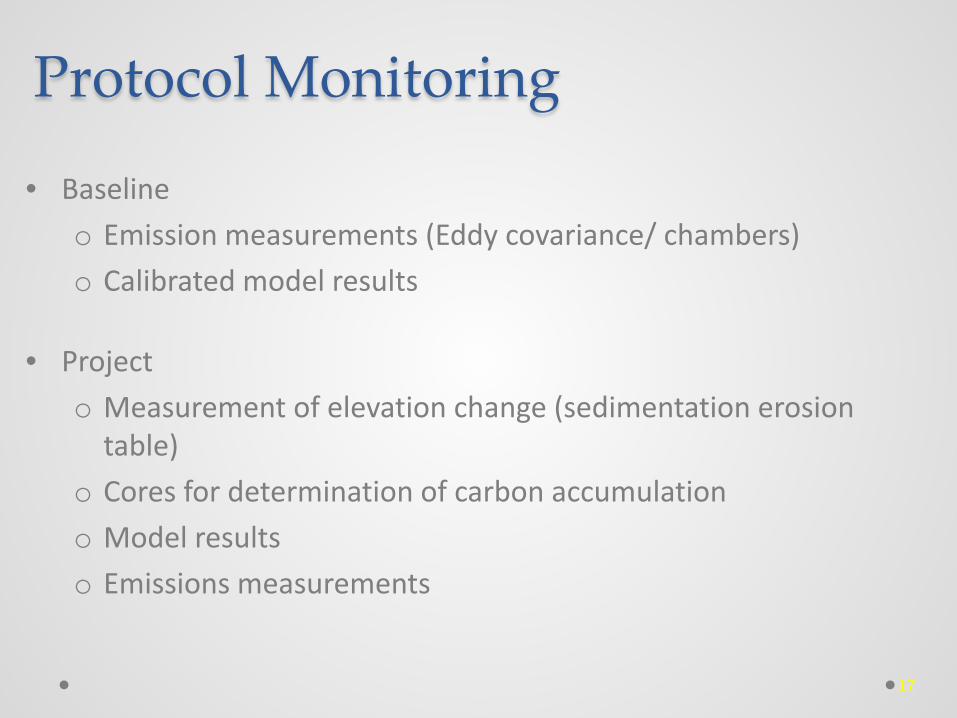
Protocol Monitoring
• Baseline o Emission measurements (Eddy covariance/ chambers) o Calibrated model results
• Project o Measurement of elevation change (sedimentation erosion
table) o Cores for determination of carbon accumulation o Model results o Emissions measurements
17
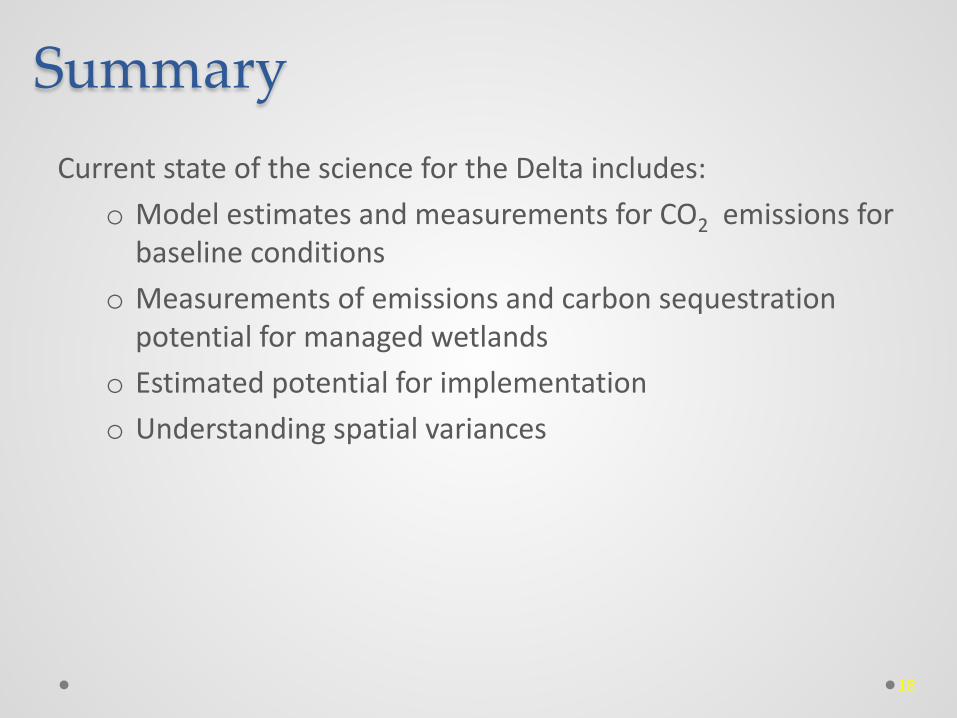
Summary Current state of the science for the Delta includes:
o Model estimates and measurements for CO2 emissions for baseline conditions
o Measurements of emissions and carbon sequestration potential for managed wetlands
o Estimated potential for implementation o Understanding spatial variances
18
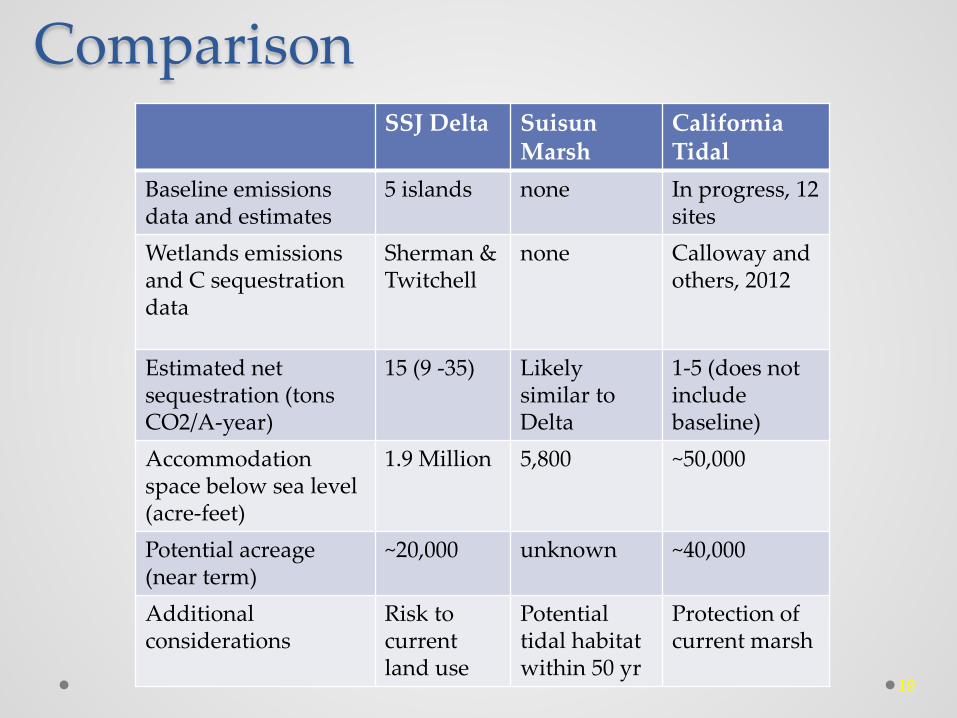
Comparison SSJ Delta Suisun
Marsh California Tidal
Baseline emissions data and estimates
5 islands none In progress, 12 sites
Wetlands emissions and C sequestration data
Sherman & Twitchell
none Calloway and others, 2012
Estimated net sequestration (tons CO2/A-year)
15 (9 -35) Likely similar to Delta
1-5 (does not include baseline)
Accommodation space below sea level (acre-feet)
1.9 Million 5,800 ~50,000
Potential acreage (near term)
~20,000 unknown ~40,000
Additional considerations
Risk to current land use
Potential tidal habitat within 50 yr
Protection of current marsh
19
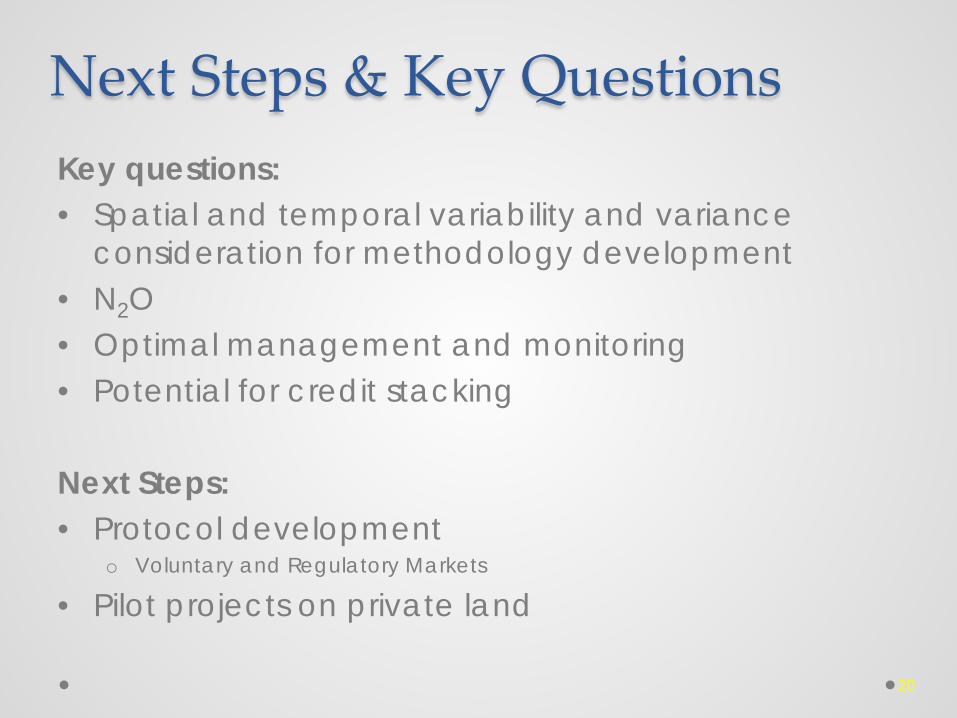
Next Steps & Key Questions Key questions: • Spatial and temporal variability and variance
consideration for methodology development • N2O • Optimal management and monitoring • Potential for credit stacking Next Steps: • Protocol development
o Voluntary and Regulatory Markets
• Pilot projects on private land
20
Restoration of Degraded Deltaic Wetlands of the Mississippi Delta
Protocol Development for Voluntary Market
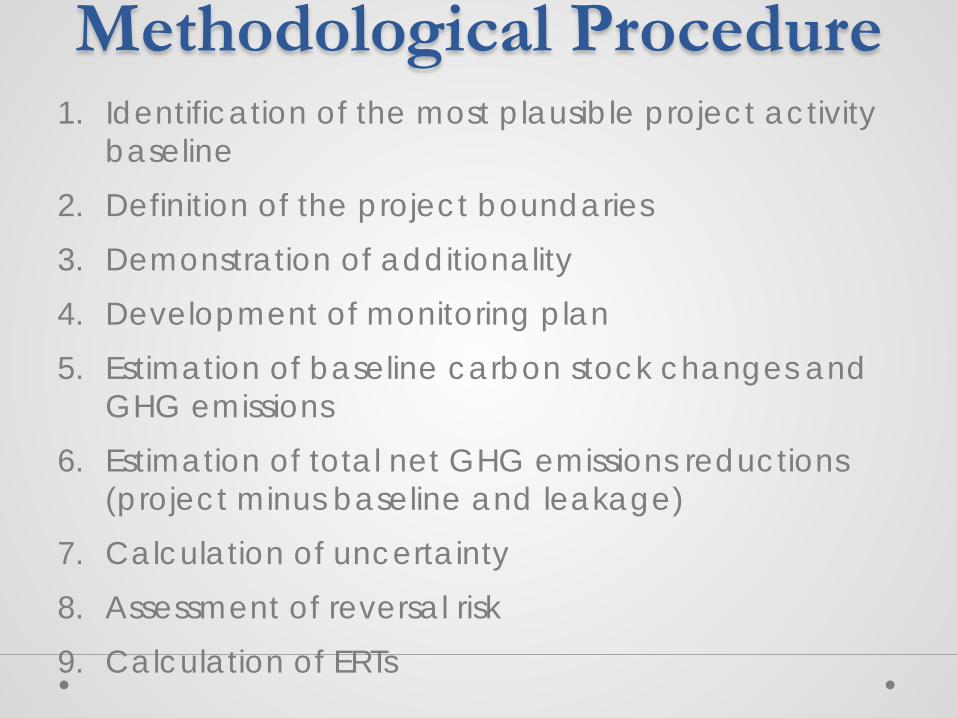
Methodological Procedure 1. Identification of the most plausible project activity
baseline 2. Definition of the project boundaries 3. Demonstration of additionality 4. Development of monitoring plan 5. Estimation of baseline carbon stock changes and
GHG emissions 6. Estimation of total net GHG emissions reductions
(project minus baseline and leakage) 7. Calculation of uncertainty 8. Assessment of reversal risk 9. Calculation of ERTs
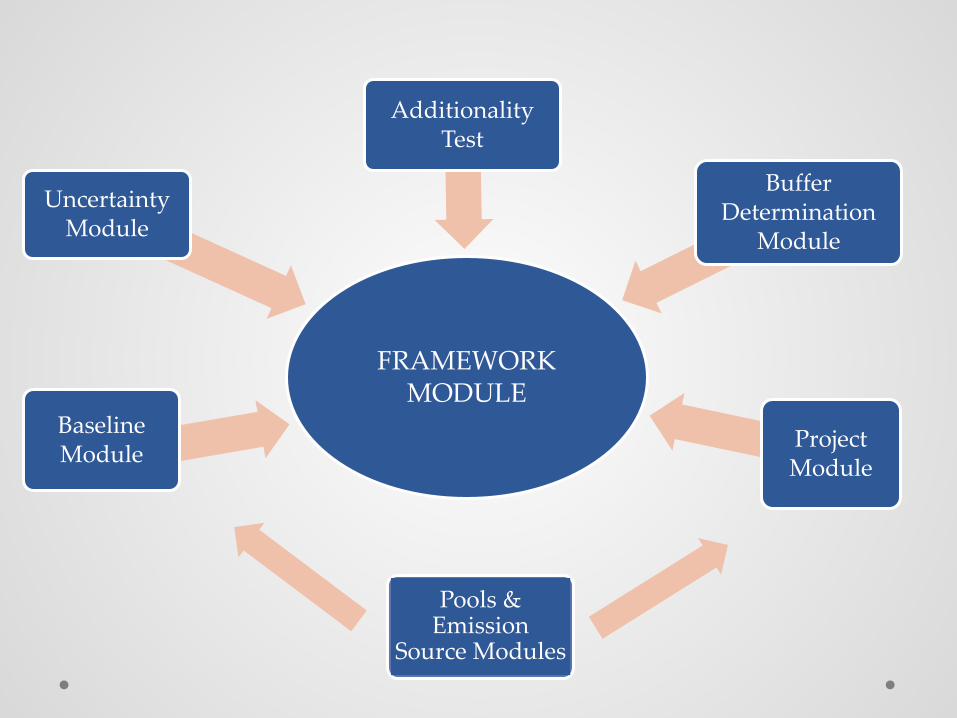
FRAMEWORK MODULE
Project Module
Additionality Test
Buffer Determination
Module
Baseline Module
Uncertainty Module
Pools & Emission
Source Modules
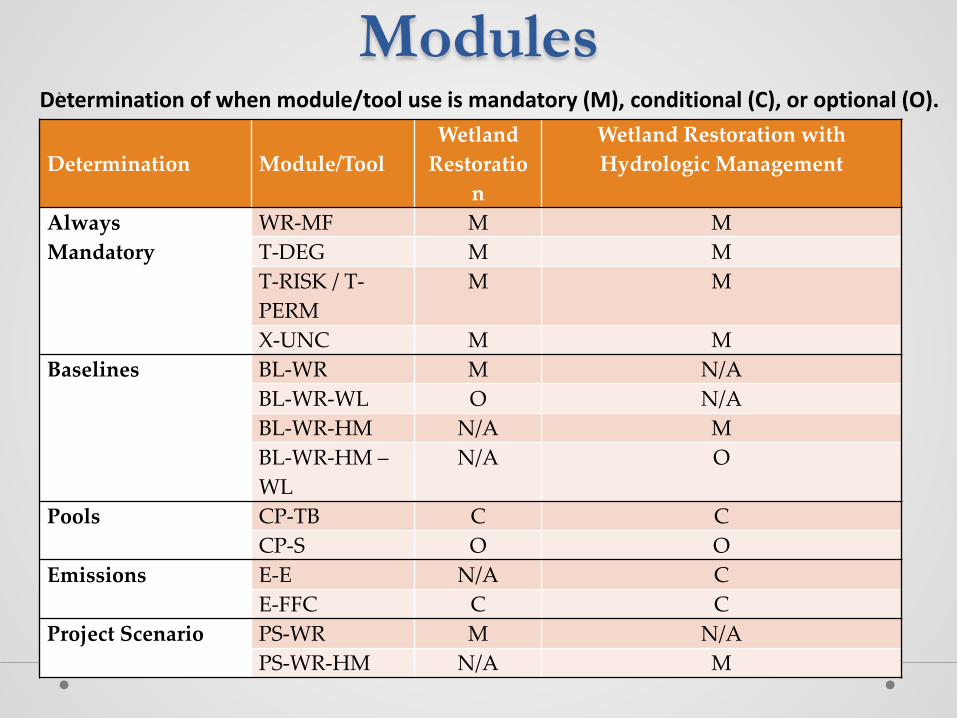
Modules
• Determination of when module/tool use is mandatory (M), conditional (C), or optional (O). Determination
Module/Tool
Wetland Restoratio
n
Wetland Restoration with Hydrologic Management
Always WR-MF M M Mandatory T-DEG M M T-RISK / T-
PERM M M
X-UNC M M Baselines BL-WR M N/A BL-WR-WL O N/A BL-WR-HM N/A M BL-WR-HM –
WL N/A O
Pools CP-TB C C CP-S O O Emissions E-E N/A C E-FFC C C Project Scenario PS-WR M N/A PS-WR-HM N/A M
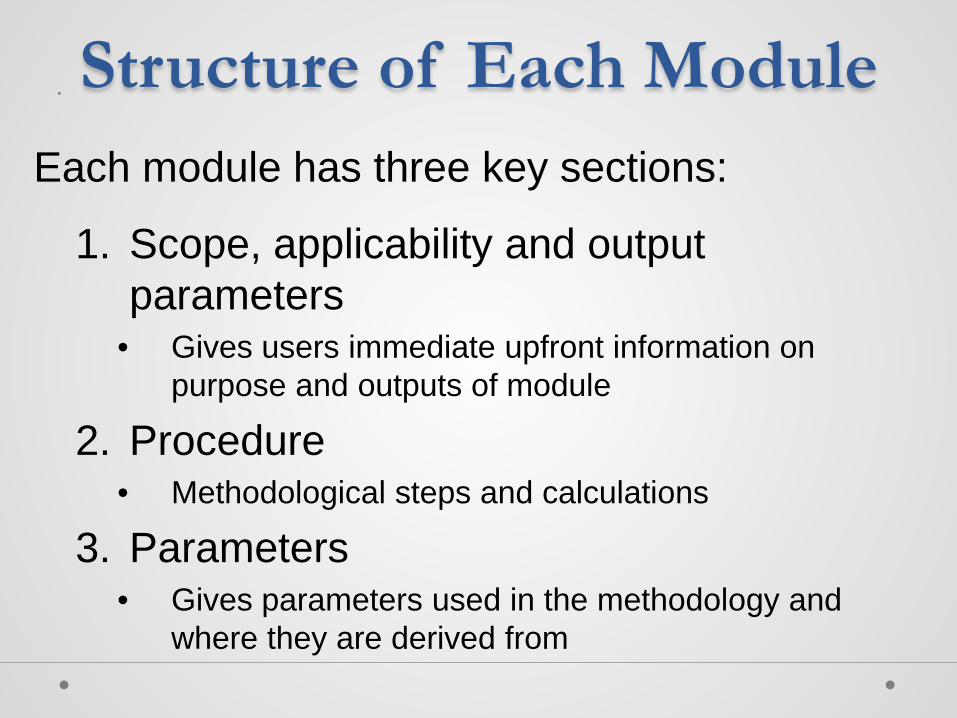
Structure of Each Module •
Each module has three key sections:
1. Scope, applicability and output parameters
• Gives users immediate upfront information on purpose and outputs of module
2. Procedure • Methodological steps and calculations
3. Parameters • Gives parameters used in the methodology and
where they are derived from
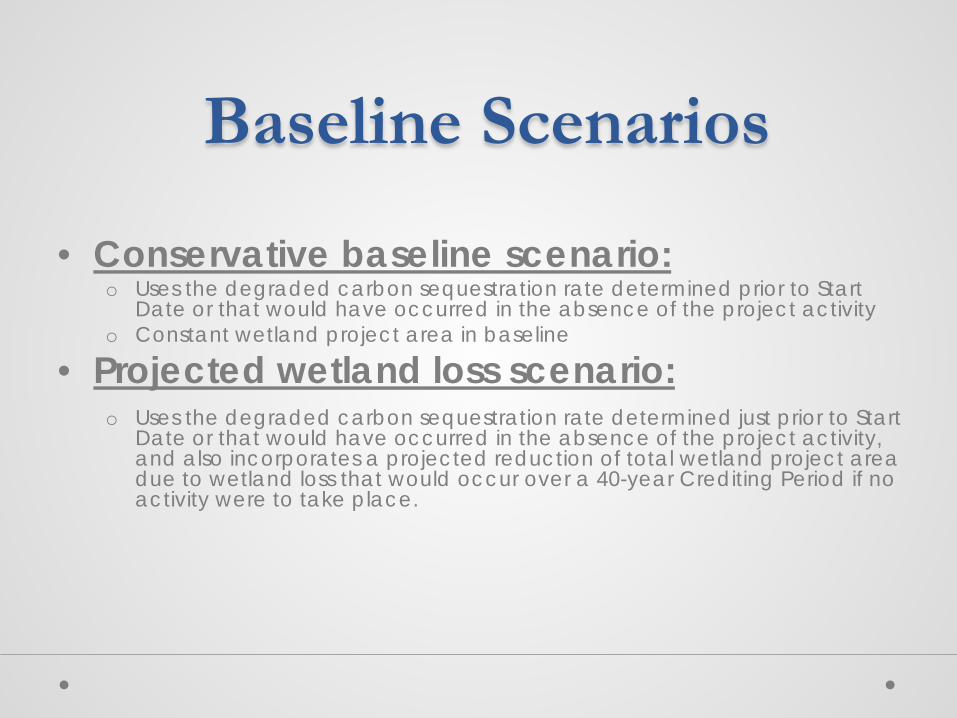
Baseline Scenarios
• Conservative baseline scenario: o Uses the degraded carbon sequestration rate determined prior to Start
Date or that would have occurred in the absence of the project activity o Constant wetland project area in baseline
• Projected wetland loss scenario:
o Uses the degraded carbon sequestration rate determined just prior to Start Date or that would have occurred in the absence of the project activity, and also incorporates a projected reduction of total wetland project area due to wetland loss that would occur over a 40-year Crediting Period if no activity were to take place.
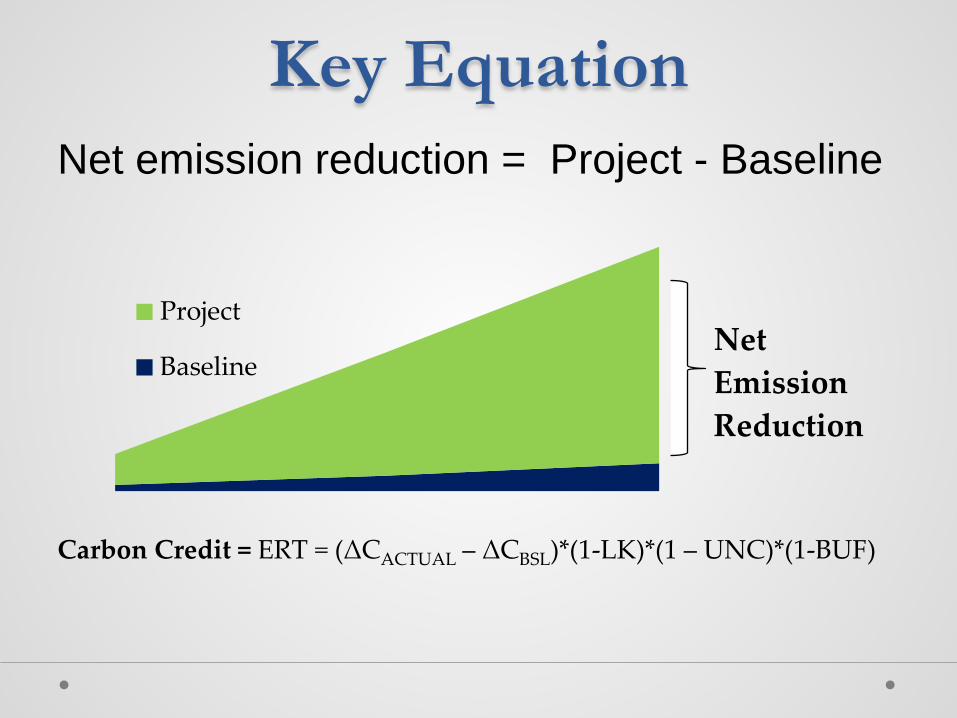
Key Equation Net emission reduction = Project - Baseline
Net Emission Reduction
Project
Baseline
Carbon Credit = ERT = (ΔCACTUAL – ΔCBSL)*(1-LK)*(1 – UNC)*(1-BUF)
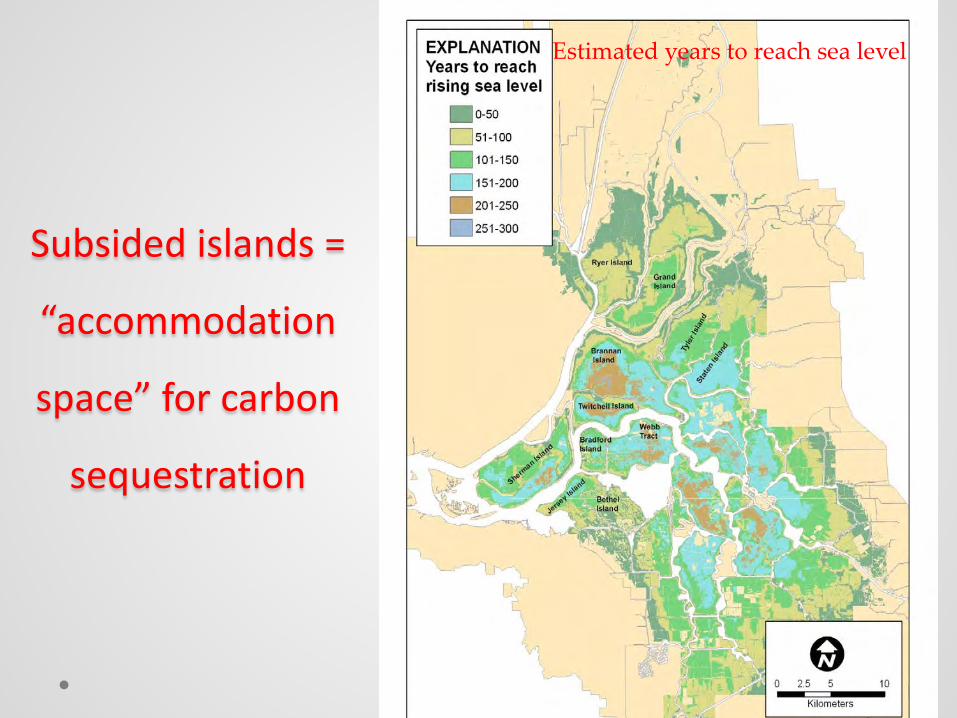
Subsided islands =
“accommodation
space” for carbon
sequestration
28
Estimated years to reach sea level
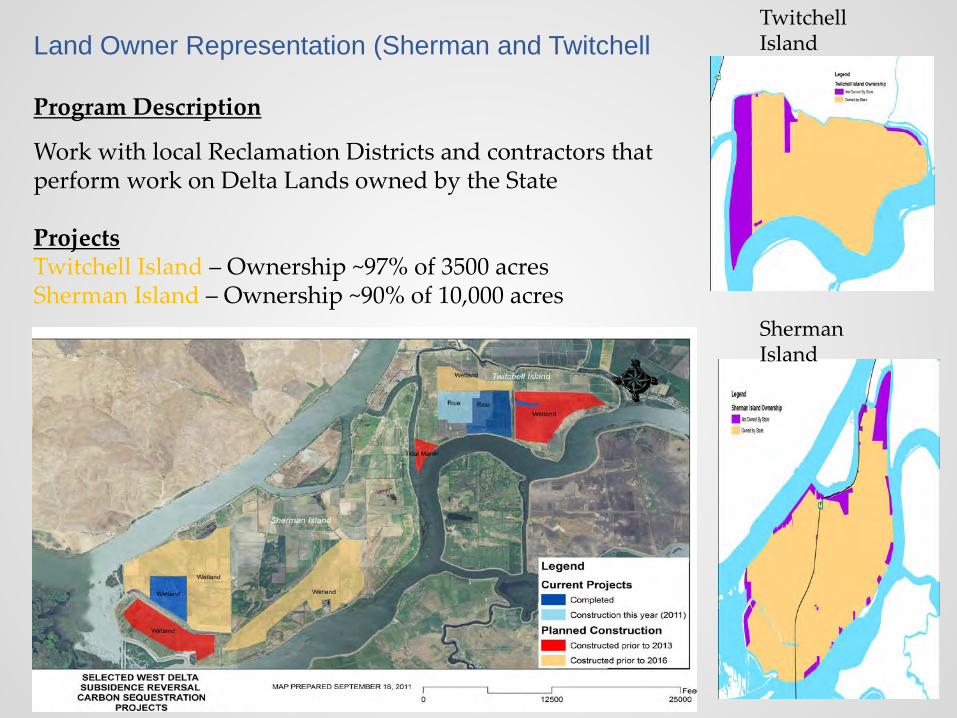
Land Owner Representation (Sherman and Twitchell
Program Description
Work with local Reclamation Districts and contractors that perform work on Delta Lands owned by the State Projects Twitchell Island – Ownership ~97% of 3500 acres Sherman Island – Ownership ~90% of 10,000 acres
Twitchell Island
Sherman Island
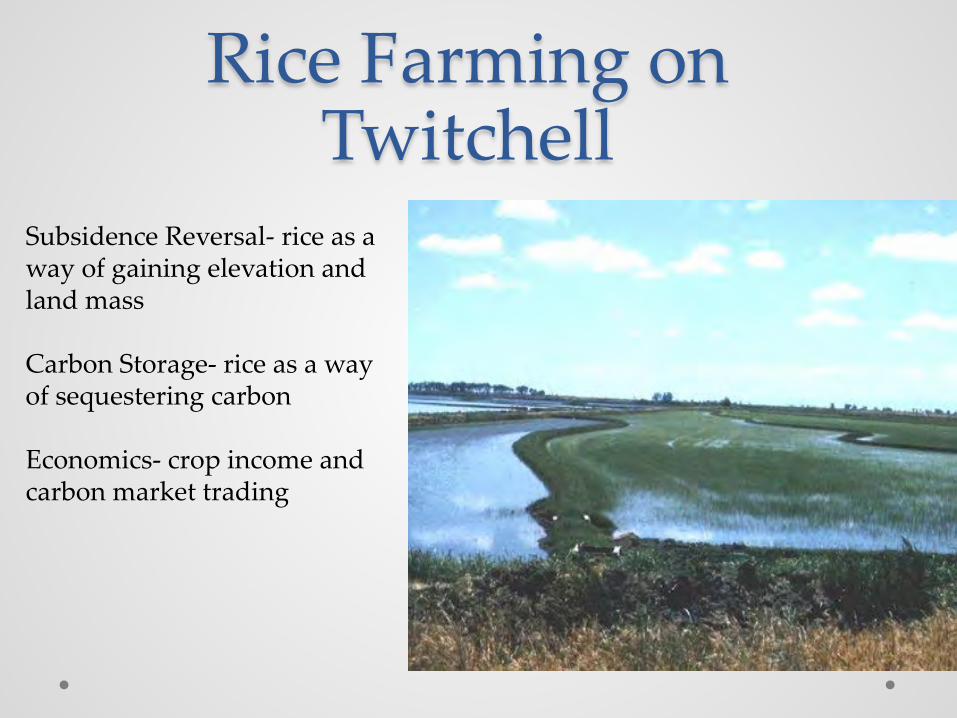
Rice Farming on Twitchell
Subsidence Reversal- rice as a way of gaining elevation and land mass Carbon Storage- rice as a way of sequestering carbon Economics- crop income and carbon market trading
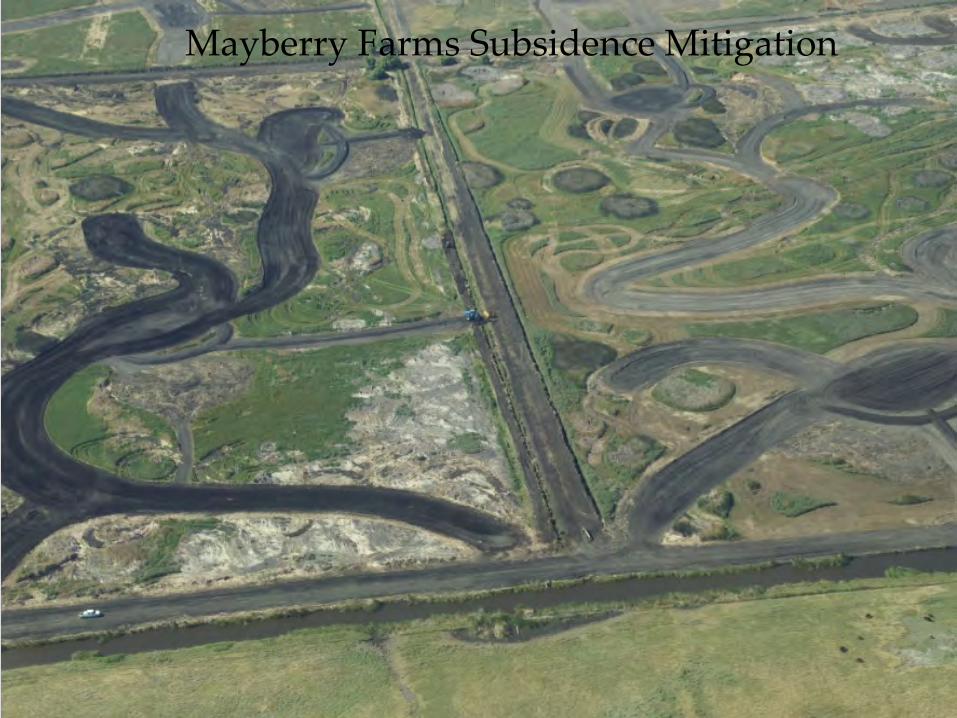
Mayberry Farms Subsidence Mitigation
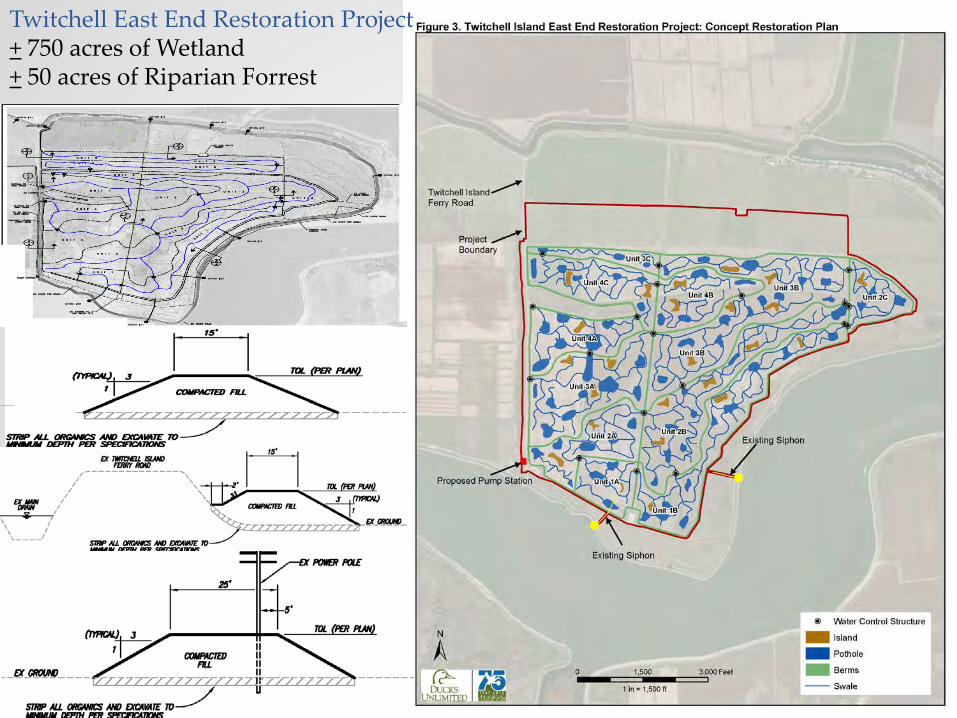
Twitchell East End Restoration Project + 750 acres of Wetland + 50 acres of Riparian Forrest
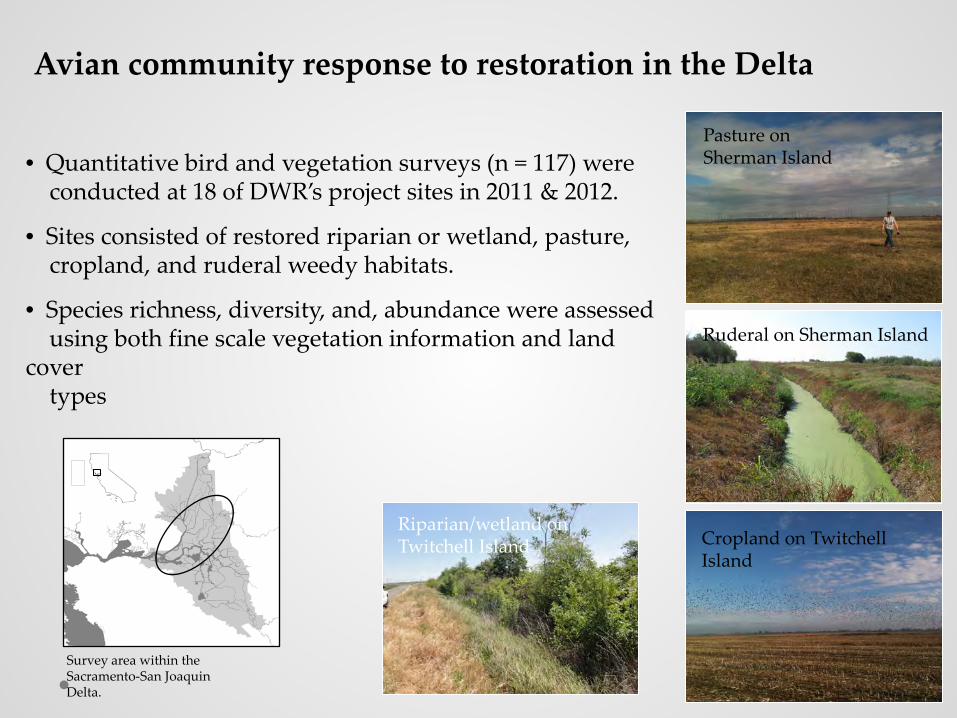
Survey area within the Sacramento-San Joaquin Delta.
Cropland on Twitchell Island
Ruderal on Sherman Island
Pasture on Sherman Island
Riparian/wetland on Twitchell Island
Avian community response to restoration in the Delta
• Quantitative bird and vegetation surveys (n = 117) were conducted at 18 of DWR’s project sites in 2011 & 2012.
• Sites consisted of restored riparian or wetland, pasture, cropland, and ruderal weedy habitats.
• Species richness, diversity, and, abundance were assessed using both fine scale vegetation information and land cover types
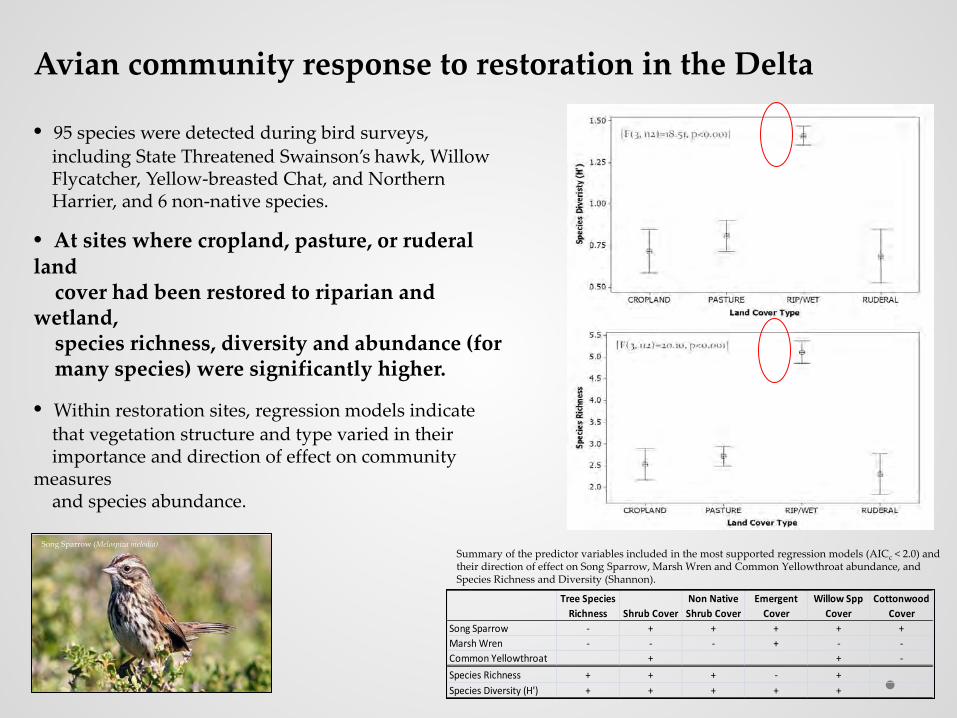
Avian community response to restoration in the Delta
• 95 species were detected during bird surveys, including State Threatened Swainson’s hawk, Willow Flycatcher, Yellow-breasted Chat, and Northern Harrier, and 6 non-native species.
• At sites where cropland, pasture, or ruderal land cover had been restored to riparian and wetland, species richness, diversity and abundance (for many species) were significantly higher.
• Within restoration sites, regression models indicate that vegetation structure and type varied in their importance and direction of effect on community measures and species abundance.
Tree Species Richness Shrub Cover
Non Native Shrub Cover
Emergent Cover
Willow Spp Cover
Cottonwood Cover
Song Sparrow - + + + + +Marsh Wren - - - + - -Common Yellowthroat + + -Species Richness + + + - +Species Diversity (H') + + + + +
Song Sparrow (Melospiza melodia) Summary of the predictor variables included in the most supported regression models (AICc < 2.0) and their direction of effect on Song Sparrow, Marsh Wren and Common Yellowthroat abundance, and Species Richness and Diversity (Shannon).
Questions?
Related Documents