Grand Valley State University ScholarWorks@GVSU Masters eses Graduate Research and Creative Practice 8-2014 Wetland Sediment Nutrient Flux in Response to Proposed Hydrologic Reconnection and Climate Warming James T. Smit Grand Valley State University Follow this and additional works at: hp://scholarworks.gvsu.edu/theses Part of the Biology Commons is esis is brought to you for free and open access by the Graduate Research and Creative Practice at ScholarWorks@GVSU. It has been accepted for inclusion in Masters eses by an authorized administrator of ScholarWorks@GVSU. For more information, please contact [email protected]. Recommended Citation Smit, James T., "Wetland Sediment Nutrient Flux in Response to Proposed Hydrologic Reconnection and Climate Warming" (2014). Masters eses. 733. hp://scholarworks.gvsu.edu/theses/733

Welcome message from author
This document is posted to help you gain knowledge. Please leave a comment to let me know what you think about it! Share it to your friends and learn new things together.
Transcript
Grand Valley State UniversityScholarWorks@GVSU
Masters Theses Graduate Research and Creative Practice
8-2014
Wetland Sediment Nutrient Flux in Response toProposed Hydrologic Reconnection and ClimateWarmingJames T. SmitGrand Valley State University
Follow this and additional works at: http://scholarworks.gvsu.edu/theses
Part of the Biology Commons
This Thesis is brought to you for free and open access by the Graduate Research and Creative Practice at ScholarWorks@GVSU. It has been acceptedfor inclusion in Masters Theses by an authorized administrator of ScholarWorks@GVSU. For more information, please [email protected].
Recommended CitationSmit, James T., "Wetland Sediment Nutrient Flux in Response to Proposed Hydrologic Reconnection and Climate Warming" (2014).Masters Theses. 733.http://scholarworks.gvsu.edu/theses/733
Wetland Sediment Nutrient Flux in Response to Proposed Hydrologic Reconnection and Climate Warming
James T. Smit
A Thesis Submitted to the Graduate Faculty of
GRAND VALLEY STATE UNIVERSITY
In
Partial Fulfillment of the Requirements
For the Degree of
Master of Science
Biology Department
August 2014

Acknowledgements
First, I sincerely and gratefully thank my graduate advisor, Dr. Al Steinman, for his
guidance, support, and encouragement. I also thank the members of my graduate committee, Drs.
Rick Rediske and Mark Luttenton, for their input and expertise in regards to my thesis project.
Additionally, I thank the faculty and staff of the Grand Valley State University Biology
Department and the Annis Water Resources Institute, as well as my fellow graduate students,
who have encouraged and challenged me, and have greatly enriched my time as a graduate
student. I also acknowledge and thank the Willbrandt family for permission to access the
property where the field work for my thesis was performed. Many thanks also go to Brian Scull,
Mary Ogdahl, Maggie Weinert, Dr. Geraldine Nogaro, Kurt Thompson, Jim O’Keefe, Anna
Harris, and David Boyer for their help in both the field and the lab. I am additionally grateful for
the statistical advice provided by Drs. Geraldine Nogaro, Megan Woller-Skar, and Carl Ruetz.
Funding for my project was provided by NASA and the Michigan Space Grant Consortium, Dr.
Al Steinman, the Grand Valley State University Presidential Research Grant, a gift from
Rivertown Resin Recycling Inc., and through an AWRI Graduate Research Assistantship. I also
humbly thank my undergraduate advisor Dr. Randal Johnson and the faculty of the Olivet
Nazarene University Biology Department to which I owe my sincere gratitude for their work in
laying the foundation for the scientist and person that I am today. Finally, I would like to thank
my wonderful family and my lovely fiancée Amanda Mazzaro, as they are all so extremely
important to me, and have supported and encouraged me through this and so many other steps in
my life.
3
Abstract
Wetland Sediment Nutrient Flux in Response to Proposed Hydrologic Reconnection and Climate Warming
By James T. Smit
Wetland restoration and creation are common practices, but wetlands restored or created
on former agricultural land may act as a source of nutrients, rather than as a sink. I studied P
sediment-water exchange in two flooded celery fields (west and east), which are designated for
wetland restoration, in order to assess the effects that hydrologic reconnection of the area to an
adjacent creek would have on P dynamics. We also examined the influence of climate change,
specifically warming temperatures, by conducting the sediment-water exchange experiments at
ambient and plus 2°C temperature conditions. Lab-based sediment core incubations revealed that
TP release rates were significantly larger when sediment from the west pond was flooded with
water from the creek (~40-60 mg m-2 d-1), simulating reconnection, than when west pond
sediment was flooded with water from the same pond (~6-20 mg m-2 d-1), simulating the current
condition. Increasing ambient water temperatures by 2°C did not produce a consistently
significant effect on P release rates from west pond sediment. Additionally, I did not observe a
consistently significant effect of flooding or increased temperature on the release of N from west
pond sediment. There was no consistently significant effect of flooding with creek water or
increased temperature on east pond sediment N and P release, although the sediments still served
as a net source of P, with release rates of ~2.2-4.73 mg TP m-2 d-1. The difference in response
between the two ponds may have been due to prior dredging in the east pond, but not in the west.
The results of this study showed that wetlands converted from agricultural areas can potentially
4

act as a significant source of P to downstream locations. Overall, the effects of warming on
nutrient dynamics were much less pronounced than effects related to prior land use.
5

Table of Contents
List of Tables...................................................................................................................................7 List of Figures..................................................................................................................................9 Chapter I. Introduction........................................................................................................................11
Wetlands loss and restoration.................................................................................13 Eutrophication........................................................................................................14 Climate change.......................................................................................................16 Conclusion..............................................................................................................17 My work.................................................................................................................19 Literature cited.......................................................................................................22
II. Wetland Sediment Nutrient Flux in Response to Proposed Hydrologic Reconnection and
Climate Warming...............................................................................................................29 Introduction...........................................................................................................29 Materials and methods...........................................................................................31 Study area..........................................................................................................31 Experimental design..........................................................................................35 Field sampling and procedure...........................................................................35 Laboratory procedure........................................................................................37 Analysis.............................................................................................................40 Results....................................................................................................................41 Water column and sediment analysis................................................................41 Change in nutrient concentration during incubation.........................................35 Maximum apparent nutrient release rate..........................................................54 Maximum concentration increase.....................................................................60 Discussion..............................................................................................................64 Conclusions............................................................................................................72 Literature cited.......................................................................................................73
III. Conclusions and Synthesis.................................................................................................80
Changes in hydrology............................................................................................81 Changes in climate.................................................................................................89 Potential solutions..................................................................................................92 Summary................................................................................................................94 Literature cited.......................................................................................................98
6

List of Tables
Table Page 2.1 Experimental parameters for experiments conducted in July and October.......................36 2.2 Summary of mean (±SE, n=6) YSI readings of temperature, dissolved oxygen (DO), pH,
specific conductivity (SpCond), and chlorophyll a (Chl a), measured in the field in July and October in the west and east ponds at the time of core collection. P-values represent the results of comparisons between west and east ponds using a t-test (t) or Mann-Whitney Rank Sum Test (r). Significant differences are in bold.......................................43
2.3 Summary of mean (±SE, n=6) sediment Ca, Al, Fe, Mg, organic matter (OM), total N,
total P measured in July and October in the west and east ponds. P-values represent the results of comparisons between west and east ponds using a t-test (t) or Mann-Whitney Rank Sum Test (r). Significant differences are in bold.....................................................44
2.4 Water quality constituents measured in the initial re-flood water in the lab before being
added to the sediment cores. Variables were measured once per location per date..........48 2.5 Two-way repeated measures ANOVA (a), results on concentration of TP, SRP, NH3-N,
and NO3-N measured over time in the surface water in experimental sediment cores in July and October experiments. Asterisk (*) indicates the results of exploratory ANOVA analyses. Significant effects are in bold.............................................................................53
2.6 Comparison of the mean (±1 SE, n=6) maximum apparent release rates of TP, SRP, NH3-
N, and NO3-N in July and October for west and east pond sediment cores under the various treatment combinations (temperature: water source)............................................58
2.7 Blocked two way ANOVA results for TP, SRP, NH3-N, and NO3-N maximum apparent
release rates depending on water source and temperature treatments. Significant effects are in bold..........................................................................................................................59
2.8 Comparison of the mean (±1 SE, n=6) maximum concentration increases of TP, SRP,
NH3-N, and NO3-N in July and October for west and east pond sediment cores under the various treatment combinations.........................................................................................62
2.9 Blocked two way ANOVA results for TP, SRP, NH3-N, NO3-N and maximum
concentration increases depending on water source and temperature treatments. Significant effects are in bold............................................................................................63
3.1 Summary of results illustrating the additional TP load that would be added to Bear Lake
once Bear Creek is reconnected to the west pond when considering a range of: average release rates; average daily loads; period of loading; and percent of the load reaching Bear Lake...........................................................................................................................85
7

3.2 Summary of results illustrating the additional TP load that would be added to Bear Lake once Bear Creek is reconnected to the east pond when considering a range of: average release rates; average daily loads; period of loading; and percent of the load reaching Bear Lake...........................................................................................................................86
8

List of Figures
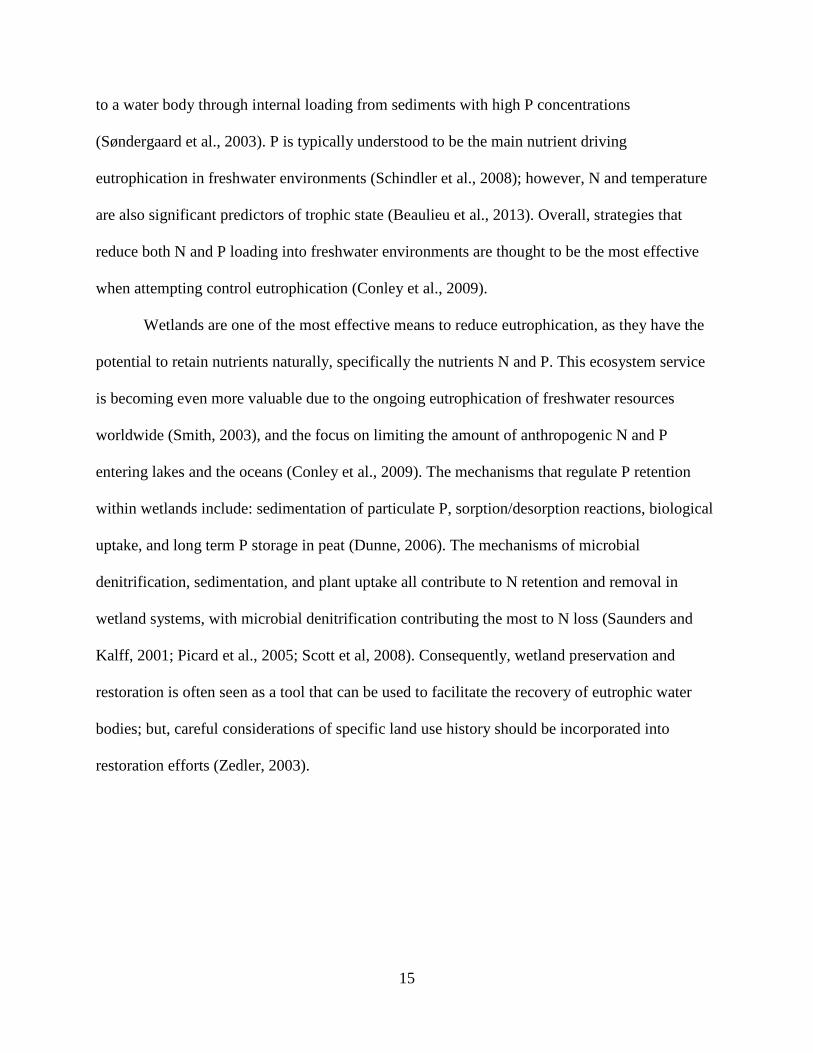
Figure Page 1.1 Conceptual model displaying the various drivers, stressors, processes, ecological
outcomes, and societal outcomes which together impact our definition and determination of water quality..................................................................................................................18
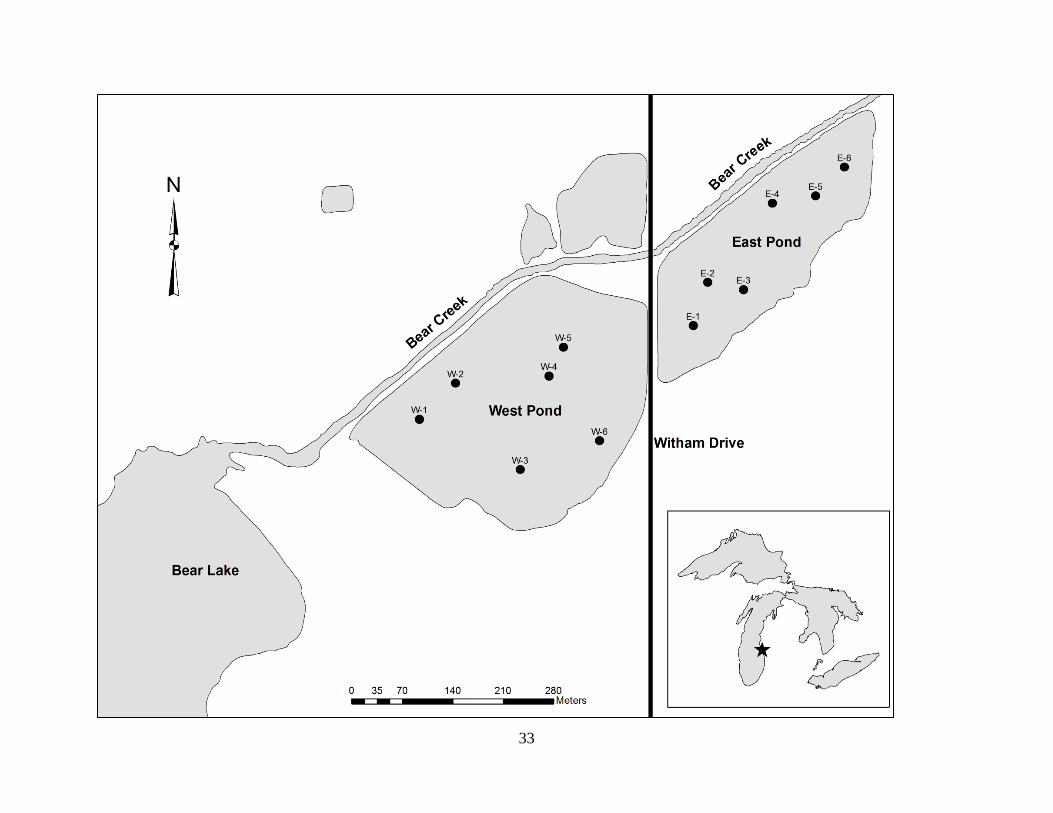
2.1 Bear Lake Wetland Restoration Area sampling locations in Muskegon, MI. Filled circles
indicate the sampling locations within each pond. Bear Creek flow is from east to west. Inset: location of the Bear Lake Wetland Restoration Area within the Laurentian Great Lakes Region.....................................................................................................................33
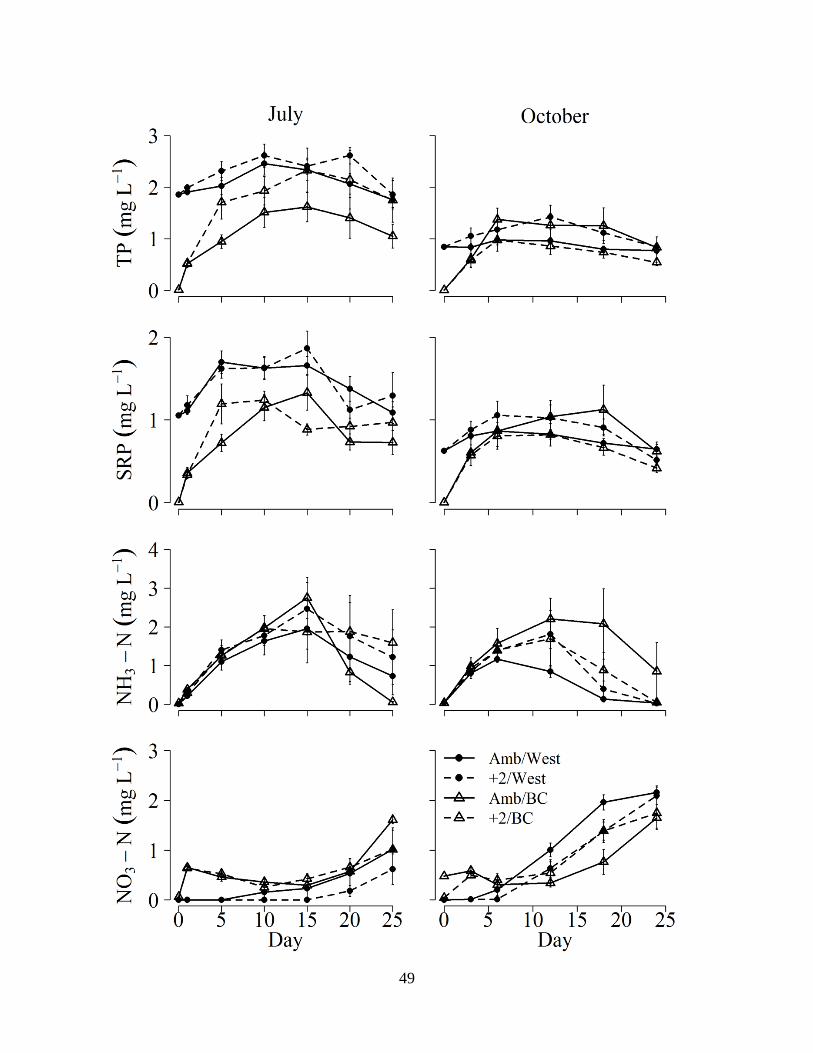
2.2 Mean (± 1SE, n=6) TP, SRP, NH3-N, and NO3-N concentrations measured in the surface
water of the west pond sediment cores for the four treatment combinations (temperature: water source) over the incubation period. Amb/West, ambient temperature west pond water; +2/west, +2°C temperature west pond water; Amb/BC, ambient temperature Bear Creek water; +2/BC, +2°C temperature Bear Creek water................................................49
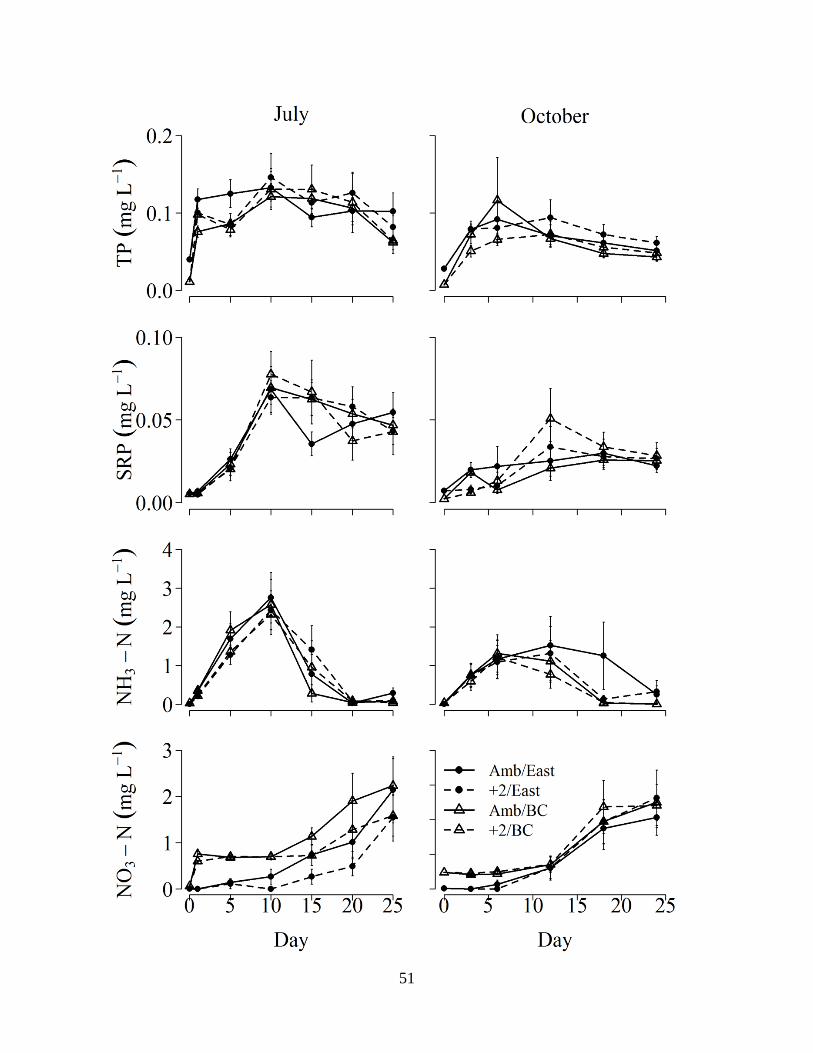
2.3 Mean (± 1 SE, n=6) TP, SRP, NH3-N, and NO3-N concentrations measured in the surface
water of the east pond sediment cores for the four treatment combinations (temperature: water source) over the incubation period. Amb/East, ambient temperature east pond water; +2/East, +2°C temperature east pond water; Amb/BC, ambient temperature Bear Creek water; +2/BC, +2°C temperature Bear Creek water................................................51
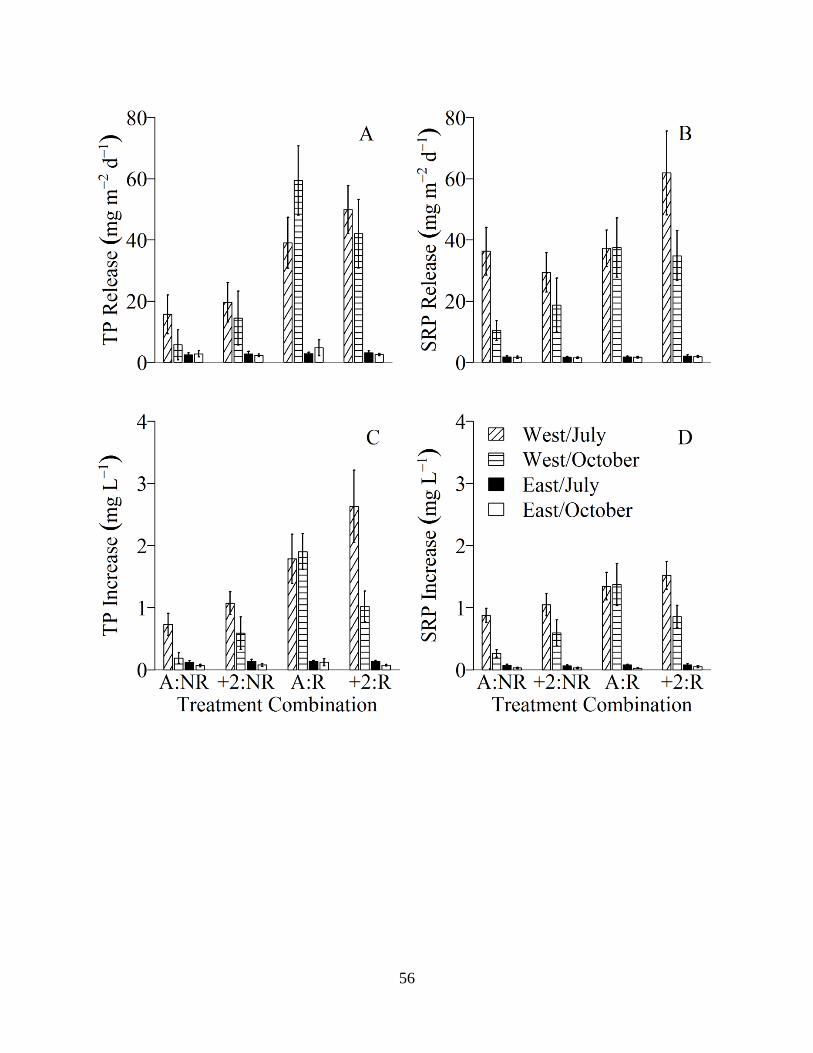
2.4 Mean (±1 SE, n=6) maximum apparent TP (total phosphorus) (A) and SRP (soluble
reactive phosphorus) (B) release rates from west and east field sediment to the water column, and maximum TP (C) and SRP (D) increases in west and east field sediment core water columns. Results represent the four treatment (temperature: water source) combinations simulating hydrologic reconnection and climate warming from both the July and October experiment in the west and east field. A= ambient temperature; +2= +2°C temperature; NR= no reconnection water treatment, R= reconnection water treatment. Reconnection indicates Bear Creek water source treatment for the west and east field; no reconnection indicates west field water source treatment for west field sediment, and east field water source treatment for east field sediment............................56
3.1 Conceptual model diagraming the various questions that should be addressed as part of
environmental restoration efforts, as well as whether those questions fit under the umbrella and responsibility of scientific research, or as part of the socio-economic concerns of the project.......................................................................................................97
9
Symbols and Abbreviations
P, phosphorus; N, nitrogen; NO3-N, nitrate; NH3-N, ammonia; SO4, sulfate; Cl, chloride; TP,
total phosphorus; SRP, soluble reactive phosphorus; OM, organic matter; DO, dissolved oxygen
concentration; ORP, oxidation/reduction potential; SpCond, specific conductivity; chl a,
chlorophyll a; total N, total nitrogen; Ca, calcium; Fe, iron; Mg, magnesium; Al, aluminum;
AFDM, ash free dry mass.
10
Chapter I
Introduction
The quality of freshwater resources is one of the paramount issues facing the world
today. Water quality refers not only to the biological, chemical, and physical characteristics of
water, but also the condition of water relative to human needs. High quality renewable fresh
water is essential for human life and societal well-being, and in addition to the fundamental
provision of drinking water, fresh water supports large scale industry, irrigation, flood control,
hydroelectric power, recreation, agriculture, and habitat for plant and animal life (Jackson et al.,
2001; Baron et al., 2002). Yet, large scale human activities such as agriculture, fossil fuel
combustion, and land development (Crutzen, 2002) have negatively impacted water quality
through eutrophication (Smith, 2003), wetlands loss (Millennium Ecosystem Assessment, 2005),
and climate change (Schindler, 2001).
Eutrophication, or the over enrichment of water bodies due to the input of excessive
nutrients, negatively impacts the quality and usability of freshwater by stimulating harmful algal
blooms, depleting hypolimnetic oxygen concentrations, and decreasing the amount of suitable
area for wildlife habitat (Bennett et al., 2001). It is one of the leading stressors of water quality in
the United States (US EPA, 1996), and eutrophication results in a cost of approximately 2.2
billion dollars annually when calculating financial losses related to recreational water usage,
waterfront real estate, spending on recovery of threatened and endangered species, and drinking
water (Dodds et al., 2009). Wetlands are typically thought to improve water quality through
multiple beneficial ecosystem services (Millennium Ecosystem Assessment, 2005), and lessen
the impacts of eutrophication (Verhoeven et al., 2006) by retaining nutrients such as nitrogen (N)
11
and phosphorus (P) in 1) plant biomass, 2) accreted organic matter, and 3) insoluble mineral
compounds (Reddy and DeLaune, 2004). Despite these benefits, approximately half of the
historic wetlands in the US have been lost (Mitsch and Gosselink, 2007), as well as nearly two
thirds of the historic wetlands in the states surrounding the Great Lakes (Dahl, 1990). In
response, numerous wetland restoration projects have been initiated, with many of these projects
occurring on former agricultural land (Zedler, 2003). Despite the intent of these projects,
wetlands constructed on former agricultural land can negatively impact water quality, and
contribute to eutrophication due to the presence of legacy nutrients in the soil (Pant and Reddy,
2003; Steinman and Ogdahl, 2011). Furthermore, increasing temperatures due to climate change
have the potential to enhance eutrophication (Townsend et al., 2012), promote blooms of
cyanobacteria (Paerl and Huisman, 2008), threaten wetland sustainability (Millennium
Ecosystem Assessment, 2005), and alter wetland biogeochemistry (Erwin, 2009). Changes in
traditional weather patterns and hydrology due to climate change also are expected to negatively
impact water quality (Mortsch and Quinn, 1996; Schindler et al., 1996)
The impacts of eutrophication, wetlands loss and restoration, and climate change not only
have created separate and distinct environmental issues in regards to freshwater environments,
but also issues that interact with and contribute to one another. These problems influence the
ecological integrity of freshwater environments, as well as the ability of freshwater to meet the
various requirements of humanity. Overall, the combined impact of these issues is a decrease in
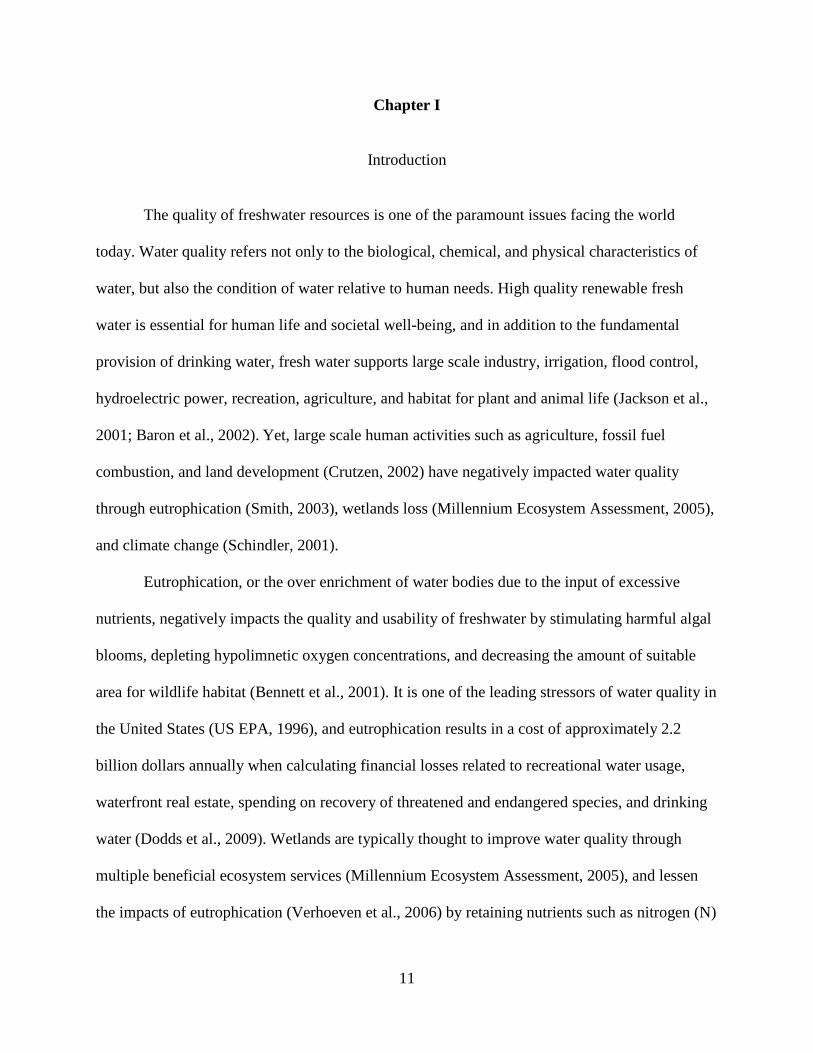
water quality (Figure 1.1). Thus, in order to understand water quality and the steps that can be
taken to protect and improve it, it is important to examine the effects and interactions of wetlands
loss and restoration, eutrophication, and climate change.
12
Wetlands loss and restoration
Wetlands provide many important ecosystem services that enhance water quality, such as
contaminant removal and the retention of N, P, carbon, and sediment (Millennium Ecosystem
Assessment, 2005; Verhoeven et al. 2006). Additionally, wetlands sustain biodiversity, mitigate
flooding, and provide essential habitats for spawning fish and other organisms (Kusler et al.,
1994). In spite of these benefits, wetlands have been dredged, drained, and filled throughout
history in support of agricultural production and land development to support population growth
(Gibbs, 2000). In total, approximately 53% of the wetlands in the United States were lost
between the years of 1780 and 1980 (Mitsch and Gosselink, 2007), with some states, such as
California and Ohio, losing approximately 90% of their historic wetland acreage (USDA, 2012).
Specifically considering the eight states surrounding the Great Lakes, an average of 65% of
historic wetland area has been lost since 1780 (Dahl, 1990).
In response to the vast amount of historic wetland loss and the associated loss of their
beneficial ecosystem services, many wetland restoration and creation projects have been
initiated. Since 1988, aquatic ecosystem regulations in the United States have been focused on
achieving a goal of “no net loss” of wetland area and function (Gosselink, 2002). Governmental
policies that were put in place to protect wetlands from development include Section 404 of the
U.S. Clean Water Act, which protects wetland resources by requiring avoidance, minimization,
and compensation of impacts to wetlands (National Research Council, 2001). Additionally,
government programs such as the Wetlands Reserve Program provide financial incentives to
encourage landowners to turn frequently flooded, marginal agricultural land into wetland
conservation easements (USDA, 2012). These policies help to retain and restore the ecosystem
13
services provided by wetlands, as well as increase land value proximal to wetland areas (Kaza
and BenDor, 2013).
The practice of restoring wetlands on farmland is seen as an environmentally prudent
endeavor; however, issues can arise when considering the specific land use history, and
water/sediment dynamics of these areas. Where wetlands are restored on soil that was farmed, it
is perhaps inevitable that there will be an initial period of equilibration (Aldous et al., 2005)
when the sediments act as a source of nutrients instead of as a sink (Newman and Pietro, 2001).
Thus, in the short term, nutrients from past agricultural practices may be transferred to the water
after re-flooding (Lindenberg and Wood, 2009). This effect is counteractive to the one of the
main goals of wetland restoration and can exacerbate issues that negatively impact water quality
such as eutrophication.
Eutrophication
Eutrophication is another process that negatively impacts water quality, and can be
influenced by wetlands loss and restoration. Eutrophication is defined as the process by which
water bodies become more productive through increased input of nutrients (Welch and Jacoby,
2004), such as N and P. This process decreases water quality by increasing algal biomass,
shifting algal community composition to bloom forming species and potentially toxic
cyanobacteria, depleting water column dissolved oxygen through increased microbial respiration,
and decreasing fish production (Smith, 2003). Anthropogenic sources of N include agricultural
runoff (Nosengo, 2003), wastewater discharge, and atmospheric deposition (Rabalais, 2002). P
also is found in agricultural runoff and wastewater discharges; however, P can also be supplied
14
to a water body through internal loading from sediments with high P concentrations
(Søndergaard et al., 2003). P is typically understood to be the main nutrient driving
eutrophication in freshwater environments (Schindler et al., 2008); however, N and temperature
are also significant predictors of trophic state (Beaulieu et al., 2013). Overall, strategies that
reduce both N and P loading into freshwater environments are thought to be the most effective
when attempting control eutrophication (Conley et al., 2009).
Wetlands are one of the most effective means to reduce eutrophication, as they have the
potential to retain nutrients naturally, specifically the nutrients N and P. This ecosystem service
is becoming even more valuable due to the ongoing eutrophication of freshwater resources
worldwide (Smith, 2003), and the focus on limiting the amount of anthropogenic N and P
entering lakes and the oceans (Conley et al., 2009). The mechanisms that regulate P retention
within wetlands include: sedimentation of particulate P, sorption/desorption reactions, biological
uptake, and long term P storage in peat (Dunne, 2006). The mechanisms of microbial
denitrification, sedimentation, and plant uptake all contribute to N retention and removal in
wetland systems, with microbial denitrification contributing the most to N loss (Saunders and
Kalff, 2001; Picard et al., 2005; Scott et al, 2008). Consequently, wetland preservation and
restoration is often seen as a tool that can be used to facilitate the recovery of eutrophic water
bodies; but, careful considerations of specific land use history should be incorporated into
restoration efforts (Zedler, 2003).
15
Climate change
Climate change represents an additional environmental issue that is impacting water
quality, as well as interacting with other water quality stressors. Since the advent of the industrial
era, human activities have been adding large amounts of energy-absorbing gasses to Earth’s
atmosphere, and increasing the proportion of solar energy that is retained within the atmosphere
(Ramanathan, 1988). This occurrence is referred to as global climate change, and it affects not
only temperature, but also traditional weather patterns and the frequency of extreme weather
events such as droughts and floods (IPCC, 2007). Current global model predictions based on
various emission scenarios predict that climate change will cause a temperature increase between
0.3 and 4.8⁰ C by the end of the 21st century (IPCC, 2013). In aquatic ecosystems, it is suggested
that warming temperatures will result in increased stratification, more prevalent benthic hypoxia,
a greater tendency for internal nutrient loading (Townsend et al., 2012), and an overall increase
in freshwater eutrophication. Climate change has been recognized as a major threat to the
integrity of wetland ecosystems, worldwide (Hulme, 2005).
Additional, detrimental impacts resulting from increased temperatures and extreme
weather events include: altered base flows and hydrology; increased flooding; increased soil
erosion and sedimentation; decreased water quantity and quality; and altered biogeochemistry
(Erwin, 2009). Considering wetland biogeochemistry and nutrient retention, increased
temperatures could stimulate organic P mineralization and release (Kadlec and Reddy, 2001), as
well as decrease water column dissolved oxygen concentrations and stimulate P release from
mineral compounds (Holdren and Armstrong, 1980). Conversely, the microbial processes that
regulate N cycling and retention in wetlands may operate more efficiently due to the increased
16
rate of microbial reactions that would result as a consequence of increased temperatures (Kadlec
and Reddy, 2001).
Conclusion
Overall, the effects of wetlands loss and restoration, eutrophication, and climate change
on water quality are numerous and synergistic (Figure 1.1). Because of this, a comprehensive
approach is necessary to appropriately examine the many direct and indirect impacts that these
issues have on water quality, including the many complex physical, chemical, and biological
interactions that occur between them. Thus, the value of research that is done with the aim of
improving or maintaining water quality through the use of wetlands is enhanced by including
both eutrophication and climate change, so that the most accurate conclusions and
recommendations can be made.
17

Figure 1.1. Conceptual model displaying the various drivers, stressors, processes, ecological
outcomes, and societal outcomes which together impact our definition and determination of
water quality.
18
My work
My study was conducted on two flooded fields, now technically ponds, that were
formerly used for celery farming and have been designated for wetland restoration. The ponds
are located approximately 250 m NE of Bear Lake (Muskegon County, MI) (Chapter 2, Figure
2.1). Bear Lake is a shallow, eutrophic, drowned river mouth lake that is fed primarily by a small
tributary, Bear Creek. The two ponds are located adjacent to Bear Creek, and are separated by an
earthen berm. Bear Lake connects to Muskegon Lake, Michigan through a small navigation
channel. Muskegon Lake is a larger drowned river-mouth system that connects directly to Lake
Michigan through another navigation channel, and has a long history of environmental
impairments that have resulted in the lake being designated as an Area of Concern (AOC) in the
Great Lakes. The Muskegon Lake AOC designation also includes Bear Lake. Currently, the
Muskegon Lake AOC listing includes nine Beneficial Use Impairments (BUIs), of which one is
for eutrophication and undesirable algae (Steinman et al., 2008). Restoration goals for the
eutrophication BUI include limiting surface total P and chlorophyll a concentrations within the
AOC boundaries to 30 and 10 µg L-1, respectively. Various projects have been undertaken within
the Muskegon Lake AOC aimed at removing the AOC listing. These projects include the
redirection of direct effluent discharge from Muskegon Lake to the Muskegon County
Wastewater Management System, the remediation of numerous former industrial sites with
contaminated soil and groundwater, and the remediation of Ruddiman Creek, a contaminated
urban tributary to Muskegon Lake (Steinman et al., 2008). Yet, significant environmental issues,
such as potentially toxic cyanobacteria blooms, poor quality shoreline habitat, and mid-summer
hypoxic zones, still plague the lake at this current time.
19
In regards to the eutrophication and undesirable algae BUI, Muskegon Lake has largely
reached the goal of being under 30 µg L-1 TP (Steinman et al., 2008), but Bear Lake has
remained above this target concentration (MDEQ, 2011). This prevents the BUI from being
removed from the Muskegon Lake AOC listing. A total maximum daily load (TMDL)
requirement for P was placed on Bear Lake in 2008, which involves reducing the TP
concentration from a mean of 44 µg L-1 to 30 µg L-1 (MDEQ, 2008). An indirect modeling
approach used in the TMDL concluded that a large proportion of the P in Bear Lake was from
internal loading via the lake sediments (MDEQ, 2008). Thus, it was thought that the best way to
decrease P loads in Bear Lake was to limit internal loading. More recent work performed by
Grand Valley State University in 2011 and 2012 used diel oxygen measurements in two areas of
the lake and sediment coring experiments to determine more accurate internal loading rates
(Steinman and Ogdahl, 2013). This study concluded that external loading was the more
significant source of Bear Lake P, with internal loading contributing a smaller fraction (Steinman
and Ogdahl, 2013). Thus, in order to meet the TMDL for Bear Lake, greater reductions from the
watershed, not the lake sediments, were warranted. Therein is the motivation for reconnecting
and restoring the two former celery fields in the Bear Lake watershed. The rationale is that the
two ponds, once reconnected to Bear Creek, will act as a flow through wetland and to retain
nutrients in the wetland before they reach the lake. However, it is unknown how land use history,
hydrologic reconnection, increasing temperatures due to climate change, as well as the
interaction among these possible stressors, will affect the ability of this area to retain nutrients
and the resulting water quality in Bear Lake.
My specific objectives for the study of these wetlands were to determine 1) if the sediments
in question will serve as a source or sink of nutrients once the area is hydrologically reconnected
20
to Bear Creek, and 2) how climate warming will impact nutrient dynamics between the sediment
and water column. To achieve these objectives, sediment core samples were taken from the two
ponds and exposed to varying water column treatments and temperature regimes. Additionally,
separate experiments were performed in July and October 2013 to investigate the impact of
seasonality. It was my also my goal that my research would influence the restoration design of
study area by highlighting potential issued, and providing information in regards to what the
effects of reconnection and climate change may have on this specific restoration area.
21
Literature cited
Aldous, A., P. McCormick, C. Ferguson, S. Graham, and C. Craft. 2005. Hydrologic regime
controls soil phosphorus fluxes in restoration and undisturbed wetlands. Restor. Ecol. 13:
341–347.
Baron, J.S., N.L. Poff, P.L. Angermeier, C.N. Dahm, P.H. Gleick, N.G. Hairston, R.B. Jackson,
C.A. Johnston, B.D. Richter, and A.D. Steinman. 2002. Meeting ecological and societal
needs for freshwater. Ecol. Appl. 12: 1247–1260.
Beaulieu, M., F. Pick, and I. Gregory-Eaves. 2013. Nutrients and water temperature are
significant predictors of cyanobacterial biomass in an 1147 lakes dataset. Limnol.
Oceanogr. 58: 1736–1746.
Bennett, E.M., S.R. Carpenter, and N.F. Caraco. 2001. Human impact on erodible phosphorus
and eutrophication: a global perspective. Bioscience 51: 227–234.
Conley, D.J., H.W. Paerl, R.W. Howarth, D.F. Boesch, S.P. Seitzinger, K.E. Havens, C.
Lancelot, and G.E. Likens. 2009. Controlling eutrophication: nitrogen and phosphorus.
Science 323: 1014–1015.
Crutzen, P.J. 2002. Geology of mankind. Nature 415: 23.
Dahl, T.E. 1990. Wetlands losses in the United States 1780’s to 1980’s. U.S. Department of the
Interior, Fish and Wildlife Service, Washington, D.C. 13p.
http://www.fws.gov/wetlands/Documents/Wetlands-Losses-in-the-United-States-1780s-to-
1980s.pdf
22
Dodds, W.K., W.W. Bouska, J.L. Eitzmann, T.J. Pilger, K.L. Pitts, A.J. Riley, J.T. Schloesser,
and D.J. Thornbrugh. 2009. Eutrophication of U.S. freshwaters: analysis of potential
economic damages. Environ. Sci. Technol. 43: 12–19.
Dunne, E.J., K.R. Reddy, and M.W. Clark. 2006. Phosphorus release and retention by soils of
natural isolated wetlands. Int. J. Environ. Pollut. 28: 496-516.
Erwin, K.L. 2009. Wetlands and global climate change: the role of wetland restoration in a
changing world. Wetl. Ecol. Manag. 17: 71–84.
Gibbs, J.P. 2000. Wetland loss and biodiversity conservation. Conserv. Biol. 14: 314–317.
Gosselink, J.G. 2002. The path to “no net loss” is a watershed one. Wetlands 22: 441–442.
Holdren, G.C., and D.E. Armstrong. 1980. Factors affecting phosphorus release from intact lake
sediment cores. Environ. Sci. Technol. 14: 2–7.
Hulme, P.E. 2005. Adapting to climate change: is there scope for ecological management in the
face of a global threat? J. Appl. Ecol. 42: 784–794.
IPCC, 2007: Climate Change 2007: Synthesis Report. Contribution of Working Groups I, II and
III to the Fourth Assessment Report of the Intergovernmental Panel on Climate Change
[Core Writing Team, Pachauri, R.K and Reisinger, A.(eds.)]. IPCC, Geneva, Switzerland.
104 pp. http://www.ipcc.ch/pdf/assessment-report/ar4/syr/ar4_syr.pdf.
IPCC, 2013: Summary for policymakers. In: Climate Change 2013: The Physical Science Basis.
Contribution of Working Group I to the Fifth Assessment Report of the Intergovernmental
23
Panel on Climate Change [Stocker, T.F., D. Qin, G.-K. Plattner, M. Tignor, S. K. Allen, J.
Boschung, A. Nauels, Y. Xia, V. Bex and P.M. Midgley (eds.)]. Cambridge University
Press, Cambridge, United Kingdom and New York, NY, USA. 1535 pp.
http://www.climatechange2013.org/images/report/WG1AR5_Frontmatter_FINAL.pdf.
Jackson, R. B., S. R. Carpenter, C. N. Dahm, D. M. McKnight, R. J. Naiman, S. L. Postel, and S.
W. Running. 2001. Water in a changing world. Ecol. Appl. 11: 1027-1045.
Kadlec, R.H., and K.R. Reddy. 2001. Temperature effects in treatment wetlands. Water Environ.
Res. 73: 543–557.
Kaza, N., and T.K. BenDor. 2013. The land value impacts of wetland restoration. J. Environ.
Manage. 127: 289–299.
Kusler, J.A., W.J. Mitsch, and J.S. Larson. 1994. Wetlands. Sci. Am. January: 64–70.
Lindenberg, M.K., and T.M. Wood. 2009. Water quality of a drained wetland, Caledonia Marsh
on Upper Klamath Lake, Oregon, after flooding in 2006. USGS Scientific Investigations
Report 2009–5025, 24 p. http://pubs.usgs.gov/sir/2009/5025/pdf/sir20095025.pdf
Michigan Department of Environmental Quality (MDEQ). 2011. Stage 2 remedial action plan
Muskegon Lake area of concern. Michigan Department of Environmental Quality, Water
Bureau, Lansing, Michigan. http://www.michigan.gov/documents/deq/deq-ogl-aoc-
MuskegonLakeStage2RAP_378189_7.pdf
Michigan Department of Environmental Quality (MDEQ). 2008. Total maximum daily load for
phosphorus for Bear Lake, Muskegon County. Michigan Department of Environmental
24

Quality, Water Bureau, Lansing, Michigan. http://www.michigan.gov/documents/deq/wb-
swas-tmdl-bearlake_258228_7.pdf.
Millennium Ecosystem Assessment, 2005. Ecosystems and human well-being: wetlands and
water synthesis. World Resources Institute, Washington, DC.
http://www.millenniumassessment.org/documents/document.358.aspx.pdf
Mitsch, W.J., and J.G. Gosselink. 2007. Wetlands. 4th ed. John Wiley & Sons, Inc, Hoboken,
New Jersey.
Mortsch, L.D., and F.H. Quinn. 1996. Climate change scenarios for Great Lakes Basin
ecosystem studies. Limnol. Oceanogr. 41: 903–911.
National Research Council (NRC). 2001. Compensating for wetland losses under the clean water
act. National Academy Press, Washington, DC, USA.
http://www.nap.edu/openbook.php?record_id=10134&page=R1
Newman, S., and K. Pietro. 2001. Phosphorus storage and release in response to flooding:
implications for Everglades stormwater treatment areas. Ecol. Eng. 18: 23–38.
Nosengo, N. 2003. Fertilized to death. Nature 425: 894–895.
Paerl, H.W., and J. Huisman. 2008. Blooms like it hot. Science 320: 57–58.
Pant, H.K., and K.R. Reddy. 2003. Potential internal loading of phosphorus in a wetland
constructed in agricultural land. Water Res. 37: 965–972.
25

Picard, C.R., L.H. Fraser, and D. Steer. 2005. The interacting effects of temperature and plant
community type on nutrient removal in wetland microcosms. Bioresour. Technol. 96: 1039-
1047.
Rabalais, N.N. 2002. Nitrogen in aquatic ecosystems. Ambio 31: 102–112.
Ramanathan, V. 1988. The greenhouse theory of climate change: a test by an inadvertent global
experiment. Science 240: 293–299.
Reddy, R.K., and R.D. DeLaune. 2004. Biogeochemistry of Wetlands: Science and Applications.
1st ed. Taylor and Francis, Boca Raton, FL.
Saunders, D., and J. Kalff. 2001. Nitrogen retention in wetlands, lakes and rivers. Hydrobiologia
443: 205–212.
Schindler, D.W. 2001. The cumulative effects of climate warming and other human stresses on
Canadian freshwaters in the new millennium. Can. J. Fish. Aquat. Sci. 58: 18–29.
Schindler, D.W., S.E. Bayley, B.R. Parker, K.G. Beaty, D.R. Cruikshank, E.J. Fee, E.U.
Schindler, and M.P. Stainton. 1996. The effects of climatic warming on the properties of
boreal lakes and streams at the Experimental Lakes Area, northwestern Ontario. Limnol.
Oceanogr. 41: 1004–1017.
Schindler, D.W., R.E. Hecky, D.L. Findlay, M.P. Stainton, B.R. Parker, M.J. Paterson, K.G.
Beaty, M. Lyng, and S.E.M. Kasian. 2008. Eutrophication of lakes cannot be controlled by
reducing nitrogen input: results of a 37-year whole-ecosystem experiment. Proc. Natl. Acad.
Sci. 105: 11254–11258.
26
Scott, J., M. McCarthy, W. Gardner, and R. Doyle. 2008. Denitrification, dissimilatory nitrate
reduction to ammonium, and nitrogen fixation along a nitrate concentration gradient in a
created freshwater wetland. Biogeochemistry 87: 99–111.
Smith, V.H. 2003. Eutrophication of freshwater and coastal marine ecosystems: a global
problem. Environ. Sci. Pollut. Res. 10: 126–139.
Søndergaard, M., J.P. Jensen, and E. Jeppesen. 2003. Role of sediment and internal loading of
phosphorus in shallow lakes. Hydrobiologia 506-509: 135–145.
Steinman A.D., and M.E. Ogdahl. 2013. Bear Creek/Bear Lake (Muskegon County) watershed
implementation project: internal phosphorus loading. Final Report: BC 319 2010-0013.
Grand Valley State University, Annis Water Resources Institute, Muskegon, Michigan.
https://www.gvsu.edu/cms3/assets/C77E9948-F8CA-334B-
D0AADD62329DD8D1/final_report_awri.pdf
Steinman, A.D., and M.E. Ogdahl. 2011. Does converting agricultural fields to wetlands retain or
release P? J. North Am. Benthol. Soc. 30: 820–830.
Steinman, A.D., M. Ogdahl, R. Rediske, C.R. Ruetz, B.A. Biddanda, and L. Nemeth. 2008.
Current status and trends in Muskegon Lake, Michigan. J. Great Lakes Res. 34: 169–188
Townsend, A.R., P.M. Vitousek, and B.Z. Houlton. 2012. The climate benefits of better nitrogen
and phosphorus management. Issues Sci. Technol. 28: 85–92.
27
USDA. 2012. Restoring America’s wetlands: a private lands conservation success story. Natural
Resources Conservation Service. Wetlands Reserve Program.
http://www.nrcs.usda.gov/Internet/FSE_DOCUMENTS/stelprdb1045079.pdf.
US EPA. 1996: Environmental indicators of water quality in the United States. US EPA 841-R-
96-02. Office of Water (4503F), US Government Printing Office, Washington, DC, USA.
http://nepis.epa.gov/Exe/ZyPDF.cgi/2000CZIX.PDF?Dockey=2000CZIX.PDF
Verhoeven, J.T.A., B. Arheimer, C. Yin, and M.M. Hefting. 2006. Regional and global concerns
over wetlands and water quality. Trends Ecol. Evol. 21: 96–103.
Welch, E.B., and J.M. Jacoby. 2004. Pollutant effects in freshwater: applied limnology. 3rd ed.
Spoon Press, New York, New York.
Zedler, J. 2003. Wetlands at your service: reducing impacts of agriculture at the watershed scale.
Front. Ecol. Environ. 1: 65–72.
28
Chapter II
Wetland Sediment Nutrient Flux in Response to Proposed Hydrologic Reconnection and Climate Warming
Introduction
Wetland habitats provide many important ecosystem services, including flood control,
fish and wildlife habitat, biodiversity preservation, and the retention of N and P (Millennium
Ecosystem Assessment, 2005). Yet, large areas of natural wetlands in the United States have
been degraded or filled due to land development in support of agricultural production and
population growth (Gibbs, 2000), with several states having lost more than 90% of their historic
wetland acreage (USDA, 2012). Currently, climate change-driven alterations in temperature are
seen as major threats to wetlands (Ferrati et al., 2005). Increasing temperatures have the
possibility to alter traditional wetland biogeochemistry (Erwin, 2009) by decreasing oxygen
solubility (Kadlec and Reddy, 2001), increasing organic N and P mineralization, accelerating N
transformation rates, and accelerating adsorption and precipitation rates of P (Reddy and
DeLaune, 2004). Additionally, increased benthic microbial metabolism stimulated by elevated
temperatures has the potential to decrease sediment oxygen concentrations, resulting in reduced
sediment redox potential and P release (Holdren and Armstrong, 1980; Redshaw et al., 1990).
In response to the amount of historic wetland loss and the associated loss of beneficial
ecosystem services, many wetland restoration and creation projects have been initiated. Local
and national programs now promote restoration activities, and many wetland restoration projects
occur on former agricultural land (Zedler, 2003; USDA, 2012). However, wetlands restored on
former agricultural land have the potential to act as a source of nutrients to the overlying water
29
column (Pant and Reddy, 2003; Duff et al., 2009; Ardón et al., 2010; Kinsman-Costello et al.,
2014), instead of as a sink. This has implications for wetland restoration in that many potential
restoration areas could act as a source of nutrients, and negatively impact water quality.
I studied a former deltaic wetland in west Michigan that was converted to farmland in the
early 1900s, and taken out of production in the late1990s/early 2000s. The area formerly was
used for celery farming, but now is flooded and split into two separate ponds that are
hydrologically isolated from one another by a road, as well as from an adjacent creek by an
earthen berm (Figure 2.1). The area is now designated for wetland restoration. The proposed
restoration design involves removal of the berm that separates the ponds and the creek, allowing
each pond to reconnect individually to the creek and potentially act as a flow through wetland.
Increased nutrient retention in this area would benefit the downstream receiving water body,
Bear Lake, which is impacted by high concentrations of P. Indeed, the state of Michigan has
placed Bear Lake on its 303(d) list of impaired water bodies, and proposed a TMDL that would
require a reduction in water column TP concentration from a current mean of 0.044 mg L-1 to
0.03 mg L-1 (MDEQ, 2008a). However, previous studies have shown that reflooding of drained
agricultural areas can stimulate nutrient release (Pant and Reddy, 2003; Duff et al., 2009; Ardón
et al., 2010; Kinsman-Costello et al., 2014), but relatively less is known about nutrient release
from flooded areas in response to hydrologic reconnection.
The study’s objectives were to determine 1) if the sediments in question will serve as a
source or sink of nutrients once the area is hydrologically reconnected to the adjacent creek, and
2) how climate warming may affect nutrient exchange between the sediment and water column. I
hypothesized that reconnection would increase the flux of N and P from the sediment to the
water column, at least in the short term, given the concentration gradient that would be generated
30
between the relatively low-nutrient creek water and the relatively high nutrient pond sediment. I
also hypothesized that elevated temperatures would increase the flux of P to the water column
and decrease the flux of reactive N, because higher temperatures would stimulate benthic
microbial metabolism, resulting in decreased sediment oxygen concentrations, and thereby create
reducing conditions in the sediment favorable for P release and denitrification.
Materials and methods
Study area The Bear Lake Wetland Restoration Area is located in western Michigan (Muskegon
County), approximately 250 m NE of Bear Lake, which is a drowned river mouth lake whose
main tributary is Bear Creek (Figure 2.1). The area consists of two shallowly flooded fields,
hereafter referred to as ponds, which were formerly used for celery farming. The two ponds are
designated east and west based on their position relative to Witham Drive, which runs north-
south and separates the two ponds from one another. The surface areas of the east and west
ponds are 12 and 22 acres, respectively. Bear Creek flows adjacent to the two ponds on their
north side, and the three hydrologic areas have been separated by an earthen berm since the
wetlands were converted to agriculture in the early 1900s. Although the earthen berm and
Witham Drive separate surface water flow between the areas, there is still potential for
subsurface flow, which has not been investigated to date. The east and west ponds were kept in
celery production until 1995 and 2002, respectively (G. Mund, personal communication, 2012).
Shortly after farming activities in the area ceased, water pumps used to keep the ponds from
31
flooding were shut off (G. Mund, personal communication, 2012). Since that time, both ponds
have remained inundated to varying extents.
Portions of the east unit were dredged to mine muck and peat between the years of 1995
and 2002 to a depth of 3 to 15 feet, and clay/sand fill was added in certain areas to facilitate
dredging operations (G. Mund, personal communication, 2012). The west unit was never
dredged, and the sediments impacted by agriculture were present at the time of this study.
32
33

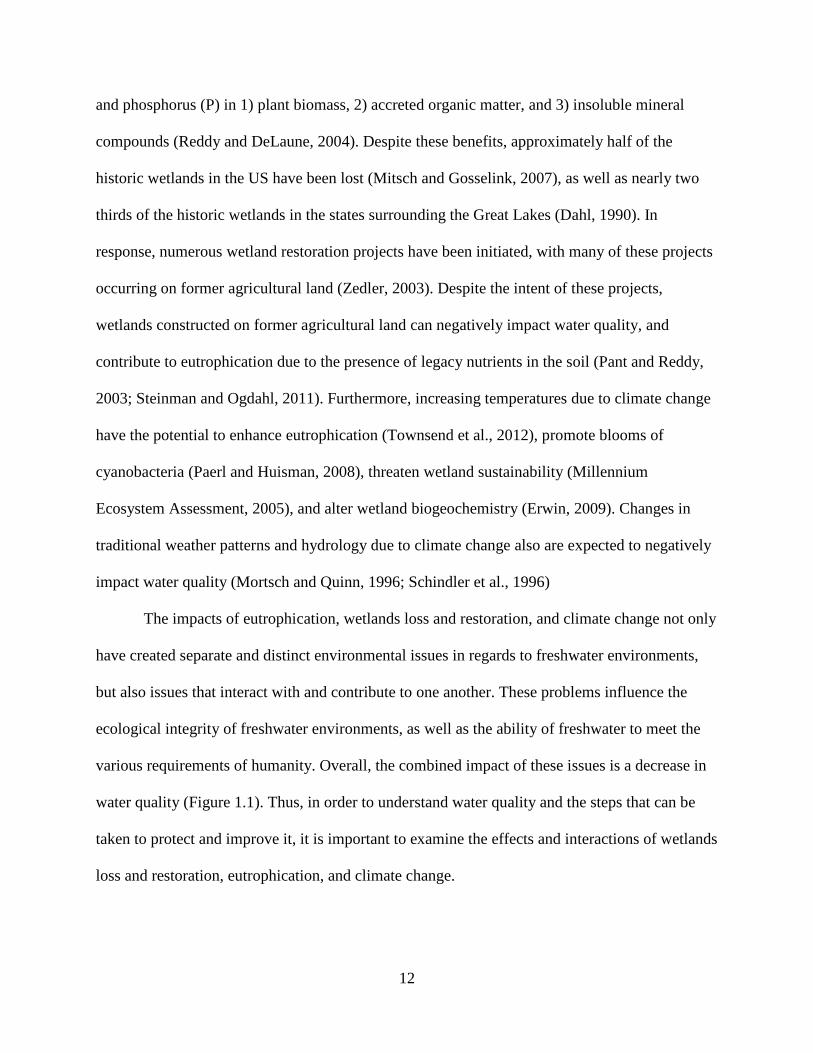
Figure 2.1. Bear Lake Wetland Restoration Area sampling locations in Muskegon, MI. Filled
circles indicate the sampling locations within each pond. Bear Creek flow is from east to west.
Inset: location of the Bear Lake Wetland Restoration Area within the Laurentian Great Lakes
Region.
34
Experimental design
Sediment cores taken from the east and west ponds were flooded with either Bear Creek
water to represent hydrologic reconnection, or with water from the pond in which they were
collected to simulate the current condition. To simulate the effects of climate warming, cores
were incubated at either the average ambient water temperature at the time of sediment core
collection (ambient condition) or at 2°C higher than the measured ambient temperature, using
two separate growth chambers (details below). In the Great Lakes region, annual air
temperatures are predicted to increase by 1.4 ±0.6°C in the near future and from 3 ±1°C to 5
±1.2°C by the end of the century depending on different emissions scenarios (Hayhoe et al.,
2010). I assume that this projected increase will be similar to average water temperatures in
small, shallow water bodies, such as my study area, that do not have a large and deep reservoir of
cool water. Hence, my increased temperature regime represents a realistic scenario of water
warming in the near future, and a conservative estimate of predicted warming by the end of the
century.
In total, I used two levels of water source (Bear Creek and ambient pond) and two levels
of temperature (ambient and plus 2°C), resulting in four treatment combinations for each pond.
Each treatment combination was replicated six times, with the four cores from each sampling
location being treated as one block.
Field sampling and procedure
Two separate experiments were performed in July and October of 2013 to determine if
nutrient exchange differed between the two seasons. Slightly different incubation periods,
35
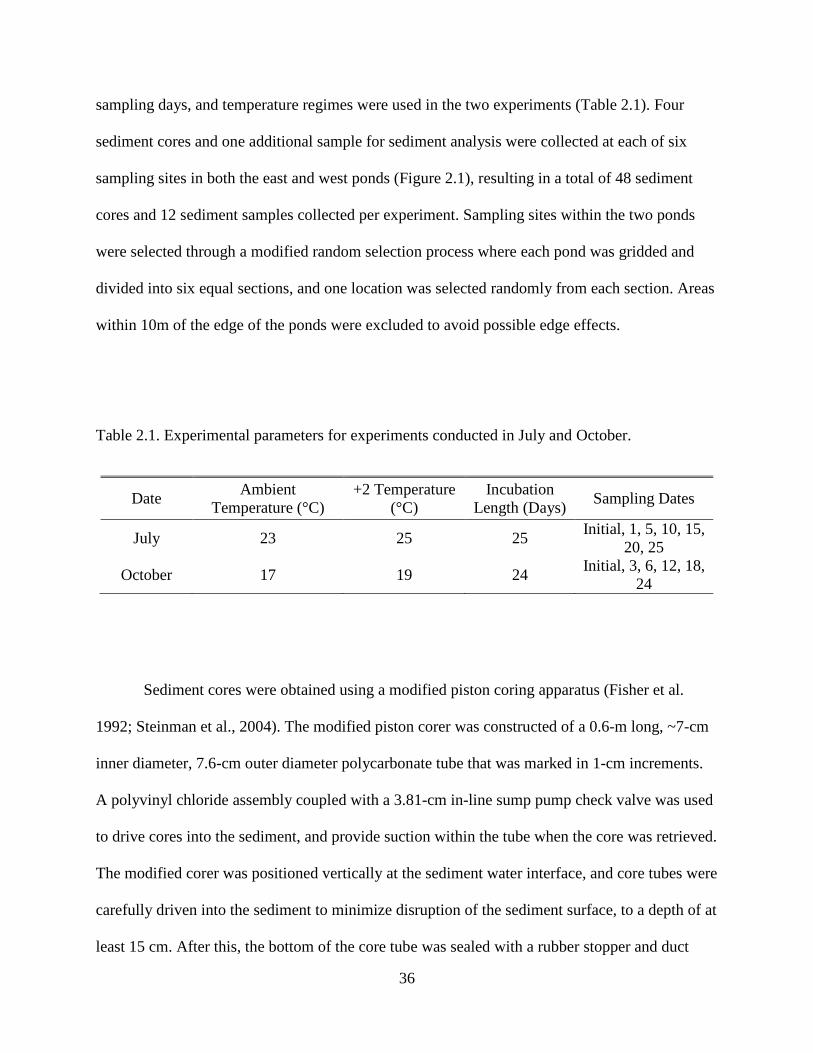
sampling days, and temperature regimes were used in the two experiments (Table 2.1). Four
sediment cores and one additional sample for sediment analysis were collected at each of six
sampling sites in both the east and west ponds (Figure 2.1), resulting in a total of 48 sediment
cores and 12 sediment samples collected per experiment. Sampling sites within the two ponds
were selected through a modified random selection process where each pond was gridded and
divided into six equal sections, and one location was selected randomly from each section. Areas
within 10m of the edge of the ponds were excluded to avoid possible edge effects.
Table 2.1. Experimental parameters for experiments conducted in July and October.
Date Ambient Temperature (°C)
+2 Temperature (°C)
Incubation Length (Days) Sampling Dates
July 23 25 25 Initial, 1, 5, 10, 15, 20, 25
October 17 19 24 Initial, 3, 6, 12, 18, 24
Sediment cores were obtained using a modified piston coring apparatus (Fisher et al.
1992; Steinman et al., 2004). The modified piston corer was constructed of a 0.6-m long, ~7-cm
inner diameter, 7.6-cm outer diameter polycarbonate tube that was marked in 1-cm increments.
A polyvinyl chloride assembly coupled with a 3.81-cm in-line sump pump check valve was used
to drive cores into the sediment, and provide suction within the tube when the core was retrieved.
The modified corer was positioned vertically at the sediment water interface, and core tubes were
carefully driven into the sediment to minimize disruption of the sediment surface, to a depth of at
least 15 cm. After this, the bottom of the core tube was sealed with a rubber stopper and duct
36
tape, and the top with a plastic cap. The resulting sediment core consisted of at least 15 cm depth
of sediment and an overlying water column of 45 cm. Upright sediment cores were transported to
the lab within 6 hours after collection for each experiment. An additional 5-cm deep sediment
core sample was collected at each site using the modified coring apparatus (Steinman et al.,
2009). After collection, the 5 cm deep sample was extruded from the core tube, and stored in a
plastic bag for additional analysis.
Water column readings of temperature, dissolved oxygen concentration (DO), pH,
specific conductivity (SpCond), and chlorophyll a (chl a) concentration, were taken using a YSI
6600 sonde (YSI Incorporated, Yellow Springs, OH) positioned just below the water surface at
each of the six sampling sites within each pond. Additionally, water to be used for subsequent
laboratory experiments was collected separately from central areas in the east and west ponds,
and one location in Bear Creek, and stored in acid washed 10-L carboys. All water samples,
sediment cores, and sediment samples were placed on ice shortly after collection, and stored this
way until transported to the lab, usually within 6 hr.
Laboratory procedure
In the laboratory, sediment cores were adjusted to a consistent sediment depth of 15 cm
by removing sediment from the bottom of the core, and the overlying water column was
carefully removed to within 5 cm of the sediment surface by using a siphon apparatus.
Concurrently, carboys of water from the west pond, east pond, and Bear Creek to be used for
core tube re-flooding were filtered (1-µm filter; Graver Technologies, Glasgow, DE) using a
peristaltic pump (Pall Corporation, Timonium, MD). Readings of temperature, DO, SpCond, chl
37

a concentration, and pH were taken on the filtered water using a YSI 6600 sonde before being
added to the core tubes. Also, separate 1-L samples of 1-µm filtered water from the east pond,
west pond, and Bear Creek were taken and analyzed for conductivity and hardness according to
standard laboratory methods (APHA, 1998), as well as for total phosphorus (TP), soluble
reactive phosphorus (SRP), nitrate (NO3-N), ammonia (NH3-N), sulfate (SO4), and chloride (Cl)
concentration (details below). Sediment core tubes were then flooded to a water column depth of
25 cm with corresponding 1-µm filtered east pond, west pond, or Bear Creek water depending on
the specific water source treatment. After flooding, remaining water from the east pond, west
pond, and Bear Creek was filtered through a 0.2-µm filter (Graver Technologies, Glasgow, DE)
using the peristaltic pump, stored in acid-washed carboys in a refrigerator, and used to refill core
tubes after each sampling during the experiment.
Sediment cores were then placed in one of two darkened environmental growth chambers
(Revco Scientific, Asheville, NC; Powers Scientific Inc, Pipersville, PA) depending on the
specific temperature treatment required for each sediment core. Temperature accuracy within the
environmental chambers was validated by using an additional incubation thermometer in each
incubator. Air was gently bubbled into the cores using aquarium pumps to maintain water
column oxygen concentrations at 75–100% equilibrium with atmospheric oxygen throughout the
incubation period. This followed my expectation that the overlying water column in these
shallow wetland areas would remain relatively well mixed and oxygenated (Reddy and DeLaune,
2004). During the incubation period, water samples were taken at the midpoint in the water
column through a sampling port inserted in the plastic cap on the top of the core tube. For each
core tube, three separate water column subsamples were taken per sampling day. These included
a 60-ml unfiltered sample for TP analysis, a 20-ml 0.45-µm filtered sample for SRP, NO3-N, Cl,
38
and SO4 analysis, and an additional 20-ml unfiltered sample for NH3-N analysis. Filters (0.45-
µm ThermoFisher Nylon Syringe Filter, ThermoFisher Scientific, Waltham, MA) were acid
washed prior to use. In total, 100 ml of water were removed from the water column of the core
tubes per sampling. NH3-N, NO3-N, SRP, SO4, and Cl samples were immediately frozen after
collection, and TP samples were stored at 4°C. To maintain a constant water column depth, core
tubes were refilled after sampling with 100 ml of 0.2-µm filtered water that was collected at the
time of coring from the two ponds and creek. Additionally, a YSI Pro-DO sonde was used to
record dissolved oxygen concentration at the midpoint of the water column and near the
water/sediment interface on each sampling day.
TP, SRP, and NH3-N concentrations were analyzed on a Bran+Luebbe Autoanalyzer
(SEAL Analytical, Mequon, Wisconsin; APHA, 1998). NO3-N, SO4, and Cl concentrations were
analyzed by ion chromatography on a Dionex ICS-2100 (APHA, 1998). The additional sediment
samples collected from each sampling location in both ponds were analyzed for percent
moisture, percent organic matter, total N, metals (Ca, Fe, Mg, Al) and ash free dry mass
(AFDM). Metals analysis was performed according to EPA method 6010B using inductively
coupled plasma-atomic emission spectrometry (ICP-AES) (U.S. EPA, 1994). Sediment NO3-N
as N, NO2-N as N, and total Kjeldahl nitrogen were analyzed using EPA methods 300.0 Rev. 2.1
and 351.2 Rev. 2.0 (U.S. EPA, 1993). Total sediment N was then calculated as a sum of these
analyses. AFDM analysis was performed by combusting a pre-weighed subsample of sediment at
550⁰C for 1 h. Percent organic matter content was measured as loss due to combustion. Sediment
TP was analyzed as described previously, using a subsample of ashed material. Sediment Fe:P
ratios were determined by weight using dry weight TP and Fe concentrations.
39
Analysis
Maximum apparent nutrient release rate calculations were based on the methodology
used in Steinman et al. (2004). In brief, the maximum rate of increase of water column TP, SRP,
NO3-N, and NH3-N was determined using the following equation:
( ) AVCCN tflux /*0−=
where, Nflux is the rate of TP, SRP, NO3-N, or NH3-N release in mg m-2d-1; Ct is the concentration
of TP, SRP, NO3-N or NH3-N at time t; C0 is the TP, SRP, or NH3-N concentration of the initial
refill water (Pant and Reddy, 2003); V is the volume of the overlying water column; and A is the
planar surface area of the sediment. In the case of NO3-N, C0 was the concentration of NO3-N
on the sampling day where I began to see a trend of increasing concentration. Flux calculations
were based on the linear portions of the water column nutrient concentration curves measured
through time in order to capture the maximum apparent release rate, however, C0 and Ct could
not be consecutive dates in order to avoid potential short term bias. Additionally, a calculation
was performed to determine the maximum nutrient concentration increase in the water column of
each sediment core, regardless of the day on which it was reached during the incubation period.
To calculate this value, I subtracted the initial (C0) concentration of each nutrient from the
maximum concentration (Cmax) of each nutrient measured in the water column of each sediment
core during the incubation period.
Two-way repeated measures analysis of variance (ANOVA), with two levels of water
source treatment (Bear Creek vs. west or east pond water) and two levels of temperature
(ambient vs. plus 2°C) as factors, and time as the repeated measure, was used to test for
differences in nutrient concentrations in the water column of sediment cores over the incubation
period. Maximum apparent nutrient release rates and maximum nutrient concentration increases
40

were tested using blocked two-way ANOVAs with water source treatment and temperature
treatment as the main effects, and sampling site as the blocking factor. In all ANOVAs, the two
ponds were treated and analyzed separately. When necessary, data were transformed (ln, square
root, reciprocal, power) to meet the assumptions of ANOVA. Normality was tested using the
Shapiro-Wilk goodness of fit test, and equality of variance was tested using Bartlett’s test. When
data did not meet the assumptions of ANOVA and transformation was ineffective, core water
column data were analyzed using ANOVA and the results noted as exploratory.
Sediment and water column characteristics were compared between the east and west
ponds using t-tests. Sediment and water column characteristics expressed as percentages were
arcsine-square root-transformed prior to analysis. Additionally, sediment and water column data
that were not normally distributed or had unequal variance were transformed (ln, square root,
reciprocal, power) prior to analysis. Data that still failed to meet normality and equal variance
assumptions after transformation were analyzed using a Mann-Whitney Rank Sum test. All
statistical analyses were conducted using R software (R Core Team, 2013).
Results
Water column and sediment analysis
Water column conditions varied between the two ponds at the time of sampling, despite
their close spatial proximity (Table 2.2). The water column in the two ponds had significantly
different mean values of DO and SpCond in both July and October. SpCond was significantly
higher in the west pond, while DO was significantly higher in the east pond (Table 2.2).
41
Additionally, mean chl a was significantly higher in the east pond in July, while mean pH was
significantly higher in the east pond in October but not July (Table 2.2).
Sediment characteristics also varied between the two ponds (Table 2.3), which is
presumably related, at least in part, to the prior dredging of the east pond. Mean sediment TP and
OM were typically higher in west pond compared to east pond (Table 2.3). Conversely, mean
values of Al, Fe, Ca, and Mg were typically higher in the sediments of the east than west pond
(Table 2.3). Mean sediment total N values were not significantly different between the two
ponds. Mean Fe:P ratios in the sediment by weight were significantly higher in the east pond
compared to the west pond (Table 2.3).
42
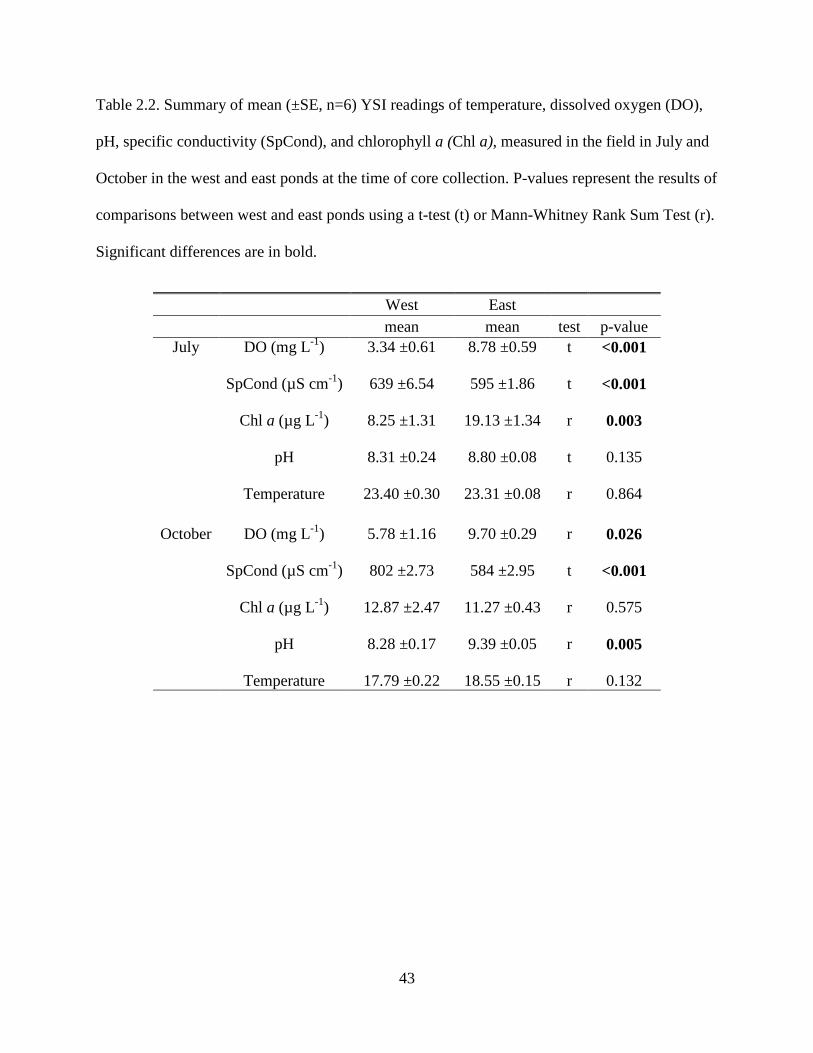
Table 2.2. Summary of mean (±SE, n=6) YSI readings of temperature, dissolved oxygen (DO),
pH, specific conductivity (SpCond), and chlorophyll a (Chl a), measured in the field in July and
October in the west and east ponds at the time of core collection. P-values represent the results of
comparisons between west and east ponds using a t-test (t) or Mann-Whitney Rank Sum Test (r).
Significant differences are in bold.
West East mean mean test p-value
July DO (mg L-1) 3.34 ±0.61 8.78 ±0.59 t <0.001
SpCond (µS cm-1)
639 ±6.54 595 ±1.86 t <0.001
Chl a (µg L-1)
8.25 ±1.31 19.13 ±1.34 r 0.003
pH
8.31 ±0.24 8.80 ±0.08 t 0.135
Temperature 23.40 ±0.30 23.31 ±0.08 r 0.864
October DO (mg L-1)
5.78 ±1.16 9.70 ±0.29 r 0.026
SpCond (µS cm-1)
802 ±2.73 584 ±2.95 t <0.001
Chl a (µg L-1)
12.87 ±2.47 11.27 ±0.43 r 0.575
pH
8.28 ±0.17 9.39 ±0.05 r 0.005
Temperature 17.79 ±0.22 18.55 ±0.15 r 0.132
43

Table 2.3. Summary of mean (±SE, n=6) sediment Ca, Al, Fe, Mg, organic matter (OM), total N,
total P measured in July and October in the west and east ponds. P-values represent the results of
comparisons between west and east ponds using a t-test (t) or Mann-Whitney Rank Sum Test (r).
Significant differences are in bold.
West East mean mean test p-value
July Total P (mg kg-1)
3476 ±1088 958 ±309 t 0.045
OM (%)
33 ±7 18 ±5 t 0.138
Al (mg kg-1)
635 ±118 1463 ±129 t <0.001
Ca (mg kg-1)
2250 ±200 8517 ±2317 t <0.001
Fe (mg kg-1)
1232 ±160 2200 ±158 t 0.003
Mg (mg kg-1)
252 ±38 2108 ±691 t <0.001
Total N (% by dry weight)
0.59 ±0.21 0.43 ±0.12 t 0.537
Fe:P (by weight) 0.69 ± 0.22 7.66 ± 4.09 t 0.041
October
Total P (mg kg-1)
4028 ±907 960 ±457 t 0.034
OM (%)
40 ±5 13 ±6 r 0.006
Al (mg kg-1)
2067 ±409 1300 ±346 t 0.332
Fe (mg kg-1)
2517 ±253 2417 ±500 t 0.875
Ca (mg kg-1)
5550 ±447 10867 ±4351 t 0.823
Mg (mg kg-1)
442 ±41 3355 ±1773 t <0.001
Total N (% by dry weight)
0.83 ±0.15 0.49 ±0.24 r 0.521
Fe:P (by weight) 0.83 ± 0.18 10.44 ± 3.91 t 0.029
44
Change in nutrient concentration during incubation
Prior to sediment core reflooding, 1-µm filtered water from the west pond had TP and
SRP concentrations that were more than an order of magnitude higher than TP and SRP
concentrations in water from the east pond and Bear Creek (Table 2.4). Concentrations of NO3-N
were highest in Bear Creek water (Table 2.4). NH3-N concentrations were below detection
across the three sampling areas (Table 2.4). Filtered water from Bear Creek had the lowest pH
while water from the east pond had the highest (Table 2.4). Phosphorus concentrations were
greater during July than October, but were still quite high regardless of season, especially in the
west pond (Table 2.4). Alkalinity, hardness, and SpCond values were variable in the three areas
in experiments conducted in July and October (Table 2.4).
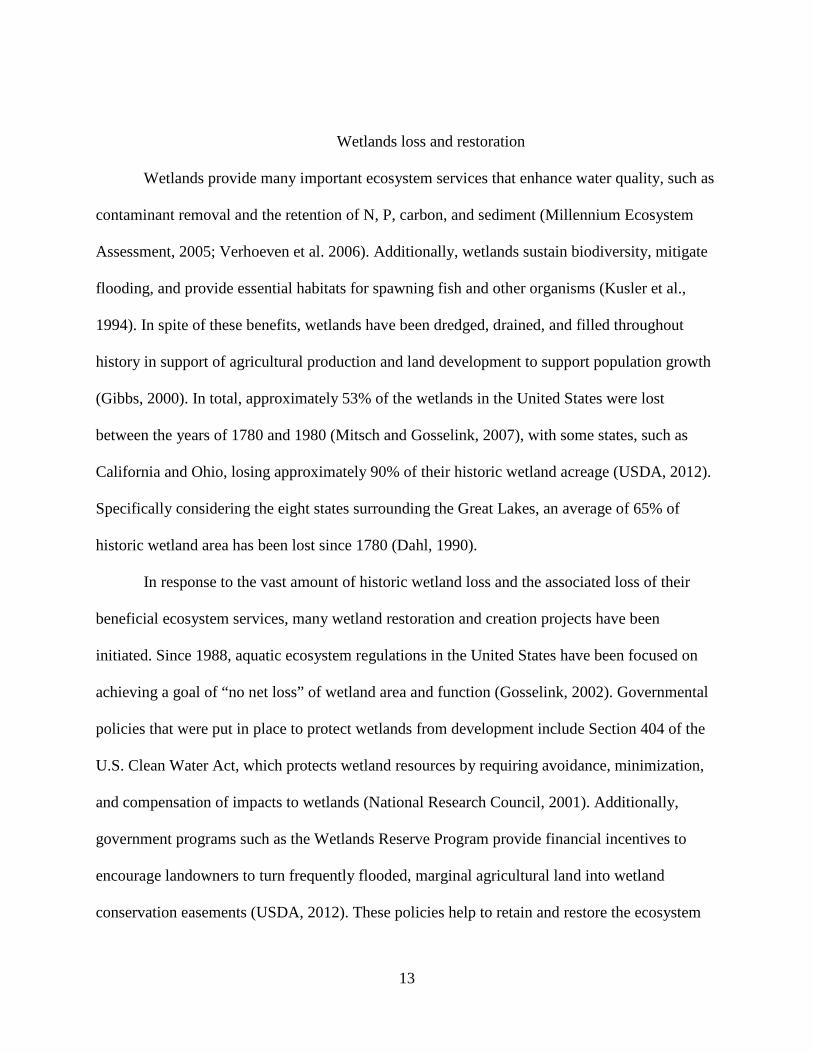
TP concentration in the water column of west pond cores was significantly influenced by
water source in July, as the increase in concentration was much greater when cores were
reflooded with Bear Creek water compared to west pond water (Figure 2.2; Table 2.5). In July,
TP concentrations increased from initial concentrations of ~0.1 to ~1.6-2.3 mg L-1 after flooding
with Bear Creek water, compared to TP increases from ~1.9 to ~2.4-2.6 mg L-1 after flooding
with west pond water (Figure 2.2). Similarly, in October, TP concentrations increased from ~0.1
to ~1-1.4 mg L-1 after flooding with Bear Creek water, compared to TP increases from ~0.8 to
~1-1.4 after flooding with west pond water (Figure 2.2). Temperature had no significant effect
on water column TP concentrations in either experiment (Table 2.5). In general, TP
concentrations were greater in July than in October (Figure 2.2). Water column SRP in west
pond sediment cores followed a similar pattern, at lower absolute concentrations, to that of TP
for all treatments, with cores treated with Bear Creek water exhibiting a significantly greater
increase in SRP concentration than west pond water in July, but not October (Figure 2.2, Table
45
2.5). Water column NH3-N concentrations were similar in all treatments and in both seasons,
with a rapid increase after inundation, a peak between days 10-15, followed by a decline (Figure
2.2); neither water source nor temperature treatment had a significant effect on NH3-N
concentration (Table 2.5). Concurrently, across all treatments and in both seasons, NO3-N
concentrations remained near initial concentrations until between days 10-15, after which they
increased in concentration until the final sampling day (Figure 2.2). Water column NO3-N
concentrations were significantly influenced by water source treatment in July (Table 2.5) in that
concentrations were typically higher during the beginning of the incubation period in cores
reflooded with Bear Creek water than west pond water (Figure 2.2). In contrast to the P patterns,
absolute NO3-N concentrations were generally higher in October than in July (Figure 2.2).
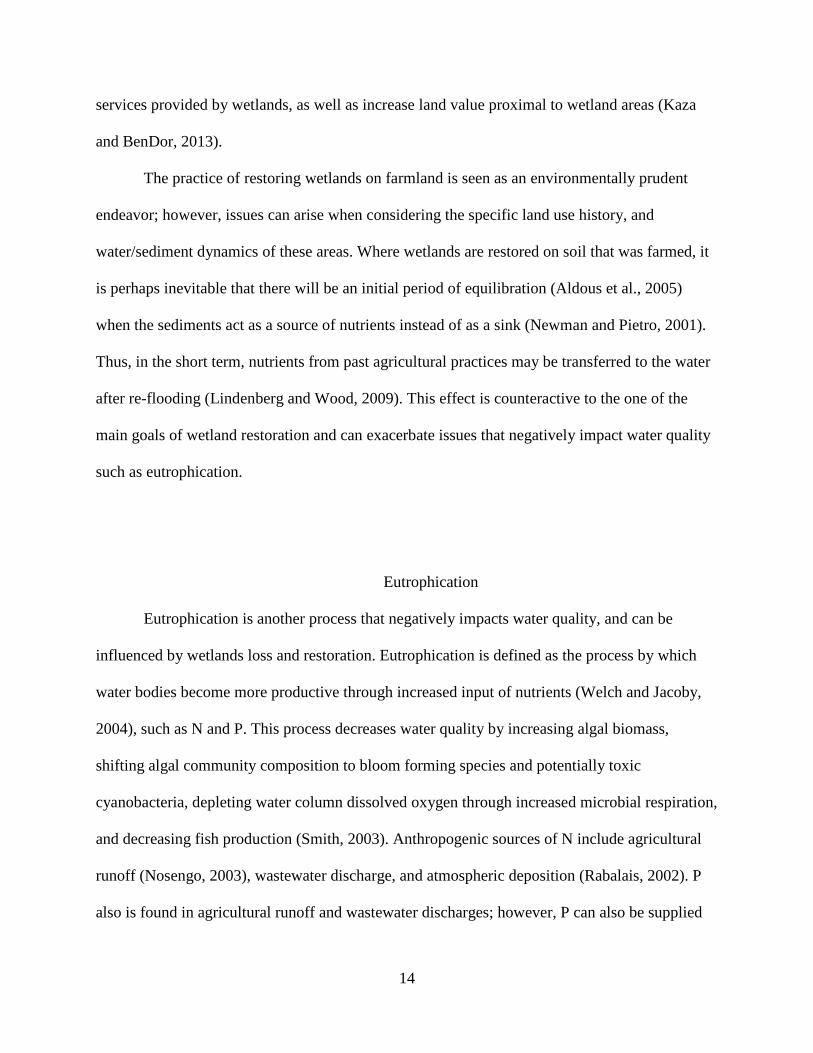
TP concentrations in the water column of east pond cores over the incubation time were
not significantly influenced by water source (Figure 2.3, Table 2.5) and in general,
concentrations of TP were similar in all treatments and in both seasons (Figure 2.3). Temperature
also had no significant effect on water column TP concentrations over the incubation time (Table
2.5). Water column SRP concentrations in east pond sediment cores followed a similar pattern, at
lower absolute concentrations, to that of TP (Figure 2.3), and were not significantly influenced
by water source or temperature (Table 2.5). Overall, P concentrations were approximately an
order of magnitude lower in the east pond than west pond incubations, regardless of water source
or temperature treatment (Figure 2.2, 2.3). Water column NH3-N and NO3-N concentration
patterns of east pond sediment cores were similar to those of the west pond (Figure 2.2, 2.3). In
general, water column NH3-N concentration patterns were consistent across all treatments and in
both seasons, with a rapid rise in concentration following inundation, a peak between days 10-
15, followed by a decline to levels near initial concentrations (Figure 2.3). There was no
46
significant effect of temperature on NH3-N water column concentrations over the incubation
time; however, water source did significantly influence water column NH3-N concentration in
October (Table 2.5). Again, across all treatments and in both seasons, NO3-N concentrations
remained near initial concentrations until between day 10 and 15, when they increased in
concentration until the final sampling day (Figure 2.3). Water column NO3-N concentrations
were significantly influenced by water source treatment in July (Table 2.5), with concentrations
typically higher in cores reflooded with Bear Creek water than with east pond water (Figure 2.3).
47
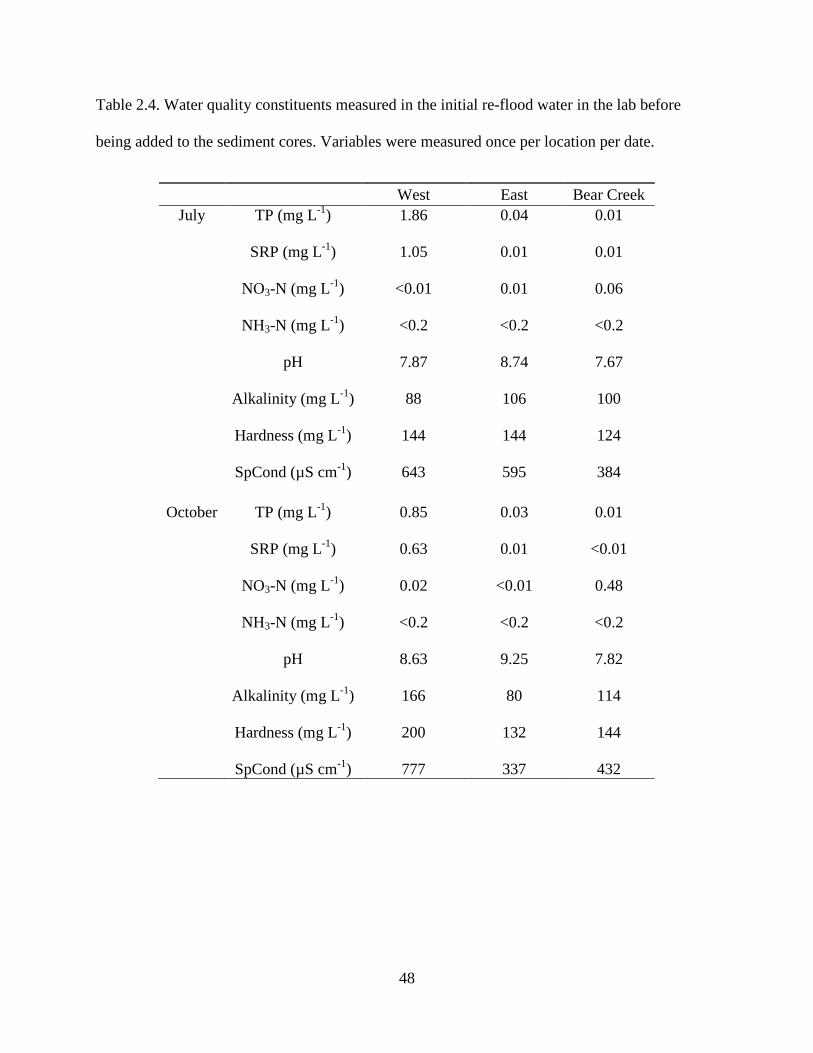
Table 2.4. Water quality constituents measured in the initial re-flood water in the lab before
being added to the sediment cores. Variables were measured once per location per date.
West East Bear Creek July TP (mg L-1)
1.86 0.04 0.01
SRP (mg L-1)
1.05 0.01 0.01
NO3-N (mg L-1)
<0.01 0.01 0.06
NH3-N (mg L-1)
<0.2 <0.2 <0.2
pH
7.87 8.74 7.67
Alkalinity (mg L-1)
88 106 100
Hardness (mg L-1)
144 144 124
SpCond (µS cm-1) 643 595 384
October TP (mg L-1)
0.85 0.03 0.01
SRP (mg L-1)
0.63 0.01 <0.01
NO3-N (mg L-1)
0.02 <0.01 0.48
NH3-N (mg L-1)
<0.2 <0.2 <0.2
pH
8.63 9.25 7.82
Alkalinity (mg L-1)
166 80 114
Hardness (mg L-1)
200 132 144
SpCond (µS cm-1) 777 337 432
48
49

Figure 2.2. Mean (± 1SE, n=6) TP, SRP, NH3-N, and NO3-N concentrations measured in the
surface water of the west pond sediment cores for the four treatment combinations (temperature:
water source) over the incubation period. Amb/West, ambient temperature west pond water;
+2/west, +2°C temperature west pond water; Amb/BC, ambient temperature Bear Creek water;
+2/BC, +2°C temperature Bear Creek water.
50
51
Figure 2.3. Mean (± 1 SE, n=6) TP, SRP, NH3-N, and NO3-N concentrations measured in the
surface water of the east pond sediment cores for the four treatment combinations (temperature:
water source) over the incubation period. Amb/East, ambient temperature east pond water;
+2/East, +2°C temperature east pond water; Amb/BC, ambient temperature Bear Creek water;
+2/BC, +2°C temperature Bear Creek water.
52

Table 2.5. Two-way repeated measures ANOVA (a), results on concentration of TP, SRP, NH3-N, and NO3-N measured over time in
the surface water in experimental sediment cores in July and October experiments. Asterisk (*) indicates the results of exploratory
ANOVA analyses. Significant effects are in bold.
TP SRP NH3-N NO3-N Sediment Source Date Factor DF F p-value F p-value F p-value F p-value
West Pond July Temperature 1 2.41 0.136 0.20 0.659 0.57 0.459 1.46* 0.242* Water Source 1 17.33 <0.01 30.92 <0.001 0.00 0.949 36.74* <0.001* Temperature x Water Source 1 0.80 0.382 0.39 0.541 0.01 0.921 0.19* 0.673*
October Temperature 1 0.00* 0.946* 0.00* 0.843* 0.30* 0.593* 0.05* 0.816* Water Source 1 2.20* 0.154* 1.70* 0.207* 1.84* 0.190* 1.18* 0.290* Temperature x Water Source 1 1.87* 0.186* 0.40* 0.556* 1.91* 0.181* 3.42* 0.079*
East Pond July Temperature 1 0.04 0.838 0.11 0.748 0.08 0.785 2.97* 0.101*
Water Source 1 0.98 0.333 0.00 0.961 0.79 0.383 26.50* <0.001* Temperature x Water Source 1 0.00 0.963 0.28 0.600 0.07 0.799 0.20* 0.661*
October Temperature 1 0.00* 0.948* 0.09* 0.765* 0.11 0.746 0.12* 0.728* Water Source 1 1.51* 0.233* 0.23* 0.637* 5.28 0.032 0.78* 0.386* Temperature x Water Source 1 0.620* 0.440* 1.05* 0.319* 0.17 0.685 0.00* 0.950*
53
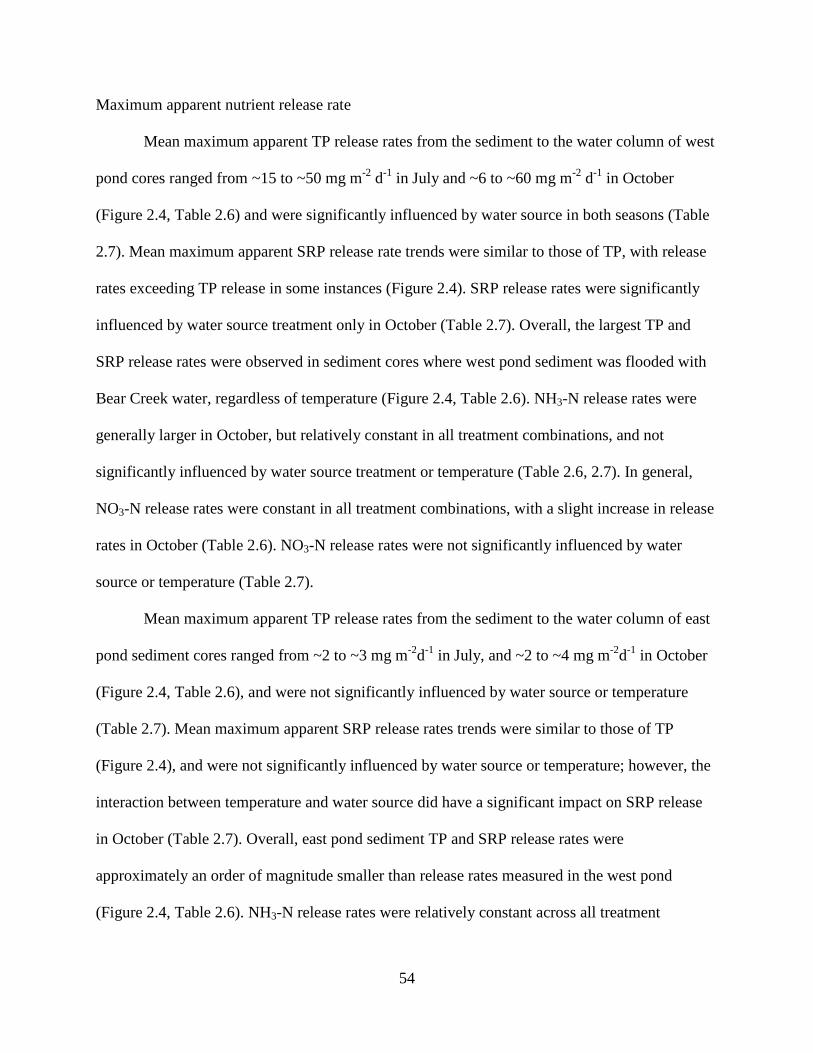
Maximum apparent nutrient release rate
Mean maximum apparent TP release rates from the sediment to the water column of west
pond cores ranged from ~15 to ~50 mg m-2 d-1 in July and ~6 to ~60 mg m-2 d-1 in October
(Figure 2.4, Table 2.6) and were significantly influenced by water source in both seasons (Table
2.7). Mean maximum apparent SRP release rate trends were similar to those of TP, with release
rates exceeding TP release in some instances (Figure 2.4). SRP release rates were significantly
influenced by water source treatment only in October (Table 2.7). Overall, the largest TP and
SRP release rates were observed in sediment cores where west pond sediment was flooded with
Bear Creek water, regardless of temperature (Figure 2.4, Table 2.6). NH3-N release rates were
generally larger in October, but relatively constant in all treatment combinations, and not
significantly influenced by water source treatment or temperature (Table 2.6, 2.7). In general,
NO3-N release rates were constant in all treatment combinations, with a slight increase in release
rates in October (Table 2.6). NO3-N release rates were not significantly influenced by water
source or temperature (Table 2.7).
Mean maximum apparent TP release rates from the sediment to the water column of east
pond sediment cores ranged from ~2 to ~3 mg m-2d-1 in July, and ~2 to ~4 mg m-2d-1 in October
(Figure 2.4, Table 2.6), and were not significantly influenced by water source or temperature
(Table 2.7). Mean maximum apparent SRP release rates trends were similar to those of TP
(Figure 2.4), and were not significantly influenced by water source or temperature; however, the
interaction between temperature and water source did have a significant impact on SRP release
in October (Table 2.7). Overall, east pond sediment TP and SRP release rates were
approximately an order of magnitude smaller than release rates measured in the west pond
(Figure 2.4, Table 2.6). NH3-N release rates were relatively constant across all treatment
54

combinations, but were slightly higher in July than in October (Table 2.6). NO3-N release rates
were relatively constant across all treatment combinations and in both seasons (Table 2.6).
Neither NH3-N nor NO3-N release rates were significantly influenced by temperature or water
source (Table 2.7).
55
56
Figure 2.4. Mean (±1 SE, n=6) maximum apparent TP (total phosphorus) (A) and SRP (soluble
reactive phosphorus) (B) release rates from west and east field sediment to the water column, and
maximum TP (C) and SRP (D) increases in west and east field sediment core water columns.
Results represent the four treatment (temperature: water source) combinations simulating
hydrologic reconnection and climate warming from both the July and October experiment in the
west and east field. A= ambient temperature; +2= +2°C temperature; NR= no reconnection water
treatment, R= reconnection water treatment. Reconnection indicates Bear Creek water source
treatment for the west and east field; no reconnection indicates west field water source treatment
for west field sediment, and east field water source treatment for east field sediment.
57
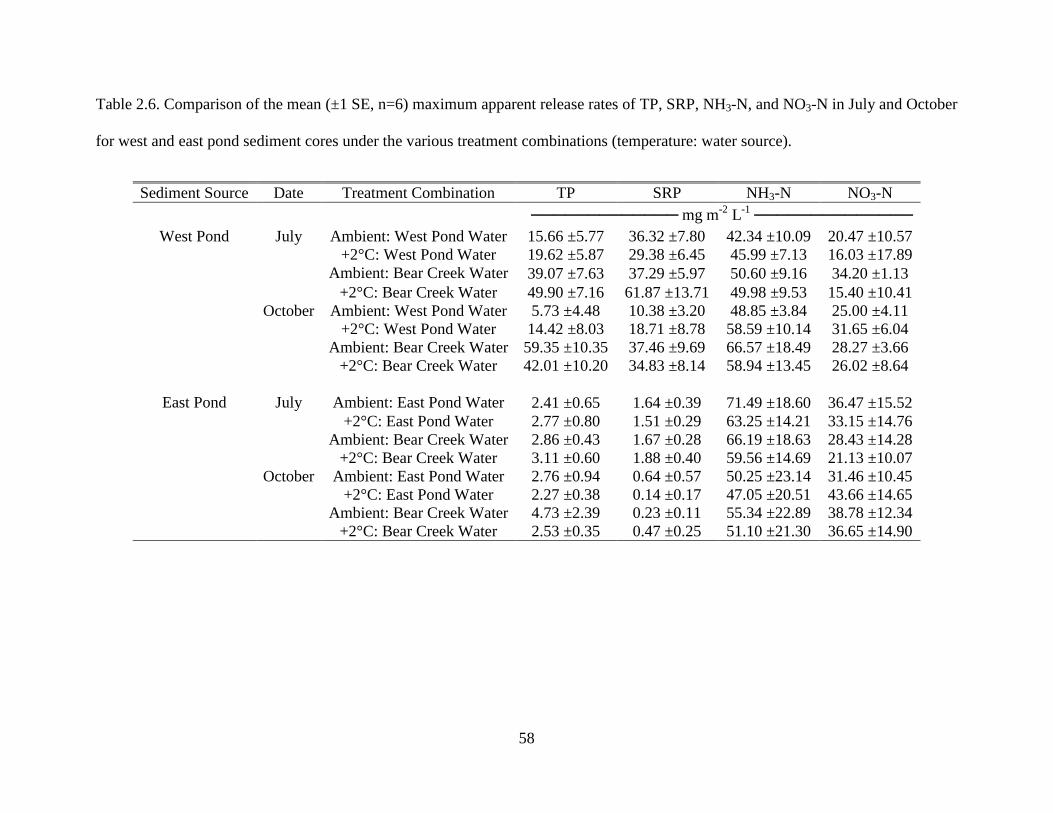
Table 2.6. Comparison of the mean (±1 SE, n=6) maximum apparent release rates of TP, SRP, NH3-N, and NO3-N in July and October
for west and east pond sediment cores under the various treatment combinations (temperature: water source).
Sediment Source Date Treatment Combination TP SRP NH3-N NO3-N ───────────── mg m-2 L-1 ──────────────
West Pond July Ambient: West Pond Water 15.66 ±5.77 36.32 ±7.80 42.34 ±10.09 20.47 ±10.57 +2°C: West Pond Water 19.62 ±5.87 29.38 ±6.45 45.99 ±7.13 16.03 ±17.89
Ambient: Bear Creek Water 39.07 ±7.63 37.29 ±5.97 50.60 ±9.16 34.20 ±1.13 +2°C: Bear Creek Water 49.90 ±7.16 61.87 ±13.71 49.98 ±9.53 15.40 ±10.41
October Ambient: West Pond Water 5.73 ±4.48 10.38 ±3.20 48.85 ±3.84 25.00 ±4.11 +2°C: West Pond Water 14.42 ±8.03 18.71 ±8.78 58.59 ±10.14 31.65 ±6.04
Ambient: Bear Creek Water 59.35 ±10.35 37.46 ±9.69 66.57 ±18.49 28.27 ±3.66 +2°C: Bear Creek Water 42.01 ±10.20 34.83 ±8.14 58.94 ±13.45 26.02 ±8.64
East Pond July Ambient: East Pond Water 2.41 ±0.65 1.64 ±0.39 71.49 ±18.60 36.47 ±15.52
+2°C: East Pond Water 2.77 ±0.80 1.51 ±0.29 63.25 ±14.21 33.15 ±14.76 Ambient: Bear Creek Water 2.86 ±0.43 1.67 ±0.28 66.19 ±18.63 28.43 ±14.28
+2°C: Bear Creek Water 3.11 ±0.60 1.88 ±0.40 59.56 ±14.69 21.13 ±10.07 October Ambient: East Pond Water 2.76 ±0.94 0.64 ±0.57 50.25 ±23.14 31.46 ±10.45
+2°C: East Pond Water 2.27 ±0.38 0.14 ±0.17 47.05 ±20.51 43.66 ±14.65 Ambient: Bear Creek Water 4.73 ±2.39 0.23 ±0.11 55.34 ±22.89 38.78 ±12.34
+2°C: Bear Creek Water 2.53 ±0.35 0.47 ±0.25 51.10 ±21.30 36.65 ±14.90
58
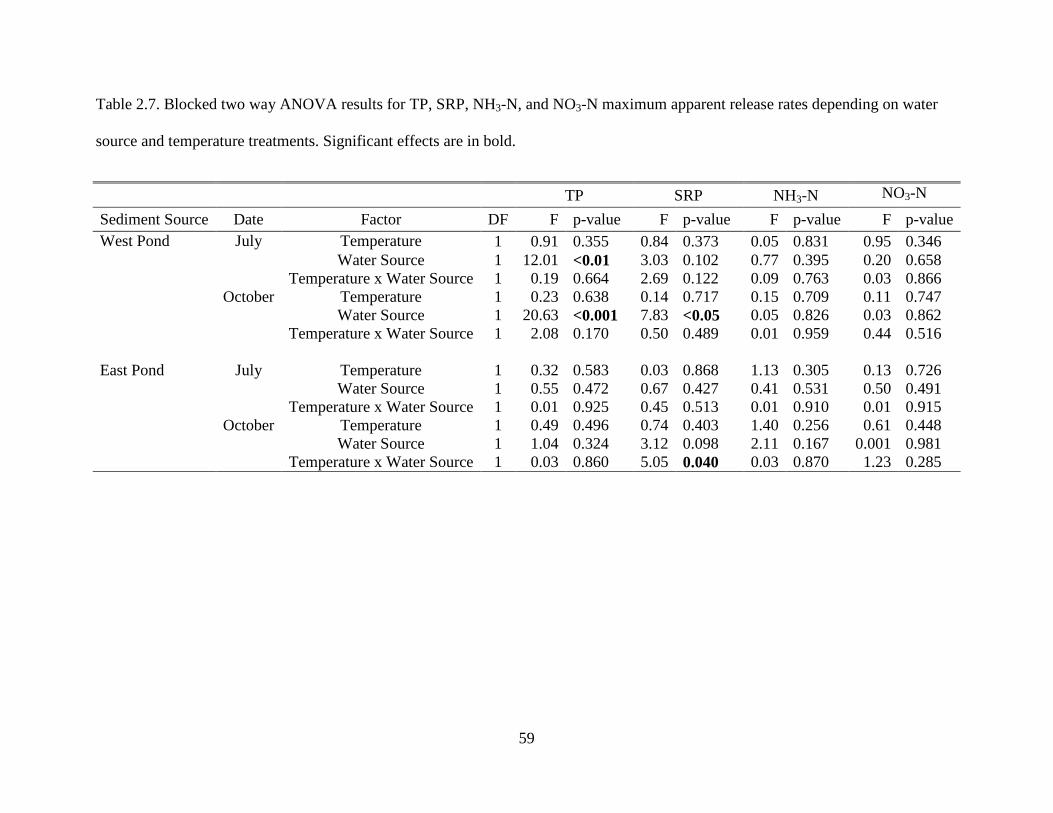
Table 2.7. Blocked two way ANOVA results for TP, SRP, NH3-N, and NO3-N maximum apparent release rates depending on water
source and temperature treatments. Significant effects are in bold.
TP SRP NH3-N NO3-N
Sediment Source Date Factor DF F p-value F p-value F p-value F p-value West Pond July Temperature 1 0.91 0.355 0.84 0.373 0.05 0.831 0.95 0.346
Water Source 1 12.01 <0.01 3.03 0.102 0.77 0.395 0.20 0.658 Temperature x Water Source 1 0.19 0.664 2.69 0.122 0.09 0.763 0.03 0.866
October Temperature 1 0.23 0.638 0.14 0.717 0.15 0.709 0.11 0.747 Water Source 1 20.63 <0.001 7.83 <0.05 0.05 0.826 0.03 0.862
Temperature x Water Source 1 2.08 0.170 0.50 0.489 0.01 0.959 0.44 0.516 East Pond July Temperature 1 0.32 0.583 0.03 0.868 1.13 0.305 0.13 0.726
Water Source 1 0.55 0.472 0.67 0.427 0.41 0.531 0.50 0.491 Temperature x Water Source 1 0.01 0.925 0.45 0.513 0.01 0.910 0.01 0.915
October Temperature 1 0.49 0.496 0.74 0.403 1.40 0.256 0.61 0.448 Water Source 1 1.04 0.324 3.12 0.098 2.11 0.167 0.001 0.981
Temperature x Water Source 1 0.03 0.860 5.05 0.040 0.03 0.870 1.23 0.285
59
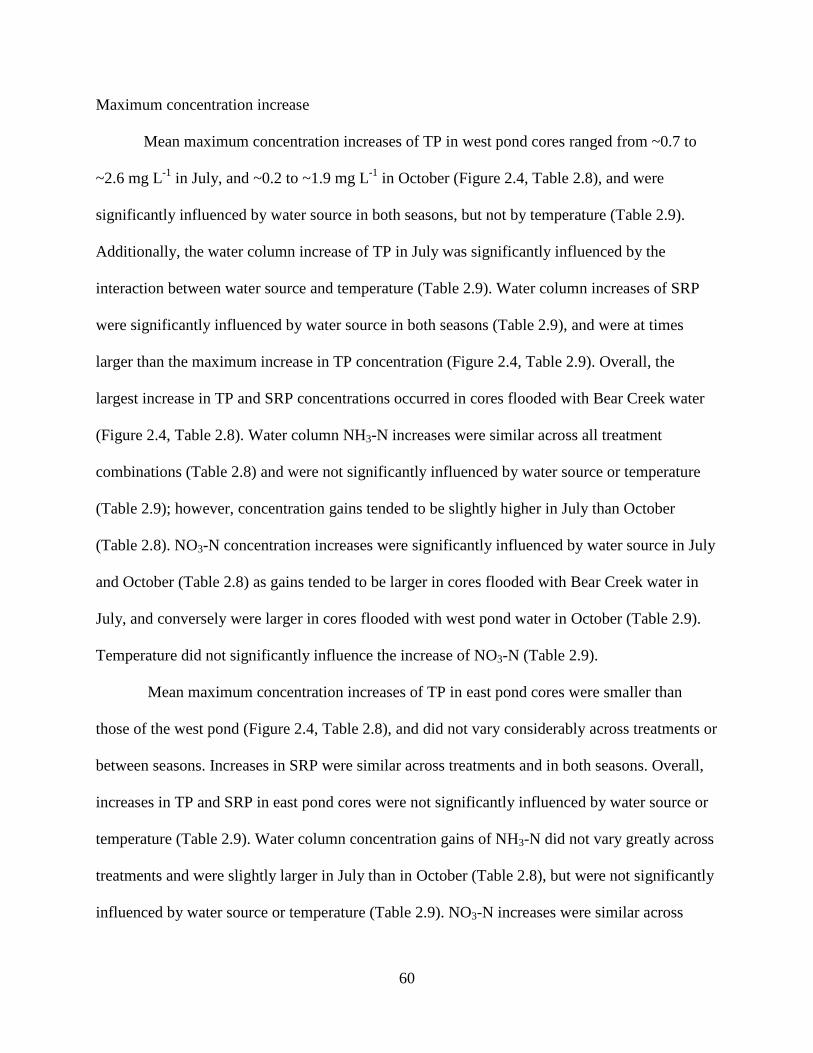
Maximum concentration increase
Mean maximum concentration increases of TP in west pond cores ranged from ~0.7 to
~2.6 mg L-1 in July, and ~0.2 to ~1.9 mg L-1 in October (Figure 2.4, Table 2.8), and were
significantly influenced by water source in both seasons, but not by temperature (Table 2.9).
Additionally, the water column increase of TP in July was significantly influenced by the
interaction between water source and temperature (Table 2.9). Water column increases of SRP
were significantly influenced by water source in both seasons (Table 2.9), and were at times
larger than the maximum increase in TP concentration (Figure 2.4, Table 2.9). Overall, the
largest increase in TP and SRP concentrations occurred in cores flooded with Bear Creek water
(Figure 2.4, Table 2.8). Water column NH3-N increases were similar across all treatment
combinations (Table 2.8) and were not significantly influenced by water source or temperature
(Table 2.9); however, concentration gains tended to be slightly higher in July than October
(Table 2.8). NO3-N concentration increases were significantly influenced by water source in July
and October (Table 2.8) as gains tended to be larger in cores flooded with Bear Creek water in
July, and conversely were larger in cores flooded with west pond water in October (Table 2.9).
Temperature did not significantly influence the increase of NO3-N (Table 2.9).
Mean maximum concentration increases of TP in east pond cores were smaller than
those of the west pond (Figure 2.4, Table 2.8), and did not vary considerably across treatments or
between seasons. Increases in SRP were similar across treatments and in both seasons. Overall,
increases in TP and SRP in east pond cores were not significantly influenced by water source or
temperature (Table 2.9). Water column concentration gains of NH3-N did not vary greatly across
treatments and were slightly larger in July than in October (Table 2.8), but were not significantly
influenced by water source or temperature (Table 2.9). NO3-N increases were similar across
60

treatments and in both seasons (Table 2.8), and were not significantly influenced by water source
or temperature (Table 2.9).
61

Table 2.8. Comparison of the mean (±1 SE, n=6) maximum concentration increases of TP, SRP, NH3-N, and NO3-N in July and
October for west and east pond sediment cores under the various treatment combinations.
Sediment Source Date Treatment Combination TP SRP NH3-N NO3-N ────────────── mg L-1 ──────────────
West Pond July Ambient: West Pond Water 0.73 ±0.16 0.88 ±0.11 2.54 ±0.51 1.03 ±0.39 +2°C: West Pond Water 1.07 ±0.17 1.05 ±0.18 3.01 ±0.66 0.62 ±0.31
Ambient: Bear Creek Water 1.79 ±0.36 1.35 ±0.22 2.72 ±0.58 1.55 ±0.08 +2°C: Bear Creek Water 2.63 ±0.53 1.52 ±0.22 2.77 ±0.79 1.19 ±0.38
October Ambient: West Pond Water 0.19 ±0.08 0.26 ±0.06 1.15 ±0.11 2.16 ±0.13 +2°C: West Pond Water 0.59 ±0.24 0.59 ±0.21 1.80 ±0.4 2.12 ±0.17
Ambient: Bear Creek Water 1.90 ±0.27 1.37 ±0.34 2.55 ±0.87 1.17 ±0.20 +2°C: Bear Creek Water 1.02 ±0.23 0.86 ±0.18 1.90 ±0.73 1.77 ±0.33
East Pond July Ambient: East Pond Water 0.12 ±0.02 0.07 ±0.02 2.86 ±0.68 2.21 ±0.68
+2°C: East Pond Water 0.14 ±0.03 0.07 ±0.01 2.60 ±0.56 1.55 ±0.50 Ambient: Bear Creek Water 0.14 ±0.01 0.08 ±0.01 2.61 ±0.67 2.38 ±0.63
+2°C: Bear Creek Water 0.14 ±0.01 0.08 ±0.02 2.32 ±0.59 1.69 ±0.53 October Ambient: East Pond Water 0.07 ±0.02 0.03 ±0.01 2.14 ±0.86 2.14 ±0.56
+2°C: East Pond Water 0.08 ±0.02 0.03 ±0.01 1.99 ±0.67 2.68 ±0.82 Ambient: Bear Creek Water 0.12 ±0.05 0.03 ±0.01 1.47 ±0.58 2.06 ±0.52
+2°C: Bear Creek Water 0.07 ±0.01 0.05 ±0.02 1.28 ±0.45 2.13 ±0.67
62
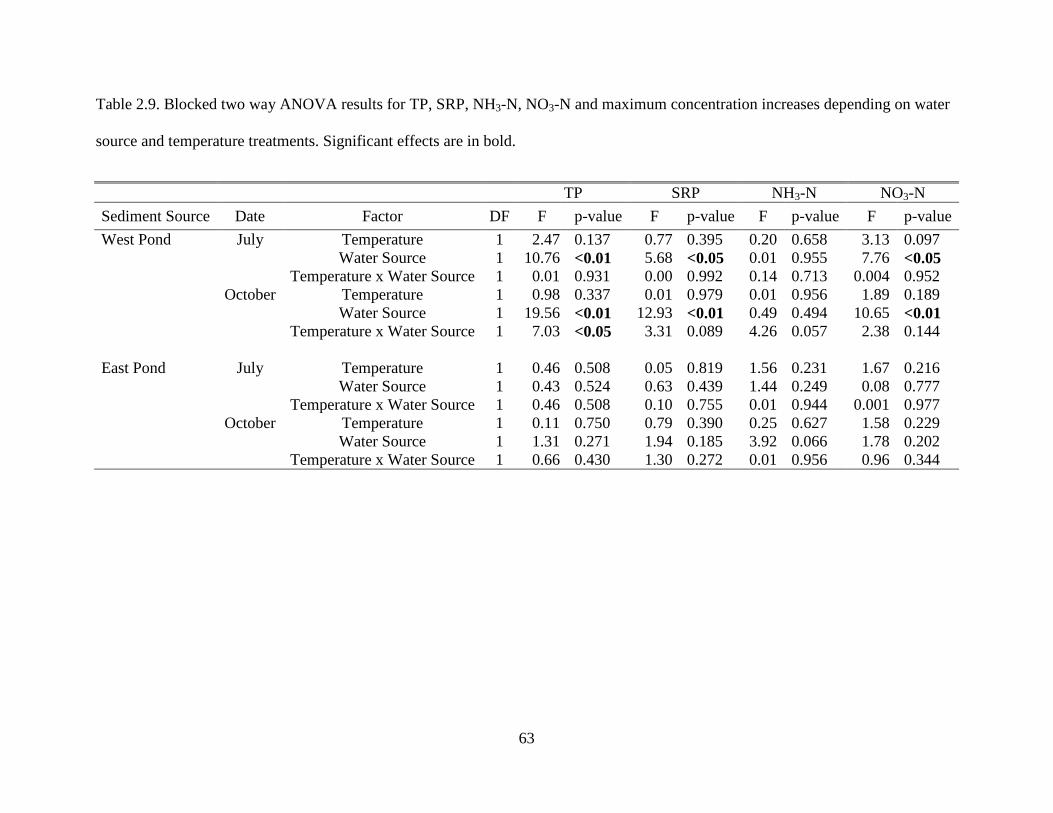
Table 2.9. Blocked two way ANOVA results for TP, SRP, NH3-N, NO3-N and maximum concentration increases depending on water
source and temperature treatments. Significant effects are in bold.
TP SRP NH3-N NO3-N Sediment Source Date Factor DF F p-value F p-value F p-value F p-value West Pond July Temperature 1 2.47 0.137 0.77 0.395 0.20 0.658 3.13 0.097
Water Source 1 10.76 <0.01 5.68 <0.05 0.01 0.955 7.76 <0.05 Temperature x Water Source 1 0.01 0.931 0.00 0.992 0.14 0.713 0.004 0.952
October Temperature 1 0.98 0.337 0.01 0.979 0.01 0.956 1.89 0.189 Water Source 1 19.56 <0.01 12.93 <0.01 0.49 0.494 10.65 <0.01
Temperature x Water Source 1 7.03 <0.05 3.31 0.089 4.26 0.057 2.38 0.144 East Pond July Temperature 1 0.46 0.508 0.05 0.819 1.56 0.231 1.67 0.216
Water Source 1 0.43 0.524 0.63 0.439 1.44 0.249 0.08 0.777 Temperature x Water Source 1 0.46 0.508 0.10 0.755 0.01 0.944 0.001 0.977
October Temperature 1 0.11 0.750 0.79 0.390 0.25 0.627 1.58 0.229 Water Source 1 1.31 0.271 1.94 0.185 3.92 0.066 1.78 0.202
Temperature x Water Source 1 0.66 0.430 1.30 0.272 0.01 0.956 0.96 0.344
63
Discussion
Previous studies have shown that drained agricultural soils can release nutrients upon
reflooding (Pant and Reddy, 2003; Duff et al., 2009; Ardón et al., 2010; Kinsman-Costello et al.,
2014), but fewer studies have investigated nutrient dynamics in flooded agricultural soils in
response to hydrologic reconnection as part of a wetland restoration. Here I show, based on
laboratory experiments, that hydrologic reconnection of a creek and flooded agricultural area can
result in nutrient release, and thus have negative impacts on downstream water quality. My
results also indicate the degree to which nutrients serve as a source are influenced by land use
history (Sharpley et al. 2013). Overall, the core water column nutrient concentrations, maximum
apparent nutrient release rates, and maximum nutrient concentration increases from the July and
October experiments clearly show that reconnecting the west pond to Bear Creek has the
potential to significantly increase the flux of P from the sediment to the water column in this
area.
The source of this release is likely the P that accumulated in the soils during the time the
area was used for celery production, as well as the wetland history of the area. Phosphorus
amendments in agricultural areas can accumulate in both biotic and abiotic compartments of the
ecosystem (Reddy et al., 2005) due to the incorporation of P in organic matter and the adsorption
of P by soil and sediments (Sharpley et al., 2013). Soil and sediment accumulation of P has been
observed as a result of agricultural operations, including dairy ranching (Dunne et al., 2011),
poultry production (Slaton et al., 2004), and the production of crops (Townsend and Porder,
2012) such as celery (Steinman and Ogdahl, 2011). Erosion, land development (Sharpley et al.,
2013), reflooding (Kinsman-Costello et al., 2014), decreased external P loading (Fisher and
Reddy, 2001), and changes in concentration gradients (Pant and Reddy, 2003) can mobilize this
64
accumulated P and result in a flux of P from the sediment to the water column. A concentration
gradient was established in the west pond cores once the high P sediments were exposed to the
relatively low P concentration in Bear Creek water, resulting in P release due to diffusion. This
was not the case when west pond sediments were exposed to west pond water, as the P
concentration in the water column was relatively high, and the sediments and water column were
already in an equilibrated state. Indeed, distinct water column characteristics can be seen when
examining the water in the two areas as measured in the field, as well as when comparing the
characteristics of the water used to refill the core tubes. As a result, we observed a much smaller
release of P in the cores where west pond sediments were exposed to west pond water as
compared to when west pond sediments were exposed to Bear Creek water.
In several instances in my study, SRP maximum apparent release rates and maximum
concentration increases in sediment cores from the west pond are reported as being larger than
those measured for TP. Although this may appear to be an error, as SRP is indeed a component
of TP, it is important to note that absolute SRP concentrations were always lower than TP
concentrations, even though the maximum rates of increase and maximum concentration
increases were sometimes greater. To explain, TP and SRP release rates in my study were
sometimes calculated over different time periods in order to capture the maximum apparent rate.
This contributed to SRP release rates exceeding TP release rates in some cases. Additionally,
sediment SRP release rates as well as concentration increases can exceed TP release naturally, as
was observed in multiple sediment cores in my study. In brief, this can occur when core water
column SRP increases, but the concentrations of additional components of TP, such as sorbed
and complexed inorganic or organic P decrease over the incubation time. This can then cause the
maximum release rates and maximum concentration increases of TP to be lower in relation to
65
that of SRP. Although sorbed and complexed P fractions were not directly measured in my
study, calculations in which water column SRP concentrations were subtracted from TP
concentrations in the same core tube over the incubation time revealed multiple instances in
which components of TP that were not directly measured decreased from initial concentrations
over the incubation period. Because SRP release rates and concentration increases were typically
similar if not larger when compared to TP release rates and concentration increases, this
highlights the fact that the majority of the P being released from west pond sediments in certain
cases is SRP. SRP is an extremely reactive and bioavailable form of P when compared to sorbed
and complexed organic and inorganic P in aquatic ecosystems (Welch and Jacoby, 2004). This
indicates even more pointedly the negative impacts that hydrologic reconnection of the two
ponds to Bear Creek, without proper consideration of the ponds as P sources, could potentially
have on downstream water quality.
In contrast to the west pond, my work indicates that reconnecting the east pond to Bear
Creek will not significantly increase P release rate; however, P will still be released from the
sediment to the water column. The lack of a water source effect in the east pond may be related
to prior dredging, which removed much of the enriched sediment, exposing sediments that may
have high P adsorption capacities. Dredging has been used to decrease internal nutrient loading
in lakes, and has been shown to significantly reduce water column P concentrations in lakes
when coupled with a reduction in external loading (Does et al., 1992; Kleeberg and Kohl, 1999).
The relatively high concentrations of Ca and Fe in the east pond sediments may also have limited
the amount of P release in this area. In wetlands, P solubility is largely regulated by the presence
of Fe and Ca (Reddy et al., 1999), and Fe:P ratios greater than 15:1 have been shown to
significantly predict and limit the release of soluble P from oxic sediments in shallow lakes
66
(Jensen et al., 1992). Yet, this ratio has proven to be a coarse indicator of potential P dynamics as
measurements of total Fe and P include forms that may be unavailable for adsorption (Rydin et
al., 2000), and the specific form of P in the sediment will also strongly influence its mobility
under anoxic conditions (Pilgrim et al., 2007), as well as its solubility and bioavailability
(Psenner et al. 1988). Despite these caveats, Fe:P ratios in the sediments of my study area were
on average lower than the coarse threshold of 15:1; however, Fe:P ratios were significantly
higher in the east pond than the west, potentially contributing to the smaller degree of P release I
observed in the east pond. In alkaline environments, forms of Ca such as calcite or calcium
hydroxide can bind P and form insoluble compounds such as apatite and hydroxyapatite (Cooke
et al., 1993; Reddy et al., 1999). My study sites were somewhat alkaline, ranging in pH from 7.8
to 9.2, indicating the potential for this retention mechanism to occur. However, P binding to Ca
may be a short-term phenomenon, as large percentages of this bound P can be released if water
column pH decreases to less than ~8 (Diaz et al., 1994). In my study area, the removal of
sediment P and organic matter by dredging, as well as the presence of high concentrations of Ca
and Fe in the east pond sediments, could account for decreased concentrations of P in east pond
water as well as low P release from the east pond sediment.
Given that the sediments of both ponds will release P, albeit to different degrees, there
are water quality implications for downstream water bodies. It is likely that a substantial amount
of P released from sediments within the two ponds would reach Bear Lake due to the short
distance between the ponds and the lake. In response to excess algal growth and elevated P
concentrations, Bear Lake was placed on the Section 303(d) list of impaired and threatened
waters as part of the Federal Clean Water Act in 2008 (MDEQ, 2008b). As required, the state of
Michigan then developed a Total Maximum Daily Load (TMDL) for the lake, stipulating a 50%,
67
or 848 lb/yr, reduction in the external load of P, in order to reduce the seasonal (April-
September) TP average from 0.044 to 0.03 mg L-1 P in the water column (MDEQ, 2008a).
However, my work indicates that reconnection of the two ponds to Bear Creek will likely result
in more P reaching Bear Lake, unless the restoration design takes into consideration the ponds as
potential sources of P.
Hydrologic reconnection also has implications beyond those related to nutrient exchange.
When two previously separated biological communities mix, species can coexist or be added or
subtracted (Livingston et al., 2013), which can then influence biogeochemical processes in the
area where mixing occurs. With respect to species addition, the migration of fish species from
Bear Creek and Bear Lake into the ponds could potentially increase nutrient release. Studies
have shown that P excretion from fish can constitute a large fraction of the P load in lakes
(Persson, 1997), in addition to the direct release of N and P by benthic feeding fish, such as carp
(Breukelaar et al., 1994). Conversely, reconnection of the ponds to Bear Creek would likely
stimulate deposition of suspended sediments in the two ponds, which would increase nutrient
retention; sedimentation of nutrients bound to particles is common in wetlands (Reddy and
DeLaune, 2004), and wetlands of sufficient size can significantly reduce the amount of total
suspended solids in the water column during flood events (Koskiaho, 2003). Reestablishment of
wetland vegetation in the ponds could also aid in retention of N and P due to their ability to take
up and store N and P in their biomass (Reddy and DeLaune, 2004). However, the majority of
nutrients stored in the aboveground biomass will be released after a short time due to the
relatively short cycles of growth and senescence in wetland plants (Richardson, 1985).
Previous work has found that elevated temperatures can increase the release of P from
sediments (Holdren and Armstrong, 1980; Steinman et al. 2009), and limit the amount of P
68

adsorption by sediment particles (Redshaw et al., 1990); however, this result was not observed in
my study. The studies cited above attribute increased P release and decreased P adsorption to
reducing conditions created by the stimulation of benthic microbial respiration at higher
temperatures. The depletion of sediment oxygen can then result in facultative microorganisms
reducing ferric iron, a major mineral associated with P binding, by using it as an electron
acceptor during metabolism (Reddy et al., 1999). The reduction of Fe results in the release of
previously bound P. Because the water column of my sediment cores was maintained in an oxic
condition, this may have negated the impacts of increasing microbial activity on sediment
oxygen concentrations, and masked the potential effect that increasing temperatures would have
on the anoxic/oxic boundary in the sediment. Additionally, the relatively small temperature
difference between my two treatments coupled with the large amount of inter-site variability in
sediment chemistry and physical properties throughout my study area may have limited my
availability to detect a significant impact due to temperature.
In contrast to the increased release of P due to the simulated reconnection of Bear Creek
to the west pond, I observed no consistently significant impact of water source on N dynamics in
either pond. Yet, previous work has found that restoring wetland hydrology to a former
agricultural unit resulted in that area acting as a significant source of NH4-N and dissolved
organic N (Ardón et al., 2010). Although I did not observe a strong response of N concentrations
due to water source treatment, I was still able to observe consistent patterns of N dynamics in my
core tubes. These dynamics represent microbial reactions that occur as part of the aquatic N
cycle; however, they may not be indicative of what will happen in the two ponds in situ. I
contend that the inverse relationship in NH3-N and NO3-N dynamics in my study could be
explained by the interacting processes of ammonification in the anoxic sediment and nitrification
69

in the oxic water column. First, water column NH3-N/NH4-N concentrations increased over the
incubation time due to the mineralization of organic N in the sediment. Because of this, NH3-
N/NH4-N concentrations reached sufficient levels that facilitated the proliferation of nitrifying
microbes which use NH3-N/NH4-N as a substrate. Subsequently, we observed a decrease in NH3-
N/NH4-N concentrations and an increase in NO3-N concentration due to this reaction. This is a
textbook example of two reactions that occur in the N cycle; however, the increase of NH3-
N/NH4-N concentrations that was observed in my sediment cores may not be an accurate
representation of what would happen in the two ponds as much of NH3-N/NH4-N produced due
to mineralization would be taken up by algal cells in the water column, and not allowed to
concentrate. Because my cores were a closed system, were incubated in the dark, and the
majority of algal cells were filtered out of the water column, this may have prevented normal
algal NH3-N/NH4-N uptake and allowed NH3-N/NH4-N concentrations to rise in the water
column. Although this response may not be an accurate representation of what would happen in
situ in the two fields, it can still serve as a demonstration of the microbial transformations that
occur in the aquatic N cycle. However, direct measurements of N cycling processes are needed
to confirm the mechanisms at work.
The contrasting fates of N and P in agricultural systems also could help explain why I
observed no significant impact of water source on N dynamics. Unlike P, which has the tendency
to accumulate in the soils and sediments of agricultural systems due to its binding to soil
minerals (Hill and Robinson, 2012; Sharpley et al., 2013), reactive N is relatively more mobile,
and can be lost from an ecosystem through volatilization to gaseous forms of N or transport of
soluble reactive N in groundwater (Robertson and Vitousek, 2009). Consequently, there may be
70
a relatively smaller buildup of legacy N compared to P in agricultural systems, and because of
this a smaller risk of release in response to changes in hydrology.
In addition to the lack of an effect from water source treatment, temperature also had no
significant impact on N release in either pond. This may be partly due to the fact that temperature
affects many different, and sometimes opposing, transformations in the aquatic N cycle such as
mineralization, nitrification, and denitrification (Kadlec and Reddy, 2001). Thus, temperature
may have stimulated multiple opposing microbial N transformations, resulting in a zero net
difference of source/sink dynamics. Again, I observed large amounts of inter-site variability
within each pond; this variability in sediment characteristics likely affected N dynamics, and
possibly hindered my ability to find statistically significant effects on nutrient flux among my
four treatment combinations.
Seasonality is generally recognized as a major influence on ecosystem functioning in
wetlands (Kadlec and Reddy, 2001); yet, in general I did not see a large disparity in nutrient
dynamics between my two seasonal experiments, besides the decrease in the magnitude of P
concentrations in October compared to July. This may be because the temperature differences
were relatively modest (23 vs. 17°C); a larger temperature difference may very well have
produced different results. It has been shown that seasonal changes in temperature have a part in
controlling soil moisture and biogeochemical processes regulating organic matter decomposition,
enzyme activity, dissolved organic matter production, and the emission of various gasses (Reddy
and DeLaune, 2004). Additionally, because my experiments were performed in the laboratory,
many other seasonal changes that effect wetlands were not able to be incorporated. Seasonal
hydrologic changes have been shown to strongly impact sediment redox state (Reddy and
DeLaune, 2004), plant growth, and nutrient loading (Kadlec and Reddy, 2001). Additionally, the
71
seasonal growth and senescence patterns of wetland plants can also influence nutrient dynamics
and result in greater nutrient retention in the growing season, with subsequent nutrient release
when the plants senesce and decompose (Kröger et al., 2007).
Conclusions
Intact sediment cores from two flooded fields that were formerly used for celery farming
were used to estimate the dynamics of N and P in response to hydrologic reconnection and
climate warming. My results showed that sediments from the two ponds have the potential to
contribute P to the water column once the two areas are reconnected to Bear Creek due to the
presence of legacy P; however, reconnection significantly increased P release only in the west
pond. The flux of N from both ponds was not consistently and significantly influenced by
reconnection. In addition, increased incubation temperatures did produce a consistently
significant effect on the flux of N or P from either pond in this study. Overall, the effects of
warming on nutrient dynamics were much less pronounced than effects related to previous land
use.
Because the reconnected wetlands would discharge to a water body that is already
impaired due to high P concentrations, any restoration design must take into consideration water
quality as well as habitat improvement. Preventative measures such as chemical amendments or
dredging may potentially remove or bind a large amount of the P that is present, and make the
area more suitable for P retention. This study reinforces the need to study sediment nutrient
content and release prior to any wetland restoration, especially when the proposed restoration
area is on agricultural land.
72
Literature cited
APHA. 1998. Standard methods for the examination of water and waste water. American Public
Health Association.Washington DC, 20th ed.
Ardón, M., J.L. Morse, M.W. Doyle, and E.S. Bernhardt. 2010. The water quality consequences
of restoring wetland hydrology to a large agricultural watershed in the Southeastern Coastal
Plain. Ecosystems 13: 1060–1078.
Breukelaar, A.W., E.H. Lammens, J.G.P. Klein Bretler, and I. Tatrai. 1994. Effects of
benthivorous bream (Abramis brama) and carp (Cyprinus carpio) on sediment
resuspension and concentrations of nutrients and chlorophyll a. Freshwater Biol. 32: 113–
121.
Cooke, G.D., E.B. Welch, A.B. Martin, D.G. Fulmer, J.B. Hyde, and G.D. Schrieve. 1993.
Effectiveness of Al, Ca, and Fe salts for control of internal phosphorus loading in shallow
and deep lakes. Hydrobiologia 253: 323–335.
Diaz, O.A., K.R. Reddy, and P.A. Moore. 1994. Solubility of inorganic phosphorus in stream
water as influenced by pH and calcium concentration. Water Res. 28: 1755–1763.
Does, J., P. Verstraelen, P. Boers, J. Roestel, R. Roijackers, and G. Moser. 1992. Lake
restoration with and without dredging of phosphorus-enriched upper sediment layers.
Hydrobiologia 233: 197–210.
73
Duff, J.H., K.D. Carpenter, D.T. Snyder, K.K. Lee, R.J. Avanzino, and F.J. Triska. 2009.
Phosphorus and nitrogen legacy in a restoration wetland, Upper Klamath Lake, Oregon.
Wetlands 29: 735–746.
Dunne, E.J., M.W. Clark, R. Corstanje, and K.R. Reddy. 2011. Legacy phosphorus in subtropical
wetland soils: influence of dairy, improved and unimproved pasture land use. Ecol. Eng. 37:
1481–1491.
Erwin, K.L. 2009. Wetlands and global climate change: the role of wetland restoration in a
changing world. Wetl. Ecol. Manag. 17: 71–84.
Ferrati, R., G. Ana Canziani, and D. Ruiz Moreno. 2005. Esteros del Ibera: hydrometeorological
and hydrological characterization. Ecol. Modell. 186: 3–15.
Fisher, M.M., M. Brenner, and K.R. Reddy. 1992. A simple, inexpensive piston corer for
collecting undisturbed sediment/water interface profiles. J. Paleolimnol. 7: 157–161.
Fisher, M.M., and K.R. Reddy. 2001. Phosphorus flux from wetland soils affected by long-term
nutrient loading. J. Environ. Qual. 30: 261–271.
Gibbs, J.P. 2000. Wetland loss and biodiversity conservation. Conserv. Biol. 14: 314–317.
Hayhoe, K., J. VanDorn, T. Croley, N. Schlegal, and D. Wuebbles. 2010. Regional climate
change projections for Chicago and the US Great Lakes. J. Great Lakes Res. 36: 7–21.
Hill, C.R., and J.S. Robinson. 2012. Phosphorus flux from wetland ditch sediments. Sci. Total
Environ. 437: 315–322.
74

Holdren, G.C., and D.E. Armstrong. 1980. Factors affecting phosphorus release from intact lake
sediment cores. Environ. Sci. Technol. 14: 2–7.
Jensen, H., P. Kristensen, E. Jeppesen, and A. Skytthe. 1992. Iron: phosphorus ratio in surface
sediment as an indicator of phosphate release from aerobic sediments in shallow lakes.
Hydrobiologia 235/236: 731–743.
Kadlec, R.H., and K.R. Reddy. 2001. Temperature effects in treatment wetlands. Water Environ.
Res. 73: 543–557.
Kinsman-Costello, L.E., J. O’Brien, and S.K. Hamilton. 2014. Re-flooding a historically drained
wetland leads to rapid sediment phosphorus release. Ecosystems 17: 641–656.
Kleeberg, A., and J. Kohl. 1999. Assessment of the long-term effectiveness of sediment dredging
to reduce benthic phosphorus release in shallow Lake Müggelsee (Germany).
Hydrobiologia 394: 153–161.
Koskiaho, J. 2003. Flow velocity retardation and sediment retention in two constructed wetland
ponds. Ecol. Eng. 19: 325–337.
Kröger, R., M.M. Holland, M.T. Moore, and C.M. Cooper. 2007. Plant senescence: a mechanism
for nutrient release in temperate agricultural wetlands. Environ. Pollut. 146: 114–119.
Livingston, G., Y. Jiang, J.W. Fox, and M.A. Leibold. 2013. The dynamics of community
assembly under sudden mixing in experimental microcosms. Ecology 94: 2898–2906.
75
Michigan Department of Environmental Quality (MDEQ). 2008a. Total maximum daily load for
phosphorus for Bear Lake, Muskegon County. Michigan Department of Environmental
Quality, Water Bureau, Lansing, Michigan. http://www.michigan.gov/documents/deq/wb-
swas-tmdl-bearlake_258228_7.pdf.
Michigan Department of Environmental Quality (MDEQ). 2008b. Water quality and pollution
control in Michigan. Michigan Department of Environmental Quality, Water Bureau,
Lansing, Michigan. http://www.michigan.gov/documents/deq/wb-swas-ir-final-
2008report_230026_7.pdf.
Millennium Ecosystem Assessment, 2005. Ecosystems and human well-being: wetlands and
water synthesis. World Resources Institute, Washington, DC.
http://www.millenniumassessment.org/documents/document.358.aspx.pdf.
Pant, H.K., and K.R. Reddy. 2003. Potential internal loading of phosphorus in a wetland
constructed in agricultural land. Water Res. 37: 965–972.
Persson, A. 1997. Phosphorus release by fish in relation to external and internal load in a
eutrophic lake. Limnol. Oceanogr. 42: 577–583.
Pilgrim, K.M., B.J. Huser, and P.L. Brezonik. 2007. A method for comparative evaluation of
whole-lake and inflow alum treatment. Water Res. 41: 1215–1224.
Psenner, R., B. Boström, M. Dinka, K. Pettersson, R. Pucsko, and M. Sager. 1988. Fractionation
of phosphorus in suspended matter and sediment. Arch. Hydrobiol. Beih. Ergebn. Limnol,
30: 98-103.
76

R Core Team (2013). R: A language and environment for statistical computing. R Foundation for
Statistical Computing, Vienna, Austria. URL http://www.R-project.org/.
Reddy, R.K., and R.D. DeLaune. 2004. Biogeochemistry of wetlands: science and applications.
I. Taylor and Francis, Boca Raton, FL.
Reddy, K.R., R.H. Kadlec, and P.M. Gale. 1999. Phosphorus retention in streams and wetlands:
a review. Crit. Rev. Environ. Sci. Technol. 29: 83–146.
Reddy, K.R., R.G. Wetzel, and R.H. Kadlec. 2005. Biogeochemistry of phosphorus in wetlands.
In J. T. Sims and A. N. Sharpley (Eds.), Phosphorus: agriculture and the environment (pp.
263-316). Soil Science Society of America.
Redshaw, C.J., C.F. Mason, C.R. Hayes, and R.D. Roberts. 1990. Factors influencing phosphate
exchange across the sediment-water interface of eutrophic reservoirs. Hydrobiologia 192:
233–245.
Richardson, C.J. 1985. Mechanisms controlling phosphorus retention capacity in freshwater
wetlands. Science 228: 1424–1427.
Robertson, G.P., and P.M. Vitousek. 2009. Nitrogen in agriculture: balancing the cost of an
essential resource. Annu. Rev. Environ. Resour. 34: 97–125.
Rydin, E., B. Huser, and E.B. Welch. 2000. Amount of phosphorus inactivated by alum
treatments in Washington lakes. Limnol. Oceanogr. 45: 226–230.
77

Sharpley, A., H.P. Jarvie, A. Buda, L. May, B. Spears, and P. Kleinman. 2013. Phosphorus
legacy: overcoming the effects of past management practices to mitigate future water
quality impairment. J. Environ. Qual. 42: 1308–1326.
Slaton, N. A, K.R. Brye, M.B. Daniels, T.C. Daniel, R.J. Norman, and D.M. Miller. 2004.
Nutrient input and removal trends for agricultural soils in nine geographic regions in
Arkansas. J. Environ. Qual. 33: 1606–1615.
Smith, V.H. 2003. Eutrophication of freshwater and coastal marine ecosystems: a global
problem. Environ. Sci. Pollut. Res. 10: 126–139.
Steinman, A.D., R.R. Rediske, and R.K. Reddy. 2004. The reduction of internal phosphorus
loading using alum in Spring Lake, Michigan. J. Environ. Qual. 33: 2040–2048.
Steinman, A., X. Chu, and M. Ogdahl. 2009. Spatial and temporal variability of internal and
external phosphorus loads in Mona Lake, Michigan. Aquat. Ecol. 43: 1–18.
Steinman, A.D., and M.E. Ogdahl. 2011. Does converting agricultural fields to wetlands retain or
release P? J. North Am. Benthol. Soc. 30: 820–830.
Taylor, P.G., and A.R. Townsend. 2010. Stoichiometric control of organic carbon–nitrate
relationships from soils to the sea. Nature 464: 1178–1181.
Townsend, A.R., and S. Porder. 2012. Agricultural legacies, food production and its
environmental consequences. Proc. Natl. Acad. Sci. U.S.A. 109: 5917–5918.
78
USDA. 2012. Restoring America’s wetlands: a private lands conservation success story. Natural
Resources Conservation Service. Wetlands Reserve Program.
http://www.nrcs.usda.gov/Internet/FSE_DOCUMENTS/stelprdb1045079.pdf.
U.S. EPA. 1993. Methods for determination of inorganic substances in environmental samples.
U.S. Environmental Protection Agency, Cincinnati, OH. EPA/600/R-93/100.
http://nepis.epa.gov/Exe/ZyPDF.cgi/30002U3P.PDF?Dockey=30002U3P.PDF.
U.S. EPA. 1994. Test methods for evaluating solid waste physical/chemical methods. U.S.
Environmental Protection Agency, Cincinnai, OH. SW-846, Third Edition.
http://nepis.epa.gov/Exe/ZyPDF.cgi/50000U6E.PDF?Dockey=50000U6E.PDF.
Welch, E.B., and J.M. Jacoby. 2004. Pollutant effects in freshwater: applied limnology. 3rd ed.
Spoon Press, New York, New York.
Zedler, J. 2003. Wetlands at your service: reducing impacts of agriculture at the watershed scale.
Front. Ecol. Environ. 1: 65–72.
79
Chapter III
Conclusions and Synthesis
High quality sustainable freshwater resources are essential to all life on earth. In addition
to the fundamental provision of drinking water, freshwater resources also provide services such
as the facilitation of large scale industrial production, irrigation, flood control, hydroelectric
power production, recreation, the production of various foods, and essential habitat for large
amounts of plant and animal life (Jackson et al., 2001; Baron et al., 2002). In spite of these
benefits, large scale human activities such as agriculture, fossil fuel combustion, and land
development (Crutzen, 2002) have negatively impacted water quality through eutrophication
(Smith, 2003), wetlands loss (Millennium Ecosystem Assessment, 2005), and climate change
(Schindler, 2001). As a result, water quality is declining on a global scale (Millennium
Ecosystem Assessment, 2005; Welch and Jacoby, 2004).
In response to this global decline, many environmental restoration projects have been
initiated that aim to improve water quality. Naturally occurring wetland ecosystems typically
improve water quality; thus, because large areas of wetlands have been degraded and destroyed
throughout history, wetland restoration and creation is viewed as a viable way to facilitate water
quality improvement (Zedler, 2000).Yet, the effectiveness of wetland restoration can be limited
by prior land use of the restoration area—hence, rehydration of previously drained agricultural
areas as part of restoration may have negative impacts on water quality (Pant and Reddy, 2003;
Duff et al., 2009; Ardón et al., 2010; Kinsman-Costello et al., 2014). Additionally, changes in
hydrology and temperature due to climate change are seen as major threats to natural and
80

restored wetlands (Ferrati et al., 2005), and have the possibility to alter wetland biogeochemistry
and associated ecosystem services (Erwin, 2009).
Changes in hydrology
Previous studies have demonstrated that drained agricultural areas can release nutrients in
response to flooding, but relatively less is known in regards to how flooded agricultural areas
will respond to changes in hydrology. My study indicated that hydrologic reconnection of a
stream and floodplain within a flooded agricultural area can potentially stimulate nutrient
release, and thus have negative impacts on downstream water quality. In the west pond of my
study area, I clearly observed that hydrologic reconnection to Bear Creek will significantly
increase the flux of P from the sediment to the water column in that area. West pond sediment
cores flooded with Bear Creek water released TP at rates and concentrations that were
significantly greater than when west pond cores were flooded with west pond water. Indeed, west
pond TP release rates approached ~60 mg m-2 d-1 when flooded with Bear Creek water. Overall,
west pond TP release rates ranged from ~6 to ~60 mg m-2 d-1 when considering both water source
treatments, indicating a consistent potential for P release. Although hydrologic reconnection did
not stimulate increased P flux in the east pond, I also observed a release of P from the sediment
to the water column in this area regardless of water source treatment (~2 to ~5mg TP m-2 d-1). In
comparison to other systems, Carter and Dzialowski (2012) measured TP release using intact
sediment cores incubated under anoxic conditions from 17 reservoirs of varying trophic status
conditions and found that mean TP release rates ranged from ~2 to ~36 mg m-2 d-1. Additionally,
Nürnberg and Lazerte (2004) report mean sediment TP release rates under anaerobic conditions
81
ranging from ~0 to ~30 mg m-2 d-1 when analyzing 91 small lakes ranging from oligotrophic to
hyper-eutrophic. The release rates I measured when sediments from the two ponds were flooded
with Bear Creek water and incubated under aerobic conditions further illustrate the large
potential of my study area overall, and the west pond especially, to be a large and significant P
source.
To more clearly examine and illustrate how reconnection could impact water quality and
the load of P supplied to Bear Lake, I used my data to calculate different scenarios of potential
TP loading that would occur if the two ponds are reconnected to Bear Creek. In order to do this, I
first calculated average sediment TP release rates for both ponds using data from my sediment
coring experiment in Chapter II. This calculation was based on an estimate of average TP release
rate over the entire incubation time. This calculation is in contrast to the maximum release rates
that were calculated in Chapter II, which are unlikely to persist over long time periods in nature,
and hence would have likely overestimated true potential loading. In brief, average TP release
rates were calculated using the change from initial to final water column TP concentration for
sediment cores that were flooded with Bear Creek water in July and October experiments.
Because there was no significant effect of temperature on P release, release rates from cores
incubated at ambient and +2°C temperature treatments were combined to determine the mean
average release rate (n=4). From this, I then calculated maximum, mean, and minimum, average
TP release rates. Maximum, mean, and minimum average release rates (mg TP m-2d-1) were then
converted into loadings (lbs TP d-1), in order to be consistent with the format of the Bear Lake
TMDL. These daily loadings were then extrapolated to calculate the amount of loading that
would be expected to occur using three different scenarios of loading days per year. The three
scenarios were 270 days, 182 days, and 91 days, representing liberal, moderate, and conservative
82
periods of release. I did not include 365 days, as it is highly unlikely release is occurring during
winter months due to the cold temperatures (cf. Steinman et al. 2009). Additionally, I
incorporated three scenarios in which I varied the percentage of the TP load leaving the pond
sediments that would actually reach Bear Lake. The three scenarios of load percentage reaching
Bear Lake were 100%, 50%, and 10%. Again, because of the short distance between the ponds
and Bear Lake, it is likely that a higher rather than lower percentage of TP released by the ponds
would enter the lake basin. Finally, from the calculations of average release rates, average daily
loadings, period of loading, and percentage TP reaching Bear Lake, I estimated the amount of TP
that would be expected to enter Bear Lake upon reconnection of the two ponds to Bear Creek on
an annual basis. Although the designations used in this analysis are somewhat arbitrary, it
nonetheless helps to visualize a wide range of potential P loading from the ponds to Bear Lake,
and allows for estimates of uncertainty.
The results of the above calculations show that reconnecting the two ponds to Bear Creek
without accounting for the potential for P release could add large and wide ranging amounts of
TP to Bear Lake (Table 3.1, Table 3.2). Overall, the calculations indicate that the west pond has
the potential to contribute 10-959 lbs TP yr-1 (Table 3.1) to Bear Lake, and the east pond can
potentially contribute 0.4-15 lbs TP yr-1 (Table 3.2). Again, this difference in loading between
the two ponds likely relates to the previous dredging of the east pond and its effects on sediment
TP and mineral content. Considering that just the Bear Creek TP load was estimated to be 1,529
lbs TP yr-1 (MDEQ, 2008), the addition of TP from the pond after reconnection could increase
the Bear Creek TP load by over 60% at the highest load scenario (i.e. to ~2,500 lbs TP yr-1). In
order to reach the TMDL stipulated goal of 0.03 mg L-1 TP in the Bear Lake water column, it
was estimated that the entire load of P of the lake would need to be reduced from 3,387 to 1,458
83
lbs TP yr-1 (MDEQ, 2008). Hence, reconnecting the ponds to the creek without any nutrient
reduction mitigation measures would likely exacerbate the eutrophication and harmful algal
bloom conditions in Bear Lake, and seriously limit the community’s ability to meet the TMDL
target for TP. Overall, it is clear that reconnecting the two ponds to Bear Creek without proper
restoration would produce effects counteractive to the TMDL and to water quality goals for Bear
Lake.
84

Table 3.1. Summary of results illustrating the additional TP load that would be added to Bear Lake once Bear Creek is reconnected to
the west pond when considering a range of: average release rates; average daily loads; period of loading; and percent of the load
reaching Bear Lake.
West Pond
Maximum Mean Minimum
Avg. release rate (mg TP m-2d-1) 18.09 10.87 5.75
Avg. daily load (lbs TP d-1) 3.55 2.13 1.13
Period of yearly loading (days) 270 182 91 270 182 91 270 182 91
Percent load reaching Bear
Lake (%) 100 50 10 100 50 10 100 50 10 100 50 10 100 50 10 100 50 10 100 50 10 100 50 10 100 50 10
Load (lbs TP yr-1) 959 479 96 646 323 65 323 162 32 576 288 58 388 194 39 194 97 19 305 152 30 205 103 21 103 51 10
85
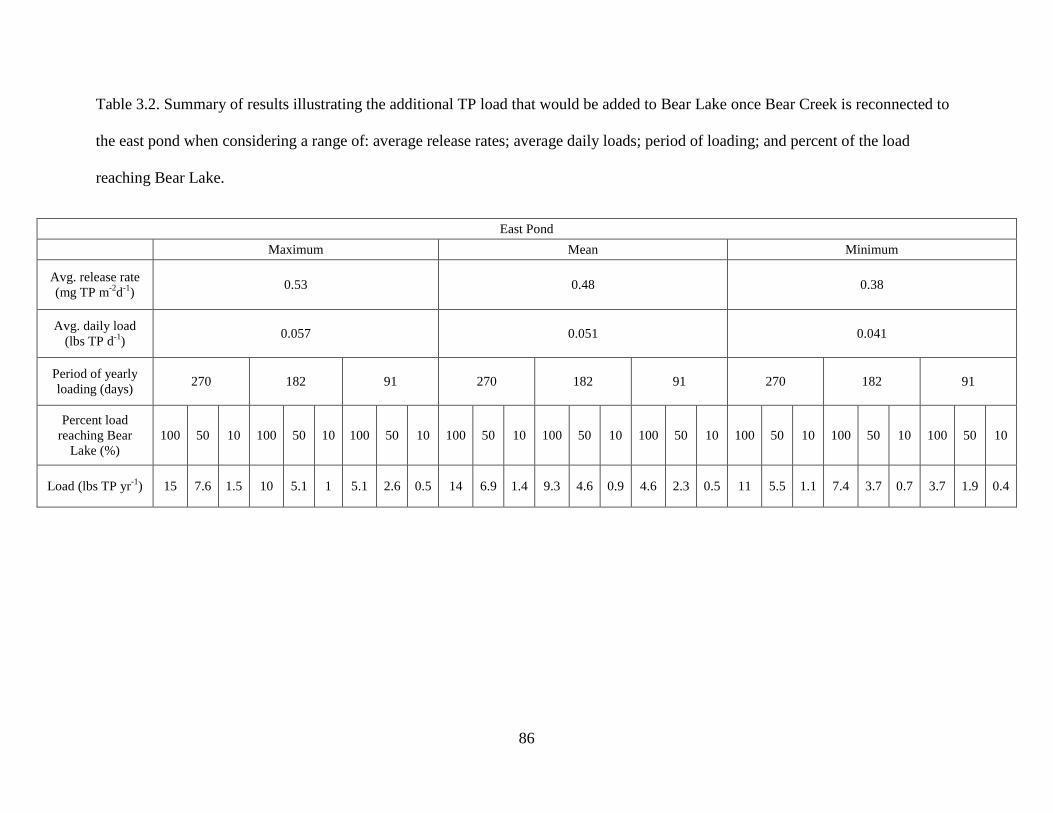
Table 3.2. Summary of results illustrating the additional TP load that would be added to Bear Lake once Bear Creek is reconnected to
the east pond when considering a range of: average release rates; average daily loads; period of loading; and percent of the load
reaching Bear Lake.
East Pond
Maximum Mean Minimum
Avg. release rate (mg TP m-2d-1) 0.53 0.48 0.38
Avg. daily load (lbs TP d-1) 0.057 0.051 0.041
Period of yearly loading (days) 270 182 91 270 182 91 270 182 91
Percent load reaching Bear
Lake (%) 100 50 10 100 50 10 100 50 10 100 50 10 100 50 10 100 50 10 100 50 10 100 50 10 100 50 10
Load (lbs TP yr-1) 15 7.6 1.5 10 5.1 1 5.1 2.6 0.5 14 6.9 1.4 9.3 4.6 0.9 4.6 2.3 0.5 11 5.5 1.1 7.4 3.7 0.7 3.7 1.9 0.4
86

It is well known that historic human activity and the legacy of previous land use
influences ecosystem structure and function (Foster et al., 2003). Often, the specific land use
history of an area can delay or prevent environmental recovery, as well as result in a disparity
between expected environmental improvements and reality (Carpenter, 2005; Meals et al., 2010;
Jarvie et al., 2013). Previous work has indicated that historic agricultural land use has had a
significant impact on terrestrial and aquatic ecosystems worldwide (Foster et al., 2003). One
significant impact of agricultural land use is legacy nutrient buildup in soil (Slaton et al., 2004;
Dunne et al., 2011; Townsend and Porder, 2012; Mattingly and Orrock, 2013; Sharpley et al.,
2013), as is the case in my study area where sediment TP concentrations averaged ~3750 mg kg-1
in the west pond, and ~960 mg kg-1 in the east pond. As evidenced by this study and others (Pant
and Reddy, 2003; Steinman and Ogdahl, 2011), this buildup of nutrients can impact source/sink
nutrient dynamics in restored wetland areas. In addition to the effects of legacy nutrients on
wetland restoration, agricultural nutrient enrichment can also have other broad ecological
impacts and influence terrestrial and aquatic invasive plant colonization (Chambers et al., 2008;
Kuhman et al., 2011), community composition (Leibold, 1999; Molofsky et al., 2013), and
ecosystem biodiversity (Isbell et al., 2013; Brönmark and Hansson, 2002). Thus, it is important
that all associated components of a restoration effort consider the specific deficiencies and
challenges represented within a proposed restoration area before beginning the project (Hobbs,
2007).
In my study, N release was generally unaffected by the different water source treatments,
which may be related to the contrasting fates of excess N and P in agricultural systems. Unlike P,
which has the tendency to accumulate in the soils and sediments of agricultural systems when
excess concentrations are applied due to its binding to soil minerals (Hill and Robinson, 2012;
87
Sharpley et al., 2013), reactive N is highly mobile in the biosphere, and excess N not taken up by
crops can be lost from an ecosystem through processes such as volatilization to gaseous forms of
N, and transport of soluble reactive N in groundwater (Robertson and Vitousek, 2009).
Confounding effects of my experimental design also may have hindered my attempts to draw
conclusions in regards to the effects of reconnection and temperature on N dynamics within my
study site. As noted above and in Chapter II, the N cycle is mediated by many different
biological processes that occur under specific environmental conditions. Because my study was
conducted in the lab under controlled environmental conditions, the N dynamics I observed may
not be a realistic example of what may occur in my study area. The sediment cores used in my
study were a closed system and incubated in the absence of light; because of this, it is possible
that the inverse relationship in NH3-N and NO3-N dynamics that was observed could be
explained by the interacting processes of ammonification in the sediment and nitrification in the
oxic water column as conditions within the core tube changed over the incubation period (Taylor
and Townsend, 2010). Thus, I propose that the initial increase in NH3-N from ammonification
was followed by both a decrease in NH3-N and an increase in NO3-N, as the conditions became
more favorable to nitrifying microbes in the water column. Although these are both
transformations that occur in the aquatic N cycle, it is unclear if these N dynamics are an artifact
of the experimental set-up, or representative of in situ conditions. More work is needed to
examine the impact of temperature and hydrology on nitrogen dynamics, as other studies have
observed a significant effect of hydrologic reconnection and temperature on wetland N dynamics
(Ardón et al., 2010; Kadlec and Reddy, 2001)
Many studies have been performed with the intent of identifying the nutrients that exert
the most control over primary productivity in freshwater ecosystems. This research is beneficial
88

for enhancing our biological knowledge of freshwater environments, and also informs us as to
what nutrients should be controlled when trying to limit eutrophication. Because costs are higher
to control both N and P, rather than just one of the two nutrients individually, the results of this
type of work have the potential to have a broad economic impact on water quality improvement
related projects (Schindler, 2012). The P limitation paradigm holds that P is the main nutrient
controlling freshwater primary productivity (Schindler, 1974; Schindler et al., 2008). In recent
history, this paradigm has strongly influenced the understanding, management, and legislation in
regards to freshwater eutrophication, resulting in actions centered on the control of P. However,
as research on nutrient limitation has continued, more recent work has begun to challenge the P
paradigm, with the recognition that both N limitation (Lewis and Wurstbaugh, 2008; North et al.,
2007) and co-limitation by N and P (Elser et al., 2007) are more common and widespread than
previously thought. Indeed, simultaneous enrichment by N and P can lead to dramatically higher
levels of production than when N or P are supplied individually (Elser et al., 2007). Although
critics of N limitation point out issues of study scale, community succession, and gradual
changes in biogeochemical cycles (Schindler, 2012), it is becoming apparent that management of
both N and P is the most effective method to attempt to limit eutrophication and improve water
quality in many water bodies (Conley et al., 2009). Thus, wetland restoration in the context of
improved nutrient retention and water quality should consider both N and P.
Changes in climate
In my study, increased temperatures did not produce a consistently significant influence
on the dynamics of N and P. However, other studies have shown that rising temperatures, and
89
changes in hydrology and weather patterns due to climate change (Mitsch and Hernandez, 2013),
are expected to alter wetland biogeochemical processes and wetland sustainability (Burkett and
Kusler, 2000; Kadlec and Reddy, 2001). Due to the effects of temperature on microbial
metabolism, climate warming has the capacity to alter the cycling of N and P, potentially
affecting the source/sink dynamics of these elements in wetlands (Kadlec and Reddy, 2001).
Previous work has also found that increases in temperature can stimulate the release of P from
sediments (Holdren and Armstrong, 1980; Steinman et al., 2009), and limit the amount of P
adsorption by sediment particles (Redshaw et al., 1990). The above studies attribute the
observation of increased P release to reduced sediment oxygen concentrations resulting from
increased benthic microbial respiration at higher temperatures. Redox-driven reactions will result
in the release of phosphorus that is associated with ferric (Fe+3) hydroxide (Mortimer, 1941).
Increased P release in response to elevated temperatures could also be a result of thermally
sensitive sediment processes related to P dynamics such as diffusion coefficients or rates of iron
oxidation, mineralization, or adsorption (Anthony and Lewis, 2012).
In regards to N, various microbial N transformations such as organic N mineralization,
nitrification, as well as denitrification, all proceed more rapidly at higher temperatures to a point
(Kadlec and Reddy, 2001). Thus, the effects of warming temperatures could potentially result in
zero net change in wetland N dynamics due to the relative acceleration of multiple opposing
transformations within the microbial N cycle. Additional work needs to be done to determine the
overall net effect on source/sink N and P dynamics in natural wetland environments in response
to warming temperatures, as well as what the effects may be in restored wetland environments.
In addition to the vulnerability of wetland biogeochemistry to elevated temperatures,
wetlands are also by nature susceptible to changes in hydrology. Consequently, predicted
90

changes in hydrology due to climate change have the potential to impact wetlands species
diversity, biogeochemistry, and sustainability (Millennium Ecosystem Assessment, 2005). In
Great Lakes coastal wetlands, climate change is expected to cause a decline in water levels to
some extent (Hayhoe et al., 2010), however, there are issues with the methodologies used to
calculate these predictions (Lofgren et al., 2011). If water levels do indeed drop, it has been
shown that this effect may facilitate the spread of invasive or nuisance species, which can
potentially influence community composition, biodiversity, and ecosystem function (Lishawa et
al., 2010). Precipitation changes due to altered weather patterns may also lead to the loss of
wetlands in certain areas due to drying out, such as prairie pothole and vernal pool wetlands
(Erwin, 2009). Additionally, when extended drying periods are followed by extreme
precipitation events, this may impact wetland biogeochemistry and stimulate nutrient release due
to redox-driven dynamics associated with sediment desiccation followed by inundation
(Steinman et al., 2012). Therefore, the combined effects of rising temperatures and changes in
hydrology due to climate change represent a large threat to many components of wetland
biogeochemistry, ecology, and sustainability.
Finally, although I did not see a large disparity in my results between the July and
October experiments, this may be because the temperatures I used were relatively warm and the
differences were relatively modest (23 vs. 17°C); a larger temperature difference may very well
have produced different results. Seasonal hydrologic changes have been shown to strongly
impact sediment redox state (Reddy and DeLaune, 2004), plant growth, and nutrient loading
(Kadlec and Reddy, 2001). Additionally, seasonal changes in temperature have a part in
controlling soil moisture and biogeochemical processes regulating organic matter decomposition,
enzyme activity, dissolved organic matter production, and the emission of various gasses (Reddy
91
and DeLaune, 2004). Finally, the seasonal growth and senescence patterns of wetland plants can
influence nutrient dynamics and result in greater nutrient retention in the growing season, with
subsequent nutrient release when the plants senesce and decompose (Kröger et al., 2007). Thus,
seasonality should be considered when studying wetland areas in regards to restoration, and
potential changes in the future.
Potential solutions
Management techniques to control water column nutrient concentrations and sediment
nutrient release are plentiful and diverse, and each technique has its own associated advantages
and disadvantages. Several common management techniques for lakes and wetlands include
phytoremediation, chemical inactivation, artificial sediment aeration, and dredging (Cooke et al.,
2005). Phytoremediation, or the use of plants and their associated microbes to remove pollutants,
is one of the less expensive and more publicly supported nutrient concentration management
techniques (Pilon-Smits, 2005). In order for phytoremediation to be successful, however, plant
biomass must be removed annually after each growing season, which leads to increased
ecosystem disturbance and habitat loss. Additionally, it may take longer to reach restoration
goals using phytoremediation when compared to other management techniques (Schnoor et al.,
1995). Chemical inactivation of nutrients using compounds such as aluminum sulfate (alum) is
another commonly used management technique, but the efficacy of alum application is variable
(Cooke et al. 2005). Alum application results in the removal of P through the
coagulation/entrapment of phosphorus containing particulates, precipitation of insoluble AlPO4,
and by sorption of P on the surfaces of aluminum hydroxide (floc) polymers that form a cap on
92

the sediment surface (Kennedy and Cooke, 1982). Negatively, alum application can adversely
impact benthic invertebrates in the short term after application (Steinman and Ogdahl, 2006), and
can produce effects toxic to aquatic organisms when applied in water bodies that have a pH of
below ~6 or above ~8 (Kennedy and Cooke, 1982; Cooke et al., 1993). Artificial hypolimnetic
oxidation, when sufficient sediment iron is present, has proven to significantly increase the rate
of P sedimentation from the water column (McQueen et al., 1986), and reduce the concentration
of ammonia in the water column during stratification (Liboriussen et al., 2009). Yet, sediment
oxidation can increase hypolimnetic temperatures (Liboriussen et al., 2009), and potentially have
an adverse effect on populations of cold water benthic fauna (Jyväsjärvi et al., 2013). Finally,
dredging is one of the most effective management techniques for controlling excess nutrient
concentrations (Cooke et al., 2005) because it removes the top layer of sediment that contains the
majority of nutrients and organic matter, and has a long-term beneficial impact. When external
loading of nutrients is small, dredging has been shown to significantly reduce water column P
concentrations in lakes (Does et al., 1992; Kleeberg and Kohl, 1999). Adversely, sediment
dredging is costly, and is extremely disruptive to benthic habitat.
Based on the results of my study, I support the previous suggestion to dredge the enriched
sediments in both ponds and apply alum in order to manage the excess P in the restoration area
(Steinman and Ogdahl, 2013). This is reasonable due to the large amounts of P in the sediment of
the west pond especially, as well as the elevated concentrations of P in the water column.
However, water column pH will have to be monitored closely because the pH I measured was on
average >8 in both ponds during both experiments. When alum is applied at pH levels above or
below an approximate range of 6-8, it can lead to increased aluminum solubility and toxicity
(Kennedy and Cooke, 1982). The addition of a buffer solution to the water prior to alum
93
treatment can manipulate pH into a range acceptable for application and reduce the possibility of
aluminum toxicity.
Summary
Overall, my results showed that the two ponds involved in this study have the potential to
contribute P to the water column once they are reconnected to Bear Creek due to the presence of
legacy P; however, reconnection significantly increased sediment P release only in the west
pond. This is likely because the east pond was previously dredged, while the west pond was not.
The flux of N from both ponds was not consistently and significantly influenced by
reconnection. This observation may be due to differences in how N and P accumulate and are
removed from the sediment, as well as possible confounding effects of my study design. In
addition, increased incubation temperatures did not consistently and significantly affect the flux
of N or P from either pond in this study. Although I was not able to detect a significant impact of
temperature on N and P dynamics in my study area, it is still important to consider how rising
temperatures and other effects of climate change such as alteration of precipitation patterns and
increased extreme weather events may influence wetland nutrient dynamics.
Because the concentrations of sediment and water column P are so high in the two ponds,
the area will not be suitable in its current state to serve as a sink of the Bear Creek P load if it is
hydrologically reconnected. The sediments within the ponds will in fact be a net contributor of P
to Bear Creek and downstream Bear Lake if reconnection occurs without proper remediation.
Hence, reconnecting the ponds to the creek without any nutrient reduction mitigation measures
would likely exacerbate the eutrophication and harmful algal bloom conditions in Bear Lake, and
94
seriously limit the community’s ability to meet the TMDL target for TP. Preventative measures
such as chemical additions, phytoremediation, or dredging may potentially remove or bind a
large amount of the soluble P that is present. In the case of this specific restoration, I support the
previous suggestion to dredge the enriched sediments in both ponds and apply alum in order to
manage the excess P in the restoration area. Additionally, before reconnection, I recommend
verifying that water column P concentrations in the two ponds are consistently below 0.03 mg L-
1, which is the target concentration in the Bear Lake TMDL, and that the sediments will not
release any appreciable amount of P to the water column. Preferably, the sediments would have
the potential to retain P when reconnection occurs. The establishment of wetland vegetation in
the two ponds prior to reconnection may also aid in sediment and nutrient retention.
Finally, my work supports the idea that the application of scientific research to real world
environmental problems not only provides academic insight, but also increases the rigor and
success of associated environmental restoration efforts (Omeron, 2003). In general, it is
understood that including and developing the scientific research basis for restoration is essential
if current and future restoration efforts are to be successful (Hobbs, 2007). Yet, in addition to
scientific research based aspects of environmental restoration, it is also important to consider the
socio-economic side of restoration efforts. Indeed, it has been suggested that perhaps the greatest
need in environmental restoration currently is for the development of a synthetic approach in
which we can integrate the ecological and socio-economic aspects of the issues surrounding
environmental restoration and the setting of restoration goals (Hobbs, 2007). Beyond setting
restoration goals, additional areas for collaboration between the two interests may include, but
are not limited to: choosing areas for restoration; determining pre, during, and post restoration
monitoring; and choosing the technical restoration design (Figure 3.1). Although this does not
95

guarantee success, it sets the stage for a well thought out and designed project which considers
the specific goals of the restoration, community needs/desires in the area, as well as ways to
measure restoration success and distribute the results to interested individuals (Hobbs, 2007). In
addition to the environmental and community benefits of successful restoration, the gained
understanding of ecosystem processes and scientific theory resulting from the research
associated with these projects benefits academia, and serves to enrich the growing literature
concerning environmental restoration and its associated techniques. Thus, all groups involved in
restoration benefit by working together. In an era where the effects of humanity on the
environment are rapidly expanding (Crutzen, 2002), environmental restoration and the recovery
of lost ecosystem services is increasingly necessary on a global scale. Hence, restoration efforts
should be thoughtfully considered and designed in order to provide not only the maximum
amount of environmental and ecological improvement, but also address associated socio-
economic needs.
96
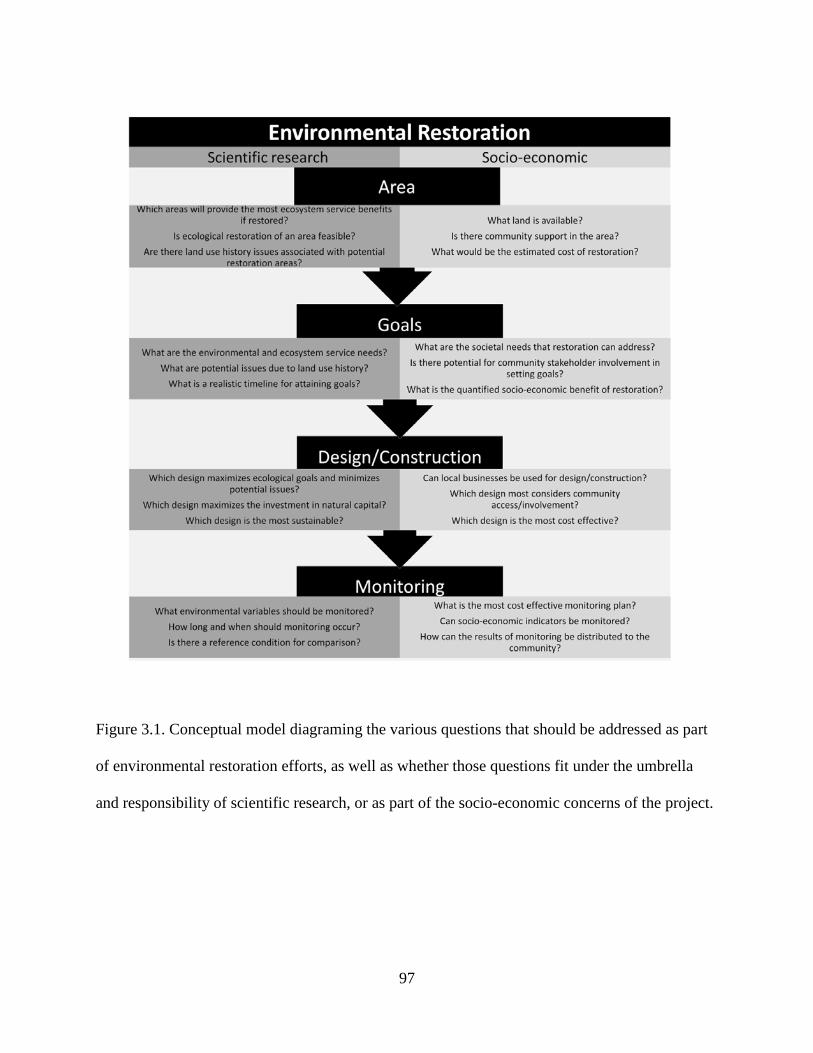
Figure 3.1. Conceptual model diagraming the various questions that should be addressed as part
of environmental restoration efforts, as well as whether those questions fit under the umbrella
and responsibility of scientific research, or as part of the socio-economic concerns of the project.
97
Literature cited
Anthony, J.L., and W.M. Lewis. 2012. Low boundary layer response and temperature
dependence of nitrogen and phosphorus releases from oxic sediments of an
oligotrophic lake. Aquat. Sci. 74: 611–617.
Ardón, M., J.L. Morse, M.W. Doyle, and E.S. Bernhardt. 2010. The water quality consequences
of restoring wetland hydrology to a large agricultural watershed in the Southeastern
Coastal Plain. Ecosystems 13: 1060–1078.
Baron, J.S., N.L. Poff, P.L. Angermeier, C.N. Dahm, P.H. Gleick, N.G. Hairston, R.B. Jackson,
C.A. Johnston, B.D. Richter, and A.D. Steinman. 2002. Meeting ecological and societal
needs for freshwater. Ecol. Appl. 12: 1247–1260.
Brönmark, C., and L. Hansson. 2002. Environmental issues in lakes and ponds: current state and
perspectives. Environ. Conserv. 29: 290–306.
Burkett, V., and J. Kusler. 2000. Climate change: potential impacts and interactions in wetlands
of the United States. J. Am. Water Resour. Assoc. 36: 313–320.
Canfield, D.E., A.N. Glazer, and P.G. Falkowski. 2010. The evolution and future of
Earth’s nitrogen cycle. Science 330: 192–196.
Carpenter, S.R. 2005. Eutrophication of aquatic ecosystems: bistability and soil phosphorus.
Proc. Natl. Acad. Sci. 102: 10002–10005.
Carter, L.D., and A.R. Dzialowski. 2012. Predicting sediment phosphorus release rates using
landuse and water-quality data. Freshw. Sci. 31: 1214–1222.
98
Chambers, P.A., P. Lacoul, K.J. Murphy, and S.M. Thomaz. 2008. Global diversity of aquatic
macrophytes in freshwater. Hydrobiologia 595: 9–26.
Conley, D.J., H.W. Paerl, R.W. Howarth, D.F. Boesch, S.P. Seitzinger, K.E. Havens, C.
Lancelot, and G.E. Likens. 2009. Controlling eutrophication: nitrogen and phosphorus.
Science 323: 1014–1015.
Cooke, G.D., E.B. Welch, A.B. Martin, D.G. Fulmer, J.B. Hyde, and G.D. Schrieve. 1993.
Effectiveness of Al, Ca, and Fe salts for control of internal phosphorus loading in shallow
and deep lakes. Hydrobiologia 253: 323–335.
Cooke, G.D., E.B. Welch, S.A. Peterson, and S.A. Nichols. 2005. Restoration and
management of lakes and reservoirs. 3rd ed. CRC Press, Boca Raton, Florida.
Crutzen, P.J. 2002. Geology of mankind. Nature 415: 23.
Does, J., P. Verstraelen, P. Boers, J. Roestel, R. Roijackers, and G. Moser. 1992. Lake
restoration with and without dredging of phosphorus-enriched upper sediment layers.
Hydrobiologia 233: 197–210.
Duff, J.H., K.D. Carpenter, D.T. Snyder, K.K. Lee, R.J. Avanzino, and F.J. Triska. 2009.
Phosphorus and nitrogen legacy in a restoration wetland, Upper Klamath Lake, Oregon.
Wetlands 29: 735–746.
Dunne, E.J., M.W. Clark, R. Corstanje, and K.R. Reddy. 2011. Legacy phosphorus in subtropical
wetland soils: influence of dairy, improved and unimproved pasture land use. Ecol. Eng.
37: 1481–1491.
99
Elser, J.J., M.E.S. Bracken, E.E. Cleland, D.S. Gruner, W.S. Harpole, H. Hillebrand, J.T. Ngai,
E.W. Seabloom, J.B. Shurin, and J.E. Smith. 2007. Global analysis of nitrogen and
phosphorus limitation of primary producers in freshwater, marine and terrestrial
ecosystems. Ecol. Lett. 10: 1135–1142.
Erwin, K.L. 2009. Wetlands and global climate change: the role of wetland restoration in a
changing world. Wetl. Ecol. Manag. 17: 71–84.
Ferrati, R., G. Ana Canziani, and D. Ruiz Moreno. 2005. Esteros del Ibera: hydrometeorological
and hydrological characterization. Ecol. Modell. 186: 3–15.
Foster, D., F. Swanson, J. Aber, I. Burke, N. Brokaw, D. Tilman, and A. Knapp. 2003. The
importance of land-use legacies to ecology and conservation. Bioscience 53: 77–88.
Hayhoe, K., J. VanDorn, T. Croley, N. Schlegal, and D. Wuebbles. 2010. Regional climate
change projections for Chicago and the US Great Lakes. J. Great Lakes Res. 36: 7–21.
Hill, C.R., and J.S. Robinson. 2012. Phosphorus flux from wetland ditch sediments. Sci.Total
Environ. 437: 315–322.
Hobbs, R.J. 2007. Setting Effective and Realistic Restoration Goals: Key Directions for
Research. Restor. Ecol. 15: 354–357.
Isbell, F., P.B. Reich, D. Tilman, S.E. Hobbie, S. Polasky, and S. Binder. 2013. Nutrient
enrichment, biodiversity loss, and consequent declines in ecosystem productivity. Proc.
Natl. Acad. Sci. U. S. A. 110: 11911–11916.
100
Jackson, R. B., S. R. Carpenter, C. N. Dahm, D. M. McKnight, R. J. Naiman, S. L. Postel, and S.
W. Running. 2001. Water in a changing world. Ecol.Appl. 11:1027- 1045.
Jarvie, H.P., A.N. Sharpley, P.J. a Withers, J.T. Scott, B.E. Haggard, and C. Neal. 2013.
Phosphorus mitigation to control river eutrophication: murky waters, inconvenient
truths, and “postnormal” science. J. Environ. Qual. 42: 295–304.
Jyväsjärvi, J., H. Immonen, P. Högmander, H. Högmander, H. Hämäläinen, and J. Karjalainen.
2013. Can lake restoration by fish removal improve the status of profundal
macroinvertebrate assemblages? Freshw. Biol. 58: 1149–1161.
Kadlec, R.H., and K.R. Reddy. 2001. Temperature effects in treatment wetlands. Water Environ.
Res. 73: 543–557.
Kennedy, R.H., and G.D. Cooke. 1982. Control of lake phosphorus with aluminum sulfate: dose
determination and application techniques. Water Resour. Bull. 18: 389–395.
Kinsman-Costello, L.E., J. O’Brien, and S.K. Hamilton. 2014. Re-flooding a historically drained
wetland leads to rapid sediment phosphorus release. Ecosystems 17: 641– 656.
Kleeberg, A., and J. Kohl. 1999. Assessment of the long-term effectiveness of sediment dredging
to reduce benthic phosphorus release in shallow Lake Müggelsee (Germany).
Hydrobiologia 394: 153–161.
Kröger, R., M.M. Holland, M.T. Moore, and C.M. Cooper. 2007. Plant senescence mechanism
for nutrient release in temperate agricultural wetlands. Environ. Pollut. 146: 114–119.
101
Kuhman, T.R., S.M. Pearson, and M.G. Turner. 2011. Agricultural land-use history increases
non-native plant invasion in a southern Appalachian forest a century after abandonment.
Can. J. For. Res. 41: 920–929.
Leibold, M. 1999. Biodiversity and nutrient enrichment in pond plankton communities. Evol.
Ecol. Res. 1: 73–95.
Lewis, W.M., and W. A. Wurtsbaugh. 2008. Control of lacustrine phytoplankton by nutrients:
erosion of the phosphorus paradigm. Int. Rev. Hydrobiol. 93: 446–465.
Liboriussen, L., M. Søndergaard, E. Jeppesen, I. Thorsgaard, S. Grünfeld, T.S. Jakobsen, and K.
Hansen. 2009. Effects of hypolimnetic oxygenation on water quality: results from five
Danish lakes. Hydrobiologia 625: 157–172.
Lishawa, S.C., D. A. Albert, and N.C. Tuchman. 2010. Water level decline promotes Typha X
glauca establishment and vegetation change in Great Lakes coastal wetlands. Wetlands
30: 1085–1096.
Lofgren, B.M., T.S. Hunter, and J. Wilbarger. 2011. Effects of using air temperature as a proxy
for potential evapotranspiration in climate change scenarios of Great Lakes basin
hydrology. J. Great Lakes Res. 37: 744–752.
Mattingly, W.B., and J.L. Orrock. 2013. Historic land use influences contemporary
establishment of invasive plant species. Oecologia 172: 1147–1157.
McQueen, D.J., D.R.S. Lean, and M.N. Charlton. 1986. The effects of hypolimnetic aeration on
iron-phosphorus interactions. Water Res. 20: 1129–1135.
102

Meals, D.W., S.A. Dressing, and T.E. Davenport. 2010. Lag time in water quality response to
best management practices: a review. J. Environ. Qual. 39: 85–96.
Michigan Department of Environmental Quality (MDEQ). 2008. Total maximum daily load for
phosphorus for Bear Lake, Muskegon County. Michigan Department of Environmental
Quality, Water Bureau, Lansing, Michigan.
http://www.michigan.gov/documents/deq/wb-swas-tmdl-bearlake_258228_7.pdf.
Millennium Ecosystem Assessment, 2005. Ecosystems and human well-being: wetlands and
water synthesis. World Resources Institute, Washington, DC.
http://www.millenniumassessment.org/documents/document.358.aspx.pdf
Mitsch, W.J., and M.E. Hernandez. 2013. Landscape and climate change threats to wetlands of
North and Central America. Aquat. Sci. 75: 133–149.
Molofsky, J., C.M. Danforth, and E.E. Crone. 2013. Nutrient enrichment alters dynamics in
experimental plant populations. Popul. Ecol. 56: 97–107.
Mortimer, C.H. 1941. The exchange of dissolved substances between mud and water in lakes.
J. Ecol. 29: 280–329.
North, R.L., S.J. Guildford, R.E.H. Smith, S.M. Havens, and M.R. Twiss. 2007. Evidence for
phosphorus, nitrogen, and iron colimitation of phytoplankton communities in Lake Erie.
Limnol. Oceanogr. 52: 315–328.
Nürnberg, G.K., and B.D. LaZerte. 2004. Modeling the effect of development on internal
phosphorus load in nutrient-poor lakes. Water Resour. Res. 40: 1–9.
103

Omeron, S.J. 2003. Restoration in applied ecology: editor’s introduction. J. Appl. Ecol. 40: 44-
50.
Pant, H.K., and K.R. Reddy. 2003. Potential internal loading of phosphorus in a wetland
constructed in agricultural land. Water Res. 3: 965–972.
Pilon-Smits, E. 2005. Phytoremediation. Annu. Rev. Plant Biol. 56: 15–39.
Reddy, R.K., and R.D. DeLaune. 2004. Biogeochemistry of wetlands: science and applications.
I. Taylor and Francis, Boca Raton, FL.
Redshaw, C.J., C.F. Mason, C.R. Hayes, and R.D. Roberts. 1990. Factors influencing phosphate
exchange across the sediment-water interface of eutrophic reservoirs. Hydrobiologia 192:
233–245.
Robertson, G.P., and P.M. Vitousek. 2009. Nitrogen in agriculture: balancing the cost of an
essential resource. Annu. Rev. Environ. Resour. 34: 97–125.
Schindler, D.W. 1974. Eutrophication and recovery in experimental lakes: implications for lake
management. Science 184: 897–899.
Schindler, D.W. 2001. The cumulative effects of climate warming and other human stresses on
Canadian freshwaters in the new millennium. Can. J. Fish. Aquat. Sci. 58: 18–29.
Schindler, D.W. 2012. The dilemma of controlling cultural eutrophication of lakes. Proc. R. Soc.
279: 4322–4333.
104

Schindler, D.W., R.E. Hecky, D.L. Findlay, M.P. Stainton, B.R. Parker, M.J. Paterson, K.G.
Beaty, M. Lyng, and S.E.M. Kasian. 2008. Eutrophication of lakes cannot be controlled
by reducing nitrogen input: results of a 37-year whole-ecosystem experiment. Proc. Natl.
Acad. Sci. 105: 11254–11258.
Schnoor, J.L., L.A. Licht, S.C. McCutcheon, N.L. Wolfe, and L.H. Carreira. 1995.
Phytoremediation of organic and nutrient contaminants. Environ. Sci. Technol. 29: 318–
323.
Sharpley, A., H.P. Jarvie, A. Buda, L. May, B. Spears, and P. Kleinman. 2013. Phosphorus
legacy: overcoming the effects of past management practices to mitigate future water
quality impairment. J. Environ. Qual. 42: 1308–1326.
Slaton, N. A, K.R. Brye, M.B. Daniels, T.C. Daniel, R.J. Norman, and D.M. Miller. 2004.
Nutrient input and removal trends for agricultural soils in nine geographic regions in
Arkansas. J. Environ. Qual. 33: 1606–1615.
Smith, V.H. 2003. Eutrophication of freshwater and coastal marine ecosystems: a global
problem. Environ. Sci. Pollut. Res. 10: 126–139.
Steinman, A.D., and M.E. Ogdahl. 2006. Ecological effects after an alum treatment in Spring
Lake, Michigan. J. Environ. Qual. 37: 22–29.
Steinman, A., X. Chu, and M. Ogdahl. 2009. Spatial and temporal variability of internal and
external phosphorus loads in Mona Lake, Michigan. Aquat. Ecol. 4: 1–18.
105
Steinman, A.D., and M.E. Ogdahl. 2011. Does converting agricultural fields to wetlands retain or
release P? J. North Am. Benthol. Soc. 30: 820–830.
Steinman A.D., and M.E. Ogdahl. 2013. Muskegon Lake AOC habitat restoration design: Bear
Lake hydrologic reconnection/wetland restoration. Final Project Report. Grand Valley
State University, Annis Water Resources Institute, Muskegon, Michigan.
http://www.gvsu.edu/cms3/assets/C77E9948-F8CA-334B-
D0AADD62329DD8D1/bear_muck_final_report_final.pdf
Steinman, A.D., M.E. Ogdahl, M. Weinert, K. Thompson, M.J. Cooper, and D.G. Uzarski. 2012.
Water level fluctuation and sediment–water nutrient exchange in Great Lakes coastal
wetlands. J. Great Lakes Res. 38: 766–775.
Steinman, A.D., R.R. Rediske, and R.K. Reddy. 2004. The reduction of internal phosphorus
loading using alum in Spring Lake, Michigan. J. Environ. Qual. 33: 2040–2048.
Sterner, R.W. 2008. On the phosphorus limitation paradigm for lakes. Int. Rev. Hydrobiol. 93:
433–445.
Taylor, P.G., and A.R. Townsend. 2010. Stoichiometric control of organic carbon–nitrate
relationships from soils to the sea. Nature 464: 1178–1181.
Townsend, A.R., and S. Porder. 2012. Agricultural legacies, food production and its
environmental consequences. Proc. Natl. Acad. Sci. U.S.A. 109: 5917–5918.
Welch, E.B., and J.M. Jacoby. 2004. Pollutant effects in freshwater: applied limnology. 3rd ed.
Spoon Press, New York, New York.
106

Zedler, J.B. 2000. Progress in wetland restoration ecology. Trends Ecol. Evol. 15: 402–407.
107
Related Documents