Atmospheric Environment 41 (2007) 4337–4348 Wet deposition of mercury at a New York state rural site: Concentrations, fluxes, and source areas Soon-onn Lai a , Thomas M. Holsen a, , Philip K. Hopke b , Peng Liu b a Department of Civil and Environmental Engineering, Clarkson University, Potsdam, NY 13699-5710, USA b Department of Chemical and Biomolecular Engineering and Center for Air Resources Engineering and Science, Clarkson University, Potsdam, NY 13699-5708, USA Received 12 June 2006; received in revised form 30 January 2007; accepted 30 January 2007 Abstract Event-based mercury (Hg) precipitation samples were collected with a modified MIC-B sampler between September 2003 and April 2005 at Potsdam, NY to investigate Hg in wet deposition and identify potential source areas using the potential source contribution function (PCSF) and residence time weighted concentration (RTWC) models. The volume- weighted mean (VWM) concentration and wet deposition flux were 5:5 ng L 1 and 7:6 mgm 2 during the study period, and 5:5 ng L 1 and 5:9 mgm 2 in 2004, respectively, and show seasonal trends with larger values in the spring and summer. The PSCF model results matched known source areas based on an emission inventory better than did the RTWC results based on the spatial correlation index. Both modeling results identified large Hg source areas that contain a number of coal-fired power plants located in the Upper Ohio River Valley and in southeastern Michigan, as well as in Quebec and Ontario where there are metal production facilities, waste incinerators and paper mills. Emissions from the Atlantic Ocean were also determined to be a potential source. r 2007 Elsevier Ltd. All rights reserved. Keywords: Wet deposition; Mercury; Potential source contribution function (PCSF); Residence time weighted concentration (RTWC) 1. Introduction Mercury (Hg) from anthropogenic and natural sources is consistently introduced into the terrestrial and aquatic ecosystems, particularly via wet and dry deposition (e.g., Landis and Keeler, 2002; Mason and Sullivan, 1997). Complex biochemical transfor- mations result in bioaccumulation and toxicity of methyl mercury (MeHg) in many ecosystems (Downs et al., 1998). Consumption of MeHg- contaminated fish is the primary route of human exposure. Elemental mercury ðHg 0 Þ is volatile and only slightly reactive, and thus, can be transported over long distances. When it is oxidized to the more water-soluble divalent mercury ðHg 2þ Þ, it can be easily removed by wet deposition (Iverfeldt and Lindqvist, 1986). Hg 2þ and particulate ðHg ðpÞ Þ along with dimethyl Hg and methyl Hg, contribute the majority of Hg in precipitation despite their small concentrations in the atmosphere (Downs et al., 1998). The amount of Hg scavenged by ARTICLE IN PRESS www.elsevier.com/locate/atmosenv 1352-2310/$ - see front matter r 2007 Elsevier Ltd. All rights reserved. doi:10.1016/j.atmosenv.2007.01.057 Corresponding author. Tel.: +1 315 268 3851; fax: +1 315 268 7985. E-mail address: [email protected] (T.M. Holsen).

Welcome message from author
This document is posted to help you gain knowledge. Please leave a comment to let me know what you think about it! Share it to your friends and learn new things together.
Transcript
ARTICLE IN PRESS
1352-2310/$ - se
doi:10.1016/j.at
�Correspondfax: +1315 268
E-mail addr
Atmospheric Environment 41 (2007) 4337–4348
www.elsevier.com/locate/atmosenv
Wet deposition of mercury at a New York state rural site:Concentrations, fluxes, and source areas
Soon-onn Laia, Thomas M. Holsena,�, Philip K. Hopkeb, Peng Liub
aDepartment of Civil and Environmental Engineering, Clarkson University, Potsdam, NY 13699-5710, USAbDepartment of Chemical and Biomolecular Engineering and Center for Air Resources Engineering and Science, Clarkson University,
Potsdam, NY 13699-5708, USA
Received 12 June 2006; received in revised form 30 January 2007; accepted 30 January 2007
Abstract
Event-based mercury (Hg) precipitation samples were collected with a modified MIC-B sampler between September
2003 and April 2005 at Potsdam, NY to investigate Hg in wet deposition and identify potential source areas using the
potential source contribution function (PCSF) and residence time weighted concentration (RTWC) models. The volume-
weighted mean (VWM) concentration and wet deposition flux were 5:5 ngL�1 and 7:6mgm�2 during the study period, and
5:5 ngL�1 and 5:9mgm�2 in 2004, respectively, and show seasonal trends with larger values in the spring and summer. The
PSCF model results matched known source areas based on an emission inventory better than did the RTWC results based
on the spatial correlation index. Both modeling results identified large Hg source areas that contain a number of coal-fired
power plants located in the Upper Ohio River Valley and in southeastern Michigan, as well as in Quebec and Ontario
where there are metal production facilities, waste incinerators and paper mills. Emissions from the Atlantic Ocean were
also determined to be a potential source.
r 2007 Elsevier Ltd. All rights reserved.
Keywords: Wet deposition; Mercury; Potential source contribution function (PCSF); Residence time weighted concentration (RTWC)
1. Introduction
Mercury (Hg) from anthropogenic and naturalsources is consistently introduced into the terrestrialand aquatic ecosystems, particularly via wet and drydeposition (e.g., Landis and Keeler, 2002; Masonand Sullivan, 1997). Complex biochemical transfor-mations result in bioaccumulation and toxicity ofmethyl mercury (MeHg) in many ecosystems
e front matter r 2007 Elsevier Ltd. All rights reserved
mosenv.2007.01.057
ing author. Tel.: +1315 268 3851;
7985.
ess: [email protected] (T.M. Holsen).
(Downs et al., 1998). Consumption of MeHg-contaminated fish is the primary route of humanexposure.
Elemental mercury ðHg0Þ is volatile and onlyslightly reactive, and thus, can be transported overlong distances. When it is oxidized to the morewater-soluble divalent mercury ðHg2þÞ, it can beeasily removed by wet deposition (Iverfeldt andLindqvist, 1986). Hg2þ and particulate ðHgðpÞÞ alongwith dimethyl Hg and methyl Hg, contribute themajority of Hg in precipitation despite theirsmall concentrations in the atmosphere (Downset al., 1998). The amount of Hg scavenged by
.

ARTICLE IN PRESSS.-o Lai et al. / Atmospheric Environment 41 (2007) 4337–43484338
precipitation depends upon Hg speciation, meteor-ological conditions (type, duration, and amount ofprecipitation), availability of oxidizing and/or redu-cing reactants (Munthe and McElroy, 1992),season (Sorensen et al., 1994; Hoyer et al., 1995),transport history of air masses (Hoyer et al., 1995),and source locations and characteristics (Glass andSorensen, 1999; Guentzel et al., 2001; Mason et al.,1997).
To better understand the origins of wet deposi-tion and thereby support the development ofeffective control strategies, it is necessary to identifytheir source areas. There have been several attemptsto link source locations with precipitation chemistrydata (e.g., Lucey et al., 2001; Plaisance et al., 1996;Zeng and Hopke, 1989). In this study, precipitationsamples were collected on an event basis rather thanin integrated samples (e.g., weekly) to satisfy theneed of receptor modeling and meteorologicalanalysis (Hoyer et al., 1995; Landis et al., 2002).
In this study, two hybrid receptor models,potential source contribution function (PCSF) andresidence time weighted concentration (RTWC)were applied to the wet deposition data collectedat Potsdam, NY to locate the potential source areascontributing to Hg in wet deposition, as well as tocompare how well the two models identified knownsource regions.
Massena
LAKE ONTARIO
NEW Y
Fig. 1. Locations of sampling site (Potsdam, NY)
2. Materials and methods
2.1. Site description
The sampling site was located at Potsdam(44�400N, 74�590W), a rural site in upstate NewYork (Fig. 1). Potsdam is located 0.5 km northwestof a very small airport and about 1 km from a ruralroad. The precipitation depth was measured with arain gauge deployed near the airport. Whenprecipitation data were not available at this site,precipitation depth was obtained from the meteor-ological station located at Massena InternationalAirport (44�560N, 74�510W) that is approximately33 km north of Potsdam.
2.2. Sampler
Event-based precipitation samples were collectedbetween September 2003 and March 2005 with aMIC-B (M.I.C. Company, Richmond Hill, Ont.)automatic precipitation sampler modified as de-scribed and validated in Landis and Keeler (1997).The MIC-B sampler was equipped with twosampling trains to collect collocated Hg samplesprior to July 2004. After that time, only every thirdsample was collected in duplicate because thecollocated precision was good with an absolute
Potsdam
ORK STATE
and meteorological station (Massena, NY).

ARTICLE IN PRESSS.-o Lai et al. / Atmospheric Environment 41 (2007) 4337–4348 4339
mean difference in the samples of 10% ðn ¼ 50Þ.Each Hg sampling train consisted of a borosilicateglass funnel ð�181 cm2Þ, a Teflon adapter, a glassvapor lock and a 1-L Teflon bottle that were acid-cleaned prior to field use. The acid cleaning protocolmodified from the EPA Method 1631 (version E)has been described by Lai (2006). During the winter,a heater (750W/1500W) was placed inside theMIC-B cabinet to melt snow accumulating in thefunnels and to prevent the samples from freezing.
2.3. Analytical method
Within 24 h of collection, concentrated BrCl(0.5% v/v) was added to the precipitation samplesto allow oxidation and desorption of Hg from theTeflon bottle walls. They were then stored in arefrigerator ð4 �CÞ for 412 h. Three reagent blanks(deionized water added with 0.5% v/v of BrCl and0.2% v/v of NH2OH �HCl) were analyzed on eachday of analysis.
Prior to analysis, each sample was sequentiallytreated with NH2OH �HCl to destroy the freehalogens, and then reduced with stannous chlorideðSnCl2Þ to convert Hg(II) to Hg0:Hg0 was finallydetected with a cold-vapor atomic fluorescencespectrometer (CVAFS) (Tekran Series 2600 Mer-cury Analysis System) (Tekran Inc., Toronto,Canada). Total Hg concentrations in precipitationwere reported.
2.4. Quality control/quality assurance
The analytical method was verified using aNational Institute of Standards and Technology(NIST) SRM 1641d, and the average relative errorwas �2:5%. The method detection limit (MDL) wascalculated as three times the standard deviation ofseven sequential reagent blanks, and averaged0:04 ngL�1. The initial (IPR) and on-going (OPR)precision and recovery measured in the beginning ofthe analysis and every 20 samples ranged between91% and 115%, and 89% and 108%, respectively.The relative average standard deviation of theduplicate analysis was 3.9%.
One field blank was collected for every 10precipitation samples ðn ¼ 13Þ by deploying thesampling assembly inside the MIC-B. Bottle blanksðn ¼ 5Þ were fully filled with deionized water, andhandled in the same manner as a precipitationsample. The average concentration of field blankswas 0:16 ngL�1, and that of bottle blanks was well
below the MDL. The field blanks were subtractedfrom the samples.
3. Trajectory calculations
Back-trajectories were computed with HYS-PLIT_4 model (Draxler and Hess, 1997,1998) withEDAS (Eta Data Assimilation System) 40 kmresolution meteorological data to reconstruct theair parcel movement. Endpoints were calculatedhourly backwards in time during the precipitationperiods. The starting height for each trajectory wasone-half of the mixing height calculated with theHYSPLIT model at that time. Samples with traceamounts of precipitation or that covered longsampling periods (exceeding a week) were excludedfrom modeling analysis. Two approaches to com-puting back-trajectories were used. Approach 1used the time period of maximum precipitationintensity during each event period as the startingtime for each trajectory, and hence, one trajectorywas associated with one event (total number oftrajectories ¼ 112). In Approach 2, several (usually2–4 in this study) trajectories were computedapproximately every 6 h during each event period(total number of trajectories ¼ 348).
4. Models
The wet deposition fluxes were used instead ofconcentrations in the modeling analysis to avoidhaving the modeling results being driven by theamount of precipitation rather than the amount ofHg deposited. The geographic area covered by thecomputed trajectories was divided into an array of1� longitude by 1� latitude grid cells.
4.1. Potential source contribution function (PSCF)
The ratio of the probability of a high flux event tothe probability of all events in the ijth cell is definedas the PSCF value (between 0 and 1) which is givenas
PSCFij ¼ mij=nij, (1)
where nij is the total number of trajectory hourlyend points that fall in cell ij and mij is the number oftrajectory hourly end points in that cell that areassociated with samples whose contributions exceedthe median Hg deposition amount. An arbitraryweighting function was applied to the PSCF valuesto minimize the effect of high PSCF values based on
ARTICLE IN PRESS
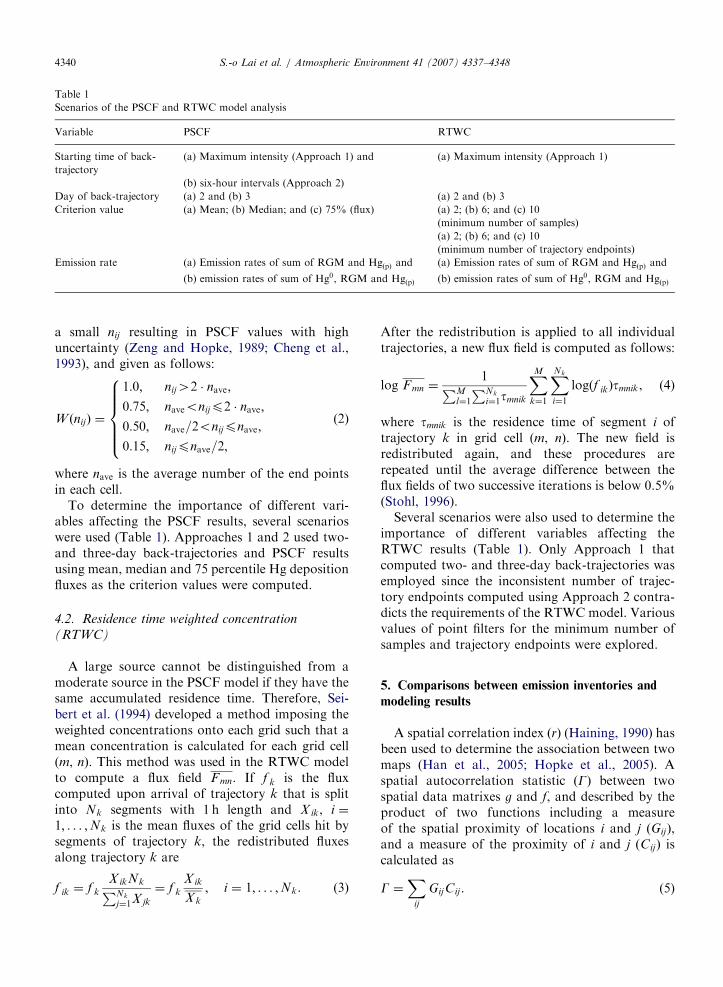
Table 1
Scenarios of the PSCF and RTWC model analysis
Variable PSCF RTWC
Starting time of back-
trajectory
(a) Maximum intensity (Approach 1) and (a) Maximum intensity (Approach 1)
(b) six-hour intervals (Approach 2)
Day of back-trajectory (a) 2 and (b) 3 (a) 2 and (b) 3
Criterion value (a) Mean; (b) Median; and (c) 75% (flux) (a) 2; (b) 6; and (c) 10
(minimum number of samples)
(a) 2; (b) 6; and (c) 10
(minimum number of trajectory endpoints)
Emission rate (a) Emission rates of sum of RGM and HgðpÞ and (a) Emission rates of sum of RGM and HgðpÞ and
(b) emission rates of sum of Hg0, RGM and HgðpÞ (b) emission rates of sum of Hg0, RGM and HgðpÞ
S.-o Lai et al. / Atmospheric Environment 41 (2007) 4337–43484340
a small nij resulting in PSCF values with highuncertainty (Zeng and Hopke, 1989; Cheng et al.,1993), and given as follows:
W ðnijÞ ¼
1:0; nij42 � nave;
0:75; naveonijp2 � nave;
0:50; nave=2onijpnave;
0:15; nijpnave=2;
8>>>><>>>>:
(2)
where nave is the average number of the end pointsin each cell.
To determine the importance of different vari-ables affecting the PSCF results, several scenarioswere used (Table 1). Approaches 1 and 2 used two-and three-day back-trajectories and PSCF resultsusing mean, median and 75 percentile Hg depositionfluxes as the criterion values were computed.
4.2. Residence time weighted concentration
(RTWC)
A large source cannot be distinguished from amoderate source in the PSCF model if they have thesame accumulated residence time. Therefore, Sei-bert et al. (1994) developed a method imposing theweighted concentrations onto each grid such that amean concentration is calculated for each grid cell(m, nÞ. This method was used in the RTWC modelto compute a flux field F mn. If f k is the fluxcomputed upon arrival of trajectory k that is splitinto Nk segments with 1 h length and X ik, i ¼
1; . . . ;Nk is the mean fluxes of the grid cells hit bysegments of trajectory k, the redistributed fluxesalong trajectory k are
f ik ¼ f k
X ikNkPNk
j¼1X jk
¼ f k
X ik
X k
; i ¼ 1; . . . ;Nk. (3)
After the redistribution is applied to all individualtrajectories, a new flux field is computed as follows:
log F mn ¼1PM
l¼1
PNk
i¼1tmnik
XMk¼1
XNk
i¼1
logðf ikÞtmnik, (4)
where tmnik is the residence time of segment i oftrajectory k in grid cell (m, nÞ. The new field isredistributed again, and these procedures arerepeated until the average difference between theflux fields of two successive iterations is below 0.5%(Stohl, 1996).
Several scenarios were also used to determine theimportance of different variables affecting theRTWC results (Table 1). Only Approach 1 thatcomputed two- and three-day back-trajectories wasemployed since the inconsistent number of trajec-tory endpoints computed using Approach 2 contra-dicts the requirements of the RTWC model. Variousvalues of point filters for the minimum number ofsamples and trajectory endpoints were explored.
5. Comparisons between emission inventories and
modeling results
A spatial correlation index ðrÞ (Haining, 1990) hasbeen used to determine the association between twomaps (Han et al., 2005; Hopke et al., 2005). Aspatial autocorrelation statistic ðGÞ between twospatial data matrixes g and f, and described by theproduct of two functions including a measureof the spatial proximity of locations i and j ðGijÞ,and a measure of the proximity of i and j ðCijÞ iscalculated as
G ¼X
ij
GijCij . (5)
ARTICLE IN PRESSS.-o Lai et al. / Atmospheric Environment 41 (2007) 4337–4348 4341
For location i, xi and yi are the coordinates, and gi
and f i are the emission rate and modeling result,respectively. The G index is transformed via Eq. (6),and the r value is obtained assuming Nð0; 1Þdistribution. The null hypothesis ðH0Þ defining thereis no spatial correlation between g and f is rejectedwhen r value o1:6 (a ¼ 0:05, one-tailed test).
r ¼G� EðGÞ
½EðG2Þ � ðEðGÞÞ2�1=2. (6)
The Hg emission inventories estimated for theUnited States in 1999 (Cohen et al., 2004; Ryan,2001) and for Canada in 1996 (Cohen et al., 2004)were used in this study. The US emission inventoryis believed to have an uncertainty of 30% foranthropogenic sources (US EPA, 1997), and excludesome anthropogenic Hg sources (e.g., mining areas,local traffic) and natural sources. In addition, theUS emission inventory was based on emissionfactors, control efficiencies, activity level measures,and estimated partitioning of Hg0, RGM and HgðpÞamong the sources, resulting in additional errors inthe emission inventory estimate. The Canadianemission inventory is also associated with highuncertainty, although its magnitude has not beenidentified.
6. Results and discussion
The distributions of the Hg concentrations in theprecipitation and wet deposition fluxes were notnormally distributed based on the Shapiro–Wilktest (W ¼ 0:23874 and 0.61275, po0:01) providedby STATISTICA 6.0 (StatSoft, Tulsa, OK).
6.1. Wet deposition of Hg
Results of two periods are reported in Table 2.From January 2004 to December 2004 ðn ¼ 94Þ, the
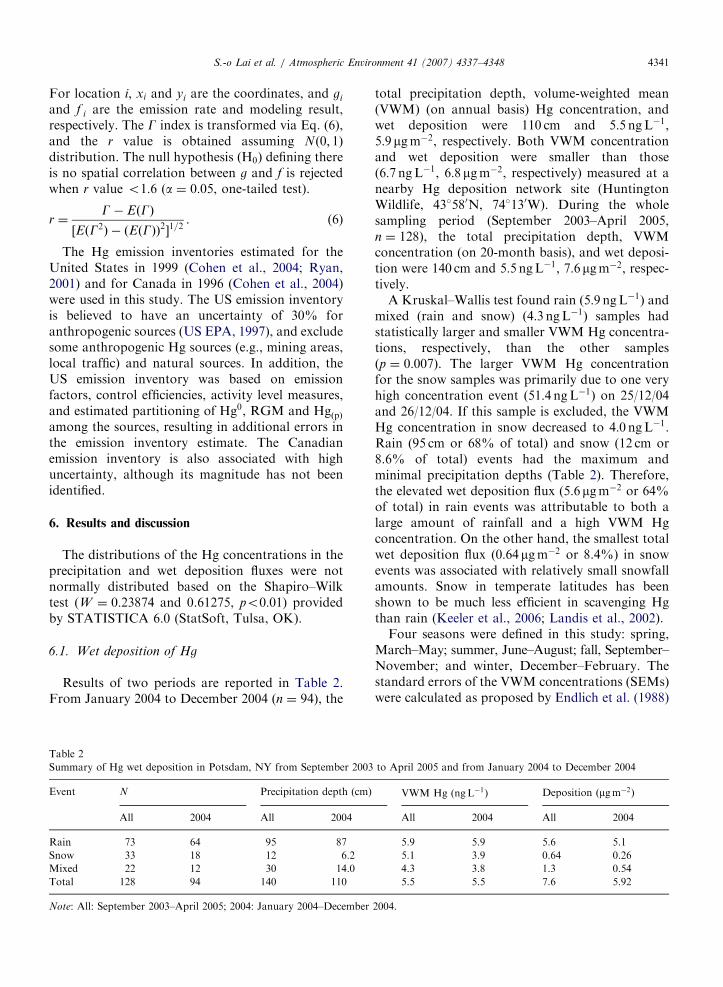
Table 2
Summary of Hg wet deposition in Potsdam, NY from September 2003
Event N Precipitation depth (cm)
All 2004 All 2004
Rain 73 64 95 87
Snow 33 18 12 6.2
Mixed 22 12 30 14.0
Total 128 94 140 110
Note: All: September 2003–April 2005; 2004: January 2004–December
total precipitation depth, volume-weighted mean(VWM) (on annual basis) Hg concentration, andwet deposition were 110 cm and 5:5 ngL�1,5:9mgm�2, respectively. Both VWM concentrationand wet deposition were smaller than those(6:7 ngL�1, 6:8mgm�2, respectively) measured at anearby Hg deposition network site (HuntingtonWildlife, 43�580N, 74�130W). During the wholesampling period (September 2003–April 2005,n ¼ 128), the total precipitation depth, VWMconcentration (on 20-month basis), and wet deposi-tion were 140 cm and 5:5 ngL�1, 7:6mgm�2, respec-tively.
A Kruskal–Wallis test found rain ð5:9 ngL�1Þ andmixed (rain and snow) ð4:3 ngL�1Þ samples hadstatistically larger and smaller VWM Hg concentra-tions, respectively, than the other samplesðp ¼ 0:007Þ. The larger VWM Hg concentrationfor the snow samples was primarily due to one veryhigh concentration event ð51:4 ngL�1Þ on 25/12/04and 26/12/04. If this sample is excluded, the VWMHg concentration in snow decreased to 4:0 ngL�1.Rain (95 cm or 68% of total) and snow (12 cm or8.6% of total) events had the maximum andminimal precipitation depths (Table 2). Therefore,the elevated wet deposition flux (5:6mgm�2 or 64%of total) in rain events was attributable to both alarge amount of rainfall and a high VWM Hgconcentration. On the other hand, the smallest totalwet deposition flux (0:64mgm�2 or 8.4%) in snowevents was associated with relatively small snowfallamounts. Snow in temperate latitudes has beenshown to be much less efficient in scavenging Hgthan rain (Keeler et al., 2006; Landis et al., 2002).
Four seasons were defined in this study: spring,March–May; summer, June–August; fall, September–November; and winter, December–February. Thestandard errors of the VWM concentrations (SEMs)were calculated as proposed by Endlich et al. (1988)
to April 2005 and from January 2004 to December 2004
VWM Hg (ngL�1) Deposition ðmgm�2Þ
All 2004 All 2004
5.9 5.9 5.6 5.1
5.1 3.9 0.64 0.26
4.3 3.8 1.3 0.54
5.5 5.5 7.6 5.92
2004.
ARTICLE IN PRESSS.-o Lai et al. / Atmospheric Environment 41 (2007) 4337–43484342
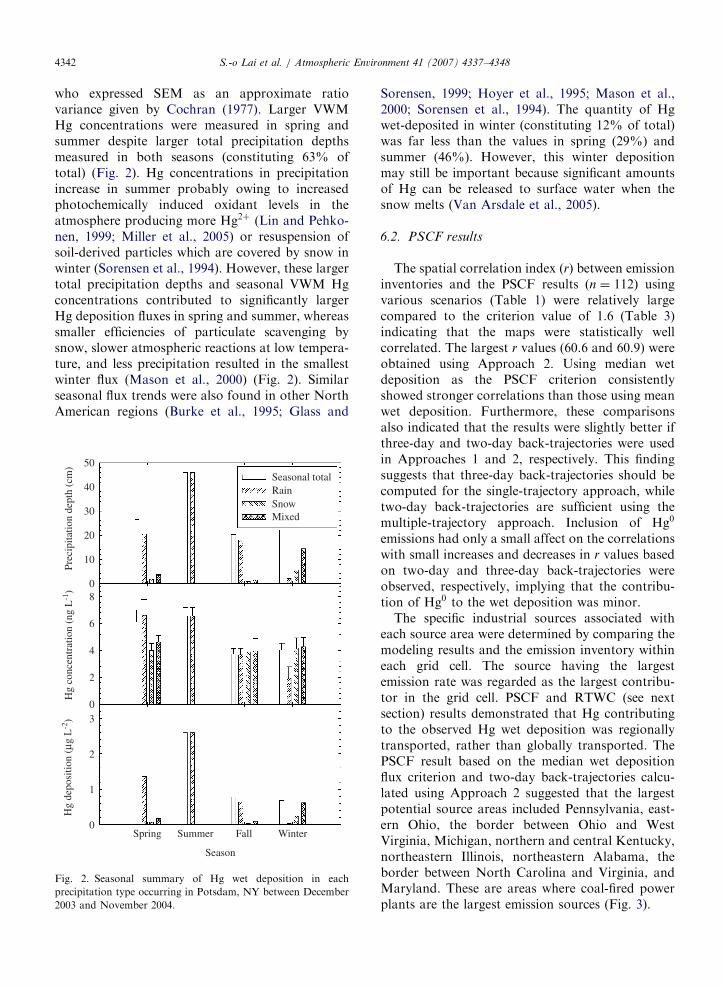
who expressed SEM as an approximate ratiovariance given by Cochran (1977). Larger VWMHg concentrations were measured in spring andsummer despite larger total precipitation depthsmeasured in both seasons (constituting 63% oftotal) (Fig. 2). Hg concentrations in precipitationincrease in summer probably owing to increasedphotochemically induced oxidant levels in theatmosphere producing more Hg2þ (Lin and Pehko-nen, 1999; Miller et al., 2005) or resuspension ofsoil-derived particles which are covered by snow inwinter (Sorensen et al., 1994). However, these largertotal precipitation depths and seasonal VWM Hgconcentrations contributed to significantly largerHg deposition fluxes in spring and summer, whereassmaller efficiencies of particulate scavenging bysnow, slower atmospheric reactions at low tempera-ture, and less precipitation resulted in the smallestwinter flux (Mason et al., 2000) (Fig. 2). Similarseasonal flux trends were also found in other NorthAmerican regions (Burke et al., 1995; Glass and
Seasonal total50
Prec
ipita
tion
dept
h (c
m)
Hg
conc
entr
atio
n (n
g L
-1)
Hg
depo
sitio
n (µ
g L
-2)
40
30
20
10
08
6
4
2
03
2
1
0Spring Summer
Season
Fall Winter
RainSnowMixed
Fig. 2. Seasonal summary of Hg wet deposition in each
precipitation type occurring in Potsdam, NY between December
2003 and November 2004.
Sorensen, 1999; Hoyer et al., 1995; Mason et al.,2000; Sorensen et al., 1994). The quantity of Hgwet-deposited in winter (constituting 12% of total)was far less than the values in spring (29%) andsummer (46%). However, this winter depositionmay still be important because significant amountsof Hg can be released to surface water when thesnow melts (Van Arsdale et al., 2005).
6.2. PSCF results
The spatial correlation index ðrÞ between emissioninventories and the PSCF results ðn ¼ 112Þ usingvarious scenarios (Table 1) were relatively largecompared to the criterion value of 1.6 (Table 3)indicating that the maps were statistically wellcorrelated. The largest r values (60.6 and 60.9) wereobtained using Approach 2. Using median wetdeposition as the PSCF criterion consistentlyshowed stronger correlations than those using meanwet deposition. Furthermore, these comparisonsalso indicated that the results were slightly better ifthree-day and two-day back-trajectories were usedin Approaches 1 and 2, respectively. This findingsuggests that three-day back-trajectories should becomputed for the single-trajectory approach, whiletwo-day back-trajectories are sufficient using themultiple-trajectory approach. Inclusion of Hg0
emissions had only a small affect on the correlationswith small increases and decreases in r values basedon two-day and three-day back-trajectories wereobserved, respectively, implying that the contribu-tion of Hg0 to the wet deposition was minor.
The specific industrial sources associated witheach source area were determined by comparing themodeling results and the emission inventory withineach grid cell. The source having the largestemission rate was regarded as the largest contribu-tor in the grid cell. PSCF and RTWC (see nextsection) results demonstrated that Hg contributingto the observed Hg wet deposition was regionallytransported, rather than globally transported. ThePSCF result based on the median wet depositionflux criterion and two-day back-trajectories calcu-lated using Approach 2 suggested that the largestpotential source areas included Pennsylvania, east-ern Ohio, the border between Ohio and WestVirginia, Michigan, northern and central Kentucky,northeastern Illinois, northeastern Alabama, theborder between North Carolina and Virginia, andMaryland. These are areas where coal-fired powerplants are the largest emission sources (Fig. 3).

ARTICLE IN PRESS
Table 3
Spatial correlation indexes ðrÞ between the emission rates and PSCF results
Sum of emission rates Criterion value Approach 1 Approach 2
Two-day B-T Three-day B-T Two-day B-T Three-day B-T
RGMþHgðpÞ Mean 42.9 47.2 49.4 47.5
Median 49.1 51.4 60.6 56.2
75% 41.5 44.9 45.3 43.4
Hg0 þRGMþHgðpÞ Mean 43.2 46.7 49.6 47.0
Median 49.4 50.8 60.9 55.5
75% 41.7 44.3 45.5 43.0
Note: B-T: Back-trajectories.
Fig. 3. PSCF result based on the criteria of median wet deposition flux and two-day back-trajectory data calculated from Approach 2 for
Hg wet deposition measured in Potsdam, NY.
S.-o Lai et al. / Atmospheric Environment 41 (2007) 4337–4348 4343
Oil-fired power plants are also found in Illinois,Pennsylvania, Maryland, Delaware and the DelmarvaPeninsula. New Jersey, southeastern Pennsylvania,northern Virginia, North Carolina, southeasternMichigan where municipal waste incinerators arelocated, and Pennsylvania and North Carolinawhere hazardous waste incinerators are locatedwere also determined to be potential source areas(it should be noted that since these emission
inventories were generated, many waste incineratorshave been closed due to increasingly stringentemission regulations). In addition, northern WestVirginia and Delaware were also identified in thePSCF analysis as potential source areas whereseveral chlorine production facilities are located.
Southern Quebec and the border between Quebecand Ontario appeared to be weak potentialsource areas. These areas contain metal production

ARTICLE IN PRESS
Table 4
Spatial correlation indexes ðrÞ between the emission rates and
RTWC results using Approach 1
Emission
rate
Point filter
ðx; yÞaTwo-day
back-
trajectories
Three-day
back-
trajectories
RGMþHgðpÞ (2, 2) 21.6 15.4
(2, 6) 24.5 17.4
(2, 10) 24.1 21.9
(6, 2) 22.6 23.1
(6, 6) 22.6 23.1
(6, 10) 22.8 23.1
(10, 2) 10.0 10.4
(10, 6) 10.0 10.4
(10, 10) 10.0 10.4
Hg0 þRGMþHgðpÞ (2, 2) 21.8 15.2
(2, 6) 24.8 17.2
(2, 10) 24.4 21.7
(6, 2) 22.8 22.9
(6, 6) 22.8 22.9
(6, 10) 23.0 23.0
(10, 2) 10.0 10.3
(10, 6) 10.0 10.3
(10, 10) 10.0 10.3
ax: The minimum number of samples in one cell; y: The
minimum number of trajectory endpoints in one cell.
S.-o Lai et al. / Atmospheric Environment 41 (2007) 4337–43484344
facilities (e.g., copper smelters and iron industries)and paper mills. Noranda in Quebec, and theFalconbridge-Sudbury area in Ontario were alsofound to be possible source regions, where Nismelters are located. Maine, where there are severallarge paper mills, was also resolved in this study. Inaddition, this approach identified several urbanareas to be important source areas, such as Detroit,Cleveland, Rochester, but other large urban areasincluding Chicago, New York City and Torontowere not observed to have high PSCF values.
The Atlantic Ocean near the eastern UnitedStates coast was found to be a potential sourcearea (Fig. 3). This area was also found to be asource area for ambient Hg at Potsdam by Han(2003). At least three explanations are possible: (1)Hg0 is oxidized to Hg2þ by marine-derived reactivehalogen radicals and compounds (e.g., Cl, Br, BrCl,BrO and ClO) during O3 photo-degradation(Laurier et al., 2003; Sheu and Mason, 2004;Dickerson et al., 1999), and then transported tothe receptor site and eventually scavenged byprecipitation. Despite its high solubility and deposi-tion velocity, RGM has been previously observed toundergo long-range transport and contribute to thelarge Hg deposition flux in southern Florida(Guentzel et al., 2001) and coastal California(Steding and Flegal, 2002). High Cl2 concentrations,the precursor of Cl atoms, have been measured at aNorth American coastal site (Spicer et al., 1998). (2)The tailing effect in which grid cells upwind anddownwind of a grid containing sources is alsoindicated to be a source, especially under low windspeed conditions. In this specific case, some back-trajectories may have passed through land-basedemission sources and moved out over the AtlanticOcean before turning towards the receptor site. Thisscenario would lead to the identification of theAtlantic Ocean as a source that even if the air masswas land based. This effect may also be the cause ofsource areas being identified in northern Maine andcentral Quebec where there are no sources indicatedin the emission inventory. (3) Hg-containing sewagesludge was previously disposed of offshore of NewYork City on the continental shelf. This Hg may bemobilized and re-emitted from the ocean into theatmosphere. It should be noted that the contribu-tion of Hg0 was generally not important to theobserved Hg wet deposition. However, there wasevidence that Hg0 that was reduced over the oceanmight be a source of Hg seen in wet deposition atthis site.
6.3. RTWC results
The spatial correlations between the emissionrates and RTWC results using different scenarios(Table 1) are summarized in Table 4. To ensure thatthe same number of trajectory endpoints is asso-ciated with each back-trajectory, only 110 and 105precipitation samples were used for two-day andthree-day back-trajectory calculations, respectively.The correlations were generally weaker than thosefound in PSCF, similar to the results of a previousstudy of total vapor phase Hg (Han, 2003),indicating that RTWC is probably not appropriatefor a single site, and multiple-site RTWC canidentify source areas over a larger domain withgreater accuracy (Stohl, 1996). RTWC maps oftenshow stronger spatial gradients when comparedwith PSCF maps (Han, 2003). However, Han (2003)found that RTWC is not always able to identifysmaller Hg sources.
For RTWC, there were no obvious patterns foron two-day and three-day back-trajectory results. Inaddition, there were no significant differencesbetween the two back-trajectory approaches if largenumber of samples (e.g., ‘‘6’’ and ‘‘10’’ in Table 4) in
ARTICLE IN PRESSS.-o Lai et al. / Atmospheric Environment 41 (2007) 4337–4348 4345
one grid cell were eliminated from the modelcomputations. The use of different minimumnumbers of trajectory endpoints and samples inone cell did not consistently affect the results,suggesting that trial and error is required to obtainthe most suitable minimum numbers of trajectoryendpoints and samples.
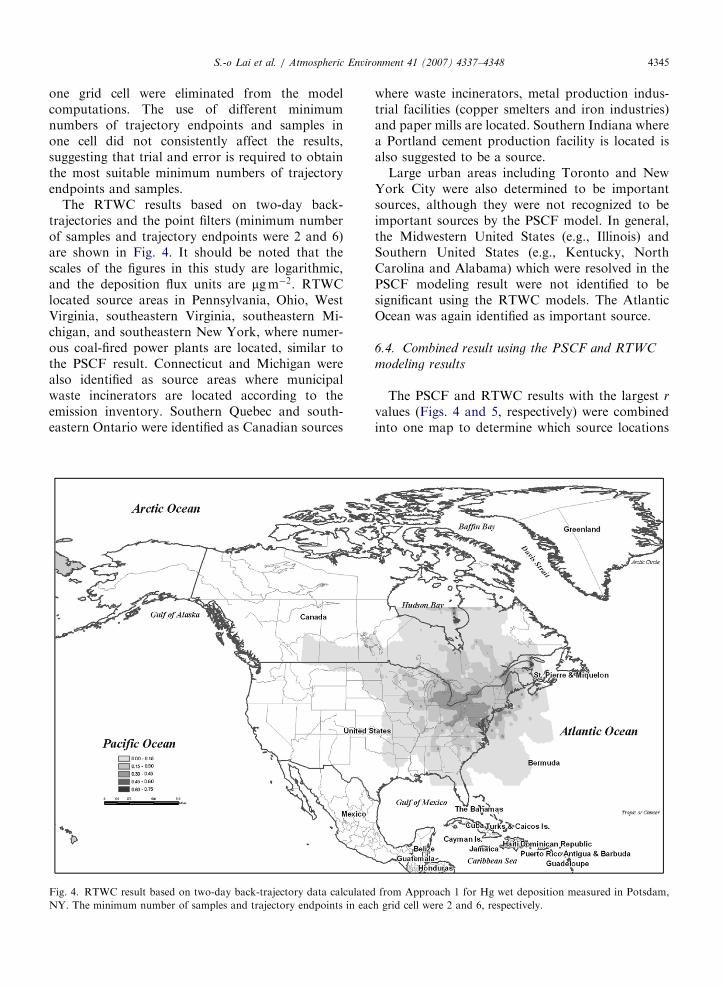
The RTWC results based on two-day back-trajectories and the point filters (minimum numberof samples and trajectory endpoints were 2 and 6)are shown in Fig. 4. It should be noted that thescales of the figures in this study are logarithmic,and the deposition flux units are mgm�2. RTWClocated source areas in Pennsylvania, Ohio, WestVirginia, southeastern Virginia, southeastern Mi-chigan, and southeastern New York, where numer-ous coal-fired power plants are located, similar tothe PSCF result. Connecticut and Michigan werealso identified as source areas where municipalwaste incinerators are located according to theemission inventory. Southern Quebec and south-eastern Ontario were identified as Canadian sources
Fig. 4. RTWC result based on two-day back-trajectory data calculated
NY. The minimum number of samples and trajectory endpoints in eac
where waste incinerators, metal production indus-trial facilities (copper smelters and iron industries)and paper mills are located. Southern Indiana wherea Portland cement production facility is located isalso suggested to be a source.
Large urban areas including Toronto and NewYork City were also determined to be importantsources, although they were not recognized to beimportant sources by the PSCF model. In general,the Midwestern United States (e.g., Illinois) andSouthern United States (e.g., Kentucky, NorthCarolina and Alabama) which were resolved in thePSCF modeling result were not identified to besignificant using the RTWC models. The AtlanticOcean was again identified as important source.
6.4. Combined result using the PSCF and RTWC
modeling results
The PSCF and RTWC results with the largest r
values (Figs. 4 and 5, respectively) were combinedinto one map to determine which source locations
from Approach 1 for Hg wet deposition measured in Potsdam,
h grid cell were 2 and 6, respectively.
ARTICLE IN PRESS
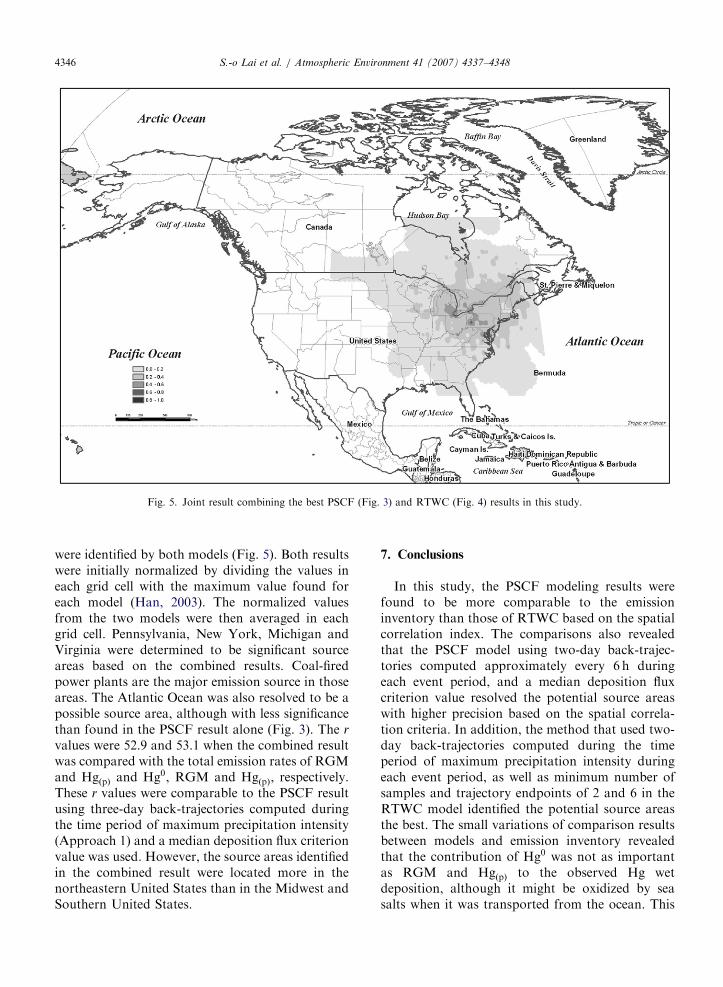
Fig. 5. Joint result combining the best PSCF (Fig. 3) and RTWC (Fig. 4) results in this study.
S.-o Lai et al. / Atmospheric Environment 41 (2007) 4337–43484346
were identified by both models (Fig. 5). Both resultswere initially normalized by dividing the values ineach grid cell with the maximum value found foreach model (Han, 2003). The normalized valuesfrom the two models were then averaged in eachgrid cell. Pennsylvania, New York, Michigan andVirginia were determined to be significant sourceareas based on the combined results. Coal-firedpower plants are the major emission source in thoseareas. The Atlantic Ocean was also resolved to be apossible source area, although with less significancethan found in the PSCF result alone (Fig. 3). The r
values were 52.9 and 53.1 when the combined resultwas compared with the total emission rates of RGMand HgðpÞ and Hg0, RGM and HgðpÞ, respectively.These r values were comparable to the PSCF resultusing three-day back-trajectories computed duringthe time period of maximum precipitation intensity(Approach 1) and a median deposition flux criterionvalue was used. However, the source areas identifiedin the combined result were located more in thenortheastern United States than in the Midwest andSouthern United States.
7. Conclusions
In this study, the PSCF modeling results werefound to be more comparable to the emissioninventory than those of RTWC based on the spatialcorrelation index. The comparisons also revealedthat the PSCF model using two-day back-trajec-tories computed approximately every 6 h duringeach event period, and a median deposition fluxcriterion value resolved the potential source areaswith higher precision based on the spatial correla-tion criteria. In addition, the method that used two-day back-trajectories computed during the timeperiod of maximum precipitation intensity duringeach event period, as well as minimum number ofsamples and trajectory endpoints of 2 and 6 in theRTWC model identified the potential source areasthe best. The small variations of comparison resultsbetween models and emission inventory revealedthat the contribution of Hg0 was not as importantas RGM and HgðpÞ to the observed Hg wetdeposition, although it might be oxidized by seasalts when it was transported from the ocean. This

ARTICLE IN PRESSS.-o Lai et al. / Atmospheric Environment 41 (2007) 4337–4348 4347
low Hg0 contribution is supported by its low watersolubility.
Model results indicated that Hg in the observedHg wet deposition was regionally transported,rather than globally transported. The results identi-fied large regional Hg source areas that contain alarge number of coal-fired power plants located inthe Upper Ohio River Valley, and in southeasternMichigan. Both models also identified source areasin Quebec and Ontario containing metal productionfacilities, waste incinerators and paper mills. Emis-sions from the Atlantic Ocean were also determinedto be a potential source of Hg.
Acknowledgment
This work has been partially funded by the USEnvironmental Protection Agency (Project No. X-98283903) and the New York Energy Research andDevelopment Authority (Project No. 6083).
References
Burke, J., Hoyer, M., Keeler, G., Scherbatskoy, T., 1995. Wet
deposition of mercury and ambient mercury concentrations at
a site in the Lake Champlain Basin. Water, Air, and Soil
Pollution 80, 353–362.
Cheng, M.-D., Hopke, P.K., Zeng, Y., 1993. A receptor
methodology for determining source regions of particle
sulfate composition observed at Dorset, Ontario. Journal of
Geophysical Research 98, 16839–16849.
Cochran, W.G., 1977. Sampling Techniques, third ed. Wiley,
New York.
Cohen, M., Artz, R., Draxler, R., Miller, P., Niemi, D., Ratte,
D., Deslauriers, M., Duvar, R., Laurin, R., Slotnick, J.,
Nettesheim, T., McDonald, J., 2004. Modeling the atmo-
spheric transport and deposition of mercury to the Great
Lakes. Environmental Research 95, 247–265.
Dickerson, R.R., Rhoads, K.P., Carsey, T.P., Oltmans, S.J.,
Burrows, J.P., Crutzen, P.J., 1999. Ozone in the remote
marine boundary layer, a possible role for halogens. Journal
of Geophysical Research 104, 21385–31395.
Draxler, R.R., Hess, G.D., 1997. Description of the Hyspolit4
modeling system. NOAA Technical Memorandum ERL
ARL-224.
Draxler, R.R., Hess, G.D., 1998. An overview of the HYS-
PLIT_4 modeling system for trajectories, dispersion, and
deposition. Australian Meteorological Magazine 47, 295–308.
Downs, S.G., MacLeod, C.L., Lester, J.N., 1998. Mercury in
precipitation and its relation to bioaccumulation in fish: a
literature review. Water, Air, and Soil Pollution 108, 149–187.
Endlich, R.M., Eynon, B.P., Ferek, R.J., Valdes, A.D., Maxwell,
C., 1988. Statistical analysis of precipitation chemistry
measurements over the eastern United States. Part I: seasonal
and regional patterns and correlations. Journal of Applied
Meteorology 27, 1322–1333.
Glass, G.E., Sorensen, J.A., 1999. Six-year trend (1990–1995) of
wet mercury deposition in the Upper Midwest, USA.
Environmental Science and Technology 33, 3303–3312.
Guentzel, J.L., Landing, W.M., Gill, G.A., Pollman, C.D., 2001.
Processes influencing rainfall deposition of mercury in
Florida. The FAMS Project (1992–1996). Environmental
Science and Technology 35, 863–873.
Haining, R., 1990. Spatial Data Analysis in the Social and
Environmental Sciences. Cambridge University Press, Cam-
bridge, UK.
Han, Y.-J., 2003. Mercury in New York State: concentrations
and source identification using hybrid receptor modeling.
Ph.D. Dissertation, Clarkson University, Potsdam, NY.
Han, Y.-J., Holsen, T.M., Hopke, P.K., Yi, S.-M., 2005.
Comparison between back-trajectories based modeling and
lagrangian backward dispersion modeling for locating sources
of reactive gaseous mercury. Environmental Science and
Technology 39, 1715–1723.
Hopke, P.K., Zhou, L., Poirot, R.L., 2005. Reconciling trajectory
ensemble receptor model results with emissions. Environ-
mental Science and Technology 39, 7980–7983.
Hoyer, M., Burke, J., Keeler, G.J., 1995. Atmospheric sources,
transport and deposition of mercury in Michigan: two years if
event precipitation. Water, Air, and Soil Pollution 80,
199–208.
Iverfeldt, A., Lindqvist, O., 1986. Atmospheric oxidation of
elemental mercury by ozone in the aqueous phase. Atmo-
spheric Environment 20, 1567–1573.
Keeler, G.J., Landis, M.S., Norris, G.A., Christianson, E.M.,
Dvonch, J.T., 2006. Sources of mercury wet deposition in
Eastern Ohio, USA. Environmental Science and Technology
40, 5874–5881.
Lai, S.-O., 2006. Mercury and other trace elements in north-
eastern New York State: the nature of deposition. Ph.D.
Dissertation, Clarkson University, Potsdam, NY.
Landis, M.S., Keeler, G.J., 1997. Critical evaluation of a
modified automatic wet-only precipitation collector for
mercury and trace element determinations. Environmental
Science and Technology 31, 2610–2615.
Landis, M.S., Keeler, G.J., 2002. Atmospheric mercury deposi-
tion to Lake Michigan during the Lake Michigan Mass
Balance Study. Environmental Science and Technology 36,
4518–4524.
Landis, M.S., Vette, A.F., Keeler, G.J., 2002. Atmospheric
mercury in the Lake Michigan Basin: influence of the
Chicago/Gary urban Area. Environmental Science and
Technology 36, 4508–4517.
Laurier, F.J.G., Mason, R.P., Whalin, L., Kato, S., 2003.
Reactive gaseous mercury formation in the North Pacific
Ocean’s marine boundary layer: a potential role of halogen
chemistry. Journal of Geophysical Research 108 (D17),
4529.
Lin, C.-J., Pehkonen, S.O., 1999. The chemistry of atmos-
pheric mercury: a review. Atmospheric Environment 33,
2067–2079.
Lucey, D., Hadjiiski, L., Hopke, P.K., Scudlark, J.R., Church,
T., 2001. Identification of sources of pollutants in precipita-
tion measured at the mid-Atlantic US coast using potential
source contribution function (PSCF). Atmospheric Environ-
ment 35, 3979–3986.
Mason, R.P., Sullivan, K.A., 1997. Mercury in Lake Michigan.
Environmental Science and Technology 31, 942–947.
ARTICLE IN PRESSS.-o Lai et al. / Atmospheric Environment 41 (2007) 4337–43484348
Mason, R.P., Lawson, N.M., Sullivan, K.A., 1997. Atmospheric
deposition to the Chesapeake Bay watershed-regional and
local sources. Atmospheric Environment 31, 3531–3540.
Mason, R.P., Lawson, N.M., Sheu, G.R., 2000. Annual and
seasonal trends in mercury deposition in Maryland. Atmo-
spheric Environment 34, 1691–1701.
Miller, E.K., Van Arsdale, A., Keeler, G.J., Chalmers, A.,
Poissant, L., Kamman, N., Brulotte, R., 2005. Estimation of
mapping of wet and dry mercury deposition across north-
eastern North America. Ecotoxicology 14, 53–70.
Munthe, J., McElroy, W.J., 1992. Some aqueous reactions of
potential importance in the atmospheric chemistry of
mercury. Atmospheric Environment 26A, 553–557.
Plaisance, H., Coddeville, P., Guillermo, R., 1996. A qualitative
determination of the source locations of precipitation constituents
in Morvan, France. Environmental Technology 17, 977–986.
Ryan, R., 2001. Point, area, and mobile sources of mercury
prepared for US EPA analysis of proposed multi-pollutant
Power Generation Legislation. US EPA, Office of Air Quality
Planning and Standards, Emissions, Monitoring and Analysis
Division, Emissions Factors and Inventory Group, US
Government Printing Office, Washington, DC.
Seibert, P., Kromp-Kolb, H., Baltensperger, U., Jost, D.T.,
Schwikowski, M., Kasper, A., Puxbaum, H., 1994. Trajectory
analysis of aerosol measurements at high alpine sites. In:
Borrell, P.M., Borell, P., Cvitas, T., Seiler, W. (Eds.),
Transport and Transformation of Pollutants in the Tropo-
sphere. Academic Publishing, Den Haag, pp. 689–693.
Sheu, G.-R., Mason, R.P., 2004. An examination of the oxidation
of elemental mercury in the presence of halide surfaces.
Journal of Atmospheric Chemistry 48, 107–130.
Sorensen, J.A., Glass, G.E., Schmidt, K.W., 1994. Regional
patterns of wet mercury deposition. Environmental Science
and Technology 28, 2025–2032.
Spicer, C.W., Chapman, E.G., Finlayson-Pitts, B.J., Plastridge,
R.A., Hubbe, J.M., Fast, J.D., Berkowitz, C.M., 1998.
Unexpectedly high concentrations of molecular chlorine in
coastal air. Nature 394, 353–356.
Steding, D.J., Flegal, A.R., 2002. Mercury concentrations in
coastal California precipitation: evidence of local and trans-
Pacific fluxes of mercury to North America. Journal of
Geophysical Research 107 (D24), 4764.
Stohl, A., 1996. Trajectory statistics—a new method to establish
source-receptor relationships of air pollutants and its
application to the transport of particulate sulfate in Europe.
Atmospheric Environment 30, 579–587.
US EPA, 1997. Mercury Study Report to Congress, Office of Air
Quality Planning and Standards and Office of Research and
Development, EPA-452/R-97-005.
Van Arsdale, A., Weiss, J., Keeler, G.J., Miller, E., Boulet, G.,
Brulotte, R., Poissant, L., Puckett, K., 2005. Patterns of
mercury deposition and concentration in northeastern North
America (1996–2002). Ecotoxicology 14, 37–52.
Zeng, Y., Hopke, P.K., 1989. A study on the sources of acid
precipitation in Ontario, Canada. Atmospheric Environment
23, 1499–1509.
Related Documents