WESTRIDGE MARINE TERMINAL MARINE TRAFFIC TECHNICAL REPORT WESTRIDGE MARINE TERMINAL UPGRADE AND EXPANSION PROJECT APPLICATION TO VANCOUVER FRASER PORT AUTHORITY Trans Mountain Pipeline ULC Kinder Morgan Canada Inc. Suite 2700, 300 – 5 Avenue S.W. Calgary, Alberta T2P 5J2 Ph: 403-514-6400 May 2017

Welcome message from author
This document is posted to help you gain knowledge. Please leave a comment to let me know what you think about it! Share it to your friends and learn new things together.
Transcript

W E S T R I D G E M A R I N E T E R M I N A L M A R I N E T R A F F I CT E C H N I C A L R E P O R T
WESTRIDGE MARINE TERMINAL UPGRADE AND EXPANSION PROJECT APPLICATION TO VANCOUVERFRASER PORT AUTHORITY
Trans Mountain Pipeline ULC Kinder Morgan Canada Inc. Suite 2700, 300 – 5 Avenue S.W. Calgary, Alberta T2P 5J2 Ph: 403-514-6400
May 2017


PR0420171202CGY ES-1
Executive Summary The Trans Mountain Expansion Project (Project) will include construction and subsequent operation of three new berths at the existing Westridge Marine Terminal (WMT or the Terminal) in Burnaby, British Columbia (BC). Each new berth will be capable of handling Aframax class vessels. The Project has undergone review by the National Energy Board, as well as having been reviewed by a Technical Review Process of Marine Terminal Systems and Transshipment Sites (TERMPOL) Review Committee led by Transport Canada. The purpose of this Marine Traffic Technical Report is to specifically address the following 11 Vancouver Fraser Port Authority (VFPA) information requests for the Westridge Marine Terminal Upgrade and Expansion Project component of the Project and Environmental Review Application Submission Requirements:
1. Confirmation of the design vessel range (maximum and minimum size of vessels that can be berthed and loaded) and anticipated traffic levels; anchorage strategy; bunkering program (whether this is permitted at the terminal); and any other operational criteria
2. Confirmation of the approaches that vessels will take to each berth and the departure from each berth, based on simulations or advice from the Pacific Pilotage Authority (PPA) and British Columbia Coast Pilots (BCCP)
3. A description of any plans for notification or broadcast of information regarding the transit or operations of the vessels associated with the Project
4. Mooring plan for design vessels at maximum and minimum size
5. A copy of berthing simulation including approaches to the proposed marine terminal and plans for docking and undocking
6. A statement on whether the PPA will require a training program for pilots
7. Description of the updated Vessel Acceptance Criteria for the Terminal
8. Passing Vessel Analysis for largest vessels passing the facility with largest design vessels at the proposed berth at different tidal current conditions
9. Confirmation that the Passing Vessel Analysis already completed will still accurately reflect outcomes considering any engineering changes that have occurred since its completion
10. Analysis of tug requirements to be conducted: report on any special requirements because of severe weather or currents at the Terminal location
11. Description of all anticipated marine traffic that will be associated with construction
The WMT will be designed to handle a range of vessels, from barges to Aframax tankers. While most of the tankers are expected to be Aframax class vessels (80,000 to 120,000 dead weight tonnage [DWT]), Panamax class tankers (60,000 to 80,000 DWT) and barges may also be nominated to load from the WMT.
Based on the expected maximum throughput at the dock, it is expected that the typical number of tanker loadings during Project operations will be up to 34 partly loaded Aframax vessels per month, which is an increase from the current total of approximately 5 tankers per month. Shippers may also opt to use Panamax vessels.
Near southern Indian Arm, located just north of the Terminal and east of Second Narrows in Central Harbour, the VFPA has provided four anchorages, at least three of which are suitable for Aframax-size vessels. Although most anchorages within the VFPA’s jurisdiction are suitable to accommodate vessels

ES-2 PR0420171202CGY
EXECUTIVE SUMMARY
of Aframax size, Trans Mountain Pipeline ULC (Trans Mountain) expects that WMT tankers will not normally frequent those anchorages that are not in the immediate vicinity of the WMT.
Trans Mountain has determined that, during Project operations, incoming vessels will normally not proceed to anchorage, even if an anchorage location is available. Subject to a berth being available and conditions being acceptable, the vessels will be directed to berth immediately upon their arrival to Central Harbour. Should a berth not be immediately needed to load an incoming vessel, a completed vessel may be held back at the berth until the applicable tide is available for it to directly transit safely through Second Narrows. This means that there will be times during which there are vessel docked at all three berths, but only one or two vessels might be actually undertaking cargo transfer.
Trans Mountain carried out a mooring analysis as part the submission to the Transport Canada TERMPOL Process and has updated it based upon the final dock design (see Appendix B). A typical tanker uses 14 to 16 mooring lines to secure the vessel to the berth, and the analysis has confirmed that number of lines to be sufficient for all conditions. A more up-to-date assessment of mooring layout for different sizes of vessels is presented in the Drawings Technical Report (TR-1).
A desktop simulation study was conducted by LANTEC Marine Inc. to identify any design issues that would unnecessarily complicate the conduct of vessel maneuvers during berthing and unberthing at the new dock system. No concerns were identified during fast-time simulations carried out in the areas surrounding the Terminal. After construction is started, Trans Mountain will conduct real-time berthing simulations around the Terminal that will be led by BCCP and developed in consultation with the VFPA and the PPA. These simulations will be used to confirm vessel berthing parameters, such as minimum safe speeds, navigability of tankers, and operational requirements for tugs.
The results of a Passing Vessel Analysis (see Appendix C) conducted for Trans Mountain indicate that the minimum distance between traffic within the proposed channel and a moored vessel at Berth 3 of the proposed expanded terminal is approximately 190 metres (m). Peak to peak motions of all vessels at the berth were minimal and well within recommended envelopes of the World Association for Waterborne Transport Infrastructure. All lines and fenders maintained loading safety factors well below the suggested Oil Companies International Marine Forum criteria for moored tankers at berth.
The current dock extends 75 m into Burrard Inlet, and the new dock is anticipated to extend approximately 250 m into Burrard Inlet; as such, the maximum marine footprint of construction activities may be approximately 350 m into Burrard Inlet. Trans Mountain expects that most of the marine facilities construction will be conducted from the water, using marine derricks and various other construction-related equipment. These may extend up to about 100 m beyond the footprint of the expanded dock, for which the Project will seek a working space from the VFPA. It is not anticipated that construction-related vessels (which will display appropriate lights and shapes in accordance with ColRegs) and marine equipment will obstruct passage of other vessels in Burrard Inlet, given the size of the inlet passage at the Terminal site. In the unlikely event that there is any potential short-term obstruction of the waterway during construction that might affect safe navigation of other vessels, this would be coordinated in advance through the VFPA Harbour Master and Canadian Coast Guard. In consultation with the VFPA, a detailed communications plan will be developed for the construction phase that will include the establishment of clear communication links using established modern means (including feedback and complaints hotlines). Regular updates will be posted to the Trans Mountain website for information of stakeholders and the public.

PR0420171202CGY I
Contents Section Page
Executive Summary ..........................................................................................................................ES-1
Acronyms and Abbreviations ............................................................................................................. iii
1 Introduction ....................................................................................................................... 1-1
2 Size of Vessels and Tanker Loading ...................................................................................... 2-1 2.1 Berth and Anchorage Strategy ......................................................................................... 2-2 2.2 Bunkering of Vessels ........................................................................................................ 2-2
3 Approaches to the Expanded Dock ...................................................................................... 3-1 3.1 Notification and Broadcasting ......................................................................................... 3-1 3.2 Dock Mooring Plan ............................................................................................................ 3-2 3.3 Berthing Simulation ......................................................................................................... 3-3 3.4 Pilot Training and Familiarization .................................................................................... 3-3 3.5 Vessel Acceptance Criteria ............................................................................................... 3-4 3.6 Passing Vessel Analysis .................................................................................................... 3-4 3.7 Analysis of Tug Requirements .......................................................................................... 3-4 3.8 Anticipated Construction-related Marine Traffic ............................................................ 3-5 3.9 Westridge Marine Terminal Construction Safety Boom .................................................. 3-7
4 References .......................................................................................................................... 4-1
Appendixes
A
B
C
D
Letters of Support
Mooring and Berthing Analysis
Passing Ship Analysis
Navigation and Safety Plan
Tables
2-1 Typical Crude Oil Vessel Parameters ............................................................................................ 2-1 3-1 Peak Mooring Line Loads – Oil Companies International Marine Forum Criteria ........................ 3-2 3-2 VFPA Tug and Bollard Pull Requirements ..................................................................................... 3-5
Figures
1-1 VFPA Jurisdiction Showing Location of the Westridge Marine Terminal within Burrard Inlet ..... 1-2 2-1 Westridge Marine Terminal in relation to other Bulk Terminals in Burrard Inlet ........................ 2-2


PR0420171202CGY III
Acronyms and Abbreviations BC British Columbia
bbl barrel(s)
BCCP British Columbia Coast Pilots
CCG Canadian Coast Guard
DNV Det Norske Veritas
DWT deadweight tonnage
ID identification
LOA length overall
LOA+B length overall plus beam
m metre(s)
MBL minimum allowable breaking load
MCTS Marine Communications and Traffic Services
MRA Movement Restricted Area
NEB National Energy Board
NNSP Navigation and Navigation Safety Plan
NOTSHIP Notices to Shipping
OCIMF Oil Companies International Marine Forum
PPA Pacific Pilotage Authority
Seaport Seaport Group
TERMPOL Technical Review Process of Marine Terminal Systems and Transshipment Sites
Trans Mountain Trans Mountain Pipeline ULC
TRC TERMPOL Review Committee
TMEP/the Project Trans Mountain Expansion Project
VFPA Vancouver Fraser Port Authority
VHF very high frequency (marine radio)
VTS Vessel Traffic Services
WMT Westridge Marine Terminal


SECTION 1
PR0420171202CGY 1-1
Introduction The Trans Mountain Expansion Project (TMEP or the Project) will include construction and subsequent operation of three new berths at the existing Westridge Marine Terminal (WMT or the Terminal) in Burnaby, British Columbia (BC), to accommodate increased throughput from the expanded pipeline capacity. Each new berth will be capable of handling Aframax class vessels. Figure 1-1 shows the location of the Terminal in the Burrard Inlet.
The marine transportation aspects of the Project have been fully described in the submission to the Transport Canada Technical Review Process of Marine Terminal Systems and Transshipment Sites (TERMPOL) (TERMPOL Review Committee [TRC], 2014), which has been reviewed by the TRC, including representatives of the Vancouver Fraser Port Authority (VFPA), and was submitted to the National Energy Board (NEB) in November 2014 (NEB Filing Identification [ID] A64923).
The purpose of this Marine Traffic Technical Report is to specifically address the following 11 VFPA information requests for the Marine Traffic Study component of the Project and Environmental Review Application Submission Requirements:
1. Confirmation of the design vessel range (maximum and minimum size of vessels that can be berthedand loaded) and anticipated traffic levels; anticipated anchorage patterns and utilization periods;bunkering program (whether this is permitted at the terminal); and any other operational criteria
2. Confirmation of the approaches that vessels will take to each berth and the departure from eachberth, based on simulations or advice from the Pacific Pilotage Authority (PPA) and British ColumbiaCoast Pilots (BCCP)
3. A description of any plans for notification or broadcast of information regarding the transit oroperations of the vessels associated with the Project
4. Mooring plan for design vessels at maximum and minimum size
5. A copy of berthing simulation, including approaches to the proposed marine terminal and plans fordocking and undocking
6. A statement on whether the PPA will require a training program for pilots
7. Description of the updated Vessel Acceptance Criteria for the Terminal
8. Passing Vessel Analysis for largest vessels passing the facility with largest design vessels at theproposed berth at different tidal current conditions
9. Confirmation that the Passing Vessel Analysis already completed will still accurately reflectoutcomes considering any engineering changes that have occurred since its completion
10. Analysis of tug requirements to be conducted: report on any special requirements because of severeweather or currents at the Terminal location
11. Description of all anticipated marine traffic that will be associated with construction
As such, this report has been structured to address each requirement.
Appendix A provides two letters of support for the Project.

SECTION 1 – INTRODUCTION
1-2 PR0420171202CGY
Figure 1-1. VFPA Jurisdiction Showing Location of the Westridge Marine Terminal within Burrard Inlet Source: VFPA, 2017a
Westridge

SECTION 2
PR0420171202CGY 2-1
Size of Vessels and Tanker Loading Trans Mountain Pipeline ULC (Trans Mountain) does not own or operate tankers or barges. Shippers on the Trans Mountain pipeline system will source barges and tankers from the international fleet and nominate to offtake cargo oil from the WMT.
The WMT will be designed to handle a range of vessels, from barges to Aframax tankers. Most tankers are expected to be Aframax class vessels (80,000 to 120,000 deadweight tonnage [DWT]); however, Panamax class tankers (60,000 to 80,000 DWT) and barges may also be nominated to load from the WMT.
Parameters of typical size vessels are provided in Table 2-1.
Table 2-1. Typical Crude Oil Vessel Parameters
Parameter Drakes Bay Oil Barge Handymax Vessel Panamax Vessel Aframax Vessel
Vessel Length overall (m) 115.8 190.0 232.0 250.0
Vessel beam (m) 23.2 32.2 32.2 44.0
Vessel draft (m) 7.9 11.0 14.0 15.5
Design deadweight (DWT; tonnes)
17,300 50,000 75,000 120,000
Maximum vessel capacity (bbl) 100,000 300,000 495,000 815,000
Average Project cargo size (bbl) 100,000 300,000 485,000 585,000
Average Project cargo size (m3) 15,900 47,700 77,100 93,000
Average Project Vessel Draft (m) 7.9 11.0 12.5a 12.5a
Source: TERMPOL Section 3.10, NEB Filing ID A3S4T3 a Draft limited by the VFPA Movement Restricted Area (MRA) rules to 13.5 m.
Notes:
bbl = barrel(s) m = metre(s) m3 = cubic metre(s)
It is expected that the typical number of tanker loadings during Project operations will be up to 34 partly loaded Aframax vessels per month, based upon the expected maximum throughput at the dock. Based upon historical records, on average, the WMT handles approximately 5 tankers per month. Barge traffic is not forecast to change.
East of Second Narrows, there are seven bulk terminals including WMT, namely: Canexus Chemicals; Ioco Refinery; Kinder Morgan Westridge; Pacific Coast Terminals; Suncor; Shellburn; and Stanovan (Figure 2-1). In addition to the planned expansion of the WMT, several bulk terminals in Burrard Inlet have planned or have already undergone expansion

SECTION 2 – SIZE OF VESSELS AND TANKER LOADING
2-2 PR0420171202CGY
Figure 2-1. Westridge Marine Terminal in relation to other Bulk Terminals in Burrard Inlet Source: TERMPOL 3.2, NEB Filing ID A3S4R8
2.1 Berth and Anchorage Strategy Trans Mountain will continue to follow the rules and guidance in effect in scheduling vessels to WMT. In addition, under normal circumstances, vessels destined to Westridge will not place undue strain on anchorages in the Port of Vancouver. Utilization of anchorages is expected to remain low under Trans Mountain’s strategy of active management of the berths, as follows: subject to a berth being available (i.e., it is not required for another vessel on the schedule), arriving or completed vessels may await cargo readiness or departure tide, respectively, while remaining alongside a berth. This will also contribute towards making more efficient use of available pilots and tugs in the port related to Trans Mountain traffic.
2.2 Bunkering of Vessels The international tanker trade requires a tanker to submit a notice of readiness to WMT to indicate the vessel’s readiness in all respects, including having a sufficient bunker on board, to complete the voyage for which it has been engaged. Time under the charter party begins to count from the time the notice of readiness is accepted.
Trans Mountain’s core business and expertise is in pipeline transportation and tanker loading. Trans Mountain does not currently provide bunker fuel service to tankers calling at the WMT and does not desire to enter the bunker fuel business in the future. Currently, only a small percentage of tankers calling at the WMT bunker in the Port of Vancouver, because tanker operators have the choice to purchase bunker fuel at many ports and will choose the most economical port, when practical, to improve overall voyage returns. Trans Mountain considered the possibility of providing bunker fuel service at the WMT; however, Trans Mountain did not include a bunkering facility in the scope of the proposed expansion primarily for the following reasons:
• It is expected that arriving tankers will, in most cases, be carrying sufficient fuel for the voyage fromthe WMT before they arrive at the berth.
• The tanker operator and/or agent will arrange to obtain bunker fuel from one of several localsuppliers, if indeed a tanker requires such fuel. Bunkering is typically carried out from a barge whilethe tanker is at anchor.
• Physical space is very limited at the WMT, and Trans Mountain’s goal is to limit the footprint of thefacility to the greatest extent practical.
However, Trans Mountain has considered that occasionally a tanker operator may wish to obtain bunker fuel from a barge while at the WMT. Whereas Trans Mountain does not exercise operational control

SECTION 2 – SIZE OF VESSELS AND TANKER LOADING
PR0420171202CGY 2-3
over calling tankers, Trans Mountain will consider allowing this practice in the future dock complex, upon request, on a case-by-case basis. Subject to acceptance by the VFPA of the WMT bunkering vessels while alongside, procedures will be developed before the commencement of the expanded operations at the WMT, to verify that any approved bunkering activities will be carried out within the safety boom and in accordance with international best practices for safety and environmental protection. In all cases, bunkering operations will be carried out according to the latest edition of the International Safety Guide for Oil Tankers and Terminals and the additional information provided in the VFPA’s Port Information Guide (VFPA, 2017b).
The master of every vessel engaged in bunkering operations will communicate with the VFPA’s Operation Center and will e-mail a copy of the bunkering checklist to [email protected] after bunkering is completed.


PR0420171202CGY 3-1
SECTION 3
Approaches to the Expanded Dock The WMT will consist of three Aframax capable berths. Vessels may make fast to their allocated berths in accordance with mooring best practices for which engineering assessments have been carried out. The WMT is approached from the west, and berthing maneuvers for Berths #1 and #2 must also be executed from the west (whereas Berth #3 berthing maneuvers can be executed from both the west and the east). All berths can accommodate vessels port or starboard side alongside, at the pilot’s discretion, based upon maneuvering safety. However, it is expected that pilots typically will dock the vessels with bow to the west to avoid having to turn the vessel around after it has been loaded.
The TRC has reviewed the proposed berth layout and does not have any concerns (TERMPOL Review Process Report on the TMEP [NEB Filing ID A64923]).
The TRC noted in the TERMPOL Report that the “existing Canadian marine laws and regulations, including international frameworks, complemented by the enhanced safety measures Trans Mountain has in place or is committed to implementing and the recommendations contained within this report will provide for safer shipping in support of the proposed Project” (TERMPOL Review Process Report on the TMEP [NEB Filing ID A64923]).
3.1 Notification and Broadcasting Marine Communications and Traffic Services (MCTS) is a program within the Canadian Coast Guard (CCG), which communicates with vessels transiting given waterways through Vessel Traffic Services (VTS). The role of MCTS is to provide initial response to ships in distress situations, to reduce the possibility of ships being involved in collisions, groundings, and strikings; and to be a cornerstone in the marine information collection and dissemination infrastructure (CCG, 2016).
The CCG issues Notices to Shipping (NOTSHIP) to inform mariners about hazards to navigation and to share other important information. Verbal NOTSHIP alerts are broadcast by radio by MCTS, and written NOTSHIP alerts are issued when the hazard location is beyond broadcast range or when the information remains in effect for an extended period.
MCTS can communicate with, and monitor the movement of, vessels in the VFPA’s jurisdiction. Vessels receiving instructions from MCTS relating to the movement or operation of vessels, works, or services in the waters of the Port of Vancouver are to assume that these are measures required by the authority and that they relate to safety or environmental protection. Periodic notices requiring action by vessels within port waters will be broadcast by MCTS as NOTSHIP or on the continuous marine broadcast.
All vessels transiting the port with very high frequency (VHF) radio capability, and not just those radios required by the MCTS and VTS Zone Regulations, should monitor the VHF channel used for MCTS communications in the respective area. The Vancouver Harbour limits MCTS uses to VHF Channel 12 for communications.

SECTION 3 – APPROACHES TO THE EXPANDED DOCK
3-2 PR0420171202CGY
3.2 Dock Mooring Plan There are three different classifications of mooring lines that are relative to the ship’s orientation:
1. Breast lines: generally perpendicular to the ship, restraining the vessel from moving away from theberth
2. Spring lines: generally parallel with the ship, restraining the vessel from moving along the berth(i.e., fore and aft)
3. Head and stern lines: typically, 45 degrees to the ship, which assist in keeping the vessel alongsideand in position
Modern terminals rely more on the breast and spring lines to restrain the vessel, since these are more efficient at directly restricting the vessel in those directions. The head and stern lines are deployed for redundancy by the vessel master and improve safety. The mooring structures layout incorporates these line configurations in the design.
Mooring analysis was carried out and presented in the TERMPOL studies (TERMPOL 3.13, Appendix A [NEB Filing ID A3S4V0]) and updated based on the final design. A typical tanker uses 14 to 16 mooring lines to secure the vessel to the berth, and the analysis has confirmed that to be sufficient for all conditions. A more up-to-date assessment of mooring layout for different sizes of vessels has been presented, together with other drawings being submitted as part of this permitting application (refer to Drawings Technical Report, TR-1).
Table 3-1 presents a summary of peak mooring line tensions for all Oil Companies International Marine Forum (OCIMF) environmental criteria examined. Loads are presented as a percentage of their minimum allowable breaking load (MBL). OCIMF recommends that the peak line tension is not to exceed 55 percent of the respective tanker’s MBL. According to the mooring analysis report, the Aframax tanker generally results in the largest mooring line loads; however, no vessel exceeds OCIMF recommendations for safe mooring.
Table 3-1. Peak Mooring Line Loads – Oil Companies International Marine Forum Criteria Mooring Line Aframax (%) Handymax (%) 650 Barge (%) Oil Barge (%)
1 25 39 18 27
2 25 41 18 12
3 31 35 30 12
4 29 38 31 12
5 38 24 30 25
6 37 24 29 28
7 34 43 30 --
8 34 53 30 --
9 28 40 -- --
10 28 40 -- --
11 38 28 -- --
12 38 28 -- --
13 35 -- -- --
14 34 -- -- --
15 29 -- -- --

SECTION 3 – APPROACHES TO THE EXPANDED DOCK
PR0420171202CGY 3-3
Table 3-1. Peak Mooring Line Loads – Oil Companies International Marine Forum Criteria Mooring Line Aframax (%) Handymax (%) 650 Barge (%) Oil Barge (%)
16 29 -- -- --
Source: TERMPOL 3.13, Appendix A (NEB Filing ID A3S4V0) Note: -- = not applicable
3.3 Berthing Simulation After the selection of a preferred design for the new WMT facility, which was filed with the NEB, a desktop navigation simulation study was conducted by LANTEC Marine Inc. to identify any design issues that might complicate the conduct of vessel maneuvers to and from the berths of the new dock system. No concerns were identified during such simulation exercises that were carried out in the areas surrounding the Terminal.
The proposed berth design has several features that are assessed as facilitating the ship maneuvering process. In all cases, the main berthing faces are unobstructed, and they allow an approach from an axis of at least 45 degrees, which provides flexibility and safety when maneuvering the vessel and working the tugs. In addition, the mooring pads and catwalks are recessed approximately 35 m from the plane of the main berthing face. This provides good clearance for the tugs, if needed, to work on the inboard side of the ship prior to connecting or after slipping mooring lines. More detail is available in the Summary Report of Maneuvering Assessment Westridge Terminals Vancouver Expansion Supplementary Report – July 2014 Modifications (NEB Filing ID A4A7R0).
It is important to note that the goal of this analysis was not to determine the ideal or best methodology for conducting approach and departure maneuvers from the proposed terminal. As such, Trans Mountain will conduct real-time simulations around the Terminal, led by the BCCP and in consultation with the VFPA and the PPA. These exercises will be used to confirm various berthing parameters (such as minimum safe speeds and operational requirements for tugs). Such real-time simulation exercises will be planned in cooperation with the VFPA, PPA, and BCCP, and they are expected to be conducted after construction is started.
3.4 Pilot Training and Familiarization The TMEP marine hazard identification process identified pilot availability and familiarization as important to the Project (TERMPOL Study 3.15, NEB Filing IDs A3S5F4, A3S5F6, and A3S5F8). The PPA has confirmed that there will be a sufficient number of licensed unrestricted pilots to provide necessary pilotage service to project tankers (NEB Filing ID A4A8T7).
Trans Mountain is aware that the highly trained pilots of the BCCP safely operate and guide vessels at a high rate of success. The PPA, which licenses all pilots operating on the BC Coast, places a high priority on refresher programs and continuous improvement of pilotage techniques, spending between $500,000 and $1,000,000 annually on training. Pilots have been trained in BC, Eastern Canada, the United States, and Europe. Recently, the PPA has installed its own navigation simulator using world-leading Kongsberg technology to further facilitate pilot training.
Trans Mountain expects that real-time simulation (Section 3.2) will be used by the PPA, the BCCP, and the VFPA to inform and run a familiarization program for pilots and tug masters in docking and undocking vessels at the expanded WMT dock system. Trans Mountain expects that initially the familiarization program will be developed and simulator databases updated by the end of 2017. The actual extent and timeframe for pilots to undergo the program would be determined by early 2018. In

3-4 PR0420171202CGY
SECTION 3 – APPROACHES TO THE EXPANDED DOCK
any case, pilot familiarization would be completed at least 3 months prior to the expanded Westridge dock system becoming operational.
3.5 Vessel Acceptance Criteria As the terminal operator, Trans Mountain has authority to vet and to grant or deny permission for tankers to berth, which is a tool to compel tankers to comply with Trans Mountain’s tanker acceptance process and terminal regulations.
Under Trans Mountain’s robust Tanker Acceptance Standard (National Energy Board [NEB] Filing ID A3W9J8), all vessels nominated to transfer cargo at the WMT must undergo a review to assess that the vessel will not pose any undue hazard or risk to the Terminal, other vessels, or the public. Unacceptable vessels or those not meeting the criteria are denied berthing rights. For added safety, Trans Mountain allocates a Loading Master to every vessel at the WMT and pre-deploys an oil spill boom whenever oil is being transferred to or from a vessel at the WMT. These industry-leading practices will continue to be applied (with necessary updates to account for the Project enhancements).
The Tanker Acceptance Standard will be updated in accordance with the NEB conditions prior to commencing operations. The basic requirements are not expected to change from its current version; rather, they will be enhanced in accordance with improvements through the project.
3.6 Passing Vessel Analysis During review of the Project under the TERMPOL Review Process, the VFPA requested that an independent party complete a Passing Vessel Analysis on behalf of Trans Mountain. The VFPA requested the analysis to take into account the proposed berth layout and to determine the safety parameters for all maneuvering situations that may result east of Second Narrows.
Trans Mountain provided the results of the Passing Vessel Analysis to the VFPA (Appendix C and NEB Filing ID A4A7Q9). The study results indicate that the minimum distance between traffic within the proposed channel and a moored vessel at Berth 3 of the proposed expanded terminal is approximately 190 m. Peak-to-peak motions of all vessels at the berth were minimal and well within recommended envelopes of the World Association for Waterborne Transport Infrastructure. All lines and fenders maintained loading safety factors well below the suggested OCIMF criteria for moored tankers at berth.
According to the TERMPOL Report, the VFPA intends to use the results of the Passing Vessel Analysis provided by Trans Mountain to inform redesign of the channel in the eastern section of the Burrard Inlet between Second Narrows and Port Moody, as well as the location of the anchorages east of Second Narrows.
Trans Mountain confirms that the Passing Vessel Analysis already completed accurately reflects outcomes considering the engineering changes that have occurred since its completion.
3.7 Analysis of Tug Requirements Tugs can provide a variety of services (ranging from escorting, tethering, and assisting in berthing to unberthing, safety and security, spill contingency, and firefighting). For the purposes of this study, only those tug services required to assist tankers calling WMT to navigate through Vancouver Harbour are considered.
Requirements for tug escorts in Vancouver Harbour are defined in the Port Information Guide (VFPA, 2017b). Vessel calling WMT are required to navigate the Second Narrows MRA and must already comply with VFPA standards for tug requirements, which have been reproduced in Table 3-2, summarizing the configuration of the tug package and the bollard pull requirements for such vessels. For those vessels

SECTION 3 – APPROACHES TO THE EXPANDED DOCK
PR0420171202CGY 3-5
arriving directly to berth at WMT the same tugs will assist during berthing. Similarly, those tugs assisting a vessel to depart from the berth will also provide the necessary assistance through the Second Narrows as well. However, in case there is a requirement of an intervening period of anchoring of the vessel, separate tugs will be called to fulfill the service requirements.
Table 3-2. VFPA Tug and Bollard Pull Requirements
Number of Tugs Bollard Pull (tonnes)
LOA/LOA +B Draught Bow Stern At Bow At Stern Total
LOA less than 200m and beam less than 35m
<8 m 1 1 20 30 50
>8 m <10 m 1 1 30 40 70
>10 m 1 1 30 50 80
LOA 200m – 229.9m and beam less than 35m
<8 m 1 1 30 50 80
>8 m <10 m 1 1 or 2 60 65 125
>10 m <12 m 1 or 2 1 or 2 60 80 140
>12 m 1 or 2 2 60 110 170
LOA 230m – 250m and beam less than 45m
<10 m 1 or 2 1 or 2 60 65 125
>10 m <12 m 1 or 2 1 or 2 60 80 140
>12 m 1 or 2 2 60 110 170
Source: VFPA, 2017b
Notes:
LOA = length overall LOA+B = length overall plus beam
Trans Mountain has been in close dialogue with tug operators in the Port of Vancouver to confirm each operator’s ability to provide the necessary tug support in future. Between the two operators, Seaspan and SAAM Smit, there are currently nine tugs each with over 60 tonnes bollard pull capacity working in the port. Both operators intend to support TMEP with tugs and, for this purpose, would be willing to obtain additional vessels as indicated by their letters of support (which are appended to the end of this report in Appendix A).
3.8 Anticipated Construction-related Marine Traffic Trans Mountain expects that a major portion of the marine facilities will be constructed from the water using marine derricks and other construction-related equipment, which may extend up to about 100 m beyond the footprint of the expanded dock. The current dock extends 75 m into Burrard Inlet, and the new dock is anticipated to extend approximately 250 m into Burrard Inlet; as such, the maximum marine footprint of construction activities may be approximately 350 m into Burrard Inlet.
It is anticipated that barges will be used to transport construction materials related to the WMT expansion. As such, during the construction phase, there will be numerous barge deliveries to the WMT site towed by tugs; other tugs, barges, vessels, and booms related to expansion of the docks will be around the new dock area as it is being built.
It is not anticipated that construction-related vessels and marine equipment will obstruct or impede the passage of other vessels in Burrard Inlet, given the size of the inlet passage at the Terminal site. These vessels will display appropriate lights and shapes in accordance with ColRegs. In the unlikely event that

3-6 PR0420171202CGY
SECTION 3 – APPROACHES TO THE EXPANDED DOCK
there is any potential short-term obstruction of the waterway during construction that would affect safe navigation of other vessels, this would be coordinated in advance through the VFPA Harbour Master and the CCG. Waterway users are notified of such activities through the CCG’s Weekly Notice to Mariners.
Increased activity at the terminal during construction may factor into certain users changing their movement patterns away from areas around the Terminal, or may result in minor delays for certain users. Should it be deemed necessary, launches will be employed by the Project to guide and direct other vessels, and such vessels will display the appropriate signals and make appropriate broadcasts by VHF radio to ensure that approaching and passing traffic is kept suitably informed (and cautioned) of the works under progress. In consultation with VFPA, a detailed communications plan will be developed for the construction phase that will include the establishment of clear communication links using established modern means, which will include feedback and complaints hotlines. Regular updates will be posted to the Trans Mountain website for information of stakeholders and the public. Please see the In-Water Excavation Technical Report (TR-6) for further detail on equipment to be used during in-water excavation.
Certain construction-related vessels and marine equipment such as pile driving rigs operating within the construction zone will utilize appropriate anchoring systems that will consist of several anchors deployed to the seafloor and extending beyond the designated construction zone. The anchors and cable will not interfere with surface navigation and will be clear of the general vessel traffic in the area and will also not impact the designated anchorage locations. Due to the bathymetry of the inlet with deep water down the center where the anchors would typically be placed, the catenary of the anchor cables would generally lay on the seafloor except when from time to time these are tightened up to reposition the construction vessel. A preliminary layout, including profile drawings, of the anchoring systems are being developed and can be provided if required as part of the technical review.
NEB Condition #48 requires development of a Navigation and Navigation Safety Plan (NNSP). The condition requires a list of navigable waterways affected by the Project and requires mitigation measures to address navigation and navigation safety. The navigable waterway that interacts with the WMT is Burrard Inlet.
The NNSP does not apply to potential navigation effects of moving tankers; however, it does apply to the presence of the expanded marine terminal during Project construction and operations. The NNSP document can be found through the NEB weblink: https://apps.neb-one.gc.ca/REGDOCS/Item/View/3241376 (see also Appendix D).
The NNSP has listed several planned mitigation measures that have been (and will be) conducted during the construction of the WMT, as follows:
• Dock design and siting has been developed so that it will not impede boat traffic. Trans Mountainhas committed that they will:
− Continue to work with the VFPA on permitting and design requirements.
− Seek input on strategies to communicate construction schedule and work areas to residents and others.
− Notify marine commercial and recreational operators of hazards associated with construction, and place warning signs offshore and onshore near construction activities.
− Facilitate barges for heavy equipment access being placed in appropriate areas.
− Operate Project vessels at low speeds.
− Provide detailed design information to the CCG to evaluate the need for additional navigational aids.

SECTION 3 – APPROACHES TO THE EXPANDED DOCK
PR0420171202CGY 3-7
− Share the NNSP for the WMT area with marine waterway users and implement it after engaging with appropriate authorities and stakeholders.
Trans Mountain also advised participants at the event that, during construction of the WMT, the following will occur:
• The VFPA will be requested to implement the proposed passing ship channel described in the TMEPsubmission to the NEB.
• The working zone for WMT construction will be demarcated by navigation buoys and other means inconsultation with the CCG and the VFPA.
• On-water safety vessels will provide guidance and assistance, as necessary.
Furthermore, Trans Mountain will regularly communicate with and update all marine waterway users (including boaters, commercial fishers, and Aboriginal groups) on construction activities in the construction area through a variety of methods, including the following:
• Meetings or workshops with key user groups
• Neighbourhood resident mail-outs
• Local advertising and public service announcements
• On-water and onshore signage
• Website postings, e-mail notifications, and social media
• Access to e-mail and phone-line contacts
3.9 Westridge Marine Terminal Construction Safety Boom Plans are in hand to install a floating marine safety boom around the entire Westridge working zone during construction. The marine construction safety boom, a key element of the NNSP, will be designed to ensure the safety of commercial and recreational users of the local marine area, and the safety of workers working within a clearly demarcated working zone. The overall Westridge area working zone is expected to encompass waters covering the future Westridge water lot area plus an additional temporary working space. It will be fitted with several access points or gates to accommodate the passage of construction vessels and vessels coming to and from the existing Westridge dock. The existing terminal will remain in operation for the majority of the construction period.
The marine construction safety boom will consist of floats and suitable vertical panels and its layout will be configured according to the construction operations and schedule. It will be highly visible during the day and the structure will be equipped with reflective placards on both the inside and outside so the marine safety boom remains visible between the buoys. At night, in accordance with general Canadian Coast Guard requirements, the boom will be marked by navigation lights (flashing yellow one nautical mile range) on all offshore corners. Additional lights will be mounted on the ship gate buoys. Radar reflectors will be installed strategically to assist approaching traffic identify the boom on radar during night time and periods of reduced visibility.
This boom will be moored using suitable anchors to withstand typical and worst case environmental conditions found in this area. Although the anchors securing the boom will be deployed to the seafloor and might extend outside the area enclosed by the boom, the anchors will not pose any concern for surface navigation.
The marine safety boom will be staged at a nearby yard in the Burrard Inlet. From here it will be assembled and launched. The NNSP in Appendix D includes a figure of the safety boom.


SECTION 4
PR0420171202CGY 4-1
References Canadian Coast Guard (CCG). 2016. Marine Communications and Traffic Services MCTS. Accessed May 2016. http://www.ccg-gcc.gc.ca/Marine-Communications/Home.
Fisheries and Oceans Canada (DFO). 2012. Pacific Region Integrated Fisheries Management Plan: Surf Smelt - April 1, 2012 to December 31, 2014. Accessed May 2016. http://www.dfo-mpo.gc.ca/Library/343255.pdf.
Fisheries and Oceans Canada (DFO). 2013. Permitted Fishing Within Rockfish Conservation Areas. Accessed May 2016. http://www.pac.dfo-mpo.gc.ca/fm-gp/maps-cartes/rca-acs/permitted-permis-eng.html.
TERMPOL Review Committee (TRC). 2014. TERMPOL Review Process Report for the Trans Mountain Expansion Project. 68 pp.
Vancouver Fraser Port Authority (VFPA). 2017a. Home. Accessed April 2017. http://www.portvancouver.com/.
Vancouver Fraser Port Authority (VFPA). 2017b. Port Information Guide. Accessed April 2017. http://www.portvancouver.com/wp-content/uploads/2015/03/Port-Information-Guide-12-Port-of-Vancouver-August-2016-amended.pdf


Appendix A Letters of Support


Appendix B Mooring and Berthing Analysis


Westridge Marine Terminal – Berthing & Mooring Analysis Final Report PRODUCED FOR TRANS MOUNTAIN PIPELINE LP APRIL 27, 2017
Westridge Marine Terminal - Berthing & Mooring Analysis | Trans Mountain Pipeline LP Revision 0 | April 27, 2017
Creative People, Practical Solutions.® Page i
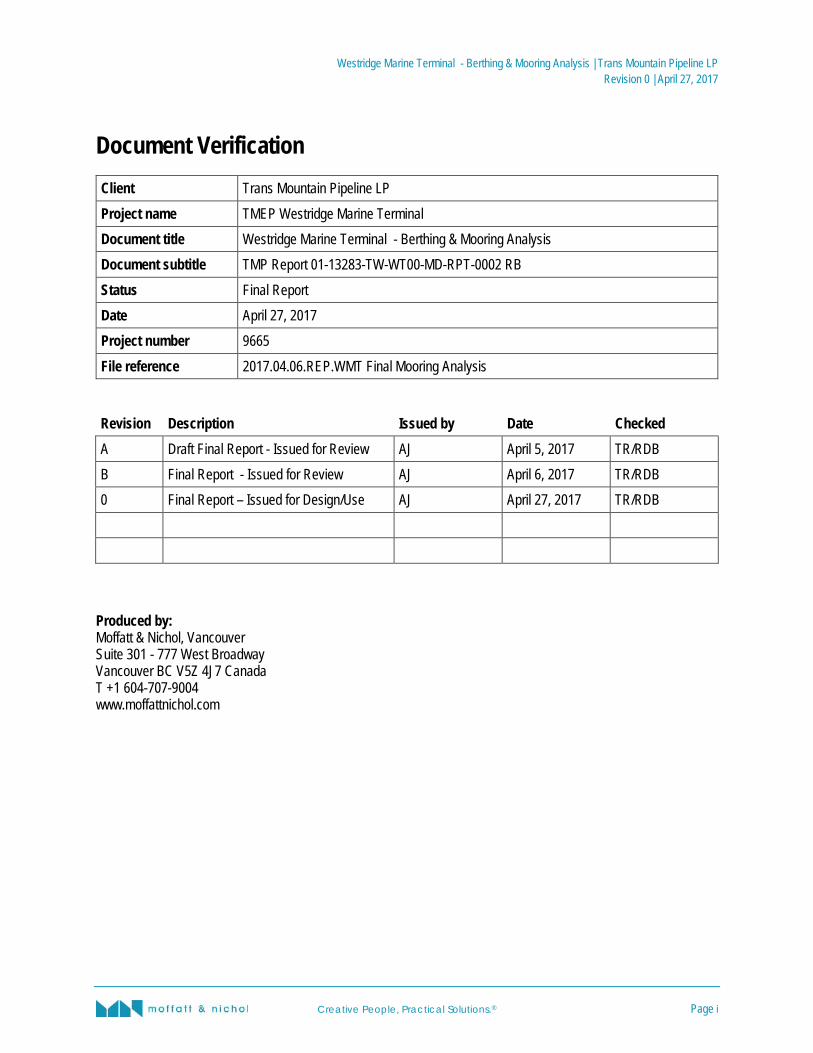
Document Verification Client Trans Mountain Pipeline LP Project name TMEP Westridge Marine Terminal Document title Westridge Marine Terminal - Berthing & Mooring Analysis Document subtitle TMP Report 01-13283-TW-WT00-MD-RPT-0002 RB Status Final Report Date April 27, 2017 Project number 9665 File reference 2017.04.06.REP.WMT Final Mooring Analysis
Revision Description Issued by Date Checked A Draft Final Report - Issued for Review AJ April 5, 2017 TR/RDB B Final Report - Issued for Review AJ April 6, 2017 TR/RDB 0 Final Report – Issued for Design/Use AJ April 27, 2017 TR/RDB
Produced by: Moffatt & Nichol, Vancouver Suite 301 - 777 West Broadway Vancouver BC V5Z 4J7 Canada T +1 604-707-9004 www.moffattnichol.com

Westridge Marine Terminal - Berthing & Mooring Analysis | Trans Mountain Pipeline LP Revision 0 | April 27, 2017
Creative People, Practical Solutions.® Page ii
Table of Contents Document Verification .................................................................................................................................................. i
Disclaimer .................................................................................................................................................................... vi
Executive Summary ..................................................................................................................................................... 1
1. Introduction ....................................................................................................................................................... 4 1.1. Scope .................................................................................................................................................................. 4 1.2. Purpose .............................................................................................................................................................. 4 1.3. Site Layout .......................................................................................................................................................... 4 2. Design Basis ..................................................................................................................................................... 6 2.1. Design Vessel Characteristics ............................................................................................................................ 6 2.2. General Arrangement of Marine Facilities .......................................................................................................... 9 2.2.1. Parallel Midbody Analysis ................................................................................................................................... 9 2.2.1. Breasting Dolphin Locations ............................................................................................................................. 10 2.2.2. Mooring Dolphins .............................................................................................................................................. 14 2.3. Metocean Criteria ............................................................................................................................................. 15 2.3.1. OCIMF Criteria .................................................................................................................................................. 15 2.3.2. Water Depth ...................................................................................................................................................... 15 2.3.3. Water Levels ..................................................................................................................................................... 15 2.3.4. Winds ................................................................................................................................................................ 17 2.3.5. Current .............................................................................................................................................................. 19 2.3.6. Waves ............................................................................................................................................................... 20 2.3.7. Tsunami ............................................................................................................................................................ 21 2.3.8. Selected Metocean Criteria............................................................................................................................... 21
3. Berthing Analysis ........................................................................................................................................... 23 3.1. Berthing Energy Requirements ......................................................................................................................... 23 3.2. Berthing Velocity ............................................................................................................................................... 23 3.3. Eccentricity Factor ............................................................................................................................................ 24 3.4. Added Mass Factor ........................................................................................................................................... 24 3.5. Berthing Configuration and Fender Softness Factor ......................................................................................... 24 3.6. Abnormal Berthing Energy Factor ..................................................................................................................... 24 3.7. Berthing Loads .................................................................................................................................................. 24 3.8. Fender Selection ............................................................................................................................................... 27 4. Mooring Point Loads ...................................................................................................................................... 29 4.1. MOTEMS .......................................................................................................................................................... 29 4.2. PIANC WG 153 ................................................................................................................................................. 29 4.3. British Standard (European Union) ................................................................................................................... 30 4.4. Determining Largest Mooring Line .................................................................................................................... 31 4.5. Method Selection .............................................................................................................................................. 32 5. Mooring Analysis Methodology ..................................................................................................................... 33 5.1. Static Mooring Model Software – OPTIMOOR ................................................................................................. 33 5.2. Dynamic Mooring Model Software – aNyMoor.................................................................................................. 33

Westridge Marine Terminal - Berthing & Mooring Analysis | Trans Mountain Pipeline LP Revision 0 | April 27, 2017
Creative People, Practical Solutions.® Page iii
5.3. Limiting Mooring Criteria ................................................................................................................................... 33 5.3.1. Mooring Line Tension Limits ............................................................................................................................. 33 5.3.2. Fender Loads .................................................................................................................................................... 34 5.3.3. Motions ............................................................................................................................................................. 34 5.4. Mooring Line Arrangements.............................................................................................................................. 34 5.4.1. Aframax Tanker ................................................................................................................................................ 34 5.4.2. Panamax Tanker .............................................................................................................................................. 37 5.4.3. Handymax Tanker ............................................................................................................................................ 39 5.4.4. Handysize Tanker ............................................................................................................................................. 40 5.4.5. Jet Fuel Barge .................................................................................................................................................. 41 5.4.6. Oil Barge ........................................................................................................................................................... 42
6. Static Mooring Analysis Results ................................................................................................................... 43 6.1. Aframax Tanker ................................................................................................................................................ 43 6.2. Panamax Tanker .............................................................................................................................................. 48 6.3. Handymax Tanker ............................................................................................................................................ 51 6.4. Jet Fuel Barge .................................................................................................................................................. 54 6.5. Jet Fuel Barge .................................................................................................................................................. 56 6.6. Oil Barge ........................................................................................................................................................... 57 7. Dynamic Mooring Analysis Results .............................................................................................................. 58 7.1. Mooring Analysis Summary .............................................................................................................................. 58 7.1.1. Tsunami Mooring Analysis Results ................................................................................................................... 58
8. Conclusions .................................................................................................................................................... 64
9. References ...................................................................................................................................................... 65
List of Figures Figure 1-1: Artist Rendering of the Proposed Westridge Terminal Expansion ........................................................... 5 Figure 2-1: KM TMEP Marine Facilities Arrangement ................................................................................................ 9 Figure 2-2: Side Profile – Parallel Midbody Curve on Panamax Tanker ................................................................... 10 Figure 2-3: Recommended Dolphin Spacing (OCIMF MEG-3) ................................................................................. 11 Figure 2-4: General Arrangement of Berths 1&2 (all dimensions in meters) ............................................................ 12 Figure 2-5: General Arrangement of Berth 3 (all dimensions in meters) .................................................................. 12 Figure 2-6: General Arrangement of Loading Platforms (Top: Berth 2; Bottom: Berth 3) ......................................... 13 Figure 2-7: General Arrangement of Tanker Manifolds (OCIMF - 1991) .................................................................. 14 Figure 2-8: Breasting Dolphin elevation .................................................................................................................... 14 Figure 2-9: Water Level Exceedance Curve at Station 7735 Vancouver .................................................................. 17 Figure 2-10: Annual wind rose developed from measurements at the Site ............................................................ 18 Figure 2-11: Peak Ebb (Depth-Averaged) Currents ............................................................................................... 20 Figure 3-1: Generalized Performance Curve of Trelleborg Super Cone Fender ...................................................... 27 Figure 3-2: Photograph of Example Fender Panel with 100 mt capacity Fender Posts............................................ 28 Figure 5-1: Mooring Line Arrangement – Aframax Tanker ....................................................................................... 35 Figure 5-2: Extreme Low Water Mooring Line Arrangement – Aframax Tanker ....................................................... 36
Westridge Marine Terminal - Berthing & Mooring Analysis | Trans Mountain Pipeline LP Revision 0 | April 27, 2017
Creative People, Practical Solutions.® Page iv
Figure 5-3: Mooring Line Arrangements – Panamax Tanker .................................................................................... 37 Figure 5-4: Extreme Low WaTer Mooring Line Arrangements – Panamax Tanker .................................................. 38 Figure 5-5: Mooring Line Arrangements – Handymax Tanker .................................................................................. 39 Figure 5-6: Mooring Line Arrangements – Handysize Tanker .................................................................................. 40 Figure 5-7: Mooring Line Arrangements – Jet Fuel Barge ........................................................................................ 41 Figure 5-8: Mooring Line Arrangements – Oil Barge ................................................................................................ 42
List of Tables Table 2-1: Basis of Design Vessels ........................................................................................................................... 6 Table 2-2: Design Vessel Characteristics .................................................................................................................. 7 Table 2-3: Parallel Midbody Confidence Intervals ................................................................................................... 10 Table 2-4: Characteristic Tidal Datums in the Site Vicinity ...................................................................................... 16 Table 2-5: Extreme Wind Speeds at Westridge Terminal........................................................................................ 19 Table 2-6: Peak Depth-Averaged Current from Hydrodynamic Model .................................................................... 20 Table 2-7: Metocean criteria for mooring analyses ................................................................................................. 22 Table 3-1: Berthing Analysis Summary ................................................................................................................... 26 Table 4-1: BS6349: 1-2 “Table H” ........................................................................................................................... 31 Table 4-2: Aframax Confidence Banding ................................................................................................................. 31 Table 4-3: Panamax Confidence Banding ............................................................................................................... 31 Table 6-1: Peak Mooring Loads – Aframax Tanker at Ballast Draft ........................................................................ 44 Table 6-2: Peak Mooring Loads – Aframax Tanker at Loaded Draft ....................................................................... 45 Table 6-3: Peak Mooring Loads – Aframax Tanker at Ballast Draft – Extreme Low Water ..................................... 46 Table 6-4: Peak Mooring Loads – Aframax Tanker at Loaded Draft – Extreme Low Water .................................... 47 Table 6-5: Peak Mooring Loads – Panamax Tanker at Ballast Draft ....................................................................... 48 Table 6-6: Peak Mooring Loads – Panamax Tanker at Loaded Draft ..................................................................... 49 Table 6-7: Peak Mooring Loads – Panamax Tanker at Ballast Draft – Extreme Low Water ................................... 50 Table 6-8: Peak Mooring Loads – Panamax Tanker at Loaded Draft – Extreme Low Water .................................. 51 Table 6-9: Peak Mooring Loads – Handymax Tanker at Ballast Draft ..................................................................... 52 Table 6-10: Peak Mooring Loads – Handymax Tanker at Loaded Draft ............................................................... 53 Table 6-11: Peak Mooring Loads – Handymax Tanker at Ballast Draft ................................................................ 54 Table 6-12: Peak Mooring Loads – Handymax Tanker at Loaded Draft ............................................................... 55 Table 6-13: Peak Mooring Loads – Jet Fuel Barge at Ballast Draft ...................................................................... 56 Table 6-14: Peak Mooring Loads – Jet Fuel Barge at Loaded Draft ..................................................................... 56 Table 6-15: Peak Mooring Loads – Oil Barge at Ballast Draft............................................................................... 57 Table 6-16: Peak Mooring Loads – Oil Barge at Loaded Draft ............................................................................. 57 Table 7-1: Peak Dynamic Mooring Loads – Aframax .............................................................................................. 59 Table 7-2: Peak Mooring Motions – Aframax .......................................................................................................... 59 Table 7-3: Peak Dynamic Mooring Loads – Panamax ............................................................................................ 60 Table 7-4: Peak Mooring Motions – Panamax ........................................................................................................ 60 Table 7-5: Peak Dynamic Mooring Loads – Handymax .......................................................................................... 61 Table 7-6: Peak Mooring Motions – Handymax ...................................................................................................... 61 Table 7-7: Peak Dynamic Mooring Loads – Handysize ........................................................................................... 62

Westridge Marine Terminal - Berthing & Mooring Analysis | Trans Mountain Pipeline LP Revision 0 | April 27, 2017
Creative People, Practical Solutions.® Page v
Table 7-8: Peak Mooring Motions – Handysize ....................................................................................................... 62 Table 7-9: Peak Dynamic Mooring Loads – Jet Fuel Barge .................................................................................... 63 Table 7-10: Peak Mooring Motions – Jet Fuel Barge ............................................................................................ 63
Westridge Marine Terminal - Berthing & Mooring Analysis | Trans Mountain Pipeline LP Revision 0 | April 27, 2017
Creative People, Practical Solutions.® Page vi
Disclaimer Moffatt & Nichol devoted effort consistent with (i) the level of diligence ordinarily exercised by competent professionals practicing in the area under the same or similar circumstances, and (ii) the time and budget available for its work, to ensure that the data contained in this report is accurate as of the date of its preparation. This study is based on estimates, assumptions and other information developed by Moffatt & Nichol from its independent research effort, general knowledge of the industry, and information provided by and consultations with the client and the client's representatives. No responsibility is assumed for inaccuracies in reporting by the Client, the Client's agents and representatives, or any third-party data source used in preparing or presenting this study. Moffatt & Nichol assumes no duty to update the information contained herein unless it is separately retained to do so pursuant to a written agreement signed by Moffatt & Nichol and the Client.
Moffatt & Nichol’s findings represent its professional judgment. Neither Moffatt & Nichol nor its respective affiliates, makes any warranty, expressed or implied, with respect to any information or methods disclosed in this document. Any recipient of this document other than the Client, by their acceptance or use of this document, releases Moffatt & Nichol and its affiliates from any liability for direct, indirect, consequential or special loss or damage whether arising in contract, warranty (express or implied), tort or otherwise, and irrespective of fault, negligence and strict liability.
This report may not to be used in conjunction with any public or private offering of securities, debt, equity, or other similar purpose where it may be relied upon to any degree by any person other than the Client. This study may not be used for purposes other than those for which it was prepared or for which prior written consent has been obtained from Moffatt & Nichol.
Possession of this study does not carry with it the right of publication or the right to use the name of "Moffatt & Nichol" in any manner without the prior written consent of Moffatt & Nichol. No party may abstract, excerpt or summarise this report without the prior written consent of Moffatt & Nichol. Moffatt & Nichol has served solely in the capacity of consultant and has not rendered any expert opinions in connection with the subject matter hereof. Any changes made to the study, or any use of the study not specifically identified in the agreement between the Client and Moffatt & Nichol or otherwise expressly approved in writing by Moffatt & Nichol, shall be at the sole risk of the party making such changes or adopting such use.
This document was prepared solely for the use by the Client. No party may rely on this report except the Client or a party so authorised by Moffatt & Nichol in writing (including, without limitation, in the form of a reliance letter). Any party who is entitled to rely on this document may do so only on the document in its entirety and not on any excerpt or summary. Entitlement to rely upon this document is conditioned upon the entitled party accepting full responsibility and not holding Moffatt & Nichol liable in any way for any impacts on the forecasts or the earnings from the project resulting from changes in "external" factors such as changes in government policy, in the pricing of commodities and materials, price levels generally, competitive alternatives to the project, the behaviour of consumers or competitors and changes in the owners’ policies affecting the operation of their projects.
This document may include “forward-looking statements”. These statements relate to Moffatt & Nichol’s expectations, beliefs, intentions or strategies regarding the future. These statements may be identified by the use of words like “anticipate,” “believe,” “estimate,” “expect,” “intend,” “may,” “plan,” “project,” “will,” “should,” “seek,” and similar expressions. The forward-looking statements reflect Moffatt & Nichol’s views and assumptions with respect to future events as of the date of this study and are subject to future economic conditions, and other risks and uncertainties. Actual and future results and trends could differ materially from those set forth in such statements due to various factors, including, without limitation, those discussed in this study. These factors are beyond Moffatt & Nichol’s ability to control or predict. Accordingly, Moffatt & Nichol makes no warranty or representation that any of the projected values or results contained in this study will actually be achieved.
This study is qualified in its entirety by, and should be considered in light of, these limitations, conditions and considerations.

Westridge Marine Terminal - Berthing & Mooring Analysis | Trans Mountain Pipeline LP Revision 0 | April 27, 2017
Creative People, Practical Solutions.® Page 1
Executive Summary As part of the Trans Mountain Expansion Project, Trans Mountain Pipeline (TMP) intends to expand its existing Westridge Marine Terminal in Burnaby, British Columbia. The expansion includes the construction of three new jetty berths, as shown in the figure below, which are capable of accepting vessels ranging from barges to Aframax tankers. Berth 1 shall accommodate vessels carrying jet fuel, crude and other oil that range from inland barges to Aframax tankers. Berth 2 and 3 shall accommodate vessels carrying only crude oils that range from inland barges to Aframax tankers.
ARTIST RENDERING OF THE PROPOSED WESTRIDGE TERMINAL EXPANSION
Moffatt & Nichol (M&N) has been retained by TMP to perform the detailed engineering design of the terminal’s marine facilities. In this report, M&N presents the mooring analyses conducted for the design range of vessels to evaluate the loads on the mooring elements (mooring lines, mooring hooks, and fenders) and the vessel motions as a result of environmental forcing imposed by winds, currents, and waves, with the objective of presenting mooring arrangements and limiting environmental criteria that satisfy industry standards for safe operations.
Berth 1
Berth 2
Berth 3

Westridge Marine Terminal - Berthing & Mooring Analysis | Trans Mountain Pipeline LP Revision 0 | April 27, 2017
Creative People, Practical Solutions.® Page 2
Berthing Energy
Berthing energies were calculated using methods developed by the World Association for Waterborne Transportation Infrastructure (PIANC) for the design of fender systems. Berthing energies were calculated at both loaded and ballast draft for the design range of tankers and barges.
The largest displacement, Aframax tanker, at loaded draft develops a berthing energy demand of 275 mt-m. For the mooring and tsunami analyses presented in this report, a representative Trelleborg SCN 2000 F 1.0 CV was modeled, with an available reaction of 256 mt and energy absorption of 306 mt-m.
Static Mooring Analysis
Static mooring analyses were conducted using OPTIMOOR software for the Oil Companies International Marine Forum (OCIMF) recommended environmental conditions, which include an omni-directional 60 knot wind concomitant with a range of current velocities and directions. Analyses were conducted for the design range of tanker and barges.
Ballast draft conditions were examined at Extreme Highest High Water including 0.5 m of sea level rise of +3.0 m [Geodetic Datum (GD)], which results in the largest windage areas and highest (least efficient) mooring line angles. Loaded draft conditions were examined at Lower Low Water Large Tide (LLW-LT) of -3.0m (GD), which result in the smallest depth to draft ratio and which magnifies the effects of current on the increased wetted area. The OCIMF winds are representative of a 500-year wind conditions and currents exceed the criteria anticipated at the project site as a result of metocean data analysis and numerical modeling conducted by M&N and presented in the 2014 Metocean Study Report.
Safe mooring criteria for all analyses include:
• Limiting line tensions to 55% of minimum breaking load (MBL) for steel wire lines and 50% for synthetic lines; Note that typically MBL of any fitted synthetic lines is higher to compensate for the reduced limiting line tensions applicable to synthetic mooring ropes.
• Limiting winch brake holding capacity to 60% of minimum breaking load (MBL) • Limiting fender reactions to the rated capacity of the selected fender (256 mt); • Limiting surge and sway motions to ±3.0 meters, per PIANC guidelines for operational conditions.
All safe mooring criteria are satisfied for all OCIMF recommended environmental conditions for all tankers and barges examined, including all water level and draft conditions. For the Aframax and Panamax tankers, an extreme low water mooring arrangement has been developed, as tankers at LLW-LT may have interference issues with the optimal arrangement of spring lines with the fender system of the interior breasting dolphins.
Dynamic Mooring Analyses
Dynamic mooring analyses were conducted using the aNyMooR-TERMSIM software, a time -domain six degree of freedom mooring analysis software. Analyses were carried out for operational metocean conditions which are defined as an omnidirectional 40 knot wind speed, including a gust spectrum. The most conservative mooring conditions of the static mooring analyses are utilized for the dynamic

Westridge Marine Terminal - Berthing & Mooring Analysis | Trans Mountain Pipeline LP Revision 0 | April 27, 2017
Creative People, Practical Solutions.® Page 3
mooring analyses, implying only ballast draft conditions are examined, as successful results at ballast draft predicate successful results at loaded draft. The same safe mooring criteria as applied for the static mooring analyses are utilized for dynamic analyses with the addition of reporting vessel motion referenced to the cargo manifold.
Results of the dynamic mooring analyses for the operational metocean conditions are successful for line tensions, fender reactions and vessel motions.
Tsunami Analysis
M&N conducted a tsunami assessment of the Westridge Terminal as part of the Trans Mountain Expansion Project, which evaluated the impact of landslide-generated tsunami in the Indian Arm and Burrard Inlet using a MIKE 21, two-dimensional hydrodynamic model. Time series of depth-averaged current velocities at the berths for each modeled landslide are available from this study. The highest depth-averaged currents were applied to the Aframax tanker to assess feasibility of sustaining a tsunami event combined with a 25-year wind of 36.8 knots (2-minute duration) wind. Tsunami analyses are considered only for the loaded Aframax tanker, on the predication that successful results for the largest design vessel will be successful for tankers with less wetted area for tsunami forces to act. Tsunami forces were also applied independently of the 25-year wind condition, to ensure that no motions are damped out as a result of applied wind force.
Results indicate that safe mooring criteria are not exceeded for the tsunami condition, with or without the addition of a 25-year wind.

Westridge Marine Terminal - Berthing & Mooring Analysis | Trans Mountain Pipeline LP Revision 0 | April 27, 2017
Creative People, Practical Solutions.® Page 4
1. Introduction
1.1. Scope
As part of the Trans Mountain Expansion Project (TMEP), Trans Mountain Pipeline (TMP) intends to expand its existing Westridge Marine Terminal in Burnaby, British Columbia. The expansion includes the construction of three new jetty berths which are capable of accepting vessels ranging from barges to Aframax tankers. TMP has engaged Moffatt & Nichol (M&N) to perform the detailed engineering design of the terminal’s marine facilities, which includes:
• Crude oil loading jetties equipped to load crude tankers ranging in size from 17,000 DWT oil barges to 127,000 DWT Aframax tankers;
• Berthing and mooring structures for the tankers, complete with quick release mooring hooks and an automated mooring line load monitoring system;
• Access trestle, intermediate platforms and other structures providing access and support for pipelines and utilities from shore to the jetties;
• Utility berth to accommodate support tugs and spill response vessels; and,
• Bulkhead wall fill structure along existing shoreline
1.2. Purpose
This document describes the static and dynamic mooring analyses conducted for the range of design vessels in order to: 1) evaluate the loads on the mooring elements (mooring lines, mooring hooks, and fenders) and the vessel motions expected to occur due to conservative, yet plausible environmental conditions and; 2) make recommendations on the mooring arrangement and limiting environmental criteria to safely carry out operations according to industry standards.
1.3. Site Layout
Figure 1-1 shows an artist’s rendering of the proposed Westridge Terminal. The three new berths are numbered from west to east, with berths 1 and 2 in a back to back configuration, sharing three (3) outboard mooring dolphins fore and aft. Berth 3 represents the western most berth of the proposed expansion plan and has a mooring arrangement identical to that of Berth 2.
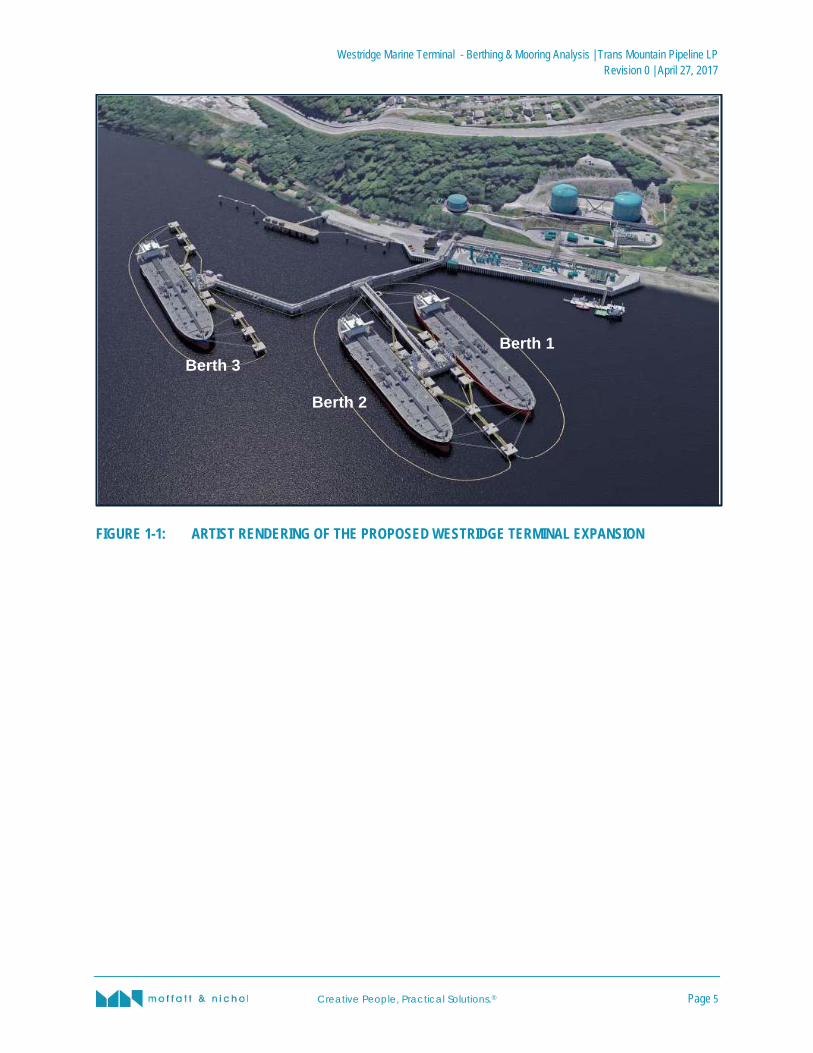
Westridge Marine Terminal - Berthing & Mooring Analysis | Trans Mountain Pipeline LP Revision 0 | April 27, 2017
Creative People, Practical Solutions.® Page 5
FIGURE 1-1: ARTIST RENDERING OF THE PROPOSED WESTRIDGE TERMINAL EXPANSION
Berth 1
Berth 2
Berth 3

Westridge Marine Terminal - Berthing & Mooring Analysis | Trans Mountain Pipeline LP Revision 0 | April 27, 2017
Creative People, Practical Solutions.® Page 6
2. Design Basis The following are the design basis assumptions for the mooring analyses.
2.1. Design Vessel Characteristics Table 2-1 presents a summary of the vessel types, classes, and anticipated cargo types which need to be accommodated by the marine facilities.
TABLE 2-1: BASIS OF DESIGN VESSELS
Vessel Class DWT Range Cargo Type
Aframax 80,000 - 120,000 Oil
Panamax 60,000 - 80,000 Oil
Handymax 40,000 - 50,000 Oil
Handysize < 40,000 Jet Fuel
Jet Fuel Barge 15,000 - 30,000
Jet Fuel
Oil Barge Oil
Table 2-2 presents a detailed summary of vessel characteristics for the design basis tankers and barges to be used for mooring analyses. These vessels are representative of the design range of tankers and barges. Where applicable, corrected deadweight and displacements are provided for the terminal’s draft limit of 13.5 m.
Although the limiting water depth at the terminal is 18 m (Chart Datum), the draft limit of 13.5 m is currently imposed by the Port of Vancouver at Second Narrows through which vessels calling at the Westridge Terminal must navigate. As such, the mooring and berthing analyses conducted basis fully laden drafts of the design vessels are considered to be conservative.

Westridge Marine Terminal - Berthing & Mooring Analysis | Trans Mountain Pipeline LP Revision 0 | April 27, 2017
Creative People, Practical Solutions.® Page 7
TABLE 2-2: DESIGN VESSEL CHARACTERISTICS
Vessel Oil Barge Crowley 650-6 Handysize Handymax Panamax Aframax
Cargo Type Oil Barge Jet Fuel Jet Fuel Jet Fuel / Oil Oil Oil
Berth 1,2,3 1 1 1,2,3 2&3 2&3
Deadweight Tonnage, DWT
Loaded Draft 15,242 27,456 16,775 50,000 70,297 117,654
Limited 13.5 m N/A N/A N/A N/A 66,036 97,799
Length Overall, LOA (m) 115.82 179 144.05 183.2 228 250
Length Between Perpendiculars, LBP (m) N/A 177.7 134 174 219 239
Beam (m) 23.16 22.56 23.3 32.2 32.23 44
Depth (m) 9.54 12.19 12.4 18.8 20.9 21
Draft Loaded (m) 7.82 9.24 8.7 11.9 13.82* 15.10*
Ballast (m) 1.65 4.95 6.21 7.18 9.9 7.13
Displacement
Loaded (mt) 17,583 33,558 21,977 54,915 84,204 136,337
Limited 13.5 m N/A N/A N/A N/A 82,060 120,276
Ballast (mt) 3,014 17,083 16,061 30,912 46,612 59,900
Side Windage Loaded (m2) 379 739 1,055 1,778 2,423 2,177
Ballast (m2) 1,011 1,485 1,390 2,595 3,177 4,169
Frontal Windage
Loaded (m2) 182 661 320 723 709 800
Ballast (m2) 325 756 378 875 776 1,152
Bow to Center Manifold (m) 61.29 89.6 74.81 91.6 113.72 124.2
Q88 Bow to Center Manifold (m) 61.8 - 69 91.88 112.78 125.79
Parallel Midbody Forward of Manifold (m) 34.4 89.02 34 42.84 65.79 69.68
Parallel Midbody Aft of Manifold (m) 34.4 89.02 38 39.76 57.59 48.44
Mooring Line Type Dyneema Dyneema PP/PE Euroflex Steel-Wire Steel-Wire
Mooring Line Minimum Breaking Load (mt) 74 82 38 62 79 83

Westridge Marine Terminal - Berthing & Mooring Analysis | Trans Mountain Pipeline LP Revision 0 | April 27, 2017
Creative People, Practical Solutions.® Page 8
Vessel Oil Barge Crowley 650-6 Handysize Handymax Panamax Aframax
Mooring Tail Type N/A N/A N/A Nylon Nylon Polyester
Mooring Tail Length (m) N/A N/A N/A 11 11 11
Tail Minimum Breaking Load (mt) N/A N/A N/A 80 120 116
*Denotes that Design Draft Values Exceed Existing Terminal Draft Limit of 13.5 m

Westridge Marine Terminal - Berthing & Mooring Analysis | Trans Mountain Pipeline LP Revision 0 | April 27, 2017
Creative People, Practical Solutions.® Page 9
2.2. General Arrangement of Marine Facilities The layout of the three marine berths (Figure 2-1) considers the following criteria: • Berth 1 is required to accommodate:
All vessels carrying jet fuel All vessels carrying oil up to Aframax tankers as design maximum
• Berths 2 and 3 will have the same general arrangement and are required to accommodate: All vessels carrying oil up to Aframax tankers as design maximum
Each berth will consist of a pile supported loading platform, four (4) breasting dolphins, and six (6) mooring dolphins whose function are to accommodate safe mooring and berthing of the design range of tankers and barges. Each Berth arrangement is identical in terms of number and placement of mooring structures. Berths 1 and 2 will share concrete caps for mooring dolphins.
FIGURE 2-1: KM TMEP MARINE FACILITIES ARRANGEMENT
Industry guidelines provided by the Oil Companies International Marine Forum (OCIMF) and the World Association for Waterborne Transport Infrastructure (PIANC) were utilized for optimal placement of mooring and berthing structures.
2.2.1. Parallel Midbody Analysis To determine the appropriate number and placement of breasting dolphins, a parallel mid-body analysis was conducted for the design range of tankers and barges.
The parallel mid-body is defined as the flat section of a vessel’s hull which can make parallel contact with the fender system. To determine optimal fender location, the distance of the parallel midbody is measured at the waterline at ballast draft, where the dimensions are least. Figure 2-2 presents the side profile of a representative Panamax tanker indicating the midbody curve, and how the dimensions are calculated at ballast draft. As the fender and fender panel are located above the waterline,
MD1
MD2
MD3
BD1
BD5
C1
C2
BD2
BD6
MD4
MD5
MD6
C13
C3
BD7
BD4
BD8
TP1
TR1
TP2
TR2
TP3
TR3
TP8
TR8
TP9
TR9
TR7TP7
TR6TP6
TP5
TP4
TS1
TS2
TS6
MD7
MD8
MD9
MD10
MD11
MD12
C19
C20
C27
C28
C21
BD9BD10
BD11BD12
LP1-2
C14
C15
C4
C5
C22
C23
LP3
UF1UF2
FP1
C6C7
C16C17
TS5
C18
C8
TS4
TS3
C9
C11
JP2
JP1
TP10
TR10
TP11
TR11
TP12
TR12
TS8
TS7
TS0
C24C25
C26
C10
C12

Westridge Marine Terminal - Berthing & Mooring Analysis | Trans Mountain Pipeline LP Revision 0 | April 27, 2017
Creative People, Practical Solutions.® Page 10
additional contact with the vessels parallel midbody is anticipated to be made over and above the dimensions provided at ballast draft.
FIGURE 2-2: SIDE PROFILE – PARALLEL MIDBODY CURVE ON PANAMAX TANKER1
The INTERTANKO (Q88) database was polled for the design range of tankers and barges to determine parallel midbody dimensions for as many vessels as possible. The result is approximately 3,200 vessels which have reported information for the design range of vessels. Confidence intervals were determined and presented in Table 2-3 and utilized to help determine breasting dolphin locations.
TABLE 2-3: PARALLEL MIDBODY CONFIDENCE INTERVALS Confidence Level 5% 25% 50% 75% 95%
Barge PBL FWD (Ballast) 31.4 42.3 50.5 56.7 65.8 PBL AFT (Ballast) 29.3 40.9 48.0 64.0 89.0
Handysize PBL FWD (Ballast) 23.5 31.9 40.0 45.0 56.5 PBL AFT (Ballast) 24.0 32.2 40.0 47.1 53.9
Handymax PBL FWD (Ballast) 33.1 38.6 43.0 44.5 50.6 PBL AFT (Ballast) 29.0 36.0 39.9 46.4 53.2
Panamax PBL FWD (Ballast) 46.2 62.1 67.1 69.1 70.9 PBL AFT (Ballast) 42.9 52.0 57.5 61.2 70.3
Aframax PBL FWD (Ballast) 50.7 59.1 61.8 67.2 73.0 PBL AFT (Ballast) 41.5 45.9 49.7 53.0 62.8
2.2.1. Breasting Dolphin Locations The functions of the breasting dolphins are to absorb the energy of the berthing vessels, resist breasting forces of a moored vessel, and to provide a foundation for the quick release mooring hooks which accommodate the vessels spring lines. 1 Diagram is for illustrative purposes only – not necessarily to scale

Westridge Marine Terminal - Berthing & Mooring Analysis | Trans Mountain Pipeline LP Revision 0 | April 27, 2017
Creative People, Practical Solutions.® Page 11
Each breasting dolphin will support an independent fender system, which will consist of a frontal frame against which the vessels make contact and, behind the frame, a flexible energy-absorbing rubber element to provide a cushion between the vessel and the dolphin. Fender selection is presented in Section 3.8.
Additionally, the Oil Companies International Marine Forum (OCIMF) Mooring Equipment Guidelines 3rd Edition recommends limiting vessel overhang to 1/3rd length overall (LOA) with respect to the outboard fenders. Meaning that no more than 1/3rd of the vessel’s overall length should extend past the last point of contact with the fender system. Overhang in excess of 1/3rd may potentially result in higher mooring line loads due to the increased moment arm pivot about the breasting dolphin. OCIMF finds that fender spacing on the order of 0.25-0.4 LOA is acceptable for berths considering a range of vessel lengths and types, as presented in Figure 2-3.
FIGURE 2-3: RECOMMENDED DOLPHIN SPACING (OCIMF MEG-3)
Figure 2-4 and Figure 2-5 present the general arrangement of berths 1-3 with dolphin dimensioning presented in meters. Figure 2-6 presents the arrangement of the loading platform for Berths 1 and 2. The layout of marine loading arms (MLA) is the same for Berth 3 as it is for Berth 2. The layout of the vapor line is to comply with tanker manifold configurations as specified by the OCIMF Recommendations for Oil Tanker Manifolds and Associated Equipment, as presented in Figure 2-7.
Breasting dolphin spacing accommodates the design range of tankers parallel midbody, with the exception of approximately 3% of tankers whose midbody does not make contact at ballast draft. These vessels are the lower 5% confidence intervals for the Handysize vessels. However, values reported by INTERTANKO are at ballast draft, at the waterline, and may in fact contact the fender system.
Figure 2-8 presents the breasting dolphin orientation, indicating the concrete cap to be +5.3 m Geodetic Datum (GD).

Westridge Marine Terminal - Berthing & Mooring Analysis | Trans Mountain Pipeline LP Revision 0 | April 27, 2017
Creative People, Practical Solutions.® Page 12
FIGURE 2-4: GENERAL ARRANGEMENT OF BERTHS 1&2 (ALL DIMENSIONS IN METERS)
FIGURE 2-5: GENERAL ARRANGEMENT OF BERTH 3 (ALL DIMENSIONS IN METERS)

Westridge Marine Terminal - Berthing & Mooring Analysis | Trans Mountain Pipeline LP Revision 0 | April 27, 2017
Creative People, Practical Solutions.® Page 13
FIGURE 2-6: GENERAL ARRANGEMENT OF LOADING PLATFORMS (TOP: BERTH 2; BOTTOM: BERTH 1)

Westridge Marine Terminal - Berthing & Mooring Analysis | Trans Mountain Pipeline LP Revision 0 | April 27, 2017
Creative People, Practical Solutions.® Page 14
FIGURE 2-7: GENERAL ARRANGEMENT OF TANKER MANIFOLDS (OCIMF - 1991)
FIGURE 2-8: BREASTING DOLPHIN ELEVATION
2.2.2. Mooring Dolphins The function of the mooring dolphins is to secure the vessels fore and aft mooring lines. All mooring dolphins have a deck elevation of +5.3 m GD and are equipped with quick release mooring hook (QRH) assemblies with remote release, load sensing and an electric reversing capstan. Mooring dolphin (MD) 6, which is shared by Berths 1 and 2, as well as MD 12, located on Berth 3, are equipped

Westridge Marine Terminal - Berthing & Mooring Analysis | Trans Mountain Pipeline LP Revision 0 | April 27, 2017
Creative People, Practical Solutions.® Page 15
with quadruple QRHs. All remaining mooring dolphins are equipped with triple QRHs; all quick release hooks have a safe working load rating of 100 mt (each hook).
The number and placement of mooring dolphins is designed to accommodate the full design range of tankers and barges. As presented in Figure 2-3, OCIMF recommends that breasting lines remain as perpendicular as possible to increase efficiency for resisting loads which act to push the vessel off the berth.
When accommodating a large range of tankers and barges, whose characteristics can vary significantly, it may not be possible to have OCIMF recommended horizontal line angles which are 15 or less under all loading conditions; however, mooring arrangements still satisfy OCIMF maximum line tension and operating metocean criteria. The results of the mooring analyses, presented in this report, properly assess the functionality of the mooring structures placement.
2.3. Metocean Criteria Two series of meteorological and oceanographic (metocean) criteria were utilized for the mooring analyses. First, criteria recommended by OCIMF Mooring Equipment Guidelines, 3rd edition were applied statically. These criteria serve to validate a vessels’ mooring equipment established for worldwide trade. Secondly, dynamic, time-varying environmental conditions which are representative of operational conditions at the project location are applied. These dynamic criteria provide insight to vessel response under operational conditions.
2.3.1. OCIMF Criteria OCIMF states that for tankers above 16,000 DWT, intended for worldwide trade, the mooring system should be capable of withstanding the following environmental conditions:
60 knots constant wind from any direction simultaneously with either: • 3-knot current at 0 deg or 180 deg; • 2-knot current at 10 deg or 170 deg; and, • 0.75 knots current from the direction of maximum beam current loading.
Wind velocity is the velocity measured at the standard datum height of 10 m above ground and is representative of a 30 second average mean velocity. Current direction is direction traveling to and relative to the bow of the vessel.
2.3.2. Water Depth According to a hydrographic survey conducted by Golder Associates in 2014, water depths over the footprint of the proposed expansion range from 18 to 21 m with respect to Chart Datum (CD). For mooring analyses purposes, the water depth at all three berths is assumed to be 18 m (CD).
2.3.3. Water Levels Water levels at the project site are dominated by a semi-diurnal mixed tide, characterized by two unequal high and low waters in a day. Table 2-4 provides tidal datums at multiple sites in the vicinity

Westridge Marine Terminal - Berthing & Mooring Analysis | Trans Mountain Pipeline LP Revision 0 | April 27, 2017
Creative People, Practical Solutions.® Page 16
of the Westridge Terminal from the Canadian Hydrographic Survey (CHS). An additional 0.5 m above the high tide line is included in the analysis of water levels to account for future sea level rise.
TABLE 2-4: CHARACTERISTIC TIDAL DATUMS IN THE SITE VICINITY
Datum Vancouver Tide Table
Vancouver CHS Chart
#3494 Port Moody Tide Table
Deep Cove CHS Chart
#3494
EHHW (m, CD) 5.60 - - - HHWLT (m, CD) 5.00 5.00 5.12 5.10 HHWMT (m, CD) 4.40 4.40 4.46 4.40
MWL (m, CD) 3.10 3.10 3.08 3.10 Chart Datum (m, CD) 0.00 0.00 0.00 1.00
LLWMT (m, CD) 1.10 1.10 1.07 1.10 LLWLT (m, CD) -0.10 0.00 -0.10 0.20 ELLW (m, CD) -0.30 - - -
EHHW: Extreme Highest High Water HHWLT: Higher High Water Large Tide HHWMT: Higher High Water Mean Tide MWL: Mean Water Level CD: the plane of Lowest Normal Tides to which charts and water levels are referred LLWMT: Lower Low Water Mean Tide LLWLT: Lower Low Water Large Tide ELLW: Extreme Lowest Low Water For the Vancouver Harbour area, Geodetic Datum is 3.1 m above CD (see BC Ministry of Env., 1995)
In addition, Figure 2-9 presents the water level exceedance curve corresponding to the water levels measured at Station 7735 Vancouver, BC. The record extends from November 1909 to February, 2017 with a sample of one hour.

Westridge Marine Terminal - Berthing & Mooring Analysis | Trans Mountain Pipeline LP Revision 0 | April 27, 2017
Creative People, Practical Solutions.® Page 17
FIGURE 2-9: WATER LEVEL EXCEEDANCE CURVE AT STATION 7735 VANCOUVER
2.3.4. Winds Winds at the terminal were measured from February 8, 2013 to February 28, 2014. As shown in the annual wind rose in Figure 2-10, winds primarily blow from the NE at speeds lower than 10 knots, followed by winds from the W of similar range. During the winter, winds from the NE prevail and are associated with outflows from the Indian Arm. During the summer, winds from the W increase in frequency and magnitude, and are associated with onshore sea breezes. The highest wind speed recorded during the period of measurements was 17.2 m/s (33.4 knots).

Westridge Marine Terminal - Berthing & Mooring Analysis | Trans Mountain Pipeline LP Revision 0 | April 27, 2017
Creative People, Practical Solutions.® Page 18
FIGURE 2-10: ANNUAL WIND ROSE DEVELOPED FROM MEASUREMENTS AT THE SITE

Westridge Marine Terminal - Berthing & Mooring Analysis | Trans Mountain Pipeline LP Revision 0 | April 27, 2017
Creative People, Practical Solutions.® Page 19
Extreme wind speeds cannot be accurately predicted with one year of measurements. In the site vicinity, the Vancouver International Airport has the longest hourly record of measured wind speeds. The record extends from 1953 to present (March 2017).
Comparison of wind speeds for the overlapping period indicates that extreme winds at the site are approximately 25% lower than at the Vancouver International Airport. Thus, extreme wind speeds calculated from the historical record at the airport were reduced by 25% as a means to estimate extremes at the site. The resulting extremes are shown in Table 2-5. These values are slightly different than those presented in the Metocean Study Report (M&N, 2014a) because more years have been included in the present analysis.
TABLE 2-5: EXTREME WIND SPEEDS AT WESTRIDGE TERMINAL
Return Period (years)
Wind Speed (2-min, 10 m height), knots
5% non-Exceedance Best Fit 95% non-Exceedance
1 25.5 26.3 27.0 2 28.6 29.4 30.1 5 30.9 32.0 33.2 10 32.2 34.1 35.9 25 34.0 36.8 39.5 50 35.3 38.8 42.3
100 36.6 40.8 45.1 200 37.8 42.8 47.9 500 39.5 45.5 51.5
The 60-knot, 30-second wind speed outlined in the OCIMF guidelines corresponds to a 2-minute wind speed of 52.9 knots. According to Table 2-5, this wind speed has a return period beyond 500 years; therefore, use of this wind speed for static analysis of the mooring system is conservative.
For dynamic mooring analyses, a 40 knot omni-directional wind speed is applied, as a typical limiting wind speed for vessels to remain at berth, disconnected from loading equipment. This corresponds approximately to the 100-year wind speed of 40.8 knots. In the event safe mooring criteria are exceeded, maximum allowable wind speeds are reduced.
2.3.5. Current Measurements of current velocities at the site were made using an Acoustic Doppler Current Profiler (ADCP) for a 2-month period in April and May of 2013. The maximum current speed recorded along the water column was 0.64 m/s (1.2 knots) and the maximum depth-averaged current was 0.47 m/s (0.9 knots).

Westridge Marine Terminal - Berthing & Mooring Analysis | Trans Mountain Pipeline LP Revision 0 | April 27, 2017
Creative People, Practical Solutions.® Page 20
Depth-averaged currents at each berth were estimated from a 2-dimensional Mike 21 hydrodynamic model of Burrard Inlet. The Metocean Study Report (M&N, 2014a) describes in detail the model development and the results at the site.
Figure 2-11 presents the peak ebb currents as a result of the largest predicated tidal variation; Table 2-6 presents a summary of peak currents and directions. The OCIMF currents of 3 and 2 knots are conservative in comparison to the measured and model-predicted currents.
FIGURE 2-11: PEAK EBB (DEPTH-AVERAGED) CURRENTS
TABLE 2-6: PEAK DEPTH-AVERAGED CURRENT FROM HYDRODYNAMIC MODEL
Location
Ebb Flood
Current Speed Direction Current Speed Direction
m/s knot (°N) m/s knot (°N) Berth 3 0.51 1.0 277.0 0.40 0.77 80.9 Berth 2 0.46 0.89 268.2 0.39 0.75 71.7 Berth 1 0.45 0.87 269.8 0.38 0.73 67.4
Utility Dock 0.54 1.05 278.7 0.45 0.87 74.0
2.3.6. Waves Burrard Inlet is well sheltered from the long period waves characteristic of the Pacific Ocean. Waves at the site are generated by the local winds blowing over the limited fetch. M&N developed a Mike 21 wave model to assess wind-generated waves (M&N, 2014a). A number of wind speeds were evaluated, ranging from the 10th percentile to the estimated 100-year return period. The wind directions that were evaluated were the NE (35 °N) and W (270 °N) which provide the longest fetch.

Westridge Marine Terminal - Berthing & Mooring Analysis | Trans Mountain Pipeline LP Revision 0 | April 27, 2017
Creative People, Practical Solutions.® Page 21
The 100-year wave will be used for dynamic mooring analyses. The model results show that winds blowing from the NE generate a greater wave height compared to westerly winds. The parameters of the 100-year wave are: significant wave height, Hs = 0.6 m; peak wave period, Tp = 2.6 s, and mean wave direction, MWD = 35 °N.
2.3.7. Tsunami M&N conducted a tsunami assessment of the Westridge Terminal as part of the TMEP (M&N, 2015). The study evaluated the impact of several hypothetical landslide-generated tsunamis in the Indian Arm and Burrard Inlet using a MIKE 21, two-dimensional hydrodynamic model. Time series of depth-averaged current velocities at the berths for each modeled landslide are available from this study. The highest depth-averaged current at the berths from all the tsunami scenarios was 1.86 knots, which is less than the 3-knot current considered in Section 2.3.1.
2.3.8. Selected Metocean Criteria Static and dynamic mooring analyses will be conducted to determine the suitability of the mooring system. The metocean criteria that will be used for each analysis is presented in Table 2-7. The peak wave period of the wave used in the dynamic analysis was increased from 2.6 sec to 3.0 sec as this is the minimum peak wave period accepted by the program.

Westridge Marine Terminal - Berthing & Mooring Analysis | Trans Mountain Pipeline LP Revision 0 | April 27, 2017
Creative People, Practical Solutions.® Page 22
TABLE 2-7: METOCEAN CRITERIA FOR MOORING ANALYSES
Parameter Static Analysis Dynamic Analysis
Depth 18 m (CD) 18 m (CD)
Water Level
Vancouver Tides: 1) 6.1 m (CD) (HHWLT + SLR) 2) -0.1 m (CD) (LLWLT)
Vancouver Tides: 1) 6.1 m (CD) (HHWLT + SLR) 2) -0.1 m (CD) (LLWLT)
Winds
OCIMF Criteria: • Speed: 60 knot (30-sec duration) • Direction: Full compass
Analysis of Local Winds: • Speed: 40 knot (2-min duration) • Direction: Full compass • 100-year return period
Currents
OCIMF Criteria: 1) 3-knot at 0°or 180° 2) 2-knot at 10° or 170° 3) 0.75 knots from the direction of
maximum beam current loading
Mike 21 Model Results: • Speed: 1.0 knot • Direction: Parallel to berth (ebb and
flood)
Waves NA
Mike 21 Model Results: • Sign. wave height, Hs = 0.6 m • Peak wave period, Tp = 3.0 s • Mean wave dir., MWD = 35 °N • 100-year return period
Tsunami NA
Mike 21 Model Results: • Maximum calculated currents
corresponding to Landslide 1 • Concurrent 25-year wind (36.8
knots)

Westridge Marine Terminal - Berthing & Mooring Analysis | Trans Mountain Pipeline LP Revision 0 | April 27, 2017
Creative People, Practical Solutions.® Page 23
3. Berthing Analysis This section of the report presents the berthing analysis and selection of fenders. All three berths will be capable of handling Aframax class tankers as well as barges. The berthing structure layouts are similar with four breasting dolphins. This implies that the dominant berthing impact load and selected fender for one berth, determines the design condition for all three berths.
Vessels berthing and unberthing will be tug-assisted. A fast-time simulation performed by LANTEC Marine Incorporated determined that each berth has adequate space for assist tugs to work effectively and adequate maneuvering space for the ship itself.
3.1. Berthing Energy Requirements The primary function of the fender is to absorb the berthing energy from the berthing vessel. Fender design method starts with estimating berthing energy for some appropriate design cases and selecting fender types. The method outlined in the World Association for Waterborne Transport Infrastructure (PIANC) Guidelines for the design of Fender Systems: 2002 (PIANC, 2002) is widely used and has been applied for this analysis. A brief description of the method is given.
Berthing impact kinetic energy is:
absmeDb CCCCMVE 221
= (1)
E = berthing impact energy (N-m) Vb = berthing velocity normal to berth (m/s) MD = vessel mass, displacement tonnage (tonnes) Ce = eccentricity coefficient Cm = added mass coefficient Cs = softness coefficient Cc = berth configuration coefficient Cab = abnormal impact coefficient or factor of safety
The appropriate factors to be used in the kinetic energy method have been selected as per PIANC guidelines and fender manufacturer design aids.
3.2. Berthing Velocity The berthing velocity is assumed to be 0.15 m/s for tankers and 0.25 m/s for barges. This is determined using the design approach velocities as recommended by Brolsma et.al. in 1977 shown in Figure 4.2.1 in PIANC (2002). As shown in the figure, the design berthing velocity is a function of navigation conditions and size of vessel. For the project site, the berthing velocities of vessels are based on tug-assisted berthing, easy berthing conditions in exposed water (category c). A vessel docking information system will provide real-time data on vessel approach speed, distance off, and angles of approach to assist vessel pilots in maintaining appropriate docking speeds.
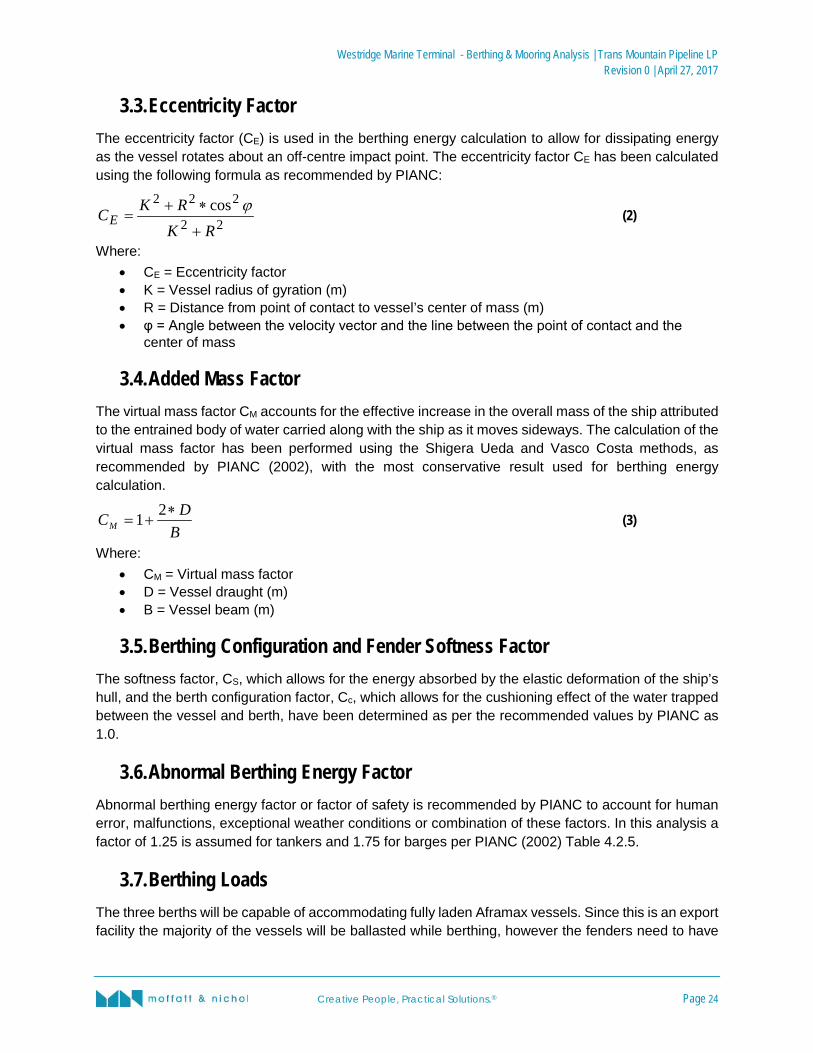
Westridge Marine Terminal - Berthing & Mooring Analysis | Trans Mountain Pipeline LP Revision 0 | April 27, 2017
Creative People, Practical Solutions.® Page 24
3.3. Eccentricity Factor The eccentricity factor (CE) is used in the berthing energy calculation to allow for dissipating energy as the vessel rotates about an off-centre impact point. The eccentricity factor CE has been calculated using the following formula as recommended by PIANC:
22
222 cosRK
RKCE+
∗+=
ϕ (2)
Where: • CE = Eccentricity factor • K = Vessel radius of gyration (m) • R = Distance from point of contact to vessel’s center of mass (m) • φ = Angle between the velocity vector and the line between the point of contact and the
center of mass
3.4. Added Mass Factor The virtual mass factor CM accounts for the effective increase in the overall mass of the ship attributed to the entrained body of water carried along with the ship as it moves sideways. The calculation of the virtual mass factor has been performed using the Shigera Ueda and Vasco Costa methods, as recommended by PIANC (2002), with the most conservative result used for berthing energy calculation.
BDCM
∗+=
21 (3)
Where: • CM = Virtual mass factor • D = Vessel draught (m) • B = Vessel beam (m)
3.5. Berthing Configuration and Fender Softness Factor The softness factor, CS, which allows for the energy absorbed by the elastic deformation of the ship’s hull, and the berth configuration factor, Cc, which allows for the cushioning effect of the water trapped between the vessel and berth, have been determined as per the recommended values by PIANC as 1.0.
3.6. Abnormal Berthing Energy Factor Abnormal berthing energy factor or factor of safety is recommended by PIANC to account for human error, malfunctions, exceptional weather conditions or combination of these factors. In this analysis a factor of 1.25 is assumed for tankers and 1.75 for barges per PIANC (2002) Table 4.2.5.
3.7. Berthing Loads The three berths will be capable of accommodating fully laden Aframax vessels. Since this is an export facility the majority of the vessels will be ballasted while berthing, however the fenders need to have

Westridge Marine Terminal - Berthing & Mooring Analysis | Trans Mountain Pipeline LP Revision 0 | April 27, 2017
Creative People, Practical Solutions.® Page 25
the capacity to accommodate both laden and ballasted vessels in the rare event that a laden vessel needs to return to the berth.
The berthing energy is calculated from Equation (1). Table 3-1 shows the berthing energies of the different design vessels. The berthing analysis shows that the berthing impact from a laden Aframax vessel governs the fender selection and design. Assuming that the breasting dolphin structure is exceptionally rigid absorbing no energy, the required energy absorption capacity of the fender is 2,700 kN-m.
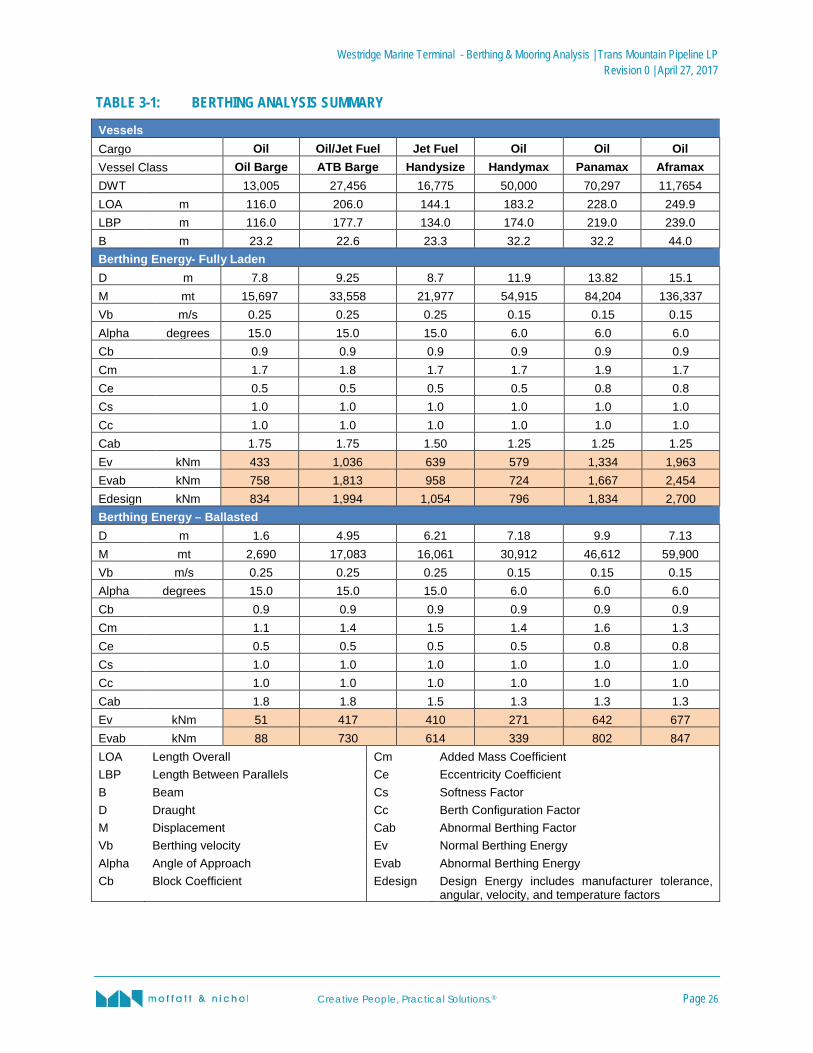
Westridge Marine Terminal - Berthing & Mooring Analysis | Trans Mountain Pipeline LP Revision 0 | April 27, 2017
Creative People, Practical Solutions.® Page 26
TABLE 3-1: BERTHING ANALYSIS SUMMARY
Vessels Cargo Oil Oil/Jet Fuel Jet Fuel Oil Oil Oil Vessel Class Oil Barge ATB Barge Handysize Handymax Panamax Aframax DWT 13,005 27,456 16,775 50,000 70,297 11,7654 LOA m 116.0 206.0 144.1 183.2 228.0 249.9 LBP m 116.0 177.7 134.0 174.0 219.0 239.0 B m 23.2 22.6 23.3 32.2 32.2 44.0 Berthing Energy- Fully Laden D m 7.8 9.25 8.7 11.9 13.82 15.1 M mt 15,697 33,558 21,977 54,915 84,204 136,337 Vb m/s 0.25 0.25 0.25 0.15 0.15 0.15 Alpha degrees 15.0 15.0 15.0 6.0 6.0 6.0 Cb 0.9 0.9 0.9 0.9 0.9 0.9 Cm 1.7 1.8 1.7 1.7 1.9 1.7 Ce 0.5 0.5 0.5 0.5 0.8 0.8 Cs 1.0 1.0 1.0 1.0 1.0 1.0 Cc 1.0 1.0 1.0 1.0 1.0 1.0 Cab 1.75 1.75 1.50 1.25 1.25 1.25 Ev kNm 433 1,036 639 579 1,334 1,963 Evab kNm 758 1,813 958 724 1,667 2,454 Edesign kNm 834 1,994 1,054 796 1,834 2,700 Berthing Energy – Ballasted D m 1.6 4.95 6.21 7.18 9.9 7.13 M mt 2,690 17,083 16,061 30,912 46,612 59,900 Vb m/s 0.25 0.25 0.25 0.15 0.15 0.15 Alpha degrees 15.0 15.0 15.0 6.0 6.0 6.0 Cb 0.9 0.9 0.9 0.9 0.9 0.9 Cm 1.1 1.4 1.5 1.4 1.6 1.3 Ce 0.5 0.5 0.5 0.5 0.8 0.8 Cs 1.0 1.0 1.0 1.0 1.0 1.0 Cc 1.0 1.0 1.0 1.0 1.0 1.0 Cab 1.8 1.8 1.5 1.3 1.3 1.3 Ev kNm 51 417 410 271 642 677 Evab kNm 88 730 614 339 802 847 LOA Length Overall Cm Added Mass Coefficient LBP Length Between Parallels Ce Eccentricity Coefficient B Beam Cs Softness Factor D Draught Cc Berth Configuration Factor M Displacement Cab Abnormal Berthing Factor Vb Berthing velocity Ev Normal Berthing Energy Alpha Angle of Approach Evab Abnormal Berthing Energy Cb Block Coefficient Edesign Design Energy includes manufacturer tolerance,
angular, velocity, and temperature factors

Westridge Marine Terminal - Berthing & Mooring Analysis | Trans Mountain Pipeline LP Revision 0 | April 27, 2017
Creative People, Practical Solutions.® Page 27
3.8. Fender Selection All breasting dolphins, for all three berths, are equipped with a single fender and fender panel. Trelleborg marine super cone fenders 2000 F1.0 CV are selected for the purposes of mooring analyses. The fender element has a rated reaction of 2,511 kN (256 mt) and an energy absorption of 3,000 kN-m (306 mt-m). Therefore, it is adequate for the range of design berthing energies presented in Table 3-1.
The super cone fenders supersede the previously proposed Trelleborg marine cone fenders MCN 2000 G1.2 per the project memorandum to TMP “Berthing Analysis and Fender Selection” (M&N, 2014b).
Figure 3-1 presents the generic super cone fender performance curve.
FIGURE 3-1: GENERALIZED PERFORMANCE CURVE OF TRELLEBORG SUPER CONE FENDER
Each fender system consists of one cone fender centered at elevation +0.85 m (GD). To accommodate barges at varying elevations of water level, it is recommended the fender panel be incorporated with mooring posts which flank the fender panel. For mooring analyses, it is assumed that mooring posts on each side of the fender panel are available with a load rating up to 100 mt.
Figure 3-2 present examples of the recommended fender panel with flanking mooring posts.

Westridge Marine Terminal - Berthing & Mooring Analysis | Trans Mountain Pipeline LP Revision 0 | April 27, 2017
Creative People, Practical Solutions.® Page 28
FIGURE 3-2: PHOTOGRAPH OF EXAMPLE FENDER PANEL WITH 100 MT CAPACITY FENDER POSTS
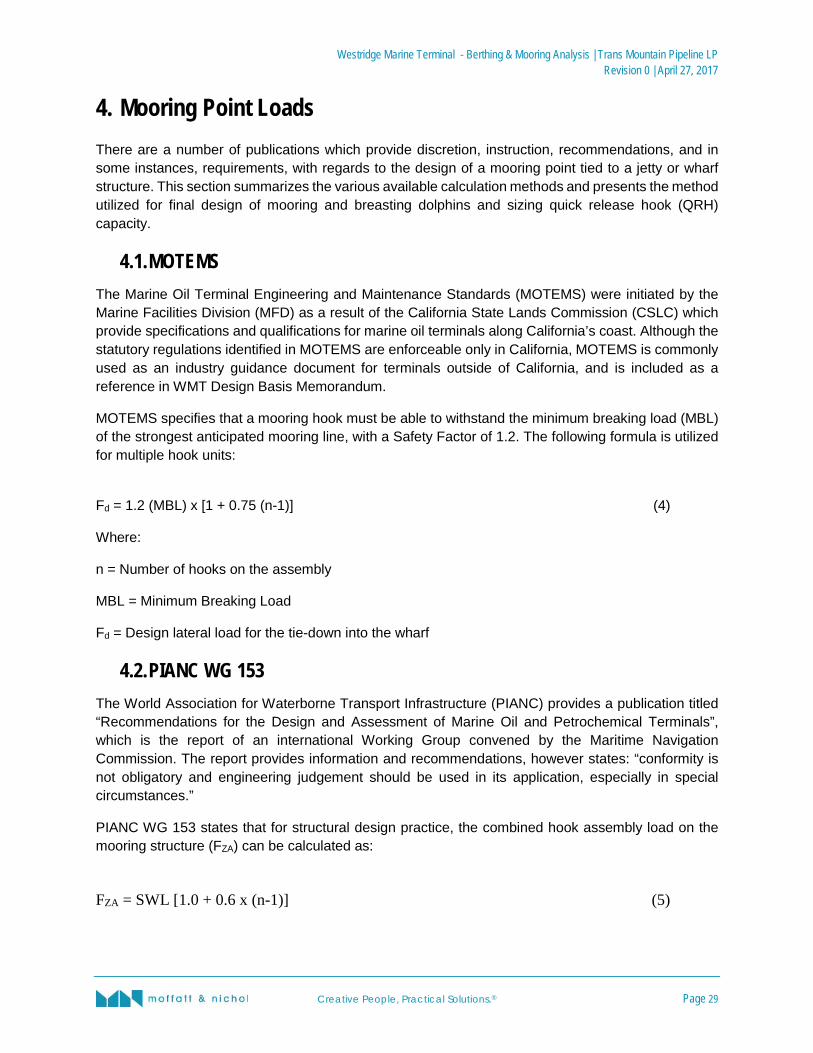
Westridge Marine Terminal - Berthing & Mooring Analysis | Trans Mountain Pipeline LP Revision 0 | April 27, 2017
Creative People, Practical Solutions.® Page 29
4. Mooring Point Loads There are a number of publications which provide discretion, instruction, recommendations, and in some instances, requirements, with regards to the design of a mooring point tied to a jetty or wharf structure. This section summarizes the various available calculation methods and presents the method utilized for final design of mooring and breasting dolphins and sizing quick release hook (QRH) capacity.
4.1. MOTEMS The Marine Oil Terminal Engineering and Maintenance Standards (MOTEMS) were initiated by the Marine Facilities Division (MFD) as a result of the California State Lands Commission (CSLC) which provide specifications and qualifications for marine oil terminals along California’s coast. Although the statutory regulations identified in MOTEMS are enforceable only in California, MOTEMS is commonly used as an industry guidance document for terminals outside of California, and is included as a reference in WMT Design Basis Memorandum.
MOTEMS specifies that a mooring hook must be able to withstand the minimum breaking load (MBL) of the strongest anticipated mooring line, with a Safety Factor of 1.2. The following formula is utilized for multiple hook units:
Fd = 1.2 (MBL) x [1 + 0.75 (n-1)] (4)
Where:
n = Number of hooks on the assembly
MBL = Minimum Breaking Load
Fd = Design lateral load for the tie-down into the wharf
4.2. PIANC WG 153 The World Association for Waterborne Transport Infrastructure (PIANC) provides a publication titled “Recommendations for the Design and Assessment of Marine Oil and Petrochemical Terminals”, which is the report of an international Working Group convened by the Maritime Navigation Commission. The report provides information and recommendations, however states: “conformity is not obligatory and engineering judgement should be used in its application, especially in special circumstances.”
PIANC WG 153 states that for structural design practice, the combined hook assembly load on the mooring structure (FZA) can be calculated as:
FZA = SWL [1.0 + 0.6 x (n-1)] (5)

Westridge Marine Terminal - Berthing & Mooring Analysis | Trans Mountain Pipeline LP Revision 0 | April 27, 2017
Creative People, Practical Solutions.® Page 30
Where:
FZA = Design load for hook anchorage and supporting structure
SWL = Safe Working Load of the hook assembly, based on highest anticipated MBL of the design range of vessels.
n = Number of hooks in the assembly
For the case of n = 1, a factor of 1.18 is recommended
The load formula above is based on a failure sequence as follows: • Ships winch brakes are set so that the holding capacity, beyond which it renders, equals 0.6 x the
rated capacity of the ships mooring lines; • The rated capacity of the mooring line is its minimum breaking load; • The factor of 0.6 x MBL is based on the OCIMF recommendation for winch rated brake holding
load; • In the event of accidental overload of the mooring system, winches will render before exceeding
the SWL of any individual hook; • For the case of n = 1, the hook should be designed to sustain a load of 1.18 times the hook SWL,
because the mooring fittings are designed for a safety margin against a yield of 1.18 per Oil Companies International Marine Forum (OCIMF) Mooring Equipment Guidelines.
4.3. British Standard (European Union) The British Standard BS 6349 1-2 provides guidance on the planning, design, construction and maintenance of maritime structures and which are in line with Eurocodes, which are European standards for specifying structural design within the European Union. Eurocodes are mandatory for the specification of European public works which recently replaced national building codes. Eurocodes, however, are not implicitly required on private sector projects.
Table 4-2 presents guidance provided by British Standard for the design of mooring points.

Westridge Marine Terminal - Berthing & Mooring Analysis | Trans Mountain Pipeline LP Revision 0 | April 27, 2017
Creative People, Practical Solutions.® Page 31
TABLE 4-1: BS6349: 1-2 “TABLE H”
Number of Mooring Hooks per Mooring Point (N)
Total Accidental Mooring Point Load as Multiple of the Factored Rated Hook SWL (or factored rated MBL of vessel's mooring line, where appropriate)
Scenario for Derivation of Total Mooring Point Load from Mooring Line MBL
2 1.8 x 1.18 = 2.1 1 x 0.8 +1 x MBL = line on one mooring hook at MBL and the other at ship's winch design brake holding load
3 2.4 x 1.18 = 2.8 3 x 0.8 x MBL = lines on each hook at ship's winch design brake holding load
4 3.0 x 1.18 = 3.5
3 x 0.8 x MBL + 1 x 0.6 x MBL = 3 x MBL lines on each hook at ship's winch design brake holding load, one line at ship's winch brake setting
4.4. Determining Largest Mooring Line To determine the appropriate minimum breaking load which services all methods of mooring point calculation, INTERTANKO (Q88) registry was queried for information regarding mooring line minimum breaking load for any/ all vessels which were labelled, “Aframax”, and “Panamax”. It is assumed that barges and smaller vessels will have lesser mooring line capacity.
Table 4-2 and Table 4-3 present confidence banding for mooring line strength for the Aframax and Panamax tankers, respectively. The largest MBL at the 95% confidence banding and is 93 metric tons.
Therefore, a QRH with a minimum capacity of 100 metric tons will satisfy the design range of tankers and barges.
TABLE 4-2: AFRAMAX CONFIDENCE BANDING
Confidence Level 5% 25% 50% 75% 95% Cubic Capacity 98% 112,092 117,926 120,330 126,526 128,011 Ropes Forecastle (BS) 0.00 0.00 0.00 69.00 87.00 Wires Forecastle (BS) 64.00 74.00 81.00 85.00 93.00
TABLE 4-3: PANAMAX CONFIDENCE BANDING
Confidence Level 5% 25% 50% 75% 95% Cubic Capacity 98% 37,426 79,649 83,613 84,314 86,652 Ropes Forecastle (BS) 0.00 0.00 63.00 72.00 87.00 Wires Forecastle (BS) 0.00 57.00 67.00 76.00 93.00

Westridge Marine Terminal - Berthing & Mooring Analysis | Trans Mountain Pipeline LP Revision 0 | April 27, 2017
Creative People, Practical Solutions.® Page 32
4.5. Method Selection Table 4-1 presents a comparison summary of mooring point loads for a representative quadruple quick release hook. The PIANC recommended formulae are utilized for structural design, with the underlying design premise that each successive element of the mooring system from the ship’s winch to the shore mooring structure should be designed to be progressively stronger. In the event of overload, this is intended to result in an inherent “fail safe” design where the mooring line would render out before the mooring line parts, before the mooring hook fails, and before the stability of the whole mooring structure is compromised. The PIANC load formula is based on a failure sequence which follows: • Ships winch brakes are set so that the holding capacity, beyond which it renders, equals 60% of
the rated capacity of the ships mooring lines; • The rated capacity of the mooring line is its minimum breaking load; • The factor of 0.6 x MBL is based on the OCIMF recommendation for winch rated brake holding
load. • In the event of accidental overload of the mooring system, winches will render before exceeding
the SWL of any individual hook;

Westridge Marine Terminal - Berthing & Mooring Analysis | Trans Mountain Pipeline LP Revision 0 | April 27, 2017
Creative People, Practical Solutions.® Page 33
5. Mooring Analysis Methodology All mooring analyses are performed at the following conditions: • Ballast Draft at Extreme Highest High Water and Sea Level Rise: +3.0 m GD: This criterion
ensures vertical line angles are the largest and least efficient; additionally, the ballast draft of the vessel has the largest windage area for the wind force to be imposed.
• Loaded Draft at Lower Low Water (Large Tide): -3.0 m GD: This criterion ensures the least amount of underkeel clearance which amplifies current force acting on the loaded draft vessel.
5.1. Static Mooring Model Software – OPTIMOOR All OCIMF recommended criteria for mooring analyses are carried out using the static mooring program OPTIMOOR v.5.6.1, developed by Tension Technology International.
OPTIMOOR is a static mooring analysis program used widely in both industrial marine and naval mooring analyses. The program allows users to input vessel particulars, pier descriptions, and mooring arrangements. The environmental conditions can be applied at various speeds from any direction. The resultant wind force on the vessel is provided by the program and distributed to the mooring lines. The lines are modeled with the elasticity of actual mooring line.
5.2. Dynamic Mooring Model Software – aNyMoor All operational metocean criteria for mooring analyses are carried out using the dynamic program aNyMoor-Termsim, developed by the Maritime Research Institute Netherlands (MARIN). The program is a time domain mooring software used to simulate the dynamic characteristics of mooring systems undergoing environmental forcing. The calculation methods are derived from the evolution of TERMSIM II (developed by MARIN), which was developed and verified through extensive model testing and is well accepted for industry use.
All metocean conditions examined use a simulation time of 3 hours (10,800 seconds) per wind direction that varied by 15 degree increments and include the API gusting spectrum. The program will not establish second order drift forces for waves whose peak period is less than three (3) seconds; therefore, all waves listed in Table 2-7 will have an increased peak wave period of at least three seconds.
5.3. Limiting Mooring Criteria The following are criteria which establish industry guidelines for safe mooring conditions.
5.3.1. Mooring Line Tension Limits The allowable safe working load (SWL) in the mooring lines was set at 55% of the minimum breaking load (MBL) per recommendations provided by OCIMF for steel wire mooring lines.
For synthetic mooring lines, OCIMF recommends a safe working load equal to 50% of the MBL.

Westridge Marine Terminal - Berthing & Mooring Analysis | Trans Mountain Pipeline LP Revision 0 | April 27, 2017
Creative People, Practical Solutions.® Page 34
5.3.2. Fender Loads The allowable working load in the fenders was the rated reaction at design performance for the representative fender design which is 256 mt.
5.3.3. Motions PIANC “Criteria for Movements of Moored Ships in Harbours” recommends ±3.0m (peak to peak) for surge and ±3.0 m (zero to peak) for sway. Values recommended by PIANC guidelines are conservative given the capabilities of modern marine loading arms, however serve as the primary limit for operational criteria.
5.4. Mooring Line Arrangements Figure 5-1 through Figure 5-8 present the mooring line arrangements for the design range of vessels at Berth 1. All vessels at Berth 1 shall be moored starboard side to, while all vessels at Berths 2 & 3 shall be moored portside to. In all mooring scenarios, the preferred method of mooring allows the bow of the vessel to be pointed towards the channel to allow for emergency departure; and allows the stern of the vessel to maximize use of the quadruple quick release mooring hooks. As the layout of the mooring and breasting dolphins are symmetrical for vessels moored starboard side-to at Berth 1 and port-side-to at Berth 2; mooring analyses are conducted for vessels positioned at Berth 1, and are considered representative for all berths.
5.4.1. Aframax Tanker Figure 5-1 presents the conventional mooring arrangement for the Aframax tanker; which deploys sixteen (16) mooring lines, and contacts all four (4) breasting dolphins. Due to the placement of onboard mooring winches, four (4) stern mooring lines are required to be sent to the aft-most mooring dolphin, equipped with the quadruple QRH.
Figure 5-2 presents the mooring line arrangement for the Aframax tanker at Lower Low Water-Large Tide (LLWLT). During extreme low water conditions, the tankers deck level, where winch mounted mooring lines are deployed, will be below the elevation of the QRH located on the interior breasting dolphins. As presented in Section 2.3.3, the LLWLT condition is exceeded only 1% of the time. Conditions where the tankers deck is lower than the top of dolphin is exceeded approximately 9% of the time. As a result, at low water, it may not be feasible to deploy the two aft spring lines (ML-9 and ML-10 as presented in Figure 5-1). Therefore an alternate mooring arrangement is provided, and the Aframax tanker is able to deploy fourteen (14) mooring lines, and contacts all four (4) breasting dolphins.

Westridge Marine Terminal - Berthing & Mooring Analysis | Trans Mountain Pipeline LP Revision 0 | April 27, 2017
Creative People, Practical Solutions.® Page 35
FIGURE 5-1: MOORING LINE ARRANGEMENT – AFRAMAX TANKER

Westridge Marine Terminal - Berthing & Mooring Analysis | Trans Mountain Pipeline LP Revision 0 | April 27, 2017
Creative People, Practical Solutions.® Page 36
FIGURE 5-2: EXTREME LOW WATER MOORING LINE ARRANGEMENT – AFRAMAX TANKER

Westridge Marine Terminal - Berthing & Mooring Analysis | Trans Mountain Pipeline LP Revision 0 | April 27, 2017
Creative People, Practical Solutions.® Page 37
5.4.2. Panamax Tanker Figure 5-3 presents the conventional mooring arrangement for the Panamax tanker; which deploys twelve (12) mooring lines, and contacts all four (4) breasting dolphins.
Figure 5-4 presents the mooring line arrangement for the Panamax tanker at LLWLT (-3.0 GD). During extreme low water conditions, the tankers deck level, where winch mounted mooring lines are deployed, will be below the elevation of the QRH located on the interior breasting dolphins. As a result, the spring lines, both forward and aft of the marine loading arm, must be attached to the quick release hooks located on the outer breasting dolphins. This placement of spring lines is not as efficient as the layout presented in Figure 5-3, however, allows spring lines to be deployed and maintain the use of all available winch mounted mooring lines. Conditions where the tankers deck is lower than the top of dolphin is exceeded approximately 5% of the time.
FIGURE 5-3: MOORING LINE ARRANGEMENTS – PANAMAX TANKER

Westridge Marine Terminal - Berthing & Mooring Analysis | Trans Mountain Pipeline LP Revision 0 | April 27, 2017
Creative People, Practical Solutions.® Page 38
FIGURE 5-4: EXTREME LOW WATER MOORING LINE ARRANGEMENTS – PANAMAX TANKER

Westridge Marine Terminal - Berthing & Mooring Analysis | Trans Mountain Pipeline LP Revision 0 | April 27, 2017
Creative People, Practical Solutions.® Page 39
5.4.3. Handymax Tanker Figure 5-5 presents the mooring arrangement for the Handymax tanker; which deploys twelve (12) mooring lines, and contacts all four (4) breasting dolphins. Due to the location of the winch-deployed mooring lines, the spring lines are sent to the interior breasting dolphins, and do not interfere with outer breasting dolphins at any water level.
FIGURE 5-5: MOORING LINE ARRANGEMENTS – HANDYMAX TANKER

Westridge Marine Terminal - Berthing & Mooring Analysis | Trans Mountain Pipeline LP Revision 0 | April 27, 2017
Creative People, Practical Solutions.® Page 40
5.4.4. Handysize Tanker Figure 5-6 presents the mooring arrangement for the Handysize tanker; which deploys twelve (12) mooring lines, and contacts the two inner breasting dolphins. Spring lines are deployed to the outer breasting dolphins, and do not require an alternate mooring line arrangement for extreme low water conditions. The handysize tanker is positioned only at Berth 1 with its central manifold spotted at the jet fuel marine loading arm.
FIGURE 5-6: MOORING LINE ARRANGEMENTS – HANDYSIZE TANKER

Westridge Marine Terminal - Berthing & Mooring Analysis | Trans Mountain Pipeline LP Revision 0 | April 27, 2017
Creative People, Practical Solutions.® Page 41
5.4.5. Jet Fuel Barge Figure 5-7 presents the mooring arrangement for ocean-going Articulated Tug Barge (ATB) servicing jet fuel; which deploys eight (8) mooring lines, and contacts all four (4) breasting dolphins. Spring lines are deployed to the outer breasting dolphins, and do not require an alternate mooring line arrangement for extreme low water conditions. The ocean going barge is positioned only at Berth 1 with its central manifold spotted at the jet fuel marine loading arm.
FIGURE 5-7: MOORING LINE ARRANGEMENTS – JET FUEL BARGE

Westridge Marine Terminal - Berthing & Mooring Analysis | Trans Mountain Pipeline LP Revision 0 | April 27, 2017
Creative People, Practical Solutions.® Page 42
5.4.6. Oil Barge Figure 5-8 presents the mooring arrangement for the oil barge which deploys eight (8) mooring lines, and contacts three breasting dolphins at ballast draft; contact is made with the two forward most breasting dolphins, and with the inner breasting dolphin aft of the marine loading arms. At loaded draft, the barge makes contact with all four (4) breasting dolphin fenders.
Spring lines are deployed from bitts located onboard the barge, but are not deployed from winches, and therefore have no pretension. The spring lines are attached to the mooring posts on the outsides of the fender panels, as presented in Figure 3-2. The ocean going barge is positioned with its central manifold spotted across from the crude marine loading arm, as connecting the vapor recovery arm is not anticipated with small barges.
FIGURE 5-8: MOORING LINE ARRANGEMENTS – OIL BARGE

Westridge Marine Terminal - Berthing & Mooring Analysis | Trans Mountain Pipeline LP Revision 0 | April 27, 2017
Creative People, Practical Solutions.® Page 43
6. Static Mooring Analysis Results Results from static mooring analyses are included for all examined design range vessels in this section. Results are presented in tabular format reporting the peak mooring line tension as a percent of the minimum allowable load. For mooring lines, peak line load is a percentage of its minimum breaking load (MBL) which can vary by vessel. Peak fender reactions are reported in kips, and should not exceed the combined fender and pile rated reaction of 256 mt. Peak loads are indicative of all environmental conditions and directions applied to the moored vessel. All tables indicate varied current directions, and include applied wind speed of 60 knots.
6.1. Aframax Tanker Table 6-1 and Table 6-2 present a summary of peak mooring line and fender loads using the mooring arrangement presented in Figure 5-1 for the ballast and loaded draft conditions, respectively. For both draft conditions, peak mooring line load is 40% of the minimum breaking load (MBL) and occurs at ballast draft. No mooring line loads exceed the OCIMF recommended criteria of 55% MBL for wire lines. No fender reactions exceed their rated capacity.
Table 6-3 and Table 6-4 present a summary of peak mooring line and fender loads for the extreme low water mooring arrangement, as presented in Figure 5-2. Peak mooring load is 50% MBL, which does not exceed the OCIMF recommended criteria of 55% MBL.

Westridge Marine Terminal - Berthing & Mooring Analysis | Trans Mountain Pipeline LP Revision 0 | April 27, 2017
Creative People, Practical Solutions.® Page 44
TABLE 6-1: PEAK MOORING LOADS – AFRAMAX TANKER AT BALLAST DRAFT (60 KNOTS WIND)
Mooring Line (ML)
No Current 3 knots 2 knots 0.75 knots
0° 180° 10° 170° Beam On Beam Off ML-1 26% 25% 27% 25% 25% 25% 27% ML-2 26% 25% 27% 25% 25% 25% 27% ML-3 30% 30% 30% 30% 29% 29% 32% ML-4 31% 31% 31% 30% 30% 30% 32% ML-5 22% 23% 21% 22% 21% 21% 23% ML-6 23% 24% 22% 23% 21% 22% 24% ML-7 14% 16% 12% 15% 13% 14% 14% ML-8 14% 17% 12% 15% 13% 14% 14% ML-9 24% 20% 27% 22% 25% 24% 23% ML-10 24% 20% 27% 22% 25% 24% 24% ML-11 39% 38% 40%1 37% 39% 37% 40% ML-12 38% 37% 39% 36% 38% 37% 40% ML-13 28% 29% 27% 28% 27% 27% 29% ML-14 28% 29% 27% 28% 28% 27% 29% ML-15 29% 30% 29% 29% 29% 28% 30% ML-16 29% 30% 29% 29% 29% 28% 30% BD-1 30% 31% 30% 31% 32% 32% 30% BD-2 29% 29% 29% 30% 30% 30% 29% BD-3 32% 33% 32% 34% 32% 34% 31% BD-4 36% 36% 36% 38% 36% 37% 35%
1Shaded cell(s) indicates peak load for this condition

Westridge Marine Terminal - Berthing & Mooring Analysis | Trans Mountain Pipeline LP Revision 0 | April 27, 2017
Creative People, Practical Solutions.® Page 45
TABLE 6-2: PEAK MOORING LOADS – AFRAMAX TANKER AT LOADED DRAFT (60 KNOTS WIND)
Mooring Line (ML)
No Current 3 knots 2 knots 0.75 knots
0° 180° 10° 170° Beam On Beam Off ML-1 11% 9% 12% 13% 7% 10% 14% ML-2 11% 9% 13% 14% 7% 10% 14% ML-3 8% 8% 8% 12% 4% 7% 15% ML-4 8% 8% 8% 12% 4% 7% 16% ML-5 10% 12% 8% 14% 6% 9% 12% ML-6 10% 12% 8% 14% 6% 9% 12% ML-7 11% 14% 9% 13% 10% 11% 11% ML-8 11% 14% 9% 13% 10% 11% 11% ML-9 19% 15% 23% 16% 20% 18% 19% ML-10 18% 14% 23% 16% 20% 18% 19% ML-11 16% 14% 17% 6% 16% 10% 24% ML-12 16% 14% 17% 6% 15% 10% 24% ML-13 14% 16% 12% 9% 15% 11% 20% ML-14 14% 16% 13% 8% 15% 11% 20% ML-15 14% 16% 13% 8% 15% 11% 20% ML-16 14% 16% 13% 8% 15% 11% 20% BD-1 13% 13% 13% 11% 25% 18% 7% BD-2 13% 14% 13% 15% 23% 19% 8% BD-3 18% 18% 18% 30% 21% 24% 13% BD-4 20% 20% 21% 35%2 21% 26% 14%
2 The figure of 35% for BD-4 is the highest value in the table, but this is a reference to fender reaction force as a percent of rated reaction force, not an indication of mooring force.

Westridge Marine Terminal - Berthing & Mooring Analysis | Trans Mountain Pipeline LP Revision 0 | April 27, 2017
Creative People, Practical Solutions.® Page 46
TABLE 6-3: PEAK MOORING LOADS – AFRAMAX TANKER AT BALLAST DRAFT – EXTREME LOW WATER (60 KNOTS WIND)
Mooring Line (ML)
No Current 3 knots 2 knots 0.75 knots
0° 180° 10° 170° Beam On Beam Off ML-1 30% 28% 33% 29% 31% 29% 31% ML-2 30% 29% 34% 29% 32% 30% 31% ML-3 31% 31% 31% 30% 30% 30% 32% ML-4 33% 32% 33% 32% 31% 31% 34% ML-5 17% 19% 16% 18% 16% 17% 18% ML-6 18% 20% 17% 19% 17% 18% 19% ML-7 13% 16% 11% 15% 12% 13% 13% ML-8 13% 16% 11% 15% 12% 13% 13% ML-9 48% 46% 50% 45% 49% 46% 50% ML-10 48% 45% 50% 45% 48% 46% 50% ML-11 26% 28% 25% 26% 25% 25% 27% ML-12 26% 28% 25% 26% 26% 26% 27% ML-13 28% 30% 27% 28% 28% 27% 29% ML-14 28% 30% 27% 28% 28% 28% 29% BD-1 32% 31% 33% 31% 34% 33% 30% BD-2 29% 29% 30% 29% 30% 30% 28% BD-3 32% 32% 32% 33% 32% 33% 31% BD-4 36% 36% 35% 38% 36% 37% 35%

Westridge Marine Terminal - Berthing & Mooring Analysis | Trans Mountain Pipeline LP Revision 0 | April 27, 2017
Creative People, Practical Solutions.® Page 47
TABLE 6-4: PEAK MOORING LOADS – AFRAMAX TANKER AT LOADED DRAFT – EXTREME LOW WATER (60 KNOTS WIND)
Mooring Line (ML)
No Current 3 knots 2 knots 0.75 knots
0° 180° 10° 170° Beam On Beam Off ML-1 21% 13% 28% 24% 18% 21% 20% ML-2 22% 14% 29% 25% 19% 22% 21% ML-3 8% 8% 8% 12% 4% 7% 16% ML-4 9% 9% 9% 12% 4% 7% 17% ML-5 9% 12% 7% 14% 5% 9% 10% ML-6 9% 11% 7% 13% 5% 9% 10% ML-7 10% 14% 7% 13% 9% 10% 10% ML-8 10% 14% 7% 13% 9% 10% 10% ML-9 25% 18% 33% 17% 30% 25% 32% ML-10 26% 18% 34% 17% 31% 25% 32% ML-11 13% 15% 11% 8% 14% 10% 18% ML-12 13% 15% 11% 8% 14% 10% 18% ML-13 14% 16% 12% 8% 14% 10% 19% ML-14 14% 16% 12% 8% 14% 10% 20% BD-1 13% 13% 15% 11% 27% 18% 7% BD-2 13% 13% 14% 15% 24% 18% 8% BD-3 18% 18% 17% 30% 20% 23% 12% BD-4 20% 20% 20% 35% 20% 26% 14%

Westridge Marine Terminal - Berthing & Mooring Analysis | Trans Mountain Pipeline LP Revision 0 | April 27, 2017
Creative People, Practical Solutions.® Page 48
6.2. Panamax Tanker Table 6-5 and Table 6-6 present a summary of peak mooring line and fender loads using the mooring arrangement presented in Figure 5-3 for the ballast and loaded draft conditions, respectively. For both draft conditions, peak mooring line load is 46% of the minimum breaking load (MBL) and occurs at ballast draft. No mooring line loads exceed the OCIMF recommended criteria of 55% MBL for wire lines. No fender reactions exceed their rated capacity.
Table 6-7 and Table 6-8 present a summary of peak mooring line and fender loads for the extreme low water mooring arrangement, as presented in Figure 5-4. Peak mooring load is 46% MBL, which does not exceed the OCIMF recommended criteria of 55% MBL for steel wire lines.
TABLE 6-5: PEAK MOORING LOADS – PANAMAX TANKER AT BALLAST DRAFT (60 KNOTS WIND)
Mooring Line (ML)
No Current 3 knots 2 knots 0.75 knots
0° 180° 10° 170° Beam On Beam Off ML-1 18% 16% 19% 17% 11% 12% 24% ML-2 18% 16% 19% 17% 12% 13% 23% ML-3 20% 21% 19% 18% 10% 13% 28% ML-4 20% 21% 20% 18% 9% 13% 28% ML-5 19% 26% 15% 22% 18% 19% 20% ML-6 19% 26% 15% 22% 18% 19% 20% ML-7 18% 14% 23% 17% 20% 18% 18% ML-8 18% 14% 23% 17% 19% 18% 18% ML-9 23% 22% 24% 11% 21% 17% 30% ML-10 23% 22% 24% 11% 21% 17% 29% ML-11 30% 32% 28% 16% 28% 23% 38% ML-12 30% 32% 28% 15% 28% 23% 38% BD-1 16% 16% 15% 13% 24% 19% 12% BD-2 16% 16% 16% 16% 23% 20% 13% BD-3 21% 21% 22% 30% 23% 25% 17% BD-4 25% 24% 25% 36% 24% 29% 20%

Westridge Marine Terminal - Berthing & Mooring Analysis | Trans Mountain Pipeline LP Revision 0 | April 27, 2017
Creative People, Practical Solutions.® Page 49
TABLE 6-6: PEAK MOORING LOADS – PANAMAX TANKER AT LOADED DRAFT (60 KNOTS WIND)
Mooring Line (ML)
No Current 3 knots 2 knots 0.75 knots
0° 180° 10° 170° Beam On Beam Off ML-1 32% 30% 33% 30% 29% 29% 34% ML-2 30% 28% 32% 29% 28% 28% 32% ML-3 36% 37% 36% 36% 33% 33% 39% ML-4 37% 37% 36% 36% 33% 34% 40% ML-5 21% 27% 18% 24% 19% 21% 22% ML-6 21% 27% 18% 24% 19% 21% 23% ML-7 20% 16% 25% 19% 23% 20% 20% ML-8 20% 16% 25% 19% 23% 20% 20% ML-9 35% 34% 36% 31% 35% 33% 38% ML-10 34% 33% 35% 30% 34% 32% 37% ML-11 44% 46% 42% 41% 42% 41% 46% ML-12 44% 46% 42% 41% 42% 41% 46% BD-1 25% 26% 25% 25% 27% 27% 24% BD-2 24% 24% 24% 24% 26% 25% 23% BD-3 28% 28% 29% 30% 29% 30% 27% BD-4 32% 32% 33% 35% 32% 34% 31%

Westridge Marine Terminal - Berthing & Mooring Analysis | Trans Mountain Pipeline LP Revision 0 | April 27, 2017
Creative People, Practical Solutions.® Page 50
TABLE 6-7: PEAK MOORING LOADS – PANAMAX TANKER AT BALLAST DRAFT – EXTREME LOW WATER (60 KNOTS WIND)
Mooring Line (ML)
No Current 3 knots 2 knots 0.75 knots
0° 180° 10° 170° Beam On Beam Off ML-1 27% 24% 29% 26% 26% 25% 29% ML-2 26% 22% 28% 24% 25% 24% 27% ML-3 32% 34% 31% 32% 29% 30% 35% ML-4 32% 33% 31% 32% 29% 30% 35% ML-5 28% 38% 24% 32% 24% 28% 29% ML-6 27% 33% 24% 29% 24% 25% 29% ML-7 22% 17% 26% 19% 24% 22% 22% ML-8 24% 19% 29% 21% 27% 24% 24% ML-9 29% 26% 31% 25% 29% 27% 31% ML-10 28% 25% 30% 24% 28% 26% 30% ML-11 42% 46% 40% 40% 41% 40% 45% ML-12 42% 46% 40% 40% 40% 40% 45% BD-1 26% 27% 26% 25% 28% 27% 25% BD-2 25% 25% 25% 25% 27% 26% 23% BD-3 29% 29% 29% 31% 29% 30% 27% BD-4 32% 34% 33% 36% 32% 34% 31%

Westridge Marine Terminal - Berthing & Mooring Analysis | Trans Mountain Pipeline LP Revision 0 | April 27, 2017
Creative People, Practical Solutions.® Page 51
TABLE 6-8: PEAK MOORING LOADS – PANAMAX TANKER AT LOADED DRAFT – EXTREME LOW WATER (60 KNOTS WIND)
Mooring Line (ML)
No Current 3 knots 2 knots 0.75 knots
0° 180° 10° 170° Beam On Beam Off ML-1 24% 17% 31% 25% 23% 24% 25% ML-2 28% 20% 37% 28% 28% 28% 28% ML-3 37% 46% 24% 46% 30% 37% 37% ML-4 24% 31% 21% 29% 18% 22% 33% ML-5 6% 6% 6% 6% 6% 6% 6% ML-6 6% 6% 6% 6% 6% 6% 6% ML-7 6% 6% 6% 6% 6% 6% 6% ML-8 6% 6% 6% 6% 6% 6% 6% ML-9 27% 19% 35% 21% 31% 27% 28% ML-10 29% 20% 37% 22% 32% 28% 29% ML-11 40% 46% 32% 39% 40% 37% 46% ML-12 39% 46% 32% 36% 38% 35% 46% BD-1 16% 15% 17% 13% 25% 19% 12% BD-2 16% 15% 17% 15% 23% 20% 12% BD-3 24% 28% 21% 35% 23% 28% 19% BD-4 29% 34% 25% 44% 27% 34% 25%
6.3. Handymax Tanker Table 6-9 and Table 6-10 present a summary of peak mooring line and fender loads using the mooring arrangement presented in Figure 5-5 for the ballast and loaded draft conditions, respectively. For both draft conditions, peak mooring line load is 50% of the minimum breaking load (MBL) and occurs at ballast draft. Mooring loads for the aft breast lines approach, but do not exceed the 50% MBL recommendation provided by OCIMF for synthetic lines.

Westridge Marine Terminal - Berthing & Mooring Analysis | Trans Mountain Pipeline LP Revision 0 | April 27, 2017
Creative People, Practical Solutions.® Page 52
TABLE 6-9: PEAK MOORING LOADS – HANDYMAX TANKER AT BALLAST DRAFT (60 KNOTS WIND)
Mooring Line (ML)
No Current 3 knots 2 knots 0.75 knots
0° 180° 10° 170° Beam On Beam Off ML-1 25% 24% 26% 24% 25% 24% 26% ML-2 25% 24% 26% 24% 25% 24% 26% ML-3 37% 37% 37% 36% 35% 35% 39% ML-4 39% 39% 39% 38% 37% 37% 41% ML-5 24% 28% 21% 26% 22% 24% 24% ML-6 23% 27% 21% 25% 22% 23% 23% ML-7 31% 27% 34% 29% 33% 31% 31% ML-8 31% 27% 35% 29% 33% 31% 31% ML-9 48% 49% 48% 46% 48% 46% 50% ML-10 50% 50% 50% 47% 49% 48% 50% ML-11 29% 30% 27% 28% 28% 28% 30% ML-12 29% 31% 28% 29% 28% 28% 30% BD-1 22% 22% 22% 22% 23% 23% 21% BD-2 21% 21% 21% 21% 21% 21% 20% BD-3 25% 25% 25% 26% 25% 26% 24% BD-4 29% 30% 29% 31% 29% 30% 29%

Westridge Marine Terminal - Berthing & Mooring Analysis | Trans Mountain Pipeline LP Revision 0 | April 27, 2017
Creative People, Practical Solutions.® Page 53
TABLE 6-10: PEAK MOORING LOADS – HANDYMAX TANKER AT LOADED DRAFT (60 KNOTS WIND)
Mooring Line (ML)
No Current 3 knots 2 knots 0.75 knots
0° 180° 10° 170° Beam On Beam Off ML-1 16% 15% 18% 15% 16% 16% 19% ML-2 16% 15% 18% 16% 17% 16% 19% ML-3 20% 20% 20% 19% 13% 15% 25% ML-4 21% 21% 22% 20% 14% 16% 27% ML-5 21% 25% 17% 23% 19% 21% 21% ML-6 21% 25% 17% 23% 19% 21% 21% ML-7 26% 21% 31% 23% 28% 26% 26% ML-8 26% 21% 31% 23% 28% 25% 26% ML-9 30% 31% 29% 18% 27% 23% 36% ML-10 30% 31% 30% 18% 28% 24% 37% ML-11 20% 22% 18% 16% 19% 18% 23% ML-12 20% 23% 19% 16% 19% 18% 23% BD-1 16% 15% 16% 13% 20% 17% 14% BD-2 15% 15% 15% 14% 18% 17% 13% BD-3 18% 19% 18% 23% 19% 21% 16% BD-4 21% 22% 21% 29% 21% 23% 19%

Westridge Marine Terminal - Berthing & Mooring Analysis | Trans Mountain Pipeline LP Revision 0 | April 27, 2017
Creative People, Practical Solutions.® Page 54
6.4. Jet Fuel Barge Table 6-9 and Table 6-10 present a summary of peak mooring line and fender loads using the mooring arrangement presented in Figure 5-7 for the ballast and loaded draft conditions, respectively. For both draft conditions, peak mooring line load is 50% of the minimum breaking load (MBL) and occurs at ballast draft. Mooring loads for the aft breast lines approach, but do not exceed the 50% MBL recommendation provided by OCIMF for synthetic lines.
TABLE 6-11: PEAK MOORING LOADS – HANDYMAX TANKER AT BALLAST DRAFT (60 KNOTS WIND)
Mooring Line (ML)
No Current 3 knots 2 knots 0.75 knots
0° 180° 10° 170° Beam On Beam Off ML-1 25% 24% 26% 24% 25% 24% 26% ML-2 25% 24% 26% 24% 25% 24% 26% ML-3 37% 37% 37% 36% 35% 35% 39% ML-4 39% 39% 39% 38% 37% 37% 41% ML-5 24% 28% 21% 26% 22% 24% 24% ML-6 23% 27% 21% 25% 22% 23% 23% ML-7 31% 27% 34% 29% 33% 31% 31% ML-8 31% 27% 35% 29% 33% 31% 31% ML-9 48% 49% 48% 46% 48% 46% 50% ML-10 50% 50% 50% 47% 49% 48% 50% ML-11 29% 30% 27% 28% 28% 28% 30% ML-12 29% 31% 28% 29% 28% 28% 30% BD-1 22% 22% 22% 22% 23% 23% 21% BD-2 21% 21% 21% 21% 21% 21% 20% BD-3 25% 25% 25% 26% 25% 26% 24% BD-4 29% 30% 29% 31% 29% 30% 29%

Westridge Marine Terminal - Berthing & Mooring Analysis | Trans Mountain Pipeline LP Revision 0 | April 27, 2017
Creative People, Practical Solutions.® Page 55
TABLE 6-12: PEAK MOORING LOADS – HANDYMAX TANKER AT LOADED DRAFT (60 KNOTS WIND)
Mooring Line (ML)
No Current 3 knots 2 knots 0.75 knots
0° 180° 10° 170° Beam On Beam Off ML-1 16% 15% 18% 15% 16% 16% 19% ML-2 16% 15% 18% 16% 17% 16% 19% ML-3 20% 20% 20% 19% 13% 15% 25% ML-4 21% 21% 22% 20% 14% 16% 27% ML-5 21% 25% 17% 23% 19% 21% 21% ML-6 21% 25% 17% 23% 19% 21% 21% ML-7 26% 21% 31% 23% 28% 26% 26% ML-8 26% 21% 31% 23% 28% 25% 26% ML-9 30% 31% 29% 18% 27% 23% 36% ML-10 30% 31% 30% 18% 28% 24% 37% ML-11 20% 22% 18% 16% 19% 18% 23% ML-12 20% 23% 19% 16% 19% 18% 23% BD-1 16% 15% 16% 13% 20% 17% 14% BD-2 15% 15% 15% 14% 18% 17% 13% BD-3 18% 19% 18% 23% 19% 21% 16% BD-4 21% 22% 21% 29% 21% 23% 19%

Westridge Marine Terminal - Berthing & Mooring Analysis | Trans Mountain Pipeline LP Revision 0 | April 27, 2017
Creative People, Practical Solutions.® Page 56
6.5. Jet Fuel Barge Table 6-13 and Table 6-14 present a summary of peak mooring line and fender loads using the mooring arrangement presented in Figure 5-7 for the ballast and loaded draft conditions, respectively. For both draft conditions, peak mooring line load is 31% of the minimum breaking load (MBL) and occurs at ballast draft. All mooring lines and fenders are within their safe working loads.
TABLE 6-13: PEAK MOORING LOADS – JET FUEL BARGE AT BALLAST DRAFT (60 KNOTS WIND)
Mooring Line (ML)
No Current 3 knots 2 knots 0.75 knots
0° 180° 10° 170° Beam On Beam Off ML-1 18% 16% 18% 17% 17% 13% 19% ML-2 17% 16% 17% 16% 16% 13% 18% ML-3 24% 27% 22% 25% 23% 6% 24% ML-4 24% 27% 22% 26% 23% 6% 24% ML-5 20% 17% 22% 18% 21% 18% 20% ML-6 19% 17% 21% 18% 20% 18% 19% ML-7 30% 30% 29% 28% 29% 4% 31% ML-8 29% 29% 28% 27% 28% 5% 30% BD-1 7% 7% 7% 7% 8% 4% 7% BD-2 8% 8% 8% 8% 9% 4% 8% BD-3 13% 13% 13% 13% 13% 5% 13% BD-4 15% 15% 15% 16% 15% 6% 14%
TABLE 6-14: PEAK MOORING LOADS – JET FUEL BARGE AT LOADED DRAFT (60 KNOTS WIND)
Mooring Line (ML)
No Current 3 knots 2 knots 0.75 knots
0° 180° 10° 170° Beam On Beam Off ML-1 13% 11% 15% 13% 13% 13% 13% ML-2 13% 11% 15% 13% 13% 13% 13% ML-3 23% 27% 19% 26% 21% 23% 23% ML-4 23% 28% 19% 26% 21% 23% 23% ML-5 18% 14% 22% 15% 20% 18% 18% ML-6 18% 14% 21% 15% 20% 18% 18% ML-7 15% 17% 15% 9% 15% 12% 20% ML-8 15% 16% 14% 9% 15% 11% 19% BD-1 5% 5% 5% 4% 8% 6% 4% BD-2 4% 5% 4% 4% 7% 6% 3% BD-3 7% 7% 8% 11% 8% 9% 6% BD-4 9% 9% 9% 13% 9% 11% 7%

Westridge Marine Terminal - Berthing & Mooring Analysis | Trans Mountain Pipeline LP Revision 0 | April 27, 2017
Creative People, Practical Solutions.® Page 57
6.6. Oil Barge Table 6-15 and Table 6-16 present a summary of peak mooring line and fender loads using the mooring arrangement presented in Figure 5-8 for the ballast and loaded draft conditions, respectively. For both draft conditions, peak mooring line load is 29% of the minimum breaking load (MBL) and occurs at ballast draft. All mooring lines and fenders are within their safe working loads.
TABLE 6-15: PEAK MOORING LOADS – OIL BARGE AT BALLAST DRAFT (60 KNOTS WIND)
Mooring Line (ML)
No Current
3 knots 2 knots 0.75 knots
0° 180° 10° 170° Beam On Beam Off
ML-1 20% 20% 20% 20% 20% 20% 21% ML-2 20% 20% 21% 20% 20% 20% 21% ML-3 19% 20% 19% 19% 18% 19% 19% ML-4 19% 20% 19% 19% 19% 19% 20% ML-5 12% 14% 10% 12% 12% 12% 12% ML-6 11% 10% 13% 11% 12% 11% 12% ML-7 10% 12% 9% 11% 10% 10% 10% ML-8 26% 23% 29% 25% 26% 26% 26% BD-1 8% 8% 9% 8% 9% 9% 8% BD-2 8% 8% 8% 8% 8% 8% 8% BD-3 12% 13% 12% 12% 12% 12% 12%
BD-4 No Contact
No Contact
No Contact
No Contact
No Contact
No Contact
No Contact
TABLE 6-16: PEAK MOORING LOADS – OIL BARGE AT LOADED DRAFT (60 KNOTS WIND)
Mooring Line (ML)
No Current 3 knots 2 knots 0.75 knots
0° 180° 10° 170° Beam On Beam Off ML-1 9% 8% 9% 7% 9% 8% 12% ML-2 9% 8% 10% 8% 9% 8% 12% ML-3 8% 9% 7% 8% 7% 8% 10% ML-4 8% 9% 7% 8% 7% 8% 10% ML-5 2% 4% 0% 2% 1% 2% 5% ML-6 1% 0% 2% 1% 2% 1% 1% ML-7 2% 4% 0% 2% 1% 2% 4% ML-8 7% 3% 12% 7% 9% 8% 12% BD-1 4% 4% 5% 7% 5% 6% 3% BD-2 4% 4% 4% 6% 5% 5% 3% BD-3 3% 3% 3% 3% 5% 4% 2% BD-4 3% 3% 2% 2% 5% 4% 2%

Westridge Marine Terminal - Berthing & Mooring Analysis | Trans Mountain Pipeline LP Revision 0 | April 27, 2017
Creative People, Practical Solutions.® Page 58
7. Dynamic Mooring Analysis Results Dynamic mooring analyses were conducted using the arrangements obtained from the static analysis. Ballast draft and high water were assumed for the simulations, as this combination was observed to provide the most conservative conditions from the static mooring analysis. The environmental conditions used in the simulations are those presented in Table 2-7, which in summary are: 100-year wind of 40 knots (2-min gust duration), ebb and flood current of 1.0 knot (parallel to berth), and 100-year wave from the NE (34 °N) with Hs = 0.6 m and Tp = 3.0 sec.
The oil barge’s small overall length does not provide reasonable Froude scaling for hydrodynamic input to the dynamic mooring analysis program, and is therefore excluded from dynamic analysis. As the project area is dominated primarily by winds, the OCIMF criteria considered in the static analysis, which correspond to a 500-year wind condition, are sufficient for confirming the feasibility of the oil barge to be moored at the marine facilities.
Additionally, a time series of maximum tsunami currents, as described in Section 2.3.7, concomitant with the 25-year wind of 36.8 knots (2-minute duration) were carried out for the Aframax tanker. Tsunami analyses are considered only for the Aframax tanker, on the predication that successful results for the largest design vessel will be successful for tankers with less wetted area for tsunami forces to act. Tsunami forces are also applied independently of the 25-year wind condition, to ensure that no motions are damped out as a result of applied wind force.
7.1. Mooring Analysis Summary All results for dynamic analyses, including peak mooring line loads, fender reactions, and vessel motions, are presented in Table 7-1 through Table 7-10 for all design vessels examined. Results are presented for the 40 knot wind condition (100-year wind) and indicate that safe mooring criteria for mooring lines, fender loads and vessel motions is not exceeded.
7.1.1. Tsunami Mooring Analysis Results As noted in Section 2.3.7, M&N conducted a tsunami assessment of the Westridge Terminal as part of the TMEP (M&N, 2015). The study evaluated the impact of several hypothetical landslide-generated tsunamis in the Indian Arm and Burrard Inlet using a MIKE 21, two-dimensional hydrodynamic model. Time series of depth-averaged current velocities at the berths for each modeled landslide were produced. The highest depth-averaged current at the berths from all the tsunami scenarios was 1.86 knots. M&N performed a dynamic mooring analysis using the worst case current time series to evaluate the effect of a hypothetical tsunami on a moored vessel.
As presented in Table 7-1 and Table 7-2, the Aframax tanker is able to maintain safe mooring criteria for the applied tsunami forces. For many mooring lines, peak loads do not exceed the pretension set in the mooring lines, indicating the Aframax tanker is able to sustain the applied tsunami forces.

Westridge Marine Terminal - Berthing & Mooring Analysis | Trans Mountain Pipeline LP Revision 0 | April 27, 2017
Creative People, Practical Solutions.® Page 59
TABLE 7-1: PEAK DYNAMIC MOORING LOADS – AFRAMAX (BALLAST DRAFT AT HIGH WATER)
Element 40 knot Wind, 100-yr Wave,
1 knot Ebb Current
40 knot Wind, 100-yr Wave,
1 knot Flood Current 25-Year Wind with Tsunami Currents
ML-1 27% 30% 10% ML-2 27% 30% 10% ML-3 28% 32% 9% ML-4 29% 32% 9% ML-5 20% 21% 7% ML-6 21% 21% 7% ML-7 12% 10% 7% ML-8 12% 10% 7% ML-9 20% 20% 11% ML-10 20% 20% 11% ML-11 34% 38% 11% ML-12 33% 38% 11% ML-13 25% 25% 9% ML-14 25% 25% 9% ML-15 26% 27% 9% ML-16 26% 27% 9% FD-1 25% 29% 12% FD-2 24% 26% 11% FD-3 25% 25% 11% FD-4 27% 27% 12%
* Minimum breaking load = 83 mt; Allowable MBL = 55%; Peak fender reaction = 256 mt
TABLE 7-2: PEAK MOORING MOTIONS – AFRAMAX (BALLAST DRAFT AT HIGH WATER)
Peak Motion 40 knot Wind, 100-yr Wave,
1 knot Ebb Current
40 knot Wind, 100-yr Wave,
1 knot Flood Current 25-Year Wind with Tsunami Current
Surge FWD [m] 0.25 0.24 0.11 Surge AFT [m] -0.09 -0.12 -0.01 Sway OFF-Berth [m] 0.15 0.14 0.08 Sway On-Berth [m] -0.6 -0.52 -0.04 Heave [+ deg] 0 0 -0.02 Heave [- deg] -0.08 -0.07 -0.03 Roll [ + deg] 0.2 0.18 0.07 Roll [- deg] -0.01 -0.01 0.06 Yaw [+ deg] 0 0 0 Yaw [- deg] -0.01 -0.01 0

Westridge Marine Terminal - Berthing & Mooring Analysis | Trans Mountain Pipeline LP Revision 0 | April 27, 2017
Creative People, Practical Solutions.® Page 60
TABLE 7-3: PEAK DYNAMIC MOORING LOADS – PANAMAX (BALLAST DRAFT AT HIGH WATER)
Element 40 knot Wind, 100-yr Wave,
1 knot Ebb Current
40 knot Wind, 100-yr Wave,
1 knot Flood Current ML-1 35% 33% ML-2 31% 30% ML-3 44% 38% ML-4 43% 38% ML-5 18% 19% ML-6 18% 19% ML-7 14% 13% ML-8 14% 13% ML-9 35% 39% ML-10 34% 38% ML-11 50% 51% ML-12 51% 52% FD-1 47% 48% FD-2 34% 42% FD-3 35% 31% FD-4 42% 39%
* Minimum breaking load = 79 mt; Allowable MBL = 55%; Peak fender reaction = 256 mt
TABLE 7-4: PEAK MOORING MOTIONS – PANAMAX (BALLAST DRAFT AT HIGH WATER)
Peak Motion 40 knot Wind, 100-yr Wave,
1 knot Ebb Current
40 knot Wind, 100-yr Wave,
1 knot Flood Current Surge FWD [m] 0.43 0.38 Surge AFT [m] -0.64 -0.71 Sway OFF-Berth [m] 0.19 0.22 Sway On-Berth [m] -1.12 -1.13 Heave [+ deg] 0 0.01 Heave [- deg] -0.07 -0.07 Roll [ + deg] 0.23 0.25 Roll [- deg] -0.02 -0.04 Yaw [+ deg] 0 0 Yaw [- deg] -0.01 -0.01

Westridge Marine Terminal - Berthing & Mooring Analysis | Trans Mountain Pipeline LP Revision 0 | April 27, 2017
Creative People, Practical Solutions.® Page 61
TABLE 7-5: PEAK DYNAMIC MOORING LOADS – HANDYMAX (BALLAST DRAFT AT HIGH WATER)
Element 40 knot Wind, 100-yr Wave,
1 knot Ebb Current
40 knot Wind, 100-yr Wave,
1 knot Flood Current ML-1 22% 22% ML-2 22% 22% ML-3 33% 35% ML-4 35% 37% ML-5 15% 16% ML-6 15% 16% ML-7 17% 17% ML-8 17% 17% ML-9 41% 42% ML-10 43% 44% ML-11 22% 23% ML-12 23% 23% FD-1 56% 60% FD-2 42% 50% FD-3 43% 35% FD-4 50% 42%
* Minimum breaking load = 62 mt; Allowable MBL = 50%; Peak fender reaction = 256 mt
TABLE 7-6: PEAK MOORING MOTIONS – HANDYMAX (BALLAST DRAFT AT HIGH WATER)
Peak Motion 40 knot Wind, 100-yr Wave,
1 knot Ebb Current
40 knot Wind, 100-yr Wave,
1 knot Flood Current Surge FWD [m] 1.07 1.09 Surge AFT [m] -0.9 -0.85 Sway OFF-Berth [m] -2.14 -2.29 Sway On-Berth [m] 0.24 0.26 Heave [+ deg] 0.02 0.03 Heave [- deg] -0.13 -0.14 Roll [ + deg] 0.46 0.48 Roll [- deg] -0.1 -0.14 Yaw [+ deg] 0 0 Yaw [- deg] -0.01 -0.01

Westridge Marine Terminal - Berthing & Mooring Analysis | Trans Mountain Pipeline LP Revision 0 | April 27, 2017
Creative People, Practical Solutions.® Page 62
TABLE 7-7: PEAK DYNAMIC MOORING LOADS – HANDYSIZE (BALLAST DRAFT AT HIGH WATER)
Element 40 knot Wind, 100-yr Wave,
1 knot Ebb Current
40 knot Wind, 100-yr Wave,
1 knot Flood Current ML-1 19% 19% ML-2 19% 18% ML-3 29% 29% ML-4 28% 28% ML-5 32% 31% ML-6 33% 32% ML-7 18% 17% ML-8 17% 16% ML-9 33% 37% ML-10 32% 36% ML-11 19% 21% ML-12 20% 22% FD-1 - - FD-2 33% 48% FD-3 46% 39% FD-4 - -
* Minimum breaking load = 38 mt; Allowable MBL = 50%; Peak fender reaction = 256 mt
TABLE 7-8: PEAK MOORING MOTIONS – HANDYSIZE (BALLAST DRAFT AT HIGH WATER)
Peak Motion 40 knot Wind, 100-yr Wave,
1 knot Ebb Current
40 knot Wind, 100-yr Wave,
1 knot Flood Current Surge FWD [m] 0.29 0.23 Surge AFT [m] -0.47 -0.48 Sway OFF-Berth [m] 0.15 0.15 Sway On-Berth [m] -1.78 -1.59 Heave [+ deg] 0.01 0.02 Heave [- deg] -0.09 -0.09 Roll [ + deg] 0.43 0.44 Roll [- deg] -0.08 -0.11 Yaw [+ deg] 0.01 0.01 Yaw [- deg] -0.01 -0.01
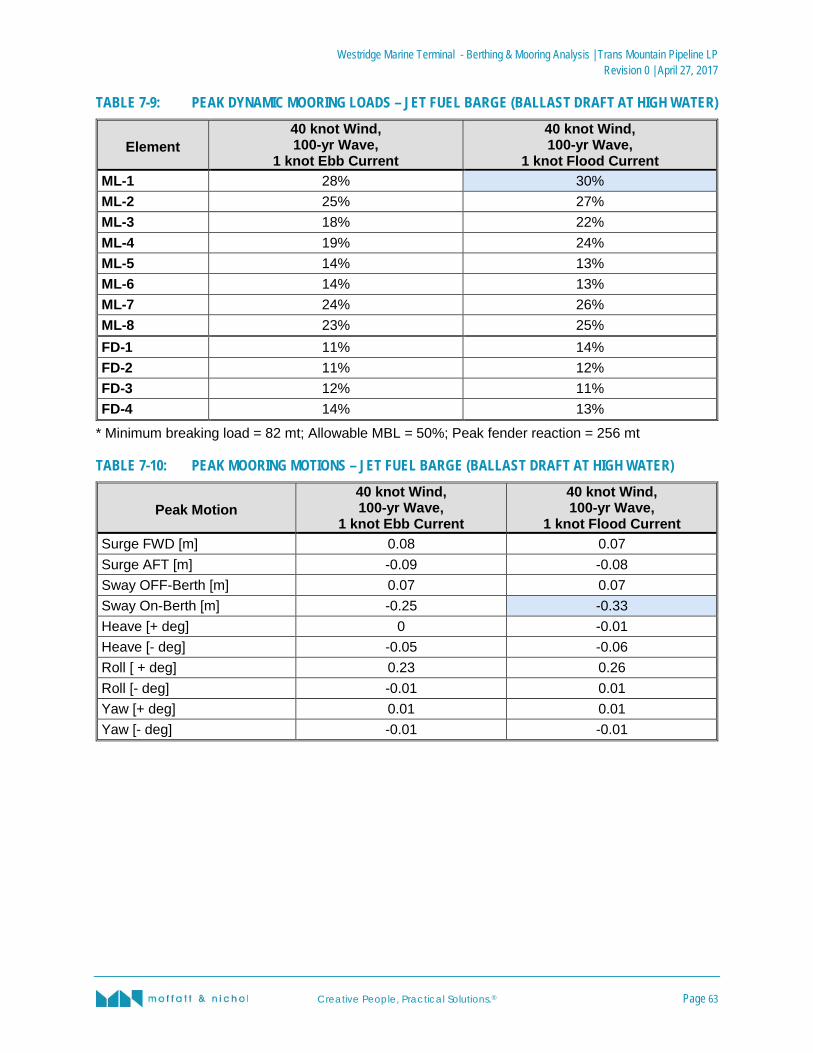
Westridge Marine Terminal - Berthing & Mooring Analysis | Trans Mountain Pipeline LP Revision 0 | April 27, 2017
Creative People, Practical Solutions.® Page 63
TABLE 7-9: PEAK DYNAMIC MOORING LOADS – JET FUEL BARGE (BALLAST DRAFT AT HIGH WATER)
Element 40 knot Wind, 100-yr Wave,
1 knot Ebb Current
40 knot Wind, 100-yr Wave,
1 knot Flood Current ML-1 28% 30% ML-2 25% 27% ML-3 18% 22% ML-4 19% 24% ML-5 14% 13% ML-6 14% 13% ML-7 24% 26% ML-8 23% 25% FD-1 11% 14% FD-2 11% 12% FD-3 12% 11% FD-4 14% 13%
* Minimum breaking load = 82 mt; Allowable MBL = 50%; Peak fender reaction = 256 mt
TABLE 7-10: PEAK MOORING MOTIONS – JET FUEL BARGE (BALLAST DRAFT AT HIGH WATER)
Peak Motion 40 knot Wind, 100-yr Wave,
1 knot Ebb Current
40 knot Wind, 100-yr Wave,
1 knot Flood Current Surge FWD [m] 0.08 0.07 Surge AFT [m] -0.09 -0.08 Sway OFF-Berth [m] 0.07 0.07 Sway On-Berth [m] -0.25 -0.33 Heave [+ deg] 0 -0.01 Heave [- deg] -0.05 -0.06 Roll [ + deg] 0.23 0.26 Roll [- deg] -0.01 0.01 Yaw [+ deg] 0.01 0.01 Yaw [- deg] -0.01 -0.01

Westridge Marine Terminal - Berthing & Mooring Analysis | Trans Mountain Pipeline LP Revision 0 | April 27, 2017
Creative People, Practical Solutions.® Page 64
8. Conclusions Extensive mooring and berthing analyses have been conducted for the design range of tankers and barges.
• Static mooring analyses conducted using OPTIMOOR and OCIMF environmental conditions result in safe mooring criteria satisfied for line tensions and fender reactions for all vessels, all draft and water level conditions.
• Dynamic mooring analyses conducted for a 100-yr conditions yield successful results for safe mooring criteria.
• Tsunami forces were applied to the Aframax tanker with successful results.

Westridge Marine Terminal - Berthing & Mooring Analysis | Trans Mountain Pipeline LP Revision 0 | April 27, 2017
Creative People, Practical Solutions.® Page 65
9. References Moffatt & Nichol (M&N). (2014a). “WMT Metocean Study Report.” Trans Mountain Expansion Project, Westridge Marine Terminal. Prepared for Trans Mountain Pipeline LP. TMP Report No. 01-13283-TW-WT00-MD-RPT-0004 RA.
Moffatt & Nichol (M&N). (2014b). “WMT Berthing Analysis and Fender Selection.” Trans Mountain Expansion Project, Westridge Marine Terminal. Prepared for Trans Mountain Pipeline LP.
Moffatt & Nichol (M&N). (2015). “WMT Tsunami Assessment.” Trans Mountain Expansion Project, Westridge Marine Terminal. Prepared for Trans Mountain Pipeline LP. TMP Report No. 01-13283-TW-WT00-MFN-RPT-0008.
Moffatt & Nichol (M&N). (2017). “WMT Design Basis Memorandum” Trans Mountain Expansion Project, Westridge Marine Terminal. Prepared for Trans Mountain Pipeline LP. TMP Report No. 01-13283-TW-WT00-MFN-RPT-0002.
OCIMF (Oil Companies International Marine Forum): “Mooring Equipment Guidelines”, 3rd Edition, 2008.
OCIMF (Oil Companies International Marine Forum): “Recommendations for Oil Tanker Manifold and Associated Equipment, Fourth Edition, 1991.
PIANC: “Guidelines for the Design of Fenders Systems: 2002”, MarCom Report of WG33, 2002.
PIANC: “Criteria for Movements of Moored Vessels”, MarCom Report of WG24 1995.
PIANC: “Recommendations for the Design and Assessment of Marine Oil and Petrochemical Terminals”, MarCom report of WG153, 2016
California State Lands Commission (SLC), “Marine Oil Terminals Engineering and Maintenance Standards (MOTEMS). Chapter 31F, California Code of Regulations, Title 24, Part 2 (2010)

Westridge Marine Terminal - Berthing & Mooring Analysis | Trans Mountain Pipeline LP Revision 0 | April 27, 2017
Creative People, Practical Solutions.® Page 66
Moffatt & Nichol, Vancouver Suite 301 - 777 West Broadway
Vancouver BC V5Z 4J7 Canada
T +1 604-707-9004
www.moffattnichol.com

Appendix C Passing Ship Analysis

Prepared by:
WESTRIDGE MARINE TERMINAL VANCOUVER, BC
PASSING SHIP ANALYSIS
Prepared for:

WESTRIDGE MARINE TERMINAL VANCOUVER, BC
PASSING SHIP ANALYSIS
M&N Project No. 7773‐01
Revision Description Issued Date Author Reviewed Approved
C Final August 25, 2014 DRD EDS RDB
B Draft May 09, 2014 DRD EDS RDB
A Interim Draft April 30, 2014 DRD EDS RDB

Trans Mountain Passing Ship Analysis 3
Trans Mountain Pipeline LP – Westridge Marine Terminal August 25, 2014
TABLE OF CONTENTS
1. INTRODUCTION ......................................................................................................................... 6
1.1 Scope of work ...................................................................................................................... 6
2. PROJECT BACKGROUND ............................................................................................................ 8
2.1 Site Location ........................................................................................................................ 8 2.2 Site Bathymetry ................................................................................................................. 11 2.3 Proposed Facility design .................................................................................................... 11 2.4 Design Vessels ................................................................................................................... 12 2.5 Existing traffic .................................................................................................................... 13 2.6 Proposed Vessel Traffic Corridor ....................................................................................... 15
3. PASSING VESSEL ANALYSIS ..................................................................................................... 17
3.1 ROPES ................................................................................................................................ 19 3.1.1 Passing Vessel Simulated Scenarios ........................................................................... 19 3.1.2 Results ........................................................................................................................ 20
3.2 Termsim ............................................................................................................................. 29 3.2.1 Environmental Parameters ........................................................................................ 31 3.2.2 Berth Geometries and Model Setup .......................................................................... 31 3.2.3 Mooring Evaluation Criteria ...................................................................................... 32 3.2.4 Results ........................................................................................................................ 32
4. CONCLUSIONS AND RECOMMENDATIONS ............................................................................. 45
5. REFERENCES ............................................................................................................................ 46
LIST OF FIGURES
Figure 1‐1: PMV Proposed Channel and Anchorage Realignment ........................................... 7
Figure 2‐1: Site Plan Overview .................................................................................................. 8
Figure 2‐2: All Vessel Traffic in the Westridge Area.................................................................. 9
Figure 2‐3: General Arrangement Plan for the Proposed Westridge Facilities ...................... 10
Figure 2‐4: Site Bathymetry .................................................................................................... 11
Figure 2‐5: Recent Vessel Traffic (LOA > 150m SOG >= 6 kts) around the Westridge
Facilities ................................................................................................................ 14
Figure 2‐6: Vessel Speed Over Ground around the Westridge Facilities (Limited to
Channel Traffic) ..................................................................................................... 15
Figure 2‐7: PMV’s Proposed Traffic Channel Alignment near Westridge Terminal ................ 16

Trans Mountain Passing Ship Analysis 4
Trans Mountain Pipeline LP – Westridge Marine Terminal August 25, 2014
Figure 3‐1: Typical representation of a passing vessel scenario ............................................. 17
Figure 3‐2: Non‐dimensional results for a passing vessel scenario (Wang, 1975) ................. 18
Figure 3‐3: Snapshot of the ROPES model developed for moored Aframax tankers at
Berth 3 ................................................................................................................... 20
Figure 3‐4: Modeled Surge Forces on the Panamax Tanker at Berth 1 .................................. 21
Figure 3‐5: Modeled Sway Forces on the Panamax Tanker at Berth 1 ................................... 21
Figure 3‐6: Modeled Heave Forces on the Panamax Tanker at Berth 1 ................................. 22
Figure 3‐7: Modeled Roll Forces on the Panamax Tanker at Berth 1 ..................................... 22
Figure 3‐8: Modeled Pitch Forces on the Panamax Tanker at Berth 1 ................................... 23
Figure 3‐9: Modeled Yaw Forces on the Panamax Tanker at Berth 1 .................................... 23
Figure 3‐10: Modeled Surge Forces on the Aframax Tanker at Berth 2 ................................... 24
Figure 3‐11: Modeled Sway Forces on the Aframax Tanker at Berth 2 .................................... 24
Figure 3‐12: Modeled Heave Forces on the Aframax Tanker at Berth 2 .................................. 25
Figure 3‐13: Modeled Roll Forces on the Aframax Tanker at Berth 2 ...................................... 25
Figure 3‐14: Modeled Pitch Forces on the Aframax Tanker at Berth 2 .................................... 26
Figure 3‐15: Modeled Yaw Forces on the Aframax Tanker at Berth 2 ...................................... 26
Figure 3‐16: Modeled Surge Forces on the Aframax Tanker at Berth 3 ................................... 27
Figure 3‐17: Modeled Sway Forces on the Aframax Tanker at Berth 3 .................................... 27
Figure 3‐18: Modeled Heave Forces on the Aframax Tanker at Berth 3 .................................. 28
Figure 3‐19: Modeled Roll Forces on the Aframax Tanker at Berth 3 ...................................... 28
Figure 3‐20: Modeled Pitch Forces on the Aframax Tanker at Berth 3 .................................... 29
Figure 3‐21: Modeled Yaw Forces on the Aframax Tanker at Berth 3 ...................................... 29
Figure 3‐22: Panamax Mooring Arrangement at Berth 1 ......................................................... 31
Figure 3‐23: Aframax Mooring Arrangement at Berths 2 and 3 ............................................... 32
LIST OF TABLES
Table 2‐1: Moored Vessel Characteristics ............................................................................. 12
Table 2‐2: Passing Vessel Characteristics ............................................................................... 13
Table 3‐1: Simulated Passing Vessel Scenarios ...................................................................... 20
Table 3‐2: Mooring Line and Hook Loads for Panamax Bulker at Berth 1 with 10 kt
Passing Vessel Speed ............................................................................................ 33
Table 3‐3: Bollard Loads for Panamax Bulker at Berth 1 with 10 kt Passing Vessel Speed ... 34
Table 3‐4: Fender Loads for Panamax Bulker at Berth 1 with 10 kt Passing Vessel Speed ... 34
Table 3‐5: Panamax Bulker Motions at Berth 1 with 10 kt Passing Vessel Speed ................. 34

Trans Mountain Passing Ship Analysis 5
Trans Mountain Pipeline LP – Westridge Marine Terminal August 25, 2014
Table 3‐6: Mooring Line and Hook Loads for Panamax Bulker at Berth 1 with 11 kt
Passing Vessel Speed ............................................................................................ 35
Table 3‐7: Bollard Loads for Panamax Bulker at Berth 1 with 11 kt Passing Vessel Speed ... 35
Table 3‐8: Fender Loads for Panamax Bulker at Berth 1 with 11 kt Passing Vessel Speed ... 35
Table 3‐9: Panamax Bulker Motions at Berth 1 with 11 kt Passing Vessel Speed ................. 36
Table 3‐10: Mooring Line and Hook Loads for Aframax Bulker at Berth 2 with 10 kt
Passing Vessel Speed ............................................................................................ 37
Table 3‐11: Bollard Loads for Aframax Bulker at Berth 2 with 10 kt Passing Vessel Speed .... 37
Table 3‐12: Fender Loads for Aframax Bulker at Berth 2 with 10 kt Passing Vessel Speed .... 38
Table 3‐13: Aframax Bulker Motions at Berth 2 with 10 kt Passing Vessel Speed .................. 38
Table 3‐14: Mooring Line and Hook Loads for Aframax Bulker at Berth 2 with 11 kt
Passing Vessel Speed ............................................................................................ 39
Table 3‐15: Bollard Loads for Aframax Bulker at Berth 2 with 11 kt Passing Vessel Speed .... 39
Table 3‐16: Fender Loads for Aframax Bulker at Berth 2 with 11 kt Passing Vessel Speed .... 40
Table 3‐17: Aframax Bulker Motions at Berth 2 with 11 kt Passing Vessel Speed .................. 40
Table 3‐18: Mooring Line and Hook Loads for Aframax Bulker at Berth 3 with 10 kt
Passing Vessel Speed ............................................................................................ 41
Table 3‐19: Bollard Loads for Aframax Bulker at Berth 3 with 10 kt Passing Vessel Speed .... 41
Table 3‐20: Fender Loads for Aframax Bulker at Berth 3 with 10 kt Passing Vessel Speed .... 42
Table 3‐21: Aframax Bulker Motions at Berth 3 with 10 kt Passing Vessel Speed .................. 42
Table 3‐22: Mooring Line and Hook Loads for Aframax Bulker at Berth 3 with 11 kt
Passing Vessel Speed ............................................................................................ 43
Table 3‐23: Bollard Loads for Aframax Bulker at Berth 3 with 11 kt Passing Vessel Speed .... 43
Table 3‐24: Fender Loads for Aframax Bulker at Berth 3 with 11 kt Passing Vessel Speed .... 44
Table 3‐25: Aframax Bulker Motions at Berth 3 with 11 kt Passing Vessel Speed .................. 44

Trans Mountain Passing Ship Analysis 6
Trans Mountain Pipeline LP – Westridge Marine Terminal August 25, 2014
1. INTRODUCTION
Kinder Morgan Canada (KMC) is currently considering expansion of marine facilities at
their Westridge Terminal in Burnaby which includes the construction of new moorings capable
of accepting 3 tanker vessels which may range from 17,000 DWT barges to Aframax tankers.
The geographic location of these facilities provides about 190 meters of clearance between
tankers moored at Westridge and the proposed channel realignment scheme within Port Metro
Vancouver (PMV). KMC has engaged Moffatt and Nichol to investigate passing vessel effects on
moored ships at the proposed Westridge Terminal expansion.
1.1 SCOPE OF WORK
The objective of this study is to determine the loads imparted by passing vessels under
the proposed channel alignment on selected tankers berthed at the new Westridge facilities. In
a meeting held on April 7 with KMC and PMV, specific scenarios were laid out for this analysis:
Panamax and Aframax tankers were to be used as the moored vessels
The considered passing vessel would be based on the largest vessel en route to Port
Moody with dimensions similar to the dry bulk carrier Shi Dai 20
The closest passing distance between berth 3 and the proposed channel realignment is
approximately 190 meters (Figure 1‐1)
A transiting speed of 10 knots would be assumed for the passing vessel.
The analysis of the passing vessel effects on the moored vessels would be carried out in
two steps: first, the forces imparted on the moored vessel by the passing ship are calculated,
and then these forces are input into a time‐domain mooring simulation model that computes
the moored vessel response with the associated mooring line loads, fender loads, and vessel
motions.

Trans Mountain Passing Ship Analysis 7
Trans Mountain Pipeline LP – Westridge Marine Terminal August 25, 2014
Figure 1‐1: PMV Proposed Channel and Anchorage Realignment

Trans Mountain Passing Ship Analysis 8
Trans Mountain Pipeline LP – Westridge Marine Terminal August 25, 2014
2. PROJECT BACKGROUND
2.1 SITE LOCATION
The Westridge terminal is situated along the southern shore of Burrard Inlet within the
port of Vancouver roughly 5 kilometers east of the Second Narrows Bridge and adjacent to the
southern entrance to the Indian Arm (Figure 2‐1).
Figure 2‐1: Site Plan Overview
Vessel traffic in the immediate vicinity is typically limited to shallow draft vessels; deep
draft vessel activity in the area is predominantly traffic calling at bulk terminals east of the site
or at the anchorages just northwest of Westridge (Figure 2‐2).

Trans Mountain Passing Ship Analysis 9
Trans Mountain Pipeline LP – Westridge Marine Terminal August 25, 2014
Figure 2‐2: All Vessel Traffic in the Westridge Area
A general arrangement of the proposed facility is shown in Figure 2‐3. The exact layout
of the terminal is still evolving as the engineering process continues, so the final layout is
expected to be somewhat different than is depicted here, but any potential changes in layout
are not expected to have a material effect on this study.

Trans Mountain Passing Ship Analysis 10
Trans Mountain Pipeline LP – Westridge Marine Terminal August 25, 2014
Figure 2‐3: General Arrangement Plan for the Proposed Westridge Facilities

Trans Mountain Passing Ship Analysis 11
Trans Mountain Pipeline LP – Westridge Marine Terminal August 25, 2014
2.2 SITE BATHYMETRY
Bathymetry used in the analysis was taken from survey data delivered to M&N from
Golder Associates on March 27, 2014. All three proposed berth locations are in naturally deep
water with 20 meters or more of depth. Bathymetric slope from the berths to the proposed
channel realignment is very mild with grades close to 30:1 (H:V). Bathymetric slopes closer to
the shoreline are typically 8:1 until reaching the surface.
Figure 2‐4: Site Bathymetry
2.3 PROPOSED FACILITY DESIGN
Proposed expansion plans at the Westridge facilities call for 3 new berths to be
constructed in naturally deep water. The berths are numbered from west to east, with Berths 1
and 2 in a back‐to‐back configuration. Each berth has three mooring dolphins forward and
three aft. The forward mooring dolphins for Berths 1 and 2 are combined structures whereas
for the aft mooring dolphins they are separate structures to accommodate the roadway and
piperack that passes between them.

Trans Mountain Passing Ship Analysis 12
Trans Mountain Pipeline LP – Westridge Marine Terminal August 25, 2014
Berth 3 represents the westernmost berth of the proposed expansion plan and has a
mooring arrangement similar to that of Berth 2.
All berths moor vessels at a heading of 288 degrees true.
2.4 DESIGN VESSELS
The tanker vessels used for this analysis were based on characteristics and dimensions
documented in M&N’s mooring and berthing analysis submitted in November of 2012. PMV
identified which vessel classifications should be used for the passing vessel. M&N selected
representative vessels from those classes and obtained their principal characteristics from
published ship databases such as Clarkson’s Register. Table 2‐1 presents a summary of the
moored design vessel characteristics used. Passing vessel effects on deep draft, loaded ships is
greater than on ballasted ships due to reduced underkeel clearance and greater submerged hull
areas. Therefore, only loaded condition tankers were evaluated in this preliminary report.
Table 2‐1: Moored Vessel Characteristics
Vessel Panamax Aframax
Name Torm Ottowa
Nevisky Prospect
DWT 70,297 117,654
LOA (m) 228.0 250.00
LBP (m) 219.0 239.00
Beam (m) 32.23 44.00
Draft Loaded (m) 13.82 15.10
Displacement Loaded (mt) 84,204 136,337
Side Windage Loaded (m2) 1,378 2,177
Frontal Windage Loaded (m2) 448 800
Mooring Line Type Steel‐Wire Steel‐Wire
Mooring Line MBL (mt) 79 83
Mooring Tail Type Nylon Polyester
Mooring Tail Length (m)/ MBL (mt) 11m/ 120mt
11m/ 116mt
Vessel characteristics for the passing vessel were taken from the presentation given by
PMV during the April 7 meeting with KMC and M&N. Table 2‐2 provides the modeled passing
vessel characteristics.

Trans Mountain Passing Ship Analysis 13
Trans Mountain Pipeline LP – Westridge Marine Terminal August 25, 2014
Table 2‐2: Passing Vessel Characteristics
Vessel Bulk Carrier
Name Shi Dai 20
Gross Registered Tonnage 64,654
Deadweight (mt) 115,664
LOA (m) 254.0
Beam (m) 43
Draft (m) 13.5
Transit Speed (kts) 10
2.5 EXISTING TRAFFIC
Historical AIS ship movement data was accessed to identify the current traffic patterns
and existing beam to beam clearances of navigation traffic from the proposed Westridge
berths. Figure 2‐5 displays recent vessel traffic around the proposed Westridge facilities for
ships with a length overall greater than 150 meters and a speed over ground greater than or
equal to 6 knots. With the exception of vessels passing immediately over the new facility
locations, the current traffic separation scheme keeps inbound traffic more than 220 meters
away from the berth 3; therefore the proposed 190 meter traffic separation scheme used in
this analysis is considered conservative. Vessel speed over ground is displayed in Figure 2‐6.

Trans Mountain Passing Ship Analysis 14
Trans Mountain Pipeline LP – Westridge Marine Terminal August 25, 2014
Figure 2‐5: Recent Vessel Traffic (LOA > 150m SOG >= 6 kts) around the Westridge Facilities

Trans Mountain Passing Ship Analysis 15
Trans Mountain Pipeline LP – Westridge Marine Terminal August 25, 2014
Figure 2‐6: Vessel Speed Over Ground around the Westridge Facilities (Limited to Channel Traffic)
2.6 PROPOSED VESSEL TRAFFIC CORRIDOR
Port Metro Vancouver has reviewed the proposed Westridge Marine Terminal
expansion and proposes defining a corridor within the Central Harbour for ship traffic to
increase the separation distances and safety for large vessels passing the terminal. The
proposed traffic corridor is shown in Figure 2‐7. The minimum distance between inbound
traffic within the corridor and a moored vessel at Berth 3 of the proposed Westridge facilities is
about 190 meters (Figure 2‐7). The proposed corridor will require adjusting some of the
existing designated anchorages in the area. The proposed corridor and anchorage locations are
considered draft locations for the purpose of doing this analysis, subject to finalized design to
be carried out by PMV at a later date.

Trans Mountain Passing Ship Analysis 16
Trans Mountain Pipeline LP – Westridge Marine Terminal August 25, 2014
Figure 2‐7: PMV’s Proposed Traffic Channel Alignment near Westridge Terminal

Trans Mountain Passing Ship Analysis 17
Trans Mountain Pipeline LP – Westridge Marine Terminal August 25, 2014
3. PASSING VESSEL ANALYSIS
When transiting ships pass at high speed and/or in close proximity to a moored vessel,
the moored vessel can experience transient dynamic mooring forces that can cause adverse
ship movements and broken mooring lines. The forces imparted to the moored vessel are
dependent on the distance to the passing vessel, the speed of the passing vessel, the underkeel
clearance of both vessels, the displacement of the two vessels, hull geometry, channel bank
geometry, and channel cross section. A representation of a passing vessel scenario is given in
Figure 3‐1 below.
Figure 3‐1: Typical representation of a passing vessel scenario
The primary loads imposed by the passing ship are longitudinal and lateral forces as well
as a moment on the moored vessel, although forces are developed in all six degrees of
freedom. Idealized forces based on a deep, open‐water passing scenario are shown in Figure
3‐2 and demonstrate that a relatively large, but transient load is experienced by the moored
vessel. A surge force pulls the moored vessel aft then pushes forward as the vessel in transit
passes while a suction force pulls the moored vessel away from the berth as the passing vessel
is adjacent to the moored vessel. The curves in Figure 3‐2 represent non‐dimensional forces
experienced at unconfined deepwater conditions. For shallow water and confined‐channel
conditions, more detailed methods are required. The method of passing vessel forces
calculation used in this report is based on the ROPES numerical model which is based on
computational methods developed by Pinkster Marine Hydrodynamics.

Trans Mountain Passing Ship Analysis 18
Trans Mountain Pipeline LP – Westridge Marine Terminal August 25, 2014
Figure 3‐2: Non‐dimensional results for a passing vessel scenario (Wang, 1975)
To fully examine practical problems, however, it is necessary to conduct a dynamic
analysis that simulates the dynamic response of a moored vessel to the imposed hydrodynamic
forces. The hydrodynamic forces are normally computed assuming the moored vessel hull is
rigid. In reality, the moored ship is relatively free to move somewhat in response to the passing
ship forces and will be restrained by mooring lines and fenders. The moored vessel may
experience loads less than, equal to, or larger than the imposed passing ship forces depending
on all the factors that dictate dynamic response (i.e. ship mass, system damping, mooring
stiffness, etc.). Given the propensity for vessels to respond dynamically in most cases where
passing problems have been experienced, M&N has found that dynamic analysis is imperative
for practical applications, rather than static analysis.
The effects of the passing ship forces were examined using the TERMSIM computer
program which is a six degree‐of‐freedom, time‐domain model for mooring dynamics
developed by the Maritime Research Institute of the Netherlands (MARIN). The six degree of
freedom hydrodynamic characteristics of the ship used in the computer model are based on a
series of tanker physical model tests. The model simulates the vessel response to incident
waves, winds, and currents including damping and shallow water effects. The wind coefficients
are based on Oil Companies International Marine Forum (OCIMF) recommendations. The forces
generated by the passing vessel model may be directly applied on the moored vessel. TERMSIM
computes the at‐berth motions in all six degrees of freedom as well as the loads in the mooring
lines and fenders. The program includes a database of the non‐linear load‐extension/deflection
curves for typical mooring line and fender types. The user may also define the load‐deflection
curves manually. The output of the simulation is time trace signals of all motions and loads
calculated in the mooring system.

Trans Mountain Passing Ship Analysis 19
Trans Mountain Pipeline LP – Westridge Marine Terminal August 25, 2014
3.1 ROPES
The ROPES 3‐d diffraction model accounts for the classical suction forces which are a result
of the interaction of the passing ship's draw down wave system with the port geometry. The model
uses a potential flow calculation to compute the pressure fields and induced forces due to the
passing ship. The model separately calculates the diffraction effects of channel and basin geometry
to compute long‐period disturbances in the channel. The effects of the potential flow and
diffraction effects are then superposed to compute the total velocities, pressures, and fluid forces
on the moored vessel. The model has been validated against scale and prototype scale
measurements by the ROPES Joint Industry Project.
3.1.1 Passing Vessel Simulated Scenarios
Passing vessels forces were assessed for the moored design vessels identified above.
The largest forces will be generated by large ships with low under‐keel clearance; therefore, all
ships were assumed at maximum draft. The analysis assumed that the passing ship travels at 10
knots along the proposed navigational channel realignment.
Bathymetric setup of the models mimicked the description provided in Section 2.2
above: a side slope of 8:1 was created from the water surface down to an elevation of ‐20
meters; a second slope of 30:1 was modeled from ‐20 meters to ‐30 meters. Bathymetry north
of the transiting vessel was not modeled as local depths were deep enough and bathymetric
slopes to the north were far enough away not to affect loads generated on either the passing
ship or moored tankers.

Trans Mountain Passing Ship Analysis 20
Trans Mountain Pipeline LP – Westridge Marine Terminal August 25, 2014
Figure 3‐3: Snapshot of the ROPES model developed for moored Aframax tankers at Berth 3
In order to capture the effects of a stemming current on the passing vessel forces, the
transiting vessel speed was increased to 11 knots to increase the apparent hydrodynamic speed
of a passing vessel and generate forces related to such an event on the moored vessel.
Simulated scenarios are summarized in table Table 3‐1 below.
Table 3‐1: Simulated Passing Vessel Scenarios
Run Number Berth Number Moored Ship Passing Distance Passing Speed
1 1 Panamax 440 m 10 kts
2 1 Panamax 440 m 11 kts
3 2 Aframax 320 m 10 kts
4 2 Aframax 320 m 11 kts
5 3 Aframax 190 m 10 kts
6 3 Aframax 190 m 11 kts
3.1.2 Results
The loads generated in the passing ship simulations are presented below for each berth.

Trans Mountain Passing Ship Analysis 21
Trans Mountain Pipeline LP – Westridge Marine Terminal August 25, 2014
BERTH 1
Figure 3‐4: Modeled Surge Forces on the Panamax Tanker at Berth 1
Figure 3‐5: Modeled Sway Forces on the Panamax Tanker at Berth 1
0 50 100 150 200 250 300 350 400−40
−30
−20
−10
0
10
20
30
40
Sur
ge F
orce
, kN
Sumulation Time, seconds
10 kts11 kts
0 50 100 150 200 250 300 350 400−100
−50
0
50
Sw
ay F
orce
, kN
Sumulation Time, seconds
10 kts11 kts

Trans Mountain Passing Ship Analysis 22
Trans Mountain Pipeline LP – Westridge Marine Terminal August 25, 2014
Figure 3‐6: Modeled Heave Forces on the Panamax Tanker at Berth 1
Figure 3‐7: Modeled Roll Forces on the Panamax Tanker at Berth 1
0 50 100 150 200 250 300 350 400−1000
−500
0
500
1000
1500
2000
Hea
ve F
orce
, kN
Sumulation Time, seconds
10 kts11 kts
0 50 100 150 200 250 300 350 400−150
−100
−50
0
50
100
Rol
l For
ce, k
N−
m
Sumulation Time, seconds
10 kts11 kts
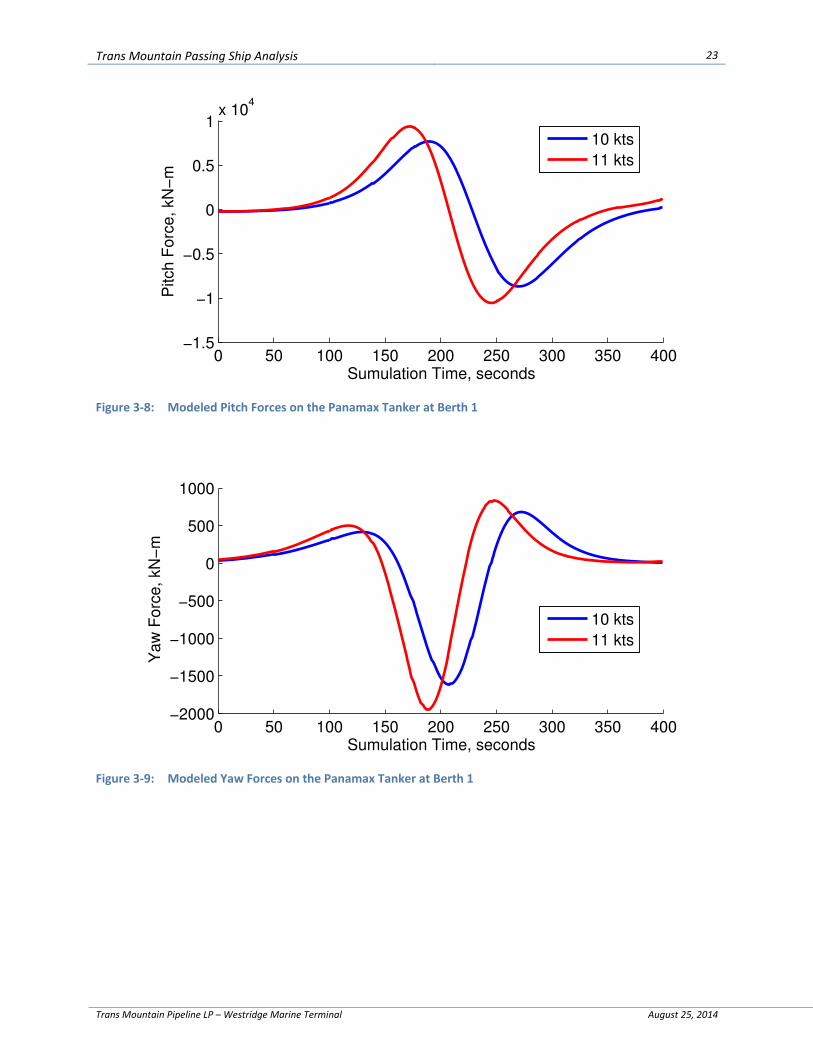
Trans Mountain Passing Ship Analysis 23
Trans Mountain Pipeline LP – Westridge Marine Terminal August 25, 2014
Figure 3‐8: Modeled Pitch Forces on the Panamax Tanker at Berth 1
Figure 3‐9: Modeled Yaw Forces on the Panamax Tanker at Berth 1
0 50 100 150 200 250 300 350 400−1.5
−1
−0.5
0
0.5
1x 10
4
Pitc
h F
orce
, kN
−m
Sumulation Time, seconds
10 kts11 kts
0 50 100 150 200 250 300 350 400−2000
−1500
−1000
−500
0
500
1000
Yaw
For
ce, k
N−
m
Sumulation Time, seconds
10 kts11 kts

Trans Mountain Passing Ship Analysis 24
Trans Mountain Pipeline LP – Westridge Marine Terminal August 25, 2014
BERTH 2
Figure 3‐10: Modeled Surge Forces on the Aframax Tanker at Berth 2
Figure 3‐11: Modeled Sway Forces on the Aframax Tanker at Berth 2
0 50 100 150 200 250 300 350 400−150
−100
−50
0
50
100
150S
urge
For
ce, k
N
Sumulation Time, seconds
10 kts11 kts
0 50 100 150 200 250 300 350 400−400
−300
−200
−100
0
100
200
Sw
ay F
orce
, kN
Sumulation Time, seconds
10 kts11 kts

Trans Mountain Passing Ship Analysis 25
Trans Mountain Pipeline LP – Westridge Marine Terminal August 25, 2014
Figure 3‐12: Modeled Heave Forces on the Aframax Tanker at Berth 2
Figure 3‐13: Modeled Roll Forces on the Aframax Tanker at Berth 2
0 50 100 150 200 250 300 350 400−2000
−1000
0
1000
2000
3000
Hea
ve F
orce
, kN
Sumulation Time, seconds
10 kts11 kts
0 50 100 150 200 250 300 350 400−400
−200
0
200
400
600
800
1000
Rol
l For
ce, k
N−
m
Sumulation Time, seconds
10 kts11 kts

Trans Mountain Passing Ship Analysis 26
Trans Mountain Pipeline LP – Westridge Marine Terminal August 25, 2014
Figure 3‐14: Modeled Pitch Forces on the Aframax Tanker at Berth 2
Figure 3‐15: Modeled Yaw Forces on the Aframax Tanker at Berth 2
0 50 100 150 200 250 300 350 400−4
−2
0
2
4x 10
4
Pitc
h F
orce
, kN
−m
Sumulation Time, seconds
10 kts11 kts
0 50 100 150 200 250 300 350 400−1
−0.5
0
0.5
1x 10
4
Yaw
For
ce, k
N−
m
Sumulation Time, seconds
10 kts11 kts

Trans Mountain Passing Ship Analysis 27
Trans Mountain Pipeline LP – Westridge Marine Terminal August 25, 2014
BERTH 3
Figure 3‐16: Modeled Surge Forces on the Aframax Tanker at Berth 3
Figure 3‐17: Modeled Sway Forces on the Aframax Tanker at Berth 3
0 50 100 150 200 250 300 350 400−400
−200
0
200
400S
urge
For
ce, k
N
Sumulation Time, seconds
10 kts11 kts
0 50 100 150 200 250 300 350 400−1500
−1000
−500
0
500
Sw
ay F
orce
, kN
Sumulation Time, seconds
10 kts11 kts

Trans Mountain Passing Ship Analysis 28
Trans Mountain Pipeline LP – Westridge Marine Terminal August 25, 2014
Figure 3‐18: Modeled Heave Forces on the Aframax Tanker at Berth 3
Figure 3‐19: Modeled Roll Forces on the Aframax Tanker at Berth 3
0 50 100 150 200 250 300 350 400−6000
−4000
−2000
0
2000
4000
Hea
ve F
orce
, kN
Sumulation Time, seconds
10 kts11 kts
0 50 100 150 200 250 300 350 400−2000
−1000
0
1000
2000
3000
Rol
l For
ce, k
N−
m
Sumulation Time, seconds
10 kts11 kts

Trans Mountain Passing Ship Analysis 29
Trans Mountain Pipeline LP – Westridge Marine Terminal August 25, 2014
Figure 3‐20: Modeled Pitch Forces on the Aframax Tanker at Berth 3
Figure 3‐21: Modeled Yaw Forces on the Aframax Tanker at Berth 3
3.2 TERMSIM
The analysis of the mooring forces was computed using the mooring model TERMSIM.
TERMSIM is a time domain program, developed by Maritime Research Institute Netherlands
(MARIN), and is used to analyze the behavior of a moored vessel subject to wind, waves, and
0 50 100 150 200 250 300 350 400−1
−0.5
0
0.5
1
1.5x 10
5
Pitc
h F
orce
, kN
−m
Sumulation Time, seconds
10 kts11 kts
0 50 100 150 200 250 300 350 400−4
−2
0
2
4x 10
4
Yaw
For
ce, k
N−
m
Sumulation Time, seconds
10 kts11 kts

Trans Mountain Passing Ship Analysis 30
Trans Mountain Pipeline LP – Westridge Marine Terminal August 25, 2014
current. The mooring system may be a Single Point Mooring (SPM), a Multi Buoy Mooring
(MBM) or a Jetty terminal, as in the case of the proposed Westridge facilities. The program
simulates the mooring loads and vessel motions when the system is exposed to operational
environmental conditions.
Vessel: The vessel is a generic tanker/bulker of regular dimensions. The hydrodynamic
data for the vessel is based on the scale model tests of tanker‐shaped hulls conducted at
MARIN. Based on the main particulars of the bulker (e.g. length, breadth, draft, water depth,
and displacement), a selection from the database is made and scaled to match the design vessel
and site conditions. A user‐defined vessel can also be input in the program.
Environment: The environmental conditions may include steady currents, steady or
irregular wind fields, and/or swell and long crested irregular waves from arbitrary directions.
Several spectral formulations for the wind, waves and swell are available. The program is
capable of simulating vessels in both shallow and deep water. Environmental conditions were
kept as static inputs to evaluate the effects of the passing vessel.
Databases: Several databases are delivered with the program.
‐Mooring elements: The mooring element database contains particulars of common
offshore chains, steel wires, synthetic ropes and fenders. For synthetic ropes, load‐elongation
characteristics are included. The load‐compression curves for various fender types are included
in the database. User‐defined characteristics of lines and fenders may also be used.
‐OCIMF wind and current coefficients: This database contains non‐dimensional
wind and current force/moment coefficients for calculation of wind and current loads on
tanker‐shaped vessels (valid for bulkers).
‐OCIMF diffraction data: The new OCIMF diffraction database contains the results of
diffraction analyses for several vessel configurations.
‐Hydrodynamic reaction coefficients: This database contains non‐dimensional
coefficients for use in the formulation of hydrodynamic reaction forces.
Output: The output of each simulation consists of a binary file containing all samples of
the calculated signals. The signals include vessel motions, loads in the mooring legs and other
measures of mooring system behavior. In addition, an output file is produced summarizing the
maximum, minimum, and mean forces and motions, as well as factors of safety. A
comprehensive data processing package is delivered with the program to view, plot and print
the results.

Trans Mountain Passing Ship Analysis 31
Trans Mountain Pipeline LP – Westridge Marine Terminal August 25, 2014
3.2.1 Environmental Parameters
The following environmental conditions were utilized in the mooring model:
Wind: Static winds were run at every 15° at 25 knots. No wind scenarios were also conducted to evaluate if wind forces on the tankers damp out loads induced by the passing vessel.
Current: A one knot current was applied to those simulations in which the passing vessel forces were simulated for a transit during a stemming tide. This current was applied 10° off of the starboard quarter of the vessels, in agreement with hydrodynamic model results developed for previous studies related to the new facility design.
3.2.2 Berth Geometries and Model Setup
All mooring models were set up to be identical to Optimoor mooring analyses
developed in 2012. For reference, figures used to represent the mooring arrangements in the
2012 report are reproduced below.
Figure 3‐22: Panamax Mooring Arrangement at Berth 1

Trans Mountain Passing Ship Analysis 32
Trans Mountain Pipeline LP – Westridge Marine Terminal August 25, 2014
Figure 3‐23: Aframax Mooring Arrangement at Berths 2 and 3
3.2.3 Mooring Evaluation Criteria
MOORING LINE TENSION LIMITS
Per recommendations provided by OCIMF, the allowable safe working load (SWL) in
mooring lines is set at 55% of the minimum breaking load (MBL) for the steel wire lines found
on tankers. Though each vessel deploys lines with 11 meter synthetic tails, the loading the steel
lines will control the allowable safe working load limits.
FENDERS
Fenders were selected for the proposed facility based on requirements set by a berthing
energy study conducted in 2012. Trelleborg Supercone Fenders SCN2000 (E1.0 rubber grade)
were selected with a rated energy capacity of 305 t‐m and a rated reaction of 295 mt.
Acceptable fender loadings are those at or below the rate reaction of the fender at design
performance (2894 kN).
MOTIONS
PIANC guidelines set envelopes for tanker motions at berth based on loading arm travel
restrictions; these criteria allow for 3 meters of peak to peak motion in surge and 3 meters of
zero to peak motion in sway for oil tankers.
3.2.4 Results
The following sections present the results of the dynamic mooring analyses for each
modeled berth location. Tables are developed in an effort to evaluate the loading in the
mooring lines (and hooks), bollards, fenders, and examine the induced vessel motions.
Directions presented below are referenced to true North. Mooring lines are numbered
sequentially from the bow to the stern. Bollard load components are as follows: X‐directional
loading is parallel with the fender line, Y‐directional loading is perpendicular to the fender line,
and Z‐directional loading is along the vertical axis of the bollard. Values presented for the
magnitudes of vessel motions represent the envelope of motions during simulations; i.e. the
amplitude between the maximum and minimum excursions of the vessel COG over the entire
simulation.

Trans Mountain Passing Ship Analysis 33
Trans Mountain Pipeline LP – Westridge Marine Terminal August 25, 2014
BERTH 1: 10 KT PASSING SHIP
Table 3‐2: Mooring Line and Hook Loads for Panamax Bulker at Berth 1 with 10 kt Passing Vessel Speed
Mooring Line
Max Load, kN
%MBL Wind Speed, m/s / Direction, deg Current Speed, m/s, Direction, deg
1 103 14.20% 12.9/80.0 0.0/120.0
2 103 14.20% 12.9/95.0 0.0/120.0
3 103 14.20% 12.9/80.0 0.0/120.0
4 103 14.20% 12.9/80.0 0.0/120.0
5 107 14.70% 12.9/140.0 0.0/120.0
6 107 14.80% 12.9/110.0 0.0/120.0
7 247 34.10% 12.9/290.0 0.0/120.0
8 247 34.00% 12.9/290.0 0.0/120.0
9 104 14.30% 12.9/200.0 0.0/120.0
10 104 14.30% 12.9/170.0 0.0/120.0
11 101 13.90% 12.9/200.0 0.0/120.0
12 101 13.90% 12.9/215.0 0.0/120.0

Trans Mountain Passing Ship Analysis 34
Trans Mountain Pipeline LP – Westridge Marine Terminal August 25, 2014
Table 3‐3: Bollard Loads for Panamax Bulker at Berth 1 with 10 kt Passing Vessel Speed
Bollard Max
Load, kN
Wind Speed, m/s /
Direction, deg
Current Speed, m/s,
Direction, deg
X‐Component,
kN
Y‐Component,
kN
Z‐Component,
kN
1 209 12.9/80.0 0.0/120.0 24 204 34
2 208 12.9/80.0 0.0/120.0 117 169 32
3 225 12.9/110.0 0.0/120.0 206 56 68
4 516 12.9/290.0 0.0/120.0 ‐479 120 148
5 211 12.9/170.0 0.0/120.0 104 179 40
6 204 12.9/200.0 0.0/120.0 160 123 26
Table 3‐4: Fender Loads for Panamax Bulker at Berth 1 with 10 kt Passing Vessel Speed
Fender Max
Load, kN%Rated
Rx
Wind Speed, m/s /
Direction, deg
Current Speed, m/s,
Direction, deg
1 389 13.40% 12.9/155.0 0.0/120.0
2 349 12.10% 12.9/ 5.0 0.0/120.0
3 325 11.20% 12.9/50.0 0.0/120.0
4 321 11.10% 12.9/50.0 0.0/120.0
Table 3‐5: Panamax Bulker Motions at Berth 1 with 10 kt Passing Vessel Speed
Motion Magnitude,
m/deg
Wind Speed, m/s /
Direction, deg
Current Speed, m/s,
Direction, deg
Surge 0.67 12.9/290.0 0.0/120.0
Sway 0.056 12.9/20.0 0.0/120.0
Heave 0.013 12.9/95.0 0.0/120.0
Roll 0.289 12.9/20.0 0.0/120.0
Pitch 0.004 12.9/245.0 0.0/120.0
BERTH 1: 11 KT PASSING SHIP

Trans Mountain Passing Ship Analysis 35
Trans Mountain Pipeline LP – Westridge Marine Terminal August 25, 2014
Table 3‐6: Mooring Line and Hook Loads for Panamax Bulker at Berth 1 with 11 kt Passing Vessel Speed
Mooring Line
Max Load, kN
%MBL
Wind Speed, m/s /
Direction, deg
Current Speed, m/s,
Direction, deg
1 103 14.20% 12.9/80.0 0.5/120.0
2 103 14.20% 12.9/65.0 0.5/120.0
3 103 14.20% 12.9/95.0 0.5/120.0
4 103 14.20% 12.9/95.0 0.5/120.0
5 107 14.70% 12.9/125.0 0.5/120.0
6 107 14.80% 12.9/95.0 0.5/120.0
7 257 35.40% 12.9/275.0 0.5/120.0
8 256 35.30% 12.9/275.0 0.5/120.0
9 104 14.30% 12.9/200.0 0.5/120.0
10 104 14.30% 12.9/185.0 0.5/120.0
11 101 13.90% 12.9/200.0 0.5/120.0
12 101 13.90% 12.9/170.0 0.5/120.0
Table 3‐7: Bollard Loads for Panamax Bulker at Berth 1 with 11 kt Passing Vessel Speed
Bollard Max
Load, kN
Wind Speed, m/s /
Direction, deg
Current Speed, m/s,
Direction, deg
X‐Component,
kN
Y‐Component,
kN
Z‐Component,
kN
1 209 12.9/65.0 0.5/120.0 24 204 34
2 208 12.9/95.0 0.5/120.0 117 169 32
3 225 12.9/95.0 0.5/120.0 206 56 68
4 535 12.9/275.0 0.5/120.0 ‐497 125 153
5 211 12.9/185.0 0.5/120.0 104 179 40
6 204 12.9/170.0 0.5/120.0 160 123 26
Table 3‐8: Fender Loads for Panamax Bulker at Berth 1 with 11 kt Passing Vessel Speed
Fender Max
Load, kN%Rated
Rx
Wind Speed, m/s /
Direction, deg
Current Speed, m/s,
Direction, deg
1 426 14.70% 12.9/155.0 0.5/120.0
2 346 12.00% 12.9/ 5.0 0.5/120.0
3 217 7.50% 12.9/50.0 0.5/120.0
4 180 6.20% 12.9/50.0 0.5/120.0

Trans Mountain Passing Ship Analysis 36
Trans Mountain Pipeline LP – Westridge Marine Terminal August 25, 2014
Table 3‐9: Panamax Bulker Motions at Berth 1 with 11 kt Passing Vessel Speed
Motion Magnitude,
m/deg
Wind Speed, m/s /
Direction, deg
Current Speed, m/s,
Direction, deg
Surge 0.689 12.9/275.0 0.5/120.0
Sway 0.048 12.9/20.0 0.5/120.0
Heave 0.038 12.9/200.0 0.5/120.0
Roll 0.249 12.9/35.0 0.5/120.0
Pitch 0.005 12.9/200.0 0.5/120.0

Trans Mountain Passing Ship Analysis 37
Trans Mountain Pipeline LP – Westridge Marine Terminal August 25, 2014
BERTH 2: 10 KT PASSING SHIP
Table 3‐10: Mooring Line and Hook Loads for Aframax Bulker at Berth 2 with 10 kt Passing Vessel Speed
Mooring Line
Max Load, kN
%MBL
Wind Speed, m/s /
Direction, deg
Current Speed, m/s,
Direction, deg
1 127 13.90% 12.9/290.0 0.0/120.0
2 128 14.00% 12.9/290.0 0.0/120.0
3 102 11.10% 12.9/185.0 0.0/120.0
4 103 11.20% 12.9/170.0 0.0/120.0
5 102 11.10% 12.9/185.0 0.0/120.0
6 102 11.10% 12.9/170.0 0.0/120.0
7 103 11.20% 12.9/185.0 0.0/120.0
8 177 19.30% 12.9/290.0 0.0/120.0
9 103 11.20% 12.9/80.0 0.0/120.0
10 103 11.20% 12.9/65.0 0.0/120.0
11 102 11.10% 12.9/80.0 0.0/120.0
12 102 11.10% 12.9/50.0 0.0/120.0
13 101 11.00% 12.9/80.0 0.0/120.0
14 101 11.00% 12.9/65.0 0.0/120.0
Table 3‐11: Bollard Loads for Aframax Bulker at Berth 2 with 10 kt Passing Vessel Speed
Bollard Max
Load, kN
Wind Speed, m/s /
Direction, deg
Current Speed, m/s,
Direction, deg
X‐Component,
kN
Y‐Component,
kN
Z‐Component,
kN
1 256 12.9/290.0 0.0/120.0 ‐128 ‐221 22
2 206 12.9/170.0 0.0/120.0 ‐16 ‐204 24
3 205 12.9/170.0 0.0/120.0 90 ‐183 24
4 207 12.9/185.0 0.0/120.0 202 ‐39 28
5 362 12.9/290.0 0.0/120.0 ‐337 ‐108 78
6 207 12.9/65.0 0.0/120.0 58 ‐197 29
7 407 12.9/50.0 0.0/120.0 236 ‐330 38
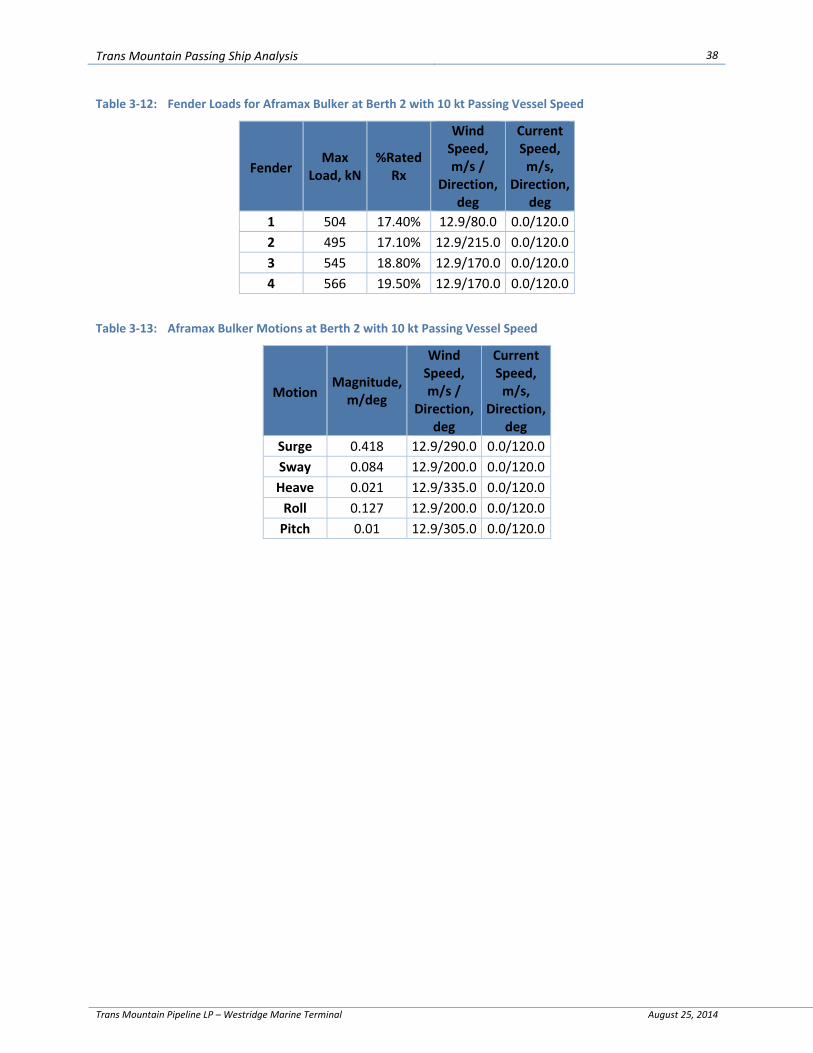
Trans Mountain Passing Ship Analysis 38
Trans Mountain Pipeline LP – Westridge Marine Terminal August 25, 2014
Table 3‐12: Fender Loads for Aframax Bulker at Berth 2 with 10 kt Passing Vessel Speed
Fender Max
Load, kN%Rated
Rx
Wind Speed, m/s /
Direction, deg
Current Speed, m/s,
Direction, deg
1 504 17.40% 12.9/80.0 0.0/120.0
2 495 17.10% 12.9/215.0 0.0/120.0
3 545 18.80% 12.9/170.0 0.0/120.0
4 566 19.50% 12.9/170.0 0.0/120.0
Table 3‐13: Aframax Bulker Motions at Berth 2 with 10 kt Passing Vessel Speed
Motion Magnitude,
m/deg
Wind Speed, m/s /
Direction, deg
Current Speed, m/s,
Direction, deg
Surge 0.418 12.9/290.0 0.0/120.0
Sway 0.084 12.9/200.0 0.0/120.0
Heave 0.021 12.9/335.0 0.0/120.0
Roll 0.127 12.9/200.0 0.0/120.0
Pitch 0.01 12.9/305.0 0.0/120.0

Trans Mountain Passing Ship Analysis 39
Trans Mountain Pipeline LP – Westridge Marine Terminal August 25, 2014
BERTH 2: 11 KT PASSING SHIP
Table 3‐14: Mooring Line and Hook Loads for Aframax Bulker at Berth 2 with 11 kt Passing Vessel Speed
Mooring Line
Max Load, kN
%MBL
Wind Speed, m/s /
Direction, deg
Current Speed, m/s,
Direction, deg
1 129 14.00% 12.9/290.0 0.5/120.0
2 129 14.10% 12.9/290.0 0.5/120.0
3 103 11.30% 12.9/155.0 0.5/120.0
4 106 11.50% 12.9/155.0 0.5/120.0
5 102 11.10% 12.9/170.0 0.5/120.0
6 102 11.10% 12.9/170.0 0.5/120.0
7 103 11.20% 12.9/170.0 0.5/120.0
8 168 18.30% 12.9/290.0 0.5/120.0
9 103 11.20% 12.9/65.0 0.5/120.0
10 103 11.20% 12.9/80.0 0.5/120.0
11 102 11.10% 12.9/65.0 0.5/120.0
12 102 11.10% 12.9/80.0 0.5/120.0
13 101 11.00% 12.9/65.0 0.5/120.0
14 101 11.00% 12.9/80.0 0.5/120.0
Table 3‐15: Bollard Loads for Aframax Bulker at Berth 2 with 11 kt Passing Vessel Speed
Bollard Max
Load, kN
Wind Speed, m/s /
Direction, deg
Current Speed, m/s,
Direction, deg
X‐Component,
kN
Y‐Component,
kN
Z‐Component,
kN
1 259 12.9/290.0 0.5/120.0 ‐129 ‐224 22
2 211 12.9/155.0 0.5/120.0 ‐16 ‐208 24
3 205 12.9/170.0 0.5/120.0 90 ‐183 24
4 207 12.9/170.0 0.5/120.0 202 ‐39 28
5 344 12.9/290.0 0.5/120.0 ‐320 ‐103 74
6 207 12.9/65.0 0.5/120.0 58 ‐197 29
7 407 12.9/65.0 0.5/120.0 236 ‐330 38

Trans Mountain Passing Ship Analysis 40
Trans Mountain Pipeline LP – Westridge Marine Terminal August 25, 2014
Table 3‐16: Fender Loads for Aframax Bulker at Berth 2 with 11 kt Passing Vessel Speed
Fender Max
Load, kN%Rated
Rx
Wind Speed, m/s /
Direction, deg
Current Speed, m/s,
Direction, deg
1 478 16.50% 12.9/80.0 0.5/120.0
2 507 17.50% 12.9/215.0 0.5/120.0
3 647 22.40% 12.9/170.0 0.5/120.0
4 698 24.10% 12.9/170.0 0.5/120.0
Table 3‐17: Aframax Bulker Motions at Berth 2 with 11 kt Passing Vessel Speed
Motion Magnitude,
m/deg
Wind Speed, m/s /
Direction, deg
Current Speed, m/s,
Direction, deg
Surge 0.386 12.9/290.0 0.5/120.0
Sway 0.091 12.9/200.0 0.5/120.0
Heave 0.045 12.9/110.0 0.5/120.0
Roll 0.136 12.9/200.0 0.5/120.0
Pitch 0.012 12.9/335.0 0.5/120.0

Trans Mountain Passing Ship Analysis 41
Trans Mountain Pipeline LP – Westridge Marine Terminal August 25, 2014
BERTH 3: 10 KT PASSING SHIP
Table 3‐18: Mooring Line and Hook Loads for Aframax Bulker at Berth 3 with 10 kt Passing Vessel Speed
Mooring Line
Max Load, kN
%MBL
Wind Speed, m/s /
Direction, deg
Current Speed, m/s,
Direction, deg
1 151 16.40% 12.9/320.0 0.0/120.0
2 153 16.70% 12.9/320.0 0.0/120.0
3 113 12.30% 12.9/155.0 0.0/120.0
4 114 12.40% 12.9/155.0 0.0/120.0
5 108 11.80% 12.9/125.0 0.0/120.0
6 108 11.80% 12.9/125.0 0.0/120.0
7 109 11.90% 12.9/80.0 0.0/120.0
8 317 34.60% 12.9/320.0 0.0/120.0
9 104 11.30% 12.9/65.0 0.0/120.0
10 104 11.30% 12.9/65.0 0.0/120.0
11 104 11.30% 12.9/80.0 0.0/120.0
12 103 11.30% 12.9/80.0 0.0/120.0
13 103 11.20% 12.9/80.0 0.0/120.0
14 103 11.20% 12.9/80.0 0.0/120.0
Table 3‐19: Bollard Loads for Aframax Bulker at Berth 3 with 10 kt Passing Vessel Speed
Bollard Max
Load, kN
Wind Speed, m/s /
Direction, deg
Current Speed, m/s,
Direction, deg
X‐Component,
kN
Y‐Component,
kN
Z‐Component,
kN
1 305 12.9/320.0 0.0/120.0 ‐152 ‐263 26
2 228 12.9/155.0 0.0/120.0 ‐17 ‐225 26
3 218 12.9/125.0 0.0/120.0 96 ‐194 26
4 220 12.9/80.0 0.0/120.0 215 ‐41 30
5 650 12.9/320.0 0.0/120.0 ‐604 ‐194 140
6 209 12.9/65.0 0.0/120.0 59 ‐199 30
7 414 12.9/80.0 0.0/120.0 240 ‐336 39

Trans Mountain Passing Ship Analysis 42
Trans Mountain Pipeline LP – Westridge Marine Terminal August 25, 2014
Table 3‐20: Fender Loads for Aframax Bulker at Berth 3 with 10 kt Passing Vessel Speed
Fender Max
Load, kN%Rated
Rx
Wind Speed, m/s /
Direction, deg
Current Speed, m/s,
Direction, deg
1 514 17.80% 12.9/ 5.0 0.0/120.0
2 501 17.30% 12.9/215.0 0.0/120.0
3 572 19.80% 12.9/170.0 0.0/120.0
4 601 20.80% 12.9/170.0 0.0/120.0
Table 3‐21: Aframax Bulker Motions at Berth 3 with 10 kt Passing Vessel Speed
Motion Magnitude,
m/deg
Wind Speed, m/s /
Direction, deg
Current Speed, m/s,
Direction, deg
Surge 0.827 12.9/320.0 0.0/120.0
Sway 0.086 12.9/200.0 0.0/120.0
Heave 0.045 12.9/185.0 0.0/120.0
Roll 0.13 12.9/200.0 0.0/120.0
Pitch 0.028 12.9/185.0 0.0/120.0

Trans Mountain Passing Ship Analysis 43
Trans Mountain Pipeline LP – Westridge Marine Terminal August 25, 2014
BERTH 3: 10 KT PASSING SHIP
Table 3‐22: Mooring Line and Hook Loads for Aframax Bulker at Berth 3 with 11 kt Passing Vessel Speed
Mooring Line
Max Load, kN
%MBL
Wind Speed, m/s /
Direction, deg
Current Speed, m/s,
Direction, deg
1 167 18.20% 12.9/350.0 0.5/120.0
2 170 18.50% 12.9/350.0 0.5/120.0
3 130 14.10% 12.9/140.0 0.5/120.0
4 129 14.10% 12.9/140.0 0.5/120.0
5 131 14.20% 12.9/20.0 0.5/120.0
6 131 14.20% 12.9/ 5.0 0.5/120.0
7 126 13.80% 12.9/95.0 0.5/120.0
8 342 37.20% 12.9/350.0 0.5/120.0
9 103 11.20% 12.9/65.0 0.5/120.0
10 103 11.20% 12.9/50.0 0.5/120.0
11 103 11.20% 12.9/65.0 0.5/120.0
12 102 11.10% 12.9/65.0 0.5/120.0
13 101 11.00% 12.9/65.0 0.5/120.0
14 101 11.00% 12.9/80.0 0.5/120.0
Table 3‐23: Bollard Loads for Aframax Bulker at Berth 3 with 11 kt Passing Vessel Speed
Bollard Max
Load, kN
Wind Speed, m/s /
Direction, deg
Current Speed, m/s,
Direction, deg
X‐Component,
kN
Y‐Component,
kN
Z‐Component,
kN
1 338 12.9/350.0 0.5/120.0 ‐168 ‐292 29
2 261 12.9/140.0 0.5/120.0 ‐20 ‐258 30
3 263 12.9/ 5.0 0.5/120.0 116 ‐234 31
4 255 12.9/95.0 0.5/120.0 248 ‐47 35
5 700 12.9/350.0 0.5/120.0 ‐651 ‐209 150
6 207 12.9/50.0 0.5/120.0 58 ‐197 29
7 409 12.9/65.0 0.5/120.0 237 ‐331 38

Trans Mountain Passing Ship Analysis 44
Trans Mountain Pipeline LP – Westridge Marine Terminal August 25, 2014
Table 3‐24: Fender Loads for Aframax Bulker at Berth 3 with 11 kt Passing Vessel Speed
Fender Max
Load, kN%Rated
Rx
Wind Speed, m/s /
Direction, deg
Current Speed, m/s,
Direction, deg
1 643 22.20% 12.9/ 5.0 0.5/120.0
2 526 18.20% 12.9/260.0 0.5/120.0
3 674 23.30% 12.9/170.0 0.5/120.0
4 732 25.30% 12.9/170.0 0.5/120.0
Table 3‐25: Aframax Bulker Motions at Berth 3 with 11 kt Passing Vessel Speed
Motion Magnitude,
m/deg
Wind Speed, m/s /
Direction, deg
Current Speed, m/s,
Direction, deg
Surge 0.949 12.9/ 5.0 0.5/120.0
Sway 0.123 12.9/ 5.0 0.5/120.0
Heave 0.072 12.9/185.0 0.5/120.0
Roll 0.138 12.9/200.0 0.5/120.0
Pitch 0.034 12.9/200.0 0.5/120.0

Trans Mountain Passing Ship Analysis 45
Trans Mountain Pipeline LP – Westridge Marine Terminal August 25, 2014
4. CONCLUSIONS AND RECOMMENDATIONS
Passing vessel analysis at the three proposed berths revealed that the proposed
realigned channel provides ample clearance between transiting and moored vessels. Peak surge
forces induced on the loaded Aframax tanker at berth 3 were about 400 kN (40 mt) for the
transiting bulker making 10 knots against a 1 knot stemming current. Coupling these passing
vessel forces with static winds and currents did not overstrain the planned mooring
arrangements and their related equipment. The largest line loadings were observed in the
shortest forward spring lines when they were resisting the initial surge forward induced by the
passing vessel.
Peak to Peak motions of all vessels at the berth were minimal and well within PIANC
recommended envelopes. All lines and fenders maintained loading safety factors well below
the suggested OCIMF criteria for moored tankers at berth.
The study also serves to illustrate the sensitivity of passing vessel forces to the vessel
speeds; calculated loads were about 30% higher for the 11 knot simulations than those of the
10 knot. Potential flow theory demonstrates that changes in the modeled ships’ draft,
displacement, passing distance, and observed speed will greatly affect the observed forces on
both vessels. Bathymetric effects also greatly contribute to these effects, but the bathymetry is
deep and mildly sloping around the Westridge facility so as to provide ample under keel
clearance and minimal amplification to passing vessel forces.
Moffatt and Nichol does not think it is warranted to repeat this analysis for transits at a
higher speed, as it seems unlikely that deep draft vessels would exceed 10 kts at engine settings
comfortable for harbour transit. Should vessels larger than those considered in the report call
at facilities east of Westridge, it would be prudent to verify that these ships will not strain the
proposed tanker moorings beyond acceptable limits.
While the layout of the proposed new Westridge Marine Terminal is still being
optimized, it should not be necessary to repeat this analysis for the final layout, provided that
the final configuration is no closer to the vessel corridor than 190m. Similarly, should PMV
decide to realign the channel adjacent to the Westridge facilities so as to bring inbound traffic
closer to the tanker berths, reanalysis of the passing vessel effects at that time would be
warranted.

Trans Mountain Passing Ship Analysis 46
Trans Mountain Pipeline LP – Westridge Marine Terminal August 25, 2014
5. REFERENCES
Kriebel, D., 2005 “Mooring Loads due to Parallel Passing Ships,” Technical Report TR‐
6056‐OCN, Naval Facilities Engineering Service Center.
Muga, B. and Fang, S., 1975 “Passing Ship Effects – From Theory and Experiment,” OTC
16719, Offshore Technology Conference, ASCE.
OCIMF, 2008, “Mooring Equipment Guidelines, 3rd Edition,” London, United Kingdom.
PIANC, 1995 ‘Criteria for Movements of Moored Ships in Harbours ‐ a Practical Guide,’
Supplement to Bulletin nr. 88, PTC2 report of WG 24, October.
Seelig, W., 2001, “Passing Ship Effects on Moored Ships,” Technical Memorandum TM‐
6027‐OCN, Facilities Engineering Service Center.
Wang, S., 1975, “Dynamic Effects of Ship Passage on Moored Vessels,” Journal of
Waterway, Port, Coastal and Ocean Engineering, Harbour and Coastal Division, ASCE.
Appendix D Navigation and Safety Plan


t
NAVIGATION AND NAVIGATION SAFETY PLAN
FOR THE TRANS MOUNTAIN PIPELINE ULC
TRANS MOUNTAIN EXPANSION PROJECT NEB CONDITION 48
April 2017 REV 1
01-13283-GG-0000-CHE-RPT-0010 R1
Prepared for:
Trans Mountain Pipeline ULC Kinder Morgan Canada Inc. Suite 2700, 300 – 5th Avenue S.W. Calgary, Alberta T2P 5J2 Ph: 403-514-6400

Trans Mountain Expansion Project
Guide to the Environmental Plans
Environmental Plans
Volume 1 – Temporary Construction Lands and Infrastructure Environmental Protection Plan Volume 2 – Pipeline Environmental Protection Plan Volume 3 – Facilities Environmental Protection Plan Volume 4 – Westridge Marine Terminal Environmental Protection Plan Volume 5 – Reactivation Environmental Protection Plan Volume 6 – Environmental Management Plans Volume 7 – Resource-Specific Mitigation Tables Volume 8 – Environmental Alignment Sheets Volume 9 – Burnaby Mountain Tunneling Environmental Protection Plan Volume 10 – Power Lines Environmental Protection Plans
This plan forms part of Volume 6 and is located:
Volume 6 – Environmental Management Plans
Section 1 – Organizational Structure Section 2 – Socio–Economic Management Section 3 – Contaminated Sites and Waste Management Section 4 – Geological and Groundwater Management Section 5 – Vegetation Management Section 6 – Wildlife Management Plans Section 7 – Wetland Management Section 8 – Aquatic Resource Management Section 9 – Reclamation Plans Section 10 – Facilities Management Plans Section 11 – Burnaby Mountain Tunneling Management

Trans Mountain Pipeline ULC Navigation and Navigation Safety Plan Trans Mountain Expansion Project April 2017
01-13283-GG-0000-CHE-RPT-0010 R1
Page i
Page i
TABLE OF CONCORDANCE NEB Condition 48 is applicable to the following legal instruments: OC-064 (CPCN), AO-003-OC-2 (OC2), XO-T260-007-2016 (Temp), XO-T260-008-2016 (Pump 1) and XO-T260-009-2016 (Pump 2). Table 1 describes how this Plan addresses the Condition requirements applicable to Project activities.
TABLE 1
LEGAL INSTRUMENT CONCORDANCE WITH NEB CONDITION 48: NAVIGATION AND NAVIGATION SAFETY PLAN
NEB Condition 48 OC-064 (CPCN)
AO-003-OC-2 (OC2)
XO-T260-007-2016 (Temp)
XO-T260-008-2016 (Pump1)
XO-T260-009-2016 (Pump2)
Trans Mountain must file with the NEB, for approval, at least 4 months prior to commencing construction, a Navigation and Navigation Safety Plan that includes: a) an updated list of navigable waterways to be crossed by or affected by the Project (including power lines, marine
terminal, temporary or permanent bridge crossings, or other ancillary works that are physically or operationally connected to the Project);
Appendix A of this Plan
Appendix A of this Plan
Appendix A of this Plan
Appendix A of this Plan
Appendix A of this Plan
b) an updated listing of effects of the Project on navigation and navigation safety for each of the identified waterways identified in a);
Section 3.2 and Appendix A of this Plan
Section 3.2 and Appendix A of this Plan
Section 3.2 and Appendix A of this Plan
Section 3.2 and Appendix A of this Plan
Section 3.2 and Appendix A of this Plan
c) proposed mitigation measures to address Project effects on navigation and navigation safety for each of the identified waterways, including adherence to codes and standards (such as the Canadian Standards Association); and
Section 4.0 and Appendix A of this Plan
Section 4.0 and Appendix A of this Plan
Section 4.0 and Appendix A of this Plan
Section 4.0 and Appendix A of this Plan
Section 4.0 and Appendix A of this Plan
d) a summary of its consultations with Appropriate Government Authorities, potentially affected Aboriginal groups and waterway users, regarding their navigational use of each of the identified waterways. In its summary, Trans Mountain must:
-- -- -- -- --
i) describe the Appropriate Government Authorities, potentially affected Aboriginal groups, and commercial and recreational waterway users consulted;
Section 2.0; Appendix B, C and D of this Plan
Section 2.0; Appendix B, C and D of this Plan
Section 2.0; Appendix B, C and D of this Plan
Section 2.0; Appendix B, C and D of this Plan
Section 2.0; Appendix B, C and D of this Plan
ii) describe how Trans Mountain identified those consulted; and Section 2.0; Appendix B, C and D of this Plan
Section 2.0; Appendix B, C and D of this Plan
Section 2.0; Appendix B, C and D of this Plan
Section 2.0; Appendix B, C and D of this Plan
Section 2.0; Appendix B, C and D of this Plan
iii) provide a description and justification for how Trans Mountain has incorporated the results of its consultation, including any recommendations from those consulted, into the plan.
Section 2.0, Appendix B of this Plan
Section 2.0, Appendix B of this Plan
Section 2.0, Appendix B of this Plan
Section 2.0, Appendix B of this Plan
Section 2.0, Appendix B of this Plan

Trans Mountain Pipeline ULC Navigation and Navigation Safety Plan Trans Mountain Expansion Project April 2017
01-13283-GG-0000-CHE-RPT-0010 R1
Page ii
EXECUTIVE SUMMARY The Navigation and Navigation Safety Plan (the Plan) was prepared to meet National Energy Board (NEB) Condition 48 for the Trans Mountain Expansion Project (TMEP or the Project).
The NEB defines navigable waters as “any body of water capable, in its natural state, of being navigated by floating vessels of any description for the purpose of transportation, recreation or commerce, and may also be a human-made feature such as a canal or reservoir”.
Trans Mountain Pipeline ULC (Trans Mountain) understands NEB Condition 48 to refer to those aspects of the Project that are within the NEB’s jurisdiction as outlined in the Condition. This includes the pipeline, power lines, marine terminal, temporary or permanent bridge crossings, or other ancillary works that are physically or operationally connected with the Project. From a marine perspective, this includes the construction and site operation of the Westridge Marine Terminal in Burrard Inlet. It does not cover the movement of Project-related marine vessels (i.e., oil tankers, tugs) using the shipping lanes in Burrard Inlet, Georgia Strait, Haro Strait, and Juan de Fuca Strait in approach to, or upon departure from, the Westridge Marine Terminal. Jurisdiction over shipping safety in marine waterways remains with Transport Canada.
The Plan provides an updated list of navigable and potentially navigable waterways (including watercourses and wetlands) that may be affected by the Project and a review of assessment outcomes and mitigation measures to address Project effects on navigation and navigation safety for each identified navigable waterway (Appendix A). The Plan also summarizes concerns related to navigation and navigation safety raised through Trans Mountain’s stakeholder and Aboriginal engagement to-date Appendix B) and how the Project has addressed them and considered them in the Plan.
Construction of the Project could potentially affect 50 watercourse crossings that are considered navigable, 145 watercourse crossings that are considered potentially navigable and 9 navigable wetlands. Aquatics and wetlands field work has determined that construction and operations of the pump stations, temporary facilities, tanks, and non-marine terminal work will not be located in, on, over, under, through or across a navigable waterway.
The potential residual effects of Project construction on navigation and navigation safety were identified in the TMEP NEB Facilities Application (Application) (Section 7.2.6 of Volume 5B for pipeline, power lines, temporary or permanent bridge crossings and other ancillary works) and include:
• impediments to watercourse users on navigable watercourses during construction or site-specific maintenance activities; and
• the safety of watercourse users on navigable watercourses may be affected in the event the user enters the construction zone.
The potential residual effects associated with the Westridge Marine Terminal (as discussed in Section 7.6.6 of Volume 5B of the Application) include:
• disruption to a navigable water (Burrard Inlet) during construction and operations; and
• concern for the safety of marine users due to changing movement patterns.
Since the filing of the Application in 2013, no new or additional interactions have been identified between the Project and navigation and navigation safety.

Trans Mountain Pipeline ULC Navigation and Navigation Safety Plan Trans Mountain Expansion Project April 2017
01-13283-GG-0000-CHE-RPT-0010 R1
Page iii
TABLE OF CONTENTS
Page TABLE OF CONCORDANCE ........................................................................................................................ i EXECUTIVE SUMMARY ............................................................................................................................... ii 1.0 INTRODUCTION .............................................................................................................................. 1
1.1 Project Description .............................................................................................................. 1 1.2 Links to Other Trans Mountain Plans .................................................................................. 2 1.3 Commitments Management ................................................................................................ 3 1.4 Navigability – Context and Approach .................................................................................. 3
2.0 CONSULTATION AND ENGAGEMENT .......................................................................................... 6 3.0 NAVIGABLE WATERWAYS ............................................................................................................ 7
3.1 Project Interactions ............................................................................................................. 7 3.2 Potential Residual Effects ................................................................................................... 8
4.0 MITIGATION MEASURES ............................................................................................................. 10 5.0 SUMMARY ..................................................................................................................................... 13 6.0 REFERENCES ............................................................................................................................... 14
LIST OF APPENDICES
Appendix A Navigable and Potentially Navigable Waterways Crossed by the Project ....................... A-1 Appendix B Consultation and Engagement ......................................................................................... B-1 Appendix C Record of Stakeholder Notifications of Draft Plan .......................................................... C-1 Appendix D Aboriginal Groups Engaged on the Navigation and Navigation Safety Plan .................. D-1 Appendix E Westridge Marine Construction Safety Boom .................................................................. E-1 Appendix F Marine Public Outreach Plan (Draft) ................................................................................ F-1
LIST OF TABLES Table 1 Legal Instrument Concordance with NEB Condition 48: Navigation and
Navigation Safety Plan ......................................................................................................... i Table 2 Trans Mountain Plans Linked to Navigation and Navigation Safety ................................... 3 Table 3 Potential Residual Effects of Project on Navigation and Navigation Safety ....................... 8 Table 4 Mitigation Measures Related to Navigation and Navigation Safety .................................. 10 Table A-1 Navigable and Potentially Navigable Watercourses Crossed by the Pipeline
Construction Right-of-Way ............................................................................................... A-2 Table A-2 Navigable and Potentially Navigable Watercourses Crossed by Power Lines ..............A-12 Table A-3 Navigable and Potentially Navigable Watercourses Crossed by the Marine
Terminal .........................................................................................................................A-12 Table A-4 Navigable Wetlands Crossed by the Pipeline Construction Right-of-Way ....................A-13 Table A-5 Navigable and Potentially Navigable Watercourses Crossed by Reactivation
Activity ............................................................................................................................A-14 Table A-6 Navigable and Potentially Navigable Watercourses Crossed by Contingency
Routes ............................................................................................................................A-15 Table A-7 Navigable and Potentially Navigable Watercourses Crossed by New
Temporary or Permanent Bridge Crossings ..................................................................A-15

Trans Mountain Pipeline ULC Navigation and Navigation Safety Plan Trans Mountain Expansion Project April 2017
01-13283-GG-0000-CHE-RPT-0010 R1
Page iv
TABLE OF CONTENTS CONT'D
Page
Table B-1 New Interests, Issues, Concerns from Public Consultation Related to Navigation and Navigation Safety Plan (July 2015 to January 2017) .............................. B-2
Table B-2 Summary of Issues and Concerns Related to Navigation and Navigation Safety (May 2012 To June 2015) ..................................................................................... B-3
Table B-3 Summary of Appropriate Government Authority and Waterway User Consultation Feedback Relevant to Navigation and Navigation Safety Plan (July 2015 To February 2017) .......................................................................................... B-4
Table B-4 Summary of Aboriginal Concerns Regarding Navigation and Navigation Safety ............................................................................................................................... B-5
Table C-1 Record of Notification ...................................................................................................... C-1

Trans Mountain Pipeline ULC Navigation and Navigation Safety Plan Trans Mountain Expansion Project April 2017
01-13283-GG-0000-CHE-RPT-0010 R1
Page 1
1.0 INTRODUCTION The Navigation and Navigation Safety Plan (the Plan) was prepared to meet National Energy Board (NEB) Condition 48 for the Trans Mountain Expansion Project (TMEP or the Project). The draft Plan was submitted to Appropriate Government Authorities, potentially affected Aboriginal groups, and commercial and recreational waterway users on September 16, 2016 for a review and feedback period, which concluded on December 16, 2016. No feedback specific to this Plan was received during this period.
Since the September 2016 release of the draft Plan, engineering design has continued to progress and there have been changes that are described in detail in TMEP Fall 2016 Project Updates (www.transmountain.com/environmental-plans). All of the changes have been reviewed, and the relevant Project design updates have been incorporated into this Plan. It is anticipated route refinement will continue to occur as engineering design progresses. Subsequent changes will be reviewed in consideration of impacts to this Plan.
The Plan provides an updated list of navigable and potentially navigable waterways (watercourses and wetlands) that may be affected by the Project (Appendix A). As stated in NEB Condition 48, this includes consideration of the pipeline construction right-of-way, power lines, marine terminal, temporary or permanent bridge crossings, or other ancillary works that are physically or operationally connected with the Project. The Plan also provides review of assessment outcomes and mitigation measures to address Project effects on navigation and navigation safety for each identified navigable waterway (Section 4.0). In addition, the Plan summarizes issues or concerns related to navigation and navigation safety raised through Trans Mountain’s stakeholder and Aboriginal engagement to-date (Section 2.0 and Appendix B) and how the Project has addressed them and considered them in the Plan.
1.1 Project Description
Trans Mountain Pipeline ULC (Trans Mountain) filed its Facilities Application (the Application) with the NEB in December 2013. In developing its Application, Trans Mountain commenced a program of extensive discussions with landowners, engagement with Aboriginal groups and consultation with affected stakeholders. This program was intended to gather input from these groups into the Application and supporting Environmental and Socio-Economic Assessment (ESA), and to continue to assist Trans Mountain in the design and execution of the Project. Trans Mountain is also working with Appropriate Government Authorities to carry out the necessary reviews, studies and assessments required for the Project.
For ease of description, the following terms are used:
Kilometre Post (KP): describes distances measured along the centreline of the pipeline1.
Project Footprint: includes the area directly disturbed by surveying, construction, clean-up and operation of the pipeline, as well as associated physical works and activities (including the temporary construction lands and infrastructure, the pipeline, reactivation, facilities, the Westridge Marine Terminal and access roads). For clarity, specific components of the Project Footprint are further described by Trans Mountain below.
• Temporary construction lands and infrastructure refers to preparatory works to be undertaken prior to Project construction and includes temporary camps, stockpile sites, equipment staging areas and borrow pits located on land that has been previously disturbed, as well as access roads within the first 10 km of each designated construction spread. For ease of assessing Project interactions, these access roads within the first 10 km of each construction spread will not be considered under
1 Kilometre Posts (KPs) are calibrated to a number of fixed values derived from the original Trans Mountain Pipeline (TMPL) Mile Posts (MPs) in 1978 and do not necessarily represent actual chainage (measurement) along the pipeline. This is the result of integrating more accurate In-Line Inspection (ILI) data without forcing adjustments to KP values along TMPL. As the Trans Mountain Expansion Project (TMEP) is required to tie into the existing pipeline these fixed TMPL KP values also force a calibration of TMEP KPs. Therefore the actual lengths of pipeline cannot be calculated accurately by simply differencing two KP values.

Trans Mountain Pipeline ULC Navigation and Navigation Safety Plan Trans Mountain Expansion Project April 2017
01-13283-GG-0000-CHE-RPT-0010 R1
Page 2
temporary construction lands and infrastructure, but instead are considered as part of the overall access road network. Temporary construction and infrastructure initiated prior to pipeline construction does not include the clearing of forested vegetation.
• Pipeline construction footprint refers to the total area used to construct the pipeline and includes the right-of-way and temporary workspace.
• Reactivation of currently deactivated pipeline segments include: engineering assessment under Section 45 of the National Energy Board Onshore Pipeline Regulations (NEB OPR); and associated construction activities. Currently known disturbance activities and associated access (as of July 2016), were assessed to determine the Project interactions. For ease of assessing Project interactions, these access roads were considered as part of the overall access road network.
• Facilities refer to pump stations, terminals (Edmonton, Sumas and Burnaby), and associated infrastructure (i.e., traps), most of which are located on land that has been previously disturbed. Westridge Marine Terminal has infrastructure located on land and in the marine environment, and is included in the Facilities component of the Project.
• Access roads include new temporary and permanent roads and existing roads that may require upgrades or improvements. For ease of assessing Project interactions, this includes the access roads to be developed as part of temporary construction lands and infrastructure, as well as those accesses associated with reactivation.
• Power lines include the two new power lines required to supply power to Project pump stations from the provincial electrical grid: a) approximately 23.5 km line required at Kingsvale pump station, and b) approximately 1.4 km line required at the proposed new Black Pines pump station.
Contingency Alternate Routes: refer to three alternate pipeline route segments that have been identified and assessed for use if construction on the preferred route is not feasible. These are not included in the Project Footprint defined above since they are considered contingency alternates.
• Raft River, in BC (KP 713.1 to 714.4), is an alternate open cut contingency alignment. The preferred primary crossing method, a horizontal directional drill (HDD), does not support an open cut contingency crossing method at the same location.
• Pembina River, in Alberta (KP 133.0 to 134.7), is an alternate open cut contingency alignment. Similar to Raft River, the preferred primary crossing method (HDD) does not support an open cut contingency crossing method at the same location.
• Westridge Delivery Lines (WDL KP 0.0 to 3.4) is an alternate contingency alignment for a trenched installation around the Burnaby Conservation Area in BC. The preferred pipeline corridor requires tunnel construction and does not support a trenched contingency option; therefore, an alternate trenched contingency alignment has been identified.
Variances: as part of the Project Footprint update that occurred in December 2016, a number of route revisions located outside of the Project corridor were identified. Trans Mountain is in the process of seeking approval from the NEB in 2017 for these route realignments.
1.2 Links to Other Trans Mountain Plans
Information from other plans prepared for the Project that are related to navigable waterways has been considered in this Plan. This includes other NEB Conditions as well as Environmental Protection Plans (EPPs). The links between this Plan and other Trans Mountain plans are provided in Table 2.

Trans Mountain Pipeline ULC Navigation and Navigation Safety Plan Trans Mountain Expansion Project April 2017
01-13283-GG-0000-CHE-RPT-0010 R1
Page 3
TABLE 2
TRANS MOUNTAIN PLANS LINKED TO NAVIGATION AND NAVIGATION SAFETY
Environmental Plan Description of the Environmental Plan Linkages to this Plan Pipeline EPP (Volume 2 of the Environmental Plans)
The Pipeline EPP contains Trans Mountain’s environmental procedures and mitigation measures to be implemented during construction of the pipeline to avoid, reduce or mitigate potential adverse environmental effects. The EPP serves as reference information for construction and inspection personnel to support decision-making and to provide direction to more detailed information (i.e., resource-specific mitigation, management and contingency plans).
The Pipeline EPP includes general construction measures applicable to navigable waterways crossed by the Project. Additional pre-construction and construction measures applicable to watercourse crossings are included.
Westridge Marine Terminal EPP (Volume 4 of the Environmental Plans)
The Westridge Marine Terminal EPP contains Trans Mountain’s environmental procedures and mitigation measures to be implemented during construction of the marine terminal to avoid, reduce or mitigate potential adverse environmental effects.
The Westridge Marine Terminal EPP includes general construction measures applicable to navigation in Burrard Inlet.
Watercourse Crossing Inventory (NEB Condition 43)
The Watercourse Crossing Inventory provides an updated inventory of all watercourses to be crossed by the Project, including details for each crossing on (but not limited to) the location of the crossing; the primary and contingency crossing methods; planned construction timing; the provincial instream work window.
Determination of navigability for each watercourse was made during the field studies related to NEB Condition 43, and data from NEB Condition 43 is the basis for navigable watercourses named in this Plan for NEB Condition 48.
Wetland Survey and Mitigation Plan (Volume 6 of the Environmental Plans) (NEB Condition 41)
The Wetland Survey and Mitigation Plan provides an overview of wetlands encountered by the Project, recommended mitigation measures and crossing methods to be implemented during construction, and reclamation measures to be implemented during construction and operations.
Determination of navigability for each wetland was made during the field studies related to NEB Condition 41, and data from NEB Condition 41 is the basis for navigable wetlands named in this Plan for NEB Condition 48.
Light Emissions Management Plan for the Westridge Marine Terminal (NEB Condition 82)
The Light Emissions Management Plan for the Westridge Marine Terminal will present a summary of the results of an area lighting study, including how potential impacts on surrounding communities and safety and operational requirements were considered. It will describe any additional mitigation and best practice measures considered for the terminal lighting design and how the proposed design and operation will minimize the impacts from light on land-based residents and marine users.
For marine users, such mitigation may also support the reduction of navigation and navigation safety effects in Burrard Inlet related to the presence of the expanded marine terminal.
Traffic Access and Control Management Plan (NEB Condition 73)
The Traffic Access and Control Management Plan (TACMP) outlines, amongst other things, the Project’s traffic management strategy, anticipated traffic volumes and associated risks, and includes construction access management maps.
TACMP identifies planned routes for access to construction and construction use areas, which is information used in determining if any temporary or permanent bridge structures are required.
1.3 Commitments Management
Trans Mountain made a number of commitments regarding the Project during the OH-001-2014 proceedings and engagement activities up to May 2016. Commitments were made to improve and optimize planning and mitigation measures. As Trans Mountain has consolidated its commitments into a Commitments Tracking Table in order to make it easier for interested parties to access and reference this information, the table of commitments in each plan has been removed.
The Commitments Tracking Table was filed with the NEB and will be available on Trans Mountain’s web site at www.transmountain.com. Trans Mountain continues to monitor and track compliance with its commitments and will update, post to its website and file with the NEB updated versions of the Commitments Tracking Table according to the timeframes outlined in NEB Condition 6. Commitments with specific relevance to this Plan have been considered and addressed.
1.4 Navigability – Context and Approach
Since July 2013, the NEB has been the “one window” federal regulator for NEB-regulated pipeline and power line projects that cross navigable waters. Previously, this had been the responsibility of Transport Canada. Transport Canada and the NEB have entered into a Memorandum of Understanding to provide guidance as to when a project is regulated by the NEB or Transport Canada. Navigation Protection Act review is not required as it is covered under the NEB approval.
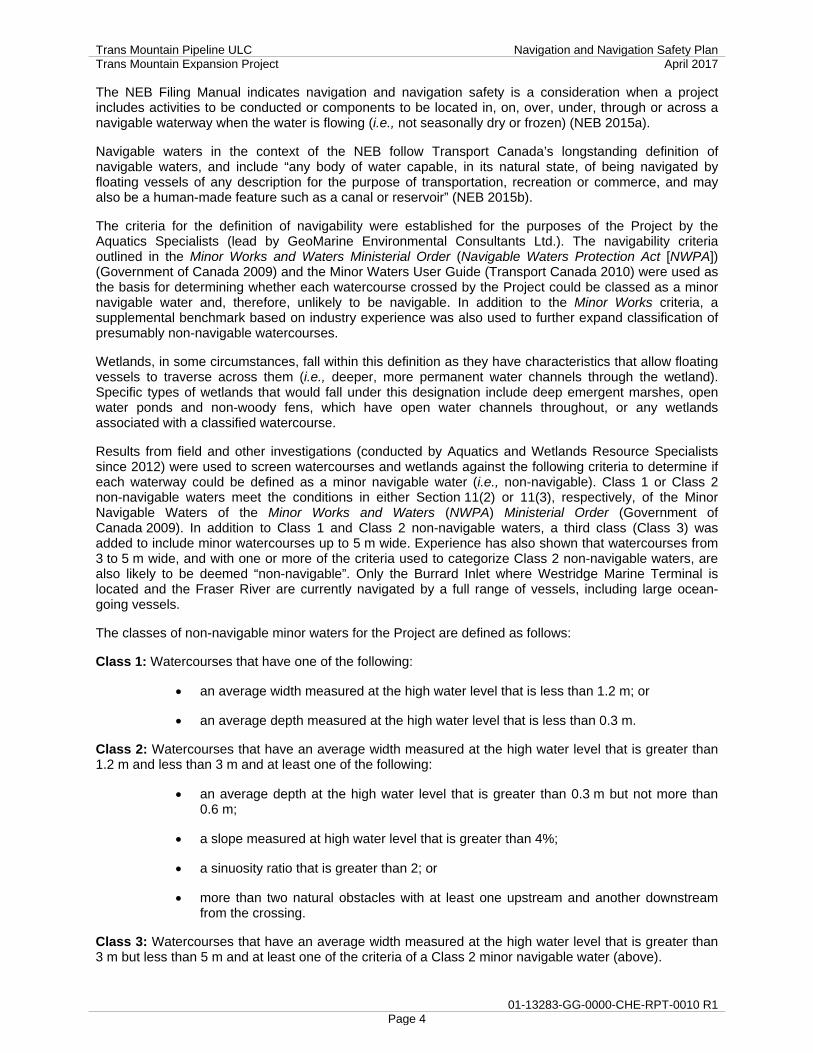
Trans Mountain Pipeline ULC Navigation and Navigation Safety Plan Trans Mountain Expansion Project April 2017
01-13283-GG-0000-CHE-RPT-0010 R1
Page 4
The NEB Filing Manual indicates navigation and navigation safety is a consideration when a project includes activities to be conducted or components to be located in, on, over, under, through or across a navigable waterway when the water is flowing (i.e., not seasonally dry or frozen) (NEB 2015a).
Navigable waters in the context of the NEB follow Transport Canada’s longstanding definition of navigable waters, and include “any body of water capable, in its natural state, of being navigated by floating vessels of any description for the purpose of transportation, recreation or commerce, and may also be a human-made feature such as a canal or reservoir” (NEB 2015b).
The criteria for the definition of navigability were established for the purposes of the Project by the Aquatics Specialists (lead by GeoMarine Environmental Consultants Ltd.). The navigability criteria outlined in the Minor Works and Waters Ministerial Order (Navigable Waters Protection Act [NWPA]) (Government of Canada 2009) and the Minor Waters User Guide (Transport Canada 2010) were used as the basis for determining whether each watercourse crossed by the Project could be classed as a minor navigable water and, therefore, unlikely to be navigable. In addition to the Minor Works criteria, a supplemental benchmark based on industry experience was also used to further expand classification of presumably non-navigable watercourses.
Wetlands, in some circumstances, fall within this definition as they have characteristics that allow floating vessels to traverse across them (i.e., deeper, more permanent water channels through the wetland). Specific types of wetlands that would fall under this designation include deep emergent marshes, open water ponds and non-woody fens, which have open water channels throughout, or any wetlands associated with a classified watercourse.
Results from field and other investigations (conducted by Aquatics and Wetlands Resource Specialists since 2012) were used to screen watercourses and wetlands against the following criteria to determine if each waterway could be defined as a minor navigable water (i.e., non-navigable). Class 1 or Class 2 non-navigable waters meet the conditions in either Section 11(2) or 11(3), respectively, of the Minor Navigable Waters of the Minor Works and Waters (NWPA) Ministerial Order (Government of Canada 2009). In addition to Class 1 and Class 2 non-navigable waters, a third class (Class 3) was added to include minor watercourses up to 5 m wide. Experience has also shown that watercourses from 3 to 5 m wide, and with one or more of the criteria used to categorize Class 2 non-navigable waters, are also likely to be deemed “non-navigable”. Only the Burrard Inlet where Westridge Marine Terminal is located and the Fraser River are currently navigated by a full range of vessels, including large ocean-going vessels.
The classes of non-navigable minor waters for the Project are defined as follows:
Class 1: Watercourses that have one of the following:
• an average width measured at the high water level that is less than 1.2 m; or
• an average depth measured at the high water level that is less than 0.3 m.
Class 2: Watercourses that have an average width measured at the high water level that is greater than 1.2 m and less than 3 m and at least one of the following:
• an average depth at the high water level that is greater than 0.3 m but not more than 0.6 m;
• a slope measured at high water level that is greater than 4%;
• a sinuosity ratio that is greater than 2; or
• more than two natural obstacles with at least one upstream and another downstream from the crossing.
Class 3: Watercourses that have an average width measured at the high water level that is greater than 3 m but less than 5 m and at least one of the criteria of a Class 2 minor navigable water (above).

Trans Mountain Pipeline ULC Navigation and Navigation Safety Plan Trans Mountain Expansion Project April 2017
01-13283-GG-0000-CHE-RPT-0010 R1
Page 5
Watercourses which did not meet the criteria of any of these three classifications were assumed to be navigable for recreational, commercial or traditional purposes.
In some instances, watercourses did not meet the criteria for non-navigable and yet were not clearly navigable (e.g., typically subject to seasonal flows). Such watercourses have been identified as ‘potentially navigable’.
Additional criteria were developed to help with identifying any potentially navigable wetlands. Criteria used included:
• classification of wetland (i.e., deep marsh, open water pond, non-woody fen or any wetland associated with classified watercourses);
• permanency of water (i.e., semi-permanent or permanent); and
• presence of semi-permanent or permanent open water channels within the wetland (e.g., within non-woody fens).
The Plan also considers the 2014 Order Amending the Minor Works and Waters (NWPA) Order (Government of Canada 2014).

Trans Mountain Pipeline ULC Navigation and Navigation Safety Plan Trans Mountain Expansion Project April 2017
01-13283-GG-0000-CHE-RPT-0010 R1
Page 6
2.0 CONSULTATION AND ENGAGEMENT Consultation and engagement activities related to navigation and navigation safety were completed between May 2012 and January 2017 with Appropriate Government Authorities, potentially affected Aboriginal groups and waterway users. Opportunities to discuss navigation and navigation safety, and identify issues or concerns were provided to public stakeholders through the Trans Mountain website, workshops, meetings and ongoing engagement activities during the reporting period. Appendix B includes a comprehensive record of these engagement activities, stakeholder feedback and Trans Mountain responses.
The draft Plan was released on September 16, 2016 for review and feedback. Feedback was requested by December 16, 2016. No feedback specific to the draft Plan was received during the feedback period.
Engineering design changes were issued in the TMEP Fall 2016 Project Update document (www.transmountain.com/environmental-plans) along with a request for feedback. All of the design updates have been reviewed, and the Project design updates that are relevant have been incorporated into this Plan.

Trans Mountain Pipeline ULC Navigation and Navigation Safety Plan Trans Mountain Expansion Project April 2017
01-13283-GG-0000-CHE-RPT-0010 R1
Page 7
3.0 NAVIGABLE WATERWAYS Construction of the Project could potentially affect 50 watercourse crossings that are considered navigable, 145 watercourse crossings that are considered potentially navigable, and 9 navigable wetlands, as outlined in Appendix A.
Trans Mountain understands NEB Condition 48 to refer to those aspects of the Project that are within the NEB’s jurisdiction. From a marine perspective, this includes the construction and site operation of the Westridge Marine Terminal in Burrard Inlet. It does not cover the movement of Project-related marine vessels (i.e., oil tankers, tugs) using the shipping lanes in Burrard Inlet, Georgia Strait, Haro Strait, and Juan de Fuca Strait in approach to, or upon departure from, the Westridge Marine Terminal. Jurisdiction over shipping safety in marine waterways remains with Transport Canada.
3.1 Project Interactions
Information on the specific components of the Project Footprint as defined in Section 1.1 (temporary construction lands and infrastructure, pipeline construction footprint, reactivation, facilities, access roads, power lines, contingency alternate routes) is provided below.
Temporary Construction Lands and Infrastructure Temporary construction lands and infrastructure (which includes temporary camps, stockpile sites, equipment staging areas and borrow pits, and works on access roads within the first 10 km of each designated construction spread) will not be located in, on, over, under, through or across a navigable waterway. As such, temporary construction lands and infrastructure activity will not interact with navigation and navigation safety.
Pipeline Construction Footprint In places, the pipeline construction footprint (i.e., specifically the pipeline right-of-way) will be located in, on, over, under, through and/or across navigable waterways. As such, the pipeline construction footprint will interact with navigation and navigation safety. Refer to Appendix A, Table A-1 (watercourses) and Table A-4 (wetlands).
Access Roads Some proposed new temporary or permanent bridge structures associated with the road access network are anticipated to be located in, on, over and/or across navigable watercourses. Approximately 18 potentially navigable or navigable watercourses have been identified as needing new temporary structures (i.e., clear span bridge), some of which may result in an interaction with navigation and navigation safety depending on conditions at the time of construction. Refer to Appendix A, Table A-7.
There are no navigable wetlands crossed by proposed temporary access roads.
Reactivation Some known reactivation activities are anticipated to occur in, on, over, under, through and/or across some watercourses that are considered navigable or potentially navigable, and thus, may interact with navigation and navigation safety. Refer to Appendix A, Table A-5.
Reactivation activities will not be located in, on, over, under, through or across a navigable wetland.
Facilities Aquatics and wetlands field work has determined that construction and operations of the pump stations, temporary facilities, terminals (Edmonton, Sumas and Burnaby, and associated infrastructure) will not be located in, on, over, under, through or across a navigable waterway. As such, these aspects of the Project will not interact with navigation and navigation safety.
The construction and operations of the Westridge Marine Terminal will be located, in part, on a navigable waterway (Burrard Inlet). As such, the Westridge Marine Terminal will interact with navigation and navigation safety. Refer to Appendix A, Table A-3.

Trans Mountain Pipeline ULC Navigation and Navigation Safety Plan Trans Mountain Expansion Project April 2017
01-13283-GG-0000-CHE-RPT-0010 R1
Page 8
Power Lines Power lines will cross over a navigable watercourse (North Thompson River), and thus, may interact with navigation and navigation safety. Refer to Appendix A, Table A-2.
No navigable wetlands will be crossed by power lines.
Contingency Alternate Routes The alternate contingency alignments for the crossing of the Raft River and Pembina River will interact with navigation and navigation safety, as these rivers are navigable. Refer to Appendix A, Table A-6.
The alternate contingency alignment for the Westridge Delivery Lines is not located in, on, over, under, through or across a navigable watercourse, and thus, it will not interact with navigation and navigation safety.
There are no navigable wetlands along any of the contingency alternate routes.
3.2 Potential Residual Effects
The potential residual effects of Project construction on navigation and navigation safety were identified in the Application (Sections 7.2.6 and 7.6.6 of Volume 5B), and are summarized in Table 3. Since the filing of the Application in 2013, no new or additional potential residual effects on navigation and navigation safety have been identified.
TABLE 3
POTENTIAL RESIDUAL EFFECTS OF PROJECT ON NAVIGATION AND NAVIGATION SAFETY
Potential Residual Effect Effect Characterization Pipeline, Power Line, Reactivation, Contingency Routes, Bridge Crossings 1. Impediments to watercourse users on navigable watercourses during
construction or site-specific maintenance activities. Short-term in duration, periodic in frequency, reversible in the short-term, low in magnitude.
2. The safety of watercourse users on navigable watercourses may be affected in the event the user enters the construction zone.
Immediate in duration, accidental in frequency, reversible in the short-term, low to high in magnitude.
Westridge Marine Terminal 3. Disruption to a navigable water (Burrard Inlet) during construction and
operations. Construction: Short-term in duration, isolated in frequency, reversible in the short-term, low-to-medium in magnitude. Operations: Long-term in duration, isolated to periodic in frequency, reversible in the long-term, low in magnitude.
4. Concern for safety of marine users due to changing movement patterns. Immediate in duration, accidental in frequency, reversible in the short-term, low-to-high in magnitude.
The degree of potential effect depends on the method of construction, the season of construction and the state of the watercourse (frozen or unfrozen). Watercourse crossings that occur during winter will have a reduced effect on navigation and navigation safety, as some types of uses may be reduced during winter and in some areas, no navigation use will occur during the winter due to frozen conditions. Impediments to watercourse users on navigable watercourses may occur during construction and site-specific maintenance. Watercourse users vary depending on the watercourses and location of each crossing. In general, activities on watercourses crossed by the Project include commercial and non-commercial rafting, kayaking, fishing, boating, tubing, as well as traditional cultural activities. The navigability of some watercourses along the Project may be affected if open water conditions occur during a trenched crossing or installation of a temporary vehicle crossing as part of construction or site-specific maintenance activities (e.g., integrity dig).
Construction through watercourses will utilize a number of appropriate pipeline watercourse crossing methods selected in consideration of the size, environmental sensitivities of each watercourse and the season/timeframe of the construction period of each particular crossing. Pipe installations at watercourse crossings can be classified as either wet (trenched) or dry (trenched with water flow control or trenchless) crossings. With a wet crossing (e.g., open cut), the trench can be excavated through flowing water, if

Trans Mountain Pipeline ULC Navigation and Navigation Safety Plan Trans Mountain Expansion Project April 2017
01-13283-GG-0000-CHE-RPT-0010 R1
Page 9
present. With a dry crossing, excavation of the trench normally occurs through the streambed once the water flow has been isolated, either by a dam and pump-around mechanism, or by using a flume over the excavated trench. Trenchless crossings (e.g., bore or HDD) techniques could also be used for watercourse crossings, where feasible.
The navigability of watercourses will generally not be affected during the operations phase since the pipeline will be buried under watercourses and the usage of new permanent vehicle crossings is not anticipated. However, impediments to navigation may occur during the operations phase if site-specific maintenance activities occur during open water conditions.
For the purposes of this Plan, each navigable and potentially navigable waterway is identified, and potential effects are described as outlined below.
• Tables A-1 outlines which potential residual effects from Table 3 are applicable to each navigable watercourse crossed by the mainline construction right-of-way.
• Table A-2 outlines which potential residual effects are applicable to navigable watercourses crossed by power lines.
• Table A-3 outlines which potential residual effects are applicable to the navigable watercourse affected by Westridge Marine Terminal.
• Table A-4 outlines which potential residual effects are applicable to each navigable wetland crossed by the mainline construction right-of-way.
• Table A-5 outlines which potential residual effects are applicable to each navigable watercourse crossed by reactivation activity.
• Table A-6 notes which potential residual effects are pertinent to navigable watercourses affected by contingency alternate routes.
• Table A-7 notes which potential residual effects may be pertinent to navigable watercourses affected by temporary or permanent bridge crossings, if potentially navigable watercourses are deemed navigable at the time of construction.

Trans Mountain Pipeline ULC Navigation and Navigation Safety Plan Trans Mountain Expansion Project April 2017
01-13283-GG-0000-CHE-RPT-0010 R1
Page 10
4.0 MITIGATION MEASURES Trans Mountain has developed numerous mitigation measures to address potential Project effects on navigation and navigation safety. Measures were identified in the ESA (Volume 5B of the Application) and through commitments to various parties throughout the NEB process. Table 4 identifies the measures Trans Mountain has committed in order to mitigate potential effects of the Project on navigation and navigation safety. Some mitigation language has been revised since the Application to reflect input from various parties; mitigation outlined in Table 4 reflects that in the most recent EPPs and Socio-Economic Management Plan (SEMP) (Volumes 2, 4 and 6 of the Environmental Plans). Table 4 does not include general communication measures that Trans Mountain will undertake to communicate Project details to regulatory authorities, municipal tourism offices, waterway user groups, and other relevant organizations so they may share details of construction activity with waterway users. Such communication measures will be outlined in the construction phase Communication and Notification Program. Mitigation also considers the 2014 Order Amending the Minor Works and Waters (NWPA) Order (Government of Canada 2014). Additional mitigation may emerge through the issuance of approvals, licenses and permits necessary for construction.
TABLE 4
MITIGATION MEASURES RELATED TO NAVIGATION AND NAVIGATION SAFETY
Activity/Concern Mitigation Measures Terrestrial (Pipeline, Power Line, Access Roads, Reactivation) Vehicle Crossing Selection a) Install temporary vehicle crossings in a manner that protects the bed and banks of watercourses from erosion, maintains
flow, does not disrupt fish passage and does not interfere with or impede navigation on navigable watercourses [Section 14.0 of Pipeline EPP].
b) If it is necessary to consider changes or modifications of vehicle crossing methods on a site-specific basis, the decision-making process will include the Contractor, the Construction Manager, Project Engineer, an Environmental Inspector, an Aquatic Resource Specialist and the management of change process [Section 14.0 of Pipeline EPP]. Criteria to be considered when making a vehicle/equipment crossing structure decision will include protection of the riparian vegetation and fisheries values associated with the crossing, navigability, the time of year and duration the crossing is required for, as well as applicable legislation and guides [Section 14.0 Pipeline EPP].
Water Crossings - General c) Limit instream construction to the shortest duration practical given the characteristics of the watercourse and the construction season [Section 14.0 Pipeline EPP].
Open Cut Crossings d) Ensure streamflow, if present at the time of construction, is maintained at all times when trenching through a watercourse [Section 14.0 Pipeline EPP].
e) Return the bed and banks of each crossing as close as practical to their pre-construction contours. Watercourses are not to be realigned or straightened, nor have their hydraulic characteristics changed [Section 14.0 Pipeline EPP].
f) If the contours of the bed of a navigable waterway are disturbed by placement, construction or removal of works, ensure that contours are restored to their natural state on completion of construction or placement of the works.
Erosion Control g) Stabilize disturbed shoreline to prevent erosion [Section 2.10 SEMP]. h) Monitor equipment/vehicle crossings to ensure that erosion control measures are adequate and streamflow is not
disrupted [Section 14.0 Pipeline EPP]. Facilitate Ongoing Navigation i) Keep channel clear upon completion of construction [Section 2.10 SEMP].
j) Ensure that vessels can navigate safely through or around the work site, or if navigation is interrupted by any activity related to construction of placement, that suitable means, such as portage, exist to allow vessels to resume navigation on the side of the work site.
Notification of Interested Parties - Waterway Users
k) Notify recreational boaters of the hazards associated with instream construction in accordance with NEB guidelines or approval conditions for navigable waters. Place warning signs (e.g., “Construction Ahead” and “Travaux de construction”) up and downstream of all the navigable crossings. The signs are to be legible at a distance recommended by the conditions of necessary permit approvals granted by the NEB. Maintain signage and other warning systems in place until navigational hazards are removed [Section 5.0 Pipeline EPP].
l) Install construction notification signs at road crossings, navigable watercourse crossings and rail crossings, as needed [Section 2.6 SEMP].
m) Work sites on navigable waterways are to be marked, from dusk to dawn and during periods of restricted visibility, with yellow flashing lights that are: (i) located on the end of the works that is farthest from the nearest bank or shore if the works are not more than 3 m in length; (ii) located on each end of the works, if the works are more than 3 m in length, but not more than 20 m in length; (iii) located on each end of the works and at any other location on the works so that the lights are spaced not more than 20 m apart if the works are more than 20 m in length, but not more than 30 m in length; or (iv) located on each end of the works and at any other location on the works so that the lights are spaced not more than 30 m apart, if the works are more than 30 m in length.
Trans Mountain Pipeline ULC Navigation and Navigation Safety Plan Trans Mountain Expansion Project April 2017
01-13283-GG-0000-CHE-RPT-0010 R1
Page 11
TABLE 4 Cont'd
Activity/Concern Mitigation Measures Notification of Interested Parties - Waterway Users (cont’d)
n) Work sites in or through a navigable waterway are to be marked with cautionary buoys that are lighted from dusk to dawn and during periods of reduced visibility and are: (i) located at the end of the works that is farthest from the nearest bank or shore, if the works are not more than 3 m in length; (ii) located at each end of the works, if the works are more than 3 m in length, but not more than 20 m in length; (iii) located at each end of the works and at any other location alongside the works so that the buoys are spaced not more than 20 m apart, if the works are more than 20 m in length, but not more than 30 m in length; or (iv) located at each end of the works and at any other location alongside the works so that the buoys are spaced not more than 30 m apart, if the works are more than 30 m in length.
Marine (Westridge Marine Terminal) Notification of Interested Parties – Municipal Authorities
o) Notify the City of Burnaby of the anticipated construction schedule as per the agreed upon schedule [Section 5.0 Westridge Marine Terminal EPP].
Notification of Interested Parties - Marine Operators
p) Notify marine commercial and recreational operators of the hazards associated with construction in accordance with NEB guidelines or approval conditions. Place warning signs (e.g., Warning - Construction in the Vicinity) in terrestrial and marine environments, near construction activities. Follow conditions of permit approvals granted by the NEB [Section 5.0 Westridge Marine Terminal EPP].
q) Notify appropriate regulatory authorities and licensees, and/or distribute a notification to the shipping industry in order to advise commercial and recreational marine operators of the Project schedule and construction activities at the Westridge Marine Terminal [Section 5.0 Westridge Marine Terminal EPP].
Notification of Interested Parties – Project Notice
r) Provide notification to residents of construction within urban areas through methods determined in collaboration with municipal and regional authorities [Section 5.0 Westridge Marine Terminal EPP].
s) Provide Project contact information to residents, land users and Aboriginal groups including for management of construction-related concerns [Section 5.0 Westridge Marine Terminal EPP].
t) Install signs at secondary road access points and within the vicinity of construction activities near secondary roads and highways to notify land users of construction activities [Section 5.0 Westridge Marine Terminal EPP].
Notification of Interested Parties – Aboriginal groups
u) Provide Aboriginal groups with the anticipated construction schedule and facility location maps, and install signage notifying of construction activities in the area, a minimum of 4 weeks prior to the commencement of construction in the vicinity of their respective communities [Section 5.0 Westridge Marine Terminal EPP].
Marine Fish and Fish Habitat* v) Ensure barges are anchored or spudded in appropriate areas with minimal effects to intertidal and subtidal marine habitats. Grounding is prohibited, unless authorized by Vancouver Fraser Port Authority (VFPA). Avoid sensitive marine habitats, where feasible [Section 8.0 Westridge Marine Terminal EPP].
Other Construction Measures w) Apply other measures in the Westridge Marine Terminal EPP pertaining to marine construction. Ensure compliance with all established legislation, including the Navigation Safety Regulations under the Canada Shipping Act, Fisheries Act and other applicable legislation [Application Volume 5B, Section 7.6.6.4].
Marine Restricted Areas x) Comply with VFPA’s Marine Restricted Area legislation, including Clear Narrows Regulations [Application Volume 5B, Section 7.6.6.4].
Construction Vessel Traffic y) Ensure Project construction vessels are equipped with appropriate navigation aids and marks. Project construction vessels will follow applicable navigation rules and carry a high frequency radio with appropriate channels to monitor vessel traffic in the Project area [Section 8.0 Westridge Marine Terminal EPP].
z) Ensure that construction vessel traffic is confined to the general work site, where feasible, and that vessel anchoring or other disturbance only occurs in Trans Mountain approved locations, unless required in an emergency situation [Section 8.0 Westridge Marine Terminal EPP].
aa) Operate Project-related construction vessels at slow speeds (<10 knots) and avoid rapid acceleration to limit the intensity of acoustic emissions (both above and below the water surface) and to decrease wake and the likelihood of striking marine mammals, infrastructure, or other vessels [Section 8.0 Westridge Marine Terminal EPP].
Public Marine Access bb) Discourage unauthorized marine vessel access at the Westridge Marine Terminal through use of signs, markers and/or buoys [Section 8.0 Westridge Marine Terminal EPP].
Marine Construction Safety Boom
cc) Install a floating marine safety boom around the entire Westridge Marine Terminal working zone during construction. The marine safety boom will consist of floats and suitable vertical panels. It will be moored using suitable anchors to withstand typical and worst case environmental conditions found in this area. It will be fitted with several gates to accommodate the passage of construction vessels and vessels coming to and from the existing Westridge Marine Terminal dock. It will be equipped with reflective placards on both the inside and outside so the marine safety barrier remains visible between the buoys. At night, as advised by the Canadian Coast Guard (CCG), the marine safety boom will be marked by navigation lights (flashing yellow one nautical mile range) on all offshore corners. Additional lights will be mounted on the ship gate buoys. Radar reflectors will be installed strategically to assist approaching traffic identify the safety boom on radar during night time and periods of reduced visibility (see Appendix E of this Plan for further details of the conceptual design and layout of the boom).
Additional Navigational Aids dd) Trans Mountain has received advice of the CCG on the additional navigation aids to provide at the facility post-construction, and this is being incorporated to the detailed engineering and design of the expanded Westridge Marine Terminal.
Navigation Simulation ee) Trans Mountain will carry out exercises entailing real time navigation simulation after completion of detailed design, such simulation maneuvers will be for the areas surrounding the Westridge Marine Terminal and will be carried out in consultation with VFPA, the Pacific Pilotage Authority, and BC Coast Pilots.
Notes: *This mitigation is also pertinent to navigation and navigation safety.

Trans Mountain Pipeline ULC Navigation and Navigation Safety Plan Trans Mountain Expansion Project April 2017
01-13283-GG-0000-CHE-RPT-0010 R1
Page 12
Tables A-1, A-2 and A-3 in Appendix A note which of the mitigation measures outlined in Table 4 are pertinent to each navigable and potentially navigable watercourse crossed by the mainline construction right-of-way, power lines and marine terminal (respectively).
Table A-4 in Appendix A notes which mitigation measures are pertinent to each navigable and potentially navigable wetland crossed by the mainline construction right-of-way.
Table A-5 in Appendix A notes which of these mitigation measures are pertinent to each navigable or potentially navigable watercourse related to reactivation activities.
Table A-6 in Appendix A notes which mitigation measures are pertinent to navigable watercourses affected by contingency crossing routes.
Table A-7 in Appendix A notes which mitigation measures are pertinent to navigable watercourses affected by temporary or permanent bridge crossings.
For “potentially navigable” watercourses, mitigation measures specific to navigation (measures [j] through [n] in Table 4) will only be initiated in the event that instream vessels are encountered during Project activities, which would result in confirmation of a navigable determination at the time of activity.
In addition to these measures and commitments, the Project will be designed, constructed, operated, maintained, deactivated and abandoned in accordance with the NEB OPR, which incorporates, by reference, the Canadian Standards Association (CSA) Z662-11, Oil and Gas Pipeline Systems (CSA Z662). Where inconsistencies occur between the NEB OPR and CSA Z662, or any other codes, standards, specifications and recommended practices used in the design, construction, operations and maintenance of TMEP and the expanded TMPL system, the NEB OPR will prevail to the extent of the inconsistency.
It is anticipated that there will be localized areas along the pipeline route where physical conditions or construction circumstances are encountered that are not specifically or adequately addressed in sufficient detail within CSA Z662, the NEB OPR or any other codes, standards, specifications and recommended practices. These conditions and circumstances could include watercourse scour and erosion, among others. Where these conditions or circumstances are encountered, the appropriate qualified engineering specialists will evaluate and prepare detailed engineered designs so that the design, construction and operations of the pipeline will implicitly meet the safety and integrity requirements of CSA Z662 and the NEB OPR. All such designs will be reviewed by qualified professional engineers who are certified accordingly.
To ensure a consistent approach to pipeline watercourse crossings throughout Canada and to aid in developing a common understanding between industry, regulators and other stakeholders, Pipeline Associated Watercourse Crossings Guidelines, 4th Edition (Canadian Association of Petroleum Producers et al. 2012) will be used to assess, plan, construct, operate and maintain the pipeline associated watercourse crossings. All watercourse crossings will have either a site-specific engineered crossing design that will address navigability issues or will refer to a generic typical watercourse crossing design.

Trans Mountain Pipeline ULC Navigation and Navigation Safety Plan Trans Mountain Expansion Project April 2017
01-13283-GG-0000-CHE-RPT-0010 R1
Page 13
5.0 SUMMARY Trans Mountain has undertaken detailed study to determine the navigability status of waterways interacting with the various components of the Project. Trans Mountain has developed numerous mitigation measures to address potential Project effects on navigation and navigation safety on affected navigable waterways.
This Plan provides an updated list of navigable and potentially navigable waterways (including watercourses and wetlands) that may be affected by the Project and a review of assessment outcomes and mitigation measures to address potential Project effects on navigation and navigation safety for each identified navigable waterway. The Plan also summarizes issues or concerns related to navigation and navigation safety raised through Trans Mountain’s stakeholder and Aboriginal engagement to-date and how the Project has addressed them and considered them in the Plan.

Trans Mountain Pipeline ULC Navigation and Navigation Safety Plan Trans Mountain Expansion Project April 2017
01-13283-GG-0000-CHE-RPT-0010 R1
Page 14
6.0 REFERENCES Canadian Association of Petroleum Producers, Canadian Energy Pipeline Association and Canadian Gas
Association. 2012. Pipeline Associated Watercourse Crossings Guidelines, 4th Edition. Prepared by TERA Environmental Consultants. Calgary, Alberta.
Government of Canada. 2009. Minor Works and Waters (Navigable Waters Protection Act) Order. Canada Gazette. Vol. 143, No 19.
Government of Canada. 2014. Order Amending the Minor Works and Waters (Navigable Waters Protection Act) Order. Canada Gazette. Vol. 148, No 16.
National Energy Board. 2015a. Filing Manual, Inclusive of Release 2015-01. Calgary, Alberta.
National Energy Board. 2015b. Frequently Asked Questions - Amendments to the National Energy Board Act and the Canada Oil and Gas Operations Act on Navigation and Navigation Safety, Environment. Website: https://www.neb-one.gc.ca/bts/ctrg/gnnb/nvgblwtrs/nvgtnfq-eng.html. Accessed February 2016.
Transport Canada. 2010. Minor Water User Guide 2010. TP 14838. 22 pp.
Trans Mountain Pipeline ULC Navigation and Navigation Safety Plan Trans Mountain Expansion Project April 2017
01-13283-GG-0000-CHE-RPT-0010 R1
Page A-1
APPENDIX A
NAVIGABLE AND POTENTIALLY NAVIGABLE WATERWAYS CROSSED BY THE PROJECT

Trans Mountain Pipeline ULC Navigation and Navigation Safety Plan Trans Mountain Expansion Project April 2017
Page A
-2
TABLE A-1
NAVIGABLE AND POTENTIALLY NAVIGABLE WATERCOURSES CROSSED BY THE PIPELINE CONSTRUCTION RIGHT-OF-WAY
KP (005) Watercourse Name
Watercourse Crossing ID PXID
Flow Regime
Class (BC) / Classification (Alberta)
Project Proposed Pipeline Crossing
Method
Recommended Vehicle Crossing Method
Flowing Navigability
Status
Potential Residual Effects on Navigation
and Navigation Safety (see Potential Residual Effects in
Table 3)
Mitigation Measures (See
Letter Referenced Mitigation in
Table 4) Watercourses - Alberta
0.5 Unnamed Tributary to North Saskatchewan
River
AB-0a W1.1 Perennial Class C (unmapped)
Isolated Trenched Existing Crossing, Clear-Span Bridge or Type 3
Culvert
Potentially Navigable
1 and 2 Mitigation Measures a) through i)
24.2 Blackmud Creek AB-12 W27.4 Perennial Class C Isolated Trenched Clear-Span Bridge Potentially Navigable
1 and 2 Mitigation Measures a) through i)
28.0 Whitemud Creek AB-13 W28.4 Perennial Class B Isolated Trenched Clear-Span Bridge Potentially Navigable
1 and 2 Mitigation Measures a) through i)
33.6 North Saskatchewan River
AB-14 W29.5 Perennial Class C Trenchless Existing Crossing Navigable No Effects, due to Trenchless Crossing
N/A
59.4 Dog Creek AB-18 W38.4 Perennial Class C (unmapped)
Isolated Trenched Clear-Span Bridge, Type 3 Culvert or Type 5 Logfill/Swamp Mat
Potentially Navigable
1 and 2 Mitigation Measures a) through i)
90.2 Unnamed Tributary to Kilini Creek
AB-33 W60.5 Perennial Class C (unmapped)
Isolated Trenched Clear-Span Bridge Potentially Navigable
1 and 2 Mitigation Measures a) through i)
91.3 Unnamed Tributary to Kilini Creek
AB-34 W61.3 Perennial Class C (unmapped)
Isolated Trenched Existing Crossing, Clear-Span Bridge, Type 3
Culvert or Type 5 Logfill/Swamp Mat
Potentially Navigable
1 and 2 Mitigation Measures a) through i)
125.8 Unnamed Tributary to Isle Lake
AB-60 W103.5 Perennial Class C Isolated Trenched Existing Crossing or Clear-Span Bridge
Potentially Navigable
1 and 2 Mitigation Measures a) through i)
134.0 Pembina River AB-66 W110.5 Perennial Class C Trenchless Existing Crossing Navigable No Effects, due to Trenchless Crossing
N/A
151.0 Unnamed Tributary to Chip Lake
AB-91 W138.3 Perennial Class C Isolated Trenched Clear-Span Bridge Potentially Navigable
1 and 2 Mitigation Measures a) through i)
172.7 Little Brule Creek AB-111 W160.5 Perennial Class C Isolated Trenched Existing Crossing or Clear- Span Bridge
Potentially Navigable
1 and 2 Mitigation Measures a) through i)
177.9 Unnamed Tributary to Brule Creek
AB-114 W163.5 Perennial Class C (unmapped)
Isolated Trenched Existing Crossing Potentially Navigable
1 and 2 Mitigation Measures a) through i)
180.0 Brule Creek AB-116 W165.4 Perennial Class C Isolated Trenched Existing Crossing or Clear- Span Bridge
Potentially Navigable
1 and 2 Mitigation Measures a) through i)
184.2 Lobstick River AB-117 W166.5 Perennial Class C Isolated Trenched Existing Crossing or Clear- Span Bridge
Potentially Navigable
1 and 2 Mitigation Measures a) through i)
187.9 Unnamed Tributary to Lobstick River
AB-118 W169.3 Perennial Class C (unmapped)
Isolated Trenched Existing Crossing or Clear- Span Bridge
Potentially Navigable
1 and 2 Mitigation Measures a) through i)
192.0 Carrot Creek AB-119 W170.5 Perennial Class C Isolated Trenched Existing Crossing or Clear- Span Bridge
Potentially Navigable
1 and 2 Mitigation Measures a) through i)
201.5 Unnamed tributary to January Creek
AB-125 W176.4 Perennial Class C (unmapped)
Isolated Trenched Existing Crossing Potentially Navigable
1 and 2 Mitigation Measures a) through i)

Trans Mountain Pipeline ULC Navigation and Navigation Safety Plan Trans Mountain Expansion Project April 2017
Page A
-3
TABLE A-1 Cont'd
KP (005) Watercourse Name
Watercourse Crossing ID PXID
Flow Regime
Class (BC) / Classification (Alberta)
Project Proposed Pipeline Crossing
Method
Recommended Vehicle Crossing Method
Flowing Navigability
Status
Potential Residual Effects on Navigation
and Navigation Safety (see Potential Residual Effects in
Table 3)
Mitigation Measures (See
Letter Referenced Mitigation in
Table 4) 201.6 Unnamed Tributary to
January Creek AB-126 W177.4 Perennial Class C
(unmapped) Isolated Trenched Existing Crossing Potentially
Navigable 1 and 2 Mitigation Measures
a) through i) 219.3 Wolf Creek AB-129 W180.4 Perennial Class C Trenchless Clear-Span Bridge Navigable No Effects, due to
Trenchless Crossing N/A
222.7 McLeod River AB-131 W183.3 Perennial Class C Trenchless Existing Crossing Navigable No Effects, due to Trenchless Crossing
N/A
226.4 Bench Creek AB-132 W184.5 Perennial Class C Isolated Trenched Clear-Span Bridge Potentially Navigable
1 and 2 Mitigation Measures a) through i)
235.4 Bench Creek AB-136 W189.3 Perennial Class C Isolated Trenched Clear-Span Bridge Potentially Navigable
1 and 2 Mitigation Measures a) through i)
244.0 Little Sundance Creek AB-137 W190.5 Perennial Class C Isolated Trenched Existing Crossing or Clear- Span Bridge
Potentially Navigable
1 and 2 Mitigation Measures a) through i)
246.7 Sundance Creek AB-138 W191.4 Perennial Class C Isolated Trenched Clear-Span Bridge Potentially Navigable
1 and 2 Mitigation Measures a) through i)
258.8 Unnamed tributary to McLeod River
AB-141 W195.4 Perennial Class C (unmapped)
Isolated Trenched Clear-Span Bridge Potentially Navigable
1 and 2 Mitigation Measures a) through i)
268.2 Unnamed tributary to McLeod River
AB-143 W197.2 Perennial Class C Isolated Trenched Clear-Span Bridge Potentially Navigable
1 and 2 Mitigation Measures a) through i)
293.9 Ponoka Creek AB-155 W211.3 Perennial Class C Isolated Trenched Clear-Span Bridge Potentially Navigable
1 and 2 Mitigation Measures a) through i)
326.2 Maskuta Creek AB-188 W255.3 Perennial Class C Isolated Trenched Existing Crossing or Clear- Span Bridge
Potentially Navigable
1 and 2 Mitigation Measures a) through i)
Watercourses - BC
490.1 Baer Creek BC-3 W1002.4 Perennial S2 Isolated Trenched Clear-Span Bridge Potentially Navigable
1 and 2 Mitigation Measures a) through i)
491.1 Marathon Creek BC-5 W1004.4 Perennial S2 Isolated Trenched Clear-Span Bridge Potentially Navigable
1 and 2 Mitigation Measures a) through i)
518.1 Swift Creek BC-32 W1032.3 Perennial S1B Isolated Trenched Clear-Span Bridge or Access Both Banks
Navigable 1 and 2 Mitigation Measures a) through n)
526.8 Canoe River BC-36 W1036.3 Perennial S1B Isolated Trenched Clear-Span Bridge or Access Both Banks
Navigable 1 and 2 Mitigation Measures a) through n)
530.0 Camp Creek BC-38 W1038.4 Perennial S2 Isolated Trenched Clear-Span Bridge Navigable 1 and 2 Mitigation Measures a) through n)
541.4 Camp Creek BC-52 W1052.4 Perennial S2 Isolated Trenched Existing or Clear-Span Bridge
Navigable 1 and 2 Mitigation Measures a) through n)
543.1 Camp Creek BC-56 W1056.2 Perennial S2 Isolated Trenched Clear-Span Bridge Potentially Navigable
1 and 2 Mitigation Measures a) through i)
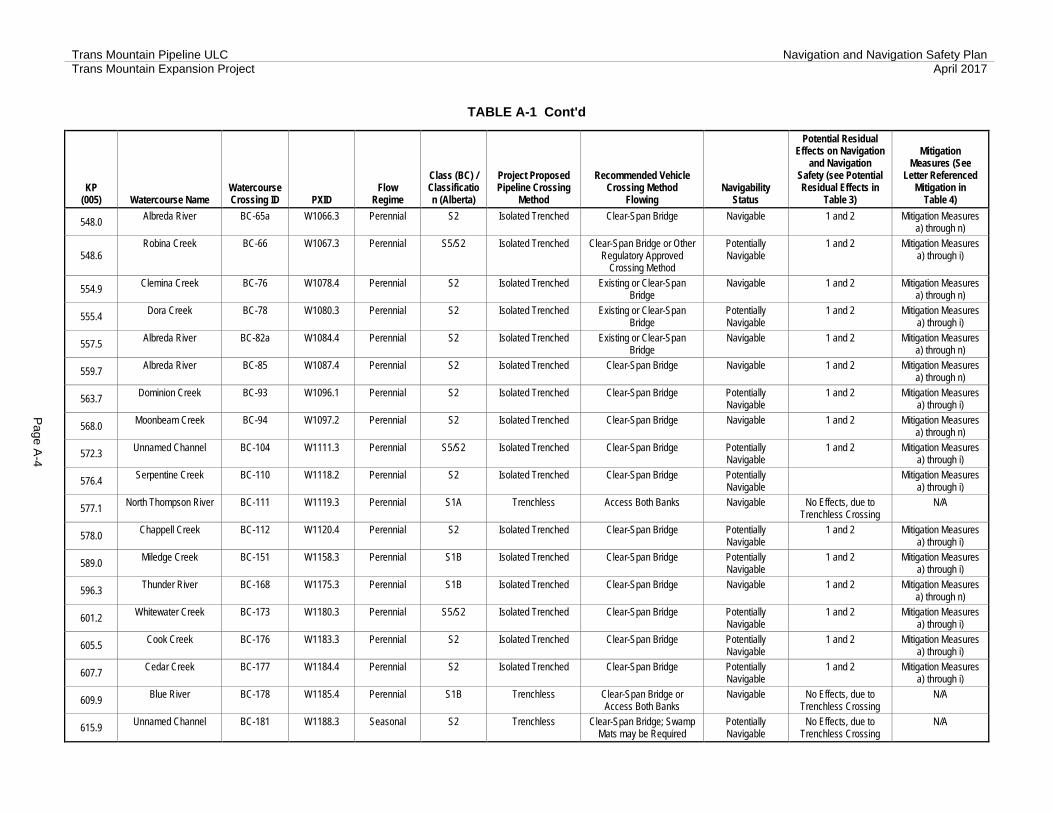
Trans Mountain Pipeline ULC Navigation and Navigation Safety Plan Trans Mountain Expansion Project April 2017
Page A
-4
TABLE A-1 Cont'd
KP (005) Watercourse Name
Watercourse Crossing ID PXID
Flow Regime
Class (BC) / Classification (Alberta)
Project Proposed Pipeline Crossing
Method
Recommended Vehicle Crossing Method
Flowing Navigability
Status
Potential Residual Effects on Navigation
and Navigation Safety (see Potential Residual Effects in
Table 3)
Mitigation Measures (See
Letter Referenced Mitigation in
Table 4)
548.0 Albreda River BC-65a W1066.3 Perennial S2 Isolated Trenched Clear-Span Bridge Navigable 1 and 2 Mitigation Measures a) through n)
548.6 Robina Creek BC-66 W1067.3 Perennial S5/S2 Isolated Trenched Clear-Span Bridge or Other
Regulatory Approved Crossing Method
Potentially Navigable
1 and 2 Mitigation Measures a) through i)
554.9 Clemina Creek BC-76 W1078.4 Perennial S2 Isolated Trenched Existing or Clear-Span Bridge
Navigable 1 and 2 Mitigation Measures a) through n)
555.4 Dora Creek BC-78 W1080.3 Perennial S2 Isolated Trenched Existing or Clear-Span Bridge
Potentially Navigable
1 and 2 Mitigation Measures a) through i)
557.5 Albreda River BC-82a W1084.4 Perennial S2 Isolated Trenched Existing or Clear-Span Bridge
Navigable 1 and 2 Mitigation Measures a) through n)
559.7 Albreda River BC-85 W1087.4 Perennial S2 Isolated Trenched Clear-Span Bridge Navigable 1 and 2 Mitigation Measures a) through n)
563.7 Dominion Creek BC-93 W1096.1 Perennial S2 Isolated Trenched Clear-Span Bridge Potentially Navigable
1 and 2 Mitigation Measures a) through i)
568.0 Moonbeam Creek BC-94 W1097.2 Perennial S2 Isolated Trenched Clear-Span Bridge Navigable 1 and 2 Mitigation Measures a) through n)
572.3 Unnamed Channel BC-104 W1111.3 Perennial S5/S2 Isolated Trenched Clear-Span Bridge Potentially Navigable
1 and 2 Mitigation Measures a) through i)
576.4 Serpentine Creek BC-110 W1118.2 Perennial S2 Isolated Trenched Clear-Span Bridge Potentially Navigable
Mitigation Measures a) through i)
577.1 North Thompson River BC-111 W1119.3 Perennial S1A Trenchless Access Both Banks Navigable No Effects, due to Trenchless Crossing
N/A
578.0 Chappell Creek BC-112 W1120.4 Perennial S2 Isolated Trenched Clear-Span Bridge Potentially Navigable
1 and 2 Mitigation Measures a) through i)
589.0 Miledge Creek BC-151 W1158.3 Perennial S1B Isolated Trenched Clear-Span Bridge Potentially Navigable
1 and 2 Mitigation Measures a) through i)
596.3 Thunder River BC-168 W1175.3 Perennial S1B Isolated Trenched Clear-Span Bridge Navigable 1 and 2 Mitigation Measures a) through n)
601.2 Whitewater Creek BC-173 W1180.3 Perennial S5/S2 Isolated Trenched Clear-Span Bridge Potentially Navigable
1 and 2 Mitigation Measures a) through i)
605.5 Cook Creek BC-176 W1183.3 Perennial S2 Isolated Trenched Clear-Span Bridge Potentially Navigable
1 and 2 Mitigation Measures a) through i)
607.7 Cedar Creek BC-177 W1184.4 Perennial S2 Isolated Trenched Clear-Span Bridge Potentially Navigable
1 and 2 Mitigation Measures a) through i)
609.9 Blue River BC-178 W1185.4 Perennial S1B Trenchless Clear-Span Bridge or Access Both Banks
Navigable No Effects, due to Trenchless Crossing
N/A
615.9 Unnamed Channel BC-181 W1188.3 Seasonal S2 Trenchless Clear-Span Bridge; Swamp Mats may be Required
Potentially Navigable
No Effects, due to Trenchless Crossing
N/A

Trans Mountain Pipeline ULC Navigation and Navigation Safety Plan Trans Mountain Expansion Project April 2017
Page A
-5
TABLE A-1 Cont'd
KP (005) Watercourse Name
Watercourse Crossing ID PXID
Flow Regime
Class (BC) / Classification (Alberta)
Project Proposed Pipeline Crossing
Method
Recommended Vehicle Crossing Method
Flowing Navigability
Status
Potential Residual Effects on Navigation
and Navigation Safety (see Potential Residual Effects in
Table 3)
Mitigation Measures (See
Letter Referenced Mitigation in
Table 4)
616.0 North Thompson River BC-182 W1189.4 Perennial S1A Trenchless Access Both Banks Navigable No Effects, due to Trenchless Crossing
N/A
622.7 Froth Creek BC-189 W1196.2 Perennial S2 Isolated Trenched Existing or Clear-Span Bridge
Potentially Navigable
1 and 2 Mitigation Measures a) through i)
629.3 Foam Creek BC-193b W1206.5 Perennial S2 Isolated Trenched Clear-Span Bridge Potentially Navigable
1 and 2 Mitigation Measures a) through i)
633.9 Finn Creek BC-201 W1215.4 Perennial S2 Isolated Trenched Clear-Span Bridge Potentially Navigable
1 and 2 Mitigation Measures a) through i)
643.3 Sundt Creek BC-224 W1240.3 Perennial S2 Isolated Trenched Clear-Span Bridge Potentially Navigable
1 and 2 Mitigation Measures a) through i)
644.2 Tumtum Creek BC-227 W1243.5 Perennial S2 Isolated Trenched Clear-Span Bridge Potentially Navigable
1 and 2 Mitigation Measures a) through i)
646.8 North Thompson River BC-236 W1252.3 Perennial S1A Trenchless Access both banks Navigable No Effects, due to Trenchless Crossing
N/A
658.6 Unnamed Channel BC-248 W1265.4 Seasonal S2 Isolated Trenched Clear-Span Bridge Potentially Navigable
1 and 2 Mitigation Measures a) through i)
659.8 Sager Creek BC-249 W1266.3 Seasonal S2 Isolated Trenched Clear-Span Bridge Potentially Navigable
1 and 2 Mitigation Measures a) through i)
667.5 Ivy Creek BC-258 W1275.4 Seasonal S5 Isolated Trenched Clear-Span Bridge or Other
Regulatory Approved Crossing Method
Potentially Navigable
1 and 2 Mitigation Measures a) through i)
678.8 Mad River BC-275 W1292.5 Perennial S2 Isolated Trenched Clear-Span Bridge Potentially Navigable
1 and 2 Mitigation Measures a) through i)
681.9 Cove Creek BC-277 W1294.4 Seasonal S2 Isolated Trenched Clear-Span Bridge Potentially Navigable
1 and 2 Mitigation Measures a) through i)
697.6 Peavine Creek BC-296 W1313.4 Seasonal S2 Isolated Trenched Clear-Span Bridge Potentially Navigable
1 and 2 Mitigation Measures a) through i)
713.4 Raft River BC-309 W1326.3 Perennial S1B Trenchless Access Both Banks Navigable No Effects, due to Trenchless Crossing
N/A
721.4 Clearwater River BC-312 W1329.4 Perennial S1A Trenchless Access Both Banks Navigable No Effects, due to Trenchless Crossing
N/A
730.5 Mann Creek BC-315 W1334.4 Perennial S2 Trenchless Clear-Span Bridge Navigable No Effects, due to Trenchless Crossing
N/A
744.8 Lemieux Creek BC-330 W1348.5 Perennial S1B Isolated Trenched Existing or Clear-Span Bridge
Navigable 1 and 2 Mitigation Measures a) through n)
746.4 Nehalliston Creek BC-331 W1349.5 Perennial S2 Isolated Trenched Clear-Span Bridge Potentially Navigable
1 and 2 Mitigation Measures a) through i)
747.8 Eakin Creek BC-332 W1350.2 Perennial S2 Isolated Trenched Clear-Span Bridge Potentially Navigable
1 and 2 Mitigation Measures a) through i)

Trans Mountain Pipeline ULC Navigation and Navigation Safety Plan Trans Mountain Expansion Project April 2017
Page A
-6
TABLE A-1 Cont'd
KP (005) Watercourse Name
Watercourse Crossing ID PXID
Flow Regime
Class (BC) / Classification (Alberta)
Project Proposed Pipeline Crossing
Method
Recommended Vehicle Crossing Method
Flowing Navigability
Status
Potential Residual Effects on Navigation
and Navigation Safety (see Potential Residual Effects in
Table 3)
Mitigation Measures (See
Letter Referenced Mitigation in
Table 4)
756.6 Thuya Creek BC-338 W1356.3 Perennial S2 Isolated Trenched Clear-Span Bridge Potentially Navigable
1 and 2 Mitigation Measures a) through i)
763.8 Darlington Creek BC-343 W1361.4 Perennial S2 Isolated Trenched Clear-Span Bridge Potentially Navigable
1 and 2 Mitigation Measures a) through i)
764.1 Lindquist Creek BC-344 W1362.3 Seasonal S2 Isolated Trenched Clear-Span Bridge Potentially Navigable
1 and 2 Mitigation Measures a) through i)
816.3 Jamieson Creek BC-371 W1389.4 Perennial S2 Isolated Trenched Clear-Span Bridge Potentially Navigable
1 and 2 Mitigation Measures a) through i)
821.5 Lanes Creek BC-376 W1394.4 Perennial S2 Isolated Trenched Clear-Span Bridge Potentially Navigable
1 and 2 Mitigation Measures a) through i)
842.9 Thompson River BC-413 W1431.2 Perennial S1A Trenchless Access Both Banks Navigable No Effects, due to Trenchless Crossing
N/A
889.4 Moore Creek BC-459 W1478.4 Perennial S2 Isolated Trenched Existing or Clear-Span Bridge
Potentially Navigable
1 and 2 Mitigation Measures a) through i)
912.6 Clapperton Creek BC-482 W1501.4 Perennial S2 Isolated Trenched Existing or Clear-Span Bridge
Potentially Navigable
1 and 2 Mitigation Measures a) through i)
924.7 Nicola River BC-504 W1524.5 Perennial S2 Trenchless Clear-Span Bridge Navigable No Effects, due to Trenchless Crossing
N/A
954.5 Coldwater River BC-548 W1570.4 Perennial S1B Trenchless Clear-Span Bridge or Access Both Banks
Navigable No Effects, due to Trenchless Crossing
N/A
954.7 Gillis Creek BC-549 W1571.4 Intermittent S3 Trenchless Clear-Span Bridge Potentially Navigable
No Effects, due to Trenchless Crossing
N/A
966.9 Coldwater River BC-559 W1582.3 Perennial S1B Trenchless Clear-Span Bridge or Access Both Banks
Navigable No Effects, due to Trenchless Crossing
N/A
976.7 Coldwater River BC-570 W1593.3 Perennial S1B Trenchless Clear-Span Bridge or Access Both Banks
Navigable No Effects, due to Trenchless Crossing
N/A
977.7 Juliet Creek BC-571 W1594.5 Perennial S1B Isolated Trenched Clear-Span Bridge Navigable 1 and 2 Mitigation Measures a) through n)
983.9 Mine Creek BC-579 W1603.3 Perennial S2 Isolated Trenched Clear-Span Bridge Potentially Navigable
1 and 2 Mitigation Measures a) through i)
986.9 Coldwater River BC-582 W1607.4 Perennial S2 Trenchless Clear-Span Bridge Navigable No Effects, due to Trenchless Crossing
N/A
1000.0 Boston Bar Creek BC-591 W1622.4 Perennial S5 Isolated Trenched Clear-Span Bridge or Other
Regulatory Approved Crossing Method
Potentially Navigable
1 and 2 Mitigation Measures a) through i)
1001.6 Unnamed Channel BC-592 W1623.5 Perennial S5 Isolated Trenched Clear-Span Bridge or Other
Regulatory Approved Crossing Method
Potentially Navigable
1 and 2 Mitigation Measures a) through i)

Trans Mountain Pipeline ULC Navigation and Navigation Safety Plan Trans Mountain Expansion Project April 2017
Page A
-7
TABLE A-1 Cont'd
KP (005) Watercourse Name
Watercourse Crossing ID PXID
Flow Regime
Class (BC) / Classification (Alberta)
Project Proposed Pipeline Crossing
Method
Recommended Vehicle Crossing Method
Flowing Navigability
Status
Potential Residual Effects on Navigation
and Navigation Safety (see Potential Residual Effects in
Table 3)
Mitigation Measures (See
Letter Referenced Mitigation in
Table 4)
1006.3 Unnamed Channel BC-595 W1626.5 Perennial S5 Isolated Trenched Clear-Span Bridge or Other
Regulatory Approved Crossing Method
Potentially Navigable
1 and 2 Mitigation Measures a) through i)
1008.0 Boston Bar Creek BC-596 W1627.3 Perennial S5 Isolated Trenched Clear-Span Bridge or other
regulatory approved crossing method
Potentially Navigable
1 and 2 Mitigation Measures a) through i)
1012.4 Unnamed Channel BC-617 W1648.3 Seasonal S5 Isolated Trenched Clear-Span Bridge or Other
Regulatory Approved Crossing Method
Potentially Navigable
1 and 2 Mitigation Measures a) through i)
1016.0 Unnamed Channel BC-624 W1656.4 Perennial S5/S2 Isolated Trenched Existing or Clear-Span
Bridge or Other Regulatory Approved Crossing Method
Potentially Navigable
1 and 2 Mitigation Measures a) through i)
1016.8 Unnamed Channel BC-628 W1660.3 Perennial S5 Isolated Trenched Existing or Clear-Span
Bridge or Other Regulatory Approved Crossing Method
Potentially Navigable
1 and 2 Mitigation Measures a) through i)
1017.4 Ladner Creek BC-629 W1661.4 Perennial S2 Isolated Trenched Existing or Clear-Span Bridge
Navigable 1 and 2 Mitigation Measures a) through n)
1018.9 Coquihalla River BC-631 W1663.3 Perennial S1B Isolated Trenched Clear-Span Bridge or Access Both Banks
Navigable 1 and 2 Mitigation Measures a) through n)
1020.0 Dewdney Creek BC-632 W1664.3 Perennial S1B Isolated Trenched Clear-Span Bridge Potentially Navigable
1 and 2 Mitigation Measures a) through i)
1021.6 Karen Creek BC-634 W1666.3 Perennial S2 Isolated Trenched Clear-Span Bridge Potentially Navigable
1 and 2 Mitigation Measures a) through i)
1023.7 Coquihalla River BC-636 W1668.4 Perennial S1B Isolated Trenched Access Both Banks Navigable 1 and 2 Mitigation Measures a) through n)
1025.9 Coquihalla River BC-639 W1671.4 Perennial S1B Isolated Trenched Access Both Banks Navigable 1 and 2 Mitigation Measures a) through n)
1029.8 Coquihalla River BC-645 W1677.4 Perennial S1B Isolated Trenched Access Both Banks Navigable 1 and 2 Mitigation Measures a) through n)
1030.5 Railway Creek BC-646 W1678.3 Perennial S2 Isolated Trenched Clear-Span Bridge Potentially Navigable
1 and 2 Mitigation Measures a) through i)
1040.4 Coquihalla River BC-654 W1686.4 Perennial S1B Isolated Trenched Access both banks Navigable 1 and 2 Mitigation Measures a) through i)
1041.8 Silverhope Creek BC-657 W1689.4 Perennial S1B Isolated Trenched Access Both Banks Navigable 1 and 2 Mitigation Measures a) through i)
1044.4 Chawuthen Creek BC-658 W1690.4 Seasonal S2 Isolated Trenched Clear-Span Bridge Potentially Navigable
1 and 2 Mitigation Measures a) through i)
1048.6 Hunter Creek BC-662 W1694.5 Perennial S1B Isolated Trenched Clear-Span Bridge Navigable 1 and 2 Mitigation Measures a) through n)
1052.6 Lorenzetta Creek BC-666 W1698.5 Perennial S2 Isolated Trenched Clear-Span Bridge Navigable 1 and 2 Mitigation Measures a) through n)

Trans Mountain Pipeline ULC Navigation and Navigation Safety Plan Trans Mountain Expansion Project April 2017
Page A
-8
TABLE A-1 Cont'd
KP (005) Watercourse Name
Watercourse Crossing ID PXID
Flow Regime
Class (BC) / Classification (Alberta)
Project Proposed Pipeline Crossing
Method
Recommended Vehicle Crossing Method
Flowing Navigability
Status
Potential Residual Effects on Navigation
and Navigation Safety (see Potential Residual Effects in
Table 3)
Mitigation Measures (See
Letter Referenced Mitigation in
Table 4)
1058.1 Wahleach Creek BC-668 W1700.4 Perennial S1B Isolated Trenched Clear-Span Bridge Navigable 1 and 2 Mitigation Measures a) through n)
1058.7 Unnamed Channel BC-676 W1711.4 Seasonal S5 Isolated Trenched Clear-Span Bridge or Other
Regulatory Approved Crossing Method
Potentially Navigable
1 and 2 Mitigation Measures a) through i)
1062.6 Unnamed Channel BC-685 W1719.4 Perennial S1B Isolated Trenched Clear-Span Bridge Potentially Navigable
1 and 2 Mitigation Measures a) through i)
1068.3 Unnamed Channel BC-687 W1721.5 Seasonal S5/NCD-W (FB)
Isolated Trenched Ramp and Culvert or Clear-Span Bridge
Potentially Navigable
1 and 2 Mitigation Measures a) through i)
1069.2 Unnamed Channel BC-688 W1722.5 Perennial S5/S2 Isolated Trenched Clear-Span Bridge or Other
Regulatory Approved Crossing Method
Potentially Navigable
1 and 2 Mitigation Measures a) through i)
1069.3 Unnamed Channel BC-689 W1723.4 Perennial S5/S2 Isolated Trenched Clear-Span Bridge or Other
Regulatory Approved Crossing Method
Potentially Navigable
1 and 2 Mitigation Measures a) through i)
1069.5 Unnamed Channel BC-690 W1724.5 Perennial S1B Isolated Trenched Clear-Span Bridge Potentially Navigable
1 and 2 Mitigation Measures a) through i)
1069.8 Unnamed Channel BC-697 W1731.4 Perennial S2 Isolated Trenched Clear-Span Bridge Potentially Navigable
1 and 2 Mitigation Measures a) through i)
1071.7 Anderson Creek BC-705 W1740.5 Seasonal S2 Isolated Trenched Clear-Span Bridge Potentially Navigable
1 and 2 Mitigation Measures a) through i)
1075.2 Unnamed Channel (Rogers Ditch)
BC-710a W1946.3 Seasonal S3 Isolated Trenched Clear-Span Bridge Potentially Navigable
1 and 2 Mitigation Measures a) through i)
1082.0 Elk Creek BC-713 (SAR) W1752.3 Perennial S3 Trenchless Clear-Span Bridge Potentially Navigable
No Effects, due to Trenchless Crossing
N/A
1084.9 Big Ditch Creek BC-713a W10091.2 Perennial S2 Trenchless Clear-Span Bridge Potentially Navigable
No Effects, due to Trenchless Crossing
N/A
1085.6 Unnamed Channel (Roadside Canal)
BC-713b W10053.2 Seasonal S3 Isolated Trenched Clear-Span Bridge Potentially Navigable
1 and 2 Mitigation Measures a) through i)
1085.8 Semmihault Creek BC-714 (SAR) W1753.3 Perennial S3 Trenchless Clear-Span Bridge Potentially Navigable
No Effects, due to Trenchless Crossing
N/A
1090.2 Chilliwack Creek BC-715 (SAR) W1754.3 Perennial S2 Trenchless Clear-Span Bridge Navigable No Effects, due to Trenchless Crossing
N/A
1091.5 Peach Creek BC-716 W1755.2 Perennial S1B Trenchless Clear-Span Bridge; Swamp Mats may be Required
Potentially Navigable
No Effects, due to Trenchless Crossing
N/A
1100.2 Chilliwack / Vedder River
BC-717 W1756.2 Perennial S1B Trenchless Access both banks Navigable No Effects, due to Trenchless Crossing
N/A
1100.4 Hopedale Slough BC-718 (SAR) W1757.2 Perennial S2 Trenchless Clear-Span Bridge Potentially Navigable
No Effects, due to Trenchless Crossing
N/A

Trans Mountain Pipeline ULC Navigation and Navigation Safety Plan Trans Mountain Expansion Project April 2017
Page A
-9
TABLE A-1 Cont'd
KP (005) Watercourse Name
Watercourse Crossing ID PXID
Flow Regime
Class (BC) / Classification (Alberta)
Project Proposed Pipeline Crossing
Method
Recommended Vehicle Crossing Method
Flowing Navigability
Status
Potential Residual Effects on Navigation
and Navigation Safety (see Potential Residual Effects in
Table 3)
Mitigation Measures (See
Letter Referenced Mitigation in
Table 4)
1100.5 Browne Creek BC-719 W10042.1 Seasonal S2 Trenchless Clear-Span Bridge; Swamp Mats may be Required
Potentially Navigable
No Effects, due to Trenchless Crossing
N/A
1100.7 Unnamed Channel (Irrigation Canal)
BC-720d W10050.2 Perennial S3 Isolated Trenched Existing or Clear-Span Bridge
Potentially Navigable
1 and 2 Mitigation Measures a) through i)
1102.4 Stewart Slough BC-720e W10029.2 Perennial S3 Trenchless Clear-Span Bridge Potentially Navigable
Mitigation Measures a) through i)
1102.7 Stewart Creek Branch B - South
BC-721a W10031.2 Perennial S3 Trenchless Clear-Span Bridge Potentially Navigable
No Effects, due to Trenchless Crossing
N/A
1103.5 Stewart Slough BC-722 W1761.3 Perennial S2 Isolated Trenched Clear-Span Bridge Potentially Navigable
1 and 2 Mitigation Measures a) through i)
1104.1 Unnamed Channel (Irrigation Canal)
BC-722a W1871.3 Seasonal S3 Isolated Trenched Ramp and Culvert or Clear-Span Bridge
Potentially Navigable
1 and 2 Mitigation Measures a) through i)
1106.6 Unnamed Channel (Roadside Canal)
BC-722a1 W10239.2 Seasonal S3 Trenchless Ramp and Culvert or Clear-Span Bridge
Potentially Navigable
No Effects, due to Trenchless Crossing
N/A
1107.2 Unnamed Channel (Roadside Canal)
BC-722a2 W10245.2 Seasonal S3 Trenchless Ramp and Culvert or Clear-Span Bridge
Potentially Navigable
No Effects, due to Trenchless Crossing
N/A
1107.2 Unnamed Channel (Roadside Canal)
BC-723 W1762.3 Seasonal S3 Trenchless Ramp and Culvert or Clear-Span Bridge
Potentially Navigable
No Effects, due to Trenchless Crossing
N/A
1108.2 Unnamed Channel (Roadside Canal)
BC-724 W1763.3 Seasonal S3 Trenchless Ramp and Culvert or Clear-Span Bridge
Potentially Navigable
No Effects, due to Trenchless Crossing
N/A
1108.3 Sumas Lake Canal BC-725 W1764.4 Perennial S1B Isolated Trenched Clear-Span Bridge or access both banks
Navigable 1 and 2 Mitigation Measures a) through n)
1108.8 Unnamed Channel (Irrigation Canal)
BC-725.1 W10257.2 Seasonal S3 Trenchless Existing or Ramp and Culvert or Clear-Span
Bridge
Potentially Navigable
No Effects, due to Trenchless Crossing
N/A
1109.4 Unnamed Channel (Roadside Canal)
BC-725b W1874.3 Seasonal S3 Trenchless Ramp and Culvert or Clear-Span Bridge
Potentially Navigable
No Effects, due to Trenchless Crossing
N/A
1110.5 Unnamed Channel (Irrigation Canal)
BC-725c W1875.3 Seasonal S3 Isolated Trenched Ramp and Culvert or Clear-Span Bridge
Potentially Navigable
1 and 2 Mitigation Measures a) through i)
1111.0 Unnamed Channel (Irrigation Canal)
BC-725d W1876.3 Seasonal S3 Isolated Trenched Existing or Ramp and Culvert or Clear-Span
Bridge
Potentially Navigable
1 and 2 Mitigation Measures a) through i)
1111.4 Sumas River BC-726 W1765.3 Perennial S1B Trenchless Access Both Banks Navigable No Effects, due to Trenchless Crossing
N/A
1112.8 Unnamed Channel BC-729 W1768.3 Seasonal S5 Isolated Trenched Clear-Span Bridge or Other
Regulatory Approved Crossing Method
Potentially Navigable
1 and 2 Mitigation Measures a) through i)
1117.3 Clayburn Creek BC-731 W1770.3 Perennial S2 Isolated Trenched Clear-Span Bridge Potentially Navigable
1 and 2 Mitigation Measures a) through i)

Trans Mountain Pipeline ULC Navigation and Navigation Safety Plan Trans Mountain Expansion Project April 2017
Page A
-10
TABLE A-1 Cont'd
KP (005) Watercourse Name
Watercourse Crossing ID PXID
Flow Regime
Class (BC) / Classification (Alberta)
Project Proposed Pipeline Crossing
Method
Recommended Vehicle Crossing Method
Flowing Navigability
Status
Potential Residual Effects on Navigation
and Navigation Safety (see Potential Residual Effects in
Table 3)
Mitigation Measures (See
Letter Referenced Mitigation in
Table 4)
1120.9 Unnamed Channel (Roadside Canal)
BC-731b W10458.2 Seasonal S3 Trenchless Clear-Span Bridge Potentially Navigable
No Effects, due to Trenchless Crossing
N/A
1121.2 Clayburn Creek BC-732 W10460.2 Perennial S2 Isolated Trenched Clear-Span Bridge Potentially Navigable
1 and 2 Mitigation Measures a) through i)
1121.9 Unnamed Channel (Irrigation Canal)
BC-732a W1899.3 Seasonal S3 Isolated Trenched Clear-Span Bridge Potentially Navigable
1 and 2 Mitigation Measures a) through i)
1122.1 Unnamed Channel (Roadside Canal)
BC-732a1 W10468.2 Seasonal S3 Trenchless Ramp and Culvert Potentially Navigable
No Effects, due to Trenchless Crossing
N/A
1122.4 Unnamed Channel (Irrigation Canal)
BC-732b W1900.3 Seasonal S3 Isolated Trenched Ramp and Culvert or Clear-Span Bridge
Potentially Navigable
1 and 2 Mitigation Measures a) through i)
1122.9 Unnamed Channel (Tributary to Gifford
Slough)
BC-733 W1772.3 Seasonal S3 Isolated Trenched Ramp and Culvert or Clear-Span Bridge
Potentially Navigable
1 and 2 Mitigation Measures a) through i)
1123.8 McLennan Creek BC-734 W1773.3 Perennial S2 Isolated Trenched Clear-Span Bridge Potentially Navigable
1 and 2 Mitigation Measures a) through i)
1126.3 Coligny Creek BC-736 W1775.3 Perennial S2 Isolated Trenched Clear-Span Bridge Potentially Navigable
1 and 2 Mitigation Measures a) through i)
1128.4 Nathan Creek BC-747 W1787.3 Perennial S2 Isolated Trenched Clear-Span Bridge Potentially Navigable
1 and 2 Mitigation Measures a) through i)
1136.6 West Creek BC-749 W1789.3 Perennial S2 Isolated Trenched Clear-Span Bridge Potentially Navigable
1 and 2 Mitigation Measures a) through i)
1141.7 Salmon River BC-753 (SAR) W1793.3 Perennial S2 Trenchless Clear-Span Bridge Navigable No Effects, due to Trenchless Crossing
N/A
1146.1 West Munday Creek BC-767 W1798.2 Perennial S2 Isolated Trenched Clear-Span Bridge Potentially Navigable
1 and 2 Mitigation Measures a) through i)
1153.5 Unnamed Channel BC-768b W1927.2 Perennial S2 Isolated Trenched Existing or Clear-Span Bridge
Potentially Navigable
1 and 2 Mitigation Measures a) through i)
1155.7 Fraser River BC-780 W1810.2 Perennial S1A Trenchless Access Both Banks Navigable No Effects, due to Trenchless Crossing
N/A
1167.0 Port Mann Slough BC-780.1 W10901.1 Seasonal S2 Trenchless Clear-Span Bridge or other
regulatory approved crossing method
Potentially Navigable
No Effects, due to Trenchless Crossing
N/A
1167.7 Unnamed Channel BC-780a1 W1811.2 Perennial S2 Trenchless Clear-Span Bridge Potentially Navigable
No Effects, due to Trenchless Crossing
N/A
1167.8 Unnamed Channel BC-780a2 W1812.2 Perennial S2 Trenchless Clear-Span Bridge Potentially Navigable
No Effects, due to Trenchless Crossing
N/A
1168.1 Unnamed Channel (Roadside Canal)
BC-780a3 W1939.2 Seasonal S2 Isolated Trenched Clear-Span Bridge or Other Regulatory Approved
Crossing Method
Potentially Navigable
1 and 2 Mitigation Measures a) through i)

Trans Mountain Pipeline ULC Navigation and Navigation Safety Plan Trans Mountain Expansion Project April 2017
Page A
-11
TABLE A-1 Cont'd
KP (005) Watercourse Name
Watercourse Crossing ID PXID
Flow Regime
Class (BC) / Classification (Alberta)
Project Proposed Pipeline Crossing
Method
Recommended Vehicle Crossing Method
Flowing Navigability
Status
Potential Residual Effects on Navigation
and Navigation Safety (see Potential Residual Effects in
Table 3)
Mitigation Measures (See
Letter Referenced Mitigation in
Table 4)
1168.3 Dawes Hill Creek BC-780b W1813.3 Perennial S2 Trenchless Existing or Clear-Span Bridge
Potentially Navigable
No Effects, due to Trenchless Crossing
N/A
1169.3
Como Creek BC-781 W1815.4 Perennial S2 No Instream Work Proposed; Crossing
Over/Under Channelized
Section
Existing or Clear-Span Bridge
Potentially Navigable
No Effects, due to No Instream work
N/A
1171.2 Unnamed Channel (Roadside Ditch)
BC-781a W10065.1 Seasonal S2 Isolated Trenched Existing or Other Regulatory Approved
Crossing Method
Potentially Navigable
1 and 2 Mitigation Measures a) through i)
1171.8 Nelson Creek BC-782 W1816.3 Perennial S2 Trenchless Clear-Span Bridge Potentially Navigable
No Effects, due to Trenchless Crossing
N/A
1172.2
Stoney Creek BC-785 W1820.2 Perennial S2 No Instream Work Proposed; Crossing
Over/Under Channelized
Section
Clear-Span Bridge Potentially Navigable
No Effects, due to No Instream work
N/A

Trans Mountain Pipeline ULC Navigation and Navigation Safety Plan Trans Mountain Expansion Project April 2017
Page A
-12
TABLE A-2
NAVIGABLE AND POTENTIALLY NAVIGABLE WATERCOURSES CROSSED BY POWER LINES
KP Watercourse Name Watercourse Crossing ID Flow Regime
Class (BC) / Classification
(Alberta)
Project Proposed Pipeline Crossing
Method
Recommended Vehicle Crossing Method Flowing
Navigability Status
Potential Residual Effects on Navigation and Navigation Safety (see Potential Residual
Effects in Table 3)
Mitigation Measures (See Letter Referenced Mitigation
in Table 4) N/A North Thompson River BCT-2 Perennial S1A Install Transmission
Poles Outside of Riparian Management
Area
Existing or Access Both Banks
Navigable No Effects, due to No Instream Work
N/A
TABLE A-3
NAVIGABLE AND POTENTIALLY NAVIGABLE WATERCOURSES CROSSED BY THE MARINE TERMINAL
KP Watercourse
Name Watercourse Crossing ID
Flow Regime
Class (BC) / Classification
(Alberta)
Project Proposed Pipeline Crossing
Method
Recommended Vehicle Crossing Method
Flowing Navigability
Status
Potential Residual Effects on Navigation and Navigation
Safety (see Potential Residual Effects in Table 3)
Mitigation Measures (See Letter Referenced Mitigation in Table 4)
N/A Burrard Inlet N/A N/A N/A N/A N/A Navigable 3 and 4 Mitigation measures o) through ee)

Trans Mountain Pipeline ULC Navigation and Navigation Safety Plan Trans Mountain Expansion Project April 2017
Page A
-13
TABLE A-4
NAVIGABLE WETLANDS CROSSED BY THE PIPELINE CONSTRUCTION RIGHT-OF-WAY
KP (005)
Wetland Unique Identifier
Flow Regime / Class (BC) /
Classification (Alberta)
Project Proposed Pipeline Crossing Method Recommended Vehicle Crossing Method Flowing
Navigability Status
Potential Residual Effects on Navigation and Navigation Safety (see Potential Residual
Effects in Table 3)
Mitigation Measures (See Letter Referenced Mitigation in
Table 4) Wetlands – Alberta
59.4 to 59.5
Edmo-Edso_WC42apoint6
Open Water Pond The majority of wetlands along the pipeline route will be crossed using
conventional trenched methods during pipeline construction. The approach taken to determine the specific crossing and mitigation
methods implemented for wetland crossings will be determined on a
case-by-case basis, in consideration of season, wetland
class, water depth, length and location of the crossing, vegetation
types, substrate type, season of construction, and buoyancy
requirements for the pipeline.1
Depending on the characteristics of a particular wetland, and the construction season, a decision will be made as to
the type of vehicle and equipment access required. In frozen winter conditions, many wetlands may be able to be
frozen solid enough to support construction equipment travel. Deeper wetlands or those with flowing water may not be frozen soils enough to provide winter access for
heavy equipment.2
Navigable 1 and 2 Mitigation measures a) through n)
65.5 to 65.6
Edmo-Edso_WC48apoint6
Open Water Pond Navigable 1 and 2 Mitigation measures a) through n)
85.1 to 85.2
Edmo-Edso_WC68point17
Open Water Pond Navigable 1 and 2 Mitigation measures a) through n)
90.2 to 90.3
Edmo-Edso_WC73bpoint4
Open Water Pond Navigable 1 and 2 Mitigation measures a) through n)
125.0to 125.9
Edmo-Edso_WC108point11
Emergent Marsh Navigable 1 and 2 Mitigation measures a) through n)
170.4 to 170.5
Edmo-Edso_WC153point33
Open Water Pond Navigable 1 and 2 Mitigation measures a) through n)
177.8 to 177.9
Edmo-Edso_WC160cpoint82
Open Water Component
Navigable 1 and 2 Mitigation measures a) through n)
235.0 to 235.5
Edso-Hint_WC217b Emergent Marsh Navigable 1 and 2 Mitigation measures a) through n)
Wetlands – BC 730.4 to
730.5 Blue-
Darf_WC707dpoint7 Open Water Pond
/ W1 The majority of wetlands along the pipeline route will be crossed using
conventional trenched methods during pipeline construction. The approach taken to determine the specific crossing and mitigation
methods implemented for wetland crossings will be determined on a
case-by-case basis, in consideration of season, wetland
class, water depth, length and location of the crossing, vegetation
types, substrate type, season of construction, and buoyancy
requirements for the pipeline.1
Depending on the characteristics of a particular wetland, and the construction season, a decision will be made as to
the type of vehicle and equipment access required. In frozen winter conditions, many wetlands may be able to be
frozen solid enough to support construction equipment travel. Deeper wetlands or those with flowing water may not be frozen soils enough to provide winter access for
heavy equipment.2
Navigable 1 and 2 Mitigation measures a) through n)
Notes: 1 Measures will be taken to mitigate effects of instream works conducted in open water areas (i.e., emergent marshes and open water ponds) using barriers and sediment controls. Salvaged surface material and trench spoil material will be used to construct a barrier/dam in moderate to deep water areas. Sediment barriers or curtains will also be utilized to provide sediment control. Alternate dam materials such as an Aquadam© or meter bags may also be used where warranted.
2 Ramp materials (e.g., wooden mats or log corduroy) may be used in both frozen and non-frozen conditions to facilitate access. In open water situations it may be necessary to combine culverts and/or temporary bridges in access ramps. It may also be necessary or preferred to construct a shoo-fly around the wetland for use by the majority of equipment and vehicles to travel on and restricting equipment access through the wetland to just the equipment needed to install the pipeline crossing.

Trans Mountain Pipeline ULC Navigation and Navigation Safety Plan Trans Mountain Expansion Project April 2017
Page A
-14
TABLE A-5
NAVIGABLE AND POTENTIALLY NAVIGABLE WATERCOURSES CROSSED BY REACTIVATION ACTIVITY
KP (TMPL) Watercourse Name
Watercourse Crossing ID
Flow Regime
Class (BC) / Classification
(Alberta)
Project Proposed Pipeline Crossing
Method Vehicle Crossing Method Flowing
Navigability Status
Potential Residual Effects on
Navigation and Navigation Safety
(see Potential Residual Effects in
Table 3)
Mitigation Measures (See Letter Referenced Mitigation in Table 4)
Watercourses - Alberta 360.2 Snaring River TMR-46 Perennial Class C Isolated Trenched Clear-Span Bridge Navigable 1 and 2 Mitigation measures a)
through n) 389.8 Minaga Creek TMR-72 Perennial Class C Isolated Trenched Clear-Span Bridge Potentially
Navigable 1 and 2 Mitigation measures a)
through i) 403.9 Miette River TMR-81 Perennial Class C Isolated Trenched Clear-Span Bridge Navigable 1 and 2 Mitigation measures a)
through n) Watercourses - BC
411.6 Rockingham Creek TMR-89 Perennial S1 Isolated Trenched Access from Either Bank, Adjacent Highway Bridge
Potentially Navigable
1 and 2 Mitigation measures a) through i)
416.3 Yellowhead Creek TMR-94 Perennial S1 Isolated Trenched Access from Either Bank
Potentially Navigable
1 and 2 Mitigation measures a) through i)
420.3 Ghita Creek TMR-98 Perennial S2 Isolated Trenched Clear-Span Bridge Potentially Navigable
1 and 2 Mitigation measures a) through i)
423.8 Fraser River TMR-110 Perennial S1 Isolated Trenched Access from Either Bank
Navigable 1 and 2 Mitigation measures a) through n)
461.2 Fraser River TMR-228 Perennial S1 Open-Cut Access from Either Bank, or Clear-Span
Bridge
Navigable 1 and 2 Mitigation measures a) through n)
Notes: Based on known disturbance activity areas as of February 2017 specific to TMEP; not related to operations and maintenance of TMPL.

Trans Mountain Pipeline ULC Navigation and Navigation Safety Plan Trans Mountain Expansion Project April 2017
Page A
-15
TABLE A-6
NAVIGABLE AND POTENTIALLY NAVIGABLE WATERCOURSES CROSSED BY CONTINGENCY ROUTES
KP Watercourse Name Watercourse Crossing ID PXID
Flow Regime
Class (BC) / Classification
(Alberta)
Project Proposed Contingency Pipeline
Crossing Method
Recommended Vehicle Crossing Method Flowing
Navigability Status
Potential Residual Effects on Navigation
and Navigation Safety (see Potential Residual Effects in
Table 3)
Mitigation Measures (See
Letter Referenced Mitigation in
Table 4) Watercourses - Alberta 134.4 Pembina River
(Alternate) AB-66P2 PRC-
W001 Perennial Class C Isolated Trenched or
Open-Cut Inside the Least Risk Biological
Window
Existing Crossing Navigable 1 and 2 Mitigation measures a) through n)
Watercourses - BC TBD Raft River (Alternate) BC-309a RRC-
W001 Perennial S1B Trenchless Access Both
Banks Navigable No Effects, due to
Trenchless crossing N/A
TABLE A-7
NAVIGABLE AND POTENTIALLY NAVIGABLE WATERCOURSES CROSSED BY NEW TEMPORARY OR PERMANENT BRIDGE CROSSINGS
Watercourse Name Watercourse Crossing ID AXID Flow
Regime Class (BC) /
Classification (Alberta)
Existing Structure
Type
Existing Crossing Structure Condition
Recommended Vehicle Crossing Method
Navigability Status
Potential Residual Effects on Navigation
and Navigation Safety (see Potential Residual Effects in
Table 3)
Mitigation Measures (See Letter Referenced Mitigation in Table 4)
Alberta
None N/A N/A N/A N/A N/A N/A N/A N/A N/A N/A
BC
Peavine Creek BCVA-91 4-B-72-A-2-W01 Seasonal S2 - - Clear-Span Bridge Potentially
Navigable 1 and 2 Mitigation measures a)
through i)
Nehalliston Creek BCVA-104a 4-B-120-C-2-W01 Perennial S2 - - Clear-Span Bridge Potentially
Navigable 1 and 2 Mitigation measures a)
through i)
Lemieux Creek BCVA-105 4-B-128-B-3-W01 Perennial S1B Bridge Functional Existing or Clear-Span
Bridge Potentially Navigable
1 and 2 Mitigation measures a) through i)
Moore Creek BCVA-194 5-B-51-885.7-1-
W01 Perennial S2 Bridge - Existing or Clear-Span
Bridge Potentially Navigable
1 and 2 Mitigation measures a) through i)
Moore Creek BCVA-200 5-B-52-C-4-W01 Perennial S2 Bridge Moderate Existing or Clear-Span
Bridge Potentially Navigable
1 and 2 Mitigation measures a) through i)

Trans Mountain Pipeline ULC Navigation and Navigation Safety Plan Trans Mountain Expansion Project April 2017
Page A
-16
TABLE A-7 Cont’d
Watercourse Name Watercourse Crossing ID AXID Flow
Regime Class (BC) /
Classification (Alberta)
Existing Structure
Type
Existing Crossing Structure Condition
Recommended Vehicle Crossing Method
Navigability Status
Potential Residual Effects on Navigation
and Navigation Safety (see Potential Residual Effects in
Table 3)
Mitigation Measures (See Letter Referenced Mitigation in Table 4)
Coldwater River BCVA-246 5-C-77-B-3-W01 Perennial S1B Bridge Functional
Existing or Clear-Span Bridge or Access Both
Banks Navigable
1 and 2 Mitigation measures a) through n)
Boston Bar Creek BCVA-263 5-D-97-G-3-W01 Perennial S5 - - Clear-Span Bridge Potentially
Navigable 1 and 2 Mitigation measures a)
through i)
Unnamed Channel BCVA-264 5-D-97-H-2-W01 Perennial S5 - - Clear-Span Bridge Potentially
Navigable
1 and 2 Mitigation measures a) through i)
Unnamed Channel BCVA-281 5-D-106-C-2-W01 Seasonal S5 - -
Clear-Span Bridge or Other Regulatory Approved
Crossing Method Potentially Navigable
1 and 2 Mitigation measures a) through i)
Unnamed Channel BCVA-282 5-D-107-A-4-W01 Seasonal S5 - -
Clear-Span Bridge or Other Regulatory Approved
Crossing Method Potentially Navigable
1 and 2 Mitigation measures a) through i)
Karen Creek BCVA-289 6-A-6-B-5-W01 Perennial S2 Bridge Moderate Existing or Clear-Span
Bridge Potentially Navigable
1 and 2 Mitigation measures a) through i)
Unnamed Channel BCVA-306 6-A-63-C-2-W01 Perennial S5/S2 - -
Clear-Span Bridge or Other Regulatory Approved
Crossing Method Potentially Navigable
1 and 2 Mitigation measures a) through i)
Unnamed Channel BCVA-307 6-A-64-B-1-W01 Perennial S1B Culvert Moderate Existing or Clear-Span
Bridge Potentially Navigable
1 and 2 Mitigation measures a) through i)
Browne Creek BCVA-312 W11474.0 Seasonal S2 - - Clear-Span Bridge Potentially Navigable
1 and 2 Mitigation measures a) through i)
Unnamed Channel (Irrigation Ditch) BCVA-313 W11473.0 Seasonal S3 Culvert Moderate Existing or Ramp and
Culvert Potentially Navigable
1 and 2 Mitigation measures a) through i)
Unnamed Channel BCVA-314 W11475.0 Perennial S3 Culvert Moderate Existing or Clear-Span Bridge
Potentially Navigable
1 and 2 Mitigation measures a) through i)
Unnamed Channel BCVA-314a W12470.0 Perennial S3 Culvert Functional Existing or Clear-Span Bridge
Potentially Navigable
1 and 2 Mitigation measures a) through i)
Bon Accord Creek BCVA-315 W11476.0 Perennial S3 Culvert Functional Existing or Clear-Span Bridge
Potentially Navigable
1 and 2 Mitigation measures a) through i)

Trans Mountain Pipeline ULC Navigation and Navigation Safety Plan Trans Mountain Expansion Project April 2017
01-13283-GG-0000-CHE-RPT-0010 R1
Page B-1
APPENDIX B
CONSULTATION AND ENGAGEMENT Consultation and engagement activities related to the Navigation and Navigation Safety Plan were completed with Appropriate Government Authorities, potentially affected Aboriginal groups as well as commercial and recreational waterway users. Opportunities to discuss navigation and navigation safety and to identify issues or concerns were also provided to public stakeholders during meetings, workshops and ongoing engagement activities. Consultation and engagement opportunities began in May 2012 with the Project announcement and are ongoing.
1.0 Consultation and Engagement Overview: Draft Plan Development Reports on public consultation activities completed between May 2012 and June 30, 2015 were filed with the National Energy Board (NEB) and are available in the Application (Volume 3A: Stakeholder and Volume 3B: Aboriginal; Filing ID A55987) as well as in Consultation Update No. 1 and Errata, Technical Update No. 1 (Filing ID A59343) / Consultation Update 2 (Filing IDs A62087 and A62088), Consultation Update 3 (Filing IDs A4H1W2 through A4H1W8) and Consultation Update 4 (Filing ID A72224). These reports include results of consultation conducted to date, identification of issues and concerns as well as Trans Mountain’s response and are included below. Where appropriate, Trans Mountain’s response has been updated to reflect information developed since the original response was provided during the NEB proceeding for the Project.
Consultation and engagement activities completed between July 1, 2015 and December 16, 2016 have not been filed on the public record with the NEB. Any new issues and concerns identified during this period, as well as Trans Mountain’s response, are described below.
2.0 Consultation and Engagement Overview: Draft Plan The draft Plan was released for review and feedback on September 16, 2016. The comment period closed on December 16, 2016. Email or mail notification regarding the Plan was sent to 141 public stakeholders, 17 government authorities, 114 Aboriginal groups and key affected commercial and recreational waterway user organizations. The notification included a summary description of the Plan, a request for review, the timing of the comment period and contact information. Aboriginal groups were offered the opportunity for an in-person meeting to review the Plan. See Appendix C for a complete list of notified stakeholders. In addition to direct notification, the online posting of each Plan was promoted through Trans Mountain's weekly e-newsletter, Trans Mountain Today, which provides Project updates, regulatory information, stories and interviews to more than 6,000 subscribers. Each week Trans Mountain Today included a focus on a specific plan, or group of plans, as well as a reminder of all plans available for review.
2016 • September 22 - Wildlife Mitigation and Habitat Restoration Plans • September 29 - Pipeline Environmental Protection Plans • October 6 - Air Quality Management Plans • October 13 - Watercourse and Water Ecosystems Plans • October 20 - Vegetation Management Plans • October 27 - Air Quality Plans • November 3 - Socio-Economic Effects Monitoring Plan • November 10 - Access Management Plan • December 22 - General promotion all plans • December 29 - General promotion all plans
2017 • January 5 - General promotion all plans • January 12 - General promotion all plans

Trans Mountain Pipeline ULC Navigation and Navigation Safety Plan Trans Mountain Expansion Project April 2017
01-13283-GG-0000-CHE-RPT-0010 R1
Page B-2
Trans Mountain is committed to ongoing engagement throughout the life of the Project. The start and end date for the review and comment period for each environmental management plan is defined. These timelines are required to allow time for preparation of the final Plan in order to meet regulatory requirements and NEB submission dates. Although a formal review period may be closed, each plan remains available for review on transmountain.com.
3.0 Consultation and Engagement: Activities and Feedback
Consultation and engagement activities completed with identified stakeholder groups are described below, including: public stakeholders (Section 3.1); Appropriate Government Authorities and waterway users (Section 3.2); and Aboriginal groups (Section 3.3).
Feedback on the draft Plan, Trans Mountain’s response, and where each issue or concern is addressed in the Plan has been outlined in each section.
3.1 Public Consultation
3.1.1 Public Consultation Summary – May 2012 to June 2015 No public feedback regarding navigation and navigation safety issues pertinent to this Plan was received between May 2012 and June 30, 2015.
3.1.2 New Interests, Issues, Concerns and Response – July 2015 to January 2017 Table B-1 includes new interests, issues and concerns, as well as Trans Mountain’s response with respect to navigation and navigation safety aspects pertinent to this Plan identified through public consultation and engagement activities between July 2015 and January 2017.
TABLE B-1
NEW INTERESTS, ISSUES, CONCERNS FROM PUBLIC CONSULTATION RELATED TO NAVIGATION AND NAVIGATION SAFETY PLAN (JULY 2015 TO JANUARY 2017)
Stakeholder Name
Method of Contact
Date of Consultation
Activity Issue or Concern Trans Mountain Response Where Addressed in this
Plan N/A Westridge Marine
Terminal/Burnaby Terminal Workshops
11/24/2016 Consider Automatic Identification Systems (AIS) as best practice for navigation (discussion required with VFPA)
TMEP followed up with the CCG. In the opinion of the CCG, AIS marking for the dock in the sheltered confines of the Burrard Inlet was unnecessary.
N/A
3.2 Appropriate Government Authority and Waterway User Consultation Through the course of Trans Mountain’s extensive engagement program, a range of issues and concerns were raised by various government authorities and waterway users about the navigational use of certain navigable waterways.
3.2.1 Appropriate Government Authority and Waterway User Consultation Summary – May 2012 to June 2015 Consultation feedback applicable to navigation and navigation safety pertinent to this Plan received during consultation and engagement activity with government authorities and waterway users between May 2012 and June 30, 2015 is summarized in Table B-2, which focuses on waterways of stakeholder interest, associated issues raised and how Trans Mountain has responded to them.

Trans Mountain Pipeline ULC Navigation and Navigation Safety Plan Trans Mountain Expansion Project April 2017
01-13283-GG-0000-CHE-RPT-0010 R1
Page B-3
TABLE B-2
SUMMARY OF ISSUES AND CONCERNS RELATED TO NAVIGATION AND NAVIGATION SAFETY (MAY 2012 TO JUNE 2015)
Watercourse Issue/Concern Stakeholder Group Trans Mountain Response Appropriate Government Authorities Thompson River Construction impacts to
Kamloops Water Aerodrome activity. Will require NAV CANADA notification.
Kamloops Airport Authority • TMEP will ensure that all NAV CANADA notifications are carried in accordance with the applicable Navigation Protection Program requirements.
Fraser River Concern about existing pipeline crossing of Fraser River – pipe is suspended and boats could get caught on pipe at low water. Not sure if pipe is TMPL.
City of Coquitlam • In use and decommissioned TMPL are buried at crossing location. TMEP will also be buried at crossing location.
• Follow-up within Trans Mountain showed that the TMPL is not suspended. The suspended pipe noted by stakeholder is not the TMPL.
Pembina River Impacts to commercial recreation businesses.
Parkland County • Planned crossing of Pembina River is trenchless. No anticipated impacts to navigation or fishing activities.
Burrard Inlet Interest in enhancements to Westridge Marine Terminal navigation aids for recreational vessels.
Village of Belcarra • Navigational aids are not in the Application now but will be placed depending on dock layout. See discussion of marine construction safety boom in Table 4 (point dd) and Appendix E of this Plan.
Ensure lighting at Westridge Marine Terminal meets requirements and does not interfere with navigation.
Vancouver Fraser Port Authority (VFPA)
• Recommendations and best practices have been applied in the current design and assessment to minimize lighting and light impact while meeting regulatory requirements for both navigation and industrial lighting for operational purposes. Trans Mountain has engaged with regulators including the Canadian Coast Guard, the Pacific Pilotage Authority, the VFPA and Transport Canada and reviewed with BC Coast Pilots regarding the plans for Westridge Marine Terminal’s navigational light marks.
• The Project will continue to engage with stakeholders such as local residents and neighbouring municipalities regarding the overall lighting plan.
• As per NEB Condition 82, Trans Mountain is developing a Light Emissions Management Plan for the Westridge Marine Terminal
Waterway Users Upper Fraser River
Concern regarding interruption to recreation business due to open cut of Fraser River at Rearguard Station.
Commercial recreation tenure holders (Stellar Descents Backcountry Adventures, Mount Robson White Water Rafting and Maligne Rafting Adventures)
• TMEP proposed revised pipeline corridor no longer crosses the Upper Fraser River (see Part 2, Technical Update #4, filed December 2014).
Winter construction preferred; do not want to be shut-down during short summer season.
Fraser River Concern about construction impact on shrimp trawlers on Fraser River.
Pacific Coast Shrimper's Association
• Planned crossing of Fraser River is trenchless. No anticipated impacts to navigation or fishing activities.
Burrard Inlet Increased risk of marine vessel collisions near Westridge Marine Terminal due to expanded dock.
North Shore No Pipeline Expansion
• The shortest distance that will occur between a tanker docked at Westridge Marine Terminal and: - the navigation beacon at Roche Point will be
approximately 850 m; - the high tide line at the boat launch at Cates Park will be
approximately 1,020 m; and - the southeast corner of the dock at Cates Park will be
approximately 1,000 m. • The siting of the dock and the clearances noted above will
not impede recreational boaters or commercial traffic. • Trans Mountain continues to work with the VFPA (previously
referred to as the Port Metro Vancouver) on permitting and design requirements of the Westridge Marine Terminal.
Coordinating movement of vessels from all the different docks.
Marine Studies Workshop participant
• Effects related to the movement of tankers and tugs to and from the Westridge Marine Terminal are outside the scope of this Plan; however, there are a series of checks and balances involving VFPA, vessels communicating with each other and the CCG.

Trans Mountain Pipeline ULC Navigation and Navigation Safety Plan Trans Mountain Expansion Project April 2017
01-13283-GG-0000-CHE-RPT-0010 R1
Page B-4
3.2.2 Feedback Regarding the Draft Plan A summary of consultation feedback from Appropriate Government Authorities and waterway users related to the draft Plan is provided in Table B-3.
TABLE B-3
SUMMARY OF APPROPRIATE GOVERNMENT AUTHORITY AND WATERWAY USER CONSULTATION FEEDBACK RELEVANT TO NAVIGATION AND NAVIGATION SAFETY PLAN
(JULY 2015 TO FEBRUARY 2017)
Invited Stakeholder Group/
Agency Name Method of Contact
Date of Consultation
Activity Feedback/Stakeholder Response Trans Mountain Response
Where Addressed in
the Plan BC Oil and Gas Commission
Email December 16, 2016 Noted that in Table A‐4, “Navigable Wetlands Crossed By The Pipeline Construction Right‐of‐Way” is not referenced in Section 3.1 of the document, unlike all other items listed Table A‐4.
The Plan has been updated to reflect this change; now also referencing Table A-4 (wetlands) in Section 3.1 of the document.
Section 3.1 of this Plan
Transport Canada Email March 17, 2017 Inquired regarding the installation and operation of a barrier around Westridge Marine Terminal during construction.
Barriers were not discussed in part of the NEB hearings, however, Trans Mountain will have a marine safety construction boom around Westridge Marine Terminal during construction to safeguard marine shipping and construction activities.
Table 4, point cc) of this Plan. Also, Appendix E of this Plan.
Trans Mountain has also conducted ongoing engagement with appropriate government authorities and marine commercial and recreation waterway users pertinent to Burrard Inlet in the context of its general marine safety program, which will inform the future NEB Condition 131 Marine Public Outreach Plan. This engagement information has been filed with the preliminary application for the Westridge Marine Terminal expansion to the VFPA and is attached as Appendix F of this Plan. While no additional issues or concerns pertinent to this Plan have emerged, it provides an overview of the range of government authorities and marine commercial and recreation waterway users pertinent to Burrard Inlet that have been engaged and will continue to be engaged by the Project.
3.3 Aboriginal Engagement Since April 2012, Trans Mountain has engaged with Aboriginal groups who might have an interest in the Project or have Aboriginal interests potentially affected by the Project, based on the proximity of their community and their assertion of traditional and cultural use of the land along the proposed pipeline corridor to maintain a traditional lifestyle. The objectives of Aboriginal engagement are to:
• have an open, transparent and inclusive process that seeks to exchange information in a respectful manner;
• address concerns shared by those who might have an interest in the Project or have Aboriginal interests potentially affected by the Project;
• incorporate feedback into Project planning and execution; and
• provide opportunities to maximize Project benefits to Aboriginal communities and Aboriginal groups.
A comprehensive Aboriginal engagement process is lead by experienced engagement advisors in Alberta and BC, specialized in the areas of Aboriginal relations, law, economic development, education, training, employment and procurement. Trans Mountain’s engagement process for the Project is flexible, allowing each community and group to engage in meaningful dialogue in the manner they choose and in a way to meet their objectives and values.

Trans Mountain Pipeline ULC Navigation and Navigation Safety Plan Trans Mountain Expansion Project April 2017
01-13283-GG-0000-CHE-RPT-0010 R1
Page B-5
Each community has the opportunity to engage with Trans Mountain, depending on Project interests and potential effects. The following opportunities to engage have been provided:
• Project announcement;
• initial contact with Aboriginal community or Aboriginal group;
• meetings with Chief and Council and meetings with staff;
• host community information session(s);
• conduct Traditional Land Use studies and socio-economic interviews;
• identify interests and concerns; and
• identify mitigation options.
Issues and concerns related to navigation and navigation safety pertinent to this Plan raised during Aboriginal engagement from between early 2012 to February 2017 are summarized in Table B-4.
TABLE B-4
SUMMARY OF ABORIGINAL CONCERNS REGARDING NAVIGATION AND NAVIGATION SAFETY
Issue or Concern Summary Trans Mountain Response
Where Addressed Summary Aboriginal Group
Requests more information regarding NEB Condition 48
Pacheedaht First Nation NEB Condition 48 and NEB Condition 131 - Marine Public Outreach Program will be provided to the community and there is opportunity for a follow-up meeting at the request of the community.
Appendix D
Trans Mountain continues its liaison with Indigenous and Northern Affairs Canada, the Government of Canada’s Major Projects Management Office, the BC Ministry of Aboriginal Relations and Reconciliation, and the Alberta Ministry of Aboriginal Affairs to provide updates regarding Trans Mountain’s engagement activities with Aboriginal groups.
Identifying Aboriginal Groups for Consultation Trans Mountain used the First Nations Consultative Area Database Public Map Service to identify the Aboriginal groups with traditional territories that cross navigational waterways. Appendix D lists the Aboriginal groups identified for consultation. Throughout regular engagement with TMEP, any Aboriginal groups were added to the list if they identified navigation on navigable waters as a concern.
Consultation Activities A letter was sent to the Aboriginal groups listed in Appendix D with a copy of the draft Plan on September 16, 2016. Trans Mountain followed up with each Aboriginal group by telephone, email or in person to ensure No feedback was received on this Plan.
This final Navigation and Navigation Safety Plan will be shared with the Aboriginal groups at the same time as the Plan is filed with the NEB in 2017.

Trans Mountain Pipeline ULC Navigation and Navigation Safety Plan Trans Mountain Expansion Project April 2017
01-13283-GG-0000-CHE-RPT-0010 R1
Page C-1
APPENDIX C
RECORD OF STAKEHOLDER NOTIFICATIONS OF DRAFT PLAN
TABLE C-1
RECORD OF NOTIFICATION
Government Authority/Stakeholder Group Contact Name (if applicable) Date Method of Contact
Aboriginal Groups (please refer to Appendix D) N/A September 26, 2016 Letter
Vancouver Fraser Port Authority Tim Blair September 20, 2016 Email Jasper National Park of Canada Mayabe Dia September 20, 2016 Email Alberta Environment and Parks Corinee Kristensen September 20, 2016 Email Ministry of Transportation and Infrastructure Lisa Gow September 20, 2016 Email
BC Parks Ken Morrison September 20, 2016 Email BC Oil and Gas Commission Brian Murphy September 20, 2016 Email Ministry of Natural Gas Development Linda Beltrano September 20, 2016 Email BC Forests, Lands and Natural Resource Operations Andrea Mah December 22, 2016 Email
BC Forests, Lands and Natural Resource Operations Susan Fitton September 20, 2016 Email
FVAQC Roger Quan October 21,, 2016 Email Environment and Climate Change Canada (ECCC) Phil Wong October 21, 2016 Email
ECCC Rachel Mayberry October 28,, 2016 Email ECCC Coral Deshield December 21,, 2016 Email ECCC Phil Wong December 21, 2016 Email Vancouver Fraser Port Authority Patrick Coates September 20, 2016 Email Department of Fisheries and Oceans Sandra Hollick-Kenyon December 3, 2016 Email Department of Fisheries and Oceans Alston Bonamis December 3, 2016 Email City of Edmonton N/A September 19 – 23, 2016 Letter City of Spruce Grove N/A September 19 – 23, 2016 Letter Municipality of Jasper N/A September 19 – 23, 2016 Letter Parkland County N/A September 19 – 23, 2016 Letter Strathcona County N/A September 19 – 23, 2016 Letter Town of Edson N/A September 19 – 23, 2016 Letter Town of Hinton N/A September 19 – 23, 2016 Letter Town of Stony Plain N/A September 19 – 23, 2016 Letter Village of Wabamun N/A September 19 – 23, 2016 Letter Yellowhead County N/A September 19 – 23, 2016 Letter City of Kamloops N/A September 19 – 23, 2016 Letter City of Kamloops Royal Canadian Mounted Police (RCMP) Detachment
N/A September 19 – 23, 2016 Letter
Kamloops Hotel Association N/A September 19 – 23, 2016 Letter Kamloops Chamber of Commerce N/A September 19 – 23, 2016 Letter Kamloops Ministry of Jobs, Tourism, Skills Training
N/A September 19 – 23, 2016 Letter
City of Merritt N/A September 19 – 23, 2016 Letter City of Merritt RCMP Detachment N/A September 19 – 23, 2016 Letter Clearwater Employment Services N/A September 19 – 23, 2016 Letter Tourism Wells Grey N/A September 19 – 23, 2016 Letter Clearwater Chamber of Commerce N/A September 19 – 23, 2016 Letter District of Clearwater N/A September 19 – 23, 2016 Letter District of Clearwater RCMP Detachment
N/A September 19 – 23, 2016 Letter
Interior Health N/A September 19 – 23, 2016 Letter Merritt Chamber of Commerce N/A September 19 – 23, 2016 Letter Northern Health N/A September 19 – 23, 2016 Letter

Trans Mountain Pipeline ULC Navigation and Navigation Safety Plan Trans Mountain Expansion Project April 2017
01-13283-GG-0000-CHE-RPT-0010 R1
Page C-2
TABLE C-1 Cont’d
Regulator/Stakeholder Group Contact Name (if applicable) Date Method of Contact Regional District of Fraser Fort George
N/A September 19 – 23, 2016 Letter
Thompson Nicola Regional District N/A September 19 – 23, 2016 Letter Town of Blue River N/A September 19 – 23, 2016 Letter Venture Kamloops N/A September 19 – 23, 2016 Letter Village of Valemount N/A September 19 – 23, 2016 Letter Village of Valemount RCMP Detachment
N/A September 19 – 23, 2016 Letter
Valley District N/A September 19 – 23, 2016 Letter Valemount Learning Centre N/A September 19 – 23, 2016 Letter Work Skills BC- Valemount N/A September 19 – 23, 2016 Letter Valemount and Area Recreation Development Association (VARDA)
N/A September 19 – 23, 2016 Letter
Valemount Chamber of Commerce N/A September 19 – 23, 2016 Letter Grassland’s Conservation Council N/A September 19 – 23, 2016 Letter Abbotsford Chamber of Commerce N/A September 19 – 23, 2016 Letter Abbotsford Police Department N/A September 19 – 23, 2016 Letter ASCA N/A September 19 – 23, 2016 Letter BC Invasive Species N/A September 19 – 23, 2016 Letter BC Ministry of Children and Family Development
N/A September 19 – 23, 2016 Letter
BC Ministry of Social Development N/A September 19 – 23, 2016 Letter BC Nature N/A September 19 – 23, 2016 Letter BC Wildlife Federation N/A September 19 – 23, 2016 Letter Burnaby Board of Trade N/A September 19 – 23, 2016 Letter Burnaby RCMP Detachment N/A September 19 – 23, 2016 Letter Chilliwack Chamber of Commerce N/A September 19 – 23, 2016 Letter Chilliwack Economic Partners N/A September 19 – 23, 2016 Letter City of Abbotsford N/A September 19 – 23, 2016 Letter City of Burnaby N/A September 19 – 23, 2016 Letter City of Chilliwack N/A September 19 – 23, 2016 Letter City of Coquitlam N/A September 19 – 23, 2016 Letter City of New Westminster N/A September 19 – 23, 2016 Letter City of Port Coquitlam N/A September 19 – 23, 2016 Letter City of Port Moody N/A September 19 – 23, 2016 Letter City of Surrey N/A September 19 – 23, 2016 Letter Coquitlam RCMP Detachment N/A September 19 – 23, 2016 Letter Corporation of Delta N/A September 19 – 23, 2016 Letter District of Hope N/A September 19 – 23, 2016 Letter Eagle Creek N/A September 19 – 23, 2016 Letter Fraser Valley Invasive Plant Council N/A September 19 – 23, 2016 Letter Fraser Valley Regional District N/A September 19 – 23, 2016 Letter Glen Valley Watershed Society N/A September 19 – 23, 2016 Letter Hope Chamber of Commerce N/A September 19 – 23, 2016 Letter Hope Community Policing Office N/A September 19 – 23, 2016 Letter Langley Chamber of Commerce N/A September 19 – 23, 2016 Letter LEPS N/A September 19 – 23, 2016 Letter LFVAQCC N/A September 19 – 23, 2016 Letter Metro Vancouver N/A September 19 – 23, 2016 Letter Newton RCMP Detachment N/A September 19 – 23, 2016 Letter RCMP Division ‘E’ N/A September 19 – 23, 2016 Letter Sapperton Fish and Game N/A September 19 – 23, 2016 Letter Stoney Creek N/A September 19 – 23, 2016 Letter Surrey Board of Trade N/A September 19 – 23, 2016 Letter Surry Environmental Partners N/A September 19 – 23, 2016 Letter Surrey RCMP Detachment N/A September 19 – 23, 2016 Letter Township of Langley N/A September 19 – 23, 2016 Letter Township of Langley RCMP Detachment
N/A September 19 – 23, 2016 Letter
TriCities Chamber of Commerce N/A September 19 – 23, 2016 Letter Upper Fraser Valley Regional Detachment
N/A September 19 – 23, 2016 Letter
Village of Anmore N/A September 19 – 23, 2016 Letter Village of Belcarra N/A September 19 – 23, 2016 Letter Yorkson N/A September 19 – 23, 2016 Letter ACGI Shipping N/A September 19 – 23, 2016 Letter

Trans Mountain Pipeline ULC Navigation and Navigation Safety Plan Trans Mountain Expansion Project April 2017
01-13283-GG-0000-CHE-RPT-0010 R1
Page C-3
TABLE C-1 Cont’d
Regulator/Stakeholder Group Contact Name (if applicable) Date Method of Contact Barnett Marine Park N/A September 19 – 23, 2016 Letter BC Ambulance N/A September 19 – 23, 2016 Letter BC Chamber of Shipping N/A September 19 – 23, 2016 Letter BC Coast Pilots N/A September 19 – 23, 2016 Letter BROKE (Burnaby Residents Opposed to Kinder Morgan Expansion)
N/A September 19 – 23, 2016 Letter
Canadian Pacific (CP) Rail N/A September 19 – 23, 2016 Letter Canexus- Ero- Newalta-Univar Community Advisory Panal (CAP)
N/A September 19 – 23, 2016 Letter
Canexus Chemicals N/A September 19 – 23, 2016 Letter Chevron N/A September 19 – 23, 2016 Letter Canadian National (CN) Rail N/A September 19 – 23, 2016 Letter Council of Marine Carriers N/A September 19 – 23, 2016 Letter District of North Vancouver N/A September 19 – 23, 2016 Letter Empire Shipping N/A September 19 – 23, 2016 Letter Erco Worldwide N/A September 19 – 23, 2016 Letter First Nation Emergency Services Society (FNESS)
N/A September 19 – 23, 2016 Letter
First Nation Health Authority N/A September 19 – 23, 2016 Letter Fraser Health Authority N/A September 19 – 23, 2016 Letter Inchcape Shipping N/A September 19 – 23, 2016 Letter Island Tug and Barge N/A September 19 – 23, 2016 Letter Kask Brothers N/A September 19 – 23, 2016 Letter Ledcor Resources and Transportation Limited Partnership
N/A September 19 – 23, 2016 Letter
Mason Agency (Shipping Service) N/A September 19 – 23, 2016 Letter MLA- Burnaby Lougheed N/A September 19 – 23, 2016 Letter MLA- Burnaby North N/A September 19 – 23, 2016 Letter MLA- Coquitlam – Burke Mountain N/A September 19 – 23, 2016 Letter MLA- North Vancouver Lonsdale N/A September 19 – 23, 2016 Letter MLA- North Vancouver Seymour N/A September 19 – 23, 2016 Letter MLA- Port Moody- Coquitlam N/A September 19 – 23, 2016 Letter MP- Delta N/A September 19 – 23, 2016 Letter MP- North Burnaby Seymour N/A September 19 – 23, 2016 Letter MP- North Vancouver N/A September 19 – 23, 2016 Letter MP- Vancouver Centre N/A September 19 – 23, 2016 Letter MP- Vancouver East N/A September 19 – 23, 2016 Letter MP- Vancouver Quadra N/A September 19 – 23, 2016 Letter MP- West Vancouver – Sunshine Coast – Sea to Sky Country
N/A September 19 – 23, 2016 Letter
North Shore No Pipeline Expansion (NOPE)
N/A September 19 – 23, 2016 Letter
North Vancouver Chamber of Commerce
N/A September 19 – 23, 2016 Letter
Pacific Coast Terminal N/A September 19 – 23, 2016 Letter Pacific Pilotage Authority N/A September 19 – 23, 2016 Letter Pacific Wildlife Foundation N/A September 19 – 23, 2016 Letter Peter Kiewit Infrastructure Co. N/A September 19 – 23, 2016 Letter Seaspan N/A September 19 – 23, 2016 Letter Shell Terminal N/A September 19 – 23, 2016 Letter Simon Fraser University N/A September 19 – 23, 2016 Letter SMIT Marine N/A September 19 – 23, 2016 Letter Suncor Terminal N/A September 19 – 23, 2016 Letter University of British Columbia Stellar Sea Lion (Marine Mammal) Research Centre
N/A September 19 – 23, 2016 Letter
Vancouver Aquarium N/A September 19 – 23, 2016 Letter Vancouver Board of Trade N/A September 19 – 23, 2016 Letter Vancouver Coastal Health Authority N/A September 19 – 23, 2016 Letter Vancouver Pile and Dredge N/A September 19 – 23, 2016 Letter West Vancouver Chamber of Commerce
N/A September 19 – 23, 2016 Letter
Westward Shipping N/A September 19 – 23, 2016 Letter Wild Bird Trust N/A September 19 – 23, 2016 Letter Metro Vancouver Regional District Ali Ergudenler September 19 – 23, 2016 Email Metro Vancouver Regional District Roger Quan September 19 – 23, 2016 Email

Trans Mountain Pipeline ULC Navigation and Navigation Safety Plan Trans Mountain Expansion Project April 2017
01-13283-GG-0000-CHE-RPT-0010 R1
Page D-1
APPENDIX D
ABORIGINAL GROUPS ENGAGED ON THE NAVIGATION AND NAVIGATION SAFETY PLAN
• Adams Lake Indian Band
• Aitchelitz First Nation (Stó:lō)
• Alexander First Nation
• Alexis Nakota First Nation
• Aseniwuche Winewak Nation
• Ashcroft Indian Band (Nlaka’pamux Nation)
• Asini Wachi Nehiyawak
• Boothroyd Band (Nlaka’pamux Nation)
• Boston Bar Band (Nlaka’pamux Nation)
• British Columbia Métis Federation
• Canim Lake Band (Tsq’escen')
• Canoe Creek (Stswecem'c Xgat'tem) Indian Band
• Chawathil First Nation (Stó:lō)
• Cheam First Nation (Stó:lō)
• Clinton Indian Band / Whispering Pines First Nation
• Coldwater Indian Band (Nlaka’pamux Nation)
• Cook’s Ferry Indian Band (Nlaka’pamux Nation)
• Enoch Cree Nation
• Ermineskin First Nation
• Foothills Ojibway Society
• High Bar
• Horse Lake First Nation (Treaty 8)
• Kanaka Bar
• Katzie First Nation
• Kelly Lake Cree Nation
• Kelly Lake First Nation
• Kelly Lake Métis Settlement Society
• Ktunaxa Nation
• Kwantlen First Nation (Stó:lō)
• Kwaw-kwaw-Apilt First Nation (Stó:lō)
• Kwikwetlem First Nation
• Leq’a:mel First Nation (Stó:lō)
• Lheidli-T’enneh First Nation

Trans Mountain Pipeline ULC Navigation and Navigation Safety Plan Trans Mountain Expansion Project April 2017
01-13283-GG-0000-CHE-RPT-0010 R1
Page D-2
• Lhtako Dene Nation
• Little Shuswap Indian Band
• Louis Bull Tribe
• Lower Nicola Indian Band (Nlaka’pamux Nation)
• Lower Similkameen Indian Band
• Lyackson First Nation
• Lytton First Nation (Nlaka’pamux Nation)
• Matsqui First Nation (Stó:lō)
• Métis Nation of Alberta Gunn Métis Local 55
• Métis Nation of British Columbia
• Métis Regional Council Zone IV of the Métis Nation of Alberta
• Michel First Nation
• Montana First Nation
• Musqueam Indian Band
• Nakcowinewak Nation of Canada
• Neskonlith Indian Band
• Nicola Tribal Association (Shackan Indian Band, Nooaitch Indian Band and Nicomen Indian Band);
• Nicomen Indian Band (NTA)
• Nooaitch Indian Band (Nlaka’pamux Nation)
• O’Chiese First Nation
• Okanagan Indian Band (added by OGC)
• Oregon Jack Creek Band (Nlaka’pamux Nation)
• Pacheedaht First Nation2
• Paul First Nation
• Pauquachin First Nation
• Penelakut First Nation
• Penticton Indian Band
• Peters Band (Stó:lō)
• Popkum First Nation (Stó:lō)
• Qayqayt First Nation (New Westminster)
• Saddle Lake Cree
• Samson Cree Nation
• Scowlitz First Nation (Stó:lō)
• Seabird Island Band (Stó:lō) 2 Pacheedaht First Nation expressed interest in this Plan subsequent to its draft distribution and will be included in final Plan
distribution.

Trans Mountain Pipeline ULC Navigation and Navigation Safety Plan Trans Mountain Expansion Project April 2017
01-13283-GG-0000-CHE-RPT-0010 R1
Page D-3
• Sechelt
• Semiahmoo First Nation
• Sencoten Alliance
• Shackan Indian Band (Nlaka’pamux Nation)
• Shuswap Indian Band
• Shuswap Nation Tribal Council
• Shxw’ōwhámel First Nation (Stó:lō)
• Shxwha:y Village (Stó:lō)
• Simpcw First Nation
• Siska Indian Band (Nlaka’pamux Nation)
• Skawahlook First Nation (Stó:lō)
• Skeetchestn First Nation
• Skowkale First Nation (Stó:lō)
• Skuppah Indian Band (Nlaka’pamux Nation)
• Skwah First Nation (Stó:lō)
• Soowahlie Indian Band (Stó:lō)
• Splatsin First Nation
• Spuzzum First Nation (Nlaka’pamux Nation)
• Squamish Nation
• Squiala First Nation (Stó:lō)
• St'at'imc Chiefs Council
• Stó:lō Collective
• Stoney Nakoda First Nation
• Sts'ailes Band (Chehalis Indian Band) (Stó:lō)
• St'uxwtews (Bonaparte Indian Band)
• Sucker Creek First Nation
• Sumas First Nation (Stó:lō)
• Sunchild First Nation
• Tk'emlups te Secwepemc (Kamloops)
• Toosey Indian Band
• Treaty 8 Nations of Alberta
• Tsartlip First Nation
• Tsawout First Nation
• Tsawwassen First Nation
• Tseycum First Nation
• Tsilhoqu'tin National Government
• Ts'kwaylaxw (Pavilion Indian Band)

Trans Mountain Pipeline ULC Navigation and Navigation Safety Plan Trans Mountain Expansion Project April 2017
01-13283-GG-0000-CHE-RPT-0010 R1
Page D-4
• Tsleil-Waututh Nation
• Tsuu T'ina First Nation
• Tzeachten First Nation (Stó:lō)
• Union Bar Indian Band (Stó:lō)
• Upper Nicola Band (Nlaka’pamux Nation)
• Upper Similkameen Indian Band
• Whitefish (Goodfish) Lake First Nation
• Williams Lake (T'exelc) Band
• Xatśūll First Nation (Soda Creek)
• Yakweakwioose Band (Stó:lō)
• Yale First Nation (Stó:lō)

Trans Mountain Pipeline ULC Navigation and Navigation Safety Plan Trans Mountain Expansion Project April 2017
01-13283-GG-0000-CHE-RPT-0010 R1
Page E-1
APPENDIX E
WESTRIDGE MARINE CONSTRUCTION SAFETY BOOM

TRANSMOUNTAIN EXPANSION PROJECT
Westridge Marine CONSTRUCTION SAFETY
BOOM Page E-2
WESTRIDGE MARINE CONSTRUCTION SAFETY BOOM
A. Background As required by the National Energy Board a Navigation and Navigation Safety Plan (NNSP)3 has been prepared. The NNSP notes that there is potential of Project construction affecting navigation and navigation safety. This includes disruptions to users during construction or maintenance activities and safety of users entering the construction zone. Therefore, in anticipation of construction pile driving for the Westridge Terminal commencing in the fall of 2017, plans are in hand to install a floating marine construction safety boom around the entire Westridge working zone. The marine construction safety boom, a key element of the NNSP, will be designed to ensure the safety of commercial and recreational users of the local marine area, and the safety of workers working within a clearly demarcated working zone. The overall Westridge area working zone is shown in Figure 1 and is expected to encompass waters covering the future Westridge water lot lease area plus an additional temporary working space.
3 https://www.transmountain.com/navigation-safety-plan

TRANSMOUNTAIN EXPANSION PROJECT
Westridge Marine CONSTRUCTION SAFETY BOOM
Page E-3
Figure 1: Proposed marine construction safety boom showing shipgate (concept only, actual layout might be different)

TRANSMOUNTAIN EXPANSION PROJECT
Westridge Marine CONSTRUCTION SAFETY BOOM
Page E-4
1. Westridge Marine Construction Safety BoomThe marine construction safety boom will consist of floats and suitable vertical panels. Once deployed itwill extend from the high water mark west of the facility, out and around the entire construction footprintincluding the existing ship berth and tying back into the shore on the east side of the facility. The layout ofthe floating safety boom will be configured according to the construction operations and schedule and itslayout during the first and second years of construction are shown as Phase 1 and Phase 2 respectively.
This boom will be moored using suitable anchors to withstand typical and worst case environmental conditions found in this area. It will be fitted with several access points or gates to accommodate the passage of construction vessels and vessels coming to and from the existing Westridge dock. The existing terminal will remain in operation for the majority of the construction period.
The marine construction safety boom will be staged at a nearby yard in the Burrard Inlet. From here it will be assembled and launched.
2. Navigation marksThe marine construction safety boom will be highly visible during the day. The structure will be equipped with reflective placards on both the inside and outside so the marine construction safety boom remains visible between the buoys. At night, in accordance with general Canadian Coast Guard requirements, the boom will be marked by navigation lights (Flashing yellow one nautical mile range) on all offshore corners. Additional lights will be mounted on the ship gate buoys. Radar reflectors will be installed strategically to assist approaching traffic identify the boom on radar during night time and periods of reduced visibility.
3. Phased implementationPhase 1: Late Summer 2017 to August 1, 2018 | Construction activities planned for this period include driving pipe piles for the Berth 1 & 2 dolphins, and driving sheet piles for the foreshore. During this period oil cargo vessels will access the existing dock through a ship gate placed at the eastern side of the marine construction safety boom. The actual layout and deployed extent of the boom may vary from the preliminary working layout shown in Figure 1; however, the minimum distance of the Phase 1 deployed boom from the centerline of the normal shipping route taken by passing vessels will be approximately 313 m (see Figure 2).
Phase 2: August 1, 2018 to December 31, 2019 | Berth 3 construction and the completion of Berths 1 & 2 will be undertaken during this period. During this phase the minimum distance of the deployed boom from the centerline of the normal route taken by passing vessels will be about 217 m (see Figure 2).
During the latter part of this period, cargo oil transfer operations will be shifted to the new Berth 1. Depending on requirements at that time, the ship gate for oil cargo vessels to access the dock will be shifted to the western side of the marine construction safety boom in order to allow access of those vessels to Berth 1. Such a Phase 3 iteration of the marine construction safety boom will be developed based on working experience with the use of the Phase 1 marine construction safety boom.

TRANSMOUNTAIN EXPANSION PROJECT
Westridge Marine CONSTRUCTION SAFETY BOOM
Page E-5
Figure 2: Eastern Burrard Inlet showing current and proposed Westridge dock area with the marine construction safety boom

TRANSMOUNTAIN EXPANSION PROJECT
Westridge Marine CONSTRUCTION SAFETY
BOOM Page E-6
4. Operations During Phase 1, the ship gate will swing inward toward an anchor buoy located by the future Berth 3. The opening will be approximately 180 m wide and if necessary it is anticipated that the opening could be further expanded by about 10 m on its southern side by installing mechanism to pull the inshore ship gate buoy toward shore.
A ship gate size of 180 m is proposed which is expected to be compatible with the results of the desk top navigation simulations previously undertaken by Lantec4,5 and submitted to the TMEP TERMPOL Review Committee and the NEB. Lantec carried out the simulations on a Kongsberg desktop simulator using Aframax vessels with typical worst case environmental conditions by applying wind from the northeast at 25 knots and tidal stream values as per spring tide conditions. Early verification of gate size compatibility and adequacy of maneuvering room has been made by Lantec by carrying out replays of two of the runs after having marked the Phase 1 and Phase 2 marine construction safety boom layout with ship gate coordinates to the simulation, see Figure 3 and Figure 4. Please note that Berth 3 will remain partially built while the existing dock is in operation with construction of the eastern dolphins deferred till after cargo operations have been transferred to new Berth 1 in 2019.
Figure 3: Arriving Aframax - Approaching existing berth through the marine construction safety boom shipgate (new berth 3 eastern dolphins will be constructed after existing berth operations have been transferred to new Berth 1)
4 Summary Report of Manoeuvring Assessment, Westridge Terminals Vancouver Expansion, 4 October 2013 5 Summary Report of Manoeuvring Assessment, Westridge Terminals Vancouver Expansion, 13 August 2014

TRANSMOUNTAIN EXPANSION PROJECT
Westridge Marine CONSTRUCTION SAFETY
BOOM Page E-7
Figure 4: Departing Aframax – Departure from existing berth through the marine construction safety boom shipgate
Related Documents