WESTERN REGION TECHNICAL ATTACHMENT NO. 98-20 MAY 12, 1998 MODEL BOUNDARY LAYER PROBLEMS AND THEIR IMPACT ON THUNDERSTORM FORECASTING IN THE WESTERN UNITED STATES Introduction Eric C. Evenson - NWSFO Boise, Idaho and Mark H. Strobin - NWSO Spokane, Washington Accurate thunderstorm forecasting can be a difficult process in the western United States (defined in this study as the area west of 1 05W longitude). During the warm season, thunderstorms can be a common occurrence, especially over the vast mountainous terrain. An important meteorological element needed for the development of thunderstorms is instability. Examples of commonly used tools to assess instability include the Lifted Index (LI) and Convective Available Potential Energy (CAPE). However, model calculations of· these parameters by the Nested Grid Model (NGM) and the operational Eta models can yield widely varying solutions. This is the result of the models' inability to 1) accurately depict low-level temperature and moisture fields generally at or below 700 millibars (mb), 2) properly define the actual topography of the western United States, and 3) in the case of the Eta, limited surface data to provide a realistic analysis of surface conditions (Staudenmaier, 1997). Since calculations of these parameters are rooted at or near the model surface, the resulting values cannot be representative of the actual amount of instability in the atmosphere. This problem could lead to an improper interpretation and an overforecast of thunderstorms. This Technical Attachment (TA) will focus on the models' inability to accurately depict moisture at or below 700 mb. Specifically, this TA will show the NGM and Eta's bias towards lower level conditions being too moist. This type of environment would yield an overestimation of instability, resulting in more instability than what is actually observed. For this study, examples of the Lifted Index (LI) will be used to illustrate this point. In addition, another common feature of the NGM will be shown to detail not only the model's problem with the moisture field, but other problems which affect various instability parameters as well. A more detailed examination of the Eta forecast soundings from Boise, Idaho (801) and Spokane, Washington (OTX) from the 1997 convective season and early 1998 will be done to highlight its boundary layer problems. Examples will also be shown to illustrate these effects on forecast instability.

Welcome message from author
This document is posted to help you gain knowledge. Please leave a comment to let me know what you think about it! Share it to your friends and learn new things together.
Transcript
WESTERN REGION TECHNICAL ATTACHMENT NO. 98-20
MAY 12, 1998
MODEL BOUNDARY LAYER PROBLEMS AND THEIR IMPACT ON THUNDERSTORM FORECASTING
IN THE WESTERN UNITED STATES
Introduction
Eric C. Evenson - NWSFO Boise, Idaho and
Mark H. Strobin - NWSO Spokane, Washington
Accurate thunderstorm forecasting can be a difficult process in the western United States (defined in this study as the area west of 1 05W longitude). During the warm season, thunderstorms can be a common occurrence, especially over the vast mountainous terrain. An important meteorological element needed for the development of thunderstorms is instability. Examples of commonly used tools to assess instability include the Lifted Index (LI) and Convective Available Potential Energy (CAPE). However, model calculations of· these parameters by the Nested Grid Model (NGM) and the operational Eta models can yield widely varying solutions. This is the result of the models' inability to 1) accurately depict low-level temperature and moisture fields generally at or below 700 millibars (mb), 2) properly define the actual topography of the western United States, and 3) in the case of the Eta, limited surface data to provide a realistic analysis of surface conditions (Staudenmaier, 1997). Since calculations of these parameters are rooted at or near the model surface, the resulting values cannot be representative of the actual amount of instability in the atmosphere. This problem could lead to an improper interpretation and an overforecast of thunderstorms.
This Technical Attachment (TA) will focus on the models' inability to accurately depict moisture at or below 700 mb. Specifically, this TA will show the NGM and Eta's bias towards lower level conditions being too moist. This type of environment would yield an overestimation of instability, resulting in more instability than what is actually observed. For this study, examples of the Lifted Index (LI) will be used to illustrate this point. In addition, another common feature of the NGM will be shown to detail not only the model's problem with the moisture field, but other problems which affect various instability parameters as well. A more detailed examination of the Eta forecast soundings from Boise, Idaho (801) and Spokane, Washington (OTX) from the 1997 convective season and early 1998 will be done to highlight its boundary layer problems. Examples will also be shown to illustrate these effects on forecast instability.
Lifted Index
The Ll can be calculated in a variety of ways. A surface-based Ll takes the surface temperature and dew point, lifts the parcel dry adiabatically until saturated, then takes the parcel moist adiabatically to 500 mb. The temperature of the lifted parcel is then subtracted from the ambienttemperature at 500mb to obtain a value of the Ll. A negative Ll indicates instability. is present (Chappell, J 986). Other ways.to calculate the Ll include taking the mean values of temperature and dew point in the lowest 1 00 mb or by lifting the most unstable parcel. Whichever method is chosen to evaluate the Ll, it is clearly evident that the lower level moisture and temperature estimates are very important to the accurate assessment of instability.
NGM Problems
Weiss and Jungbluth (1993) noted in their assessment of the NGM Lis that using forecast soundings provided substantial insight into model performance and are useful in diagnosing aspects of the NGM Ll errors. In examining cases east of the Continental Divide, Weiss and Jungbluth found three typical examples where the NGM overforecast the amount of instability. One of these examples was strictly related to the excessive forecast of moisture in the lower levels of the atmosphere.
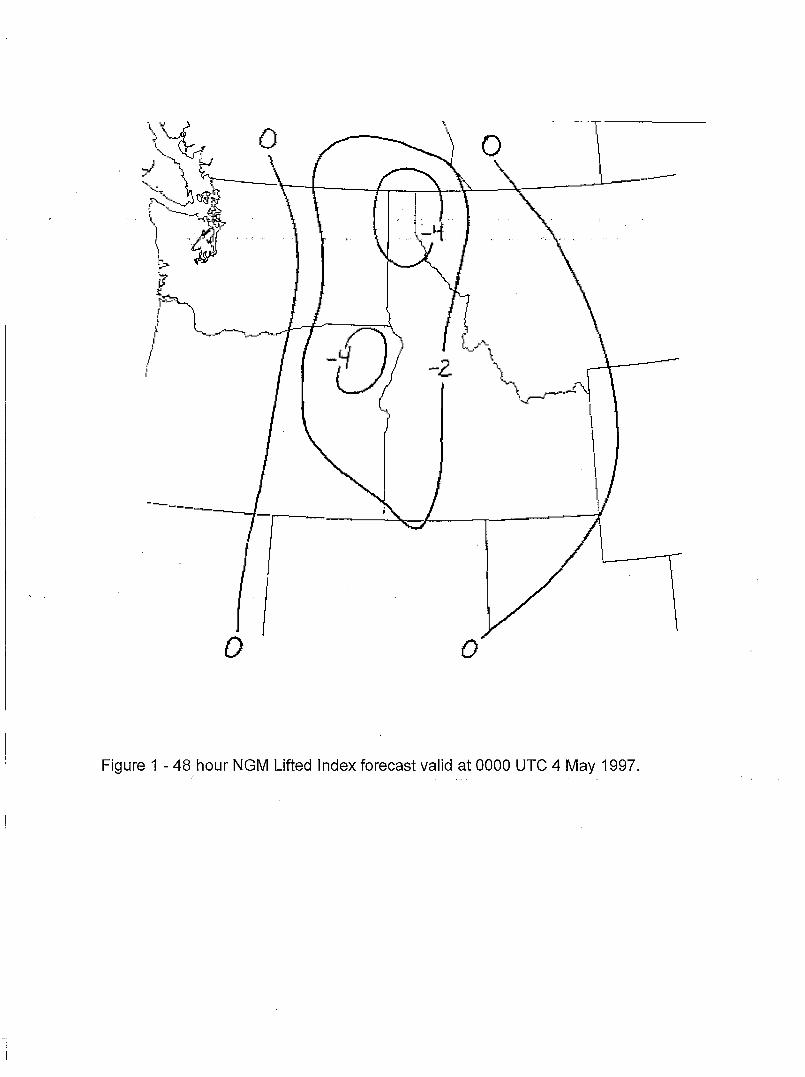
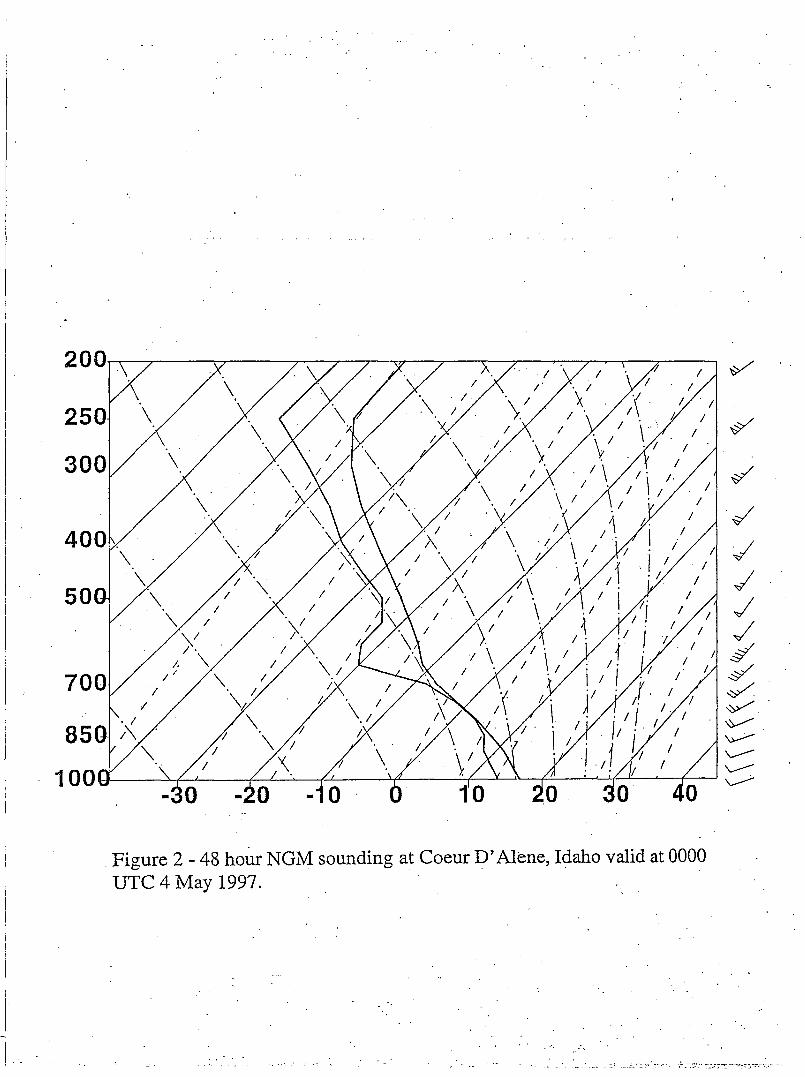
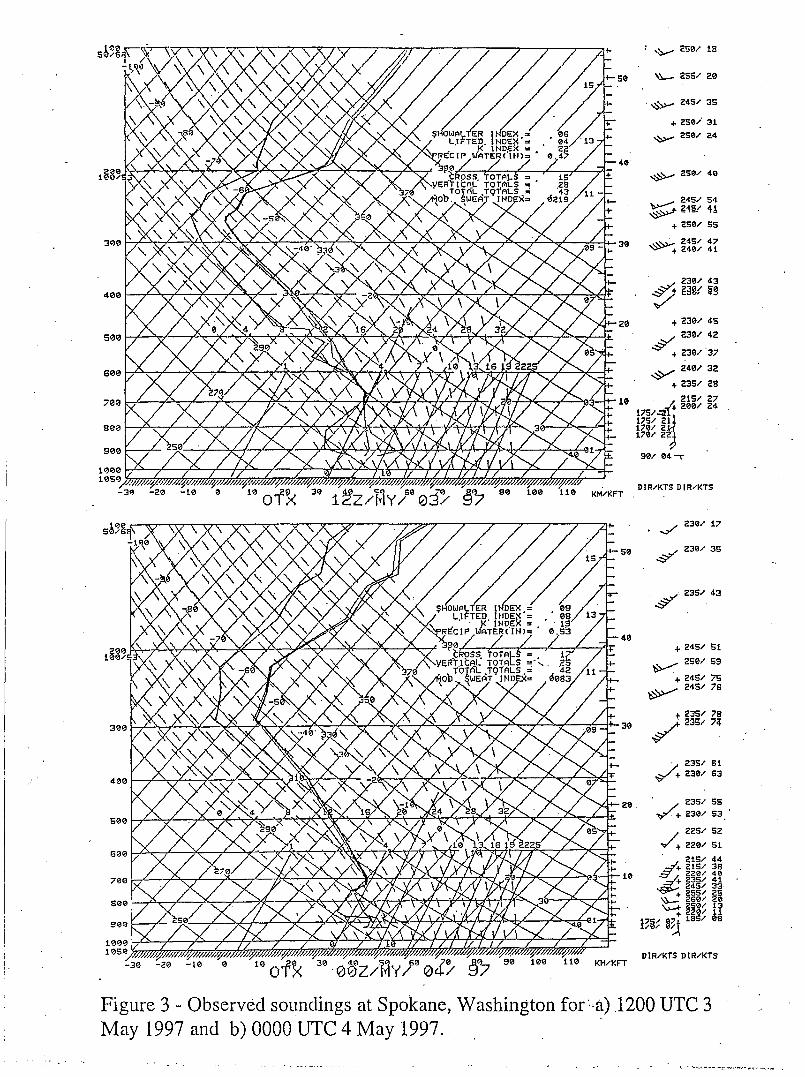
The case of 3 May 1997 clearly shows the boundary layer problems that can affect the NGM west of the Continental Divide. Figure 1 shows a plan view perspective of the 48 hour NGM Ll forecast (using the most unstable parcel) valid at 0000 UTC 4 May 1997. Note the area of -4 Lis extending across northeast Oregon, the Idaho Panhandle, and extreme northwest Montana. Examining a forecast sounding (sounding interpolated from grid point data) from any point in the area where a -4 Ll is being forecast will show the temperature and moisture profiles that are generating the substantial amount of instability. Figure 2 shows the 48 hour NGM forecast sounding for Coeur D'Alene, Idaho (COE) valid at 0000 UTC 4 May 1997. The forecast sounding depicts a rather moist environment below 700 mb with dew point values between 800 and 900 mb greater than zero degrees Celsius. Note the model surface at COE is roughly 900 mb and the model will interpolate temperature and dew point values down to 1000mb. However, Ll calculations ignore this interpolation to 1000mb and lift parcels starting at the model's surface. Lifting parcels in the moist NGM environment depicted on the COE sounding will easily result in a negative Ll. However, examination of the 1200 UTC 3 May 1997 and 0000 UTC 4 May 1997 observed soundings at Spokane, Washington (OTX), about 30 miles west of COE, show quite a contrast in the actual low level moisture field (Fig. 3). Much of the moisture profile below 700 mb in both observed OTX soundings indicate dew point values less than zero degrees Celsius, roughly a 5 to 10 degree difference than what was forecast at the 48-hour time frame. Observed values of Ll at 0000 UTC 4 May 1997 over the area previously forecast to be -4 were actually well above zero indicating stability. No thunderstorms developed anywhere across northeast Oregon, eastern Washington, northern Idaho, and extreme northwest Montana.
2
Figure 2 shows another significant problem with other instability parameters from the NGM. Note between 850 and 700 mb the NGM depicts a saturated dry adiabatic lapse rate. This is a common feature in the NGM forecast soundings, especially in the winter and spring months. This scenario is physically impossible since in a saturated environment, the lapse rate cannot be greater than the moist adiabatic lapse rate. This problem results in an overestimation oUhe lapse rate, which causes the. lapse rate to be too steep. This in turn generates too much instability.
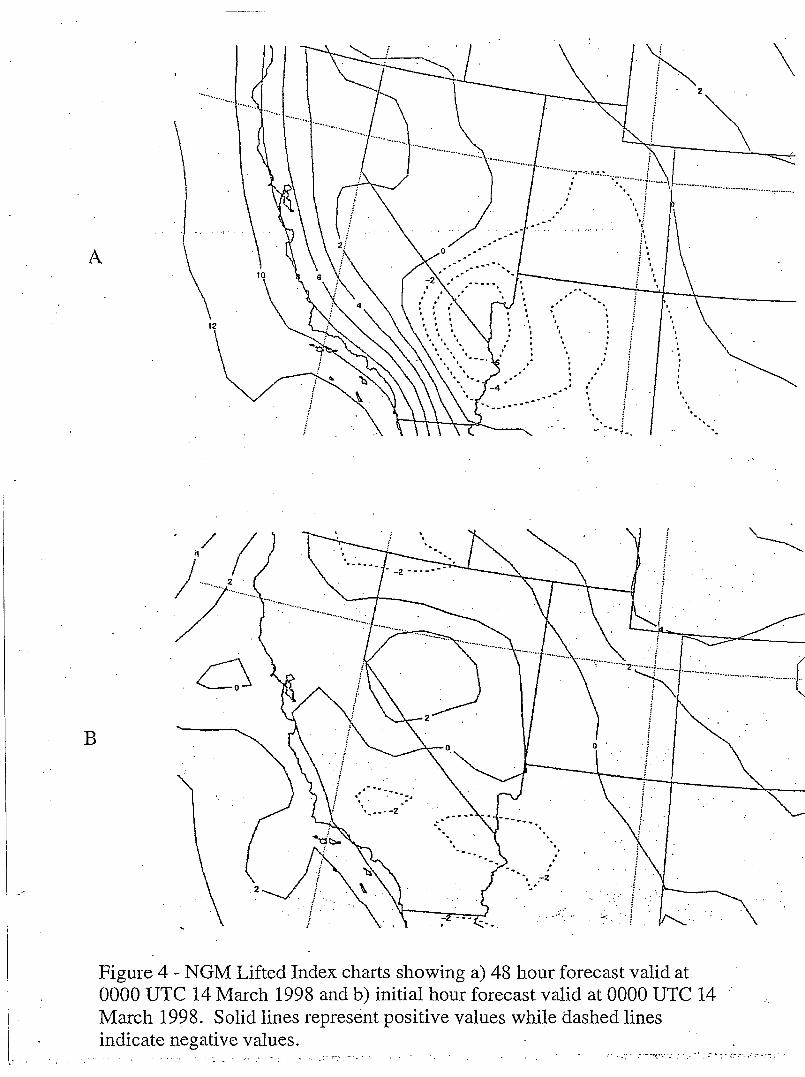
Another example is shown in Fig. 4 and 5. Figure 4 shows the 48 hour NGM U forecast and the observed NGM Us valid at 0000 UTC 14 March 1998 from a plan view perspective. Note the -6 U forecast in the Las Vegas, Nevada area (LAS) on the 48 hour forecast with the initialized U around -1 at 0000 UTC 14 March 1998. The forecast and initialized soundings from LAS (Fig. 5) clearly show why such a difference in Us existed. The 48-hour forecast sounding at LAS showed a nearly saturated environment from 700 to 850 mb while the initialized sounding indicated the presence of a rather dry, low-level environment. In addition, the same problem occurred as in Fig. 2 with a saturated dry adiabatic lapse rate observed between 700 and 850mb. No thunderstorms were observed across southern Nevada on this day as the NGM clearly overforecast the actual amount of instability due to the excessive moisture in the lower levels of the atmosphere.
Eta Problems
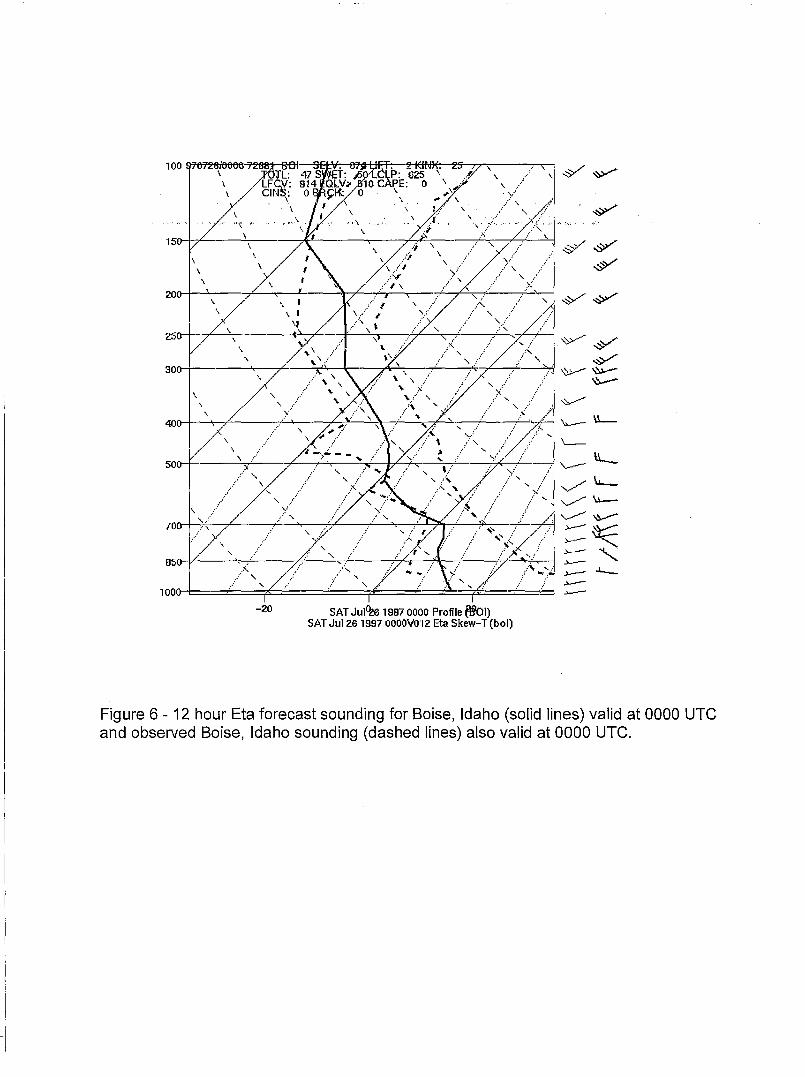
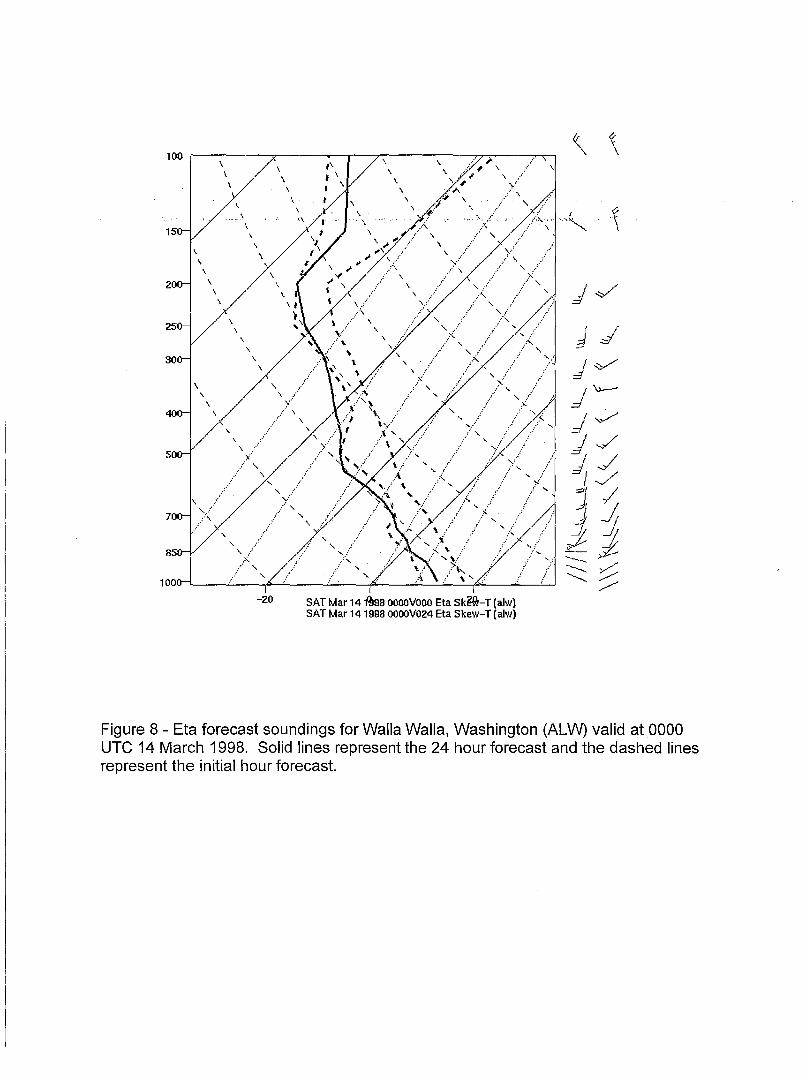
As is the case with the NGM, the Eta model also has problems with accurately predicting low-level moisture conditions. Forecast soundings (once again interpolated from grid point data) in the 12 hour and 24 hour forecast time frames at 801 and OTX were examined for the entire warm season of 1997 and early 1998. When comparing the 12- and 24-hour forecast soundings at 801 and OTX with the observed soundings at these locations, a common feature was noted. In general, these forecast soundings were typically too moist below 700mb in comparison to the observed soundings (Fig. 6). This scenario can lead to an overestimation of the actual amount of instability. An example of this is seen in Fig. 7. The plan view perspective of the Eta 24 hour forecast Us valid at 0000 UTC 14 March 1998 indicates an area of -2 Us across portions of south central and southeast Washington. The observed Us valid at 0000 UTC indicate U values in the zero to plus one range over south central and southeast Washington (Figure 8). Comparing the 24-hour forecast sounding at Walla Walla, Washington (ALW), where a -2 U was forecast, with the initialized sounding atALW shows the reason for the overestimation of the instability. Note the temperature profiles on both the 24-hourforecast sounding and the initialized sounding are nearly identical. However the moisture profile below 850mb indicates more moisture forecast at 24 hours than the initialized moisture profile. With the model surface pressure at ALW around 900mb, this directly affected the calculation of the U as the parcels were lifted from a more moist environment. The result was an overestimation of instability. Just as the other cases discussed above, no thunderstorms occurred over the area where the instability was forecast to exist.
3
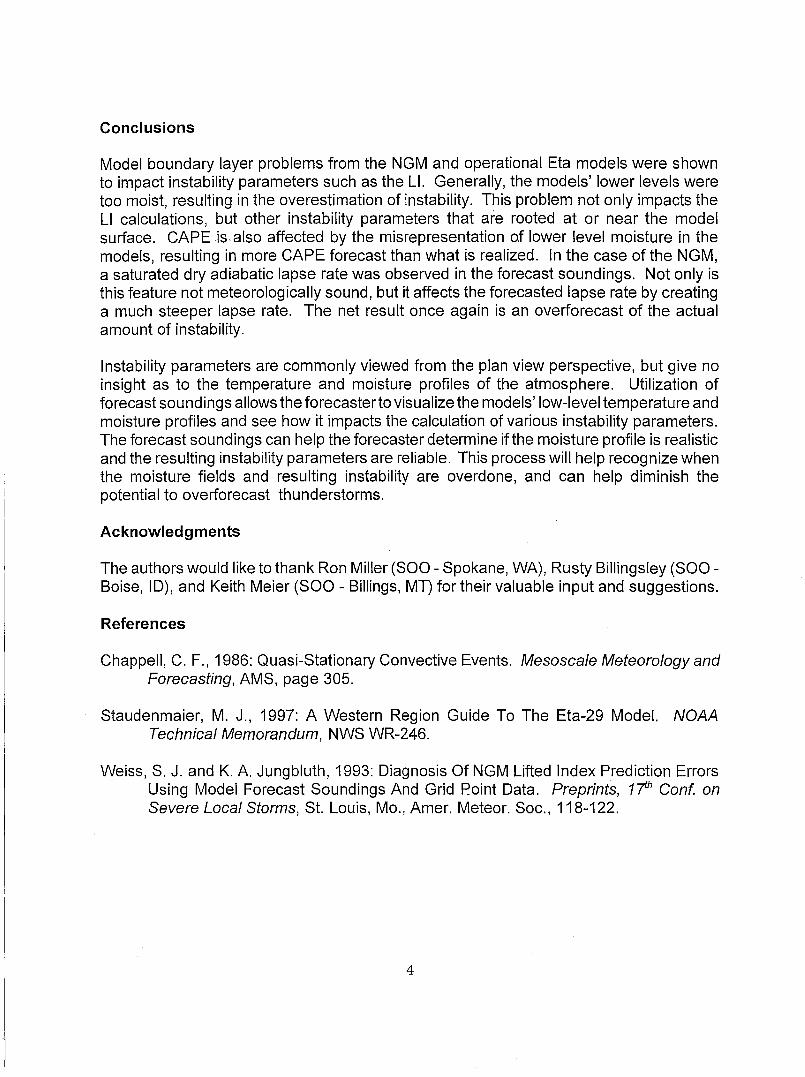
Conclusions
Model boundary layer problems from the NGM and operational Eta models were shown to impact instability parameters such as the Ll. Generally, the models' lower levels were too moist, resulting in the overestimation of instability. This problem not only impacts the Ll calculations, but other instability parameters that are rooted at or near the model surface. CAPE is also affected by the misrepresentation of lower level moisture in the models, resulting in more CAPE forecast than what is realized. In the case of the NGM, a saturated dry adiabatic lapse rate was observed in the forecast soundings. Not only is this feature not meteorologically sound, but it affects the forecasted lapse rate by creating a much steeper lapse rate. The net result once again is an overforecast of the actual amount of instability.
Instability parameters are commonly viewed from the plan view perspective, but give no insight as to the temperature and moisture profiles of the atmosphere. Utilization of forecast soundings allows the forecaster to visualize the models' low-level temperature and moisture profiles and see how it impacts the calculation of various instability parameters. The forecast soundings can help the forecaster determine if the moisture profile is realistic and the resulting instability parameters are reliable. This process will help recognize when the moisture fields and resulting instability are overdone, and can help diminish the potential to overforecast thunderstorms.
Acknowledgments
The authors would like to thank Ron Miller (SOO- Spokane, WA), Rusty Billingsley (SOOBoise, I D), and Keith Meier (SOO- Billings, MT) for their valuable input and suggestions.
References
Chappell, C. F., 1986: Quasi-Stationary Convective Events. Mesoscale Meteorology and Forecasting, AMS, page 305.
Staudenmaier, M. J., 1997: A Western Region Guide To The Eta-29 Model. NOAA Technical Memorandum, NWS WR-246.
Weiss, S. J. and K. A. Jungbluth, 1993: Diagnosis Of NGM Lifted Index Prediction Errors Using Model Forecast Soundings And Grid ~oint Data. Preprints, 11h Conf on Severe Local Storms, St. Louis, Mo., Amer. Meteor. Soc., 118-122.
4
-OJ (
0
\~ I
I \
Figure 1 - 48 hour NGM Lifted Index forecast valid at 0000 UTC 4 May 1997.
50
85
I
. Figure 2-48 hour NGM sounding at Coeur D'Alene, Idaho valid at 0000 UTC 4 May 1997.
. .. ..··.
~
/
/ / ./ / /
t./ ./ / ~. ~ ~ ~
~ ~
~ 250/ 18
~ 255/ 20
-~ 245/35
+ 250/ 31
~ 250/ 24
40
1~8~ ~ 250/40
245/ 54 ~ 61lil 4!
+ 250/ 55
30 ~ 245/ 47 + 240/ 41
230/ 43
400 .:;/ E~~f li~
20 + 230/ 45
~ 230/.42
+ 230/ 37
6'210 ~ 240/32
+ 235/ 28
700 10 215/ 27 175/ ..:af 200/ 24
175/ 2~ 800 170/ 2 . 170/ 22
9'210 90/ 04-r
100 110 DIR/KTS DIR/KTS
....,/ 230/ 17
50 ~ 230/ 35
# 235/ 43
40 + 245/ 51
~ 250/59
+ 245/ 75 ~ 245/76
+ 235/ 78 / ~~!;/ '4
. 235/ 61 /+ 230/ 63
20. 235/ 55
~ 230/ 53.·
225/ 52
~ 220/ 51
. 215/ 44 ..§I; 215/ 38 10 220/ 4~ ~ 235/4 245/ 33·
~ ~~~~ ~~ "-'" 250/ 13
+ 220/ 11 i7~/ 0~ 185/ 08
/ / 1(1/
~ v.~ ~.~. v, ~ 10 of)< 30
· 0~Z/l~Y J 0 0J'/
100 110 KM/KFT DIR/KTS DIR/KTS
Figure 3- Observed soundings at Spokane, Washington for··,a) 1200 UTC 3 May 1997 and b) 0000 UTC 4 May 1997.
·~ \ I ,~
. ................... -;------.... ~ .. ~.. K . ----'----..;,::,::---'-· . : '·;·: <.'"'"/""'""-\ ........................................................ , ......... ..
. -· \j
.....................
·-··-................. ..
.. ........... . •oo,OOoMo, .. ,,.,,_Ooooo,,,,_
A
; j', :I j I
t ••
B
12
i J .
f '. t ,
: I
---
· . . . . . . .
.... ,..-2
! I :' l
••• j !
! ~· ~. f .
. . I ~-· ---~-
.. _.... .. .. .. ;
!
f I
I I
. . . . . . ' .
.. · ..
Figure 4 - NGM Lifted Index charts showing a) 48 hour forecast valid at 0000 UTC 14 March 1998 and b) initial hour forecast valid at 0000 UTC 14 March 1998. Solid lines represent positive values while dashed lines indicate negative values.
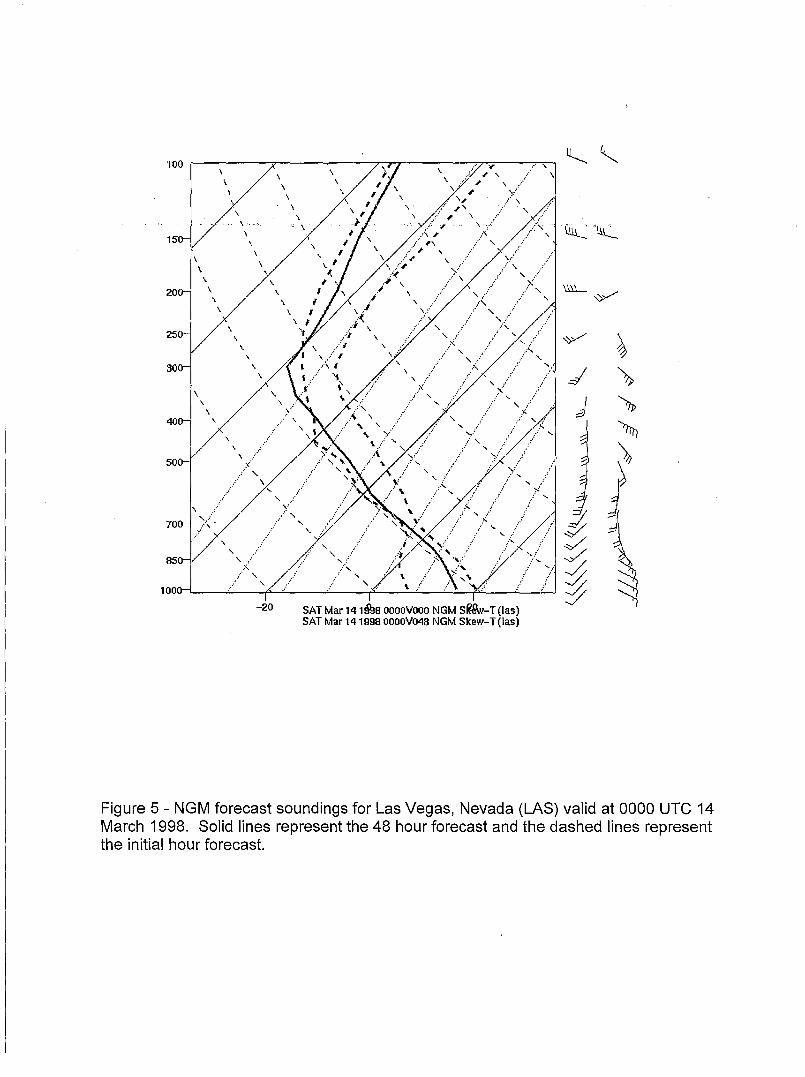
Figure 5- NGM forecast soundings for Las Vegas, Nevada (LAS) valid at 0000 UTC 14 March 1998. Solid lines represent the 48 hour forecast and the dashed lines represent the initial hour forecast.
40~--~~-------~-----~~--~~,~~-r~·--~-
\ \ .///,... ..
Figure 6- 12 hour Eta forecast sounding for Boise, Idaho (solid lines) valid at 0000 UTC and observed Boise, Idaho sounding (dashed lines) also valid at 0000 UTC_
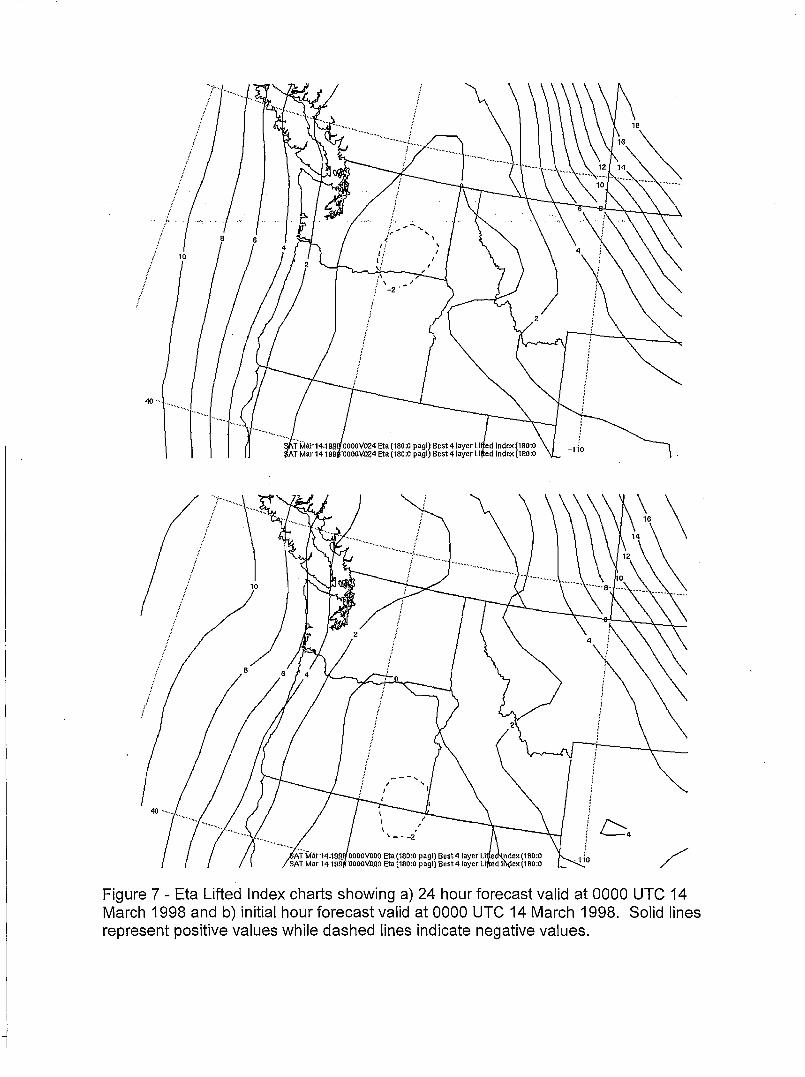
/ Figure 7- Eta Lifted Index charts showing a) 24 hour forecast valid at 0000 UTC 14 March 1998 and b) initial hour forecast valid at 0000 UTC 14 March 1998. Solid lines represent positive values while dashed lines indicate negative values.
100
\
\
\ \
\
\
\
\ \
-20 SAT Mar 1 4'f999 oooovooo Eta Sk~-T ( alw) SAT Mar 141998 OOOOV024 Eta Skew-T (alw)
\ \
Figure 8- Eta forecast soundings for Walla Walla, Washington (ALW) valid at 0000 UTC 14 March 1998. Solid lines represent the 24 hour forecast and the dashed lines represent the initial hour forecast.
Related Documents