WESTCHESTER COUNTY AFFORDABLE HOUSING NEEDS ASSESSMENT FINAL REPORT CENTER FOR URBAN POLICY RESEARCH (CUPR) EDWARD J. BLOUSTEIN SCHOOL OF PLANNING AND PUBLIC POLICY RUTGERS UNIVERSITY 33 LIVINGSTON AVENUE, SUITE 400 NEW BRUNSWICK, NJ 08901-1982 SUBMITTED TO WESTCHESTER COUNTY BOARD OF LEGISLATORS Principal Investigators Participating Investigators Sean M. DiGiovanna, PhD William R. Dolphin, MA Robert W. Burchell, PhD Nancy H. Mantell, PhD 30 MARCH 2004

Welcome message from author
This document is posted to help you gain knowledge. Please leave a comment to let me know what you think about it! Share it to your friends and learn new things together.
Transcript

WESTCHESTER COUNTY AFFORDABLE HOUSING
NEEDS ASSESSMENT
FINAL REPORT
CENTER FOR URBAN POLICY RESEARCH (CUPR)
EDWARD J. BLOUSTEIN SCHOOL OF PLANNING AND PUBLIC POLICY RUTGERS UNIVERSITY
33 LIVINGSTON AVENUE, SUITE 400 NEW BRUNSWICK, NJ 08901-1982
SUBMITTED TO
WESTCHESTER COUNTY BOARD OF LEGISLATORS
Principal Investigators Participating Investigators Sean M. DiGiovanna, PhD William R. Dolphin, MA Robert W. Burchell, PhD Nancy H. Mantell, PhD
30 MARCH 2004


Westchester County March 2004 Affordable Housing Needs Assessment Table of Contents
-i-
TABLE OF CONTENTS EXECUTIVE SUMMARY............................................................................................................ iii
CHAPTER 1: INTRODUCTION.................................................................................................... 1 OUTLINE OF THE REPORT..................................................................................................... 1
CHAPTER 2: EXISTING AND PROJECTED DEMAND FOR AFFORDABLE HOUSING ..... 3 INTRODUCTION ....................................................................................................................... 3 EXISTING (2000) DEMAND FOR AFFORDABLE HOUSING .............................................. 3 PROJECTED DEMAND FOR AFFORDABLE HOUSING, 2000–2015................................ 18 SUMMARY OF EXISTING AND PROJECTED AFFORDABLE HOUSING DEMAND.... 22
CHAPTER 3: CHARACTERISTICS OF INCOME-CONSTRAINED HOUSEHOLDS ........... 25 SOCIOECONOMIC CHARACTERISTICS OF WESTCHESTER HOUSEHOLDS ............. 25 LOCATIONAL CHARACTERISTICS OF HOUSEHOLDS................................................... 39 CHARACTERISTICS OF PROJECTED DEMAND HOUSEHOLDS, 2000-2015 ................ 43 SUMMARY............................................................................................................................... 45
CHAPTER 4: EXISTING AND PROJECTED HOUSING SUPPLY.......................................... 47 INTRODUCTION ..................................................................................................................... 47 THE BASE HOUSING STOCK ............................................................................................... 49 RECENT HOUSING TRENDS ................................................................................................ 51 PROJECTED HOUSING GROWTH, 2000-2015 .................................................................... 53 SUMMARY............................................................................................................................... 56
CHAPTER 5: MATCHING HOUSING NEED AND HOUSING SUPPLY ............................... 57 INTRODUCTION ..................................................................................................................... 57 AFFORDABLE HOUSING DEMAND.................................................................................... 58 PROJECTED HOUSING SUPPLY .......................................................................................... 60 MATCHING DEMAND TO SUPPLY ..................................................................................... 60 SUMMARY............................................................................................................................... 65
CHAPTER 6: AFFORDABLE HOUSING NEED....................................................................... 67
APPENDIX A: COMMUTATION ANALYSIS .......................................................................... 69 COMMUTING DESTINATIONS OF EMPLOYED WESTCHESTER RESIDENTS............ 69 ORIGINS OF COMMUTERS WORKING IN WESTCHESTER............................................ 70 COMPARING CHARACTERISTICS OF COMMUTER GROUPS ....................................... 70 SUMMARY............................................................................................................................... 76

Westchester County March 2004 Affordable Housing Needs Assessment Table of Contents
-ii-

Westchester County March 2004 Affordable Housing Needs Assessment Executive Summary
-iii-
EXECUTIVE SUMMARY
This report presents the findings of a detailed study of Westchester County’s affordable
housing need for the years 2000 to 2015. Working with the Westchester County Housing
Opportunities Commission (HOC), the Center for Urban Policy Research (CUPR) analyzed data
from the 2000 US Census as well as other sources to identify Westchester County’s existing
affordable housing need and to forecast future need. CUPR used the income, housing conditions,
and housing expenditures of households identified in the U.S. Census Public Use Microdata
Sample (PUMS-5%) to determine existing affordable housing need. Future affordable housing
need is a result of the projected growth in households within particular income categories.
Income-constrained Households in Westchester County in the Year 2000
This report analyzes three household income groups—50% or less of household median
income, 50-80% of household median income, and 80-100% of median household income.
Although information is provided for all three income groups, only the first two are included in
the final need determination. The inclusion of the third group (80-100% of median household
income) in the analysis is intended to demonstrate that finding affordable housing in Westchester
can be problematic even for households earning close to the county median in income.
According to the U.S. Census PUMS data, Westchester County contained 335,244
households in 2000. Using the median household income for Westchester County ($83,100)
published by the US Department of Housing and Urban Development (HUD) in 2000, CUPR
determined that 94,336 households earned less than 50 percent of the county median and 59,001
households earned between 50 and 80 percent of the county median.
• Thus, for the purposes of this study, the total income-constrained population (i.e., the
target population) from which affordable housing need is determined is 153,337
households.

Westchester County March 2004 Affordable Housing Needs Assessment Executive Summary
-iv-
Existing Affordable Housing Demand—2000
Working with the HOC, CUPR identified three housing conditions as being indicative of
existing affordable housing demand—households living in deficient conditions, households living
in overcrowded conditions, and households paying too large a percentage of their income for
housing. The first condition refers to housing units that have insufficiencies relating to suitability
for habitation, such as: age, fuel source, lack of complete plumbing, or kitchen facilities. Using
the U.S. Census PUMS data, CUPR determined that:
• 2,481 low- and moderate- income households in Westchester County occupied deficient
housing
The second housing condition refers to households in which the ratio of persons to rooms
exceeds 1.01, a number used by HUD as in indication of crowding. Recognizing that some
deficient housing units might also be crowded, CUPR only included overcrowded households that
were not deficient in its analysis. In addressing overcrowding as a housing issue, it should be
noted that the creation of one new affordable unit has the potential to create more than one
satisfied affordable household. That is, as an overcrowded household moves into a unit of
appropriate size, the original unit is left to address another household’s needs. Thus, in
determining final need, about fifty percent of the crowded households will require the creation of
new housing units.
• 14,274 low- and moderate-income households not living in deficient conditions occupied
overcrowded housing in Westchester County; CUPR estimates that the number of
additional housing units required to meet this demand is 7,273
The third condition of affordable housing demand, cost burden, was identified as those
rental households paying over 30% of income for rent and those owner households paying over
50% for housing costs. Again, CUPR considered only those income-constrained households that
were neither in deficient nor crowded conditions to avoid double counting.
• 72,259 low- and moderate-income households not living in deficient or overcrowded
conditions were found to be cost-burdened in Westchester County
While cost burden is an important issue for many Westchester households, it can be alleviated
through policy interventions other than housing unit creation (financial assistance) and, thus, is
not included in the final determination of housing need.

Westchester County March 2004 Affordable Housing Needs Assessment Executive Summary
-v-
In addition, the number of homeless households, supplied by Westchester County, is
included in the existing demand for affordable housing. In 2000, there were 677 homeless
households.
• Total existing demand is 10,431 units, consisting of 2,481 deficient units, 7,273
overcrowded units, and 677 homeless households.
Projected Affordable Housing Demand—2000-2015
Projected affordable housing demand is defined as the net increase in low- and moderate-
income households between the year 2000 and the year 2015. CUPR forecast the growth in these
households using population projections from New York State and household formation (or
headship) rates and income projections computed by CUPR.
• Projected affordable housing demand between 2000 and 2015 is 8,652 units
Projected Affordable Housing Supply—2000-2015
CUPR projected an increase in the supply of housing available to the income-constrained
population to meet existing and future need. For existing need, this comes primarily from
secondary sources (filtering, conversions, etc.) and amounts to 3,502 units. For future need, this is
public and private housing supply netting out what was delivered in response to the prior need
projection. This amounts to 4,813 units.
• Through 2015, of a total affordable housing demand of 19,083 units, primary and
secondary sources of affordable housing supply are projected to provide for 8,315 target
population households
• Through 2015, 10,768 existing and projected target population households will constitute
housing need that is projected not to be met through primary or secondary sources of
housing supply. Our projections indicate that this unmet need is represented by 6,252
existing and 3,839 future low- and moderate-income households, plus 677 existing
homeless households.

Westchester County March 2004 Affordable Housing Needs Assessment Executive Summary
-vi-
Westchester County Affordable Housing Need
The total affordable housing need for Westchester County to the year 2015 is
summarized in the table below.
Existing Demand (2000)
Deficient Units ........................................................................................ 2,481
Crowded Units .......................................................................................... 7,273
Homeless ........................................................................................... 677
Total Current Demand.................................................................................10,431
Future Demand (2000-2015)
New Low-, and Moderate-Income Households........................................... 8,652
Total Affordable Housing Demand..........................................................19,083
Future Supply (2000-2015)
Primary Sources .......................................................................................... 3,483
Secondary Sources ...................................................................................... 4,832
Total Affordable Housing Supply ............................................................ 8,315
Total Affordable Housing Need
Total Demand – Total Supply ..................................................................10,768

Westchester County March 2004 Affordable Housing Needs Assessment Chapter 1: Introduction
-1-
CHAPTER 1: INTRODUCTION
The Center for Urban Policy Research (CUPR) has conducted a study of the affordable
housing need in Westchester County and produced the following report. The assessment was
conducted based upon a methodology agreed to by the Westchester County Housing
Opportunities Commission (HOC) and CUPR, and laid out in the report. The goal of the study
was to determine the existing and projected affordable housing need for the period of 2000-2015.
CUPR completed a similar study for Westchester County in 1993, the results of which helped the
county design and implement an affordable housing development plan. It is our hope that the
present report will be as useful to Westchester County.
OUTLINE OF THE REPORT
In the following chapter, CUPR sets out the methodology for determining existing and
future affordable housing demand. We first discuss the characteristics of the target population,
the county’s low- (<50% of median), moderate- (50-80% of median), and middle-income
households (80-100% of median). These households together represent what we have called the
“income-constrained” population of Westchester County. Although we analyze all three income
groups, the middle –income group is reported for informational purposes only and is not included
in the final need determination. Thus, the low- and moderate-income groups represent the target
population of households for purposes of this study.
Through our discussions with the HOC, we defined existing demand to include four
groups of income-constrained households in the year 2000:
1) Those households in physically deficient housing units,
2) Those households in overcrowded housing units, and
3) Those households paying too great a share of their income in housing costs.
4) Homeless households
The third category of affordable housing need, cost burden, can be addressed through
policy interventions that do not necessitate the creation of new affordable housing units and
therefore is not considered in the final need determination, but presented for informational
purposes only.
Projected demand is defined as the net increase in income-constrained households
between the years 2000 and 2015. The number and selected characteristics of each of these
groups is detailed in Chapter 2. More detail on the households that comprise current demand is

Westchester County March 2004 Affordable Housing Needs Assessment Chapter 1: Introduction
-2-
presented in Chapter 3. In particular, we examine the socioeconomic and locational
characteristics of these households and make some observations about the extent of affordable
housing demand in particular demographic and regional groupings.
Chapter 4 presents CUPR’s estimate for projected housing supply for the period between
the years 2000 and 2015. The projected supply consists of both units provided through primary
sources (e.g., new construction) and those derived from so-called secondary sources—
conversions, filtering, and spontaneous rehabilitation. We then set out to determine the number
of units in each of these categories that might accommodate income-constrained households.
Chapter 5 brings together our demand population and our projected affordable housing
supply. Through a series of matching exercises, we determine to what extent projected housing
supply will be able to meet the demand identified in Chapter 2. That demand which is not
satisfied through the matching process is considered unmet need.
Chapter 6 summarizes the affordable housing need for Westchester County for the period
2000-2015. An analysis detailing characteristics of the commuting population of Westchester
County is provided in Appendix A. This data has no impact on the determination of affordable
housing need, but is provided at the request of the HOC for purposes of policy formation and
implementation.

Westchester County March 2004 Affordable Housing Needs Assessment Chapter 2: Affordable Housing Demand
-3-
CHAPTER 2: EXISTING AND PROJECTED DEMAND FOR AFFORDABLE HOUSING
INTRODUCTION
This chapter sets forth a methodology for measuring existing demand for affordable
housing in the Westchester County, placing that methodology squarely within the context of more
than fifty years of work by the U.S. Bureau of the Census and federal housing programs to arrive
at definitions of housing need. We ask what proportion of the total number of households in the
Westchester County can be classified as low, moderate, or middle income; and we ask what
proportion of these income-constrained households are living in deficient or overcrowded
housing, or bearing an excessive housing cost burden. To answer these questions requires
rigorous specification of the definition of “low income,” “moderate income,” and “middle
income” and of “deficient housing,” “overcrowded housing,” and “housing cost burden”—terms
that at first glance may seem self-explanatory but upon deeper reflection are quite complex.
We first measure the magnitude of housing need generated by existing (2000) low-,
moderate-, and middle-income households in deficient or overcrowded housing or experiencing
housing cost burden. We then estimate the growth in demand in the region through the year
2015. We use the U.S. Census Public Use Microdata Sample (PUMS) to determine existing
demand for the year 2000. The methodology used to measure projected demand begins with
projections of county population growth for 2000 to 2015, translates these population projections
into estimates of household growth rates (since it is households that consume housing units), and
then determines the proportion of projected household growth that will be of low, moderate, or
middle income.
In sum, this chapter sets forth the magnitude of existing (2000) and projected (2000 to
2015) demand for affordable housing in the Westchester County. This specification of demand
sets the stage for any subsequent attempt at amelioration: it is the critical initial building block
that documents the scale of the issue. Only when the magnitude of demand has been rigorously
and systematically defined can the effort required to meet that demand be assessed and a
workable plan formulated. We now turn to the identification of existing housing demand in 2000.
EXISTING (2000) DEMAND FOR AFFORDABLE HOUSING
The U.S. Census Public Use Microdata Sample (PUMS) provides estimates of household
and housing characteristics based on a detailed survey of 5 percent of the total population. We use

Westchester County March 2004 Affordable Housing Needs Assessment Chapter 2: Affordable Housing Demand
-4-
this data to identify the total population of households in Westchester in the year 2000, to
determine what proportion of households that are low-, moderate- or middle-income, and to
identify among those which households are cost-burdened, overcrowded, or otherwise deficient
and thus in need of affordable housing. We start by identifying the total population of households
within Westchester County for the year 2000.
Exhibit 2-1 presents data from the Census on household growth from 1990 to 2000. In
the ten-year period, the total number of households in Westchester County grew from 319,657 to
337,486, a total of 17,829 net new households created between the census years—an overall
growth rate of 5.6 percent. As Exhibit 2-1 illustrates, the majority of household growth occurred
in households headed by individuals between the ages of 35-54, with a sizeable increase in
households headed by those over 75 as well.
Exhibit 2-1 Change in Total Households, by Age of Householder,
Westchester County 1990 and 2000 Change 1990 2000 Number Percent 15-24 6,794 6,860 66 1.0% 25-34 56,562 49,475 (7,087) -12.5% 35-44 69,341 80,955 11,614 16.7% 45-54 57,308 71,437 14,129 24.7% 55-64 52,250 49,448 (2,802) -5.4% 65-74 43,502 40,973 (2,529) -5.8% 75+ 33,900 38,338 4,438 13.1% Total 319,657 337,486 17,829 5.6%
Identifying Income-Constrained Households
In order to identify existing demand for affordable housing in Westchester, we first need
to identify that population of households that we consider income constrained, and thus might
require assistance in obtaining affordable housing. All income-constrained household groups are
defined in relation to the median household income for the county. In discussions between
Westchester County and CUPR, it was agreed that we would consider three groups of households
as income constrained—low-, moderate-, and middle-income households.
Numerous state and federal housing programs exist across the country to help provide
housing for low-income groups. A basic consideration in defining low-, moderate-, and middle-
income households is to ensure that our definition is compatible with the definitions used in
established and ongoing housing programs in the region. This is important to prevent the
Westchester County March 2004 Affordable Housing Needs Assessment Chapter 2: Affordable Housing Demand
-5-
inevitable confusion that would be caused by the simultaneous existence of widely disparate
estimates of need based on inconsistent definitions of income eligibility.
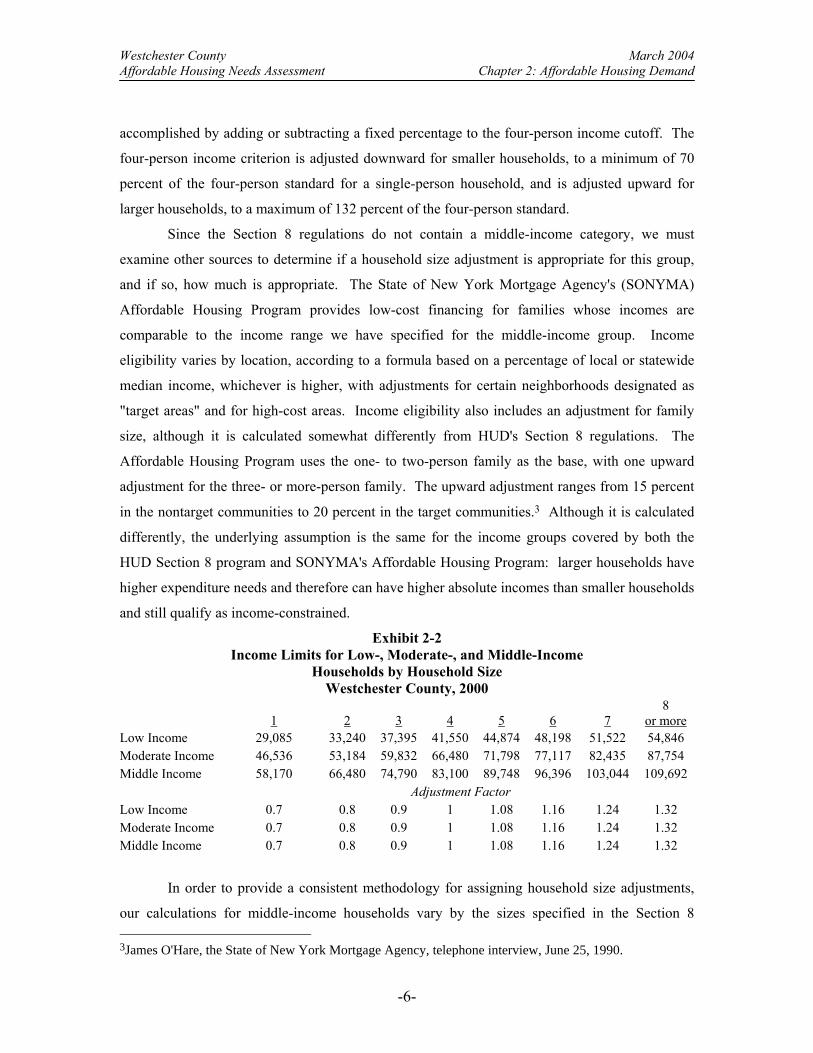
To prevent such confusion and to ensure consistency, we have adopted the definitions for
low and moderate income used in federal regulations governing the Section 8 Rent Supplement
program administered by the U.S. Department of Housing and Urban Development (HUD).1
According to these regulations, low-income households are those with incomes below 50 percent
of the area's median family income.2 Moderate-income households are those with incomes below
80 percent of the area's median family income but above the 50 percent median income cutoff for
low-income households. Income eligibility in both cases is adjusted by household size. For
middle-income households, we have used Westchester County's definition: these are households
having incomes between 80 percent and 100 percent of the area's median family income. We
have also adjusted income eligibility for middle-income households by household size. In order to
operationalize these definitions, it is necessary to specify (1) the household size adjustments; and
(2) the definition of what constitutes a household.
Adjustment for Household Size
Following federal regulations implementing the Section 8 program, income eligibility
levels used to qualify households as either low or moderate income are adjusted by household
size. That is, it is assumed that larger households must spend more and therefore can have higher
absolute incomes than smaller households and still qualify as income-constrained.
The household size adjustment specified in HUD regulations assumes that the median
income corresponds to a family of four. A low-income, four-person household is thus one that is
at or below 50 percent of the areawide median family income level; a moderate-income, four-
person household is one that is between 50 percent and 80 percent of the areawide median family
income level. Adjustment for household size larger or smaller than this four-person standard is 1See 42 U.S. Code, 1437a (b) (2) Supplement. References in Section 8 regulations to "very low income" correspond to the term "low income" as used in this study; the term "low income" in Section 8 regulations corresponds to "moderate income" herein. 2An explanation of the terms "family" and "household" is in order. The term "family" refers to two or more related individuals residing within the same housing unit and the term "household" refers to the occupants of a housing unit regardless of their number or relationship. In defining income limits, we have followed federal regulations for the Section 8 housing program. The U.S. Department of Housing and Urban Development has always used family income to determine eligibility for households that qualify for the Section 8 program. It has done so even though single persons and households consisting of unrelated individuals are eligible for the program. In following these federal standards, we also have used family income to establish income limits for low-, moderate-, and middle-income households, including single persons and unrelated individuals.
Westchester County March 2004 Affordable Housing Needs Assessment Chapter 2: Affordable Housing Demand
-6-
accomplished by adding or subtracting a fixed percentage to the four-person income cutoff. The
four-person income criterion is adjusted downward for smaller households, to a minimum of 70
percent of the four-person standard for a single-person household, and is adjusted upward for
larger households, to a maximum of 132 percent of the four-person standard.
Since the Section 8 regulations do not contain a middle-income category, we must
examine other sources to determine if a household size adjustment is appropriate for this group,
and if so, how much is appropriate. The State of New York Mortgage Agency's (SONYMA)
Affordable Housing Program provides low-cost financing for families whose incomes are
comparable to the income range we have specified for the middle-income group. Income
eligibility varies by location, according to a formula based on a percentage of local or statewide
median income, whichever is higher, with adjustments for certain neighborhoods designated as
"target areas" and for high-cost areas. Income eligibility also includes an adjustment for family
size, although it is calculated somewhat differently from HUD's Section 8 regulations. The
Affordable Housing Program uses the one- to two-person family as the base, with one upward
adjustment for the three- or more-person family. The upward adjustment ranges from 15 percent
in the nontarget communities to 20 percent in the target communities.3 Although it is calculated
differently, the underlying assumption is the same for the income groups covered by both the
HUD Section 8 program and SONYMA's Affordable Housing Program: larger households have
higher expenditure needs and therefore can have higher absolute incomes than smaller households
and still qualify as income-constrained.
Exhibit 2-2 Income Limits for Low-, Moderate-, and Middle-Income
Households by Household Size Westchester County, 2000
1 2 3 4 5 6 7 8
or more Low Income 29,085 33,240 37,395 41,550 44,874 48,198 51,522 54,846 Moderate Income 46,536 53,184 59,832 66,480 71,798 77,117 82,435 87,754 Middle Income 58,170 66,480 74,790 83,100 89,748 96,396 103,044 109,692 Adjustment Factor Low Income 0.7 0.8 0.9 1 1.08 1.16 1.24 1.32 Moderate Income 0.7 0.8 0.9 1 1.08 1.16 1.24 1.32 Middle Income 0.7 0.8 0.9 1 1.08 1.16 1.24 1.32
In order to provide a consistent methodology for assigning household size adjustments,
our calculations for middle-income households vary by the sizes specified in the Section 8 3James O'Hare, the State of New York Mortgage Agency, telephone interview, June 25, 1990.
Westchester County March 2004 Affordable Housing Needs Assessment Chapter 2: Affordable Housing Demand
-7-
regulations. Adjustments increase or decrease in increments of about 10 percent to a total
difference increase of about 30 percent, which is comparable to the adjustments specified in the
SONYMA Affordable Housing Program. The household adjustment factors for households
ranging from one to eight or more persons in Westchester County are summarized in Exhibit 2-2. Household Designation
The final element in determining the number of low-, moderate-, and middle-income
households in the region is specification of what constitutes a household. For this purpose, several
categories of individuals have been excluded from further analysis. They are as follows:
1. Individuals living in group quarters;
2. Individuals living in institutions; and
3. Individuals living as roomers and boarders.
This eliminates college students living in dormitories, prisoners, nursing home occupants,
inmates of institutions, paid employees, roomers and boarders, and the homeless from being
counted as part of the low-, moderate-, and middle-income population in households.
Income-Constrained Households in 2000
As Exhibit 2-3 presents, in 2000 there were a total of 185,119 households with income
equal to or less than the median in Westchester County. This represents 55.2% of the total
households in the county. The reason this is greater than 50% is that we are using census data,
but applying the median determined by HUD. Of these income-constrained households, 94,336
(51.0%) are considered low-income, 59,001 (31.9%) are considered moderate-income, and
31,782 (17.1%) are considered middle-income.
As stated earlier, we will only be considering households from the first two income
groups in the final determination of affordable housing need, thus our target population consists
of 153,337 households, 61.5% of which are low income and 38.5% of which are moderate
income. We now turn to identifying the proportion of these households that are in need of
affordable housing either due to excessive housing costs, deficient housing, or overcrowded
conditions.

Westchester County March 2004 Affordable Housing Needs Assessment Chapter 2: Affordable Housing Demand
-8-
Exhibit 2-3 Household Income Related to Westchester County Median ($83,100), 2000
Income Range Number Percent Cumulative
Percent Low <50% 94,336 28.1 28.1 Moderate 50-80% 59,001 17.6 45.7
Target Population 153,337 Middle 80-100% 31,782 9.5 55.2
Income Constrained Total 185,119 Above Median 150,126 44.8 100.0
Total 335,244 100.0
Exhibit 2-4 details the income-constrained population of Westchester County by age
group. Each age cohort within the three income groups is also expressed as a percentage of total
households within that age cohort in the County. Particularly striking is the representation of
both very young and senior headed households within the low-income category—61.5% of
county households headed by a person under 24 are considered low income. Similarly, 52.4% of
county households headed by a person over 75 are considered low income.
Exhibit 2-4 Income-Constrained Households as a Percent of Total County Households,
by Age of Household Head Westchester County, 2000
Household Income Related to County Median 2000 - $83,100
Low <50% Moderate 50-80% Middle 80-100%
Age of Head Number Percent of County Total Number Percent of
County Total Number Percent of County Total
15 to 24 4,212 61.5% 1,291 18.8% 490 7.1% 25 to 34 14,556 29.3% 10,560 21.2% 5,567 11.2% 35 to 44 17,570 22.4% 13,964 17.8% 8,459 10.8% 45 to 54 11,953 17.1% 10,909 15.6% 6,103 8.7% 55 to 64 11,174 21.5% 7,661 14.7% 5,044 9.7% 65 to 74 15,008 37.2% 7,872 19.5% 3,667 9.1% 75 and up 19,862 52.4% 6,742 17.8% 2,453 6.5% Total 94,336 28.1% 59,001 17.6% 31,782 9.5%
Defining Housing Need: Overview
In the Housing Act of 1949, Congress established a goal of “a decent home and a suitable
living environment” for every American family. “Various interpretations of what constitutes a
‘decent’ home have been developed in an attempt to measure the progress made toward attaining

Westchester County March 2004 Affordable Housing Needs Assessment Chapter 2: Affordable Housing Demand
-9-
this goal.”4 Housing quality indicators available from the decennial census and the American
Housing Survey make it possible to describe the physical condition of housing in the United
States. In addition to the physical adequacy of housing units, HUD also uses crowding and cost-
burden indicators to determine the progress made toward the goals of the Housing Act of 149.5
All three conditions—physical inadequacy, crowding, and affordability—are recognized
as problems that deny Americans decent housing, and all three are included in CUPR's definition
of housing need. In considering each of these conditions, we prioritize demand due to deficient
housing over that due to overcrowding, and we prioritize need due to overcrowding over that due
to cost burden. As a result, households in deficient housing may or may not be crowded or cost
burdened, yet they are only included in the deficient housing category. Similarly, the
overcrowded category will include all non-deficient households that are crowded, regardless of
whether they may or may not also be cost burdened. The cost burdened demand represents those
households that are neither deficient, nor crowded, but pay too large a share of their income for
housing costs. Our purpose in this prioritization is to avoid double counting and to highlight as
most important those components of need—deficiency and crowding—that are most likely to lead
to the need for new housing construction. Finally, Westchester County has provided CUPR with
2000 figures for the homeless. The number of homeless households in single or family facilities
in 2000 will be added directly to the number for existing demand.
Defining Housing Need: Measuring Physical Inadequacy
The attempt to develop a sound methodology for measuring the physical adequacy of
housing predates the 1949 Housing Act.6 Reflecting concerns of the Depression years, the 1940
census was the first to include a census of housing, and it obtained a variety of facts on the
nation's housing. It asked for the number of rooms and occupants per dwelling unit, enabling
calculations to be made regarding crowding. It also required trained enumerators to judge the
condition of each dwelling unit and to distinguish between (1) units needing major repairs and (2)
those not needing major repairs. The criterion for classification was the presence or absence of a
4Iredia Irby, "Attaining the Housing Goal?" paper prepared for the Housing and Demographic Analysis Division, Office of Economic Affairs, U.S. Department of Housing and Urban Development, Washington, D.C., July 1986, p. 1. 5Ibid. 6U.S. Bureau of the Census, Measuring the Quality of Housing: An Appraisal of Census Statistics and Methods (Washington, D.C.: Bureau of the Census, 1967).

Westchester County March 2004 Affordable Housing Needs Assessment Chapter 2: Affordable Housing Demand
-10-
condition that, if left unattended, would undermine the soundness of the structure and create a
hazard as a place of residence.
The conjectural nature of this evaluation was compounded by the introduction of an
additional level of judgment for the 1950 census. For this census, the enumerator was required
not only to evaluate the dwelling unit's state of repair but also to judge the unit as “dilapidated” or
“not dilapidated.” The enumerator's task was expanded yet again for the 1960 census; housing
units were classified into one of three categories: sound (in good repair), deteriorating (in need of
repair), or dilapidated.7 Unfortunately, evaluations and retests of the 1960 housing census
revealed significant inaccuracies in the enumeration of housing quality. Enumerators' judgments
were found to be subjective and inconsistent. There was no uniform method for making
evaluations, and, in addition, the enumerator was given only about a minute to rate the structural
condition of a dwelling unit.
Questions regarding the structural soundness of housing units were removed from the
census after 1960. With the 1970 census, the Census Bureau initiated a new approach. Instead of
subjective appraisals of building condition, the bureau collected data on the presence or absence
of specific, objective attributes of housing units, such as the presence and completeness of
plumbing and kitchen facilities, availability of direct access to the unit, type of heating facility,
and so forth.8 The 1980 census continued this approach, including virtually all the questions
asked in the 1970 census. These objective measures of structural characteristics and facilities are
used in the CUPR methodology to identify the extent of housing deficiency among income-
constrained households. We have brought the methodology up-to-date based on the indicators of
housing quality included in the 2000 census.
CUPR Methodology for Identifying Physically Deficient Housing
The CUPR methodology uses four census variables to identify physically deficient
housing units in a region. These represent the full array of variables in the 2000 Census of
7U.S. Bureau of the Census, 200 Years of U.S. Census Taking: Population and Housing Questions, 1790–1990 (Washington, D.C.: Bureau of the Census, November 1989), p. 80. 8For evaluations of using these measures as indicators of housing condition, see Jeanne E. Goedert and John L. Goodman, Jr., Indicators of Housing Quality: An Exploration of the Annual Housing Survey (Washington, D.C.: Urban Institute, 1976); U.S. Bureau of the Census, A Preliminary Look at the Results of the Five City Survey (Washington, D.C.: Bureau of the Census, 1975); and Grace Horowitz, Housing Quality Data Needs of Users: Needs for Data on Housing Quality (Washington, D.C.: U.S. Department of Health, Education, and Welfare, 1977).

Westchester County March 2004 Affordable Housing Needs Assessment Chapter 2: Affordable Housing Demand
-11-
Population and Housing that describe housing quality.9 In addition, these are the variables used
by HUD and cited in the literature as significant indicators of housing quality.10 The four
variables are as follows:
1. year structure built: built pre- or post-1940;
2. plumbing facilities: lack of complete or exclusive plumbing;
3. kitchen facilities: lack of complete or exclusive kitchen facilities;
4. heating fuel: no fuel; or coal, coke, or wood for heat;
Year Built. The age of a residential structure is indicative of many housing quality
factors. Most immediately, the age of a structure shows how long it has been in the inventory and
the duration of time during which deterioration can potentially take place. Age is also a factor in
the filtering process. In general, it is older structures that are passed on to lower-income
households. As this process continues over time, the income capacity of the receiving group can
be insufficient to retain or maintain the structure; at this point, it can fall into the deficient
category. In the CUPR methodology, the age threshold selected is 1940: if a housing unit was
built before 1940, it signals a potential deficiency. Old housing (units built before 1940) is also
one of the criteria used in the Community Development Block Grant Program to allocate funds.
Plumbing Facilities. Incomplete plumbing facilities is considered a surrogate of
plumbing adequacy.11 The family health is endangered when the essential facilities—hot and
cold running water, flush toilet, and bathtub or shower—are not available. The lack of such
facilities is therefore used as an index of deficient housing conditions.
Kitchen Facilities. Adequate and unshared kitchen facilities are considered essential for
food preparation functions. The ingestion of foods prepared under unsanitary conditions or under
such conditions that encourage spoilage is clearly a threat to good health.12 The basic
components considered essential for a complete kitchen are: a sink with piped water, a range or
cookstove, and a refrigerator. The absence of any of these facilities or sharing them with another
household is a signal of deficient housing conditions.
9Several housing questions related to building condition that had been in the 1990 census were dropped from the 2000 census, such as water and sewer source. 10For metroarea comparisons of housing quality, HUD sponsors the American Housing Survey (AHS) for classifying deficient housing units. The AHS contains thirty-five indicators of housing condition and quality; it is a 1 in 2000 sample. The CUPR methodology uses the Public Use Microdata Sample of the decennial census to measure housing condition; it is a 1 in 6 sample. This permits us to generate custom cross-tabulations of any data required in the analysis. 11American Public Health Association, Basic Principles of Healthful Housing (New York: APHA, 1961). 12Ibid.

Westchester County March 2004 Affordable Housing Needs Assessment Chapter 2: Affordable Housing Demand
-12-
Heating Fuel. A reliable and safe heating source is essential for year-round occupancy of
housing in many areas of the United States, including New York State. The absence of heating
fuel or reliance on such potentially hazardous heating sources as coal, coke, and wood is an
indication of housing deficiency.
Using these four indicators of housing quality, the CUPR methodology classifies housing
units as deficient if any two quality measures indicate a substandard condition. Following this
definition, we identify as deficient a total of 2,481 housing units occupied by low- and moderate-
income households in the Westchester County housing region in 2000 (Exhibits 2-5, 2-6 and 2-
7). The vast majority of these housing units (2,107 or 85%) are deficient only in two areas—most
likely age and one of the other three (Exhibit 2-5).
Exhibit 2-5 Income Constrained Households by Incidence of Housing Deficiency,
Westchester County, 2000
Low Income Moderate Income Total Target Population Middle Income Indicators of
Housing Deficiency Number Percent Number Percent Number Percent Number Percent
Yes 768 51.2 384 39.1 1,152 46.4 111 36.9 No 731 48.8 598 60.9 1,329 53.6 190 63.1
Complete Plumbing
Total 1,499 100.0 982 100.0 2,481 100.0 301 100.0 Yes 855 57.1 434 44.2 1,289 52.0 160 53.2 No 644 42.9 548 55.8 1,192 48.0 141 46.8
Complete Kitchen
Total 1,499 100.0 982 100.0 2,481 100.0 301 100.0 OK 783 52.2 663 67.5 1,446 58.3 229 76.1 Deficient 716 47.8 319 32.5 1,035 41.7 72 23.9
Heating Fuel
Total 1,499 100.0 982 100.0 2,481 100.0 301 100.0 Newer 396 26.4 260 26.4 656 26.4 26 8.6 Older 1,103 73.6 722 73.6 1,825 73.6 275 91.4
New or Old Building Total 1,499 100.0 982 100.0 2,481 100.0 301 100.0
2 1,320 88.1 787 80.2 2,107 84.9 225 74.8 3 162 10.8 166 16.9 328 13.2 76 25.2
Number of Problems 4 17 1.1 29 3.0 46 1.9 - - Total 1,499 100.0 982 100.0 2,481 100.0 301 100.0
Using these results, it is evident that a relatively small proportion of low-, moderate-, and
middle-income households in Westchester occupy deficient housing (see Exhibit 2-6). Across the
County, 1.5 percent of total income-constrained households in 2000 reside in deficient units while
the remaining 98.5 percent occupy standard housing units. In terms of household size, housing-
deficient households tend to be small, with one- to two-person households comprising 60.8
percent of the total (Exhibit 2-7). This is particularly true of the low-income households. As
income increases, the housing-deficient tend to be larger households.

Westchester County March 2004 Affordable Housing Needs Assessment Chapter 2: Affordable Housing Demand
-13-
Exhibit 2-6 Income-Constrained Households by Incidence of Housing Deficiency,
Westchester County, 2000
Household Income Related to County Median 2000 - $83,100
Low <50% Moderate 50-80% Middle 80-100% Total Target Population
Total Income-Constrained
Housing Deficiency
Count Percent Count Percent Count Percent Count Percent Count Percent Not Deficient 92,837 98.4% 58,019 98.3% 31,481 99.1% 150,856 98.4% 182,336 98.5%Deficient 1,499 1.6% 982 1.7% 301 .9% 2,481 1.6% 2,782 1.5%Total 94,336 100.0% 59,001 100.0% 31,782 100.0% 153,337 100.0% 185,118 100.0%
Exhibit 2-7 Existing Housing Demand: Income-Constrained Housing Deficient Households by
Household Size, Westchester County, 2000
Household Income Related to County Median 2000 - $83,100 Number of Persons in
Household Low <50%
Moderate 50-80%
Middle 80-100% Total
1 or 2 964 627 102 1,692 3 or 4 426 245 90 761 5 or more 110 110 109 329
Total 1,499 982 301 2,782
Since we are only including the low- and moderate-income groups in our final need
determination, we conclude that 2,481 households contribute to existing affordable housing
demand due to deficient housing, consisting of 1,499 low-income households and 982 moderate-
income households. Defining Housing Need: Measuring Overcrowding
The degree of crowding within a dwelling unit is directly related to the potential quality
of life of the householders as well as the wear and tear sustained by the structure. The American
Public Health Association standards support the notion that a degree of privacy is essential for
safety and well-being. The actual point at which the number of persons in a dwelling unit
becomes a threat to health and safety is uncertain. However, the value of more than one person
per room (1.01) is commonly used by HUD in housing programs as the threshold for defining
living conditions as overcrowded.
In previous studies, CUPR used overcrowding as just one of the measures of housing
deficiency. Westchester County has asked CUPR to identify separately those units that are
considered overcrowded and we have done so in Exhibit 2-8. CUPR has identified 16,005

Westchester County March 2004 Affordable Housing Needs Assessment Chapter 2: Affordable Housing Demand
-14-
overcrowded, not deficient units among income-constrained households in Westchester. Among
the target population of low- and moderate-income households, the number of crowded units is
14,274. More than two-thirds of the overcrowded households in the target population are in the
low-income group (Exhibit 2-8).
In addressing overcrowding as a housing issue, it should be noted that the creation of one
new, large, affordable unit has the potential to create more than one satisfied affordable
household. That is, as an overcrowded household moves into a unit of larger size, the original
unit is left to address another household’s needs. Thus, in determining final need, only a portion
of the crowded households will require the creation of new housing units, which CUPR estimates
to be about 50%. This factor is taken into account in Exhibit 2-9, which details the housing
demand engendered by overcrowding among income-constrained households.
Exhibit 2-8 Income Constrained Households by Incidence of Crowding (Not Deficient),
Westchester County, 2000
Household Income Related to County Median 2000 - $83,100
Low <50% Moderate 50-80% Middle 80-100% Total Target Population
Total Income-Constrained
Crowding Status
Count Percent Count Percent Count Percent Count Percent Count Percent Not crowded 83,098 89.5% 53,484 92.2% 29,749 83,097 136,581 90.5% 166,331 91.2%Crowded 9,739 10.5% 4,535 7.8% 1,731 9,739 14,274 9.5% 16,005 8.8%Total 92,837 100.0% 58,019 100.0% 31,480 92,836 150,855 100.0% 182,336 100.0%
Exhibit 2-9 Existing Housing Demand: Income Constrained Crowded
Households (Not Deficient) by Household Size, Westchester County, 2000
Household Income Related to County Median 2000 - $83,100 Number of Persons in Household
Low <50% Moderate
50-80% Middle 80-
100%
Total Target
Population
Total Income-
Constrained 1 or 2 441 217 123 658 781 3 or 4 1,858 854 197 2,712 2,909 5 or more 2,648 1,253 523 3,901 4,425 Total 4,948 2,325 843 7,273 8,116
In 2000, the total number of overcrowded, not deficient units in these three income
groups was 8,116. Affordable housing need as a result of overcrowding is represented by those
units that are occupied by low- or moderate-income households, or 7,273 units. Not surprisingly,

Westchester County March 2004 Affordable Housing Needs Assessment Chapter 2: Affordable Housing Demand
-15-
the majority of these units are represented by larger households—those with 5 or more people
(Exhibit 2-9).
The discussion in the above two sections has focused on housing need in terms of the
physical characteristics of dwelling units. It has described the measurement of physical
inadequacy and crowding by the use of housing quality indicators found in the 2000 U.S. Census
of Population and Housing. Another housing problem, and one of growing concern to
policymakers, is housing affordability. We turn now to a discussion of this issue.
Defining Housing Need: Measuring Cost Burden
Beginning in the late 1970s, housing costs began to rise rapidly with incomes failing to
keep up with costs.13 In the last few decades, cost burden has become an increasing problem for
American households in general, but the data show that the burden has fallen particularly heavily
on the nation's poorest families. For example, 56 percent of the nation’s low or lower-middle
income households were moderately or severely cost burdened in 2001. At the same time, the
number of substandard units has been decreasing. In 2001, only about 3% of the nation’s low or
lower-middle income housing units were classified as severely inadequate.14 To summarize, the
data for both all households and for the neediest households show that the problem of excessive
housing cost burden has been increasing while physically inadequate housing is decreasing.
CUPR Methodology for Identifying Cost Burden
The CUPR methodology for identifying cost burden is based on federal household
eligibility standards for rental assistance programs. Since 1983, Congress has given preference
for admission to HUD's rental assistance programs to income-constrained households that pay
more than 50 percent of income for rent.15 These are the “worst case” families, with priority
needs as contrasted to those that have “lesser problems” defined as rent burdens between 30
percent and 50 percent of income.16 Thus, the CUPR methodology defines two categories of cost
13William C. Apgar, Jr., "The Leaky Boat: A Housing Problem Remains," in Housing America's Poor, edited by Peter D. Salins (Chapel Hill: University of North Carolina Press, 1987), p. 67. 14 Joint Center for Housing Studies of Harvard University. 2003. The State of the Nation’s Housing. Cambridge, MA, p. 40. 15William C. Apgar, Jr., "The Leaky Boat: A Housing Problem Remains," in Housing America's Poor, edited by Peter D. Salins (Chapel Hill: University of North Carolina Press, 1987). Preference is also given to income-constrained households that live in substandard housing or that have been involuntarily displaced. 16 Ibid

Westchester County March 2004 Affordable Housing Needs Assessment Chapter 2: Affordable Housing Demand
-16-
burden—those households that pay over 30 percent, but less than 50 percent of their income for
rent are moderately cost burdened, while those that pay more than 50 percent of their income for
rent are severely cost burdened. Owner households are included if they are paying above 50
percent of their income for housing costs, but are not included in the 30-50 percent category
because homeownership represents an investment for which families are often willing to pay a
disproportionate share of their income for a variety of reasons. It is assumed that the taking on of
a high housing burden includes an element of choice, involving either a preference for extensive
housing consumption, the expectation of future income increases, the desire for tax benefits
associated with homeownership, building equity, or an attempt to benefit from the investment
leveraging possible in an era of rising housing prices.
Following the above methodology, we identify as cost burdened (not deficient, not
crowded) a total of 75,136 income-constrained households in Westchester County (Exhibit 2-10)
in 2000, 72,259 of which consist of low- or moderate-income households. As would be expected,
the vast majority of all cost-burdened households are found among those with the lowest
incomes.
Exhibit 2-10 Income Constrained Households by Incidence of Excessive Cost Burden
(Not Deficient, Not Crowded) Westchester County, 2000
Household Income Related to County Median 2000 - $83,100
Cost Burden Low <50% Moderate 50-80% Middle 80-100% Total Number Percent Number Percent Number Percent Number Percent Not Cost Burdened 27,866 31.7% 43,457 78.0% 27,761 90.6% 99,084 56.9% Moderate Cost Burdened 16,262 18.5% 6,254 11.2% 825 2.7% 23,341 13.4% Severe Cost Burdened 43,760 49.8% 5,983 10.7% 2,052 6.7% 51,795 29.7% Total Cost Burdened 60,022 68.3% 12,237 22.0% 2,877 9.4% 75,136 43.1% Total 87,888 100.0% 55,694 100.0% 30,638 100.0% 174,220 100.0%
Two-thirds of all low-income households are cost-burdened, and half are severely cost
burdened. In contrast, less than 10% of middle-income households are cost burdened. Out of a
total of 75,136 cost-burdened (not deficient, not crowded) households, 49,537, or almost two-
thirds, are one- to two-person households. Less than 10 percent of the excessively cost-burdened
families consist of five or more persons (Exhibit 2-11). While cost burden is an important issue
for many Westchester households, it can be alleviated through policy interventions other than
housing unit creation and, thus, is not included in the final determination of housing need.

Westchester County March 2004 Affordable Housing Needs Assessment Chapter 2: Affordable Housing Demand
-17-
Exhibit 2-11 Existing Housing Demand: Income Constrained Cost Burdened Households
(Not Deficient, Not Crowded) by Household Size, Westchester County, 2000
Household Income Related to County Median 2000 -
$83,100 Number of Persons in Household
Low <50% Moderate 50-80%
Middle 80-100% Total
1 or 2 40,594 7,246 1,697 49,537 3 or 4 14,539 3,775 899 19,212 5 or more 4,889 1,217 282 6,387 Total 60,022 12,237 2,877 75,136
Summary: Existing Demand, 2000
Existing 2000 housing demand consists of three groups of low- and moderate-income
households: (1) those occupying deficient units; (2) a proportion of those in overcrowded units;
and (3) the number of homeless households reported in 2000.17 The numbers of households in
these three groups are summarized in Exhibit 2-12.
Exhibit 2-12 Total Housing Demand, Target Population Households by Income Level,
Westchester County, 2000
Household Income Related to County Median 2000 - $83,100 Source of Housing Demand Low <50% Moderate 50-80% Total
Number Percent Number Percent Number Percent Deficient 1,499 23.3% 982 29.7% 2,481 22.5% Crowded 4,948 76.7% 2,325 70.3% 7,273 65.9% Homeless 677 - - - 677 11.6% Total Existing Demand 7,124 100% 3,307 100% 10,431 100.0%
In total, existing demand for affordable housing in Westchester was 10,431 households in
2000. Of this the vast majority is due to overcrowding, with 7,273 households considered living
in overcrowded conditions. This represents 69.7 percent of total existing demand (Exhibit 2-12).
Not surprisingly, the demand for affordable housing is greatest in the lowest income group—low-
income households account for over two-thirds of existing affordable housing demand. 17 The figure for homeless households (677) was provided by the Westchester County Department of Social Services. It should be noted that we have only included those homeless households that could not have been counted in the 2000 census, in order to avoid of double counting. Homeless families and individuals in emergency housing apartments, for example, were not included as they might have been given and completed a census form.

Westchester County March 2004 Affordable Housing Needs Assessment Chapter 2: Affordable Housing Demand
-18-
PROJECTED DEMAND FOR AFFORDABLE HOUSING, 2000–2015
The method used to measure projected (2015) affordable housing need by low-,
moderate-, and middle-income households requires several consecutive steps. Population and
household projections are used to determine households in 2015. The proportion of total
household distribution by age cohort is determined by using weights derived from 2000 census
data to obtain the number of income-constrained households in 2015. This figure represents the
total affordable housing demand in 2015.
The measurement of total population and total household growth between 2000 and 2015
rests on two separate demographic components. These are (1) the 2000 and 2015 population
figures by age cohort; and (2) headship rates by age cohort. The county population figures used
in this study are the official New York State projections for Westchester and predict only modest
population growth (Exhibit 2-13).
Household Formation Rate
Given the population figures by age group reported above, the next step in the analysis is
to transform these measures of growth in total population into growth in the number of
households. The critical element for this purpose is the rate of household formation, or headship
rate.
Exhibit 2-13 Westchester County Population 2000
and Population Projections for 2005, 2010, and 2015
Age Group 2000 2005 2010 2015 0 to 4 64,242 56,069 54,148 54,923 5 to 9 67,993 61,005 54,774 53,519 10 to 14 63,757 66,863 60,940 55,881 15 to 19 54,363 62,165 63,937 59,400 20 to 24 46,962 53,935 58,988 59,335 25 to 29 54,734 52,034 56,969 60,268 30 to 34 68,733 58,655 57,786 61,524 35 to 39 79,809 67,849 60,252 60,305 40 to 44 77,224 77,632 67,212 61,091 45 to 49 68,166 76,309 75,621 66,170 50 to 54 61,832 66,340 73,274 71,917 55 to 59 48,310 57,540 61,763 67,521 60 to 64 38,370 42,762 50,562 54,245 65 to 69 34,039 32,919 36,826 43,241 70 to 74 32,746 28,689 28,119 31,668 75 to 79 26,529 26,328 23,350 23,214 80 to 84 17,991 19,654 19,418 17,550 85 and up 17,659 20,515 22,859 23,942
923,459 927,263 926,798 925,714

Westchester County March 2004 Affordable Housing Needs Assessment Chapter 2: Affordable Housing Demand
-19-
The headship rate measures the propensity of the population within a given age cohort to
form a household. Calculated separately for each age group, the headship rate is a function of the
sex, marital status, education, income, and other attributes of the population within that age group
and reflects the influence of these various characteristics on the propensity to form a new
household.18 In this analysis, county-specific headship rates are calculated as the ratio of
household heads within a given age cohort to the total number of persons within that age cohort.
The resulting headship rates vary directly by age cohort (Exhibit 2-14). The lowest rate of
household formation is evident in the youngest age cohorts; the population in the under 25 and 25
to 29 age groups has a higher propensity to remain part of an existing household, in part reflecting
the long-standing trend toward delayed marriage. Headship rates increase among the middle age
groups and are highest in the oldest age category, indicating the increasing presence of the elderly
in Westchester County.
Exhibit 2-14 Headship Rates by age Cohort
Westchester County, 2000
Age Cohort Headship Rate
15-24 0.0694 25-34 0.4027 35-44 0.5046 45-54 0.5497 55-64 0.5724 65-74 0.6116 75+ 0.6153
Application of age-specific headship rates (see Exhibit 2-14) to population figures for the
county (see Exhibit 2-13) yields household estimates by age group and county for 2015 (Exhibit
2-15). Westchester County household calculations for the period 2000 to 2015 show a substantial
increase in households in the youngest age group (under 25) and in the senior age groups (55 to
74), with the former group increasing by 20 percent and the 55 to 64 age group increasing by 34
percent. At the same time, the data show a general decline in households in the prime family-
18George Sternlieb, James Hughes, and Connie O. Hughes, Demographic Trends and Economic Reality (New Brunswick, N.J.: .Rutgers University Center for Urban Policy Research, 1982). See also Kenneth T. Rosen, California Housing Markets in the 1980s: Demand, Affordability, and Policies (Cambridge, Mass.: Oelgeschlager, Gunn & Hain, 1984), pp. 15–16, for an excellent discussion of headship rates and the household formation process. He argues that headship rates are a function of real income, the relative cost of operating a housing unit, and sociological factors, such as the postponement of marriage and the divorce rate.

Westchester County March 2004 Affordable Housing Needs Assessment Chapter 2: Affordable Housing Demand
-20-
forming years (25 to 44). The largest increase in terms of absolute numbers is in the 55 to 64 age
group, with an increase of 17,734 new households. Overall, the number of Westchester County
households is projected to increase by 4 percent between 2000 and 2015.
Exhibit 2-15 Change in Households
Westchester County, 2000 to 2105
Change 2000 2015 Number Percent 15 to 24 6,854 8,243 1,389 20% 25 to 34 49,699 49,041 (658) -1% 35 to 44 78,404 61,255 (17,149) -22% 45 to 54 70,061 75,911 5,850 8% 55 to 64 51,967 69,701 17,734 34% 65 to 74 40,329 45,815 5,486 14% 75 and up 37,930 39,813 1,883 5% Total 335,244 349,779 14,535 4%
Given these calculations of total household growth for 2000 to 2015, next it is necessary
to determine the proportion of these total households that can be classified as income constrained,
and thus the number of households in the target population.
Projected Demand for Affordable Housing
The preceding household projections by age cohort provide the necessary building blocks
to project future demand for affordable housing by low-, moderate-, and middle-income
households. Future growth in affordable housing need is a function of the contribution of each
age cohort to total household growth and the percentage of each age cohort classified as low,
moderate, and middle income. Once again, it is important to note that application of a single low-,
moderate-, and middle-income fraction to total household growth obscures the complexity of the
income characteristics of those households comprising total household growth over a given
period. Instead, the percentage share of low-, moderate-, and middle-income households within
each age cohort in 2000 is applied to the age-adjusted total household projections for 2015.
As stated earlier, the income characteristics of household growth require an adjustment of
median income levels used to define low-, moderate-, and middle-income households in
subsequent periods. That is, if household growth is substantially comprised of age groups falling
into the lower-income age cohorts, the likely result of that growth is to depress the median
income of households in place at the end of the growth period. Since low-, moderate-, and

Westchester County March 2004 Affordable Housing Needs Assessment Chapter 2: Affordable Housing Demand
-21-
middle-income households are defined as those with incomes at 100 percent or less of the area
median family income, this calculation is based on median income figures revised to reflect the
income composition of household growth in each period. The income limits for income-
constrained households in 2015 are shown in Exhibit 2-16. In 2015, CUPR projects that median
household income in Westchester County will be $118,224 (2000 $).
Exhibit 2-16 Projected Income Limits for Low-, Moderate, and Middle-Income
Households by Household Size Westchester County, 2015
1 2 3 4 5 6 7 8 or more Low Income $ 41,378 $ 47,290 $ 53,201 $ 59,112 $ 63,841 $ 62,659 $ 73,299 $ 78,028 Moderate Income $ 66,205 $ 75,663 $ 85,121 $ 94,579 $ 102,146 $ 100,254 $ 117,278 $ 124,845 Middle Income $ 82,757 $ 94,579 $ 106,402 $ 118,224 $ 127,682 $ 125,317 $ 146,598 $ 156,056 Adjustment Factor
Low Income 0.7 0.8 0.9 1 1.08 1.16 1.24 1.32 Moderate Income 0.7 0.8 0.9 1 1.08 1.16 1.24 1.32 Middle Income 0.7 0.8 0.9 1 1.08 1.16 1.24 1.32
Total household growth by age cohort for 2000 to 2015 is calculated together with the
percentage of growth in each age group classified as low, moderate, or middle income. The
resulting increase or decrease in these classified households by age cohort, when summed, yields
total growth in affordable housing demand for the year 2000 to the year 2015 (Exhibit 2-17).
These data are summarized by household size category in Exhibit 2-18.
Exhibit 2-17 Projected Housing Demand:
Change in Income-Constrained Households, Westchester County, 2000-2105
Change 2000 2015 Number Percent Low Income 94,336 101,253 6,917 7.3% Moderate Income 59,001 60,736 1,735 2.9% Total Target Population 153,337 161,989 8,652 5.6% Middle Income 31,782 32,482 700 2.2% Total Income-Constrained 185,118 194,471 9,352 5.1% Total Households 335,244 349,779 14,535 4.3%

Westchester County March 2004 Affordable Housing Needs Assessment Chapter 2: Affordable Housing Demand
-22-
Exhibit 2-18 Projected Housing Demand
Change in Income-Constrained Groups by Household Size Westchester County, 2000 to 2015
Low <50% Moderate 50-80% Middle 80-100% Total Change Change Change Change Number Percent Number Percent Number Percent Number Percent
1 or 2 7,237 105% 1,959 113% 1,005 144% 10,201 109%3 or 4 154 2% (227) -13% 43 6% (29) 0%5 or more (474) -7% 3 0% (348) -50% (819) -9%
Number of Persons in Household
Total 6,917 100% 1,735 100% 700 100% 9,352 100%
The projected growth in low-, moderate-, and middle-income housing need for 2000 to
2015 is 9,352 households in Westchester County (see Exhibit 2-18). Thus, the growth in low-,
moderate-, and middle-income housing need is a function of county trends in total household
growth and in the age-specific composition of that growth. In terms of household size, projected
demand by low-income households is concentrated in the smaller, one- to two-person households.
Since we are only considering low- and moderate-income groups as components of affordable
housing need, the total projected affordable housing demand is 8,652 units, 6,917 (79.9%) of
which are the result of projected growth in low-income households, and 1,735 (20.1%) of which
are the result of projected growth in moderate-income households.
SUMMARY OF EXISTING AND PROJECTED AFFORDABLE HOUSING
DEMAND
The preceding data on existing and projected demand for affordable housing are
summarized in Exhibit 2-19. To recapitulate, existing demand is defined as comprising three
groups: (1) the number of low- and moderate-income households living in deficient housing in
2000; (2) the number of low- and moderate-income households with overcrowded (not deficient)
conditions in 2000; and (3) homeless households in 2000. Projected demand comprises the
increase in the number of low-, and moderate-income households (regardless of housing
condition) during the period 2000 to 2015.

Westchester County March 2004 Affordable Housing Needs Assessment Chapter 2: Affordable Housing Demand
-23-
Exhibit 2-19 Total Housing Demand, by Income Level,
Westchester County, 2000-2015
Household Income Related to County Median Source of Housing Demand Low <50% Moderate 50-80% Total
Number Percent Number Percent Number Percent Deficient 1,499 23.3% 982 29.7% 2,481 22.5%Crowded 4,948 76.7% 2,325 70.3% 7,273 65.9%Homeless 677 - - - 677 11.6% Total Existing Demand 7,124 100% 3,307 100% 10,431 100.0%
Total Projected Demand 6,917 1,735 8,652
Total Demand 14,041 5,042 19,083
Existing 2000 low- and moderate-income demand in Westchester County consists of
10,431 households. Demand for affordable housing in Westchester County is projected to
increase by 8,652 low- and moderate-income households between the year 2000 and the year
2015. Thus, total affordable housing demand for Westchester County from the year 2000 to the
year 2015 is 19,083 units.

Westchester County March 2004 Affordable Housing Needs Assessment Chapter 2: Affordable Housing Demand
-24-

Westchester County March 2004 Affordable Housing Needs Assessment Chapter 3: Characteristics of Households
-25-
CHAPTER 3: CHARACTERISTICS OF INCOME-CONSTRAINED HOUSEHOLDS
As indicated in Chapter 2, the designation of income-constrained households with
housing need is based on three criteria: income, set at less than 50 percent (low income),
between 50 percent and 80 percent (moderate income), or between 80 percent and 100 percent
(middle income) of the area's median income modified for household size; housing condition,
defined as either standard or deficient according to a composite of several factors; crowding,
defined as 1.01 or greater persons per room; and cost burden, defined as payment of more than 30
percent of income on housing costs for renters and 50 percent of income on housing costs for
homeowners. Although the middle-income group and cost-burdened households are not included
in the final affordable housing need determination, they are included in this chapter for
informational purposes only.
Households are described in this chapter using (1) population and household
characteristics, including racial/ethnic origin, age, sex, and occupation of the chief income earner,
as well as household income and availability of an automobile, and (2) location within the county.
The discussion is prefaced by a composite picture of the county in terms of total households as of
2000, to serve as a backdrop and to suggest the extent to which the housing-need groups diverge
from total averages. The subsequent material describes the socioeconomic characteristics of
existing income-constrained, housing-deficient, crowded and cost-burdened households in
Westchester as of the year 2000. Next, we discuss the location of households in need within the
county. The final section concerns the socioeconomic characteristics of the projected income-
constrained households that will form in the county between the years 2000 and 2015.
SOCIOECONOMIC CHARACTERISTICS OF WESTCHESTER HOUSEHOLDS
All Westchester County Households, 2000
Socioeconomic characteristics for all Westchester County households are presented in
Exhibit 3-1. Household size in Westchester County in 2000 tended to be small: 55.2 percent
consisted of one to two persons and 33.1 percent consisted of three to four persons. Only 11.7
percent had five or more persons in the household. They were also predominantly white (75.3
percent) and non-Hispanic (88.7 percent). The chief income earners were principally male (60.6
percent) and were concentrated in the age groups of 25 to 64, which accounted for almost 75
percent of the population. Only 2 percent of household heads were 24 or younger. The annual

Westchester County March 2004 Affordable Housing Needs Assessment Chapter 3: Characteristics of Households
-26-
income in 2000 dollars of a majority of households (60 percent) was more than $49,100, but 20.1
percent of all households reported an income of less than $25,000 a year. Labor force
participation was reported at 66.5 percent, but 31.4 percent of heads of households were not in the
labor force. Managerial and professional occupations were the most common (47.6 percent
combined), followed by service and sales jobs (36.7 percent combined). Workplaces were located
relatively close to the residence, so that the journey-to-work took less than 30 minutes for a
plurality of principal income producers (47.2 percent). Most work-related journeys (70.9 percent)
depended on the automobile, and access to an automobile stood at 84.8 percent for households in
the county. Nevertheless, 21.7 percent depended on public transport, a figure that underscores the
importance of this service to residents. Finally, the largest industry employer for heads of
households was educational, health, and social services (22.5 percent), followed by professional,
scientific and management (14.4 percent), and finance, insurance, and real estate (12 percent).
Housing-Deficient Households, 2000
Income-constrained households suffering from deficient housing, overcrowding and
those bearing an excessive housing cost burden present distinct socioeconomic profiles. There
are some differences between these groups, especially in terms of household income and the
gender, age, and labor force status of the household's chief income producer. These and other
socioeconomic characteristics are shown in the following tables for housing-deficient,
overcrowded and cost-burdened households as of the year 2000. We begin our discussion with a
profile of the housing-deficient group (Exhibit 3-2).
In terms of household size, households living in deficient housing tend to be somewhat
smaller than in the county as a whole. About 60.8 percent consist of one to two persons,
(compared to about 55.2 percent of total households). Smaller household size is more prevalent
in low-income housing-deficient households. As income rises, so does the size of the household.
Housing-deficient households also differ from total Westchester County housing region
households in terms of racial composition. While county households are predominantly white,
with a nonwhite population of 24.7 percent (13.5 percent black and 11.2 percent other), housing-
deficient households show a nonwhite component that is more than twice that: 51 percent are
nonwhite (28.4 percent black and 22.6 percent other). A similar trend is apparent with respect to
the representation of Hispanic households. Whereas in the aggregate, Westchester County
households are only 11.3 percent Hispanic, the housing-deficient households are 23.9 percent
Hispanic.

Westchester County March 2004 Affordable Housing Needs Assessment Chapter 3: Characteristics of Households
-27-
Exhibit 3-1 Socioeconomic Characteristics of Total Households Westchester County, 2000
Selected Characteristics of Households Percent of Total (n=number of cases)
1 or 2 55.2%
3 or 4 33.1%
5 or more 11.7%
Total 100.0%
Number of Persons in Household
335,244
White 75.3%
Black 13.5%
Other 11.2%
Total 100.0%
Race of Head
335,244
Not Hispanic 88.7%
Hispanic 11.3%
Total 100.0%
Hispanic Origin of Head
335,244
Male 60.6%
Female 39.4%
Total 100.0%
Sex of Head
335,244
15 to 24 2.0%
25 to 34 14.8%
35 to 44 23.4%
45 to 54 20.9%
55 to 64 15.5%
65 to 74 12.0%
75 and up 11.3%
Total 100.0%
Age of Head
335,244
Employed 66.5%
Unemployed 2.2%
Not in Labor Force-or Military 31.4%
Total 100.0%
Labor Force Status of Head
335,226
$25,000 or less 20.1%
$25,001 thru $49,100 19.9%
$49,101 thru $81,000 20.1%
$81,001 thru $140,000 20.0%
$140,001 thru highest 19.9%
Total 100.0%
Household Income
335,244

Westchester County March 2004 Affordable Housing Needs Assessment Chapter 3: Characteristics of Households
-28-
Exhibit 3-1 (Cont.) Socioeconomic Characteristics of Total Households, Westchester County, 2000
Selected Characteristics of Households Percent of Total (n=number of cases)
Management, Business, & Financial 21.5%
Professional and Related 26.1%
Service Occupations 13.7%
Sales and Office occupations 23.0%
Farming, Fishing, & Forestry .1%
Construction, Extraction, & Maintenance 7.9% Production, Transportation, & Material Moving 7.6%
Total 100.0%
Occupation of Head
267,453
Less than 30 min 47.2%
30 to 59 min 32.5%
60 or more min 20.3%
Total 100.0%
Travel Time of Head (Minutes)
211,437
Auto 70.9%
Public Transit 21.7%
Other 3.7%
Work at Home 3.7%
Total 100.0%
Means of Travel to Work of Head
219,636
None 15.2%
One 35.8%
2 or more 49.0%
Total 100.0%
Vehicles in Household
335,244 Agriculture, forestry, fishing, hunting & mining .2%
Construction 6.5%
Manufacturing 7.8%
Wholesale trade 3.8%
Retail trade 8.1%
Transportation and warehousing, and utilities 5.1%
Information 5.4%
Finance, insurance, real estate 12.0%
Professional, scientific, management 14.4%
Educational, health and social services 22.5% Arts, entertainment, recreation, accommodation 4.8%
Other services 4.8%
Public administration 4.6%
Armed Forces .0%
Total 100.0%
Industry
267,502

Westchester County March 2004 Affordable Housing Needs Assessment Chapter 3: Characteristics of Households
-29-
Exhibit 3-2 Socioeconomic Characteristics of Housing Deficient Households
Westchester County, 2000
Selected Characteristics of Households Low Income Households
(n=cases)
Moderate Income Households
(n=cases)
Middle Income Households
(n=cases)
Total Housing Deficient (n=cases)
1 or 2 64.3% 63.8% 33.9% 60.8%
3 or 4 28.4% 25.0% 29.9% 27.3%
5 or more 7.3% 11.2% 36.2% 11.8%
Total 100.0% 100.0% 100.0% 100.0%
Number of Persons in Household
1,499 982 301 2,782
White 44.6% 57.3% 43.5% 49.0%
Black 34.8% 17.3% 32.2% 28.4%
Other 20.5% 25.4% 24.3% 22.6%
Total 100.0% 100.0% 100.0% 100.0%
Race of Head
1,499 982 301 2,782
Not Hispanic 80.2% 75.1% 59.1% 76.1%
Hispanic 19.8% 24.9% 40.9% 23.9%
Total 100.0% 100.0% 100.0% 100.0%
Hispanic Origin of Head
1,499 982 301 2,782
Male 48.9% 69.7% 97.0% 61.4%
Female 51.1% 30.3% 3.0% 38.6%
Total 100.0% 100.0% 100.0% 100.0%
Sex of Head
1,499 982 301 2,782
15 to 24 6.0% .0% .0% 3.2%
25 to 34 23.0% 24.7% 6.6% 21.8%
35 to 44 21.7% 29.4% 36.9% 26.1%
45 to 54 13.9% 15.5% 4.0% 13.4%
55 to 64 6.3% 18.6% 46.5% 15.0%
65 to 74 20.2% 11.8% 6.0% 15.7%
75 and up 8.9% .0% .0% 4.8%
Total 100.0% 100.0% 100.0% 100.0%
Age of Head
1,499 982 301 2,782
Employed 41.8% 64.5% 74.8% 53.4%
Unemployed 4.1% 8.8% .0% 5.3%
Not in Labor Force-or Military 54.1% 26.8% 25.2% 41.3%
Total 100.0% 100.0% 100.0% 100.0%
Labor Force Status of Head
1,499 982 301 2,782
$25,000 or less 82.1% .0% .0% 44.2%
$25,001 through $49,100 17.9% 66.5% 8.6% 34.0%
$49,101 through $81,000 .0% 33.5% 84.4% 21.0%
$81,001 through $140,000 .0% .0% 7.0% .8%
$140,001 through highest .0% .0% .0% .0%
Total 100.0% 100.0% 100.0% 100.0%
Household Income
1,499 982 301 2,782

Westchester County March 2004 Affordable Housing Needs Assessment Chapter 3: Characteristics of Households
-30-
Exhibit 3-2 (Cont.) Socioeconomic Characteristics of Housing Deficient Households
Westchester County, 2000 Selected Characteristics of Households Low Income
Households Moderate Income
Households Middle Income
Households Total Housing
Deficient Management, Business, & Financial 2.3% 14.8% 3.0% 7.5%
Professional and Related 3.9% 23.8% 4.0% 12.0%
Service Occupations 35.0% 9.3% 18.6% 22.3%
Sales and Office occupations 25.9% 20.0% 22.3% 23.0%
Farming, Fishing, & Forestry .0% .0% .0% .0%
Construction, Extraction, & Maintenance 17.4% 22.6% 11.6% 18.7%
Production, Transportation, & Material Moving 15.6% 9.5% 40.5% 16.5%
Total 100.0% 100.0% 100.0% 100.0%
Occupation of Head
1,033 915 301 2,249
Less than 30 min 61.4% 48.4% 28.2% 51.2%
30 to 59 min 27.4% 47.2% 61.8% 40.9%
60 or more min 11.2% 4.4% 10.0% 7.9%
Total 100.0% 100.0% 100.0% 100.0%
Travel Time of Head (Minutes)
554 633 170 1,357
Auto 66.8% 76.3% 81.7% 73.3%
Public Transit 33.2% 18.0% .0% 21.4%
Other .0% 5.7% .0% 2.6%
Work at Home .0% .0% 18.3% 2.7%
Total 100.0% 100.0% 100.0% 100.0%
Means of Travel to Work of Head
554 633 208 1,395
None 53.6% 22.3% 29.2% 39.9%
One 37.1% 49.7% 39.9% 41.8%
2 or more 9.3% 28.1% 30.9% 18.3%
Total 100.0% 100.0% 100.0% 100.0%
Vehicles in Household
1,499 982 301 2,782
Agriculture, forestry, fishing, hunting & mining .0% .0% .0% .0%
Construction 12.9% 16.9% 6.0% 13.6%
Manufacturing 6.8% 12.1% 5.6% 8.8%
Wholesale trade 4.4% 2.0% 7.0% 3.7%
Retail trade 13.7% 6.1% 13.6% 10.6%
Transportation and warehousing, and utilities 2.2% .0% 34.9% 5.7%
Information 2.5% 6.7% 9.6% 5.2%
Finance, insurance, real estate 2.3% 10.5% 20.3% 8.1%
Professional, scientific, management 14.9% 13.8% .0% 12.5%
Educational, health and social services 22.9% 18.4% .0% 18.0%
Arts, entertainment, recreation, accommodation 9.6% 4.3% .0% 6.1%
Other services 7.6% 9.3% .0% 7.3%
Public administration .0% .0% 3.0% .4%
Armed Forces .0% .0% .0% .0%
Total 100.0% 100.0% 100.0% 100.0%
Industry
1,033 915 301 2,249

Westchester County March 2004 Affordable Housing Needs Assessment Chapter 3: Characteristics of Households
-31-
Considering the sex of the head of household, low-income households show a smaller
percentage of males (48.9 percent) than is found in the moderate- and middle-income groups
(69.7 percent and 97 percent, respectively). These latter two housing-deficient income groups, in
fact, show a higher proportion of male household heads than in the county as a whole (60.6
percent). Data on the age of the head of household reveal differences between the county
aggregate—where households are concentrated in the 35-54 range—and housing-deficient
households, a little over half of which have heads below age 35.
Labor force participation is somewhat lower among housing-deficient households than
for the county as a whole: 53.4 percent compared to 66.5 percent for the county. Not
surprisingly, labor force participation increases dramatically with income, from 41.8 percent for
low-income households to 64.5 for moderate-income and 74.8 percent for middle-income
households. Unemployment is higher in moderate-income households (8.8 percent) than in the
county and even than among low-income households, reflecting the tendency of the long-term
unemployed to dropout of the labor market. (Note that this is expressed as a percentage of total
households rather than households in the labor force, and is thus not equivalent to the commonly
used definition of unemployment.) In the low-income group, 54.1 percent of chief income
producers are outside the labor force whereas for the county as a whole, the corresponding
number is 41.3 percent. The share of household heads that are not in the labor force is 26.8
percent for the moderate-income group and 25.2 percent for the middle-income group.
The annual income (in 2000 dollars) of housing-deficient households shows wide
variations. Predictably, the annual income of low-income households is low: more than 80
percent (82.1 percent) earn less than $25,000. The majority of the moderate-income households
earn between $25,000 and $49,100 (66.5 percent) and 85.4 percent of the middle-income
households earn between $49,101 and $81,000.
The data on occupation show patterns that are somewhat different from aggregate county
totals. In the county as a whole, managerial and professional occupations were the most common
(47.6 percent combined), followed by service and sales jobs (36.7 percent combined). The most
commonly represented occupations of income-constrained, housing-deficient households are
sales and service jobs (45.3 percent combined) and construction and production workers (35.2
percent combined). Differences between the income groups show a concentration in low-income
earners in service and sales occupations (60.9 percent).
The journey-to-work data reveal somewhat shorter travel time for the housing-deficient
household heads than for aggregate county totals. This is particularly illustrated by those

Westchester County March 2004 Affordable Housing Needs Assessment Chapter 3: Characteristics of Households
-32-
households that have commuting trips of more than an hour: 11.2 percent of low-income
household heads, 4.4 percent of moderate-income household heads, and 10 percent of middle-
income household heads. These figures compare to 20.3 percent for workers in the county as a
whole. A related factor is occupation. Some of the higher status and better paying jobs are
located in Manhattan, so that a longer commute becomes necessary.
The means of journey-to-work is the automobile for a large majority of the chief income
earners in the county as a whole (70.9 percent), as well as for the income-constrained housing-
deficient households (73.3 percent); the rest of the latter household heads are mostly dependent
on public transit (21.4 percent). As would be expected, the use of the automobile is highest in the
middle-income category (81.7 percent) than in the low- and moderate-income categories (66.8
percent and 76.3 percent, respectively). The low-income group is most dependent on public
transportation: 33.2 percent use this means of transportation to commute to work.
The availability of an automobile to a household is more clearly correlated with income
levels. While 53.6 percent of low-income housing-deficient households have no automobile, only
22.3 percent of the moderate-income households and 29.2 percent of the middle-income
households are similarly disadvantaged. One-car households form 37.1 percent of the low-, 49.7
percent of the moderate-, and 39.9 percent of the middle-income households. The percentage of
households with two or more cars also differs substantially: 9.3 percent for the low-, 28.1 percent
for the moderate-, and 30.9 percent for the middle-income group.
Overcrowded (Not Deficient) Households, 2000
As might be predicted, in terms of household size, income-constrained households living
in overcrowded conditions tend to be larger than in the county as a whole (Exhibit 3-3). About
54.4 percent consist of 5 or more persons, (compared to about 11.7 percent of total households).
Smaller household size is relatively more prevalent in low-income housing-deficient households.
As income rises, so too does the size of the household.
Overcrowded households also differ from total Westchester County households in terms
of racial composition. While county households are predominantly white, with a nonwhite
population of 24.7 percent (13.5 percent black and 11.2 percent other), overcrowded households
are 64 percent nonwhite (22.3 percent black and 41.9 percent other). 56 percent of overcrowded
households are Hispanic.
Considering the sex of the head of household, overcrowded households more closely
mirror the county average—62.8 percent of overcrowded households are headed by males. The

Westchester County March 2004 Affordable Housing Needs Assessment Chapter 3: Characteristics of Households
-33-
more affluent two overcrowded income groups, however, show a higher proportion of male
household heads than in the county as a whole (76.6 percent for moderate income and 81.9
percent for middle income, compared to 60.6 percent for the county as a whole). Data on the age
of the head of household reveal that overcrowded households are concentrated in the lower age
groups, though not to the same extent as the housing deficient.
Labor force participation is not significantly different for the overcrowded households
than for the county as a whole: 62.7 percent compared to 66.5 percent for the county. The data
on occupation for overcrowded households again show that those in housing need are
concentrated in sales and service jobs (48.8 percent combined) and construction and production
jobs (32.3 percent combined). Differences between the income groups show a concentration in
low-income earners in service occupations (38.7 percent).
The journey-to-work data reveal a shorter travel time for the overcrowded household
heads than for either the housing-deficient households or the aggregate county totals. 58.5
percent of overcrowded household heads have less than a 30 minute commute as compared to
47.2 percent for the county as a whole. The means of journey-to-work and the availability of an
automobile are similar to that in housing deficient households.
Cost-Burdened (Not Deficient, Not Overcrowded) Households, 2000
In terms of household size 65.9 percent of income-constrained, cost-burdened households
have one or two members, compared to 55.2 percent of county households (Exhibit 3-4). The
dominance of small households is especially striking among low-income cost-burdened
households. 67.6 percent of these households have one or two members, while 24 percent contain
three or four members.
As opposed to the deficient or overcrowded, the racial composition of the cost-burdened
household more closely reflects the county as a whole. Households with excessive cost burdens
are predominantly white—64.4 percent, a proportion that is still somewhat lower than the 75.3
percent of the county's households that are white. Although comprising only 13.5 percent of the
county's total households, blacks comprise 20.8 percent of cost-burdened households. Other racial
groups make up 14.8 percent of the cost-burdened. There is only a slight difference in the
incidence of Hispanic origin in cost-burdened households as compared to the county as a whole.
In the aggregate, household heads are 11.3 percent Hispanic; the cost-burdened group is 14.8
percent Hispanic. These data demonstrate that housing cost burden is a more universal problem
in Westchester County.

Westchester County March 2004 Affordable Housing Needs Assessment Chapter 3: Characteristics of Households
-34-
Exhibit 3-3 Socioeconomic Characteristics of Overcrowded (Not Deficient) Households
Westchester County, 2000
Selected Characteristics of Households Low Income Households
(n=cases)
Moderate Income Households
(n=cases)
Middle Income Households
(n=cases)
Total Overcrowded
(n=cases) 1 or 2 8.9% 9.4% 14.6% 9.6%
3 or 4 37.6% 36.7% 23.4% 35.8%
5 or more 53.5% 53.9% 62.1% 54.5%
Total 100.0% 100.0% 100.0% 100.0%
Number of Persons in Household
4,948 2,325 843 8,116
White 29.9% 46.8% 39.8% 35.8%
Black 24.1% 22.7% 10.8% 22.3%
Other 46.0% 30.5% 49.4% 41.9%
Total 100.0% 100.0% 100.0% 100.0%
Race of Head
4,948 2,325 843 8,116
Not Hispanic 38.1% 54.9% 48.5% 44.0%
Hispanic 61.9% 45.1% 51.5% 56.0%
Total 100.0% 100.0% 100.0% 100.0%
Hispanic Origin of Head
4,948 2,325 843 8,116
Male 53.1% 76.6% 81.9% 62.8%
Female 46.9% 23.4% 18.1% 37.2%
Total 100.0% 100.0% 100.0% 100.0%
Sex of Head
4,948 2,325 843 8,116
15 to 24 5.2% 7.4% 7.4% 6.0%
25 to 34 36.5% 19.6% 25.5% 30.5%
35 to 44 38.0% 38.5% 38.4% 38.2%
45 to 54 13.7% 19.5% 18.2% 15.9%
55 to 64 3.1% 10.3% 4.3% 5.3%
65 to 74 3.2% 3.5% 1.7% 3.2%
75 and up .3% 1.3% 4.5% 1.0%
Total 100.0% 100.0% 100.0% 100.0%
Age of Head
4,948 2,325 843 8,116Employed 55.7% 74.1% 72.1% 62.7%
Unemployed 8.7% 3.7% .0% 6.3%
Not in Labor Force-or Military 35.7% 22.2% 27.9% 31.0%
Total 100.0% 100.0% 100.0% 100.0%
Labor Force Status of Head
4,948 2,325 843 8,116
$25,000 or less 52.3% .0% .0% 31.9%
$25,001 through $49,100 45.8% 26.8% .0% 35.6%
$49,101 through $81,000 1.9% 72.5% 64.8% 28.7%
$81,001 through $140,000 .0% .6% 35.2% 3.8%
$140,001 through highest .0% .0% .0% .0%
Total 100.0% 100.0% 100.0% 100.0%
Household Income
4,948 2,325 843 8,116
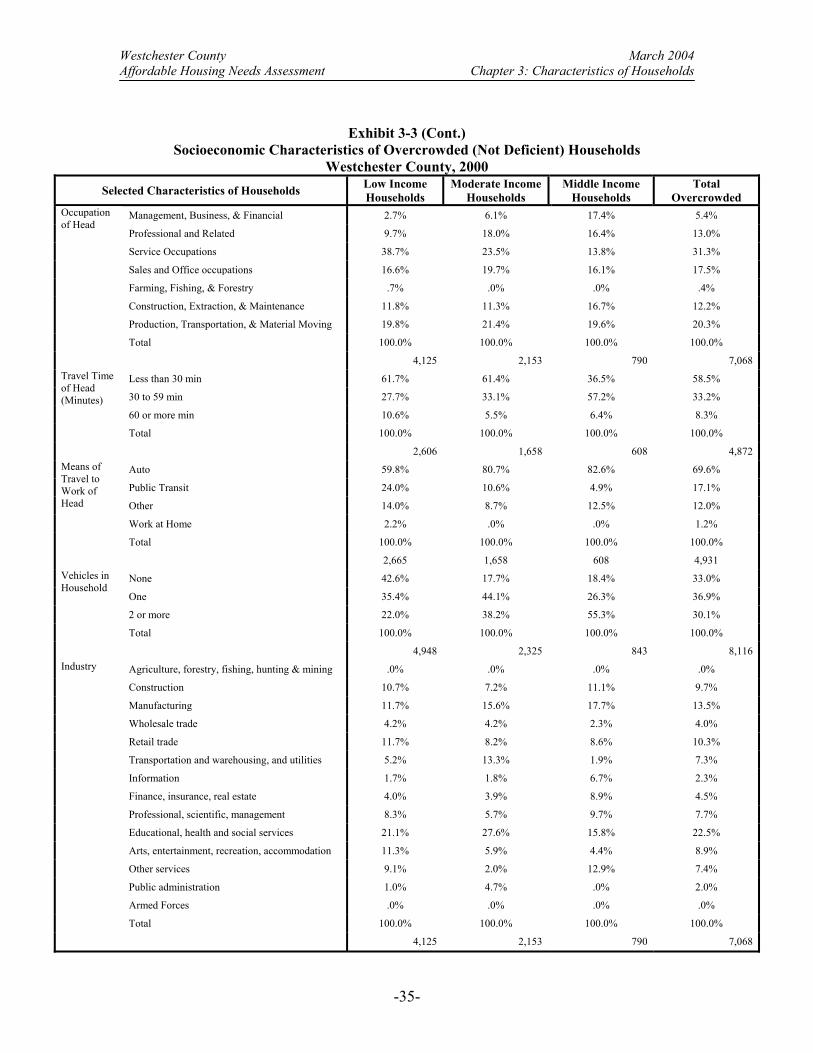
Westchester County March 2004 Affordable Housing Needs Assessment Chapter 3: Characteristics of Households
-35-
Exhibit 3-3 (Cont.) Socioeconomic Characteristics of Overcrowded (Not Deficient) Households
Westchester County, 2000 Selected Characteristics of Households Low Income
Households Moderate Income
Households Middle Income
Households Total
Overcrowded Management, Business, & Financial 2.7% 6.1% 17.4% 5.4%
Professional and Related 9.7% 18.0% 16.4% 13.0%
Service Occupations 38.7% 23.5% 13.8% 31.3%
Sales and Office occupations 16.6% 19.7% 16.1% 17.5%
Farming, Fishing, & Forestry .7% .0% .0% .4%
Construction, Extraction, & Maintenance 11.8% 11.3% 16.7% 12.2%
Production, Transportation, & Material Moving 19.8% 21.4% 19.6% 20.3%
Total 100.0% 100.0% 100.0% 100.0%
Occupation of Head
4,125 2,153 790 7,068
Less than 30 min 61.7% 61.4% 36.5% 58.5%
30 to 59 min 27.7% 33.1% 57.2% 33.2%
60 or more min 10.6% 5.5% 6.4% 8.3%
Total 100.0% 100.0% 100.0% 100.0%
Travel Time of Head (Minutes)
2,606 1,658 608 4,872
Auto 59.8% 80.7% 82.6% 69.6%
Public Transit 24.0% 10.6% 4.9% 17.1%
Other 14.0% 8.7% 12.5% 12.0%
Work at Home 2.2% .0% .0% 1.2%
Total 100.0% 100.0% 100.0% 100.0%
Means of Travel to Work of Head
2,665 1,658 608 4,931
None 42.6% 17.7% 18.4% 33.0%
One 35.4% 44.1% 26.3% 36.9%
2 or more 22.0% 38.2% 55.3% 30.1%
Total 100.0% 100.0% 100.0% 100.0%
Vehicles in Household
4,948 2,325 843 8,116
Agriculture, forestry, fishing, hunting & mining .0% .0% .0% .0%
Construction 10.7% 7.2% 11.1% 9.7%
Manufacturing 11.7% 15.6% 17.7% 13.5%
Wholesale trade 4.2% 4.2% 2.3% 4.0%
Retail trade 11.7% 8.2% 8.6% 10.3%
Transportation and warehousing, and utilities 5.2% 13.3% 1.9% 7.3%
Information 1.7% 1.8% 6.7% 2.3%
Finance, insurance, real estate 4.0% 3.9% 8.9% 4.5%
Professional, scientific, management 8.3% 5.7% 9.7% 7.7%
Educational, health and social services 21.1% 27.6% 15.8% 22.5%
Arts, entertainment, recreation, accommodation 11.3% 5.9% 4.4% 8.9%
Other services 9.1% 2.0% 12.9% 7.4%
Public administration 1.0% 4.7% .0% 2.0%
Armed Forces .0% .0% .0% .0%
Total 100.0% 100.0% 100.0% 100.0%
Industry
4,125 2,153 790 7,068

Westchester County March 2004 Affordable Housing Needs Assessment Chapter 3: Characteristics of Households
-36-
One of the biggest socioeconomic differences between cost-burdened households and
other household heads is the gender of the household's chief income producer. 55 percent of the
cost-burdened households are headed by a woman. By contrast, a majority of other households
are headed by a man: 60.6 percent of total county households, 61.4 percent of the housing-
deficient, and 62.8 percent of the overcrowded. As income rises, so does the proportion of
households headed by a man: in the low-income cost-burdened group, men are the primary
breadwinners for only 41.8 percent of the households, but in the moderate-income group, they are
the primary breadwinners for 56.8 percent, and 63.9% in the middle-income group.
Data on the age of the household head show a higher than average concentration of cost
burdened households in the youngest and oldest age categories. The data show that 21.4 percent
of the chief income producers for cost-burdened households are less than 35 years old. Even
more striking is the representation of elderly households. Almost one-third (29.4 percent) of the
cost-burdened households are headed by people 65 years or older, compared to 23.4 percent for
the county as a whole.
The degree of labor force participation is low among excessively cost-burdened
household heads. The percentage of households whose chief income producer is employed is
47.4 percent. Among all households, it is 66.5 percent. The chief income producers of almost
half (48.8 percent) the cost-burdened households are out of the labor force, compared to 31.4
percent of all households. This disparity in labor force participation probably reflects the
predominance of cost-burdened households headed by people over 65 years of age who are likely
to be retired or by women who may be unable to join the labor force because of childcare
responsibilities. Labor force participation rates are lower in the low-income group—only 40.9
percent of low-income cost-burdened households are employed. Predictably, excessively cost-
burdened households tend to have much lower incomes than households in the county at large.
More than 92.1 percent of the cost-burdened households have incomes of less than $49,100
compared to 40 percent of the percent of households in the county.
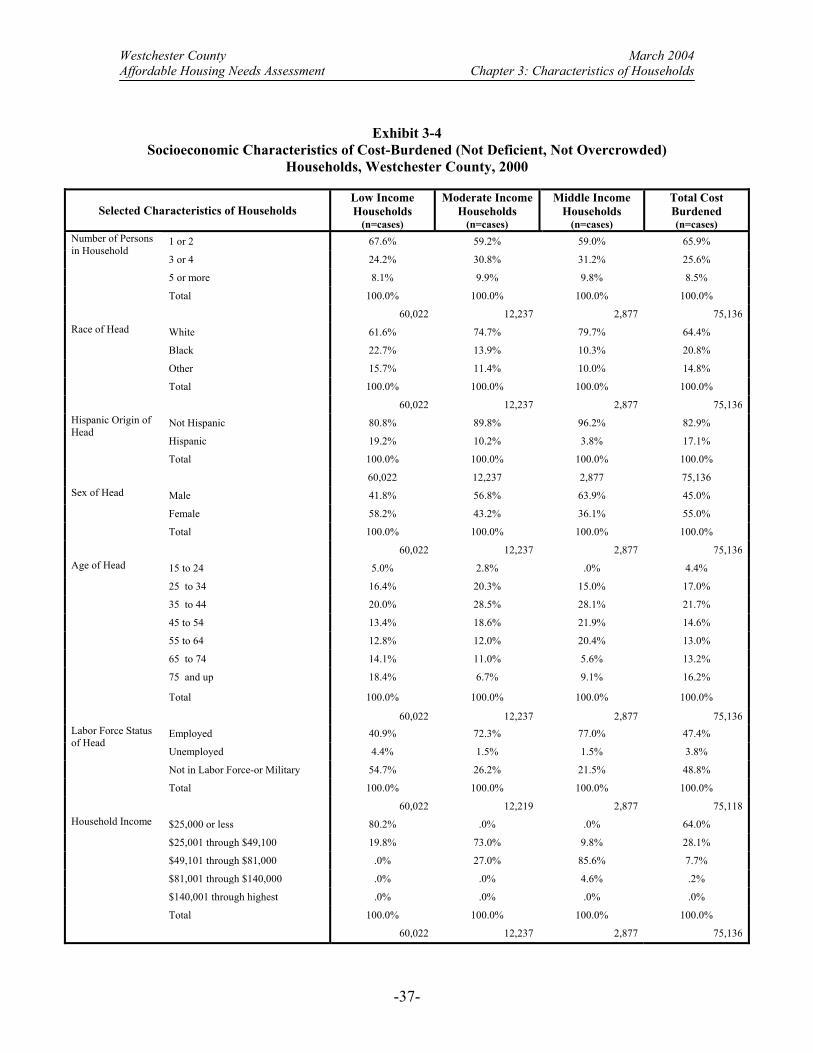
Westchester County March 2004 Affordable Housing Needs Assessment Chapter 3: Characteristics of Households
-37-
Exhibit 3-4 Socioeconomic Characteristics of Cost-Burdened (Not Deficient, Not Overcrowded)
Households, Westchester County, 2000
Selected Characteristics of Households Low Income Households
(n=cases)
Moderate Income Households
(n=cases)
Middle Income Households
(n=cases)
Total Cost Burdened (n=cases)
1 or 2 67.6% 59.2% 59.0% 65.9%
3 or 4 24.2% 30.8% 31.2% 25.6%
5 or more 8.1% 9.9% 9.8% 8.5%
Total 100.0% 100.0% 100.0% 100.0%
Number of Persons in Household
60,022 12,237 2,877 75,136
White 61.6% 74.7% 79.7% 64.4%
Black 22.7% 13.9% 10.3% 20.8%
Other 15.7% 11.4% 10.0% 14.8%
Total 100.0% 100.0% 100.0% 100.0%
Race of Head
60,022 12,237 2,877 75,136
Not Hispanic 80.8% 89.8% 96.2% 82.9%
Hispanic 19.2% 10.2% 3.8% 17.1%
Total 100.0% 100.0% 100.0% 100.0%
Hispanic Origin of Head
60,022 12,237 2,877 75,136
Male 41.8% 56.8% 63.9% 45.0%
Female 58.2% 43.2% 36.1% 55.0%
Total 100.0% 100.0% 100.0% 100.0%
Sex of Head
60,022 12,237 2,877 75,136
15 to 24 5.0% 2.8% .0% 4.4%
25 to 34 16.4% 20.3% 15.0% 17.0%
35 to 44 20.0% 28.5% 28.1% 21.7%
45 to 54 13.4% 18.6% 21.9% 14.6%
55 to 64 12.8% 12.0% 20.4% 13.0%
65 to 74 14.1% 11.0% 5.6% 13.2%
75 and up 18.4% 6.7% 9.1% 16.2%
Total 100.0% 100.0% 100.0% 100.0%
Age of Head
60,022 12,237 2,877 75,136Employed 40.9% 72.3% 77.0% 47.4%
Unemployed 4.4% 1.5% 1.5% 3.8%
Not in Labor Force-or Military 54.7% 26.2% 21.5% 48.8%
Total 100.0% 100.0% 100.0% 100.0%
Labor Force Status of Head
60,022 12,219 2,877 75,118
$25,000 or less 80.2% .0% .0% 64.0%
$25,001 through $49,100 19.8% 73.0% 9.8% 28.1%
$49,101 through $81,000 .0% 27.0% 85.6% 7.7%
$81,001 through $140,000 .0% .0% 4.6% .2%
$140,001 through highest .0% .0% .0% .0%
Total 100.0% 100.0% 100.0% 100.0%
Household Income
60,022 12,237 2,877 75,136

Westchester County March 2004 Affordable Housing Needs Assessment Chapter 3: Characteristics of Households
-38-
Exhibit 3-4 (Cont.) Socioeconomic Characteristics of Cost-Burdened (Not Deficient, Not Overcrowded)
Households, Westchester County, 2000 Selected Characteristics of Households Low Income
Households Moderate Income
Households Middle Income
Households Total Cost Burdened
Management, Business, & Financial 9.1% 18.2% 22.6% 11.7%
Professional and Related 13.2% 24.0% 28.8% 16.4%
Service Occupations 28.6% 14.5% 9.4% 24.5%
Sales and Office occupations 28.0% 28.4% 24.2% 27.9%
Farming, Fishing, & Forestry .2% .0% .0% .2%
Construction, Extraction, & Maintenance 9.8% 7.5% 10.6% 9.4%
Production, Transportation, & Material Moving 11.1% 7.4% 4.5% 10.0%
Total 100.0% 100.0% 100.0% 100.0%
Occupation of Head
36,139 10,679 2,537 49,355
Less than 30 min 56.9% 55.0% 45.6% 55.7%
30 to 59 min 29.1% 27.1% 33.3% 28.9%
60 or more min 14.0% 17.9% 21.1% 15.4%
Total 100.0% 100.0% 100.0% 100.0%
Travel Time of Head (Minutes)
22,842 8,343 2,118 33,302
Auto 65.8% 73.6% 68.2% 67.9%
Public Transit 22.8% 18.8% 26.3% 22.0%
Other 7.7% 2.9% 2.4% 6.2%
Work at Home 3.7% 4.7% 3.1% 3.9%
Total 100.0% 100.0% 100.0% 100.0%
Means of Travel to Work of Head
23,723 8,750 2,186 34,658
None 37.5% 10.0% 5.0% 31.8%
One 42.5% 47.9% 44.2% 43.4%
2 or more 20.0% 42.0% 50.7% 24.8%
Total 100.0% 100.0% 100.0% 100.0%
Vehicles in Household
60,022 12,237 2,877 75,136
Agriculture, forestry, fishing, hunting & mining .3% .0% .0% .2%
Construction 7.7% 7.5% 4.8% 7.5%
Manufacturing 7.1% 6.7% 4.7% 6.9%
Wholesale trade 3.5% 3.8% 1.6% 3.5%
Retail trade 11.8% 9.1% 10.7% 11.2%
Transportation and warehousing, and utilities 4.4% 5.5% 8.2% 4.9%
Information 2.4% 4.7% 9.6% 3.3%
Finance, insurance, real estate 7.1% 11.3% 12.1% 8.2%
Professional, scientific, management 11.6% 14.2% 11.5% 12.2%
Educational, health and social services 25.5% 21.3% 19.8% 24.3%
Arts, entertainment, recreation, accommodation 8.7% 6.0% 7.4% 8.1%
Other services 7.9% 6.0% 2.6% 7.2%
Public administration 2.0% 3.8% 7.0% 2.7%
Armed Forces .0% .0% .0% .0%
Total 100.0% 100.0% 100.0% 100.0%
Industry
36,139 10,679 2,537 49,355

Westchester County March 2004 Affordable Housing Needs Assessment Chapter 3: Characteristics of Households
-39-
The data on occupation show that the chief income producers of cost-burdened
households are disproportionately employed within lower-paying sales, clerical, and service
occupations. The chief income producers for almost 53 percent of the cost-burdened households
belong to sales, clerical, or service occupations, compared to 36.7 percent of the households in
the county. Blue-collar occupations account for 19.4 percent of the cost-burdened household
heads, compared to 15.5 percent of total household heads in the county.
In terms of journey-to-work time, the heads of cost-burdened households are somewhat
more likely to have shorter commutes than the county average. The means of journey-to-work are
very similar to the county average. As for automobile availability, cost-burdened households are
somewhat less likely to have access to a car, or to as many cars.
LOCATIONAL CHARACTERISTICS OF HOUSEHOLDS
In order to inform the county’s decision-making process in regard to meeting affordable
housing demand, CUPR has generated results for each component of existing demand among
income-constrained households—housing deficient, overcrowded, cost burdened—by location
within Westchester County. We use the six Public Use Microdata Areas (PUMAs) identified by
the census (Yonkers, Northeast, Northwest, West Central, East Central and Southeast—See Map
3-1). Before discussing the locational characteristics of each of the components of need, we look
at the characteristics of all Westchester households and those in the income-constrained category.
Total and Income-Constrained Households, 2000
Exhibit 3-5 presents the breakdown of where Westchester County households are located
with in the county. Census PUMAs are supposed to represent equally populated areas, yet in an
effort to draw appropriate boundaries, some PUMAs are more populated than others. In the case
of Westchester, Yonkers and the Southeast account for a somewhat greater proportion of total
households than the other areas. Thus, we would expect for Yonkers and the Southeast to have a
larger number of households in need, even if the rate of need throughout the county was constant.
Nevertheless, Exhibit 3-5 shows that both Yonkers and Southeast have a greater percentage of
income-constrained households than their share of total county households. Thus, income-
constrained households are more concentrated in Yonkers (29.1 percent) and the Southeast (22.6
percent) than in the rest of the county’s areas.

Westchester County March 2004 Affordable Housing Needs Assessment Chapter 3: Characteristics of Households
-40-
Map 3-1
Yonkers
Harrison
w City
Rye
Chappaqua
Armonk
White Plains
New Rochelle
Ossining
Mahopac
Gl C
Scarsdale
Peekskill
y Point
Croton-on-Hudson
Blauvelt Tarrytown
Irvington
Bedford
Congers
Haverstraw
Valhalla
Briarcli ff Manor
Tappan
Sleepy Hollow
Rye BrookHartsdale
Lattingtown
Upper Nyackardonia
Yorktown Heights
Mill Neck
Mount Vernon
Thornwood
Mamaroneck
Valley Cottage
Eastchester
Jefferson Valley-Yorktown
Peach Lake
Orangeburg
Dobbs Ferry
Nyack
Mount Kisco
West Nyack
Crompond Golden's Bridge
Lake Mohegan
Port Chester
Bayville
Ardsley
Heritage Hil ls
Buchanan
Hawthorne
Crugers
Shrub Oak
Pleasantvi lle
Cove Nec
Hastings-on-Hudson
South Nyack
Piermont
Lincolndale
Elmsford
Scotts Corners
Pelham
Larchmont
Bronxville
Pelham Manor
est Haverstraw
ontgomery
Highland Falls
Verplanck
Centre Island
Locust Valley
8 0 8 16 Miles
Pl36_d00.shpP536_d00.shpCo36_d00.shp
N
EW
S
Westchester County, New York5% Sample Public Use (PUMAs) Microdata Areas
NortheastNorthwest
West Central
East Central
Southeast
Yonkers
Source: U.S. Department of Commerce, Bureau of Census. U.S. Census of Population and Housing, 2000.

Westchester County March 2004 Affordable Housing Needs Assessment Chapter 3: Characteristics of Households
-41-
Exhibit 3-5 Income-Constrained Households by Location in
Westchester County, 2000
Public Use Area Percent Not
Income Constrained
Percent Income
Constrained
Percent of County Total
Yonkers 13.9% 29.1% 22.3%
Northeast 18.9% 8.8% 13.3%
Northwest 15.4% 14.1% 14.7%
West Central 20.9% 14.8% 17.5%
East Central 13.6% 10.5% 11.9%
Southeast 17.2% 22.6% 20.2%
Total 100.0% 100.0% 100.0%
150,126 185,118 335,244
Housing Deficient Households, 2000
Of interest are those locations where housing deficiency is a greater proportion of all
households than those income constrained. Exhibit 3-6 demonstrates that although Yonkers
accounts for the most cases, the West Central and Southeast areas have a greater proportion of
housing deficiency than income constrained. The West Central area represents 14.8 percent of
income-constrained households (Exhibit 3-5), but contains 21.2 percent of deficient units. The
figures for the Southeast are 22.6 percent and 27 percent, respectively.
Exhibit 3-6 Housing Deficient Households by Location in
Westchester County, 2000
Public Use Area Number Percent of Housing Deficient
Percent of Total Income Constrained
Yonkers 753 27.1% 29.1%
Northeast 161 5.8% 8.8%
Northwest 258 9.3% 14.1%
West Central 591 21.2% 14.8%
East Central 269 9.7% 10.5%
Southeast 750 27.0% 22.6%
Total 2,782 100.0% 100.0%

Westchester County March 2004 Affordable Housing Needs Assessment Chapter 3: Characteristics of Households
-42-
The higher percentage of deficient units in the West Central area might be explained by
the age of much of the housing stock found in the Hudson River villages. In general, housing
deficiency appears to be concentrated in the areas with older housing stock.
Overcrowded (Not Deficient) Households, 2000
In contrast to housing deficiency, overcrowded units are much more heavily concentrated
in Yonkers (Exhibit 3-7). While Yonkers represents 29.1 percent of income-constrained units, it
contains 40.7 percent of demand due to overcrowding. It is worth noting that overcrowding is
particularly concentrated in Hispanic-headed households (Exhibit 3-3), and that Hispanics have a
larger presence in Yonkers than in most other county areas. All other county areas tend to have a
lower incidence of overcrowding than their share of income-constrained households would
suggest.
Exhibit 3-7 Overcrowded (Not Deficient) Households by Location in
Westchester County, 2000
Public Use Area Number Percent of Overcrowded
Percent of Total Income Constrained
Yonkers 3,300 40.7% 29.1%
Northeast 330 4.1% 8.8%
Northwest 975 12.0% 14.1%
West Central 1,197 14.7% 14.8%
East Central 606 7.5% 10.5%
Southeast 1,708 21.0% 22.6%
Total 8,116 100.0% 100.0%
Cost-Burdened (Not Deficient, Not Overcrowded) Households, 2000
In contrast to the other components of housing need, cost-burdened households have no
clearly differentiated locational characteristics (Exhibit 3-8). In fact, the distribution of cost-
burdened households within the county closely mirrors the distribution of income-constrained
households generally—the relative proportions in each area varying only by one or two
percentage points. This indicates that cost burden is an issue that affects all income-constrained
households, regardless of location within the county.

Westchester County March 2004 Affordable Housing Needs Assessment Chapter 3: Characteristics of Households
-43-
Exhibit 3-8 Cost-Burdened (Not Deficient, Not Overcrowded) Households by Location in Westchester
County, 2000
Public Use Area Number Percent of Cost Burdened
Percent of Total Income Constrained
Yonkers 21,143 28.1% 29.1%
Northeast 6,688 8.9% 8.8%
Northwest 9,631 12.8% 14.1%
West Central 10,553 14.0% 14.8%
East Central 8,932 11.9% 10.5%
Southeast 18,189 24.2% 22.6%
Total 75,136 100.0% 100.0%
CHARACTERISTICS OF PROJECTED DEMAND HOUSEHOLDS, 2000-2015
As defined in Chapter 2, the projected increase in low-, moderate-, and middle-income
households between 2000 and 2015 is based solely on the income criterion, without reference to
housing condition or cost burden. Low-, moderate-, and middle-income household projections are
fueled largely by the underlying demographic and socioeconomic trends projected for total
county populations. Therefore, the projected composition of these additional households will
reflect broader countywide patterns of change rather than the characteristics of existing housing-
deficient and cost-burdened characteristics.
It is important to note that the changes reported in income-constrained households
between 2000 and 2015 constitute net change for each socioeconomic category and that each
socioeconomic category is considered individually. For example, income-constrained households
whose heads are between 35 and 44 are expected to decrease, but these declines will be offset by
increases of households whose heads are older, particularly between the ages of 55 and 74. Thus,
Exhibit 3-9 shows minus percentages for the younger age categories and positive values for the
older age categories.
In Chapter 2, we estimated that the number of low-, moderate-, and middle-income
households within the Westchester County housing region will increase by 9,352 households.
Almost three-quarters (74 percent) will be low-income households, 18.5 percent will be
moderate-income, and about 7.5 percent will be middle-income households. In terms of
household size, most new households are projected to consist of one or two persons. Selected
socioeconomic characteristics of these additional households are presented in Exhibit 3-9.

Westchester County March 2004 Affordable Housing Needs Assessment Chapter 3: Characteristics of Households
-44-
Exhibit 3-9 Socioeconomic Characteristics of Projected Housing Demand
Change Over Time, Westchester County, 2000-2015
Selected Characteristics of Households
Low Income Households,
Percent of Total Change 2000-2015
(n=cases)
Moderate Income
Households, Percent of Total
Change 2000-2015
(n=cases)
Middle Income Households,
Percent of Total Change 2000-2015
(n=cases)
Total Projected, Percent of Total
Change 2000-2015 (n=cases)
1 or 2 105% 113% 144% 109% 3 or 4 2% -13% 6% 0% 5 or more -7% 0% -50% -9%
Number of Persons in Household
Total 6,917 1,735 700 9,352White 77% 105% 75% 82% Black 19% 3% 18% 16% Other 4% -8% 8% 2%
Race of Head
Total 6,917 1,735 700 9,352Not Hispanic 95% 98% 117% 97% Hispanic 5% 2% -17% 3%
Hispanic Origin
Total 6,917 1,735 700 9,352Male 42% 62% 28% 44% Female 58% 38% 72% 56%
Sex
Total 6,917 1,735 700 9,35215 to 24 12% 15% 14% 13% 25 to 34 7% -4% 16% 6% 35 to 44 -46% -153% -287% -83% 45 to 54 5% 19% 87% 14% 55 to 64 53% 142% 236% 83% 65 to 74 36% 72% 72% 45% 75 and up 32% 9% -39% 23%
Age of Head
Total 6,917 1,735 700 9,352Employed 15% 8% 71% 18% Unemployed 1% 7% -6% 2% Not in Labor Force-or Military 83% 85% 35% 80%
Labor Force Status of Head
Total 6,917 1,731 700 9,349Management, Business, & Financial 11% 7% 41% 15% Professional and Related 11% -2% 35% 12% Service Occupations 30% 32% -29% 21% Sales and Office occupations 34% 48% 49% 39% Farming, Fishing, & Forestry 0% 0% 4% 0% Construction, Extraction, & Maintenance 4% 2% -15% 1% Production, Transportation, & Moving 10% 13% 16% 12%
Occupation of Head
Total 2,589 664 627 3,880

Westchester County March 2004 Affordable Housing Needs Assessment Chapter 3: Characteristics of Households
-45-
The projection of additional low-, moderate-, and middle-income households by race in
the Westchester housing region shows that whites comprise 82 percent of projected growth, with
black households accounting for 16 percent of growth. Overall, the share of income-constrained
households of Hispanic origin in the Westchester County housing region will increase only
slightly during the next decade. Exhibit 3-9 shows that while the share of Hispanic households is
projected to increase among low-and moderate-income households, there will be a decrease of
Hispanic households in the share of middle-income households.
The sex of the household head will be female for over half (56 percent) of projected
change in low-, moderate-, and middle-income households, as female-headed households increase
more than male-headed households in both the low- and middle-income categories. In terms of
the age of the household head, the share of income-constrained households with relatively young
heads, especially those between the ages of 35 to 44, will decline during the forecast period. The
largest increases in households will occur among those headed by persons in the 55 to 74 age
groups.
The extent of labor force participation continues to be a clear indication of income
differences (see Exhibit 3-9). An alarming 80 percent of new income-constrained household
growth will be accounted for by households where the head is not in the labor force. Clearly this
is an outgrowth of the strong growth in households headed by the elderly. The occupation of the
chief income producers for the region's additional income-constrained households will be
concentrated in the sales and service occupations.
SUMMARY
Blacks and minority groups are much more likely to live in deficient or overcrowded
units. In particular, 56 percent of overcrowded units are headed by a person of Hispanic origin
(Exhibit 3-3). Minorities also have a higher incidence of cost burden.
In terms of location, the greatest affordable housing need is concentrated in
Yonkers and the Southeast. In particular, Yonkers has a disproportionate share of
overcrowded households (Exhibit 3-7), while the Southeast and West Central areas have
a disproportionate share of deficient units (Exhibit 3-6). Interestingly, cost burden is a
housing problem that is evenly distributed among the income-constrained in all areas of
the county (Exhibit 3-8). Finally, the vast majority of future housing demand will be
accounted for by households headed by persons aged 55 and up.

Westchester County March 2004 Affordable Housing Needs Assessment Chapter 3: Characteristics of Households
-46-

Westchester County March 2004 Affordable Housing Needs Assessment Chapter 4: Existing and Projected Housing Supply
-47-
CHAPTER 4: EXISTING AND PROJECTED HOUSING SUPPLY
INTRODUCTION
In Chapter 2, we presented data on existing and projected demand for affordable housing
in the Westchester County housing region. Existing demand was defined as the number of low-,
and moderate-income households either living in deficient or overcrowded housing and the
number of homeless households in 2000. Projected demand was defined as the increase in the
number of low-, and moderate-income households (regardless of housing condition) during the
period 2000 to 2015. Thus, total demand was shown to consist of (1) year 2000 deficiency-based
demand of 2,481 units; (2) year 2000 overcrowded demand of 7,273 units; (3) year 2000
homeless household population of 677; and (4) a year 2015 projected demand of 8,652 units, for a
total of 19,083 units.
A widespread assumption in public debate appears to be that meeting housing demand
requires new construction in a price range and unit type not currently being provided in the
region. There are two problems with this assumption. First, we have shown that housing demand
is comprised of different kinds of need. New construction may be appropriate to meet
prospective demand, but subsidies for households that are excessively cost-burdened or unit
rehabilitation for households that are living in deficient units may also be more appropriate
responses for these groups. New construction, in short, is not the only solution to meeting
housing demand. A number of strategies are possible, and the causes giving rise to housing
demand must be examined for the appropriate response.
Second, before determining the extent to which new construction is required to satisfy
demand, we must examine how well that demand is likely to be met given existing and projected
dimensions of the county’s housing supply. To what extent is the current housing delivery
process already providing housing for low-, moderate-, and middle-income households within
normal market channels and with the housing programs now in place? The answer to this
question can be obtained only by looking at the numbers on the existing housing stock and recent
construction trends. Analysis of housing supply trends is a critical component in responding to
the challenge of providing affordable housing. This chapter presents baseline data on the
dimensions of Westchester County's housing supply. Once the parameters of existing and
projected housing supply are determined, we will be able to match demand and supply and
calculate unmet need. It should be noted that this discussion of supply is for informational
purposes only.

Westchester County March 2004 Affordable Housing Needs Assessment Chapter 4: Existing and Projected Housing Supply
-48-
Our discussion addresses the following issues:
First, what are the characteristics of the housing stock? This discussion describes the
base housing supply in terms of magnitude, housing type, tenure (own versus rent), and value/rent
levels.
Second, what have been recent trends in housing supply? Net change in the housing
stock is a complex composite reflecting additions to the stock through new construction and
conversion of units from single-family to multifamily or from nonresidential to residential. Also
reflected in net change are losses from the housing inventory through demolition, condemnation,
and fire or other disaster and conversion of residential units to nonresidential uses. Data on these
components of change in the housing stock are presented to provide a picture of recent housing
supply trends in the region and to provide a basis for future supply projections.
Third, what are projections of housing supply for 2000 to 2015? Information from the
preceding two sections—on the base stock and recent trends in housing supply—together with
available data on national housing supply projections, are used to develop projections of net
change in housing supply in Westchester County through 2015.
Fourth, what proportion of projected growth in housing supply will be affordable by low-
, moderate-, and middle-income households? It is widely assumed that the existing delivery
system is unable to provide affordable housing. How accurate is this assumption? This will be
discussed in detail in Chapter 5.
Within this analysis, we focus on the key components of the housing inventory.19 First,
housing-unit type (e.g., single-family, multifamily, and so on) is discussed. Different housing
types exhibit important variations in costs, density, and amenability to intervention. Secondly,
we look at housing tenure—owner-occupied versus renter-occupied housing units—each of
which represents special considerations in meeting affordable housing needs. Down payment and
financing requirements may limit the ability of the owner-occupied sector to meet such needs
while various limitations on market return can constrain construction within the rental sector.
In sum, this chapter provides a baseline view of existing and projected housing
inventories from which housing for low-, moderate-, and middle-income households can
potentially be drawn. It must be stressed that this discussion addresses housing supply and
19American Institute of Planners, Regional Housing Planning: A Technical Guide (Washington, D.C.: AIP, March 1972).
Westchester County March 2004 Affordable Housing Needs Assessment Chapter 4: Existing and Projected Housing Supply
-49-
changes in the inventory in the absence of any new governmental intervention. This represents
the status quo—the ability of current and projected inventories to house the population. C
THE BASE HOUSING STOCK
According to the 2000 U.S. census, total housing units in Westchester County numbered
349,455. With total housing units in 1990 numbering 336,727, this represents an increase of
12,728 units, for a gain of about 3.8 percent. For the purposes of this study, we are looking at the
characteristics of occupied housing units. The data for these units are presented in Exhibit 4-1.
In 2000, there were 335,244 occupied housing units. This represents an increase of 17,933 over
1990's figure of 317,311.
Over half (50.7 percent) of the county's inventory in 2000 consisted of single-family
housing units. Multifamily units comprised almost one-third (31.6 percent) of all units in
Westchester, while those that accommodate 2 to 4 families represented 17.6 percent of the total.
About 60 percent of the base occupied conventional housing stock (i.e., excluding mobile homes)
in the county was owner-occupied (59.9 percent), comprising 200,724 units; the remaining
134,520 units (40.1 percent) were renter-occupied (Exhibit 4–1).
The data show that over three-quarters (77.5 percent) of Westchester's housing stock was
built before 1970. Successive decades have witnessed a consistent drop-off in new units. This
might appear contrary to anecdotal observation, but the fact that much of the new housing
consists of large, single family homes means that many fewer units of housing are created per
acre of development.
Rents in Westchester are concentrated at the higher end of the spectrum, with almost one
quarter (23.1 percent) of rental units costing above $1,100 per month. Exhibit 5-1 shows that cost
burden is certainly a problem for renters, with 21.2 percent of renter households moderately cost
burdened and 20.6 percent severely cost burdened.
The house values of owner-occupied units indicate a somewhat bifurcated housing
market, with peaks in the distribution both below $225,000 and above $350,000. Owners tend to
fare a little better in terms of cost burden, with only 17.6 percent moderately cost burdened and
13.5 percent severely cost burdened. As explained in Chapter 2, homeowners will often
voluntarily take on greater household costs in order to build equity in an appreciating asset—and
house values in Westchester have greatly appreciated over time.

Westchester County March 2004 Affordable Housing Needs Assessment Chapter 4: Existing and Projected Housing Supply
-50-
Exhibit 4-1 Housing Characteristics of All Existing Households
Westchester County, 2000
Characteristics Number Percent
Single Family 169,993 50.7% 2 to 4 Family 59,103 17.6% Multi-family 105,854 31.6% Other 293 .1%
Type of Structure
Total 335,244 100.0%
Own 200,724 59.9% Rent 134,520 40.1%
Tenure
Total 335,244 100.0%
1990 or newer 17,933 5.3% 1980-1989 23,730 7.1% 1970-1979 33,537 10.0% 1940-1969 156,976 46.8% 1939 or earlier 103,067 30.7%
Year Unit Built
Total 335,244 100.0%
$1 to $399 13,824 10.5% $400-$599 15,855 12.1% $600-$749 21,149 16.1% $750-$899 25,126 19.2% $900-$1,099 24,919 19.0% $1,100 or more 30,253 23.1%
Rent
Total 131,126 100.0%
1 to 19% 44,548 34.9% 20 to 29% 29,646 23.2% 30 to 49% 27,081 21.2% 50% or more 26,270 20.6%
Rent as % Income
Total 127,543 100.0%

Westchester County March 2004 Affordable Housing Needs Assessment Chapter 4: Existing and Projected Housing Supply
-51-
Exhibit 4-1 (Cont.) Housing Characteristics of All Existing Households
Westchester County, 2000
Characteristics Number Percent
Up to $169,999 40,961 20.4% $170,000 - $225,000 39,523 19.7% $225,001 - $349,999 27,510 13.7% $350,000 - $450,000 54,436 27.1% $450,001 or more 38,293 19.1%
House Value
Total 200,724 100.0%
Less than $800 41,003 20.4% $800-1299 36,604 18.2% $1300-1999 42,192 21.0% $2000-2799 39,238 19.5% $2800 or more 41,687 20.8%
Selected Owner Costs
Total 200,724 100.0%
1 to 19% 92,180 46.2% 20 to 29% 45,277 22.7% 30 to 49% 35,104 17.6% 50% or more 26,881 13.5%
Selected Owner Costs as % Income
Total 199,443 100.0%
RECENT HOUSING TRENDS
The characteristics of the occupied units built between 1990 and 2000 are presented in
Exhibit 4-2. In total, 17,933 new occupied housing units were created; 62.4 percent of these were
single family homes. New units were also much more likely to be owner-occupied (65.5
percent). Thus, the additional units favored single family, owner-occupied homes to a greater
degree than the existing county average.
Of those rental units created, almost half (49.9 percent) had costs above $1,000 per
month as compared to the 23.1 percent average for the county. The data reflect the county's
efforts in the previous decade to provide more affordable housing units as the lowest rental
category (rents below $399) also provided more new units than the existing county average (13.3
percent of new units as opposed to 10.5 percent of total units).
For ownership units built from 1990 to 2000, 42.9 percent of housing units built were
valued at over $450,000 (Exhibit 4-2); 45 percent of these new households had monthly housing
costs of $2,800 or more.
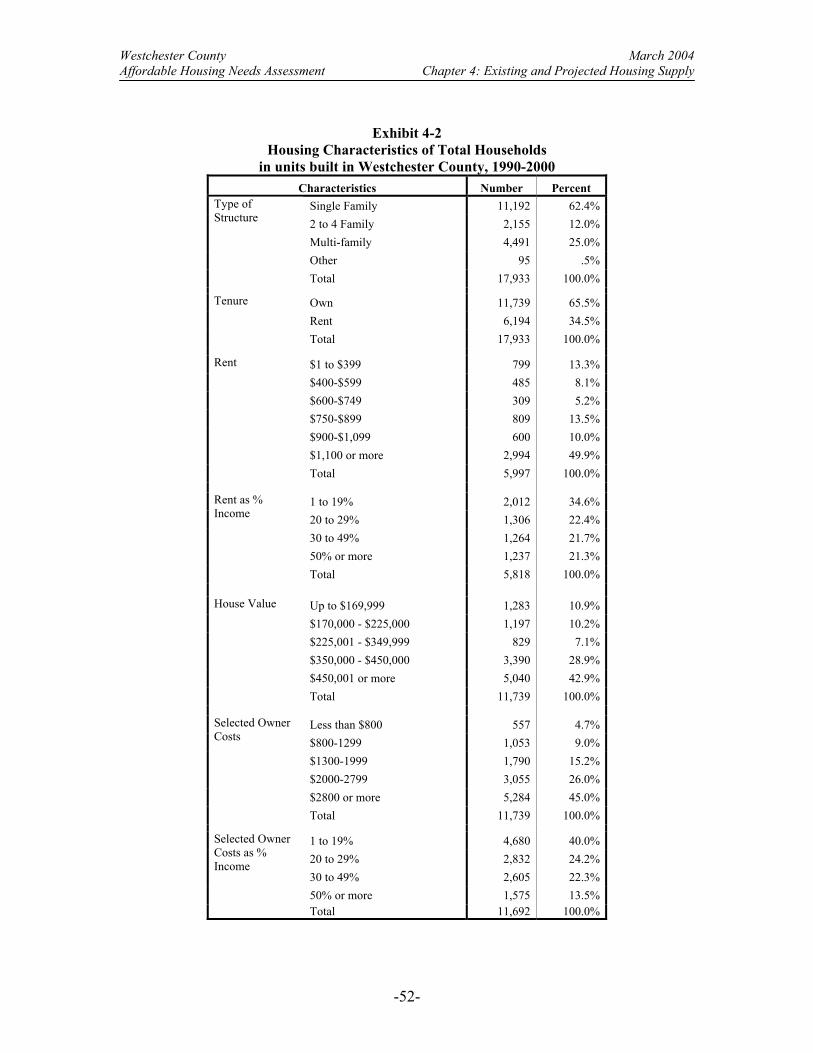
Westchester County March 2004 Affordable Housing Needs Assessment Chapter 4: Existing and Projected Housing Supply
-52-
Exhibit 4-2 Housing Characteristics of Total Households
in units built in Westchester County, 1990-2000 Characteristics Number Percent
Single Family 11,192 62.4% 2 to 4 Family 2,155 12.0% Multi-family 4,491 25.0% Other 95 .5%
Type of Structure
Total 17,933 100.0%
Own 11,739 65.5% Rent 6,194 34.5%
Tenure
Total 17,933 100.0%
$1 to $399 799 13.3% $400-$599 485 8.1% $600-$749 309 5.2% $750-$899 809 13.5% $900-$1,099 600 10.0% $1,100 or more 2,994 49.9%
Rent
Total 5,997 100.0%
1 to 19% 2,012 34.6% 20 to 29% 1,306 22.4% 30 to 49% 1,264 21.7% 50% or more 1,237 21.3%
Rent as % Income
Total 5,818 100.0%
Up to $169,999 1,283 10.9% $170,000 - $225,000 1,197 10.2% $225,001 - $349,999 829 7.1% $350,000 - $450,000 3,390 28.9% $450,001 or more 5,040 42.9%
House Value
Total 11,739 100.0%
Less than $800 557 4.7% $800-1299 1,053 9.0% $1300-1999 1,790 15.2% $2000-2799 3,055 26.0% $2800 or more 5,284 45.0%
Selected Owner Costs
Total 11,739 100.0%
1 to 19% 4,680 40.0% 20 to 29% 2,832 24.2% 30 to 49% 2,605 22.3% 50% or more 1,575 13.5%
Selected Owner Costs as % Income
Total 11,692 100.0%

Westchester County March 2004 Affordable Housing Needs Assessment Chapter 4: Existing and Projected Housing Supply
-53-
PROJECTED HOUSING GROWTH, 2000-2015
In predicting future growth in housing supply, CUPR assumed that the number and
characteristics of new housing units would grow basically in proportion to trends observed for the
1990-2000 period. Clearly, part of the increase in lower rent units in the previous decade was the
result of the provision of affordable housing through the efforts of Westchester County. We have
modified the projection to reflect what would happen if the county took no action on affordable
unit construction in order to avoid assumptions that the previous initiative would be duplicated.
The characteristics of this projected supply are presented in Exhibit 4-3. In total, CUPR
projects that private market productions in Westchester County will provide for 14,535 additional
household-occupied units between 2000 and 2015. 9,842 of these new units will be single family
housing; an additional 3,024 will be multifamily housing; and 1,606 will be 2 to 4 family
housing. 10,325 of these new units will be owner occupied, while 4,210 will be renter occupied.
Note that, all else being equal, the projected housing supply will still favor higher income
households and owners over lower income households and renters.
It is assumed that some of the households comprising current and future demand for
affordable housing will be able to satisfy that demand through this “natural” projected growth in
supply. That is, some households in need will have access to these new units, thus alleviating
deficiency, overcrowding, or cost burden. The affordability and size of projected new
construction units is detailed in Exhibit 4-4. Of these 14,535 additional units, 9,198 (or two-
thirds) will be too expensive for income-constrained households. The remainder, 5,337 are
available to income-constrained households, however only 4,474 of them will be available to the
target population of low- and moderate-income households. These will be matched against
existing and future demand in Chapter 5.

Westchester County March 2004 Affordable Housing Needs Assessment Chapter 4: Existing and Projected Housing Supply
-54-
Exhibit 4-3 Projected Housing Characteristics of Total Households
in units built in Westchester County, 2000-2015
Characteristics Number Percent Single Family 9,842 67.7% 2 to 4 Family 1,606 11.1% Multi-family 3,024 20.8% Other 63 .4%
Type of Structure
Total 14,535 100.0%
Own 10,325 71.0% Rent 4,210 29.0%
Tenure
Total 14,535 100.0%
$1 to $399 0 .0% $400-$599 149 3.7% $600-$749 341 8.5% $750-$899 366 9.1% $900-$1,099 468 11.6% $1,100 or more 2,708 67.2%
Rent
Total 4,032 100.0%
Up to $169,999 0 .0% $170,000 - $225,000 1,083 10.5% $225,001 - $349,999 1,620 15.7% $350,000 - $450,000 3,065 29.7% $450,001 or more 4,557 44.1%
House Value
Total 10,325 100.0%
Less than $800 340 3.3% $800-1299 581 5.6% $1300-1999 1,337 12.9% $2000-2799 2,921 28.3% $2800 or more 5,146 49.8%
Selected Owner Costs
Total 10,325 100.0%
Exhibit 4-4 Affordability Characteristics of Projected New Construction Housing Units
Westchester County, 2000-2015
Affordability Range Number of Units Not Affordable 9,198 80-100% of County Median 863 50-80% of County Median 2,726 0-50% of County Median 1,748 Total Available for Income Constrained 5,337 Total 14,535 Total Available for Target Households 4,474

Westchester County March 2004 Affordable Housing Needs Assessment Chapter 4: Existing and Projected Housing Supply
-55-
In addition to new, private market housing construction, there are other sources of
additions to the housing inventory. These include conversion of single units into two or more
units and conversion of nonresidential structures into residential units. Offsetting these additions
are losses from the housing stock due to a number of causes. Included in this category are
demolitions, condemnations, units lost through fire, structural damage, or other disaster and
conversions from residential to nonresidential use.20 The importance of these additions and
losses relative to new construction is likely to vary over time in response to fluctuating interest
rates, changing household size, and similar factors affecting the pattern of housing demand.
Indications are that the rate of additions to the housing supply due to sources other than new
construction has increased in recent years while demolitions have slowed, both in response to
rising construction costs and shrinking household size. This reduces the demand for larger units.
Exhibit 4-5 Affordability and Size Characteristics of Projected Secondary Source Housing Units
Westchester County, 2000-2015
Affordability Range Number of Bedrooms 1 2 or 3 4 or more Total Not Affordable 811 1,539 1,064 3,41380-100% of county Median - 945 397 1,342 50-80% of county Median 127 2,615 979 3,721 0-50% of county Median 132 1,240 742 2,113 Total Available for Income Constrained 259 4,800 2,117 7,176Total 1,070 6,339 3,181 10,590Total Available for Target Households 259 3,855 1,721 5,834
Between 2000 and 2015, CUPR estimates that 9,389 units should be available from the
downward filtering of sound units—those units occupied by upper income households that should
become available to low-, moderate-, and middle-income households. Another 881 units should
become available through conversions—the subdividing of residential structures or non-
residential structures being converted to residential structures. Finally, we estimate that 320 units
should become available from spontaneous rehabilitation—thus making deficient units occupied
by the income-constrained no longer deficient. This provides a total of 10,590 new housing units
that should become available due to secondary sources of supply—some of which might be
20For an excellent discussion of components of change in the national housing inventory, see William C. Apgar, Jr., The Changing Utilization of the Housing Inventory: Past Trends and Future Prospects, Working Paper No. W83–1, Joint Center for Urban Studies of MIT and Harvard University, July 1983.
Westchester County March 2004 Affordable Housing Needs Assessment Chapter 4: Existing and Projected Housing Supply
-56-
appropriate to meet current and/or projected affordable housing demand. The affordability and
size of projected secondary housing supply is detailed in Exhibit 4-5. Of these 10,590 units,
5,834 are potentially affordable to the target population of low and moderate-income households
(Exhibit 4-4).
SUMMARY
Based upon the results of projected housing supply from new construction and secondary
sources, we expect the following in terms of growth is housing supply.
• 14,535 new housing units added through normal housing construction; 4,474 of these
should be within the affordability range of target population households
• 10,590 additional housing units through secondary sources; 5,834 of these should be
within the affordability range of target population households
• A total of 10,308 housing units will potentially become available to income-constrained
households through new construction and secondary sources
We will now attempt to match these sources of supply with the households comprising current and
projected affordable housing demand in Chapter 5.

Westchester County March 2004 Affordable Housing Needs Assessment Chapter 5: Matching Demand and Supply
-57-
CHAPTER 5: MATCHING HOUSING DEMAND AND HOUSING SUPPLY
INTRODUCTION
Preceding chapters have quantified the existing and projected demand for affordable
housing in Westchester County and existing and projected levels of primary and secondary
housing supply. Existing demand has been shown to consist of 2,481 low-and moderate-income
households living in deficient housing (i.e., physically inadequate housing as measured by
specific housing quality measures), 7,273 households living in overcrowded conditions (i.e., more
than 1 person per room), and 677 homeless households. Future demand consists of 8,652 low-
and moderate-income households that are projected to form in the region between 2000 and 2015.
The purpose of the present chapter is to determine the fit between future demand for
affordable housing and future housing supply. The question posed in this chapter is the
following: To what extent can net growth in housing supply be expected to provide for some
portion of projected demand for housing by low-, and moderate-income households?
This approach represents something of a departure from the conventional wisdom
concerning affordable housing demand. Implicit or explicit in most discussions regarding the
need for affordable housing for income-constrained households is that the full complement of that
need requires some form of subsidy or public intervention in order to be delivered: that is, that
market-rate, conventional housing is entirely beyond the means of lower-income households.
This assumption may be questioned, however, and particularly so in this study, given that the
definition of income constrained reaches 100 percent of area median income—$83,100 (in 2000
dollars). It is reasonable to expect that at least some conventional housing is likely to be available
and affordable to those at that income level.
That the conventional housing supply can be expected to meet some portion of affordable
housing demand is critical for determining the net, remaining unmet level of demand for housing
for low-, moderate-, and middle-income households. This net unmet demand represents the
remaining affordable housing need to be filled through some form of public intervention or some
other means.
This chapter begins with a summary of findings from preceding chapters on the
magnitude of demand for housing by low-, moderate-, and middle-income households and the
level of housing supply available to meet that demand. The measure of housing demand
distinguishes between the groups of existing demand and projected housing demand. The

Westchester County March 2004 Affordable Housing Needs Assessment Chapter 5: Matching Demand and Supply
-58-
summary of housing supply projections focuses on net new housing supply for 2000 to 2015 as
presented in Chapter 4. Net new housing supply is the net increase or decrease in housing units
resulting from new construction plus conversions minus demolitions.
The housing demand and housing supply data are then used to determine the share of
future demand that will be satisfied by projected new housing supply through the year 2015. A
computer algorithm developed by CUPR matches future low-, moderate-, and middle-income
households, characterized by household size and income, with projected housing units,
characterized by unit size (in terms of number of bedrooms) and housing value or rent, to
determine the capacity of net new supply to provide some measure of affordable housing. Any
remaining future households are then added to existing housing deficient and overcrowded
households, and paired against housing supply from secondary sources. The difference between
total affordable housing demand and that proportion of demand “housed” by net new housing
supply yields net remaining unmet demand for affordable housing in Westchester County. Net
remaining unmet demand is reported by number of housing units required during the period 2000
to 2015. Note that the lack of detailed characteristics for the homeless population prevents them
from being included in the matching algorithm. As a result, the homeless total is added directly
to unmet need. These data provide a firm basis for defining the kind of interventionary response
that will be required to meet the need for affordable housing in Westchester County through the
year 2015.
AFFORDABLE HOUSING DEMAND
As specified in Chapter 2, affordable housing demand is comprised of separate
components. Existing demand is the number of low- and moderate-income households currently
living in deficient or overcrowded housing units. These components of demand are prioritized by
the likelihood of a new unit being needed. Thus, all households in deficient housing are counted
in that category, while the overcrowded category contains only those households that are not
deficient. Homeless households are also included. Projected demand is the net growth in the
number of low- and moderate-income households between 2000 and 2015.

Westchester County March 2004 Affordable Housing Needs Assessment Chapter 5: Matching Demand and Supply
-59-
Exhibit 5-1 Total Housing Demand, by Income Level,
Westchester County, 2000-2015
Household Income Related to County Median Source of Housing Demand Low <50% Moderate 50-80% Total
Number Percent Number Percent Number Percent Deficient 1,499 23.3% 982 29.7% 2,481 22.5%Crowded 4,948 76.7% 2,325 70.3% 7,273 65.9%Homeless 677 - - - 677 11.6% Total Existing Demand 7,124 100% 3,307 100% 10,431 100.0%
Total Projected Demand 6,917 1,735 8,652
Total Demand 14,041 5,042 19,083
Existing (2000) Housing-Deficient Demand
The number of low- and moderate-income households in Westchester County living in
deficient units totaled 2,481 in 2000 (Exhibit 5-1). More than 60 percent of the deficient units
occupied by income-constrained households in the county (1,499 units) were occupied by low-
income households. Among the larger group of income-constrained households (including
middle-income), 60.8 percent of housing-deficient households consist of small (one- to two-
person households), 27.4 percent of three- to four-person households, and 11.8 percent of five-
plus-person households (see Chapter 2, Exhibit 2-7).
Existing (2000) Overcrowded Demand
The number of low- or moderate-income households in Westchester County living in
overcrowded units totaled 7,273 in 2000 (Exhibit 5-1). More than 68 percent of the overcrowded
units occupied by income-constrained households in the county were occupied by low-income
households (4,948).
Projected Demand, 2000–2015
By 2015, it is projected that Westchester County will contain a net additional 8,652 low-
and moderate-income households (see Exhibit 5-1). The largest share of projected demand for
affordable housing will consist of low-income households—79.9 percent of new households will

Westchester County March 2004 Affordable Housing Needs Assessment Chapter 5: Matching Demand and Supply
-60-
be in this category. Almost all of the growth in demand in Westchester County will be comprised
of small, one- to two-person households (see Chapter 2, Exhibit 2-18).
PROJECTED HOUSING SUPPLY
Projecting net change in housing supply over more than the short term (i.e., three to six
months) is extremely difficult given the uncertainty of interest rates, construction costs, mortgage
availability, developer behavior, and the like. However, historical patterns, as well as projections
of demand driven by household formation rates, provide useful benchmarks for likely estimates
of net change in housing supply. That is, long-term housing supply is expected to respond to
long-term trends in household formation, within the broad constraints of the historical trends plus
expectations regarding the level of household growth.
Net change in housing supply is the sum of new construction plus conversions of
structures from nonresidential to residential uses minus demolitions and conversions from
residential to nonresidential uses. During the decade from 1990 to 2000, net new housing supply
totaled 17,933 units in Westchester (see Chapter 4, Exhibit 4-2). For the forecast period, from
2000 to 2015, we estimate net new growth in the housing supply of 14,535 units in the county
(see Chapter 4, Exhibit 4-3). This figure reflects our expectation of a continued drop in the
growth rate of the housing supply consonant with the slower projected growth in total
households. Of these new units, 4,474 are projected be affordable for low- and moderate-income
households (see Chapter 4, Exhibit 4-4).
In addition, CUPR forecasts 10,590 additional units of housing supply through secondary
sources—such as filtering of units, conversions and spontaneous rehabilitation. Through an
examination of the affordability of these units (see Chapter 4, Exhibit 4-5), CUPR has determined
that 5,834 are potentially available to low- and moderate-income households in Westchester.
Thus, a total of 10,308 additional units of housing supply will become available to target
population households in Westchester between 2000 and 2015.
MATCHING DEMAND TO SUPPLY
We turn now to a discussion of determining the share of existing and future affordable
housing demand that will be satisfied through the conventional net new housing supply. As has
been suggested, some share of net new housing should be available at an affordable level of
housing cost to offset a portion of demand for affordable housing. Matching demand to supply
thus apportions demand into the component that will be housed through conventional supply or
Westchester County March 2004 Affordable Housing Needs Assessment Chapter 5: Matching Demand and Supply
-61-
secondary sources, with the remainder constituting net unmet demand to be answered through
some form of public intervention.
In the current study, we first look to see the extent to which projected housing
construction will accommodate projected growth in target population households. Those
projected households not matched will then be added to existing deficient and overcrowded
households, representing a population that will potentially be able to take advantage of additional
housing from secondary sources. After this group is matched to secondary housing supply, the
remainder represents the number of households whose needs will be unmet without further action.
The CUPR Housing Demand Algorithm
The procedure for matching housing demand to the specifics of net new housing supply is
encompassed in a computer algorithm developed by CUPR. In the simplest terms, the matching
program compares two data files—one representing the set of projected low-, moderate-, and
middle-income households and the second representing the set of net new housing units—and
sequentially searches the data files for appropriate pairings of households and housing units.
For purposes of the match, projected low-, moderate-, and middle-income households are
defined in terms of household size (number of persons) and income level. Housing units are
similarly defined in terms of tenure, unit size (number of bedrooms), and rent or value. Housing
units and low-, moderate-, and middle-income households are sorted sequentially by size (number
of bedrooms, number of persons) and by housing cost and rent and household income. The
computer algorithm then selects a first household, searches the housing unit file for a unit of
appropriate size given household size, and searches appropriate-size units for a unit of appropriate
value or rent given household income. The household is then either “housed” or “not housed” as
a result of the search procedure, the next household is selected, and the process is repeated until
either all housing units are occupied or all households are either “housed” or “not housed.”
Several elements of this procedure bear highlighting. The housing demand algorithm
closely resembles the actual process a household would follow in seeking a housing unit: It
determines the size of unit needed and searches for a unit of the desired size at an affordable cost,
given a fixed criterion of affordability. All households compete on an equal footing for
affordable housing, entering the household queue simultaneously, differing in their access to
housing only insofar as their size and income characteristics differ. In the event that several
households have identical size and income characteristics, such households are randomly entered
into the household queue to compete for available housing units. Finally, if households cannot be

Westchester County March 2004 Affordable Housing Needs Assessment Chapter 5: Matching Demand and Supply
-62-
matched with an appropriately sized unit, they are allowed to search for a unit of a larger size, as
long as it is still affordable.
Therefore, for a unit to be found “affordable,” it must also be appropriate in terms of size
as well as cost. A hypothetically available four-room unit listed at a low rent would not be
counted within the affordable stock if there is no household of appropriate size and income to
qualify for that unit. Similarly, a four-person household with an income at the high end of the
middle-income scale may not be able to obtain affordable housing if the supply of appropriate-
size units has been exhausted.
Projected Housing Demand Versus Projected New Housing Units
The results of our first housing demand matching exercise provide a count of the number
of prospective low-, moderate-, and middle-income households that will be housed through net
growth in the conventional housing supply (new construction) and those that will need housing
from other sources. This latter group will subsequently be added to the existing deficient and
overcrowded groups and then matched with secondary sources of supply. The affordability
characteristics of projected new housing supply are reproduced in Exhibit 5-2. A total of 4,474
units are deemed to be within the affordability range for income-constrained households. These
units are then matched against the households representing projected demand, totaling 8,652. The
results of the match are presented in Exhibit 5-3.
Exhibit 5-2 Affordability Characteristics of Projected New Construction Housing Units
Westchester County, 2000-2015
Affordability Range Number of Units
Not Affordable 9,19880-100% of County Median 86350-80% of County Median 2,7260-50% of County Median 1,748Total Available for Income Constrained 5,337Total 14,535 Total Available for Target Households 4,474

Westchester County March 2004 Affordable Housing Needs Assessment Chapter 5: Matching Demand and Supply
-63-
Exhibit 5-3 Match for Projected Target Population Households with New Construction
Westchester County, 2000-2015
Affordability New Units
Projected Demand Matched Not
Matched 80-100% of county Median 863 700 700 0 50-80% of county Median 2,726 1,735 1,735 0 0-50% of county Median 1,748 6,917 1,748 5,169 Total 5,337 9,352 4,183 5,169
Total Match for Target Households 4,474 8,652 3,483 5,169
Through the matching process, CUPR has determined that 3,483 projected target
population households will be accommodated through projected new housing provision. Of the
new units constructed, 1,154 could not be filled because their costs were too high for those
comprising the need population. The results of the match mean that 5,169 households—all low
income—will not be accommodated by projected new housing construction. This number will be
added into the population matched to secondary sources in the next section.
Demand Satisfied Through Secondary Sources of Housing Provision CUPR has projected that the secondary sources of housing provision—filtering,
conversions, and rehabilitations—will contribute 10,590 additional housing units in Westchester
County between 2000 and 2015. Of these, 5,384 will fall within the affordability range of low-
and moderate-income households. The affordability and size characteristics of these units are
reproduced in Exhibit 5-4. These units were matched with a demand population consisting of
three components—those projected income-constrained households not matched to projected
conventional supply (5,169), those existing households in deficient housing (2,481), and those
existing households in overcrowded housing (7,273). Thus, the total demand population matched
to supply from secondary sources is 14,923. The results of the match are presented in Exhibit 5-
5.
The CUPR matching routine was able to match 4,832 households to projected secondary
sources of supply. 10,091 low- and moderate-income households were not able to be matched.
Of the unmatched households, 9,566 (or 94.7%) are in the low-income category. To this figure is
added 677 existing homeless households that also could not be matched for a total of 10,768

Westchester County March 2004 Affordable Housing Needs Assessment Chapter 5: Matching Demand and Supply
-64-
units. Exhibit 5-6 provides a summary of both matches for the income-constrained population,
both existing and projected.
Exhibit 5-4 Affordability and Size Characteristics of Projected Secondary Source Housing Units
Westchester County, 2000-2015 Affordability Range Number of Bedrooms
1 2 or 3 4 or more Total Not Affordable 811 1,539 1,064 3,41380-100% of county Median - 945 397 1,34250-80% of county Median 127 2,615 979 3,7210-50% of county Median 132 1,240 742 2,113Total Available for Income Constrained 259 4,800 2,117 7,176Total 1,070 6,339 3,181 10,590 Total Available for Target Households 259 3,855 1,721 5,834
Exhibit 5-5 Match for Existing (Not Homeless) and Projected Target Population Households with
Secondary Sources Westchester County, 2000-2015
Affordability SecondaryUnits
Projected Demand Matched Not
Matched 80-100% of county Median 1,342 1,144 682 462 50-80% of county Median 3,721 3,307 2,782 525 0-50% of county Median 2,113 11,616 2,050 9,566 Total 7,176 16,067 5,514 10,553
Total Match for Target Households 5,834 14,923 4,832 10,091
Exhibit 5-6 Summary of Primary and Secondary Matching Projected and Existing Demand (Not Homeless)
Westchester County, 2000-2015
Affordability Projected Demand
Matched to Primary Sources
Matched to Secondary
Sources
Projected Not
Matched
Existing Demand
Matched to Secondary
Sources
Existing Not Matched
Total Matched
Total Not Matched
80-100% of county Median 700 700 - - 1,144 682 462 1,382 46250-80% of county Median 1,735 1,735 - - 3,307 2,782 525 4,517 5250-50% of county Median 6,917 1,748 1,330 3,839 6,447 720 5,727 3,798 9,566Total 9,352 4,183 1,330 3,839 10,898 4,184 6,714 9,697 10,553
Total Match for Target Households 8,652 3,483 1,330 3,839 9,754 3,502 6,252 8,315 10,091

Westchester County March 2004 Affordable Housing Needs Assessment Chapter 5: Matching Demand and Supply
-65-
SUMMARY
Projected low- and moderate-income households and existing low- and moderate-income
households that are in deficient or overcrowded units that are not housed through growth in the
conventional or secondary sources of supply constitute net future unmet demand for affordable
housing in the region. Housing for this remaining unmet projected demand, as well as for
existing cost-burdened demand identified earlier, constitutes the object for policy consideration.
A variety of programs, such as new construction, rehabilitation of existing units, or some other
form of public intervention or subsidy, may be required to satisfy this remaining unmet demand.
The magnitude of unmet existing and projected demand is as follows.
• Through 2015, of a total affordable housing demand of 19,083 units, primary and
secondary sources of affordable housing supply are projected to provide for 8,315 target
population households
• Through 2015, 10,768 existing and projected target population households will constitute
housing need that is projected not to be met through primary or secondary sources of
housing supply. Our projections indicate that this unmet need is represented by 6,252
existing and 3,839 future low- and moderate-income households, plus 677 existing
homeless households.

Westchester County March 2004 Affordable Housing Needs Assessment Chapter 5: Matching Demand and Supply
-66-
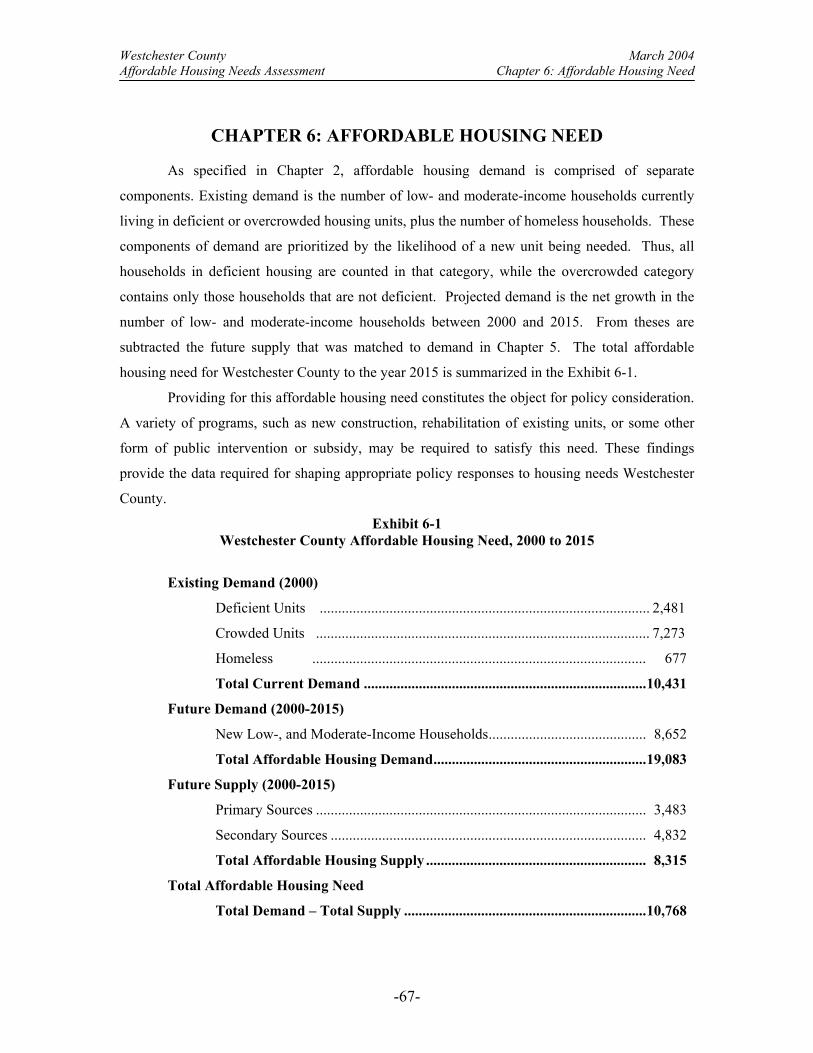
Westchester County March 2004 Affordable Housing Needs Assessment Chapter 6: Affordable Housing Need
-67-
CHAPTER 6: AFFORDABLE HOUSING NEED
As specified in Chapter 2, affordable housing demand is comprised of separate
components. Existing demand is the number of low- and moderate-income households currently
living in deficient or overcrowded housing units, plus the number of homeless households. These
components of demand are prioritized by the likelihood of a new unit being needed. Thus, all
households in deficient housing are counted in that category, while the overcrowded category
contains only those households that are not deficient. Projected demand is the net growth in the
number of low- and moderate-income households between 2000 and 2015. From theses are
subtracted the future supply that was matched to demand in Chapter 5. The total affordable
housing need for Westchester County to the year 2015 is summarized in the Exhibit 6-1.
Providing for this affordable housing need constitutes the object for policy consideration.
A variety of programs, such as new construction, rehabilitation of existing units, or some other
form of public intervention or subsidy, may be required to satisfy this need. These findings
provide the data required for shaping appropriate policy responses to housing needs Westchester
County.
Exhibit 6-1 Westchester County Affordable Housing Need, 2000 to 2015
Existing Demand (2000)
Deficient Units .......................................................................................... 2,481
Crowded Units ........................................................................................... 7,273
Homeless ........................................................................................... 677
Total Current Demand .............................................................................10,431
Future Demand (2000-2015)
New Low-, and Moderate-Income Households........................................... 8,652
Total Affordable Housing Demand..........................................................19,083
Future Supply (2000-2015)
Primary Sources .......................................................................................... 3,483
Secondary Sources ...................................................................................... 4,832
Total Affordable Housing Supply ............................................................ 8,315
Total Affordable Housing Need
Total Demand – Total Supply ..................................................................10,768

Westchester County March 2004 Affordable Housing Needs Assessment Chapter 6: Affordable Housing Need
-68-

Westchester County March 2004 Affordable Housing Needs Assessment Appendix A: Commutation Analysis
-69-
APPENDIX A: COMMUTATION ANALYSIS
In discussions with CUPR, representatives of Westchester County expressed interest in
obtaining more information on the commutation patterns evident in the region. To that end, we
have provided the following analysis comparing characteristics of commuters to and from
Westchester County, both generally, by origin and by destination within the county. It should be
noted that, in the CUPR model of affordable housing need, commuters are not included in the
formulation of existing demand. If we were to assume that commuters preferred to live in
Westchester County, then we must also assume that commuters out of Westchester would prefer
to live in the region of their destination. Nevertheless, the propensity for onetime commuters to
move to Westchester is captured in the projection of future affordable housing demand, as it is
based upon previous household growth that includes any commuters that moved to Westchester
from 1990 to 2000.
COMMUTING DESTINATIONS OF EMPLOYED WESTCHESTER RESIDENTS
The destinations of employed residents of Westchester County are presented in Exhibit
A-1. CUPR was able to obtain data for 420,637 residents using the U.S. Census PUMS data.21
Of this group, 225,331, or 53.6 percent, work within Westchester County. By far, the largest
destination for commuters out of the county is Manhattan, with 19.1 percent of the total employed
population of Westchester. This is followed by the surrounding upstate New York counties (10.7
percent) and the rest of New York City’s boroughs (9 percent).
Exhibit A-1 Location of Work for Westchester Residents
Westchester County, 2000
Origin Number Percent Cumulative Percent
Westchester 225,331 53.6% 53.6% Manhattan 80,327 19.1% 72.7% Other New York City 37,869 9.0% 81.7% Near Upstate New York 44,883 10.7% 92.3% Connecticut 18,598 4.4% 96.8% Other 13,628 3.2% 100.0% Total 420,637 100.0%
21 It must be noted that all data in this chapter exclude the Northeast region of Westchester, which was combine with portions of Dutchess and Putnam counties by the Census, and is thus not able to be considered on its own.

Westchester County March 2004 Affordable Housing Needs Assessment Appendix A: Commutation Analysis
-70-
ORIGINS OF COMMUTERS WORKING IN WESTCHESTER
The origins of those employed within Westchester are presented in Exhibit A-2. CUPR
has identified 333,960 persons employed within the county. Of this workforce, Westchester
residents represent 67.5 percent. We can see that the volume of commuters leaving Westchester
is greater than the volume of commuters entering the county. The surrounding counties of upstate
New York provide the biggest source of commuters into Westchester, with 11.9 percent of the
total county workforce. Although Manhattan was an important destination for commuting
Westchester residents, it is not a significant source of commuters to the county. Rather, the
Bronx is more important, with 7.8 percent of the county workforce commuting from that
borough. Thus, although New York City as a whole is the most important origin and destination
for commuters to and from Westchester, the precise geography of these movements varies.
Exhibit A-2 Location of Residence for People Working in Westchester
Westchester County, 2000
Origin Number Percent Cumulative Percent
Westchester 225,331 67.5% 67.5% Bronx 25,987 7.8% 75.3% Other New York City 15,620 4.7% 79.9% Near Upstate New York 39,804 11.9% 91.8% Connecticut 14,863 4.5% 96.3% Other 12,355 3.7% 100.0% Total 333,960 100.0%
COMPARING CHARACTERISTICS OF COMMUTER GROUPS
In their discussions with CUPR, representatives of Westchester County expressed a
desire to have more information on whether those commuting into the county had significantly
different characteristics than those who lived and worked in Westchester or those who commuted
out of the county. The following provides some comparisons of these groups, focusing on
demographic and employment characteristics.
Demographic Characteristics of Commuting Groups
Selected demographic characteristics of the three basic commuting groups (those who
live in Westchester, but work elsewhere; those who live and work in Westchester; and those who
work in Westchester, but live elsewhere) are presented in Exhibit A-3. In terms of relative

Westchester County March 2004 Affordable Housing Needs Assessment Appendix A: Commutation Analysis
-71-
groups sizes, those who both live and work within the county are the largest group (225,331)
followed by those who commute out of Westchester (202,220) and those who commute into
Westchester (108,629).
Exhibit A-3 Socioeconomic Characteristics of Employed Persons Living and/or Working in
Westchester County, 2000
Commuter Group Live in Westchester,
Work Elsewhere Live and work in
Westchester Work in Westchester,
Live Elsewhere Characteristics
Number Percent Number Percent Number Percent
White 156,950 77.6% 158,838 70.5% 76,897 70.8%Black 19,986 9.9% 32,906 14.6% 16,351 15.1%Other 25,284 12.5% 33,586 14.9% 15,381 14.2%
Race
Total 202,220 100.0% 225,331 100.0% 108,629 100.0%
Not Hispanic 179,554 88.8% 187,184 83.1% 93,448 86.0%Hispanic 22,666 11.2% 38,147 16.9% 15,181 14.0%
Hispanic Origin
Total 202,220 100.0% 225,331 100.0% 108,629 100.0%
Male 116,276 57.5% 108,501 48.2% 66,155 60.9%Female 85,944 42.5% 116,830 51.8% 42,474 39.1%
Sex
Total 202,220 100.0% 225,331 100.0% 108,629 100.0%
15 to 24 13,786 6.8% 23,028 10.2% 9,444 8.7%25 to 34 45,321 22.4% 48,285 21.4% 25,397 23.4%35 to 44 59,306 29.3% 59,521 26.4% 32,575 30.0%45 to 54 48,975 24.2% 51,226 22.7% 26,060 24.0%55 to 64 26,454 13.1% 30,116 13.4% 12,544 11.5%65 to 74 6,442 3.2% 10,019 4.4% 2,179 2.0%75 and up 1,935 1.0% 3,136 1.4% 430 .4%
Age
Total 202,220 100.0% 225,331 100.0% 108,629 100.0%
$25,000 or less 10,592 5.2% 21,129 9.4% 8,360 7.7% $25,001 thru $49,100 22,112 10.9% 41,088 18.2% 18,921 17.4%$49,101 thru $81,000 40,736 20.1% 55,073 24.4% 27,781 25.6%$81,001 thru $140,000 58,512 28.9% 62,455 27.7% 35,473 32.7%
Household Income $140,001 thru highest 70,268 34.7% 45,586 20.2% 18,094 16.7% Total 202,220 100.0% 225,331 100.0% 108,629 100.0%
One of the most notable patterns in the data is the stronger presence of racial and ethnic
minority groups among those who work in Westchester versus those who live in Westchester and
work elsewhere. While only 9.9 percent of commuters out of Westchester are black, 14.9 percent
Westchester County March 2004 Affordable Housing Needs Assessment Appendix A: Commutation Analysis
-72-
of those who live and work in the county and 15.1 percent of those that commute into the county
are in that racial group. Similarly, there are a greater percentage of Hispanics among those who
live and work in Westchester (16.9 percent) and those who commute-in (14 percent), than among
those who commute out Westchester (11.2 percent).
While the age distribution of the three groups are roughly similar (Exhibit A-3) the
income distribution varies somewhat. Those who commute out of Westchester tend to be more
concentrated in the higher income ranges compared to the other two groups. In fact, over a third
(34.7 percent) of Westchester residents who work outside the county have annual incomes greater
than $140,000. This compares to only a fifth for those who both live and work in the county
(20.2 percent) and about a sixth (16.7 percent) for those who commute into Westchester. This
most likely reflects the higher salaries paid to employees in Manhattan, which is the largest
destination for Westchester’s commuters. On average, the lowest incomes are found in the group
that both lives and works in the county.
Employment Characteristics of Commuters into Westchester
Given that county representatives expressed particular interest in the employment
characteristics of commuters into Westchester, we have provided two views of this group—by
both origin and destination within the county. Exhibit A-4 compares Westchester employees by
their region of origin. In this way, we can see if the commuters into the county from various
regions differ significantly form those who live and work in the county.
In terms of occupation, the greatest differences are among those who commute from the
Bronx versus other areas. In particular, Bronx commuters are less represented in the management
and professional occupations and more represented in manufacturing, and service occupations
than all other regions. Managers make up a large portion of Connecticut’s commuters (31.8
percent), while professionals are highly represented (33.4 percent) among commuters from the
rest of New York City.
There are similar trends in industry characteristics. Bronx commuters are highly
concentrated in education, health and social services (26.9 percent) and in retail trade (15.5
percent). The surrounding upstate New York counties have a relatively high proportion of
commuters in public administration (6.9 percent compared to an average of 4 percent). Of all the
groups, workers from Westchester and the surrounding upstate counties are the most represented
in the public sector with 14.9 percent and 18.8 percent, respectively.

Westchester County March 2004 Affordable Housing Needs Assessment Appendix A: Commutation Analysis
-73-
Exhibit A-4
Socioeconomic Characteristics of Commuters to Westchester by Origin Westchester County 2000
Region of Origin
Commuter Characteristics Westchester Bronx Other New
York City Near
Upstate NY Connecticut Other Total
Total Commuters 225,331 25,987 15,620 39,804 14,863 12,355 333,960 Percentage of Total 67.5% 7.8% 4.7% 11.9% 4.5% 3.7% 100.0%
Management, Business & Finance 14.3% 8.7% 19.3% 19.3% 31.8% 28.0% 16.0%
Professional and Related 24.1% 16.9% 33.4% 29.0% 27.9% 23.5% 24.7%
Service Occupations 17.5% 21.8% 11.0% 10.8% 5.9% 6.9% 15.9%Sales and Office occupations 28.7% 29.0% 20.6% 21.4% 23.4% 22.6% 27.0%
Farming, Fishing, & Forestry .1% .1% .1% .3% .0% .0% .1%
Construction & Maintenance 7.6% 8.0% 4.9% 11.5% 5.8% 10.3% 8.0%
Production & Transportation 7.7% 15.5% 10.7% 7.7% 5.1% 8.7% 8.4%
Occupation
Total 225,331 25,987 15,620 39,804 14,863 12,355 333,960
Agriculture, forestry, fishing and hunting, and mining:
.2% .1% .4% .4% .9% .0% .2%
Construction 6.6% 4.0% 4.2% 7.2% 4.0% 8.5% 6.3%
Manufacturing 6.4% 9.1% 13.5% 7.9% 14.1% 13.2% 7.7%
Wholesale trade 3.4% 3.5% 3.5% 4.4% 7.1% 6.4% 3.8%
Retail trade 10.9% 15.5% 10.8% 9.0% 9.5% 9.1% 10.9%Transportation, warehousing & utilities 4.3% 7.5% 3.9% 8.8% 5.1% 6.5% 5.2%
Information 4.1% 4.5% 6.0% 6.5% 8.4% 7.6% 4.8%Finance, insurance & real estate 8.4% 6.7% 9.7% 6.5% 10.7% 13.0% 8.3%
Professional, scientific, management & administrative
12.1% 8.0% 12.3% 10.5% 15.4% 10.1% 11.7%
Educational, health and social services 27.1% 26.9% 20.8% 25.5% 15.6% 15.2% 25.7%
Arts, entertainment & recreation 6.4% 5.5% 6.1% 2.8% 4.2% 3.5% 5.7%
Other services 6.1% 5.7% 6.0% 3.5% 3.4% 3.4% 5.5%
Public administration 3.8% 3.0% 2.6% 6.9% 1.6% 3.5% 4.0%
Armed Forces .0% .0% .0% .0% .0% .0% .0%
Industry
Total 225,331 25,987 15,620 39,804 14,863 12,355 333,960
Private 71.2% 84.6% 81.3% 75.1% 84.0% 80.8% 74.1%
Local Gov. 11.2% 6.9% 5.1% 10.1% 4.7% 4.9% 9.9%
State or Fed. Gov. 3.7% 4.5% 6.0% 8.7% 2.4% 5.5% 4.5%
Self Employed 13.8% 4.1% 7.6% 6.1% 8.9% 8.9% 11.4%
Sector
Total 224,893 25,927 15,549 39,804 14,858 12,340 333,371

Westchester County March 2004 Affordable Housing Needs Assessment Appendix A: Commutation Analysis
-74-
These same employment characteristics are also presented by the destination of
commuters within Westchester (Exhibit A-5). As the data indicate, the West Central portion of
the county is the greatest recipient of commuters, with a share of 33.5 percent. This is followed
by the Northwest (19.8 percent) and East Central (18.1 percent). Interestingly, the largest regions
in terms of population—Yonkers and the Southeast—have the smallest shares of commuters—
13.4 and 15.2 percent, respectively.
Commuters to Yonkers and the Southeast tend to be more concentrated in the
manufacturing and service occupations than the average for all commuters. The central areas of
the county attract the highest proportion of managers, while the Northwest is more concentrated
in the professional occupations.
Yonkers and the Southeast commuters tend to be more concentrated in the manufacturing
and retail trade industries, while those two regions plus the Northwest have large proportions of
commuters in the educational, health and social services industries. The central areas are well
represented in the professional and scientific industries as well as finance, insurance and real
estate. Generally, the central regions attract a greater proportion of commuters in the private
sector, while Yonkers and the Northwest have relatively high concentrations of government
workers.

Westchester County March 2004 Affordable Housing Needs Assessment Appendix A: Commutation Analysis
-75-
Exhibit A-5 Employment Characteristics of Commuters to Westchester by Destination
(Excluding Northeast), Westchester County 2000
Westchester Sub-region Commuter Characteristics
Yonkers Northwest West Central
East Central Southeast Total
Total Commuters 14,505 21,503 36,414 19,691 16,516 108,629 Percentage of Total 13.4% 19.8% 33.5% 18.1% 15.2% 100.0%
Management, Business & Finance 12.3% 13.1% 23.1% 29.3% 14.3% 19.5%
Professional and Related 20.9% 34.1% 25.6% 25.9% 20.7% 26.0%
Service Occupations 18.4% 13.3% 9.7% 10.0% 14.5% 12.3%
Sales and Office occupations 23.0% 20.8% 25.1% 21.7% 26.1% 23.5%
Farming, Fishing, & Forestry .3% .0% .1% .0% .5% .1%
Construction & Maintenance 8.8% 10.4% 7.8% 7.2% 10.8% 8.8%
Production & Transportation 16.1% 8.3% 8.7% 5.9% 13.2% 9.8%
Occupation of Head
Total 14,505 21,503 36,414 19,691 16,516 108,629
Agriculture, forestry, fishing and hunting, and mining: .3% .1% .7% .2% .2% .4%
Construction 6.7% 6.4% 4.2% 4.8% 8.3% 5.7%
Manufacturing 12.4% 8.1% 10.5% 10.0% 12.2% 10.5%
Wholesale trade 3.1% 3.6% 5.0% 5.1% 6.0% 4.6%
Retail trade 12.7% 7.6% 12.6% 7.4% 14.1% 10.9%
Transportation, warehousing & utilities 9.2% 9.2% 6.5% 6.3% 4.3% 7.0%
Information 3.9% 8.3% 6.2% 9.3% 2.7% 6.4%
Finance, insurance & real estate 3.9% 3.7% 9.9% 15.3% 6.4% 8.3%Professional, scientific, management & administrative 4.6% 9.1% 15.3% 12.7% 6.2% 10.8%
Educational, health and social services 26.4% 30.3% 17.3% 17.5% 27.4% 22.6%
Arts, entertainment & recreation 5.9% 3.1% 3.4% 5.6% 4.1% 4.2%
Other services 4.2% 3.9% 4.9% 3.7% 4.7% 4.4%
Public administration 6.7% 6.5% 3.6% 2.1% 3.3% 4.3%
Armed Forces .0% .0% .0% .0% .0% .0%
Industry
Total 14,505 21,503 36,414 19,691 16,516 108,629
Private 76.6% 73.5% 84.9% 83.3% 77.7% 80.1%
Local Gov. 11.8% 9.3% 4.5% 5.0% 9.5% 7.3%
State or Fed. Gov. 5.3% 11.3% 5.3% 4.8% 3.2% 6.1%
Self Employed 6.4% 6.0% 5.3% 7.0% 9.7% 6.5%
Sector
Total 14,487 21,479 36,343 19,658 16,511 108,478

Westchester County March 2004 Affordable Housing Needs Assessment Appendix A: Commutation Analysis
-76-
SUMMARY
While this analysis of commutation patterns is necessarily limited, it nevertheless
provides some interesting generalizations.
• New York City remains an important region in terms of commuters both into and out of
Westchester. Nevertheless, the precise geography of these flows differs, with Manhattan
being a more important destination for Westchester commuters and the Bronx being a
more important source of commuters into the county (Exhibits A-1 and A-2).
• Despite the perceptions on the part of many, commuters into Westchester are not
particularly concentrated in low-income groups (Exhibit A-3) or in local government
(Exhibit A-4). In fact, both of these characteristics are more evident in those who live
and work in Westchester than in those who commute in. Thus, any policy that targets
commuters for affordable housing provision should be carefully considered.
• The West Central area is the county region with highest share of commuters, while those
in the south end of the county (Yonkers and the Southeast) are relatively low (Exhibit A-
5).
It is our hope that the data presented in this Appendix will be of interest and use to the
county in designing future policy.
Related Documents