West Nile Virus Infection Surveillance in Québec 2013 SEASON

Welcome message from author
This document is posted to help you gain knowledge. Please leave a comment to let me know what you think about it! Share it to your friends and learn new things together.
Transcript
West Nile Virus Infection Surveillance in Québec
2013 SEASON

West Nile Virus Infection Surveillance in Québec
2013 SEASON
ANNUAL SURVEILLANCE REPORT
Direction des risques biologiques et de la santé au travail
Laboratoire de santé publique du Québec
Direction de la santé environnementale et de la toxicologie
July 2014

AUTHORS
Najwa Ouhoumanne, Ph. D., Direction des risques biologiques et de la santé au travail, Institut national de santé publique du Québec
Anne-Marie Lowe, M. Sc., Direction des risques biologiques et de la santé au travail, Institut national de santé publique du Québec
Christian Back, M. Sc., Medical Entomology Consultant
Germain Lebel, M. Sc., Direction de la santé environnementale et de la toxicologie, Institut national de santé publique du Québec
François Milord, M.D., Direction des risques biologiques et de la santé au travail, Institut national de santé publique du Québec
Christian Therrien, Ph. D., Laboratoire de santé publique du Québec, Institut national de santé publique du Québec
Stéphane Lair, DVM, Centre québécois sur la santé des animaux sauvages, Faculty of Veterinary Medicine, Université de Montréal
Isabelle Picard, DVM, Direction de la santé et du bien-être animal, Ministère de l’Agriculture, des Pêcheries et de l’Alimentation du Québec
IN COLLABORATION WITH
Groupe d’experts scientifiques sur le VNO
LAYOUT
Murielle St-Onge, Direction des risques biologiques et de la santé au travail, Institut national de santé publique du Québec
TRANSLATION
The translation of this publication was made possible with funding from the Public Health Agency of Canada.
This document is available in its entirety in electronic format (PDF) on the Institut national de santé publique du Québec Web site at: http://www.inspq.qc.ca. Reproductions for private study or research purposes are authorized by virtue of Article 29 of the Copyright Act. Any other use must be authorized by the Government of Québec, which holds the exclusive intellectual property rights for this document. Authorization may be obtained by submitting a request to the central clearing house of the Service de la gestion des droits d’auteur of Les Publications du Québec, using the online form at http://www.droitauteur.gouv.qc.ca/en/autorisation.php or by sending an e-mail to [email protected]. Information contained in the document may be cited provided that the source is mentioned. LEGAL DEPOSIT – 1st QUARTER 2015 BIBLIOTHÈQUE ET ARCHIVES NATIONALES DU QUÉBEC LIBRARY AND ARCHIVES CANADA ISSN: 2292-4094 (PDF) ISBN: 978-2-550-71683-9 (FRENCH PDF) ISBN: 978-2-550-72719-4 (PDF)
© Gouvernement du Québec (2015)
West Nile Virus Infection Surveillance in Québec: 2013 Season
Institut national de santé publique du Québec I
Table of contents
List of tables .......................................................................................................................................... III
List of figures .......................................................................................................................................... V
Summary ................................................................................................................................................. 1
Introduction ............................................................................................................................................ 3
1 Integrated WNV surveillance objectives ...................................................................................... 5
2 Results ............................................................................................................................................. 7
2.1 Human surveillance ................................................................................................................ 7
2.2 Entomological surveillance .................................................................................................. 14
2.3 Animal surveillance .............................................................................................................. 18
2.3.1 Wild animal surveillance .......................................................................................... 18
2.3.2 Domestic animal surveillance ................................................................................. 19
2.4 Integrated WNV surveillance ............................................................................................... 20
3 Epidemiological situation in Canada and the United States ................................................... 21
4 Interventions ................................................................................................................................. 23
5 Discussion ..................................................................................................................................... 25
Conclusions and recommendations .................................................................................................. 29
References ........................................................................................................................................... 31
Appendix 1 Culex pipiens/restuans abundance, infection rate, and vector index, by health region, Québec, 2013 ........................................................................................ 33
Appendix 2 Number of reported human cases of WNV infection and percentage of neurological cases ........................................................................................................ 37

West Nile Virus Infection Surveillance in Québec: 2013 Season
Institut national de santé publique du Québec III
List of tables
Table 1 Characteristics of reported human cases of WNV infection, Québec, 2013 .................... 10
Table 2 Sequelae reported three or six months post WNV diagnosis in WNV cases with neurological involvement, Québec, 2013 .......................................................................... 11
Table 3 Number of human cases of WNV infection with neurological involvement and crude incidence rate by age and sex, Québec, 2013 ....................................................... 12
Table 4 Number of requests for WNV serological tests submitted to the LSPQ and test positivity rate, by region, Québec, 2013 ........................................................................... 13
Table 5 Distribution of entomological traps and WNV-positive traps by region, Québec, 2013 ................................................................................................................................... 14
Table 6 Number of wild birds confirmed positive for WNV by the CQSAS by species, Québec, 2013 .................................................................................................................... 19
Table 7 Distribution of WNV-positive domestic animals by region and CDC week, Québec, 2013 (horses, unless otherwise specified) ........................................................................ 20
Table 8 Number of WNV-positive human and animal cases in Canada, 2013 season (from January 1 to November 23, 2013) ..................................................................................... 21

West Nile Virus Infection Surveillance in Québec: 2013 Season
Institut national de santé publique du Québec V
List of figures
Figure 1 Distribution of the number of human cases of WNV infection acquired in Québec and crude incidence rate, 2002-2013 ................................................................................. 7
Figure 2 Distribution of the number of human cases of WNV infection acquired in Québec, according to week of onset of symptoms, 2013 ................................................................ 8
Figure 3 Geographic distribution of reported human cases of WNV infection, Québec, 2012-2013 ........................................................................................................................... 9
Figure 4 Number of requests for WNV serological tests submitted to the LSPQ by CDC week, Québec, 2011-2013 ................................................................................................ 13
Figure 5 Number of positive mosquito pools by health region and by CDC week (date the mosquitoes were collected), Québec, 2013 ..................................................................... 15
Figure 6 Culex pipiens/restuans vector index and its components (a-mean abundance by night of capture and b-infection rate), by CDC week (date the mosquitoes were collected), Québec, 2013 .................................................................................................. 16
Figure 7 Number of reported human cases of WNV infection and Culex pipiens/restuans vector index, by CDC week, Québec, 2013 ...................................................................... 17
Figure 8 14-day moving window assessment of the accumulated degree-days above the 14 °C threshold for WNV amplification in mosquitoes, 2013 season ............................... 18
Figure 9 Distribution of wild birds confirmed positive for WNV by the CQSAS, by health region and by CDC week, Québec, 2013 ......................................................................... 19
Figure 10 Integrated WNV surveillance (human, animal cases, number of WNV-positive mosquito pools and Culex pipiens/restuans VI), by CDC week, Québec, 2013 ............... 20

West Nile Virus Infection Surveillance in Québec: 2013 Season
Institut national de santé publique du Québec 1
Summary
In 2013, integrated surveillance of West Nile virus (WNV) in Québec included epidemiological surveillance of human cases, entomological surveillance of mosquitoes and surveillance of animals, including wild birds and domestic animals (agricultural).
During this season, 30 human cases of WNV infection were acquired in Québec, including 29 confirmed cases and one probable case. Of these, 23 (77%) were classed as WNV neuroinvasive cases and 22 were hospitalized, including eight people who were admitted to intensive care and one person who died of meningitis caused by WNV.
The average age of cases was 59 years and two thirds of the cases were men (20/30). More than 70% of the human cases occurred in the Montérégie, Montréal and Laval regions. Of the reported animals that were confirmed positive, nearly 66% were found in these same regions. A total of 2,530 mosquito pools were tested for WNV in 2013, and 60 pools (2.4%) tested positive.
In 2013, 38 wild birds were confirmed WNV positive by the Centre québécois sur la santé des animaux sauvages (CQSAS) [Québec centre for wild animal health]. The Ministère de l’Agriculture, des Pêcheries et de l’Alimentation du Québec (MAPAQ) [Québec’s ministry of agriculture, fisheries and food] also reported eight horses and one domestic Ross’ goose infected by WNV.

West Nile Virus Infection Surveillance in Québec: 2013 Season
Institut national de santé publique du Québec 3
Introduction
In Québec, the first cases of West Nile virus (WNV) infection were identified in 2002. As early as 2003, an integrated surveillance system was set up to detect the presence of WNV activity and to establish procedures to prevent the human complications and mortality associated with WNV infection. Humans, mosquitoes, birds and other animals were part of the integrated surveillance.
During the first two years of WNV circulation in Québec (2002 and 2003), 20 and 17 human cases of WNV infection were reported, respectively. The number of cases greatly declined between 2004 and 2010, with fewer than five cases reported annually, and then increased in 2011 (40 cases acquired in Québec), reaching 133 cases in 2012 (85 of which showed neurological involvement and five of which were fatal).
In addition to this increase in the activity of the virus, a new government intervention plan was adopted in early 2013 to protect public health against the WNV. The objective of the plan was to define the strategy to be pursued for the years 2013-2015[1]. Thus, entomological surveillance (of mosquitoes), which had been interrupted since 2007, was resumed during the 2013 season in some regions. Furthermore, in order to reduce the complications associated with WNV infection, preventive interventions were introduced during the 2013 season. The interventions included the application of larvicide in certain areas of five regions of Québec (identified based on human surveillance historical data), an awareness campaign aimed at the general population and an outreach activity intended for health care professionals. Lastly, weather monitoring was carried out to keep track of degree-days above 14° C (which influences the potential of WNV amplification in mosquitoes) on an exploratory basis, in addition to entomological surveillance, in order to identify the periods favourable to virus amplification in mosquitoes.
This report presents the results of integrated WNV surveillance in Québec for the 2013 season and is mainly based on data from the Système intégré de données de vigie sanitaire du VNO (SIDVS-VNO) [integrated health monitoring data system for WNV], extracted on February 19, 2014. The data on avian and other animal surveillance was provided directly by the MAPAQ for domestic animals and by the CQSAS for wild animals.


West Nile Virus Infection Surveillance in Québec: 2013 Season
Institut national de santé publique du Québec 5
1 Integrated WNV surveillance objectives
The objectives and the methodology of the integrated WNV surveillance, including the reporting of human cases, the choice of location for the entomological traps, and the method used to collect mosquitoes are presented in detail in the analysis plan for this integrated surveillance[2].
In short, the integrated WNV surveillance is based on epidemiological surveillance of human cases, necessary to document disease burden and the demographic, geographic, and seasonal distribution of cases, and on entomological surveillance (of mosquitoes) and animal surveillance, necessary to monitor local activity of the virus and to determine the areas at risk.

West Nile Virus Infection Surveillance in Québec: 2013 Season
Institut national de santé publique du Québec 7
2 Results
2.1 Human surveillance
In 2013, 32 cases of WNV infection were reported in Québec, including 30 cases acquired in Québec. The two cases acquired outside of Québec were excluded from the analyses. Of the cases acquired in Québec, there were 29 confirmed cases and one probable case. Héma-Québec [Québec’s blood collection agency] reported one asymptomatic case.
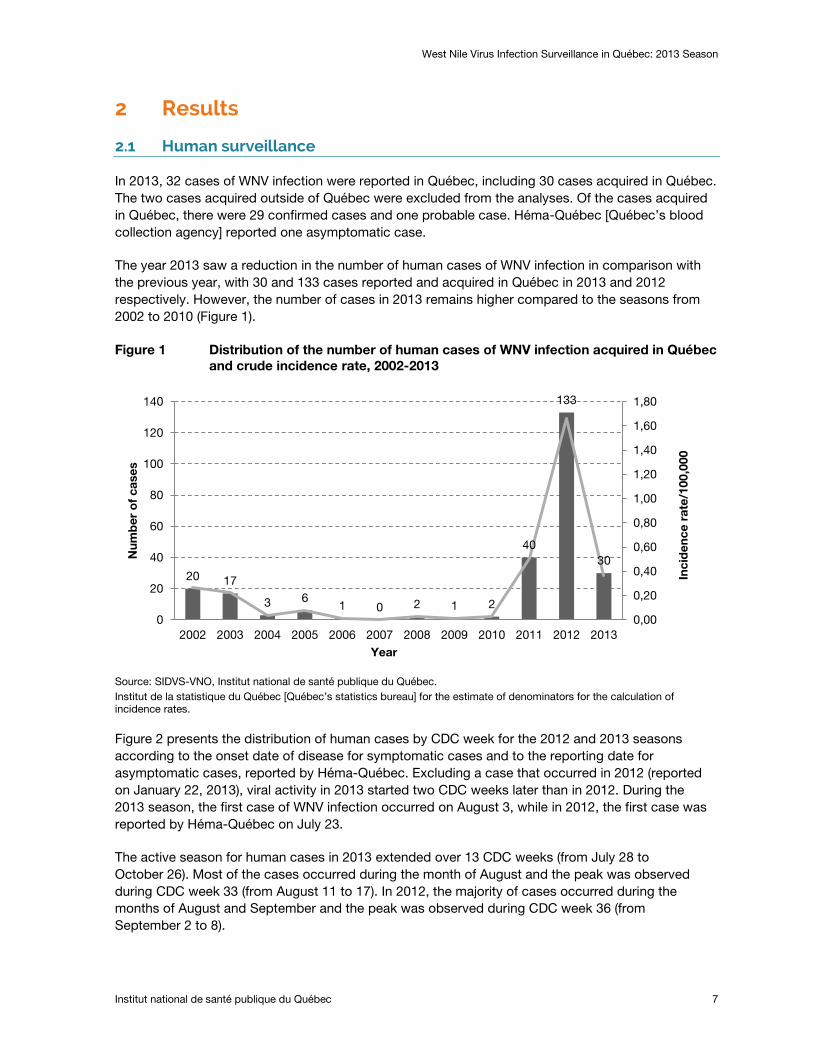
The year 2013 saw a reduction in the number of human cases of WNV infection in comparison with the previous year, with 30 and 133 cases reported and acquired in Québec in 2013 and 2012 respectively. However, the number of cases in 2013 remains higher compared to the seasons from 2002 to 2010 (Figure 1).
Figure 1 Distribution of the number of human cases of WNV infection acquired in Québec and crude incidence rate, 2002-2013
Source: SIDVS-VNO, Institut national de santé publique du Québec. Institut de la statistique du Québec [Québec’s statistics bureau] for the estimate of denominators for the calculation of incidence rates.
Figure 2 presents the distribution of human cases by CDC week for the 2012 and 2013 seasons according to the onset date of disease for symptomatic cases and to the reporting date for asymptomatic cases, reported by Héma-Québec. Excluding a case that occurred in 2012 (reported on January 22, 2013), viral activity in 2013 started two CDC weeks later than in 2012. During the 2013 season, the first case of WNV infection occurred on August 3, while in 2012, the first case was reported by Héma-Québec on July 23.
The active season for human cases in 2013 extended over 13 CDC weeks (from July 28 to October 26). Most of the cases occurred during the month of August and the peak was observed during CDC week 33 (from August 11 to 17). In 2012, the majority of cases occurred during the months of August and September and the peak was observed during CDC week 36 (from September 2 to 8).
20 17
3 6 1 0 2 1 2
40
133
30
0,00
0,20
0,40
0,60
0,80
1,00
1,20
1,40
1,60
1,80
0
20
40
60
80
100
120
140
2002 2003 2004 2005 2006 2007 2008 2009 2010 2011 2012 2013
Num
ber
of
case
s
Year
Inci
den
ce r
ate/
100,
000

West Nile Virus Infection Surveillance in Québec: 2013 Season
8 Institut national de santé publique du Québec
Figure 2 Distribution of the number of human cases of WNV infection acquired in Québec, according to week of onset of symptoms, 2013
The case that occurred in 2012 and was reported in 2013 is not presented. Source: SIDVS-VNO, Institut national de santé publique du Québec. Institut de la statistique du Québec for the estimate of denominators for the calculation of rates.
1 2
9
5 6
3 2 1 1 3 4
9 10
20 19
31
16
12
6
2
0
5
10
15
20
25
30
35
28 29 30 31 32 33 34 35 36 37 38 39 40 41 42 43 44
Num
ber
of
hum
an c
ases
CDC week
2013 Season 2012 Season
West Nile Virus Infection Surveillance in Québec: 2013 Season
Institut national de santé publique du Québec 9
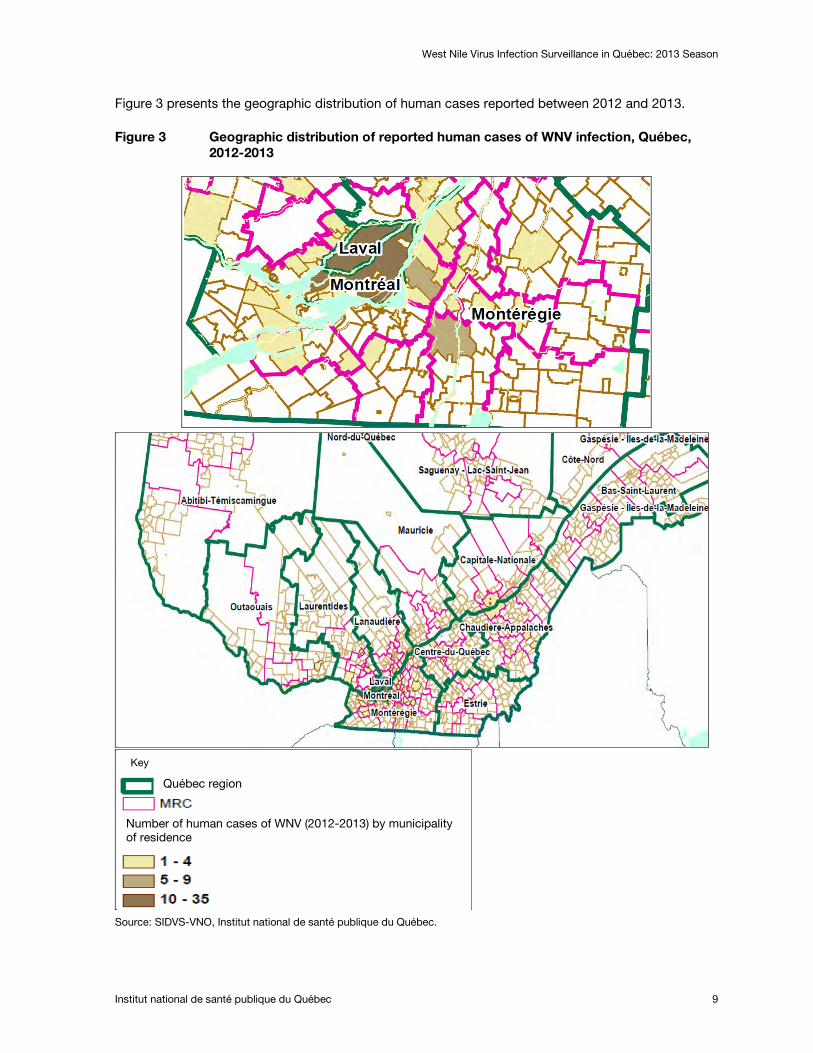
Figure 3 presents the geographic distribution of human cases reported between 2012 and 2013.
Figure 3 Geographic distribution of reported human cases of WNV infection, Québec, 2012-2013
Source: SIDVS-VNO, Institut national de santé publique du Québec.
Key
Québec region
Number of human cases of WNV (2012-2013) by municipality of residence
West Nile Virus Infection Surveillance in Québec: 2013 Season
10 Institut national de santé publique du Québec
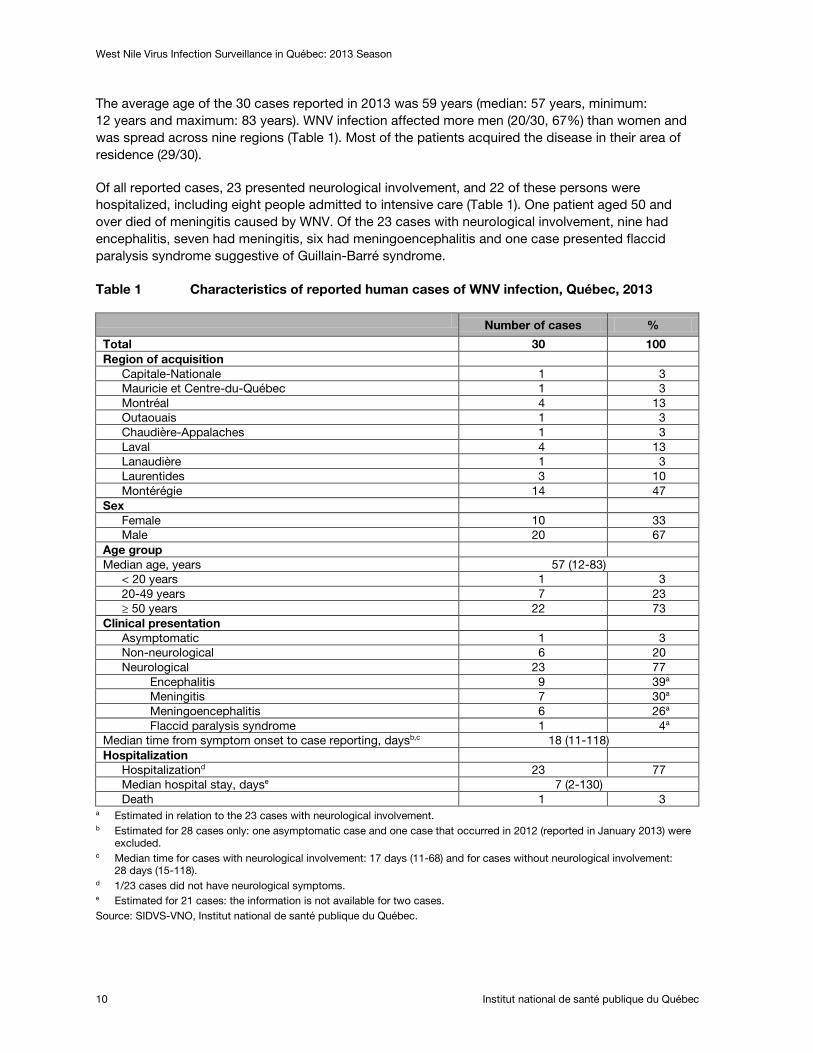
The average age of the 30 cases reported in 2013 was 59 years (median: 57 years, minimum: 12 years and maximum: 83 years). WNV infection affected more men (20/30, 67%) than women and was spread across nine regions (Table 1). Most of the patients acquired the disease in their area of residence (29/30).
Of all reported cases, 23 presented neurological involvement, and 22 of these persons were hospitalized, including eight people admitted to intensive care (Table 1). One patient aged 50 and over died of meningitis caused by WNV. Of the 23 cases with neurological involvement, nine had encephalitis, seven had meningitis, six had meningoencephalitis and one case presented flaccid paralysis syndrome suggestive of Guillain-Barré syndrome.
Table 1 Characteristics of reported human cases of WNV infection, Québec, 2013
Number of cases %
Total 30 100 Region of acquisition
Capitale-Nationale 1 3 Mauricie et Centre-du-Québec 1 3 Montréal 4 13 Outaouais 1 3 Chaudière-Appalaches 1 3 Laval 4 13 Lanaudière 1 3 Laurentides 3 10 Montérégie 14 47
Sex Female 10 33 Male 20 67
Age group Median age, years 57 (12-83)
< 20 years 1 3 20-49 years 7 23 ≥ 50 years 22 73
Clinical presentation Asymptomatic 1 3 Non-neurological 6 20 Neurological 23 77
Encephalitis 9 39a Meningitis 7 30a Meningoencephalitis 6 26a Flaccid paralysis syndrome 1 4a
Median time from symptom onset to case reporting, daysb,c 18 (11-118) Hospitalization
Hospitalizationd 23 77 Median hospital stay, dayse 7 (2-130) Death 1 3
a Estimated in relation to the 23 cases with neurological involvement. b Estimated for 28 cases only: one asymptomatic case and one case that occurred in 2012 (reported in January 2013) were
excluded. c Median time for cases with neurological involvement: 17 days (11-68) and for cases without neurological involvement:
28 days (15-118). d 1/23 cases did not have neurological symptoms. e Estimated for 21 cases: the information is not available for two cases. Source: SIDVS-VNO, Institut national de santé publique du Québec.
West Nile Virus Infection Surveillance in Québec: 2013 Season
Institut national de santé publique du Québec 11
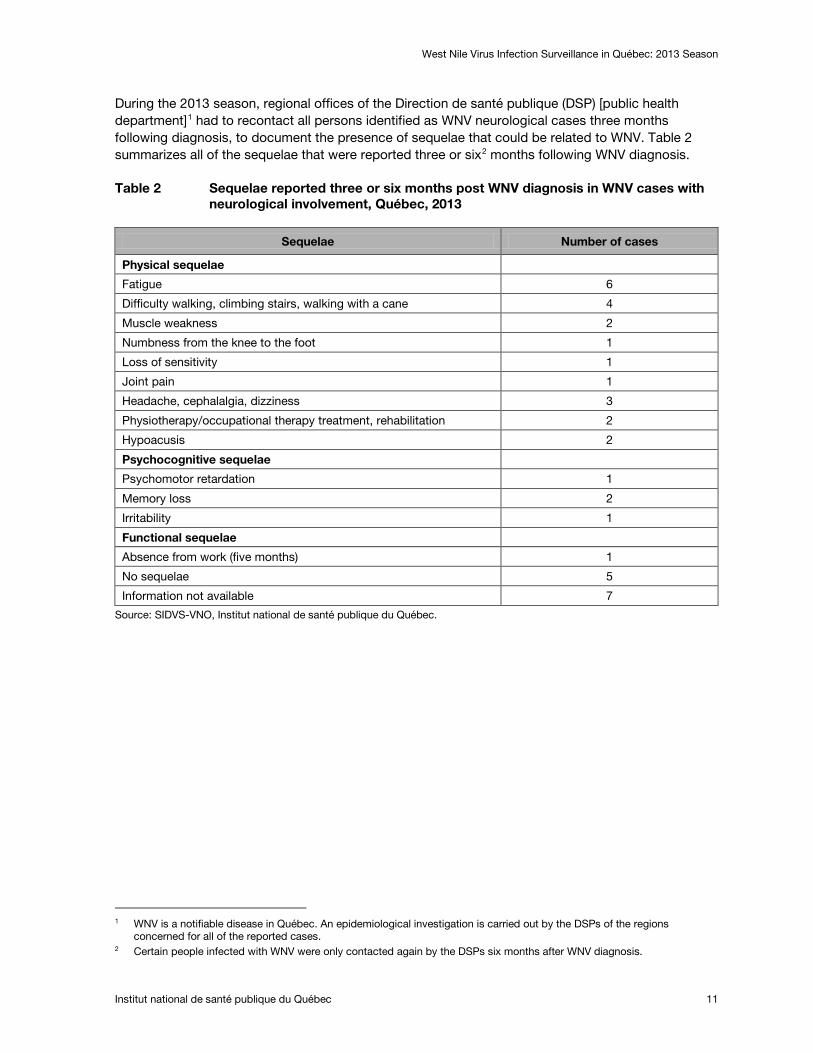
During the 2013 season, regional offices of the Direction de santé publique (DSP) [public health department]1 had to recontact all persons identified as WNV neurological cases three months following diagnosis, to document the presence of sequelae that could be related to WNV. Table 2 summarizes all of the sequelae that were reported three or six2
Table 2 Sequelae reported three or six months post WNV diagnosis in WNV cases with neurological involvement, Québec, 2013
months following WNV diagnosis.
Sequelae Number of cases
Physical sequelae
Fatigue 6
Difficulty walking, climbing stairs, walking with a cane 4
Muscle weakness 2
Numbness from the knee to the foot 1
Loss of sensitivity 1
Joint pain 1
Headache, cephalalgia, dizziness 3
Physiotherapy/occupational therapy treatment, rehabilitation 2
Hypoacusis 2
Psychocognitive sequelae
Psychomotor retardation 1
Memory loss 2
Irritability 1
Functional sequelae
Absence from work (five months) 1
No sequelae 5
Information not available 7
Source: SIDVS-VNO, Institut national de santé publique du Québec.
1 WNV is a notifiable disease in Québec. An epidemiological investigation is carried out by the DSPs of the regions
concerned for all of the reported cases. 2 Certain people infected with WNV were only contacted again by the DSPs six months after WNV diagnosis.

West Nile Virus Infection Surveillance in Québec: 2013 Season
12 Institut national de santé publique du Québec
Men and people over 50 represented the majority of cases of WNV infection with neurological involvement. The incidence rate was 0.39 and 0.54/100,000 person-years (py), respectively (Table 3). One adolescent presented meningoencephalitis and represented the youngest case with neurological involvement to be reported since WNV first appeared in Québec.
Table 3 Number of human cases of WNV infection with neurological involvement and crude incidence rate by age and sex, Québec, 2013
Sex Number of cases
Incidence rate/ 100,000
Female 7 0.17 Male 16 0.39
Age group < 50 years 6 0.12 ≥ 50 years 17 0.54
Total 23 0.28 Denominator: the entire Québec population. Source: SIDVS-VNO, Institut national de santé publique du Québec. Institut de la statistique du Québec for the estimate of the denominators for the calculation of rates.
Requests for tests submitted to the Laboratoire de santé publique du Québec (LSPQ) [Québec’s public health laboratory]
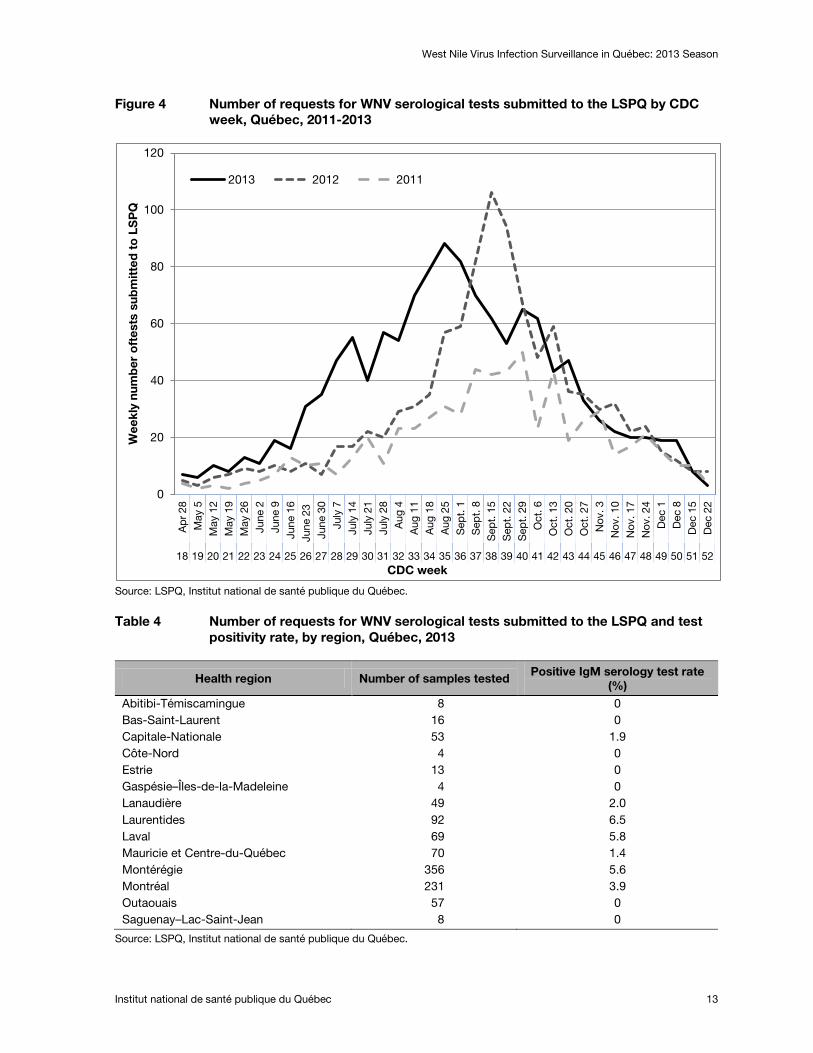
Between April 28 and November 30, 2013, 1,401 serum samples were sent to and tested by the Laboratoire de santé publique du Québec (LSPQ) for WNV detection (Figure 4). In comparison with the two previous seasons (2011 and 2012), the number of requests for tests submitted to the LSPQ was particularly high at the beginning of the 2013 season, between the weeks of June 9 and August 25 (CDC weeks 24 to 35).
An analysis of the data by health region reveals that in 2013, nearly 60% of requests for serological tests came from the Montérégie and Montréal regions (Table 4). However, the highest rates of positive IgM serological tests were observed in the Laurentides, Laval and Montérégie regions.
West Nile Virus Infection Surveillance in Québec: 2013 Season
Institut national de santé publique du Québec 13
Figure 4 Number of requests for WNV serological tests submitted to the LSPQ by CDC week, Québec, 2011-2013
Source: LSPQ, Institut national de santé publique du Québec.
Table 4 Number of requests for WNV serological tests submitted to the LSPQ and test positivity rate, by region, Québec, 2013
Health region Number of samples tested Positive IgM serology test rate
(%) Abitibi-Témiscamingue 8 0 Bas-Saint-Laurent 16 0 Capitale-Nationale 53 1.9 Côte-Nord 4 0 Estrie 13 0 Gaspésie–Îles-de-la-Madeleine 4 0 Lanaudière 49 2.0 Laurentides 92 6.5 Laval 69 5.8 Mauricie et Centre-du-Québec 70 1.4 Montérégie 356 5.6 Montréal 231 3.9 Outaouais 57 0 Saguenay–Lac-Saint-Jean 8 0
Source: LSPQ, Institut national de santé publique du Québec.
0
20
40
60
80
100
120
Ap
r 28
May
5
May
12
May
19
May
26
June
2
June
9
June
16
June
23
Ju
ne 3
0 Ju
ly 7
Ju
ly 1
4 Ju
ly 2
1 Ju
ly 2
8 A
ug 4
A
ug 1
1 A
ug 1
8 A
ug 2
5 S
ept.
1
Sep
t. 8
S
ept.
15
Sep
t. 2
2 S
ept.
29
Oct
. 6
Oct
. 13
Oct
. 20
Oct
. 27
Nov
. 3
Nov
. 10
Nov
. 17
Nov
. 24
Dec
1
Dec
8
Dec
15
Dec
22
18 19 20 21 22 23 24 25 26 27 28 29 30 31 32 33 34 35 36 37 38 39 40 41 42 43 44 45 46 47 48 49 50 51 52
Wee
kly
num
ber
oft
ests
sub
mit
ted
to
LS
PQ
CDC week
2013 2012 2011
West Nile Virus Infection Surveillance in Québec: 2013 Season
14 Institut national de santé publique du Québec
2.2 Entomological surveillance
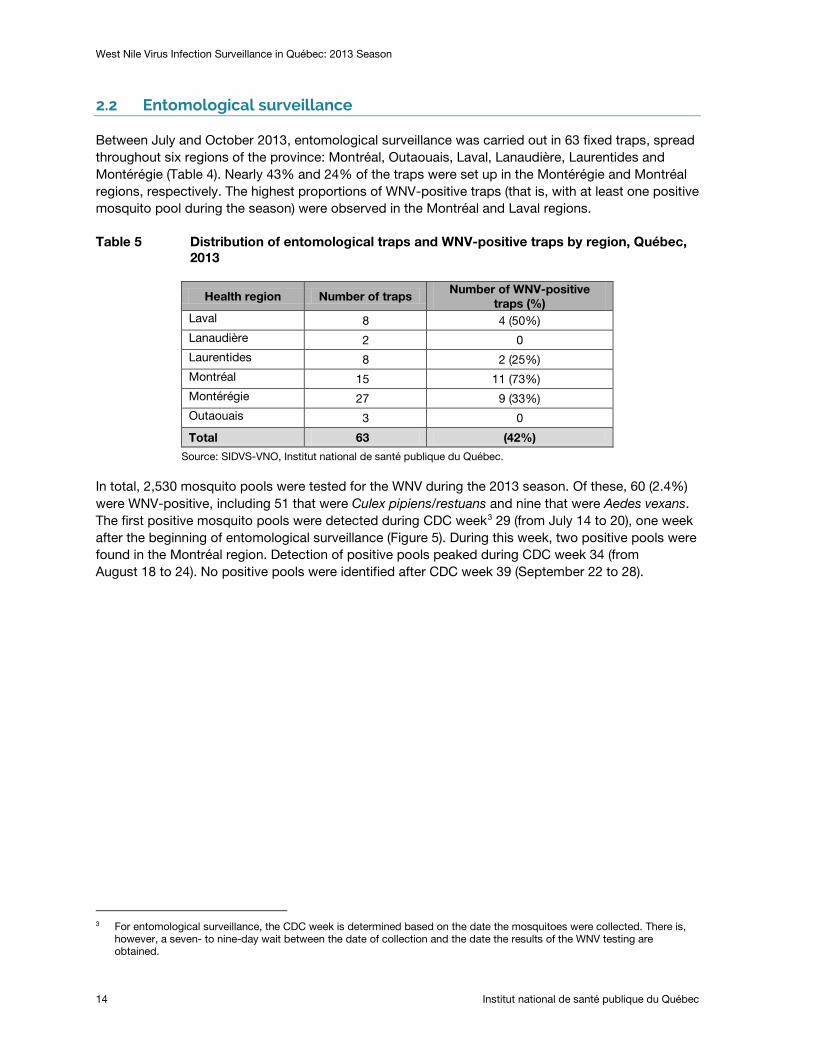
Between July and October 2013, entomological surveillance was carried out in 63 fixed traps, spread throughout six regions of the province: Montréal, Outaouais, Laval, Lanaudière, Laurentides and Montérégie (Table 4). Nearly 43% and 24% of the traps were set up in the Montérégie and Montréal regions, respectively. The highest proportions of WNV-positive traps (that is, with at least one positive mosquito pool during the season) were observed in the Montréal and Laval regions.
Table 5 Distribution of entomological traps and WNV-positive traps by region, Québec, 2013
Health region Number of traps Number of WNV-positive
traps (%) Laval 8 4 (50%) Lanaudière 2 0 Laurentides 8 2 (25%) Montréal 15 11 (73%) Montérégie 27 9 (33%) Outaouais 3 0
Total 63 (42%)
Source: SIDVS-VNO, Institut national de santé publique du Québec.
In total, 2,530 mosquito pools were tested for the WNV during the 2013 season. Of these, 60 (2.4%) were WNV-positive, including 51 that were Culex pipiens/restuans and nine that were Aedes vexans. The first positive mosquito pools were detected during CDC week3
29 (from July 14 to 20), one week after the beginning of entomological surveillance (Figure 5). During this week, two positive pools were found in the Montréal region. Detection of positive pools peaked during CDC week 34 (from August 18 to 24). No positive pools were identified after CDC week 39 (September 22 to 28).
3 For entomological surveillance, the CDC week is determined based on the date the mosquitoes were collected. There is,
however, a seven- to nine-day wait between the date of collection and the date the results of the WNV testing are obtained.

West Nile Virus Infection Surveillance in Québec: 2013 Season
Institut national de santé publique du Québec 15
Figure 5 Number of positive mosquito pools by health region and by CDC week (date the mosquitoes were collected), Québec, 2013
Montréal: 35 pools, Montérégie: 14, Laval: 8 and Laurentides: 3. Source: SIDVS-VNO, Institut national de santé publique du Québec.
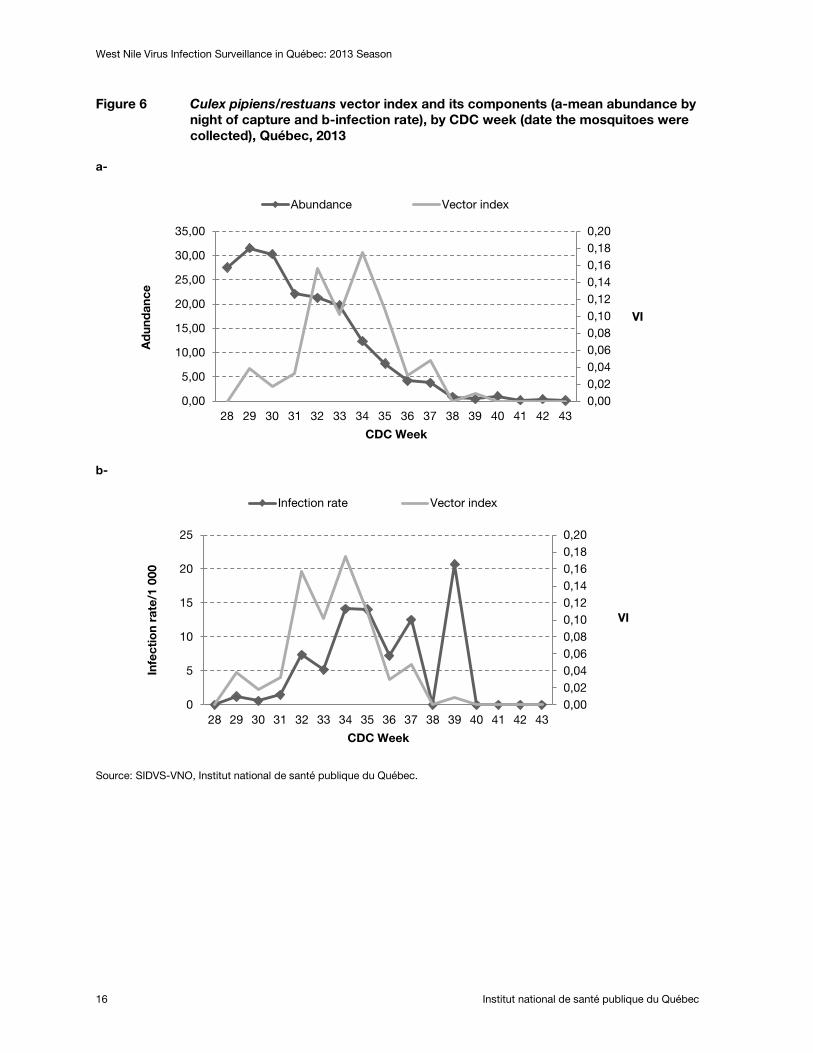
The maximum mean abundance (geometric mean of all of the traps) for Culex pipiens/restuans was observed at the very beginning of the surveillance, during CDC week 29 (from July 14 to 20) (Figure 6a). The infection rate gradually increased, reaching 14.1/1,000 (95% confidence interval: 7.7-24.2) during CDC weeks 34 and 35, and remained high until CDC week 37 (from September 8 to 14) (Figure 6b).
There were two peaks in the geometric mean of the vector index (VI) (calculated from the abundance and the infection rate): the first peak of 0.16 in CDC week 32 (from August 4 to 10) and the second peak of 0.17 in CDC week 34 (from August 18 to 24) (Figures 6a and 6b). As a reminder, the vector index is an estimate of the number of infected mosquitoes captured by night for a given species. Appendix 1 presents the measurements of the VI and its components by region.
0
2
4
6
8
10
12
14
28 29 30 31 32 33 34 35 36 37 38 39 40
Num
ber
of
po
siti
ve p
oo
ls
CDC week
Laurentides Laval Montérégie Montréal
West Nile Virus Infection Surveillance in Québec: 2013 Season
16 Institut national de santé publique du Québec
Figure 6 Culex pipiens/restuans vector index and its components (a-mean abundance by night of capture and b-infection rate), by CDC week (date the mosquitoes were collected), Québec, 2013
a-
b-
Source: SIDVS-VNO, Institut national de santé publique du Québec.
0,00 0,02 0,04 0,06 0,08 0,10 0,12 0,14 0,16 0,18 0,20
0,00
5,00
10,00
15,00
20,00
25,00
30,00
35,00
28 29 30 31 32 33 34 35 36 37 38 39 40 41 42 43
Ad
und
ance
CDC Week
VI
Abundance Vector index
0,00 0,02 0,04 0,06 0,08 0,10 0,12 0,14 0,16 0,18 0,20
0
5
10
15
20
25
28 29 30 31 32 33 34 35 36 37 38 39 40 41 42 43
Infe
ctio
n ra
te/1
000
CDC Week
VI
Infection rate Vector index

West Nile Virus Infection Surveillance in Québec: 2013 Season
Institut national de santé publique du Québec 17
Figure 7 indicates the presence of some correlation between the VI curves for Culex pipiens/restuans mosquitoes and the number of human cases of WNV infection. The increase in the number of human cases of WNV infection occurred one week after the peak in the VI.
Figure 7 Number of reported human cases of WNV infection and Culex pipiens/restuans vector index, by CDC week, Québec, 2013
Source: SIDVS-VNO, Institut national de santé publique du Québec.
Weather monitoring
The McTavish station in downtown Montréal was chosen for weather monitoring. This station is representative of the urban environment, is near the WNV “epicentre,” and there isn’t much weather data missing for the reporting period.
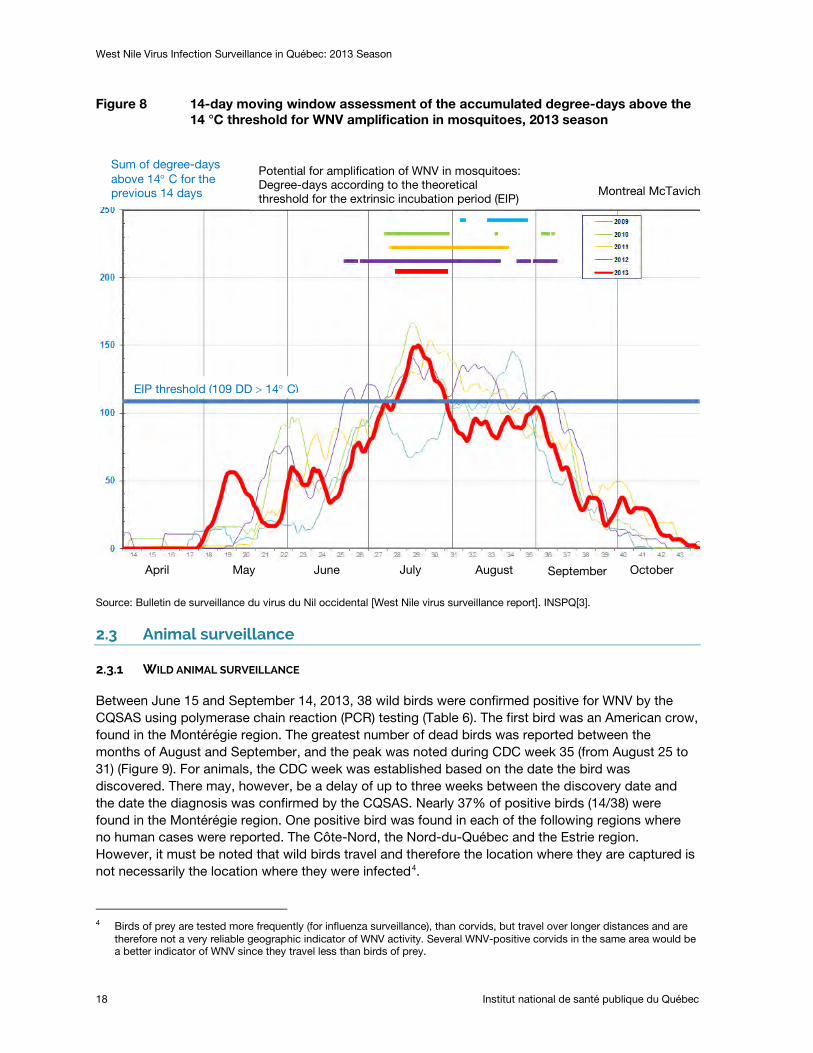
Figure 8 shows the tracking of degree-days above 14° C (threshold for WNV amplification in mosquitoes) from 2009 to 2013. In 2013, the month of July (curve above the threshold) seems to have been favourable to the development of WNV in mosquitoes. In the month of August 2013, the sum of degree-days remained below the reference threshold of 109 degree-days above 14° C and it never went back up above this threshold. In 2011 and 2012, the period that was favourable to the development of WNV in mosquitoes was longer: from July to August 2011, and from mid-June to the beginning of September 2012, respectively. During the 2009 and 2010 seasons (when viral activity was very low in Québec), this period was very short: the last two weeks of August 2009 and the entire month of July 2010.
0,00
0,02
0,04
0,06
0,08
0,10
0,12
0,14
0,16
0,18
0,20
0
1
2
3
4
5
6
7
8
9
10
28 29 30 31 32 33 34 35 36 37 38 39 40 41 42 43
Num
ber
of
hum
an c
ases
CDC Week
VI
N of human cases VI
West Nile Virus Infection Surveillance in Québec: 2013 Season
18 Institut national de santé publique du Québec
Figure 8 14-day moving window assessment of the accumulated degree-days above the 14 °C threshold for WNV amplification in mosquitoes, 2013 season
Source: Bulletin de surveillance du virus du Nil occidental [West Nile virus surveillance report]. INSPQ[3].
2.3 Animal surveillance
2.3.1 WILD ANIMAL SURVEILLANCE
Between June 15 and September 14, 2013, 38 wild birds were confirmed positive for WNV by the CQSAS using polymerase chain reaction (PCR) testing (Table 6). The first bird was an American crow, found in the Montérégie region. The greatest number of dead birds was reported between the months of August and September, and the peak was noted during CDC week 35 (from August 25 to 31) (Figure 9). For animals, the CDC week was established based on the date the bird was discovered. There may, however, be a delay of up to three weeks between the discovery date and the date the diagnosis was confirmed by the CQSAS. Nearly 37% of positive birds (14/38) were found in the Montérégie region. One positive bird was found in each of the following regions where no human cases were reported. The Côte-Nord, the Nord-du-Québec and the Estrie region. However, it must be noted that wild birds travel and therefore the location where they are captured is not necessarily the location where they were infected4
4 Birds of prey are tested more frequently (for influenza surveillance), than corvids, but travel over longer distances and are
therefore not a very reliable geographic indicator of WNV activity. Several WNV-positive corvids in the same area would be a better indicator of WNV since they travel less than birds of prey.
.
Sum of degree-days above 14° C for the previous 14 days
Potential for amplification of WNV in mosquitoes: Degree-days according to the theoretical threshold for the extrinsic incubation period (EIP) Montreal McTavich
EIP threshold (109 DD > 14° C)
April May June July August September October

West Nile Virus Infection Surveillance in Québec: 2013 Season
Institut national de santé publique du Québec 19
Table 6 Number of wild birds confirmed positive for WNV by the CQSAS by species, Québec, 2013
Species Number of cases
American crow 5
Northern goshawk 3
Red-tailed hawk 5
Northern hawk-owl 1
Sharp-shinned hawk 8
Cooper’s hawk 6
Merlin 5
Broad-winged hawk 3
American kestrel 1
Snowy owl 1
Total 38
Figure 9 Distribution of wild birds confirmed positive for WNV by the CQSAS, by health region and by CDC week, Québec, 2013
2.3.2 DOMESTIC ANIMAL SURVEILLANCE
During the 2013 season, eight horses and one Ross’ goose with central nervous system involvement were reported and confirmed WNV positive by the MAPAQ (Table 5). In total, four of the eight horses died. None of the eight horses had been properly vaccinated. The nine animals were reported in the Montérégie (five cases), Lanaudière (three cases) and Chaudière-Appalaches (one case) regions and did not have a history of exposure outside their area of residence in the weeks preceding the presentation of clinical signs. The first case (the Ross’ goose) occurred during CDC week 33 (from August 11 to 17).
0
1
2
3
4
5
6
7
8
9
10
24 31 32 33 34 35 36 37
Num
ber
of
wild
bir
ds
CDC week
Côte Nord Outaouais Nord-du-Québec Montréal Montérégie Laval Laurentides Lanaudières Estrie Mauricie et Centre-du-Québec Capitale-Nationale

West Nile Virus Infection Surveillance in Québec: 2013 Season
20 Institut national de santé publique du Québec
Table 7 Distribution of WNV-positive domestic animals by region and CDC week, Québec, 2013 (horses, unless otherwise specified)
Health region
CDC week Total
28 29 30 31 32 33 34 35 36 37 38 39 40 41 42 43 44 Chaudière-Appalaches
1 1
Lanaudière 1 2 3 Montérégie 1a 1 2 1 5 Total 1a 1 1 2 1 2 1 9
a Ross’ goose.
2.4 Integrated WNV surveillance
All of the WNV surveillance data (human, entomological and animal) collected during the 2013 season is presented in Figure 10 in order to provide an overview of the season. The first WNV-positive animal (a wild bird) was discovered during CDC week 24, and then four other positive animals were discovered during CDC week 31. The first positive mosquito pools were collected during CDC week 29, two weeks before onset of symptoms in the first human case. Lastly, the first peak in the VI for Culex pipiens/restuans mosquitoes occurred during CDC week 32, one week before the peak in human cases of WNV infection.
Figure 10 Integrated WNV surveillance (human, animal cases, number of WNV-positive mosquito pools and Culex pipiens/restuans VI), by CDC week, Québec, 2013
0,00
0,02
0,04
0,06
0,08
0,10
0,12
0,14
0,16
0,18
0,20
0
1
2
3
4
5
6
7
8
9
10
28 29 30 31 32 33 34 35 36 37 38 39 40 41 42 43 44
Num
ber
of
case
s
CDC Week
VI
N of human cases N of animal cases VI

West Nile Virus Infection Surveillance in Québec: 2013 Season
Institut national de santé publique du Québec 21
3 Epidemiological situation in Canada and the United States
Canada
As of November 23, 2013 (CDC week 47), a total of 113 human cases of WNV infection had been reported by the Public Health Agency of Canada (PHAC)[4]. Of these, 40 cases (35%) presented neurological involvement, 46 cases (41%) did not have neurological involvement, three cases (3%) were asymptomatic and 24 cases (21%) had an unspecified diagnosis. Ontario (53), Québec (29) and Alberta (21) accounted for the highest number of cases (Table 8). Four deaths associated with WNV were reported.
As of the same date (November 23, 2013), a total of 187 dead birds had been tested for WNV by the Canadian Cooperative Wildlife Health Centre, of which 89 were positive for WNV. Two other birds were reported in a zoo in Ontario and a Ross’ domestic goose was reported by MAPAQ in Québec. In addition, the Canadian Food Inspection Agency reported a total of 57 cases of WNV infection in animals (not including birds) (Table 8).
A total of 13,458 mosquito pools were tested for WNV in Canada (8,642 in Ontario, 2,530 in Québec, 909 in Saskatchewan, 1,088 in Manitoba and 289 in British Columbia). Of these, 318 (2.4%) were WNV-positive (198 in Ontario, 60 in Québec, 40 in Saskatchewan, 19 in Manitoba and 1 in British Columbia) (Table 8).
Table 8 Number of WNV-positive human and animal cases in Canada, 2013 season (from January 1 to November 23, 2013)
Province Human cases
Dead birds Other birds
Domestic animals
Positive mosquito
pools Ontario 53 36 2 15 198 Québec 29 38 1 8 60 Alberta 21 1 0 13 0 Saskatchewan 6 11 0 17 40 Manitoba 3 2 0 3 19 British Columbia 1 1 0 1 1 Canada 113 89 3 57 318
Source PHAC, West Nile Virus, National Surveillance Report week 46 and 47[4].
United States
During the 2013 season, a total of 2,374 human cases of WNV infection were reported in 48 States. Of these, 1,205 cases (51%) presented neurological involvement and 114 cases (5%) were fatal. In addition, 420 blood donors tested positive for WNV in 2013. The incidence rate for cases with neurological involvement exceeds 1/100,000 person-years in eight central states and ranges from 0.01 to 0.24/100,000 in the states neighbouring Québec, such as New York, Vermont and New Hampshire5
5
.
http://www.cdc.gov/westnile/statsMaps/preliminaryMapsData/incidencestatedate.html.


West Nile Virus Infection Surveillance in Québec: 2013 Season
Institut national de santé publique du Québec 23
4 Interventions
In 2013, working with the Ministère du Développement durable, Environnement, Faune et Parcs (MDDEFP) [ministry of sustainable development, environment, wildlife and parks], the MAPAQ and the Ministère des Affaires municipales, des Régions et de l’Occupation du territoire (MAMROT) [ministry of municipal affairs, the regions and land development], the Ministère de la Santé et services sociaux (MSSS) [ministry of health and social services) adopted a government intervention plan to protect the population’s health against WNV infection, aimed at defining the strategy to be pursued for the years 2013-2015[1]. This intervention plan included integrated surveillance of WNV and intervention measures including the preventive application of larvicide, an awareness campaign aimed at the general public and outreach activities intended for health care professionals.
Over the summer of 2013, larvicide was applied in certain areas of the Laval, Montréal, Montérégie, Lanaudière and Laurentides regions. These areas were identified based on two criteria: the occurrence of at least three human cases of WNV infection within a two-km radius and a population density equal to or greater than 400 residents per km2. The first application of larvicide was carried out in mid-June in order to target the larvae of the Culex genus of mosquitoes prior to the first occurrences of human cases of WNV infection. The larvicide was applied until mid-September 2013. Three applications of methoprene were carried out in catch basins during the months of June, July and August. Bacillus thuringiensis israelensis (Bti) was used in natural or semi-natural breeding places. In total, nearly 600 km2 were treated, which represents 315 natural breeding places and 191,908 catch basins[1].
Between August 5 and September 15, 2013, the MSSS conducted an awareness campaign, involving radio commercials and superboards displayed along highways, targeting the residents of the nine regions where cases of WNV infection had been reported during the preceding season[1]. The goal of this campaign was to raise the general public’s awareness of the risk of severe WNV infection and to inform them of the personal protection measures they could take.
In addition, as WNV infection is likely underdiagnosed in Québec, the Direction de la protection de la santé publique [department of public health protection] sent a message to physician associations (microbiologists-infectiologists, neurologists, emergency physicians, internists and general practitioners) to be distributed to their members. In 2013, the Direction de santé publique of each of the six branches targeted by the intervention plan was urged to ask clinical practitioners in its region to be vigilant[1].


West Nile Virus Infection Surveillance in Québec: 2013 Season
Institut national de santé publique du Québec 25
5 Discussion
Human surveillance
The year 2013 is the third highest year on record (after 2012 and 2011) in terms of the number of human cases of WNV infection since the virus apparition in Québec. More than 70% of the cases occurred in the Montérégie, Montréal and Laval regions. Of the animals that were reported and confirmed positive, nearly 66% were found in these same regions.
Neurological cases represent the most severe cases, they usually require hospitalization, and they may result in long-term sequelae and deaths[5]. In 2013, 23 cases with neurological involvement were reported in Québec, which represents 77% of the total number of cases reported. This proportion is overestimated, however, owing to more significant underdiagnosis of cases of infection without neurological involvement. In fact, American data indicates that of all of WNV infection cases identified through blood donor screening, 26% developed non-neurological symptoms[6]. Other studies estimated that from 1/140 to 1/244 cases of infection will develop neurological disease[7, 8]. Thus, by extrapolating these results from the Québec data, and based on the reported neurological cases (n = 23), we can estimate that from 3,220 to 5,612 human cases of WNV infection occurred in Québec in 2013, of which 837 to 1,460 presented non-neurological symptoms.
However, not all neurological cases are diagnosed. In Canada, the results of a retrospective study on over 24,000 hospitalizations for encephalitis that occurred between 1994 and 2008 indicated that the likely cause of the disease was unexplained (not investigated) in 50% of cases)[9]. This underdiagnosis was even more significant in Québec (65%) than in the other provinces[9]. The authors indicate that the spatial and temporal overlap between cases of unknown aetiology and those caused by WNV suggests a common aetiology[9]. During the 2010 outbreak of WNV in Arizona, only 40% (24/60) of patients hospitalized for encephalitis or meningitis were tested for WNV[10]. This proportion was even lower for patients under 50 years of age than for patients aged 50 and over (28% vs 71%, p < 0.01)[10]. All of this information reflects an underdiagnosis even in the most severe cases. This could be at least partially attributable to health care professionals and the general public having insufficient knowledge of vector-borne diseases, to the difficulty of making an aetiological diagnosis and to the absence of a specific treatment for cases of encephalitis, which makes identification of the aetiological agent not very clinically useful for health care professionals.
In Québec in 2013, the incidence rate for cases of WNV infection with neurological involvement was estimated at 0.28/100,000 person-years. The rates were higher for men and for people 50 years of age and over. The differences were statistically insignificant given the low number of cases. Similar results were reported by other studies[9, 11]. As well, the results of a recent American study showed that old age and male sex are independent risk factors for neurological involvement following WNV infection, even after adjustment for the history of underlying medical conditions[12]. Other risk factors, including a history of cancer, diabetes, hypertension, kidney disease and alcohol abuse, were also reported[12, 13].
The incidence rate for cases of WNV infection with neurological involvement in 2013 decreased as compared with 2012 (1.08/100,000 person-years) and with 2011 (0.32/100,000 person-years ), even though the number of requests for WNV tests submitted to the LSPQ increased in 2013 (likely owing to the outreach activities intended for health care professionals conducted during this year). The decline in the incidence rate could be attributable to a combination of factors, including 1) the early application of larvicide during the 2013 season in the areas where the WNV was actively circulating, 2) the awareness campaign aimed at the general public and 3) the weather conditions that appear to

West Nile Virus Infection Surveillance in Québec: 2013 Season
26 Institut national de santé publique du Québec
have been less favourable for the amplification of the virus in mosquitoes as compared with the previous two seasons.
To that effect, the efficacy of applying larvicide6
It is not very likely that the awareness campaign affected the number of cases of infection, since for a large proportion of the cases, the WNV infection likely occurred before the campaign started or at least during the initial days of the campaign. More specifically, the period covered by the awareness campaign was from August 5 to September 15, 2013. Yet, the human surveillance data showed that onset of symptoms occurred between July 28 and October 26, with most cases having occurred during the month of August. The WNV incubation period in humans is estimated to be between two and 14 days[5]. Of the 30 cases of WNV infection, nearly half (n=12) occurred during CDC weeks 31 to 33, between July 28 and August 18. If the incubation period had been 14 days for all of these cases, the time of infection would have been between July 14 and August 4, 2013, that is, before the awareness campaign started.
in reducing the number of mosquitoes was documented by several studies[14-16]. During the 2013 season, the Société de protection des forêts contre les insectes et les maladies (SOPFIM) [society for the protection of forests against insects and diseases] estimated 92% efficacy in reducing the emergence of adult mosquitoes[16]. A few studies also demonstrated the efficacy of larvicides used in combination with adulticides to contro; mosquitoes in reducing human cases[17, 18]. While the experts recommend the application of larvicide, no conclusive data is available at the present time on the efficacy of applying larvicide alone in reducing the number of human cases of WNV infection or in reducing the abundance of vectors and their WNV infection rate. The decision to use larvicide is based on the logical thinking that by decreasing the vector, the risk is reduced. Consequently, in order to document the effect of larvicides, the MSSS gave the INSPQ the mandate to carry out a study with an objective of evaluating the efficacy of larvicides, applied as part of the government intervention program, in reducing the abundance of Culex pipiens/restuans mosquitoes and their infection rate.
Regarding the weather conditions observed in 2013, summer came late and winter was very cold. The period during which the temperature was above the threshold for amplification of the virus in mosquitoes was shorter than in 2011 and 2012. Weather parameters are increasingly used in surveillance programs to complement entomological surveillance indicators[19-22].
Entomological surveillance
Entomological surveillance allowed viral activity to be documented in mosquitoes in four of the six regions where traps were placed. The first WNV-positive mosquito pools were detected in the Montréal region two weeks prior to symptom onset in the first human case reported in Montréal. The weekly similarity observed between the human cases and the VI for Culex pipiens/restuans mosquitoes suggests that the latter could be a good indicator of the evolution of the risk of exposure in humans during the season. In fact, several studies report that an increase in the VI reflects an increase in the risk of infection in humans[22-26]. These studies also demonstrated a significant association between the VI and the number of human cases that occurred from one to two weeks later. However, owing to the low incidence of human cases in Québec and the discontinuity of entomological data, we are unable to confirm whether these observations apply to the Québec situation.
6 Methoprene is a synthesized hormone that prevents the larvae from developing into adults, while BTi (which kills larvae) is
effective in reducing the emergence of adult mosquitoes in breeding places in which the product is applied.
West Nile Virus Infection Surveillance in Québec: 2013 Season
Institut national de santé publique du Québec 27
Surveillance of birds and other animals
In 2013, the CQSAS reported 38 wild birds infected by WNV, 28 of which were birds of prey. All of the birds were detected in 11 health regions and four of them were found in regions where no human cases had been reported. While the surveillance of wild birds of prey is not a good indicator of local WNV activity, continued collection of surveillance data collection over time would enable the detection of any abnormal change that could be an early indicator of WNV activity in a new, non-endemic area.
In total, one domestic goose and eight horses infected by WNV were reported by the MAPAQ, eight of which were in the Montérégie and Lanaudière regions, as well as one case in Chaudière-Appalaches. The number of horses infected also decreased in comparison with 2012, when 20 cases were reported.
Limits
Integrated WNV surveillance (including human, animal and entomological surveillance) is likely underestimated and presents only a partial picture of the actual activity of the virus in Québec.
Human surveillance is particularly limited to the most severe cases that present neurological involvement, representing less than 1% of all cases. The high rate of underdiagnosis of less severe or asymptomatic cases makes it difficult to precisely estimate the number of human cases and the demographic distribution of these cases. The estimated incidence rate for all cases is underestimated and therefore, must be interpreted with some caution. Moreover, human surveillance is passive surveillance that relies solely on reporting by health care professionals, which depends on their awareness of vector-borne diseases, and therefore impacts their decision to make a diagnosis and report cases. All of these factors make comparison between regions or with other provinces difficult.
In Québec, the proportion of cases with neurological involvement is high in comparison with Ontario (Appendix 2). Assumptions may be suggested to explain this difference. The number of cases without neurological involvement may be more significantly underestimated in Québec than in Ontario. The awareness campaigns aimed at the general public and health care professionals in Ontario may have led to more diagnoses of WNV cases without neurological involvement. Moreover, better detection of neurological cases in Québec in comparison with Ontario would not represent a very likely cause for the discrepancy, according to the results of Kulkarni et al.[9]. Another assumption that could explain this difference in proportion is that in Ontario, 17/53 cases of WNV infection reported in 2013 had an unknown clinical status7
The data currently available is inadequate to meet all of the objectives of human surveillance established by the Groupe d’experts scientifiques sur le VNO [WNV scientific expert panel on WNV][28], objectives such as, for example, documenting the risk factors associated with severe
, which could be due to a lack of information on the case (personal communication with Curtis Russel). This could lead to an overestimation of the difference in proportion between Québec and Ontario if a large proportion of these 17 cases were neurological. Lastly, in the absence of data on the genotype(s) of the WNV strains circulating in Québec, we cannot make an assumption that there is a more virulent strain in Québec (resulting in more severe cases). More information in this regard would allow us to more accurately compare the Québec situation with the situation in the other provinces. A study on the genotyping of strains of WNV isolated in Québec by second-generation sequencing is being prepared. This project is led by the LSPQ and is being carried out in collaboration with the MAPAQ and the National Microbiology Laboratory (NML)[27].
7 http://www.phac-aspc.gc.ca/wnv-vwn/mon-hmnsurv-eng.php.

West Nile Virus Infection Surveillance in Québec: 2013 Season
28 Institut national de santé publique du Québec
forms of WNV infection. Medical history information should be integrated into the SIDVS-VNO for the 2014 season.
As concerns entomological surveillance, the absence of an enriched subsampling during the 2013 season likely reduced the system’s sensitivity for detecting the positive pools reported and consequently, led to an underestimation of the infection rate and of the VI of the vector. Enriched subsampling consists of removing specimens of the target species (Culex pipiens/restuans) from the large sample sizes that are subsampled. This procedure would allow us to increase the number of specimens tested, and therefore increase WNV detection sensitivity in mosquitoes.
Mosquito abundance and WNV amplification are largely influenced by weather conditions and by the application of larvicide early in the season. However, the absence of historical data in this regard limits the possibility of assessing the impact of these factors.
Entomological surveillance was carried out primarily in the areas where WNV activity had previously been documented. This could bias the entomological surveillance, since the presence of positive mosquitoes in areas other than the areas of surveillance is not identified. However, this bias is not very likely to be significant. In fact, the number of human cases in a region is closely related to the presence of infected mosquitoes. Infected mosquitoes may circulate in regions in the periphery of the regions historically affected, but the abundance of these is likely to be low.
The methodology used for weather monitoring (monitoring degree-days above the threshold for WNV amplification in mosquitoes) is an adaptation from a study carried out in California[29], where the primary WNV vector (Culex tarsalis) is a different species than the one observed in Québec (Culex pipiens/restuans). The climate of these two regions is also different. Thus, weather monitoring was used only on an exploratory basis, since this method had not been validated specifically for Québec. Moreover, monitoring was done from only one station, the McTavish station in downtown Montréal, which is not representative of the variations in temperature throughout Québec. However, choosing to use just one station enabled us to monitor the evolution of degree-days over the course of the season and in comparison with the previous years. Also, of course, weather factors vary locally, but in order to map them on a daily basis, a complex system of analysis must be implemented.
Lastly, the animal surveillance data is limited because, in particular, several suspicious cases of horses presenting nervous signs in keeping with WNV infection were not reported. Moreover, some horses are vaccinated against WNV. Wild birds are the subject of passive surveillance by the CQSAS as part of avian flu surveillance. The criteria for collecting dead birds reported in this context are therefore not optimal for WNV surveillance.

West Nile Virus Infection Surveillance in Québec: 2013 Season
Institut national de santé publique du Québec 29
Conclusions and recommendations
WNV is endemic in Québec. Since 2011, there has been an upsurge in the number of cases of WNV infection. The reduction observed during the 2013 season could be explained by weather conditions that were less favourable for the amplification of the virus in the vector and by the early application of larvicide at the start of the season. However, other biological and environmental factors may also have contributed. Research efforts to better identify these factors and their impact on the epidemiology of the virus would therefore be useful to better anticipate the risk of transmission to humans.
The results of this report indicate that entomological surveillance data are probably an early indicator of viral activity in a given geographic area, enabling us to identify potential risk of transmission to humans. This therefore suggests that it is important to continue this surveillance in time and in space (with fixed traps). This is important not only to get a long-term entomological picture, but also to establish a threshold for the VI that within a few years would enable us to identify an abnormal increase in the number of cases of WNV infection during the season. The availability of longitudinal entomological data and data on human cases of WNV infection would be part of a body of information enabling us to estimate the risk of WNV infection and to monitor its evolution during the season. Predictive models could possibly be developed to assess the risk of transmission to humans. This would require using a standard method for collecting mosquitoes, a sufficient number of fixed traps and the mosquitoes collected would have to be screened for WNV within a short time.
The number of human cases of WNV infection is underestimated, even for neurological cases. Improving health care professionals’ awareness regarding the importance of testing suspicious cases could improve the sensitivity of the surveillance system. This could be done through a continuing education program on WNV and its diagnosis for clinical practitioners.
In order to better document the true incidence of human cases, the demographic distribution of all cases, and to confirm the risk factors for WNV infection, seroprevalence studies (prevalence of anti-WNV antibodies) in a representative sample of the general population could be carried out. Data from Héma-Québec on the active surveillance of WNV infection in blood donors could be an interesting source for a potential project.
Lastly, an awareness campaign aimed at the general public should be conducted again during the 2014 season, but starting earlier, taking into account the WNV incubation period in humans.


West Nile Virus Infection Surveillance in Québec: 2013 Season
Institut national de santé publique du Québec 31
References
1. Ministère de la Santé et des Services sociaux du Québec, Ministère. Plan d'intervention gouvernemental 2013-2015 pour la protection de la population contre le virus du Nil occidental. 1-29. 2013. Government of Québec.
2. Groupe d'experts scientifiques sur le virus du Nil occidental (VNO): Analysis Plan: Integrated West Nile Virus Surveillance. 9999.
3. Institut national de santé publique du Québec: Bulletin de surveillance du virus du Nil occidental. Bilan 2013. Semaine de surveillance 44 (27 octobre au 2 novembre 2013). Volume 1, number 14. 2013.
4. Public Health Agency of Canada: West Nile Virus, National Surveillance Report. Report week 46 and 47, 2013. Cases reported as of November 23, 2013. 2014.
5. Petersen, L.R., Brault, A.C., Nasci, R.S.: West Nile virus: review of the literature. JAMA. 2013; 310:308-315.
6. Zou, S., Foster, G.A., Dodd, R.Y., Petersen, L.R., Stramer, S.L.: West Nile fever characteristics among viremic persons identified through blood donor screening. J Infect Dis. 2010; 202:1354-1361.
7. Carson, P.J., Borchardt, S.M., Custer, B., Prince, H.E., Dunn-Williams, J., Winkelman, V., Tobler, L., Biggerstaff, B.J., Lanciotti, R., Petersen, L.R. et al.: Neuroinvasive disease and West Nile virus infection, North Dakota, USA, 1999-2008. Emerg Infect Dis. 2012; 18:684-686.
8. Mostashari, F., Bunning, M.L., Kitsutani, P.T., Singer, D.A., Nash, D., Cooper, M.J., Katz, N., Liljebjelke, K.A., Biggerstaff, B.J., Fine, A.D. et al.: Epidemic West Nile encephalitis, New York, 1999: results of a household-based seroepidemiological survey. The Lancet. 2001; 358:261-264.
9. Kulkarni, M.A., Lecocq, A.C., Artsob. H., Drebot, M.A., Ogden, N.H.: Epidemiology and aetiology of encephalitis in Canada, 1994-2008: a case for undiagnosed arboviral agents? Epidemiol Infect. 2013; 141:2243-2255.
10. Petersen, L.R., Carson, P.J., Biggerstaff, B.J., Custer, B., Borchardt, S.M., Busch, M.P.: Estimated cumulative incidence of West Nile virus infection in US adults, 1999-2010. Epidemiol Infect. 2012;1-5.
11. Lindsey, N.P., Staples, J.E., Lehman, J.A., Fischer, M.: Surveillance for human West Nile virus disease - United States, 1999-2008. MMWR Surveill Summ. 2010; 59:1-17.
12. Lindsey, N.P., Staples, J.E., Lehman, J.A., Fischer, M.: Medical risk factors for severe West Nile Virus disease, United States, 2008-2010. Am J Trop Med Hyg. 2012; 87:179-184.
13. Bode, A.V., Sejvar, J.J., Pape, W.J., Campbell, G.L., Marfin, A.A.: West Nile virus disease: a descriptive study of 228 patients hospitalized in a 4-county region of Colorado in 2003. Clin Infect Dis. 2006; 42:1234-1240.
14. Baker, S.L., Yan, N.D.: Accumulated organic debris in catch basins improves the efficacy of S-methoprene against mosquitoes in Toronto, Ontario, Canada. Journal of the American Mosquito Control Association. 2010; 26:172-182.
West Nile Virus Infection Surveillance in Québec: 2013 Season
32 Institut national de santé publique du Québec
15. Stockwell, P.J., Wessell, N., Reed, D.R., Kronenwetter-Koepel, T.A., Reed, K.D., Turchi, T.R., Meece, J.K.: A field evaluation of four larval mosquito control methods in urban catch basins. J Am Mosq Control Assoc. 2006; 22:666-671.
16. Trudel, R., Leclerc, L., Souto-Neveu, M.: Rapport des travaux d'application de larvicides en prévention (saison 2013) : volet contrôle vectoriel du plan d'intervention gouvernemental contre le virus du Nil occidental. 2013.
17. Palmisano, C.T., Taylor, V., Caillouet, K., Byrd, B., Wesson, D.M.: Impact of West Nile virus outbreak upon St. Tammany Parish Mosquito Abatement District. J Am Mosq Control Assoc. 2005; 21:33-38.
18. Tedesco, C., Ruiz, M., McLafferty, S.: Mosquito politics: local vector control policies and the spread of West Nile Virus in the Chicago region. Health Place. 2010; 16:1188-1195.
19. Chuang, T.W., Ionides, E.L., Knepper, R.G., Stanuszek, W.W., Walker, E.D., Wilson, M.L.: Cross-correlation map analyses show weather variation influences on mosquito abundance patterns in Saginaw County, Michigan, 1989-2005. J Med Entomol. 2012; 49:851-858.
20. Paz, S., Malkinson, D., Green, M.S., Tsioni, G., Papa, A., Danis, K., Sirbu, A., Ceianu, C., Katalin, K., Ferenczi, E. et al.: Permissive summer temperatures of the 2010 European West Nile fever upsurge. PLoS One. 2013; 8:e56398.
21. Ruiz, M.O., Chaves, L.F., Hamer, G.L., Sun, T., Brown, W.M., Walker, E.D., Haramis, L., Goldberg, T.L., Kitron, U.D.: Local impact of temperature and precipitation on West Nile virus infection in Culex species mosquitoes in northeast Illinois, USA. Parasite Vectors. 2010; 3:19.
22. Chung, W.M., Buseman, C.M., Joyner, S.N., Hughes, S.M., Fomby, T.B., Luby, J.P., Haley, R.W.: The 2012 West Nile encephalitis epidemic in Dallas, Texas. JAMA. 2013; 310:297-307.
23. Bolling, B.G., Barker, C.M., Moore, C.G., Pape, W.J., Eisen, L.: Seasonal patterns for entomological measures of risk for exposure to Culex vectors and West Nile virus in relation to human disease cases in northeastern Colorado. J Med Entomol. 2009; 46:1519-1531.
24. Colborn, J.M., Smith, K.A., Townsend, J., Damian, D., Nasci, R.S., Mutebi, J.P.: West Nile virus outbreak in Phoenix, Arizona--2010: entomological observations and epidemiological correlations. J Am Mosq Control Assoc. 2013; 29:123-132.
25. Jones, R.C., Weaver, K.N., Smith, S., Blanco, C., Flores, C., Gibbs, K., Markowski, D., Mutebi, J.P.: Use of the vector index and geographic information system to prospectively inform West Nile virus interventions. J Am Mosq Control Assoc. 2011; 27:315-319.
26. Kilpatrick, A.M., Pape, W.J.: Predicting human West Nile virus infections with mosquito surveillance data. Am J Epidemiol. 2013; 178:829-835.
27. Institut national de santé publique du Québec: Le risque relié au virus du Nil occidental au Québec et les interventions à privilégier en 2013-Addenda pour soutenir la gestion du risque en 2014 (underway). 2014.
28. Groupe d'experts scientifiques sur le virus du Nil occidental. Analysis Plan - Integrated West Nile Virus Surveillance (working document). 1-11. 9999. Institut national de santé publique du Québec.
29. Reisen, W.K., Fang, Y., Martinez, V.M.: Effects of temperature on the transmission of West Nile virus by Culex tarsalis (Diptera: Culicidae). J Med Entomol. 2006; 43:309-317.
Appendix 1
Culex pipiens/restuans abundance, infection rate, and vector index, by health region, Québec, 2013

West Nile Virus Infection Surveillance in Québec: 2013 Season
Institut national de santé publique du Québec 35
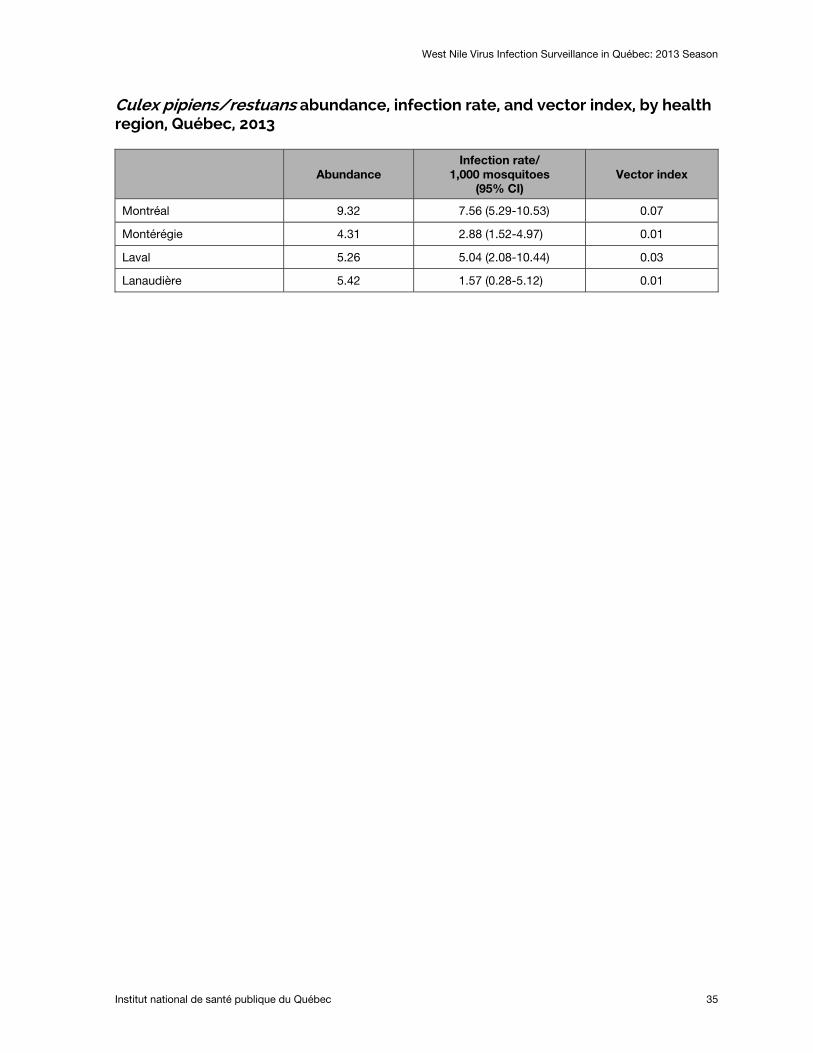
Culex pipiens/restuans abundance, infection rate, and vector index, by health region, Québec, 2013
Abundance Infection rate/
1,000 mosquitoes (95% CI)
Vector index
Montréal 9.32 7.56 (5.29-10.53) 0.07
Montérégie 4.31 2.88 (1.52-4.97) 0.01
Laval 5.26 5.04 (2.08-10.44) 0.03
Lanaudière 5.42 1.57 (0.28-5.12) 0.01


Appendix 2
Number of reported human cases of WNV infection and percentage of neurological cases

West Nile Virus Infection Surveillance in Québec: 2013 Season
Institut national de santé publique du Québec 39
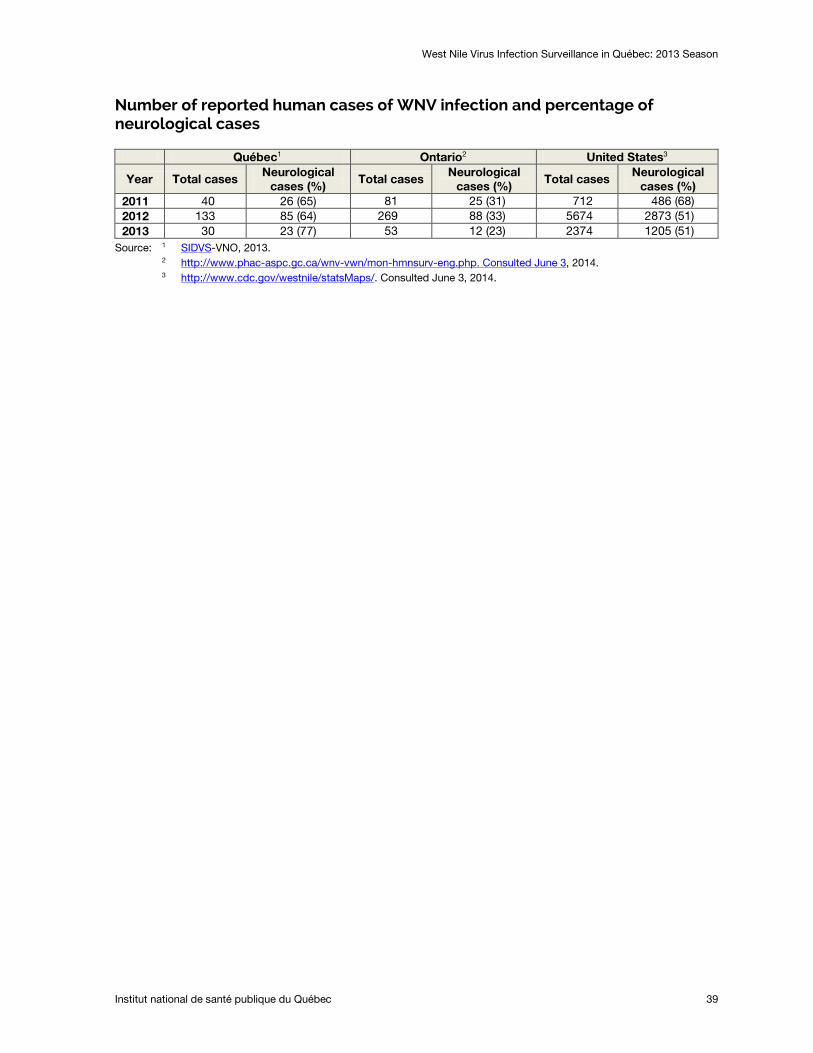
Number of reported human cases of WNV infection and percentage of neurological cases
Québec1 Ontario2 United States3
Year Total cases Neurological cases (%)
Total cases Neurological cases (%)
Total cases Neurological cases (%)
2011 40 26 (65) 81 25 (31) 712 486 (68) 2012 133 85 (64) 269 88 (33) 5674 2873 (51) 2013 30 23 (77) 53 12 (23) 2374 1205 (51)
Source: 1 SIDVS2
-VNO, 2013. http://www.phac-aspc.gc.ca/wnv-vwn/mon-hmnsurv-eng.php. Consulted June 3, 2014.
3 http://www.cdc.gov/westnile/statsMaps/. Consulted June 3, 2014.

Publication N°: 1967

Centre d’expertise et de référence
www.inspq.qc.ca
Related Documents