West London Alliance Skills Demand Analysis: Technical report and summary Report prepared for: Ealing Council on behalf of the West London Alliance Boroughs By: Economic Modelling Specialists International (Emsi) August 2016

Welcome message from author
This document is posted to help you gain knowledge. Please leave a comment to let me know what you think about it! Share it to your friends and learn new things together.
Transcript

WestLondonAllianceSkillsDemandAnalysis:Technicalreportandsummary Report prepared for: Ealing Council on behalf of the West London Alliance Boroughs
By: Economic Modelling Specialists International (Emsi)
August 2016

Emsi:SkillsDemandAnalysisWestLondonAlliance
EconomicModellingSpecialistsInt.www.economicmodelling.co.uk
2
ContentsExecutivesummary......................................................................................................................................3
Occupations..............................................................................................................................................5
Skills..........................................................................................................................................................6
Conclusionsandrecommendations.........................................................................................................8
Industrytables..............................................................................................................................................9
Occupationtables......................................................................................................................................22
Skills–WestLondon..................................................................................................................................35
Skills–AreaofEconomicInterest..............................................................................................................38
TechnicalAppendix....................................................................................................................................40
Backgroundtotheresearch...................................................................................................................40
Aimsandobjectives...............................................................................................................................40
Methodology..........................................................................................................................................41
Studygeography.....................................................................................................................................43
AboutEmsiandEmsi’sUKdata..............................................................................................................46
ComparingEmsiandUKCES(WorkingFutures)data.............................................................................47

Emsi:SkillsDemandAnalysisWestLondonAlliance
EconomicModellingSpecialistsInt.www.economicmodelling.co.uk
3
Executivesummary- Inthefastchangingeconomicandsocialenvironmenttheyoperatein,FurtherEducation
collegesarefacingincreasingchallengesintheireffortstoidentifyandquantifycourseneedsfor
localresidentsandbusinesses.
- TheAreaBasedReviewsofPost-16EducationandTrainingprovidershavesetinmotionastrong
impetustoestablishfinanciallyresilienteducationinstitutionsthatofferhighqualityeducation
andtrainingbasedontheneedsoflearnersandemployerswithintheirlocalarea.
- TheprospectofdevolvedskillsfundinghighlightsagrowingneedforLocalAuthoritiestowork
withcolleges,employersandlocalstrategicpartnerstoarticulatedemandandplanfortheskills
theircommunitiesandeconomieswillneed,notonlyasapartofAreaReview,butaspartofan
ongoingplanningcycle.
- Thisresearchanalysesthecomponentsoflabourmarketdemandintermsofthekeyregional
industriesandoccupationsandbuildstowardsaskillsconclusionthatclearlyidentifiesthe
SectorSubjectAreasmostlikelytoservetheskillsneedsoftheWLAeconomy.
Figure1:SkillsDemandAnalysis
- TheWestLondonAlliance(WLA)region’semploymentisdominatedbyanumberofkey
industries,whichaccountedforabout60%ofemploymentin2015andtheyareforecastto
experiencegrowthinthecomingyears(to2022).TheyincludeWholesaleandRetail,Transport
andStorage,AdministrativeandSupportServices,HumanHealthandSocialWorkActivities
andProfessional,ScientificandTechnicalActivities.

Emsi:SkillsDemandAnalysisWestLondonAlliance
EconomicModellingSpecialistsInt.www.economicmodelling.co.uk
4
- Detailedanalysisrevealsthatthetop15(SIC4)industriesaccountforover35%oftotal
employment(2015),amongthemarePassengerAirTransport,RestaurantsandMobileFood
Services,HospitalActivities,ComputerConsultancyandTelevisionBroadcastingand
ProgrammingActivities.
- AccordingtoEmsi,theWLAeconomyaddedapproximately108,000jobsbetween2010and
2015andisforecasttoexpandbyafurther52,000jobs(netgrowth)between2015and2022.
Headline(SIC1)industryemploymenttrendsshowsignificantgrowthvolumesinProfessional,
ScientificandTechnicalActivities(+10,339),andAccommodationandFoodServiceActivities
(+8,027).
- Thetop5growthindustriesareforecasttoaccountforover75%oftotalemploymentgrowthin
theWLAregion,whilemoredetailedindustry(SIC4)analysisrevealsthatsmallerindustriessuch
ascomputerprogrammingarealsosettoexperiencehigherratesofgrowth,albeitbasedon
smallernumbers.
- EmploymentinTransportationandStorageshowshighlevelsofconcentrationinWestLondon
withmorethantwicetheexpectedlevelcomparedtothenationalaverage.Highconcentrations
inspecificindustriessuchasPassengerAirTransportation,AirTransportationServiceActivities
andCargoHandlingcontributetothistrend.
- InformationandCommunicationindustryemploymentisalsohighlyconcentratedinWest
London,withTelevisionBroadcastingandProgramming;MotionPicture,VideoandTV
ProgrammingandDistribution;andPublishing(ofbothcomputergamesandmusicrecording)
beingprominentinthelocaleconomy.
- IndustrieswithhigherearningslevelshavethepotentialtodrivewealthcreationintheWLA
region.TheseincludeFinancialandInsuranceActivities,InformationandCommunicationand
ProfessionalandScientificActivities.DetailedanalysisrevealshigheraveragewagesinFreight
transportation(AiraswellasSeatransportation),Softwarepublishing,Telecom’s,Market
ResearchandOpinionPollingandITandcomputerservicesactivities.However,thetop(SIC4)
industriesbywageintheWLAregionaccountforlessthan2%ofemploymentin2015.
- Consistentwiththearea’sindustrialstrengthsandspecialisms,qualitativeanalysissuggeststhat
theplanneddevelopmentsandinvestmentintheWLAeconomywillhaveaninitialimpactand
stimulateskillsdemandinindustriessuchasconstructionandengineering,humanhealth,
passengertransport(e.g.aviation,rail)andlogistics(freight,warehousingactivities),with
furthertrickle-downeffectsinanumberofsecondaryareassuchashospitalityandretail,
education,andfoodmanufacturing.

Emsi:SkillsDemandAnalysisWestLondonAlliance
EconomicModellingSpecialistsInt.www.economicmodelling.co.uk
5
Occupations
- AnalysisofthekeyoccupationsintheWLAeconomyrevealsthosethataredrivingsomeof
theseindustryemploymenttrendsandprovidesaninsightintothenatureofskillsdemandin
theregion.
- EmploymentsharebyoccupationshowsthattheWLAregionisdominatedbyanumberofkey
(SOC2)occupationgroupsin2015.TheyincludeElementaryAdministrationandService
Occupations,BusinessandPublicServiceAssociateProfessionals,AdministrativeOccupations,
CorporateManagersandDirectors,andSalesOccupations.
- Theseoccupationsaccountfor45%ofemployment(2015).TogetherwithCaringPersonal
ServiceOccupationstheyareexpectedtoexperiencesignificantgrowthbetween2015and
2022.
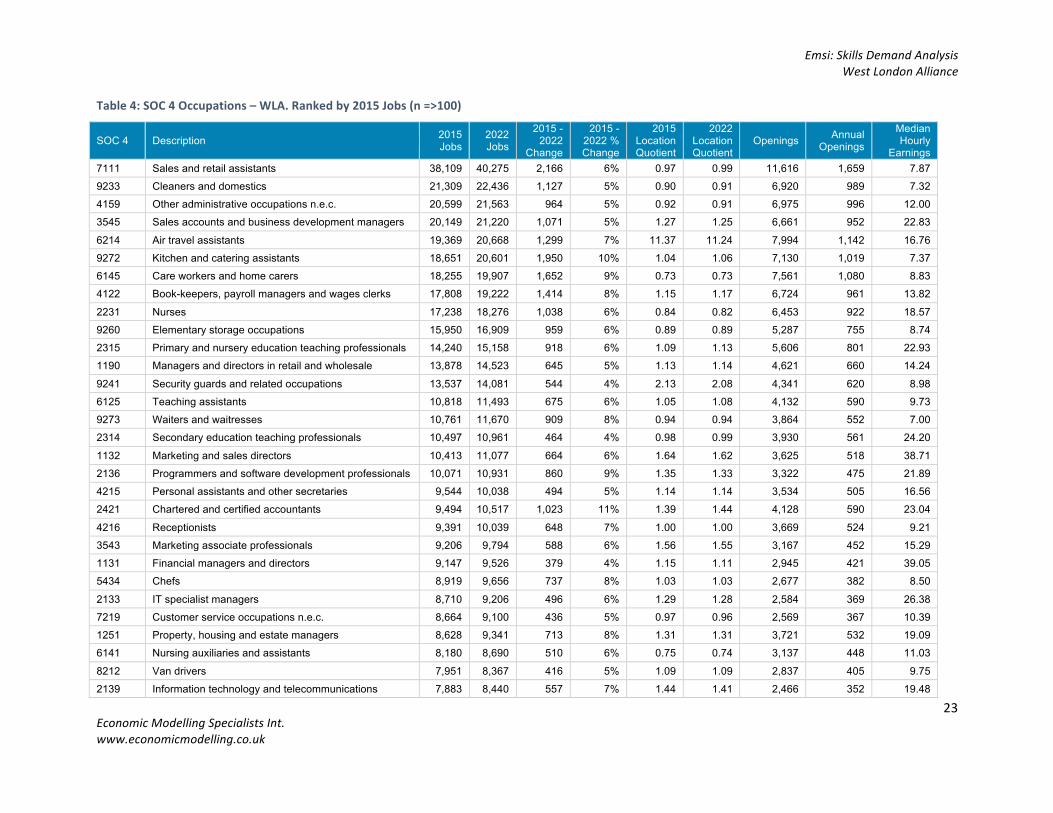
- Atamoredetailed(SOC4)leveltheprominentoccupationsincludeSalesandretailassistants,
Cleanersanddomestics,Salesaccountsandbusinessdevelopmentmanagers,Airtravel
assistantsaswellasKitchenandcateringassistants.Thetop15(SOC4)occupations(3%ofthe
totalnumberofoccupationsfoundintheWestLondoneconomy)accountforoverathird(35%)
oftotalemployment.
- Whilegrowthislargelyexpectedtocomefromoccupationswithhigheremploymentvolumes,
someoccupationsexperiencingsmallerabsolutegrowth,likeCharteredandCertified
Accountants,ProgrammersandSoftwareDevelopmentprofessionals,andChefsare
nonethelesssettoexperiencerelativelyhighgrowthratesinthecomingyears,creatingfuture
skillsdemand.
- AnnualOpeningsfigurestakeaccountofbothgrowthandreplacementdemandfor
occupations,andhelptoidentifyoccupationsprojectedtobemostin-demandeachyearupto
2022.Importantly,theyprovidethemostappropriatemeasureagainstwhichtomapskills
demand,recognisingtheneedtoreplacestaff(labourturnover)aswellasemploymentgrowth.
- Itisforecastthatineachyearbetween2015and2022,theWLAeconomywillcreate46,000
AnnualOpenings.Around44%ofAnnualOpeningsareexpectedtobeinoccupationswith
higheroverallemploymentvolumes,suchasElementaryAdministrationandService
Occupations,BusinessandPublicServiceAssociateProfessionals,AdministrativeOccupations,CorporateManagersandDirectors,andCaringPersonalServiceOccupations.

Emsi:SkillsDemandAnalysisWestLondonAlliance
EconomicModellingSpecialistsInt.www.economicmodelling.co.uk
6
Skills
- Understandingthealignmentbetweencoursedisciplinesandthelocaleconomy’spotentialskills
needsishelpfulinensuringthattheeducationalfocusofcollegesandprovidersworksinparallel
withtheoccupationalrequirementsofthelocaleconomy.
- EveryaccreditedFurtherEducationqualificationiscategorisedintoaSectorSubjectArea(SSA)
thatgroupsqualificationsintocategoriesbasedonthetypesofskillsandjobsthequalification
trainsfor.MappingeverySOC4-digitoccupationtoeachoftheSSAcategoriesenablesusto
translatelabourmarkettrendsintoSSAgroupingsandthereforedescribeskillsdemandin
termsrelevanttothequalificationssystem.
- BasedonthismappingwecanidentifywhichSSAcategorieshavegreatestdemandintermsof
AnnualOpeningsintheWestLondoneconomy.Thetop5categorieswithgreatestdemandare:
o 153BusinessManagement
o 154MarketingandSales
o 152Administration
o 014PublicServices
o 013HealthandSocialCare
Together,thesecategoriesaccountfor70%ofAnnualOpeningsintheWLAregion.
- IntheAreaofEconomicInterest,whichincludescentralLondon,theSSAcategorieswith
greatestdemand(AnnualOpenings)areverysimilartoWestLondon.Thetop5categorieswith
greatestdemandare:
o 153BusinessManagement
o 154MarketingandSales
o 151AccountingandFinance
o 152Administration
o 014PublicServices
ThenotabledifferenceisthatAccountingandFinanceranksasthethirdhighestSSAcategory,
displacingHealthandSocialCare,whichranksseventhintheAreaofEconomicInterest.
- AswellasidentifyingtheAnnualOpeningsforeachsubjectarea,itisalsousefultounderstand
theeducationlevelthatmayberequired.Themappingenablesustoapplyahighest
qualificationlevelprofilebySSA(Tier2)tohelpassesstheappropriateeducationlevelto
deliver.ThisisdonebyusingnationalLabourForceSurveydataon‘highestqualificationheld’by
occupation,thencreatingaqualificationprofileforeachSSA.
- Basedontheprofile,somesubjectareasmayrequirepredominantlyhigherlevelqualifications
(e.g.teaching),whileothersmightrequireaspectrumofeducationprovisionatmultiplelevels,
(e.g.marketingandsales).

Emsi:SkillsDemandAnalysisWestLondonAlliance
EconomicModellingSpecialistsInt.www.economicmodelling.co.uk
7
- UsingBusinessManagementasanexampleinWestLondon,5,133or60%ofAnnualOpenings
inthissubjectarea,maptoaLevel6orhigherqualificationinWestLondon.Thisrisesto81%at
Level6oraboveforTeachingandLecturing(1,982AnnualOpenings).Thesupportingchartsand
tablesprovidemoredetailedinformation.
- ApplyingthequalificationprofiletothetotalnumberofAnnualOpeningsforeachSSAprovides
anindicationofthevolumesthatmightbeassociatedwitheachSSAbyeducationLevel.These
areexperimentalstatisticsproducedasaguide.However,theinformationprovidedbythe
analysiscanhelpinformtheWLA’sconversationwithcollegesaboutfutureskillsprovisionnot
onlyintermsoflikelyvolumes,butalsotheeducationleveltodeliver,andprovidethebasisfor
furtheranalysis.

Emsi:SkillsDemandAnalysisWestLondonAlliance
EconomicModellingSpecialistsInt.www.economicmodelling.co.uk
8
Conclusionsandrecommendations
- WhatemergesintheWLAregionareclearlinkagesbetweensignificantorgrowingindustries
andoccupations,planneddevelopmentsandstrategicpriorities,andtheskillsrequiredto
servicetheWLAregion’seconomicgrowthandaspirationsforthefuture.Itishopedthatthe
SkillsDemandAnalysisformsthebasisoffurtherconversationswithcollegesabouthow
provisioncanmeetskillsdemandinthecomingyears.
- Whiletheresearchisnecessarilylimitedtoademand-sideassessment,mappingtoSSAisatried
andtestedmeansofassessingthesuitabilityofeducationprovisionvis-à-visthelabourmarket,
andrepresentstheinitialstep–oracrosswalk-formatchinglabourmarketdemandtothe
supplyoflearnersfromtheeducationsystem.
- Itisrecommendedthatoncelearnerrecordsdatahasbeenacquiredfortheregion,agap
analysisshouldbeundertakentohighlightareasofoverandundersupplyrelativetolabour
market,andwouldtaketheanalysistothenextlevelandprovideadditionalfocusforthe
conversationswithcolleges.
- TheresultoftherecentEUreferendumandtheUK’sdecisiontoleavetheEuropeanUniondoes
nothaveanysignificantimpactontheshorttermview,butemphasisesthelimitationsof
economicforecastingoverextendedtimeperiodsandtheimportantneedtoreviewthese
forecastsperiodicallywhenthinkingaboutfutureskillsdemand.
- Wecannotsaywithanycertaintywhattheimpactof‘Brexit’willbe,notleastbecausetheterms
oftheUK’sexitandnewtradearrangementsareyettobeagreed.Changesintheeconomyat
anindustryandoccupationallevelwilltaketimetoemergeinofficialdatasources,butasand
whenthisdatabecomesavailable,itwillfeedintorevisedeconomicforecasts.
- Intheinterim,itmaybereasonabletoassesswhichplanneddevelopmentsandinvestmentsin
WestLondonmaybeatrisk,andwhichsectorshavemosttradeexposuretotheEUSingle
Marketandarelikelytobeaffectedbytradebarriers(examplesinLondonmightinclude
constructionandfinancialservices).
- Itispossibletodevelopa"riskprofile"foranareabasedondifferentscenariosofSingleMarket
access,inordertoseetheprofileofindustrieslikelytobeaffectedbyBrexit,eitherbecauseof
exportrestrictionsordependenceonmigrantlabour,andtheimplicationsforskillsdemandin
theseindustries.
- Anyrestrictiononfreemovementandtighteningofmigration,forexample,islikelytoincrease
theneedforresidenttalent,placingtheonusoneconomicdeveloperstomakebestuseof
availableworkforces,andtosharpentheincentivesforpeopletodeveloptheirskills.

Emsi:SkillsDemandAnalysisWestLondonAlliance
EconomicModellingSpecialistsInt.www.economicmodelling.co.uk
9
IndustrytablesTable1:SIC1Industries-WLA
SIC-1 Description 2015 Jobs
2022 Jobs
2015 - 2022
Change
2015 - 2022 % Change
2015 Location Quotient
2022 Location Quotient
Average Earnings
A AGRICULTURE, FORESTRY AND FISHING 211 169 -42 -20% 0.02 0.01 £19,967
B MINING AND QUARRYING 1,415 1,450 35 2% 0.67 0.70 £71,193 C MANUFACTURING 41,084 39,219 -1,865 -5% 0.53 0.53 £27,816
D ELECTRICITY, GAS, STEAM AND AIR CONDITIONING SUPPLY 635 585 -50 -8% 0.18 0.16 £41,858
E WATER SUPPLY; SEWERAGE, WASTE MANAGEMENT AND REMEDIATION ACTIVITIES 4,121 4,687 566 14% 0.66 0.69 £42,191
F CONSTRUCTION 35,692 40,291 4,599 13% 0.79 0.77 £32,373
G WHOLESALE AND RETAIL TRADE; REPAIR OF MOTOR VEHICLES AND MOTORCYCLES 157,841 164,463 6,622 4% 1.06 1.06 £24,908
H TRANSPORTATION AND STORAGE 99,956 106,508 6,552 7% 2.39 2.36 £36,251 I ACCOMMODATION AND FOOD SERVICE ACTIVITIES 61,495 69,522 8,027 13% 0.90 0.92 £15,987 J INFORMATION AND COMMUNICATION 72,195 76,032 3,837 5% 1.91 1.83 £47,862 K FINANCIAL AND INSURANCE ACTIVITIES 12,268 12,465 197 2% 0.36 0.34 £57,491
L REAL ESTATE ACTIVITIES 20,429 19,618 -811 -4% 1.19 1.07 £29,921 M PROFESSIONAL, SCIENTIFIC AND TECHNICAL ACTIVITIES 91,403 101,802 10,399 11% 1.14 1.16 £35,358 N ADMINISTRATIVE AND SUPPORT SERVICE ACTIVITIES 99,874 104,645 4,771 5% 1.24 1.22 £19,522
O PUBLIC ADMINISTRATION AND DEFENCE; COMPULSORY SOCIAL SECURITY 31,442 28,263 -3,179 -10% 0.78 0.70 £38,360
P EDUCATION 77,870 79,913 2,043 3% 0.93 0.96 £28,255 Q HUMAN HEALTH AND SOCIAL WORK ACTIVITIES 96,092 103,896 7,804 8% 0.78 0.77 £30,862
R ARTS, ENTERTAINMENT AND RECREATION 24,394 26,201 1,807 7% 1.03 1.05 £22,838 S OTHER SERVICE ACTIVITIES 17,043 17,815 772 5% 0.90 0.88 £25,697
945,459 997,544 52,085 6% £30,104

Emsi:SkillsDemandAnalysisWestLondonAlliance
EconomicModellingSpecialistsInt.www.economicmodelling.co.uk
10
Table2:SIC4Industries–WLA.Rankedby2015Jobs(n>100).
SIC-4 Description 2015 Jobs
2022 Jobs
2015 - 2022
Change
2015 - 2022 % Change
2015 Location Quotient
2022 Location Quotient
Averagel Earnings
8520 Primary education 36,940 38,689 1,749 5% 1.14 1.20 £27,302 5110 Passenger air transport 35,570 38,265 2,695 8% 15.88 15.75 £40,661
8610 Hospital activities 33,289 35,450 2,161 6% 0.73 0.71 £45,624 8400 Public administration and defence; compulsory social security 31,442 28,263 -3,179 -10% 0.78 0.70 £38,360 5610 Restaurants and mobile food service activities 29,852 34,866 5,014 17% 1.04 1.06 £16,161
4711 Retail sale in non-specialised stores with food, beverages or tobacco predominating 28,318 30,144 1,826 6% 0.84 0.86 £13,801
7820 Temporary employment agency activities 24,737 25,189 452 2% 1.00 0.93 £16,101 8531 General secondary education 18,959 19,485 526 3% 0.95 0.98 £30,041
7010 Activities of head offices 17,873 21,177 3,304 18% 2.01 2.06 £45,121 6020 Television programming and broadcasting activities 16,912 17,048 136 1% 18.35 17.54 £45,845 6202 Computer consultancy activities 16,756 18,755 1,999 12% 1.50 1.49 £49,856 6920 Accounting, bookkeeping and auditing activities; tax consultancy 15,049 18,415 3,366 22% 1.41 1.58 £23,057
7022 Business and other management consultancy activities 15,023 16,429 1,406 9% 0.97 0.92 £30,135 8121 General cleaning of buildings 14,130 14,635 505 4% 1.13 1.17 £9,205 8299 Other business support service activities n.e.c. 13,614 15,168 1,554 11% 1.76 1.87 £19,057 5223 Service activities incidental to air transportation 13,263 14,469 1,206 9% 8.36 8.43 £49,914
8010 Private security activities 12,681 13,134 453 4% 2.17 2.08 £25,964 4771 Retail sale of clothing in specialised stores 11,538 11,677 139 1% 1.02 1.01 £13,572 4120 Construction of residential and non-residential buildings 10,750 12,508 1,758 16% 0.96 1.03 £32,428 8690 Other human health activities 10,618 11,852 1,234 12% 0.88 0.88 £38,578
5629 Other food service activities 10,332 13,596 3,264 32% 2.34 2.34 £10,067 4931 Urban and suburban passenger land transport 10,247 10,972 725 7% 2.26 2.26 £24,807 8899 Other social work activities without accommodation n.e.c. 9,964 9,819 -145 -1% 0.70 0.67 £18,071 8810 Social work activities without accommodation for the elderly and disabled 9,447 11,068 1,621 17% 1.02 1.07 £15,701
6820 Renting and operating of own or leased real estate 8,989 8,767 -222 -2% 1.02 0.93 £27,546 4719 Other retail sale in non-specialised stores 8,741 9,549 808 9% 1.06 1.08 £13,953 7810 Activities of employment placement agencies 8,025 8,061 36 0% 1.86 1.83 £21,104 6201 Computer programming activities 7,702 9,118 1,416 18% 1.54 1.57 £38,789

Emsi:SkillsDemandAnalysisWestLondonAlliance
EconomicModellingSpecialistsInt.www.economicmodelling.co.uk
11
SIC-4 Description 2015 Jobs
2022 Jobs
2015 - 2022
Change
2015 - 2022 % Change
2015 Location Quotient
2022 Location Quotient
Averagel Earnings
5911 Motion picture, video and television programme production activities 7,615 6,705 -910 -12% 4.09 3.50 £42,425
7112 Engineering activities and related technical consultancy 7,537 7,027 -510 -7% 0.60 0.55 £53,954 5510 Hotels and similar accommodation 7,507 8,150 643 9% 0.64 0.68 £20,559 5229 Other transportation support activities 7,498 8,350 852 11% 3.57 3.74 £43,537 8110 Combined facilities support activities 7,454 8,531 1,077 14% 1.36 1.37 £19,076
8621 General medical practice activities 6,820 7,330 510 7% 0.87 0.86 £22,177 5630 Beverage serving activities 6,801 7,196 395 6% 0.40 0.39 £19,072 6910 Legal activities 6,647 7,570 923 14% 0.65 0.70 £21,450 8710 Residential nursing care activities 6,594 7,024 430 7% 0.98 0.96 £22,572
6600 Activities auxiliary to financial services and insurance activities 6,531 7,360 829 13% 0.45 0.46 £53,638 5310 Postal activities under universal service obligation 6,479 7,188 709 11% 1.28 1.29 £31,891 8542 Tertiary education 6,410 6,454 44 1% 0.47 0.47 £36,676 5621 Event catering activities 6,400 5,025 -1,375 -21% 1.70 1.59 £15,639
6831 Real estate agencies 6,399 6,185 -214 -3% 1.31 1.19 £26,652 8559 Other education n.e.c. 6,336 6,331 -5 -0% 0.93 0.90 £24,574 7320 Market research and public opinion polling 5,775 6,436 661 11% 3.62 3.83 £55,915 4520 Maintenance and repair of motor vehicles 5,640 5,798 158 3% 0.77 0.77 £29,028
6400 Financial service activities, except insurance and pension funding 5,567 4,968 -599 -11% 0.33 0.27 £62,390 8891 Child day-care activities 5,402 5,817 415 8% 0.90 0.88 £12,933 4645 Wholesale of perfume and cosmetics 5,385 6,412 1,027 19% 5.22 5.49 £26,472 6190 Other telecommunications activities 5,221 5,648 427 8% 0.97 1.00 £54,675
4791 Retail sale via mail order houses or via Internet 5,199 6,077 878 17% 1.54 1.52 £31,396 4110 Development of building projects 5,112 6,005 893 17% 1.82 1.91 £21,895 7311 Advertising agencies 5,108 5,148 40 1% 1.59 1.42 £29,432 5320 Other postal and courier activities 4,944 5,384 440 9% 2.01 1.99 £29,135
8790 Other residential care activities 4,941 5,469 528 11% 0.64 0.65 £28,314 4646 Wholesale of pharmaceutical goods 4,885 5,218 333 7% 2.28 2.26 £43,905
7219 Other research and experimental development on natural sciences and engineering 4,805 4,849 44 1% 1.37 1.33 £48,297
4639 Non-specialised wholesale of food, beverages and tobacco 4,797 5,552 755 16% 1.71 1.84 £28,859 9311 Operation of sports facilities 4,786 5,104 318 7% 0.98 1.00 £14,273

Emsi:SkillsDemandAnalysisWestLondonAlliance
EconomicModellingSpecialistsInt.www.economicmodelling.co.uk
12
SIC-4 Description 2015 Jobs
2022 Jobs
2015 - 2022
Change
2015 - 2022 % Change
2015 Location Quotient
2022 Location Quotient
Averagel Earnings
9602 Hairdressing and other beauty treatment 4,618 5,103 485 11% 1.06 1.05 £18,711
4511 Sale of cars and light motor vehicles 4,520 4,710 190 4% 0.79 0.81 £36,005 6209 Other information technology and computer service activities 4,497 4,470 -27 -1% 1.11 1.06 £66,639 9200 Gambling and betting activities 4,404 4,738 334 8% 1.43 1.37 £12,485 9312 Activities of sport clubs 4,378 4,540 162 4% 0.96 0.99 £38,375
5210 Warehousing and storage 4,368 4,661 293 7% 0.57 0.54 £23,337 6832 Management of real estate on a fee or contract basis 4,348 4,076 -272 -6% 1.43 1.24 £42,794 4939 Other passenger land transport n.e.c. 4,213 4,516 303 7% 2.05 2.05 £31,207 1085 Manufacture of prepared meals and dishes 4,181 4,743 562 13% 4.64 5.09 £23,906
8532 Technical and vocational secondary education 4,056 3,828 -228 -6% 0.67 0.65 £27,745 7490 Other professional, scientific and technical activities n.e.c. 3,932 4,340 408 10% 1.06 1.02 £23,104
4759 Retail sale of furniture, lighting equipment and other household articles in specialised stores 3,894 4,317 423 11% 1.29 1.37 £30,072
8730 Residential care activities for the elderly and disabled 3,719 3,845 126 3% 0.48 0.46 £22,444 9313 Fitness facilities 3,673 4,236 563 15% 2.56 2.64 £13,312 4321 Electrical installation 3,581 3,103 -478 -13% 0.50 0.37 £48,663
4634 Wholesale of beverages 3,429 3,860 431 13% 3.38 3.59 £33,374 8623 Dental practice activities 3,241 3,731 490 15% 0.99 1.01 £19,671 4778 Other retail sale of new goods in specialised stores 3,169 2,955 -214 -7% 0.71 0.67 £25,712 4690 Non-specialised wholesale trade 3,112 2,736 -376 -12% 1.42 1.27 £42,392
4649 Wholesale of other household goods 3,084 3,253 169 5% 1.46 1.50 £31,671 9491 Activities of religious organisations 3,083 3,413 330 11% 1.49 1.51 £25,359 5224 Cargo handling 2,952 3,285 333 11% 10.51 10.93 £38,492 4752 Retail sale of hardware, paints and glass in specialised stores 2,922 3,084 162 6% 1.04 1.07 £16,953
4643 Wholesale of electrical household appliances 2,893 3,025 132 5% 2.90 2.90 £48,236 4941 Freight transport by road 2,885 2,411 -474 -16% 0.44 0.37 £28,718 1071 Manufacture of bread; manufacture of fresh pastry goods and cakes 2,860 2,523 -337 -12% 1.21 1.12 £18,731 4673 Wholesale of wood, construction materials and sanitary equipment 2,840 2,731 -109 -4% 0.78 0.72 £33,197
4932 Taxi operation 2,813 2,828 15 1% 2.29 2.17 £10,227 9609 Other personal service activities n.e.c. 2,809 2,338 -471 -17% 0.92 0.80 £39,984 4764 Retail sale of sporting equipment in specialised stores 2,717 3,029 312 11% 1.28 1.38 £15,337

Emsi:SkillsDemandAnalysisWestLondonAlliance
EconomicModellingSpecialistsInt.www.economicmodelling.co.uk
13
SIC-4 Description 2015 Jobs
2022 Jobs
2015 - 2022
Change
2015 - 2022 % Change
2015 Location Quotient
2022 Location Quotient
Averagel Earnings
7911 Travel agency activities 2,711 2,977 266 10% 1.50 1.57 £33,595
4642 Wholesale of clothing and footwear 2,679 3,150 471 18% 1.86 2.04 £30,987 3811 Collection of non-hazardous waste 2,670 3,110 440 16% 1.34 1.46 £47,484 4339 Other building completion and finishing 2,638 3,390 752 29% 1.55 1.61 £30,243 1089 Manufacture of other food products n.e.c. 2,619 2,719 100 4% 2.63 2.92 £20,374
4773 Dispensing chemist in specialised stores 2,592 2,773 181 7% 0.76 0.73 £15,788 7111 Architectural activities 2,572 2,507 -65 -3% 0.99 0.92 £40,016 5221 Service activities incidental to land transportation 2,500 2,106 -394 -16% 1.01 0.79 £19,805
1072 Manufacture of rusks and biscuits; manufacture of preserved pastry goods and cakes 2,490 2,112 -378 -15% 3.18 2.96 £33,338
8510 Pre-primary education 2,484 2,796 312 13% 1.18 1.28 £16,169 4299 Construction of other civil engineering projects n.e.c. 2,465 2,965 500 20% 0.61 0.66 £28,435
4322 Plumbing, heat and air-conditioning installation 2,446 2,537 91 4% 0.51 0.44 £31,770 4742 Retail sale of telecommunications equipment in specialised stores 2,390 2,094 -296 -12% 2.65 2.24 £33,383 4651 Wholesale of computers, computer peripheral equipment and software 2,381 1,604 -777 -33% 2.12 1.49 £51,069 1812 Other printing 2,247 2,265 18 1% 0.71 0.72 £26,016
9499 Activities of other membership organisations n.e.c. 2,197 2,461 264 12% 0.59 0.63 £34,549 7410 Specialised design activities 2,193 2,530 337 15% 1.29 1.23 £23,590 4669 Wholesale of other machinery and equipment 2,141 1,748 -393 -18% 0.57 0.45 £50,092 8129 Other cleaning activities 2,071 2,105 34 2% 1.32 1.21 £13,989
4772 Retail sale of footwear and leather goods in specialised stores 1,943 2,045 102 5% 1.16 1.24 £11,763 5913 Motion picture, video and television programme distribution activities 1,882 2,143 261 14% 9.85 10.72 £62,024 1039 Other processing and preserving of fruit and vegetables 1,855 1,720 -135 -7% 2.91 2.76 £31,983
4724 Retail sale of bread, cakes, flour confectionery and sugar confectionery in specialised stores 1,801 2,057 256 14% 0.96 1.05 £24,763
4531 Wholesale trade of motor vehicle parts and accessories 1,791 1,851 60 3% 0.78 0.76 £21,007 9003 Artistic creation 1,764 1,904 140 8% 1.86 1.93 £36,438 4729 Other retail sale of food in specialised stores 1,732 1,964 232 13% 1.67 1.71 £15,800
7912 Tour operator activities 1,610 1,893 283 18% 1.72 1.83 £29,882 4754 Retail sale of electrical household appliances in specialised stores 1,591 1,481 -110 -7% 1.34 1.37 £16,088 4399 Other specialised construction activities n.e.c. 1,568 1,268 -300 -19% 0.45 0.33 £40,705

Emsi:SkillsDemandAnalysisWestLondonAlliance
EconomicModellingSpecialistsInt.www.economicmodelling.co.uk
14
SIC-4 Description 2015 Jobs
2022 Jobs
2015 - 2022
Change
2015 - 2022 % Change
2015 Location Quotient
2022 Location Quotient
Averagel Earnings
7830 Other human resources provision 1,536 2,112 576 38% 3.31 3.62 £16,884
5814 Publishing of journals and periodicals 1,509 1,515 6 0% 1.21 1.22 £42,540 4777 Retail sale of watches and jewellery in specialised stores 1,505 1,548 43 3% 1.24 1.23 £21,750 9001 Performing arts 1,503 1,720 217 14% 0.91 0.90 £35,269 7500 Veterinary activities 1,451 1,961 510 35% 0.86 1.06 £15,736
7739 Renting and leasing of other machinery, equipment and tangible goods n.e.c. 1,436 1,403 -33 -2% 1.25 1.19 £32,971 5920 Sound recording and music publishing activities 1,413 1,493 80 6% 4.99 5.02 £39,794 4942 Removal services 1,394 1,367 -27 -2% 2.96 2.69 £23,630 7711 Renting and leasing of cars and light motor vehicles 1,394 1,148 -246 -18% 1.20 0.97 £17,360
6311 Data processing, hosting and related activities 1,372 1,458 86 6% 0.98 0.87 £47,019 4631 Wholesale of fruit and vegetables 1,356 1,405 49 4% 1.30 1.33 £32,706 0610 Extraction of crude petroleum 1,333 1,378 45 3% 2.51 2.59 £73,544 4775 Retail sale of cosmetic and toilet articles in specialised stores 1,299 1,368 69 5% 1.25 1.27 £11,717
8230 Organisation of conventions and trade shows 1,293 1,383 90 7% 1.86 1.84 £22,773 4212 Construction of railways and underground railways 1,286 1,691 405 31% 4.49 4.81 £30,747 8541 Post-secondary non-tertiary education 1,273 800 -473 -37% 0.96 0.85 £27,410 8220 Activities of call centres 1,268 1,212 -56 -4% 0.38 0.33 £56,340
4666 Wholesale of other office machinery and equipment 1,241 1,117 -124 -10% 1.74 1.46 £41,860 4329 Other construction installation 1,199 1,467 268 22% 0.86 0.84 £40,877 4730 Retail sale of automotive fuel in specialised stores 1,198 1,142 -56 -5% 0.89 0.82 £59,216 8211 Combined office administrative service activities 1,188 1,330 142 12% 1.71 1.61 £19,769
4332 Joinery installation 1,169 1,308 139 12% 0.53 0.51 £31,979 9601 Washing and (dry-)cleaning of textile and fur products 1,166 1,096 -70 -6% 1.23 1.10 £15,629 7420 Photographic activities 1,154 1,221 67 6% 1.86 1.93 £15,110 1031 Processing and preserving of potatoes 1,117 1,240 123 11% 4.40 5.38 £36,526
4334 Painting and glazing 1,103 1,251 148 13% 0.67 0.67 £27,157 4762 Retail sale of newspapers and stationery in specialised stores 1,097 1,116 19 2% 0.98 1.12 £15,643 2221 Manufacture of plastic plates, sheets, tubes and profiles 1,085 1,114 29 3% 1.29 1.33 £35,100
8720 Residential care activities for learning disabilities, mental health and substance abuse 1,082 1,288 206 19% 0.70 0.81 £27,004
4652 Wholesale of electronic and telecommunications equipment and parts 1,078 896 -182 -17% 0.94 0.74 £19,594

Emsi:SkillsDemandAnalysisWestLondonAlliance
EconomicModellingSpecialistsInt.www.economicmodelling.co.uk
15
SIC-4 Description 2015 Jobs
2022 Jobs
2015 - 2022
Change
2015 - 2022 % Change
2015 Location Quotient
2022 Location Quotient
Averagel Earnings
4647 Wholesale of furniture, carpets and lighting equipment 1,075 1,239 164 15% 1.69 1.86 £36,753
4779 Retail sale of second-hand goods in stores 1,046 1,156 110 11% 0.83 0.82 £17,127 4722 Retail sale of meat and meat products in specialised stores 1,029 1,120 91 9% 0.84 0.87 £22,484
4776 Retail sale of flowers, plants, seeds, fertilisers, pet animals and pet food in specialised stores 1,028 1,079 51 5% 0.49 0.50 £18,446
9319 Other sports activities 1,020 1,197 177 17% 0.83 0.88 £20,040 4532 Retail trade of motor vehicle parts and accessories 1,010 1,091 81 8% 0.79 0.81 £30,603 4211 Construction of roads and motorways 990 1,212 222 22% 0.71 0.74 £28,409
8622 Specialist medical practice activities 977 1,203 226 23% 1.31 1.36 £23,134 7729 Renting and leasing of other personal and household goods 954 904 -50 -5% 2.45 2.37 £26,236 6120 Wireless telecommunications activities 910 1,190 280 31% 1.72 1.84 £72,936 2562 Machining 907 737 -170 -19% 0.30 0.26 £26,781
2223 Manufacture of builders’ ware of plastic 900 1,087 187 21% 0.64 0.78 £14,859 5811 Book publishing 894 731 -163 -18% 1.12 0.88 £42,501 3109 Manufacture of other furniture 893 913 20 2% 0.72 0.75 £21,593 4641 Wholesale of textiles 881 978 97 11% 1.85 1.96 £35,024
9329 Other amusement and recreation activities 877 675 -202 -23% 0.63 0.52 £15,761 4674 Wholesale of hardware, plumbing and heating equipment and supplies 866 698 -168 -19% 0.55 0.45 £33,414 7021 Public relations and communication activities 830 803 -27 -3% 1.19 1.04 £41,668 5819 Other publishing activities 820 898 78 10% 1.50 1.56 £51,051
2511 Manufacture of metal structures and parts of structures 796 722 -74 -9% 0.49 0.51 £27,075 4638 Wholesale of other food, including fish, crustaceans and molluscs 783 884 101 13% 1.29 1.40 £36,482 5914 Motion picture projection activities 782 823 41 5% 1.24 1.20 £8,261
7732 Renting and leasing of construction and civil engineering machinery and equipment 773 891 118 15% 0.60 0.64 £34,902
4725 Retail sale of beverages in specialised stores 764 739 -25 -3% 1.15 1.17 £15,418 4741 Retail sale of computers, peripheral units and software in specialised stores 757 692 -65 -9% 1.29 1.10 £29,428 4632 Wholesale of meat and meat products 741 839 98 13% 0.98 1.06 £35,439
4633 Wholesale of dairy products, eggs and edible oils and fats 714 726 12 2% 1.74 1.71 £27,492 2229 Manufacture of other plastic products 710 795 85 12% 0.42 0.45 £19,213 4648 Wholesale of watches and jewellery 710 784 74 10% 2.65 2.67 £27,769
Emsi:SkillsDemandAnalysisWestLondonAlliance
EconomicModellingSpecialistsInt.www.economicmodelling.co.uk
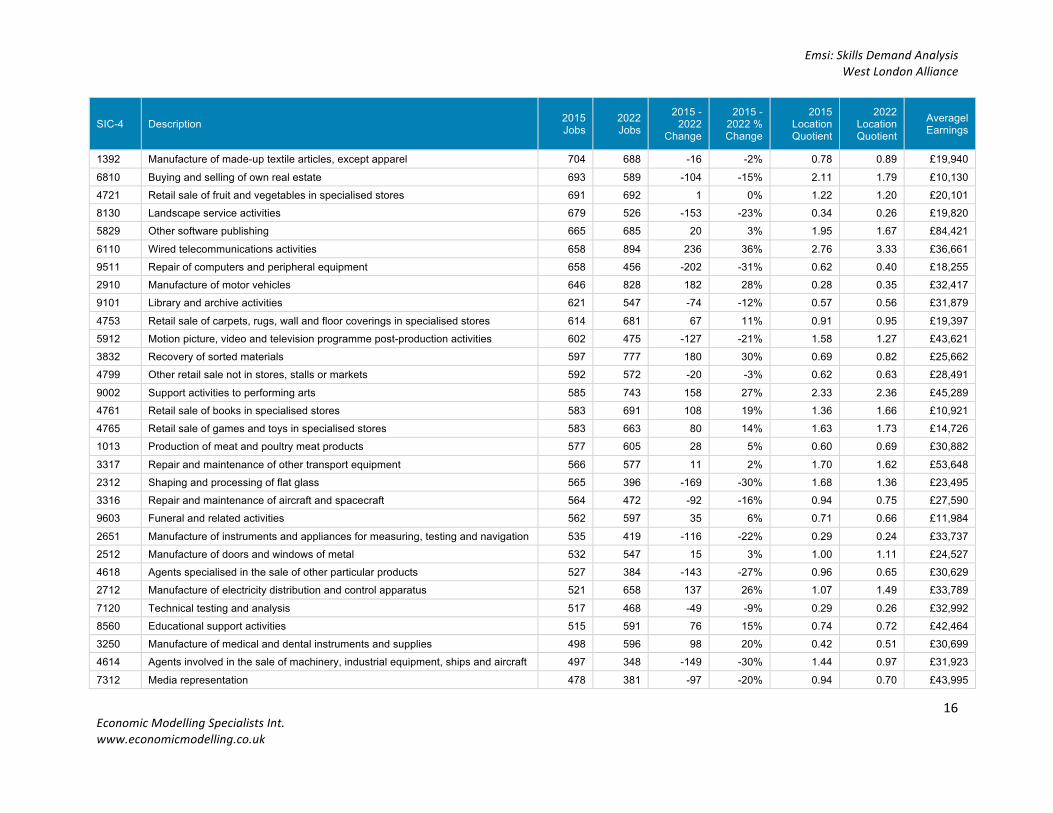
16
SIC-4 Description 2015 Jobs
2022 Jobs
2015 - 2022
Change
2015 - 2022 % Change
2015 Location Quotient
2022 Location Quotient
Averagel Earnings
1392 Manufacture of made-up textile articles, except apparel 704 688 -16 -2% 0.78 0.89 £19,940
6810 Buying and selling of own real estate 693 589 -104 -15% 2.11 1.79 £10,130 4721 Retail sale of fruit and vegetables in specialised stores 691 692 1 0% 1.22 1.20 £20,101 8130 Landscape service activities 679 526 -153 -23% 0.34 0.26 £19,820 5829 Other software publishing 665 685 20 3% 1.95 1.67 £84,421
6110 Wired telecommunications activities 658 894 236 36% 2.76 3.33 £36,661 9511 Repair of computers and peripheral equipment 658 456 -202 -31% 0.62 0.40 £18,255 2910 Manufacture of motor vehicles 646 828 182 28% 0.28 0.35 £32,417 9101 Library and archive activities 621 547 -74 -12% 0.57 0.56 £31,879
4753 Retail sale of carpets, rugs, wall and floor coverings in specialised stores 614 681 67 11% 0.91 0.95 £19,397 5912 Motion picture, video and television programme post-production activities 602 475 -127 -21% 1.58 1.27 £43,621 3832 Recovery of sorted materials 597 777 180 30% 0.69 0.82 £25,662 4799 Other retail sale not in stores, stalls or markets 592 572 -20 -3% 0.62 0.63 £28,491
9002 Support activities to performing arts 585 743 158 27% 2.33 2.36 £45,289 4761 Retail sale of books in specialised stores 583 691 108 19% 1.36 1.66 £10,921 4765 Retail sale of games and toys in specialised stores 583 663 80 14% 1.63 1.73 £14,726 1013 Production of meat and poultry meat products 577 605 28 5% 0.60 0.69 £30,882
3317 Repair and maintenance of other transport equipment 566 577 11 2% 1.70 1.62 £53,648 2312 Shaping and processing of flat glass 565 396 -169 -30% 1.68 1.36 £23,495 3316 Repair and maintenance of aircraft and spacecraft 564 472 -92 -16% 0.94 0.75 £27,590 9603 Funeral and related activities 562 597 35 6% 0.71 0.66 £11,984
2651 Manufacture of instruments and appliances for measuring, testing and navigation 535 419 -116 -22% 0.29 0.24 £33,737 2512 Manufacture of doors and windows of metal 532 547 15 3% 1.00 1.11 £24,527 4618 Agents specialised in the sale of other particular products 527 384 -143 -27% 0.96 0.65 £30,629 2712 Manufacture of electricity distribution and control apparatus 521 658 137 26% 1.07 1.49 £33,789
7120 Technical testing and analysis 517 468 -49 -9% 0.29 0.26 £32,992 8560 Educational support activities 515 591 76 15% 0.74 0.72 £42,464 3250 Manufacture of medical and dental instruments and supplies 498 596 98 20% 0.42 0.51 £30,699 4614 Agents involved in the sale of machinery, industrial equipment, ships and aircraft 497 348 -149 -30% 1.44 0.97 £31,923
7312 Media representation 478 381 -97 -20% 0.94 0.70 £43,995
Emsi:SkillsDemandAnalysisWestLondonAlliance
EconomicModellingSpecialistsInt.www.economicmodelling.co.uk
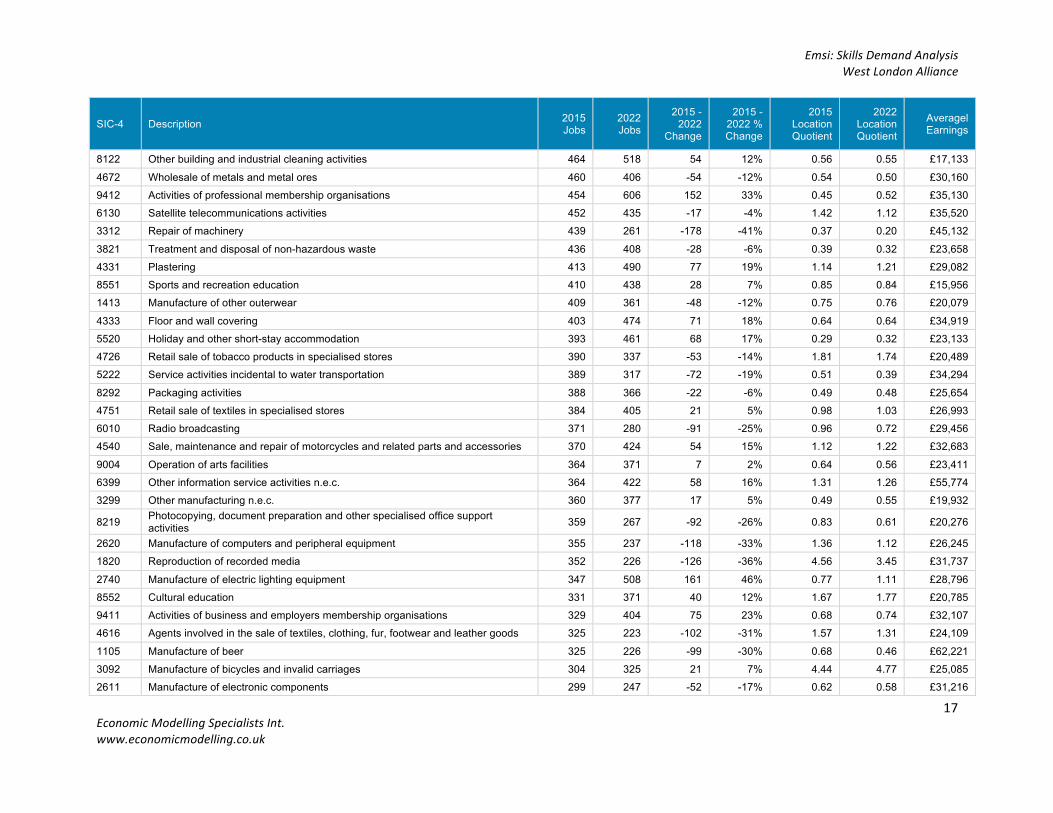
17
SIC-4 Description 2015 Jobs
2022 Jobs
2015 - 2022
Change
2015 - 2022 % Change
2015 Location Quotient
2022 Location Quotient
Averagel Earnings
8122 Other building and industrial cleaning activities 464 518 54 12% 0.56 0.55 £17,133
4672 Wholesale of metals and metal ores 460 406 -54 -12% 0.54 0.50 £30,160 9412 Activities of professional membership organisations 454 606 152 33% 0.45 0.52 £35,130 6130 Satellite telecommunications activities 452 435 -17 -4% 1.42 1.12 £35,520 3312 Repair of machinery 439 261 -178 -41% 0.37 0.20 £45,132
3821 Treatment and disposal of non-hazardous waste 436 408 -28 -6% 0.39 0.32 £23,658 4331 Plastering 413 490 77 19% 1.14 1.21 £29,082 8551 Sports and recreation education 410 438 28 7% 0.85 0.84 £15,956 1413 Manufacture of other outerwear 409 361 -48 -12% 0.75 0.76 £20,079
4333 Floor and wall covering 403 474 71 18% 0.64 0.64 £34,919 5520 Holiday and other short-stay accommodation 393 461 68 17% 0.29 0.32 £23,133 4726 Retail sale of tobacco products in specialised stores 390 337 -53 -14% 1.81 1.74 £20,489 5222 Service activities incidental to water transportation 389 317 -72 -19% 0.51 0.39 £34,294
8292 Packaging activities 388 366 -22 -6% 0.49 0.48 £25,654 4751 Retail sale of textiles in specialised stores 384 405 21 5% 0.98 1.03 £26,993 6010 Radio broadcasting 371 280 -91 -25% 0.96 0.72 £29,456 4540 Sale, maintenance and repair of motorcycles and related parts and accessories 370 424 54 15% 1.12 1.22 £32,683
9004 Operation of arts facilities 364 371 7 2% 0.64 0.56 £23,411 6399 Other information service activities n.e.c. 364 422 58 16% 1.31 1.26 £55,774 3299 Other manufacturing n.e.c. 360 377 17 5% 0.49 0.55 £19,932
8219 Photocopying, document preparation and other specialised office support activities 359 267 -92 -26% 0.83 0.61 £20,276
2620 Manufacture of computers and peripheral equipment 355 237 -118 -33% 1.36 1.12 £26,245 1820 Reproduction of recorded media 352 226 -126 -36% 4.56 3.45 £31,737
2740 Manufacture of electric lighting equipment 347 508 161 46% 0.77 1.11 £28,796 8552 Cultural education 331 371 40 12% 1.67 1.77 £20,785 9411 Activities of business and employers membership organisations 329 404 75 23% 0.68 0.74 £32,107 4616 Agents involved in the sale of textiles, clothing, fur, footwear and leather goods 325 223 -102 -31% 1.57 1.31 £24,109
1105 Manufacture of beer 325 226 -99 -30% 0.68 0.46 £62,221 3092 Manufacture of bicycles and invalid carriages 304 325 21 7% 4.44 4.77 £25,085 2611 Manufacture of electronic components 299 247 -52 -17% 0.62 0.58 £31,216

Emsi:SkillsDemandAnalysisWestLondonAlliance
EconomicModellingSpecialistsInt.www.economicmodelling.co.uk
18
SIC-4 Description 2015 Jobs
2022 Jobs
2015 - 2022
Change
2015 - 2022 % Change
2015 Location Quotient
2022 Location Quotient
Averagel Earnings
3320 Installation of industrial machinery and equipment 297 272 -25 -8% 0.43 0.36 £42,413
1051 Operation of dairies and cheese making 292 290 -2 -1% 0.54 0.61 £28,287 2630 Manufacture of communication equipment 286 208 -78 -27% 0.54 0.47 £33,702 2599 Manufacture of other fabricated metal products n.e.c. 282 223 -59 -21% 0.28 0.25 £22,387 9604 Physical well-being activities 275 347 72 26% 1.08 1.07 £24,239
3513 Distribution of electricity 267 271 4 1% 0.23 0.22 £44,592 9512 Repair of communication equipment 261 319 58 22% 2.20 2.66 £15,127 7990 Other reservation service and related activities 255 157 -98 -38% 0.90 0.68 £43,710 2222 Manufacture of plastic packing goods 253 306 53 21% 0.33 0.39 £34,881
3521 Manufacture of gas 252 172 -80 -32% 1.38 1.02 £48,852 3101 Manufacture of office and shop furniture 252 231 -21 -8% 0.41 0.36 £13,104 9102 Museum activities 251 261 10 4% 0.28 0.29 £24,483 7220 Research and experimental development on social sciences and humanities 249 299 50 20% 1.36 1.53 £25,492
3700 Sewerage 244 200 -44 -18% 0.34 0.27 £46,763 4671 Wholesale of solid, liquid and gaseous fuels and related products 238 187 -51 -21% 0.37 0.29 £35,878 4743 Retail sale of audio and video equipment in specialised stores 231 245 14 6% 1.36 1.42 £16,925 2640 Manufacture of consumer electronics 230 154 -76 -33% 1.30 1.05 £22,718
2790 Manufacture of other electrical equipment 227 251 24 11% 0.82 0.93 £32,411 4789 Retail sale via stalls and markets of other goods 224 252 28 13% 2.62 2.65 £12,054 7712 Renting and leasing of trucks 217 168 -49 -23% 0.69 0.51 £43,866 2825 Manufacture of non-domestic cooling and ventilation equipment 212 175 -37 -17% 0.35 0.32 £32,399
1712 Manufacture of paper and paperboard 212 141 -71 -33% 0.71 0.59 £33,719 2561 Treatment and coating of metals 212 160 -52 -25% 0.31 0.26 £23,081 4781 Retail sale via stalls and markets of food, beverages and tobacco products 211 266 55 26% 2.15 2.53 £13,046 4723 Retail sale of fish, crustaceans and molluscs in specialised stores 211 221 10 5% 1.80 1.78 £14,033
6312 Web portals 209 271 62 30% 0.85 0.83 £27,384 4675 Wholesale of chemical products 203 133 -70 -34% 0.40 0.27 £37,202 4676 Wholesale of other intermediate products 203 130 -73 -36% 0.36 0.23 £26,345 3212 Manufacture of jewellery and related articles 198 229 31 16% 1.27 1.54 £19,768
4619 Agents involved in the sale of a variety of goods 197 174 -23 -12% 1.37 1.14 £36,463
Emsi:SkillsDemandAnalysisWestLondonAlliance
EconomicModellingSpecialistsInt.www.economicmodelling.co.uk
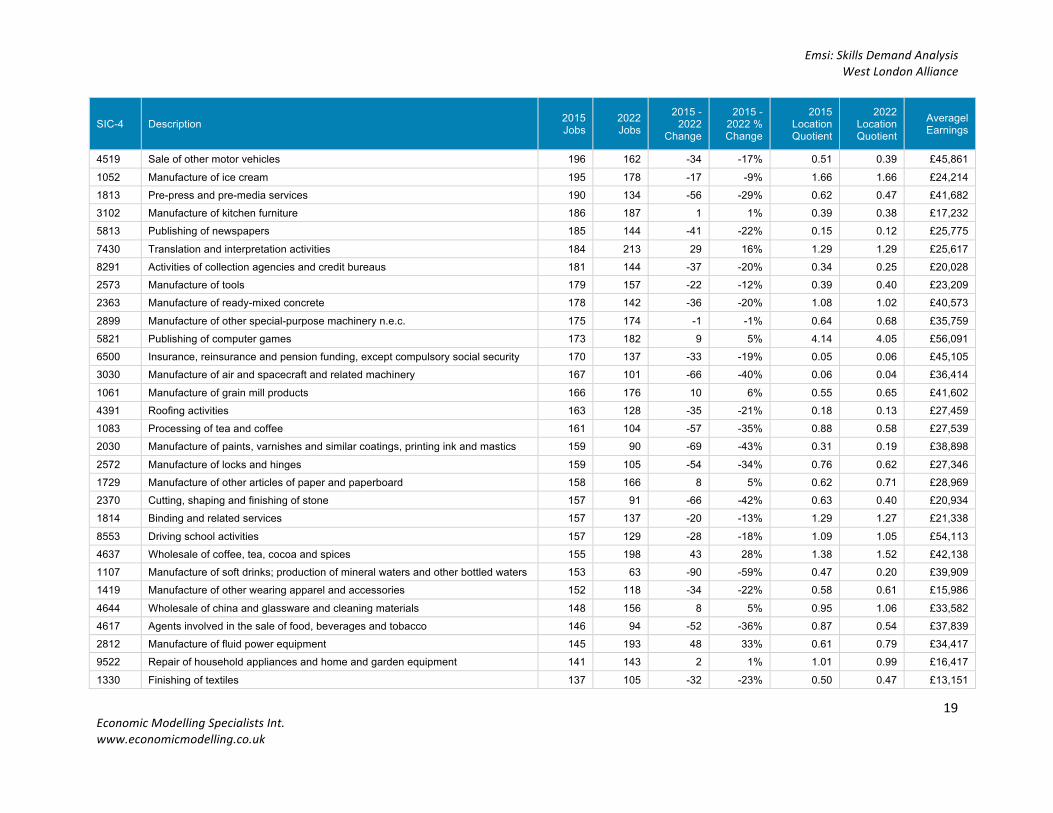
19
SIC-4 Description 2015 Jobs
2022 Jobs
2015 - 2022
Change
2015 - 2022 % Change
2015 Location Quotient
2022 Location Quotient
Averagel Earnings
4519 Sale of other motor vehicles 196 162 -34 -17% 0.51 0.39 £45,861
1052 Manufacture of ice cream 195 178 -17 -9% 1.66 1.66 £24,214 1813 Pre-press and pre-media services 190 134 -56 -29% 0.62 0.47 £41,682 3102 Manufacture of kitchen furniture 186 187 1 1% 0.39 0.38 £17,232 5813 Publishing of newspapers 185 144 -41 -22% 0.15 0.12 £25,775
7430 Translation and interpretation activities 184 213 29 16% 1.29 1.29 £25,617 8291 Activities of collection agencies and credit bureaus 181 144 -37 -20% 0.34 0.25 £20,028 2573 Manufacture of tools 179 157 -22 -12% 0.39 0.40 £23,209 2363 Manufacture of ready-mixed concrete 178 142 -36 -20% 1.08 1.02 £40,573
2899 Manufacture of other special-purpose machinery n.e.c. 175 174 -1 -1% 0.64 0.68 £35,759 5821 Publishing of computer games 173 182 9 5% 4.14 4.05 £56,091 6500 Insurance, reinsurance and pension funding, except compulsory social security 170 137 -33 -19% 0.05 0.06 £45,105 3030 Manufacture of air and spacecraft and related machinery 167 101 -66 -40% 0.06 0.04 £36,414
1061 Manufacture of grain mill products 166 176 10 6% 0.55 0.65 £41,602 4391 Roofing activities 163 128 -35 -21% 0.18 0.13 £27,459 1083 Processing of tea and coffee 161 104 -57 -35% 0.88 0.58 £27,539 2030 Manufacture of paints, varnishes and similar coatings, printing ink and mastics 159 90 -69 -43% 0.31 0.19 £38,898
2572 Manufacture of locks and hinges 159 105 -54 -34% 0.76 0.62 £27,346 1729 Manufacture of other articles of paper and paperboard 158 166 8 5% 0.62 0.71 £28,969 2370 Cutting, shaping and finishing of stone 157 91 -66 -42% 0.63 0.40 £20,934 1814 Binding and related services 157 137 -20 -13% 1.29 1.27 £21,338
8553 Driving school activities 157 129 -28 -18% 1.09 1.05 £54,113 4637 Wholesale of coffee, tea, cocoa and spices 155 198 43 28% 1.38 1.52 £42,138 1107 Manufacture of soft drinks; production of mineral waters and other bottled waters 153 63 -90 -59% 0.47 0.20 £39,909 1419 Manufacture of other wearing apparel and accessories 152 118 -34 -22% 0.58 0.61 £15,986
4644 Wholesale of china and glassware and cleaning materials 148 156 8 5% 0.95 1.06 £33,582 4617 Agents involved in the sale of food, beverages and tobacco 146 94 -52 -36% 0.87 0.54 £37,839 2812 Manufacture of fluid power equipment 145 193 48 33% 0.61 0.79 £34,417 9522 Repair of household appliances and home and garden equipment 141 143 2 1% 1.01 0.99 £16,417
1330 Finishing of textiles 137 105 -32 -23% 0.50 0.47 £13,151

Emsi:SkillsDemandAnalysisWestLondonAlliance
EconomicModellingSpecialistsInt.www.economicmodelling.co.uk
20
SIC-4 Description 2015 Jobs
2022 Jobs
2015 - 2022
Change
2015 - 2022 % Change
2015 Location Quotient
2022 Location Quotient
Averagel Earnings
2932 Manufacture of other parts and accessories for motor vehicles 134 88 -46 -34% 0.08 0.05 £24,448
4920 Freight rail transport 132 122 -10 -8% 0.65 0.56 £102,284 9103 Operation of historical sites and buildings and similar visitor attractions 130 134 4 3% 0.28 0.29 £25,687 1623 Manufacture of other builders' carpentry and joinery 130 76 -54 -42% 0.09 0.05 £31,169 8020 Security systems service activities 130 104 -26 -20% 0.39 0.26 £51,015
2120 Manufacture of pharmaceutical preparations 128 87 -41 -32% 0.12 0.08 £42,986 4636 Wholesale of sugar and chocolate and sugar confectionery 127 114 -13 -10% 0.42 0.33 £32,935 5020 Sea and coastal freight water transport 126 156 30 24% 0.50 0.60 £73,601 1082 Manufacture of cocoa, chocolate and sugar confectionery 124 84 -40 -32% 0.23 0.17 £28,407
2822 Manufacture of lifting and handling equipment 123 131 8 7% 0.22 0.23 £31,356 1101 Distilling, rectifying and blending of spirits 122 107 -15 -12% 0.39 0.35 £32,762 9524 Repair of furniture and home furnishings 121 141 20 17% 1.17 1.26 £18,582 5590 Other accommodation 121 117 -4 -3% 0.40 0.33 £14,929
2593 Manufacture of wire products, chain and springs 121 93 -28 -23% 0.49 0.46 £20,734 6203 Computer facilities management activities 116 123 7 6% 1.77 1.53 £29,799 4312 Site preparation 115 97 -18 -16% 0.23 0.16 £43,397 7740 Leasing of intellectual property and similar products, except copyrighted works 114 145 31 27% 1.28 1.33 £27,203
4615 Agents involved in the sale of furniture, household goods, hardware and ironmongery 114 74 -40 -35% 1.23 1.04 £28,552
2454 Casting of other non-ferrous metals 114 95 -19 -17% 1.56 1.74 £25,095
3511 Production of electricity 112 139 27 24% 0.13 0.14 £19,585 1084 Manufacture of condiments and seasonings 112 128 16 14% 0.46 0.55 £40,757 4613 Agents involved in the sale of timber and building materials 112 69 -43 -38% 0.49 0.27 £40,108 9525 Repair of watches, clocks and jewellery 112 148 36 32% 1.98 2.41 £15,029
4222 Construction of utility projects for electricity and telecommunications 111 142 31 28% 0.31 0.29 £43,658 2399 Manufacture of other non-metallic mineral products n.e.c. 111 124 13 12% 0.53 0.64 £36,456 4622 Wholesale of flowers and plants 111 81 -30 -27% 0.51 0.38 £26,026 3319 Repair of other equipment 110 55 -55 -50% 0.51 0.31 £23,399
4635 Wholesale of tobacco products 110 109 -1 -1% 3.58 4.78 £70,973 4612 Agents involved in the sale of fuels, ores, metals and industrial chemicals 110 110 0 0% 0.79 0.74 £25,036 2441 Precious metals production 109 110 1 1% 3.69 4.19 £55,749

Emsi:SkillsDemandAnalysisWestLondonAlliance
EconomicModellingSpecialistsInt.www.economicmodelling.co.uk
21
SIC-4 Description 2015 Jobs
2022 Jobs
2015 - 2022
Change
2015 - 2022 % Change
2015 Location Quotient
2022 Location Quotient
Averagel Earnings
9521 Repair of consumer electronics 109 111 2 2% 1.05 1.16 £10,134
2829 Manufacture of other general-purpose machinery n.e.c. 107 109 2 2% 0.15 0.16 £28,319 4763 Retail sale of music and video recordings in specialised stores 104 69 -35 -34% 0.85 0.76 £15,728 5121 Freight air transport 102 46 -56 -55% 1.19 0.51 £27,816 2931 Manufacture of electrical and electronic equipment for motor vehicles 102 81 -21 -21% 1.32 1.50 £26,163
2540 Manufacture of weapons and ammunition 101 62 -39 -39% 0.23 0.15 £19,108

Emsi:SkillsDemandAnalysisWestLondonAlliance
EconomicModellingSpecialistsInt.www.economicmodelling.co.uk
22
OccupationtablesTable3:SOC2Occupations-WLA
SOC 2 Description 2015 Jobs
2022 Jobs
2015 - 2022
Change
2015 - 2022 % Change
2015 Location Quotient
2022 Location Quotient
Openings (2015-22)
Annual Openings
Median Hourly
Earnings
11 Corporate Managers and Directors 77,011 80,949 3,938 5% 1.16 1.15 25,868 3,695 £28.04 12 Other Managers and Proprietors 30,535 32,193 1,658 5% 1.04 1.04 12,471 1,782 £16.10
21 Science, Research, Engineering and Technology Professionals 51,219 54,315 3,096 6% 1.10 1.09 15,552 2,222 £22.42 22 Health Professionals 33,637 35,709 2,072 6% 0.85 0.83 12,788 1,827 £21.60 23 Teaching and Educational Professionals 40,192 41,884 1,692 4% 0.96 0.97 14,993 2,142 £23.28 24 Business, Media and Public Service Professionals 58,160 61,601 3,441 6% 1.20 1.20 22,150 3,164 £22.81
31 Science, Engineering and Technology Associate Professionals 16,189 16,974 785 5% 0.98 0.97 4,517 645 £15.84 32 Health and Social Care Associate Professionals 11,401 12,079 678 6% 0.86 0.85 4,175 596 £13.73 33 Protective Service Occupations 7,836 7,612 -224 -3% 0.97 0.93 1,525 218 £17.80 34 Culture, Media and Sports Occupations 22,399 23,198 799 4% 1.78 1.75 7,885 1,126 £15.96
35 Business and Public Service Associate Professionals 89,371 94,023 4,652 5% 1.20 1.19 29,628 4,233 £22.28 41 Administrative Occupations 81,848 85,771 3,923 5% 0.93 0.93 28,243 4,035 £12.89 42 Secretarial and Related Occupations 26,573 28,182 1,609 6% 0.97 0.98 10,133 1,448 £13.28 51 Skilled Agricultural and Related Trades 1,599 1,545 -54 -3% 0.18 0.17 623 89 £9.53
52 Skilled Metal, Electrical and Electronic Trades 20,120 20,321 201 1% 0.63 0.61 5,055 722 £14.56 53 Skilled Construction and Building Trades 11,282 11,987 705 6% 0.67 0.67 3,753 536 £13.69 54 Textiles, Printing and Other Skilled Trades 20,457 21,844 1,387 7% 0.94 0.95 6,006 858 £9.22 61 Caring Personal Service Occupations 55,587 59,980 4,393 8% 0.83 0.83 22,402 3,200 £9.57
62 Leisure, Travel and Related Personal Service Occupations 35,363 37,880 2,517 7% 2.09 2.11 14,879 2,126 £13.73 71 Sales Occupations 62,579 66,078 3,499 6% 0.96 0.97 19,075 2,725 £8.49 72 Customer Service Occupations 19,662 20,703 1,041 5% 1.00 0.99 5,941 849 £11.58 81 Process, Plant and Machine Operatives 15,539 16,260 721 5% 0.64 0.67 4,008 573 £9.74
82 Transport and Mobile Machine Drivers and Operatives 35,694 37,415 1,721 5% 1.14 1.14 12,652 1,807 £12.39 91 Elementary Trades and Related Occupations 10,849 11,460 611 6% 0.62 0.63 3,081 440 £8.00 92 Elementary Administration and Service Occupations 110,355 117,581 7,226 7% 0.99 0.99 37,718 5,388 £8.21
945,459 997,544 52,085 6% 325,121 46,446 £15.98
Emsi:SkillsDemandAnalysisWestLondonAlliance
EconomicModellingSpecialistsInt.www.economicmodelling.co.uk
23
Table4:SOC4Occupations–WLA.Rankedby2015Jobs(n=>100)
SOC 4 Description 2015 Jobs
2022 Jobs
2015 - 2022
Change
2015 - 2022 % Change
2015 Location Quotient
2022 Location Quotient
Openings Annual Openings
Median Hourly
Earnings 7111 Sales and retail assistants 38,109 40,275 2,166 6% 0.97 0.99 11,616 1,659 7.87 9233 Cleaners and domestics 21,309 22,436 1,127 5% 0.90 0.91 6,920 989 7.32 4159 Other administrative occupations n.e.c. 20,599 21,563 964 5% 0.92 0.91 6,975 996 12.00 3545 Sales accounts and business development managers 20,149 21,220 1,071 5% 1.27 1.25 6,661 952 22.83
6214 Air travel assistants 19,369 20,668 1,299 7% 11.37 11.24 7,994 1,142 16.76 9272 Kitchen and catering assistants 18,651 20,601 1,950 10% 1.04 1.06 7,130 1,019 7.37 6145 Care workers and home carers 18,255 19,907 1,652 9% 0.73 0.73 7,561 1,080 8.83 4122 Book-keepers, payroll managers and wages clerks 17,808 19,222 1,414 8% 1.15 1.17 6,724 961 13.82
2231 Nurses 17,238 18,276 1,038 6% 0.84 0.82 6,453 922 18.57 9260 Elementary storage occupations 15,950 16,909 959 6% 0.89 0.89 5,287 755 8.74 2315 Primary and nursery education teaching professionals 14,240 15,158 918 6% 1.09 1.13 5,606 801 22.93 1190 Managers and directors in retail and wholesale 13,878 14,523 645 5% 1.13 1.14 4,621 660 14.24
9241 Security guards and related occupations 13,537 14,081 544 4% 2.13 2.08 4,341 620 8.98 6125 Teaching assistants 10,818 11,493 675 6% 1.05 1.08 4,132 590 9.73 9273 Waiters and waitresses 10,761 11,670 909 8% 0.94 0.94 3,864 552 7.00 2314 Secondary education teaching professionals 10,497 10,961 464 4% 0.98 0.99 3,930 561 24.20
1132 Marketing and sales directors 10,413 11,077 664 6% 1.64 1.62 3,625 518 38.71 2136 Programmers and software development professionals 10,071 10,931 860 9% 1.35 1.33 3,322 475 21.89 4215 Personal assistants and other secretaries 9,544 10,038 494 5% 1.14 1.14 3,534 505 16.56 2421 Chartered and certified accountants 9,494 10,517 1,023 11% 1.39 1.44 4,128 590 23.04
4216 Receptionists 9,391 10,039 648 7% 1.00 1.00 3,669 524 9.21 3543 Marketing associate professionals 9,206 9,794 588 6% 1.56 1.55 3,167 452 15.29 1131 Financial managers and directors 9,147 9,526 379 4% 1.15 1.11 2,945 421 39.05 5434 Chefs 8,919 9,656 737 8% 1.03 1.03 2,677 382 8.50
2133 IT specialist managers 8,710 9,206 496 6% 1.29 1.28 2,584 369 26.38 7219 Customer service occupations n.e.c. 8,664 9,100 436 5% 0.97 0.96 2,569 367 10.39 1251 Property, housing and estate managers 8,628 9,341 713 8% 1.31 1.31 3,721 532 19.09 6141 Nursing auxiliaries and assistants 8,180 8,690 510 6% 0.75 0.74 3,137 448 11.03
8212 Van drivers 7,951 8,367 416 5% 1.09 1.09 2,837 405 9.75 2139 Information technology and telecommunications 7,883 8,440 557 7% 1.44 1.41 2,466 352 19.48

Emsi:SkillsDemandAnalysisWestLondonAlliance
EconomicModellingSpecialistsInt.www.economicmodelling.co.uk
24
SOC 4 Description 2015 Jobs
2022 Jobs
2015 - 2022
Change
2015 - 2022 % Change
2015 Location Quotient
2022 Location Quotient
Openings Annual Openings
Median Hourly
Earnings professionals n.e.c.
2424 Business and financial project management professionals 7,868 8,223 355 5% 1.16 1.14 2,819 403 25.53
8211 Large goods vehicle drivers 7,671 7,895 224 3% 0.75 0.75 2,573 368 12.92 8213 Bus and coach drivers 7,570 8,020 450 6% 1.88 1.89 2,761 394 13.81 3562 Human resources and industrial relations officers 7,510 7,984 474 6% 1.30 1.31 2,577 368 15.29 1259 Managers and proprietors in other services n.e.c. 7,470 7,719 249 3% 1.28 1.23 2,807 401 16.54
1135 Human resource managers and directors 7,413 7,943 530 7% 1.50 1.51 2,639 377 26.87 7112 Retail cashiers and check-out operators 7,285 7,729 444 6% 0.91 0.92 2,251 322 8.12 7130 Sales supervisors 7,189 7,612 423 6% 1.02 1.03 2,200 314 10.06 3416 Arts officers, producers and directors 6,862 6,891 29 0% 4.40 4.18 2,222 317 20.93
2211 Medical practitioners 6,729 7,106 377 6% 0.88 0.86 2,524 361 30.19 2423 Management consultants and business analysts 6,462 6,968 506 8% 1.15 1.13 2,587 370 25.40 9274 Bar staff 6,440 6,771 331 5% 0.60 0.59 2,113 302 6.95 3542 Business sales executives 6,353 6,590 237 4% 1.19 1.18 2,037 291 13.66
3512 Aircraft pilots and flight engineers 6,163 6,573 410 7% 10.91 11.06 2,130 304 69.54 9211 Postal workers, mail sorters, messengers and couriers 5,933 6,351 418 7% 1.18 1.20 2,075 296 13.65 4161 Office managers 5,835 6,125 290 5% 1.00 0.99 1,996 285 15.41 8111 Food, drink and tobacco process operatives 5,716 6,058 342 6% 1.28 1.33 1,515 216 7.38
4129 Financial administrative occupations n.e.c. 5,525 5,781 256 5% 0.96 0.95 1,867 267 12.10 1121 Production managers and directors in manufacturing 5,487 5,596 109 2% 0.70 0.70 1,656 237 25.32 9134 Packers, bottlers, canners and fillers 5,335 5,684 349 7% 0.85 0.87 1,549 221 7.18 7220 Customer service managers and supervisors 5,134 5,423 289 6% 1.10 1.09 1,559 223 14.11
4112 National government administrative occupations 4,784 4,617 -167 -3% 0.80 0.76 1,364 195 13.07 1139 Functional managers and directors n.e.c. 4,695 4,970 275 6% 1.37 1.36 1,600 229 29.43 3538 Financial accounts managers 4,610 4,864 254 6% 1.02 1.01 1,534 219 22.85 2319 Teaching and other educational professionals n.e.c. 4,488 4,608 120 3% 1.05 1.04 1,596 228 19.04
2135 IT business analysts, architects and systems designers 4,463 4,749 286 6% 1.30 1.28 1,363 195 25.74
1223 Restaurant and catering establishment managers and proprietors 4,378 4,797 419 10% 1.16 1.16 1,956 279 11.35
3534 Finance and investment analysts and advisers 4,273 4,447 174 4% 0.79 0.76 1,353 193 21.47 3131 IT operations technicians 4,271 4,446 175 4% 1.16 1.13 1,152 165 16.42

Emsi:SkillsDemandAnalysisWestLondonAlliance
EconomicModellingSpecialistsInt.www.economicmodelling.co.uk
25
SOC 4 Description 2015 Jobs
2022 Jobs
2015 - 2022
Change
2015 - 2022 % Change
2015 Location Quotient
2022 Location Quotient
Openings Annual Openings
Median Hourly
Earnings 3539 Business and related associate professionals n.e.c. 4,262 4,410 148 3% 1.05 1.02 1,325 189 15.73 9244 School midday and crossing patrol occupations 4,174 4,592 418 10% 1.14 1.20 1,580 226 8.29 6121 Nursery nurses and assistants 4,106 4,511 405 10% 0.88 0.91 1,745 249 8.14 3563 Vocational and industrial trainers and instructors 4,081 4,267 186 5% 0.86 0.86 1,320 189 15.26
5231 Vehicle technicians, mechanics and electricians 4,072 4,165 93 2% 0.70 0.69 1,059 151 11.81 1161 Managers and directors in transport and distribution 4,037 4,271 234 6% 1.63 1.65 1,372 196 20.13 4133 Stock control clerks and assistants 3,963 4,285 322 8% 1.09 1.12 1,507 215 9.82 1162 Managers and directors in storage and warehousing 3,936 4,095 159 4% 1.13 1.12 1,263 180 14.15
4134 Transport and distribution clerks and assistants 3,909 4,185 276 7% 1.75 1.78 1,432 205 12.69 1122 Production managers and directors in construction 3,781 4,140 359 9% 0.95 0.96 1,450 207 20.29 4131 Records clerks and assistants 3,663 3,848 185 5% 0.89 0.89 1,261 180 12.14 5241 Electricians and electrical fitters 3,658 3,631 -27 -1% 0.59 0.55 884 126 16.09
2471 Journalists, newspaper and periodical editors 3,602 3,653 51 1% 2.31 2.28 1,216 174 18.05 8233 Air transport operatives 3,529 3,779 250 7% 8.41 8.46 1,327 190 13.23 6126 Educational support assistants 3,517 3,724 207 6% 0.92 0.94 1,328 190 9.00 5435 Cooks 3,499 3,931 432 12% 1.06 1.08 1,210 173 8.41
3132 IT user support technicians 3,459 3,626 167 5% 1.13 1.10 958 137 16.77 1115 Chief executives and senior officials 3,457 3,639 182 5% 1.60 1.58 1,153 165 48.72 3312 Police officers (sergeant and below) 3,317 3,075 -242 -7% 0.86 0.79 576 82 20.75 3541 Buyers and procurement officers 3,248 3,435 187 6% 1.24 1.24 1,094 156 16.37
5319 Construction and building trades n.e.c. 3,219 3,512 293 9% 1.01 1.03 1,147 164 15.61 6232 Caretakers 3,134 3,296 162 5% 1.13 1.13 1,248 178 11.37 4113 Local government administrative occupations 3,104 3,096 -8 -0% 0.74 0.72 936 134 14.15 2317 Senior professionals of educational establishments 3,101 3,230 129 4% 1.05 1.07 1,136 162 28.26
2413 Solicitors 3,084 3,325 241 8% 0.79 0.82 1,249 178 24.90 3239 Welfare and housing associate professionals n.e.c. 2,984 3,185 201 7% 0.79 0.79 1,101 157 13.43
3417 Photographers, audio-visual and broadcasting equipment operators 2,967 3,043 76 3% 2.20 2.14 1,025 146 12.96
2312 Further education teaching professionals 2,960 2,860 -100 -3% 0.71 0.68 942 135 21.33 9120 Elementary construction occupations 2,958 3,197 239 8% 0.82 0.83 921 132 9.03 8222 Fork-lift truck drivers 2,936 3,111 175 6% 0.78 0.78 1,074 153 10.50

Emsi:SkillsDemandAnalysisWestLondonAlliance
EconomicModellingSpecialistsInt.www.economicmodelling.co.uk
26
SOC 4 Description 2015 Jobs
2022 Jobs
2015 - 2022
Change
2015 - 2022 % Change
2015 Location Quotient
2022 Location Quotient
Openings Annual Openings
Median Hourly
Earnings 3544 Estate agents and auctioneers 2,911 3,006 95 3% 1.31 1.27 899 128 11.88 2134 IT project and programme managers 2,866 3,055 189 7% 1.37 1.35 882 126 25.26 5223 Metal working production and maintenance fitters 2,805 2,824 19 1% 0.53 0.52 677 97 16.03 1254 Shopkeepers and proprietors – wholesale and retail 2,802 2,597 -205 -7% 0.93 0.93 941 134 13.84
6221 Hairdressers and barbers 2,798 3,171 373 13% 0.96 1.00 1,408 201 7.31 8214 Taxi and cab drivers and chauffeurs 2,754 2,853 99 4% 1.56 1.54 961 137 9.25 9251 Shelf fillers 2,723 2,855 132 5% 0.79 0.80 873 125 9.14
1136 Information technology and telecommunications directors 2,639 2,859 220 8% 1.40 1.39 975 139 36.33
3319 Protective service associate professionals n.e.c. 2,506 2,583 77 3% 1.68 1.66 557 80 16.71 3546 Conference and exhibition managers and organisers 2,497 2,585 88 4% 1.38 1.37 791 113 13.28
3561 Public services associate professionals 2,486 2,517 31 1% 0.91 0.88 735 105 17.21 4151 Sales administrators 2,463 2,570 107 4% 0.88 0.87 829 118 11.24 2462 Quality assurance and regulatory professionals 2,450 2,585 135 6% 1.03 1.03 912 130 24.18
6240 Cleaning and housekeeping managers and supervisors 2,429 2,553 124 5% 0.97 0.98 963 138 9.08
5436 Catering and bar managers 2,425 2,566 141 6% 1.06 1.06 685 98 9.71
2436 Construction project managers and related professionals 2,329 2,523 194 8% 1.19 1.20 942 135 19.28
3113 Engineering technicians 2,286 2,429 143 6% 1.00 1.03 670 96 19.45 2137 Web design and development professionals 2,253 2,457 204 9% 1.41 1.42 760 109 16.49
2472 Public relations professionals 2,249 2,323 74 3% 1.80 1.74 782 112 16.43 7211 Call and contact centre occupations 2,246 2,297 51 2% 0.54 0.51 622 89 9.99 2311 Higher education teaching professionals 2,183 2,259 76 3% 0.56 0.56 806 115 27.00 4211 Medical secretaries 2,175 2,316 141 6% 0.81 0.80 847 121 13.19
2419 Legal professionals n.e.c. 2,157 2,275 118 5% 1.27 1.27 806 115 40.01 6146 Senior care workers 2,107 2,284 177 8% 0.82 0.82 857 122 9.53 2473 Advertising accounts managers and creative directors 2,093 2,136 43 2% 2.14 2.02 709 101 21.34 3421 Graphic designers 2,076 2,191 115 6% 1.20 1.18 749 107 14.58
3442 Sports coaches, instructors and officials 2,060 2,192 132 6% 0.95 0.96 763 109 12.71 2112 Biological scientists and biochemists 2,056 2,099 43 2% 0.83 0.80 538 77 21.14 3234 Housing officers 2,043 2,118 75 4% 1.02 0.99 699 100 14.23 2426 Business and related research professionals 2,037 2,077 40 2% 1.78 1.72 706 101 18.40

Emsi:SkillsDemandAnalysisWestLondonAlliance
EconomicModellingSpecialistsInt.www.economicmodelling.co.uk
27
SOC 4 Description 2015 Jobs
2022 Jobs
2015 - 2022
Change
2015 - 2022 % Change
2015 Location Quotient
2022 Location Quotient
Openings Annual Openings
Median Hourly
Earnings 6212 Travel agents 2,024 2,198 174 9% 1.56 1.61 902 129 12.29 8149 Construction operatives n.e.c. 2,005 2,141 136 7% 0.85 0.85 540 77 11.20 2316 Special needs education teaching professionals 1,995 2,076 81 4% 0.98 0.99 730 104 23.50 6143 Dental nurses 1,989 2,255 266 13% 1.06 1.08 929 133 11.54
4138 Human resources administrative occupations 1,968 2,069 101 5% 0.96 0.95 679 97 10.94 1225 Leisure and sports managers 1,942 2,096 154 8% 1.13 1.15 828 118 17.99 6211 Sports and leisure assistants 1,919 2,051 132 7% 1.01 1.03 801 114 8.41 7129 Sales related occupations n.e.c. 1,870 1,876 6 0% 0.97 0.94 483 69 9.36
3443 Fitness instructors 1,835 2,083 248 14% 1.65 1.73 833 119 14.86 2434 Chartered surveyors 1,830 1,906 76 4% 0.99 0.97 660 94 20.84 7122 Debt, rent and other cash collectors 1,816 1,986 170 9% 1.25 1.29 637 91 9.22 3231 Youth and community workers 1,806 1,892 86 5% 0.74 0.74 636 91 14.33
5315 Carpenters and joiners 1,799 1,889 90 5% 0.55 0.55 570 81 12.36 3111 Laboratory technicians 1,794 1,875 81 5% 0.76 0.76 492 70 11.25 2442 Social workers 1,789 1,857 68 4% 0.72 0.72 653 93 19.83 5314 Plumbers and heating and ventilating engineers 1,786 1,863 77 4% 0.50 0.47 563 80 15.24
4213 School secretaries 1,767 1,856 89 5% 0.90 0.92 654 93 12.97 6122 Childminders and related occupations 1,723 1,870 147 9% 1.27 1.28 709 101 9.83 5249 Electrical and electronic trades n.e.c. 1,722 1,703 -19 -1% 0.78 0.74 397 57 14.98 3422 Product, clothing and related designers 1,703 1,852 149 9% 1.41 1.44 687 98 14.60
2121 Civil engineers 1,692 1,777 85 5% 0.88 0.88 521 74 17.53 3412 Authors, writers and translators 1,692 1,702 10 1% 1.81 1.75 537 77 13.66
2429 Business, research and administrative professionals n.e.c. 1,649 1,668 19 1% 1.42 1.37 548 78 19.94
6222 Beauticians and related occupations 1,645 1,822 177 11% 1.13 1.17 780 111 8.21 7214 Communication operators 1,642 1,732 90 5% 1.84 1.86 500 71 14.97 9219 Elementary administration occupations n.e.c. 1,634 1,675 41 3% 0.97 0.95 490 70 7.77
1133 Purchasing managers and directors 1,617 1,705 88 5% 0.99 0.98 543 78 28.12 2129 Engineering professionals n.e.c. 1,608 1,670 62 4% 0.67 0.67 454 65 19.98 7113 Telephone salespersons 1,602 1,655 53 3% 0.94 0.91 450 64 11.04 4162 Office supervisors 1,581 1,668 87 6% 1.04 1.03 550 79 13.91

Emsi:SkillsDemandAnalysisWestLondonAlliance
EconomicModellingSpecialistsInt.www.economicmodelling.co.uk
28
SOC 4 Description 2015 Jobs
2022 Jobs
2015 - 2022
Change
2015 - 2022 % Change
2015 Location Quotient
2022 Location Quotient
Openings Annual Openings
Median Hourly
Earnings 3520 Legal associate professionals 1,581 1,667 86 5% 0.71 0.71 533 76 14.91 4114 Officers of non-governmental organisations 1,533 1,609 76 5% 0.85 0.84 529 76 16.50 4123 Bank and post office clerks 1,472 1,416 -56 -4% 0.34 0.31 421 60 13.55 8133 Routine inspectors and testers 1,468 1,563 95 6% 0.67 0.70 392 56 10.48
2150 Research and development managers 1,455 1,567 112 8% 1.21 1.24 465 66 25.55 9279 Other elementary services occupations n.e.c. 1,433 1,486 53 4% 1.09 1.07 454 65 6.97
1181 Health services and public health managers and directors 1,422 1,466 44 3% 0.94 0.90 451 64 29.49
1150 Financial institution managers and directors 1,413 1,385 -28 -2% 0.50 0.46 411 59 38.98 2433 Quantity surveyors 1,406 1,568 162 12% 1.11 1.13 626 89 23.12 4121 Credit controllers 1,385 1,420 35 3% 0.98 0.96 444 63 13.19
3535 Taxation experts 1,380 1,559 179 13% 1.40 1.48 581 83 25.17 2124 Electronics engineers 1,360 1,400 40 3% 1.38 1.35 365 52 17.43 2431 Architects 1,356 1,416 60 4% 1.12 1.10 503 72 19.90 2444 Clergy 1,355 1,447 92 7% 1.29 1.28 527 75 13.97
5242 Telecommunications engineers 1,342 1,402 60 4% 0.89 0.86 384 55 16.46 5235 Aircraft maintenance and related trades 1,335 1,394 59 4% 2.01 2.06 366 52 15.86 4217 Typists and related keyboard occupations 1,321 1,373 52 4% 0.78 0.76 472 67 10.98 9139 Elementary process plant occupations n.e.c. 1,320 1,322 2 0% 0.53 0.53 305 44 8.62
4124 Finance officers 1,315 1,357 42 3% 0.96 0.94 427 61 14.94 7114 Pharmacy and other dispensing assistants 1,307 1,372 65 5% 0.60 0.59 397 57 8.05 2122 Mechanical engineers 1,300 1,354 54 4% 0.63 0.63 368 53 24.06 3531 Estimators, valuers and assessors 1,290 1,349 59 5% 0.63 0.64 417 60 21.35
1134 Advertising and public relations directors 1,282 1,302 20 2% 1.82 1.70 392 56 35.77 7125 Merchandisers and window dressers 1,273 1,364 91 7% 1.08 1.08 408 58 12.00 3567 Health and safety officers 1,241 1,322 81 7% 0.95 0.95 431 62 22.47 3532 Brokers 1,234 1,288 54 4% 0.89 0.87 410 59 30.15
9235 Refuse and salvage occupations 1,233 1,376 143 12% 0.87 0.91 500 71 10.64 4214 Company secretaries 1,228 1,314 86 7% 0.88 0.89 484 69 17.60 1184 Social services managers and directors 1,228 1,306 78 6% 0.85 0.85 427 61 19.37 3565 Inspectors of standards and regulations 1,224 1,265 41 3% 0.88 0.87 382 55 16.95

Emsi:SkillsDemandAnalysisWestLondonAlliance
EconomicModellingSpecialistsInt.www.economicmodelling.co.uk
29
SOC 4 Description 2015 Jobs
2022 Jobs
2015 - 2022
Change
2015 - 2022 % Change
2015 Location Quotient
2022 Location Quotient
Openings Annual Openings
Median Hourly
Earnings 2221 Physiotherapists 1,165 1,253 88 8% 0.82 0.81 460 66 18.91 2213 Pharmacists 1,161 1,192 31 3% 0.90 0.86 434 62 20.67 5323 Painters and decorators 1,161 1,245 84 7% 0.70 0.71 399 57 8.96 5245 IT engineers 1,159 1,147 -12 -1% 0.88 0.81 268 38 14.28
7215 Market research interviewers 1,153 1,290 137 12% 2.30 2.44 447 64 9.39 2232 Midwives 1,152 1,220 68 6% 0.83 0.81 436 62 21.01 4212 Legal secretaries 1,148 1,245 97 8% 0.64 0.67 475 68 17.88 7115 Vehicle and parts salespersons and advisers 1,139 1,193 54 5% 0.81 0.82 347 50 10.47
5330 Construction and building trades supervisors 1,132 1,231 99 9% 0.73 0.74 393 56 17.97 6139 Animal care services occupations n.e.c. 1,109 1,098 -11 -1% 0.48 0.47 377 54 10.56 3413 Actors, entertainers and presenters 1,109 1,118 9 1% 1.67 1.60 354 51 12.40
1242 Residential, day and domiciliary care managers and proprietors 1,109 1,187 78 7% 0.72 0.73 461 66 17.97
6123 Playworkers 1,082 1,168 86 8% 0.94 0.96 436 62 8.46 2219 Health professionals n.e.c. 1,060 1,131 71 7% 0.80 0.80 405 58 19.27
5432 Bakers and flour confectioners 1,034 1,010 -24 -2% 0.91 0.88 241 34 9.32 2425 Actuaries, economists and statisticians 1,026 1,072 46 4% 1.08 1.07 371 53 27.17 2126 Design and development engineers 1,001 1,020 19 2% 0.51 0.50 260 37 24.77 1224 Publicans and managers of licensed premises 994 1,018 24 2% 0.50 0.49 380 54 9.72
3564 Careers advisers and vocational guidance specialists 981 1,019 38 4% 0.85 0.84 311 44 11.56 3218 Medical and dental technicians 981 1,035 54 6% 0.90 0.89 356 51 14.06 9275 Leisure and theme park attendants 971 1,020 49 5% 0.96 0.95 330 47 7.59 3537 Financial and accounting technicians 938 1,009 71 8% 0.94 0.95 334 48 23.85
8229 Mobile machine drivers and operatives n.e.c. 929 936 7 1% 0.76 0.73 294 42 12.18 3119 Science, engineering and production technicians n.e.c. 924 985 61 7% 0.88 0.90 276 39 13.95 9132 Industrial cleaning process occupations 913 938 25 3% 0.83 0.83 230 33 8.23 2222 Occupational therapists 883 947 64 7% 0.81 0.80 344 49 19.64
3313 Fire service officers (watch manager and below) 864 863 -1 -0% 0.74 0.74 183 26 16.14 3511 Air traffic controllers 862 913 51 6% 5.57 5.51 290 41 57.03 6231 Housekeepers and related occupations 850 884 34 4% 0.74 0.72 327 47 9.11 1221 Hotel and accommodation managers and proprietors 850 925 75 9% 0.59 0.61 378 54 12.31

Emsi:SkillsDemandAnalysisWestLondonAlliance
EconomicModellingSpecialistsInt.www.economicmodelling.co.uk
30
SOC 4 Description 2015 Jobs
2022 Jobs
2015 - 2022
Change
2015 - 2022 % Change
2015 Location Quotient
2022 Location Quotient
Openings Annual Openings
Median Hourly
Earnings 9236 Vehicle valeters and cleaners 846 870 24 3% 0.97 0.96 261 37 7.18 2142 Environment professionals 844 876 32 4% 0.81 0.78 242 35 22.24 3233 Child and early years officers 825 873 48 6% 1.00 1.01 295 42 12.44 7213 Telephonists 824 861 37 4% 1.28 1.26 244 35 8.94
2119 Natural and social science professionals n.e.c. 823 844 21 3% 0.71 0.70 223 32 20.80 5431 Butchers 819 886 67 8% 0.66 0.68 259 37 8.25 9259 Elementary sales occupations n.e.c. 814 873 59 7% 0.95 0.95 285 41 7.74 5113 Gardeners and landscape gardeners 809 743 -66 -8% 0.39 0.35 291 42 9.91
9242 Parking and civil enforcement occupations 805 763 -42 -5% 1.26 1.14 210 30 10.10 8239 Other drivers and transport operatives n.e.c. 804 841 37 5% 1.20 1.19 285 41 15.23 3415 Musicians 804 802 -2 -0% 1.33 1.25 251 36 16.49 5422 Printers 803 788 -15 -2% 0.77 0.77 178 25 13.18
9234 Launderers, dry cleaners and pressers 802 821 19 2% 0.98 0.96 250 36 6.50 2123 Electrical engineers 801 819 18 2% 0.77 0.74 212 30 24.97
5250 Skilled metal, electrical and electronic trades supervisors 796 800 4 1% 0.65 0.63 191 27 17.02
3314 Prison service officers (below principal officer) 787 755 -32 -4% 0.71 0.67 146 21 12.21 6147 Care escorts 785 847 62 8% 1.58 1.63 317 45 8.43 2212 Psychologists 778 831 53 7% 0.86 0.85 300 43 21.08
9249 Elementary security occupations n.e.c. 762 768 6 1% 0.91 0.89 220 31 10.61 3219 Health associate professionals n.e.c. 757 822 65 9% 0.99 0.99 301 43 10.48 3122 Draughtspersons 746 766 20 3% 0.73 0.72 191 27 14.23 6219 Leisure and travel service occupations n.e.c. 744 773 29 4% 0.94 0.94 287 41 15.78
2318 Education advisers and school inspectors 728 731 3 0% 0.84 0.82 247 35 18.19 3213 Paramedics 724 808 84 12% 1.02 1.04 323 46 17.55 2229 Therapy professionals n.e.c. 721 772 51 7% 1.00 0.99 281 40 22.22 3116 Planning, process and production technicians 704 748 44 6% 0.94 0.98 214 31 16.20
3217 Pharmaceutical technicians 690 725 35 5% 0.77 0.74 247 35 11.00 2217 Medical radiographers 687 722 35 5% 0.79 0.76 256 37 21.06 2451 Librarians 683 705 22 3% 0.89 0.92 247 35 20.85 3411 Artists 660 644 -16 -2% 1.51 1.47 214 31 13.18

Emsi:SkillsDemandAnalysisWestLondonAlliance
EconomicModellingSpecialistsInt.www.economicmodelling.co.uk
31
SOC 4 Description 2015 Jobs
2022 Jobs
2015 - 2022
Change
2015 - 2022 % Change
2015 Location Quotient
2022 Location Quotient
Openings Annual Openings
Median Hourly
Earnings 1252 Garage managers and proprietors 657 666 9 1% 0.87 0.87 246 35 17.04 2461 Quality control and planning engineers 656 685 29 4% 0.80 0.80 236 34 22.68 1241 Health care practice managers 655 719 64 10% 0.88 0.89 294 42 17.71 2412 Barristers and judges 645 649 4 1% 0.98 0.95 215 31 22.79
8139 Assemblers and routine operatives n.e.c. 635 669 34 5% 0.56 0.59 165 24 7.66 3536 Importers and exporters 618 664 46 7% 2.23 2.31 228 33 15.85 6144 Houseparents and residential wardens 617 655 38 6% 0.57 0.57 237 34 12.54 3115 Quality assurance technicians 616 655 39 6% 0.98 1.00 181 26 12.22
5316 Glaziers, window fabricators and fitters 616 623 7 1% 0.68 0.68 181 26 9.56 5449 Other skilled trades n.e.c. 606 605 -1 -0% 0.63 0.62 140 20 13.81 8231 Train and tram drivers 604 634 30 5% 0.95 0.94 212 30 27.21 2127 Production and process engineers 570 577 7 1% 0.44 0.44 145 21 20.01
5312 Bricklayers and masons 558 559 1 0% 0.60 0.58 155 22 13.69 3121 Architectural and town planning technicians 553 585 32 6% 0.96 0.95 162 23 14.31 2113 Physical scientists 533 546 13 2% 0.71 0.68 142 20 22.52 2215 Dental practitioners 533 583 50 9% 0.85 0.87 225 32 28.53
4132 Pensions and insurance clerks and assistants 529 537 8 2% 0.29 0.29 170 24 12.62 5114 Groundsmen and greenkeepers 528 554 26 5% 0.56 0.57 234 33 8.80 5215 Welding trades 526 528 2 0% 0.30 0.30 138 20 10.00 9271 Hospital porters 524 553 29 6% 0.86 0.84 179 26 10.72
8134 Weighers, graders and sorters 518 548 30 6% 0.92 0.94 135 19 7.73 2452 Archivists and curators 518 541 23 4% 1.51 1.53 187 27 14.09 2449 Welfare professionals n.e.c. 510 541 31 6% 0.79 0.79 195 28 18.63 5244 TV, video and audio engineers 506 513 7 1% 1.86 1.73 125 18 11.53
2214 Ophthalmic opticians 500 476 -24 -5% 0.82 0.77 152 22 23.89 3441 Sports players 482 522 40 8% 0.79 0.82 195 28 11.20 9232 Street cleaners 472 509 37 8% 1.00 1.00 168 24 8.74 8137 Sewing machinists 468 492 24 5% 0.53 0.59 120 17 6.47
5232 Vehicle body builders and repairers 463 482 19 4% 0.75 0.77 132 19 11.71 5321 Plasterers 461 513 52 11% 0.86 0.90 181 26 9.02 8234 Rail transport operatives 460 485 25 5% 1.24 1.21 166 24 23.47

Emsi:SkillsDemandAnalysisWestLondonAlliance
EconomicModellingSpecialistsInt.www.economicmodelling.co.uk
32
SOC 4 Description 2015 Jobs
2022 Jobs
2015 - 2022
Change
2015 - 2022 % Change
2015 Location Quotient
2022 Location Quotient
Openings Annual Openings
Median Hourly
Earnings 3235 Counsellors 455 491 36 8% 0.72 0.73 177 25 16.12 7123 Roundspersons and van salespersons 454 460 6 1% 0.90 0.89 123 18 10.84 5423 Print finishing and binding workers 453 463 10 2% 0.88 0.90 109 16 10.06 2223 Speech and language therapists 451 493 42 9% 1.00 1.01 188 27 14.11
6215 Rail travel assistants 449 465 16 4% 0.94 0.92 171 24 19.79 3112 Electrical and electronics technicians 447 450 3 1% 0.65 0.63 108 15 17.98 1226 Travel agency managers and proprietors 446 478 32 7% 1.74 1.82 192 27 18.27 2432 Town planning officers 439 458 19 4% 0.85 0.84 159 23 19.26
8141 Scaffolders, stagers and riggers 437 399 -38 -9% 0.48 0.41 82 12 17.01 6142 Ambulance staff (excluding paramedics) 429 482 53 12% 0.72 0.74 203 29 11.93 5442 Furniture makers and other craft woodworkers 422 447 25 6% 0.51 0.53 122 17 13.33 2216 Veterinarians 416 531 115 28% 0.88 1.04 266 38 26.87
4135 Library clerks and assistants 411 404 -7 -2% 0.51 0.52 132 19 11.47 8116 Plastics process operatives 403 440 37 9% 0.39 0.42 125 18 8.73 8143 Rail construction and maintenance operatives 403 437 34 8% 1.54 1.57 120 17 14.42 3114 Building and civil engineering technicians 388 409 21 5% 0.85 0.86 114 16 13.63
8129 Plant and machine operatives n.e.c. 382 392 10 3% 0.46 0.47 87 12 18.83 2114 Social and humanities scientists 380 383 3 1% 0.89 0.86 98 14 18.71 9239 Elementary cleaning occupations n.e.c. 375 386 11 3% 1.08 1.07 114 16 8.20 6131 Veterinary nurses 373 475 102 27% 0.94 1.10 240 34 11.37
3315 Police community support officers 361 337 -24 -7% 0.84 0.78 63 9 14.35 7124 Market and street traders and assistants 360 378 18 5% 1.43 1.52 114 16 10.02 8125 Metal working machine operatives 356 355 -1 -0% 0.23 0.23 74 11 12.09 8135 Tyre, exhaust and windscreen fitters 351 365 14 4% 0.81 0.81 85 12 8.07
2111 Chemical scientists 343 329 -14 -4% 0.49 0.46 80 11 20.03
1173 Senior officers in fire, ambulance, prison and related services 334 328 -6 -2% 0.95 0.92 99 14 28.62
1172 Senior police officers 332 306 -26 -8% 0.92 0.85 88 13 30.02 6148 Undertakers, mortuary and crematorium assistants 319 343 24 8% 0.62 0.61 131 19 10.57 5412 Upholsterers 306 335 29 9% 0.86 0.92 97 14 11.70 5322 Floorers and wall tilers 302 321 19 6% 0.69 0.70 104 15 9.29

Emsi:SkillsDemandAnalysisWestLondonAlliance
EconomicModellingSpecialistsInt.www.economicmodelling.co.uk
33
SOC 4 Description 2015 Jobs
2022 Jobs
2015 - 2022
Change
2015 - 2022 % Change
2015 Location Quotient
2022 Location Quotient
Openings Annual Openings
Median Hourly
Earnings 5221 Metal machining setters and setter-operators 301 294 -7 -2% 0.18 0.18 69 10 12.44 5224 Precision instrument makers and repairers 296 297 1 0% 0.49 0.48 71 10 16.11 8131 Assemblers (electrical and electronic products) 286 274 -12 -4% 0.34 0.33 62 9 9.46 8132 Assemblers (vehicles and metal goods) 274 295 21 8% 0.23 0.25 82 12 19.32
8114 Chemical and related process operatives 271 261 -10 -4% 0.24 0.23 54 8 11.44 5234 Vehicle paint technicians 263 270 7 3% 0.65 0.65 71 10 10.78
1123 Production managers and directors in mining and energy 263 279 16 6% 0.67 0.68 90 13 25.81
2463 Environmental health professionals 256 262 6 2% 0.80 0.79 88 13 22.22 1255 Waste disposal and environmental services managers 255 274 19 7% 0.68 0.68 111 16 15.61
1253 Hairdressing and beauty salon managers and proprietors 255 280 25 10% 0.86 0.88 120 17 13.83
5433 Fishmongers and poultry dressers 248 266 18 7% 0.91 0.93 74 11 7.70 8127 Printing machine assistants 246 240 -6 -2% 0.48 0.47 49 7 10.32
1116 Elected officers and representatives 238 235 -3 -1% 0.85 0.82 69 10 35.94 5414 Tailors and dressmakers 237 240 3 1% 0.99 1.00 59 8 7.29 8142 Road construction operatives 233 261 28 12% 0.55 0.56 79 11 11.50 8121 Paper and wood machine operatives 221 212 -9 -4% 0.21 0.21 45 6 9.59
2141 Conservation professionals 207 217 10 5% 0.42 0.41 61 9 21.45 9231 Window cleaners 206 215 9 4% 0.64 0.61 73 10 8.34 5441 Glass and ceramics makers, decorators and finishers 203 177 -26 -13% 0.90 0.82 41 6 13.10 5443 Florists 202 202 0 0% 0.72 0.71 52 7 7.56
9119 Fishing and other elementary agriculture occupations n.e.c. 202 196 -6 -3% 0.21 0.20 45 6 7.14
8113 Textile process operatives 201 215 14 7% 0.55 0.64 55 8 8.77
8221 Crane drivers 190 199 9 5% 0.74 0.75 68 10 13.10 5237 Rail and rolling stock builders and repairers 183 196 13 7% 1.34 1.35 56 8 23.20 5225 Air-conditioning and refrigeration engineers 182 175 -7 -4% 0.46 0.40 43 6 16.18 6132 Pest control officers 179 176 -3 -2% 0.93 0.84 63 9 13.51
7121 Collector salespersons and credit agents 175 178 3 2% 0.44 0.43 50 7 9.47 5222 Tool makers, tool fitters and markers-out 170 166 -4 -2% 0.40 0.40 39 6 14.64 2218 Podiatrists 164 176 12 7% 0.74 0.74 66 9 22.39 5313 Roofers, roof tilers and slaters 156 147 -9 -6% 0.30 0.26 38 5 14.17
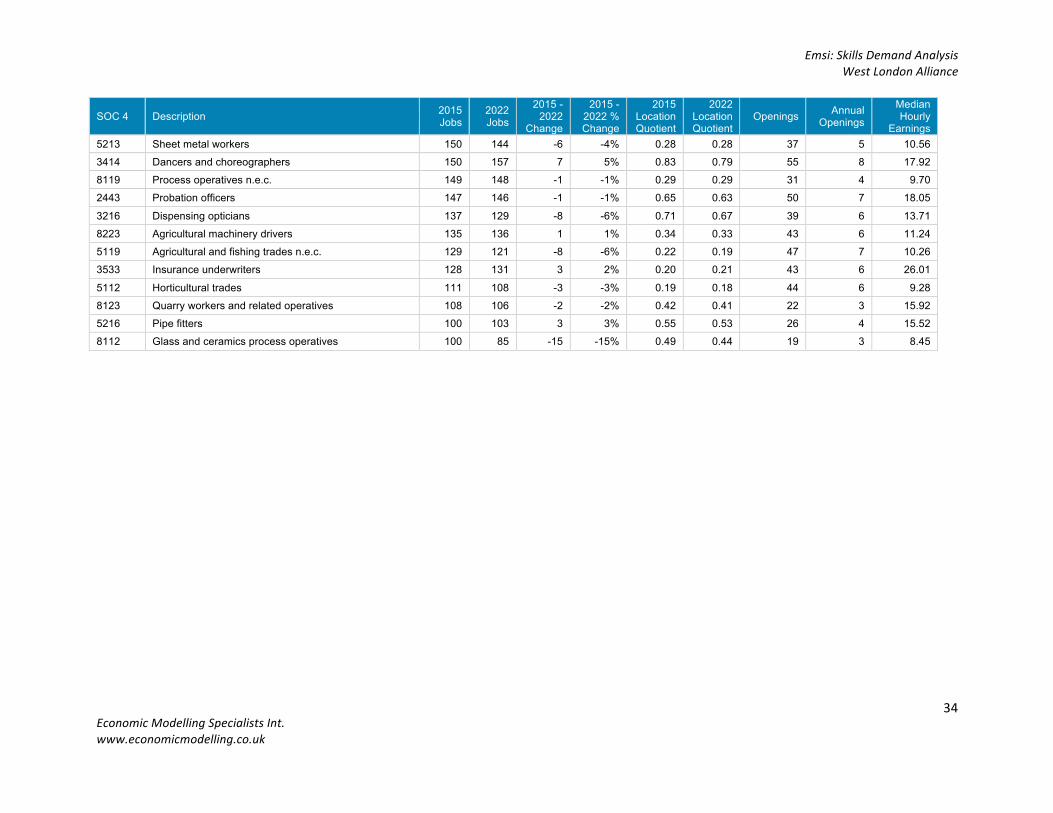
Emsi:SkillsDemandAnalysisWestLondonAlliance
EconomicModellingSpecialistsInt.www.economicmodelling.co.uk
34
SOC 4 Description 2015 Jobs
2022 Jobs
2015 - 2022
Change
2015 - 2022 % Change
2015 Location Quotient
2022 Location Quotient
Openings Annual Openings
Median Hourly
Earnings 5213 Sheet metal workers 150 144 -6 -4% 0.28 0.28 37 5 10.56 3414 Dancers and choreographers 150 157 7 5% 0.83 0.79 55 8 17.92 8119 Process operatives n.e.c. 149 148 -1 -1% 0.29 0.29 31 4 9.70 2443 Probation officers 147 146 -1 -1% 0.65 0.63 50 7 18.05
3216 Dispensing opticians 137 129 -8 -6% 0.71 0.67 39 6 13.71 8223 Agricultural machinery drivers 135 136 1 1% 0.34 0.33 43 6 11.24 5119 Agricultural and fishing trades n.e.c. 129 121 -8 -6% 0.22 0.19 47 7 10.26 3533 Insurance underwriters 128 131 3 2% 0.20 0.21 43 6 26.01
5112 Horticultural trades 111 108 -3 -3% 0.19 0.18 44 6 9.28 8123 Quarry workers and related operatives 108 106 -2 -2% 0.42 0.41 22 3 15.92 5216 Pipe fitters 100 103 3 3% 0.55 0.53 26 4 15.52 8112 Glass and ceramics process operatives 100 85 -15 -15% 0.49 0.44 19 3 8.45

Emsi:SkillsDemandAnalysisWestLondonAlliance
EconomicModellingSpecialistsInt.www.economicmodelling.co.uk
35
Skills–WestLondonFigure2:WestLondon-AnnualOpeningsbySectorSubjectAreaTier2andHighestQualificationLevel
0 1,000 2,000 3,000 4,000 5,000 6,000 7,000 8,000 9,000 10,000
101 History102 Archaeology and Archaeological Sciences
103 Philosophy111 Geography
113 Politics115 Anthropology
022 Mathematics and Statistics114 Economics
034 Environmental Conservation104 Theology and Religious Studies
121 Languages, Literature and Culture of the British Isles122 Other Languages, Literature and Culture
123 Linguistics, Semiotics, Translation051 Architecture
033 Animal Care and Veterinary Science112 Sociology and Social Policy032 Horticulture And Forestry
053 Urban, Rural and Regional Planning031 Agriculture
062 ICT for Users155 Law and Legal Services
081 Sport, Leisure and Recreation091 Performing Arts
015 Child Development and Well-Being132 Direct Learning Support
094 Publishing and Information Services041 Engineering
011 Medicine and Dentistry082 Travel and Tourism
092 Crafts, Creative Arts and Design093 Media and Communication
042 Manufacturing Technologies052 Building and Construction
072 Warehousing and Distribution061 ICT Practitioners
021 Science131 Teaching and Lecturing
012 Nursing and Subjects and Vocations Allied to Medicine151 Accounting and Finance
073 Service Enterprises071 Retailing and Wholesaling
043 Transportation Operations and Maintenance074 Hospitality and Catering
013 Health and Social Care014 Public Services152 Administration
154 Marketing and Sales153 Business Management
Level 0 Level 1 Level 2 Level 3 Level 4-5 Level 6+

Emsi:SkillsDemandAnalysisWestLondonAlliance
EconomicModellingSpecialistsInt.www.economicmodelling.co.uk
36
Figure3:WestLondon-SectorSubjectAreaTier2byHighestQualificationLevel(asapercentageofeachSSA)
RankedbyAnnualOpenings
0% 10% 20% 30% 40% 50% 60% 70% 80% 90% 100%
101 History102 Archaeology and Archaeological Sciences
103 Philosophy111 Geography
113 Politics115 Anthropology
022 Mathematics and Statistics114 Economics
034 Environmental Conservation104 Theology and Religious Studies
121 Languages, Literature and Culture of the British Isles122 Other Languages, Literature and Culture
123 Linguistics, Semiotics, Translation051 Architecture
033 Animal Care and Veterinary Science112 Sociology and Social Policy032 Horticulture And Forestry
053 Urban, Rural and Regional Planning031 Agriculture
062 ICT for Users155 Law and Legal Services
081 Sport, Leisure and Recreation091 Performing Arts
015 Child Development and Well-Being132 Direct Learning Support
094 Publishing and Information Services041 Engineering
011 Medicine and Dentistry082 Travel and Tourism
092 Crafts, Creative Arts and Design093 Media and Communication
042 Manufacturing Technologies052 Building and Construction
072 Warehousing and Distribution061 ICT Practitioners
021 Science131 Teaching and Lecturing
012 Nursing and Subjects and Vocations Allied to Medicine151 Accounting and Finance
073 Service Enterprises071 Retailing and Wholesaling
043 Transportation Operations and Maintenance074 Hospitality and Catering
013 Health and Social Care014 Public Services152 Administration
154 Marketing and Sales153 Business Management
Level 0 Level 1 Level 2 Level 3 Level 4-5 Level 6+

Emsi:SkillsDemandAnalysisWestLondonAlliance
EconomicModellingSpecialistsInt.www.economicmodelling.co.uk
37
Table5:WestLondon-QualificationvolumesbySSAT2andHighestQualificationLevel
RankedbyAnnualOpenings(n>100)
SSA
T2SSAT2Name Level0 Level1 Level2 Level3
Level
4-5
Level
6+
Annual
Openings
153 BusinessManagement 194 468 853 1344 581 5133 8,572
154 MarketingandSales 347 598 1346 1707 568 3960 8,527
152 Administration 245 420 1338 1191 501 2023 5,718
014 PublicServices 528 658 743 782 428 1940 5,079
013 HealthandSocialCare 125 278 600 818 754 2238 4,813
074 HospitalityandCatering 400 1032 860 933 228 733 4,187
043 TransportationOperationsandMaintenance 258 819 916 984 301 694 3,973
071 RetailingandWholesaling 265 426 699 909 271 883 3,452
073 ServiceEnterprises 558 606 580 569 268 778 3,359
151 AccountingandFinance 31 189 415 469 192 1708 3,004
012 NursingandSubjectsandVocationsAlliedtoMedicine 37 99 167 262 519 1700 2,784
131 TeachingandLecturing 2 44 83 150 173 1982 2,434
021 Science 9 55 97 181 361 1515 2,217
061 ICTPractitioners 20 84 202 309 165 1352 2,132
072 WarehousingandDistribution 205 344 545 444 109 390 2,037
052 BuildingandConstruction 125 310 290 566 188 534 2,013
042 ManufacturingTechnologies 193 338 324 463 164 268 1,750
093 MediaandCommunication 10 27 47 150 102 1230 1,567
092 Crafts,CreativeArtsandDesign 33 57 100 211 120 1038 1,559
082 TravelandTourism 38 177 461 318 191 367 1,552
011 MedicineandDentistry 3 30 7 24 319 1116 1,499
041 Engineering 30 63 167 446 140 594 1,439
094 PublishingandInformationServices 21 53 107 127 71 906 1,285
132 DirectLearningSupport 13 44 183 201 80 259 780
015 ChildDevelopmentandWell-Being 37 80 151 232 108 164 772
091 PerformingArts 4 11 21 70 37 526 670
081 Sport,LeisureandRecreation 10 30 112 185 52 187 577
155 LawandLegalServices 4 9 32 54 9 361 468
062 ICTforUsers 6 12 44 66 24 149 301
031 Agriculture 20 27 55 55 26 107 291
053 Urban,RuralandRegionalPlanning 3 3 36 35 13 163 254
032 HorticultureAndForestry 21 32 41 40 11 16 160
112 SociologyandSocialPolicy 2 1 3 12 16 102 135
033 AnimalCareandVeterinaryScience 4 6 31 27 14 48 130
051 Architecture 2 1 8 16 13 87 126
122 OtherLanguages,LiteratureandCulture 0 2 3 5 6 105 123
123 Linguistics,Semiotics,Translation 0 2 3 5 6 105 123
Note:a‘London’LFSskillsprofilehasbeenappliedtotheAnnualOpeningsfortheWLAregion

Emsi:SkillsDemandAnalysisWestLondonAlliance
EconomicModellingSpecialistsInt.www.economicmodelling.co.uk
38
Skills–AreaofEconomicInterestFigure4:AOEI-AnnualOpeningsbySectorSubjectAreaTier2andHighestQualificationLevel
0 5,000 10,000 15,000 20,000 25,000 30,000
101 History102 Archaeology and Archaeological Sciences
103 Philosophy111 Geography
113 Politics115 Anthropology
034 Environmental Conservation033 Animal Care and Veterinary Science
104 Theology and Religious Studies032 Horticulture And Forestry
121 Languages, Literature and Culture of the British Isles112 Sociology and Social Policy022 Mathematics and Statistics
114 Economics122 Other Languages, Literature and Culture
123 Linguistics, Semiotics, Translation051 Architecture
031 Agriculture132 Direct Learning Support
053 Urban, Rural and Regional Planning081 Sport, Leisure and Recreation
015 Child Development and Well-Being062 ICT for Users
082 Travel and Tourism091 Performing Arts
042 Manufacturing Technologies043 Transportation Operations and Maintenance
041 Engineering072 Warehousing and Distribution
011 Medicine and Dentistry052 Building and Construction
155 Law and Legal Services131 Teaching and Lecturing
094 Publishing and Information Services021 Science
012 Nursing and Subjects and Vocations Allied to Medicine092 Crafts, Creative Arts and Design
093 Media and Communication071 Retailing and Wholesaling
061 ICT Practitioners073 Service Enterprises
013 Health and Social Care074 Hospitality and Catering
014 Public Services152 Administration
151 Accounting and Finance154 Marketing and Sales
153 Business Management
Level 0 Level 1 Level 2 Level 3 Level 4-5 Level 6+

Emsi:SkillsDemandAnalysisWestLondonAlliance
EconomicModellingSpecialistsInt.www.economicmodelling.co.uk
39
Table6:AOEI-QualificationvolumesbySSAT2andHighestQualificationLevel
RankedbyAnnualOpenings(n>100)
SSA
T2SSAT2Name Level0 Level1 Level2 Level3
Level
4-5
Level
6+
Annual
Openings
153 BusinessManagement 448 1261 2587 3866 1656 18732 28,549
154 MarketingandSales 709 1263 3150 3989 1370 11625 22,106
151 AccountingandFinance 129 822 2278 2750 898 9960 16,837
152 Administration 647 1169 3884 3544 1466 5977 16,687
014 PublicServices 1188 1423 1894 2162 1074 7679 15,419
074 HospitalityandCatering 834 2344 1760 2122 542 1799 9,401
013 HealthandSocialCare 179 392 921 1313 1284 4158 8,247
073 ServiceEnterprises 1408 1463 1409 1386 700 1794 8,160
061 ICTPractitioners 45 270 644 888 532 4851 7,230
071 RetailingandWholesaling 431 742 1237 1610 478 1596 6,094
093 MediaandCommunication 40 93 161 521 357 4331 5,503
092 Crafts,CreativeArtsandDesign 64 146 256 622 409 3528 5,026
012 NursingandSubjectsandVocationsAlliedtoMedicine 62 170 279 441 900 3101 4,953
021 Science 16 111 245 409 666 3225 4,671
094 PublishingandInformationServices 96 198 336 531 259 3133 4,553
131 TeachingandLecturing 4 70 197 319 316 3528 4,433
155 LawandLegalServices 30 79 273 441 68 3189 4,081
052 BuildingandConstruction 181 426 431 905 358 1483 3,784
011 MedicineandDentistry 6 54 13 43 580 1968 2,665
072 WarehousingandDistribution 264 420 684 565 136 530 2,599
041 Engineering 31 79 250 497 265 1235 2,357
043 TransportationOperationsandMaintenance 212 634 553 534 143 269 2,346
042 ManufacturingTechnologies 229 383 395 615 213 467 2,301
091 PerformingArts 13 36 75 222 121 1745 2,212
082 TravelandTourism 40 112 308 281 119 245 1,105
062 ICTforUsers 21 41 153 227 83 511 1,036
015 ChildDevelopmentandWell-Being 34 82 163 273 162 278 992
081 Sport,LeisureandRecreation 19 54 185 312 82 315 969
053 Urban,RuralandRegionalPlanning 9 11 122 120 43 582 888
132 DirectLearningSupport 15 37 168 184 79 226 708
031 Agriculture 41 56 115 116 55 281 664
051 Architecture 8 3 33 68 51 474 636
122 OtherLanguages,LiteratureandCulture 0 9 11 20 22 432 494
123 Linguistics,Semiotics,Translation 0 9 11 20 22 432 494
022 MathematicsandStatistics 0 0 1 14 0 424 438
114 Economics 0 0 1 14 0 424 438
112 SociologyandSocialPolicy 5 4 7 33 41 287 378
121 Languages,LiteratureandCultureoftheBritishIsles 0 7 11 21 23 269 331
032 HorticultureAndForestry 38 56 74 78 26 37 309
104 TheologyandReligiousStudies 5 1 17 11 14 196 245
033 AnimalCareandVeterinaryScience 8 10 59 48 22 68 215
034 EnvironmentalConservation 0 3 4 13 14 178 212
Note:a‘London’LFSskillsprofilehasbeenappliedtotheAnnualOpeningsfortheAreaofEconomicInterest

Emsi:SkillsDemandAnalysisWestLondonAlliance
EconomicModellingSpecialistsInt.www.economicmodelling.co.uk
40
TechnicalAppendixBackgroundtotheresearch
TheannouncementbytheUKGovernmentin2015ofacomprehensiveseriesofAreaBasedReviewsofPost-16EducationandTrainingproviderssetinmotionastrongimpetustoestablishfinanciallyresilienteducationinstitutionsthatofferhighqualityeducationandtrainingbasedontheneedsoflearnersandemployerswithintheirlocalarea.TheReviewsformpartofthegovernment’sbroadagendatoraiseproductivity,inwhichhumancapitaldevelopmentwillplayanimportantrole.
Asaresult,FurtherEducation(FE)collegesstandatthethresholdofpotentiallysignificanteducationalreformandchange.Thereexistwidespreadopportunitiestotransformandimprovethevalueofthecollegesintermsoftheiremployerengagement,improvedlocalcareeropportunities,course/curriculumalignmenttotheneedsofthelocaleconomy,andmore.However,inthefastchangingeconomicandsocialenvironmenttheyoperatein,FEcollegesarefacingincreasingchallengesintheirefforttoidentifyandquantifycourseneedsforlocalresidentsandbusinesses.
Intheireffortstomeetthesechallenges,theymustaccountforthechangingsocio-economicdynamicswithintheircatchmentareas,suchasindustryandoccupationgrowth/decline,aswellasthechangingqualityandcompositionofthearea’sworkforce.Astechnologyprogresses,agrowingneedtoaddressincreasinglycomplexandspecialisedoccupationaltasksrequiresadditionalcustomisationtoeducationandtraining.Asaresult,collegesareincreasinglycalledupontoincorporaterelevantworkforcedevelopmentandtechnicalcoursesinordertomeettheneedsofstudentsandbusinessesintheirservicearea—adeparturefromtraditionalsupply-basededucationtowardademand-drivenmodel.
Withdevolution,theemergenceofCombinedAuthorities,andanincreasingmovementtowardlocalismanddecentralisationofgovernment,thereislikelytobeamuchgreaterlocaldimensiontoskillsplanningandfunding,withlocalauthoritiesworkingalongsidecolleges,employersandotherstrategicpartners,suchasLEPs,toarticulatelocaldemandandcommissiontheskillstheireconomiesandcommunitiesneedbothnowandinthefuture.
InthepostAreaReviewlandscape,LocalOutcomeAgreementshavebeenpositedasatemplateforlocalpartnershipworkinginthefuture,butwhatevertheblueprint,skillsdevolutionismorelikelytomeanmoreregularreviewsoflocalneedsaspartofaregularplanningcycle.WhilethishasbeeninitiatedbytheAreaReviewprocessitisforlocalpartnerstoseizethisopportunityandcontinuethemomentum.
Aimsandobjectives
TheresearchaimstoprovidetheWestLondonAllianceBoroughswitharobustSkillsDemandAnalysis(SDA)toinformtheAreaReviewofPost-16EducationandTraininginitssub-region.
ItaimstoassisttheWLABoroughstogainabetterunderstandingofthedynamicsofitsregionallabourmarketbyprovidingevidenceontheWLAregion’scurrentandfuturelabourmarkettrends.Itprovidesadetailedanalysisatanindustryandoccupationallevelsoastohighlightthelikelyfocusforeducationproviders,assuggestedbythelabourmarketdemandforskills.

Emsi:SkillsDemandAnalysisWestLondonAlliance
EconomicModellingSpecialistsInt.www.economicmodelling.co.uk
41
TheresearchbuildstowardsaskillsconclusionthatclearlyidentifiestheSectorSubjectAreasmostlikelytoservetheskillsneedsoftheWLAeconomy,aswellasindicativevolumesbyqualificationlevel,fortheconsiderationoftheWLAanditseducationpartners
ItishopedthatthefindingsofthisresearchwillhelptheWestLondonBoroughsandCollegesintheirstrategicplanningactivitiesandtosecuretheskillsneedsoftheWestLondoneconomyinthecomingyears.
Methodology
Emsilabourmarketdataismodelledfromanumberofrobust,consistentofficiallabourmarketdatasources,including:
• BusinessRegisterEmploymentSurvey(BRES)• WorkforceJobsSeries(WJS)• AnnualSurveyofHoursandEarnings(ASHE)• AnnualPopulationSurvey(APS)• LabourForceSurvey(LFS)• Mid-yearpopulationestimates• Sub-nationalPopulationProjections• CensusforEnglandandWales,Scotland
Thedataincludesemployeesandproprietors(self-employedworkersPAYEand/orVATregistered).Ourforecastsaremodelledthroughacombinationof3,5and10yearhistorictrendsatthelocalauthority,countyandregionallevels.
Thisbreadthofdata,togetherwithEmsi’suniquemodellingtechniques,allowsEmsitopublishindustryandoccupationdatatothemostgranular4-digitindustryandoccupationlevels(usingSICandSOCcategorisation).
MoregranularanalysisiscrucialinunderstandingthespecificindustriesthatarekeyemployersintheWLAeconomy.Thishelpstakeaccountofthe‘averaging’thatcandisguisemoredetailedemploymenttrendswhenonlylookingattheheadlinesatthe1-digitSICor2-digitSOClevels.
SkillsDemandAnalysis
Tounderstandtheemergingpictureofskillsdemandintheregionweneedtolookindetailattheregion’skeyindustriesandoccupationsandtheimplicationsforskills.Strategically,it’simportanttoidentifykeyareasofgrowthandtobuildthemintothepictureoffutureprovisiontoavoidpotentialskillsshortagesandtheriskoftheoverallareabecominglesscompetitive.
Industrieswhicharegrowingand/oremployingpeopleinlargervolumeswilltendtodrivetheskillsrequiredinthelocalworkforce.However,whileemerginggrowthsectorsmaynotaccountforsignificantemploymentnumberstheymaystillbeofstrategicimportance,oftencontributingtothearea’slocalidentityandwhatmakesitunique.

Emsi:SkillsDemandAnalysisWestLondonAlliance
EconomicModellingSpecialistsInt.www.economicmodelling.co.uk
42
TheSkillsDemandAnalysisaimedtodescribeoccupationaldemandinmorerecognisabletermsforproviders(bycoursecodeandlevel)andtoinformtheWLA’ssubsequentconversationswiththisgroup.
Emsi’sapproachwouldevaluatedetailedindustryandoccupationprojectionsaffectingthewholeofthelocalWLAeconomycoveringtheperiod2015to2022,with2022beingthedateuptowhichWorkingFuturesdatawasprojectedatthetimeoftheresearch.
Ourmethodologywasfocusedpurelyonthedemand-sideusingoccupations,linkedtosubjectareas,asanindicatorforskillsprovision.Thescopeofourmethodologydidnotincludeanassessmentorgapanalysisofsupplysidedata,butwouldlaythefoundationforsubsequentworkinthisarea.
Ourindustryanalysiscoveredhistoricalandprojectedjobsbyindustry,averageearningsandareasofcompetitiveadvantage.Thisincludedanalysisatboththe1-digitaswellas4-digitStandardIndustrialClassification(SIC)leveltoprovidebothahigheraswellasmoredetailedlevelofevidence.
Theoccupationanalysiscoveredhistoricalandprojectedjobsbyoccupation,averageearnings,projectedopeningsandin-demandoccupations(capturingbothreplacementandexpansiondemand)andtypicaleducationattainmentlevelsforeachoccupationoroccupationgroup.Similartotheindustrialanalysis,occupationalanalysiswascarriedoutatahigher2-digitaswellasmoredetailed4-digitStandardOccupationalClassification(SOC)levelstoprovidegreaterdetail.
Anassessmentoftheevidencecollectedbyindustryandoccupationthenfedintoamappingexerciseofthein-demandoccupationsmatchedtosectorsubjectareasasanindicatorofskillsdemand.Thismappingoffersexperimentalstatisticsthatmaygiveanindicationofthelikelyskillsdemandforany
givensubjectareaandtheeducationleveltodeliver.Note:therewillbesomedoublecountingasoccupationscanbeassignedtomultiplesubjectcategories.
The2015LabourForceSurveyprovidesadetailedbreakdownofhighestqualificationheldby4-digitoccupation.ByapplyingthisqualificationprofiletoemploymentintheWLAregion,EmsihasmodelledalikelyskillsprofilefortheWLAregion’sworkforce.Note:ALondonLFSprofilehasbeenusedtoreflectthegreaterdemandforhigherlevelskillsinLondon,inpreferencetothenationalprofile.Althoughthelatterismorerobust,weightednationalleveldatahasbeenusedtobackfillthose4-digitoccupationswherethereisarelativelysmallnumberofobservations(<100).
Figures5and6comparethenationalandLondonLFSprofilesbyLevelandclearlyshowthehigherproportionsofthoseeducatedtoLevel6oraboveinLondon,byeachmajorSOCgroup.
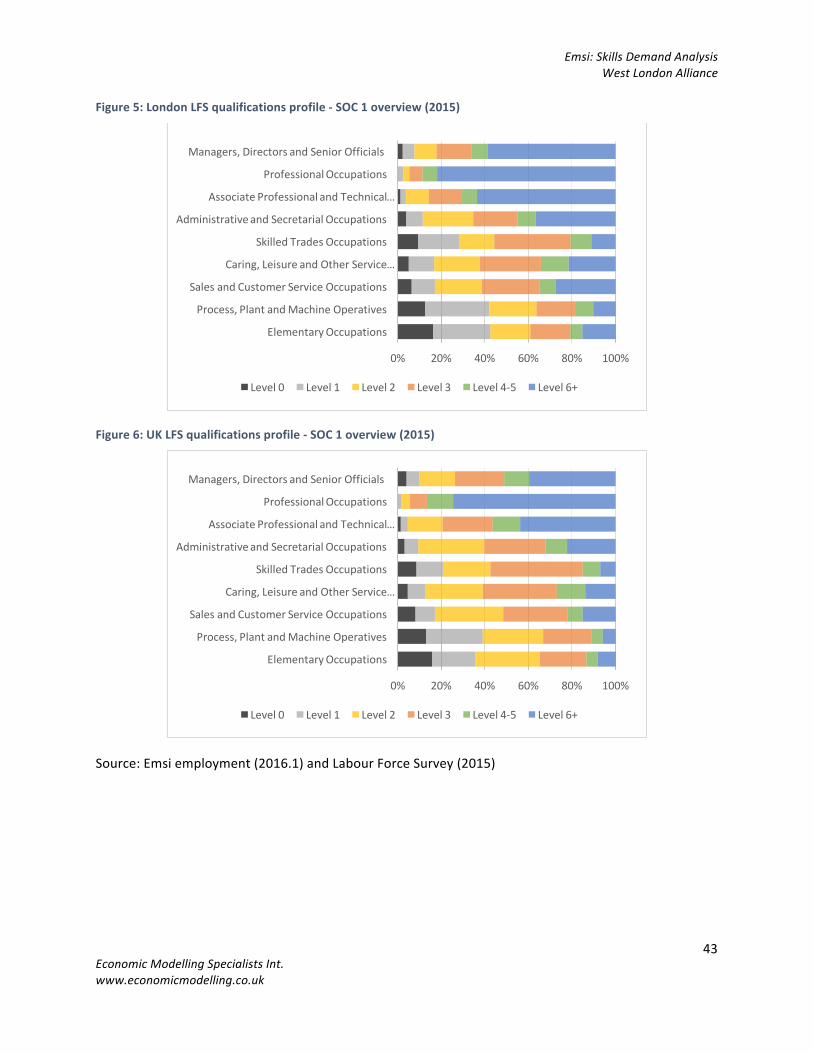
Emsi:SkillsDemandAnalysisWestLondonAlliance
EconomicModellingSpecialistsInt.www.economicmodelling.co.uk
43
Figure5:LondonLFSqualificationsprofile-SOC1overview(2015)
Figure6:UKLFSqualificationsprofile-SOC1overview(2015)
Source:Emsiemployment(2016.1)andLabourForceSurvey(2015)
0% 20% 40% 60% 80% 100%
ElementaryOccupations
Process,PlantandMachineOperatives
SalesandCustomerServiceOccupations
Caring,LeisureandOtherService…
SkilledTradesOccupations
AdministrativeandSecretarialOccupations
AssociateProfessionalandTechnical…
ProfessionalOccupations
Managers,DirectorsandSeniorOfficials
Level0 Level1 Level2 Level3 Level4-5 Level6+

Emsi:SkillsDemandAnalysisWestLondonAlliance
EconomicModellingSpecialistsInt.www.economicmodelling.co.uk
44
Qualitativeresearch
Emsiundertookqualitativetelephoneinterviewswithskillsand/oreconomicdevelopmentrepresentativesfromeachofthesevenLondonBoroughs.Whereavailable,thisresearchwascomplimentedbyanalysisoflocalplansandsimilardocumentsthatcouldquantifyfuturedevelopmentsbysector.Thiselementoftheresearchwouldhelptocontextualiseandverifythedata-drivenanalysisandlendagreaterdegreeofcredibility,enablinglocalpartners‘toseethemselvesinthedata’.
Theinterviewsaimedtoidentifyplanneddevelopmentsandinvestments,skillsshortages,potentialeducationalandotherdevelopmentsatalocallevelthatcouldpotentiallyimpactonskillsdemandintheWLAregioninthecomingyears.Theywouldalsoseektoidentifyaspirationalgrowthsectorsandthoseofstrategicimportancethatmaynotyetbeinfluencingactuallabourmarkettrendsbutareexpectedtobeakeydriversofgrowthwithassociatedskillsrequirementsinthefuture.

Emsi:SkillsDemandAnalysisWestLondonAlliance
EconomicModellingSpecialistsInt.www.economicmodelling.co.uk
45
StudygeographyTheanalysiscoverstheWestLondonAllianceregion.IncludingthefollowingLondonBoroughs:
Figure7:WestLondonAlliancegeography(shown
withinGreaterLondon)
• Barnet• Brent• Ealing• Hammersmith&Fulham• Harrow• Hillingdon• Hounslow
The analysis also considers theWLA’s ‘Area ofEconomic Interest’ (AoEI) as identified byknown commuting patterns. These are areaschiefly in SussexandSurrey,which include thefollowing:
• CityofLondon• Camden• Islington• Kensington&Chelsea• RichmonduponThames• TowerHamlets• Westminster
Figure8:AreaofEconomicInterest
Source:Emsiemploymentdata2016.1

Emsi:SkillsDemandAnalysisWestLondonAlliance
EconomicModellingSpecialistsInt.www.economicmodelling.co.uk
46
AboutEmsiandEmsi’sUKdata
EconomicModellingSpecialistsInternational(Emsi)provideshigh-qualityemploymentdataandeconomicanalysisviacustomreportsandwebtools.WealsoproducecomprehensiveeconomicimpactanalysisforcollegesanduniversitiesintheUK,US,andCanada.Ourclientbaseiscomposedprimarilyoffurthereducationcolleges,highereducation,economicdevelopmentgroups,andlabourmarketinformationagencies.
Emsi’sexpertiseiscentredonregionaleconomics,dataanalysis,programminganddesignsowecanprovidethebest-availableproductsandservicesforregionalstakeholdersanddecision-makers.Emsispecialisesindetailedinformationaboutlocal,regional,andnationaleconomiesforclients’assessmentandplanningpurposes,bringingtogetherindustry,workforce,andeducationperspectives.
Emsi’sUKData
EmsiprovidesthemostdetailedandlocalisedlabourmarketinformationavailableintheUK,whichinturncreatesarobustbaseuponwhichtocreateuniquelylocalisedanddetailemploymentforecasts.Emsibringstogetherdifferentdatasourcestocreatearobustcompositedatasetthatprovidesdetailedlabourmarketinformationonhundredsofindustriesandoccupationsatthelowestgeographiclevels.Byjoiningtogetherthesedatasets,Emsicanprovideuniqueinsightsintotherelationshipbetweenindustrytrendsandassociatedoccupationalrequirements.
Emsibuildsthedatafrom9differentgovernmentdatasources,eachdescribingdifferentaspectsofthelabourmarketthatinisolationonlytellpartofthestoryorcontaininherentweaknesses,butwhenmodelledtogetherprovideamoreholisticandrobustviewofthelabourmarket.Thisprovidestheplatformforemploymentforecaststobecreatedthatdescribelocally-specificemploymenttrends,andwhichareupdatedannuallyasmoreup-to-datedataismadeavailablethroughthegovernmentsources.
TwomajorsourcesareWorkingFutures(high-levelemploymentprojectionsfromtheUKCommissionforEmploymentandSkills)andtheNOMISservicefromtheOfficeforNationalStatistics,whichgiveshistoricanddetailedLMIaboutlocalareas.Combiningdatafromthesesourcescreatessomethingentirelyunique,providingemploymentforecastsatalevelofdetailthatmakeslabourmarketdatausefultoabroadrangeoflocal,regional,andnationalorganisations.Linkingthiswithskillsandcompetencyintelligencehelpstounderstandshiftsintrainingprioritiesassociatedwithachanginglabourforce.
OurdatacapturesmajorrecentchangesinUKdata,includingtheswitchfromSIC2003toSIC2007,migrationfromWorkingFutures2007-2017to2012-2022,andashiftfromABItoBRESastheprimarybasisforstructurallabourmarketemployment.Withthecurrentdataset,weareabletocharacterize563industries(upfrom485industriespreviously)in128geographies(CountyandUnitaryAuthorities)and353occupationsatthelowestlevels.Ouruniquelygranulardatamakesitpossibletoshowdetailed4-digitindustry(SIC)andoccupation(SOC)trendsdowntolocalauthoritylevel,asopposedtohigh-levelindustry,occupationandregional/nationalanalysis,whichcanlackthedegreeofdetailrequiredbykeydecisionmakers.
Emsi:SkillsDemandAnalysisWestLondonAlliance
EconomicModellingSpecialistsInt.www.economicmodelling.co.uk
47
OuremploymentprojectionsarecreatedbytakinglinearregressionsbasedonpasttrendsandadjustingthemtotheWorkingFuturesindustryprojections.Theselinearregressionsarebasedonthreesegmentsofdatathatcorrespondtothelasteightyears,fiveyearsandthreeyears,respectively.
Allofourindustriesareprojectedattheirmostgranularlevel.Weaveragetheregressionstoformasingletrendwhichwedampenovertimetocurbexcessivegainsordeclines.WeuseWorkingFuturesregionalandnationalindustryprojectionstoadjusttheoverallgainordeclineofmacro-levelindustrydivisions,sothatthepercentgainordeclineofprojecteddatamatchestheprojectionspublishedbyWorkingFutures.
ArecentstudyofEmsi’sforecastingdata1revealedthatovera5-yearforecastingperiodtheerrorbetweenourforecastandtheactualemploymentfigurewaslessthan30%in90%ofoccasions,whichcomparesfavourablytosimilarforecastingmodels.
ComparingEmsiandUKCES(WorkingFutures)data
Themainquestionswhenconsideringthebasisforprojectionsare:
1) howyouweightthehistoricseries(i.e.howmuchdoesrecenthistorycountinyourprojectionversuslongertrends?)
2) theextenttowhichyouareconsideringdataexternaltohistorictrends(i.e.weknowthatXinfrastructureprocessisgoingtohappen,orYcompanyisleavingthearea)and;
3) foroccupations,howmuchstructuralchangeisassumedtocontinue(i.e.weknowthatalotofsecretarieshavebeenreplacedbyautomation,buthowmuchfurtherwillthattrendcontinue?)
Dependinghowthosethreequestionsareanswered,itispossibletoarriveatverydifferentprojectionsallbasedonthesamesetofhistoricaldata,withvaryingdegreesofdefensibility.
ThereareanumberoffundamentaldifferencesintheapproachtakenbyEmsiandUKCESinbuildinglabourmarketdataprofilesandforecasts.Hereisasummaryofthekeydifferences:
Modelbasis
Althoughallmodelsarelargelydrivenbyhistoricemploymentdata,Emsi’sapproachtendstobeslightlymoreconservativethanUKCESandGLA,andisrootedinshorterhistorictrendseries.Emsi’sapproachusesacombinationof10,5and3-yearhistorictrendstobalanceforecastsagainstmedium-termtrends,whilealsobeinginfluencedbychangesintheeconomythathaveaffectedrecentemployment.UKCESandGLAforecaststendtoberootedinalongerterm20-yearhistorictimeserieswhichprovidesadealofgreaterstabilitytoforecasts,butislessresponsivetorecentchangesaffectingtheeconomy.InmanycasesthoserecentchangeshavebuckedthelongtermtrendandsohavecreatedadivergencebetweenEmsi’strendandthatsetoutbyUKCESandGLA.
1 http://www.economicmodelling.co.uk/2014/07/30/how-accurate-are-we/.

Emsi:SkillsDemandAnalysisWestLondonAlliance
EconomicModellingSpecialistsInt.www.economicmodelling.co.uk
48
Figure9:GreaterLondon-Transport/storage-ProjectionComparison
InthecaseoftransportationandstorageinWestLondon,whileEmsi’sprojectionshavebeenverifiedagainstWorkingFutures2012-2022data,morerecentUKCESfiguresproducedfortheLondonsub-regionshavebeenbasedontherevisedWorkingFutures2014-2024data,inwhichunusualgrowthintheindustrybetween2013-14appearstohavebeendownwardlyadjustedbyUKCEStomatchthehistoriclineartrendupto2014.
Inthisexample,theWF2012-2022andUKCES2014-2024projectionsareactuallyverysimilarintermsofwheretheyseetheabsolutenumberofjobsin2022,thoughtheyhaveverydifferenttrajectories.UnlessUKCES2024isconsideringotheroutsidefactors,though,therealdifferenceisthatthe2014observedvaluesarewellabovewhatwouldhavebeenexpected.
Italmostappearsthatthe2024valuehasjustbeenmovedbacktothe1990-2014lineartrend.Inonesense,giventhevolatilityoftheindustryovertime,thismaybelogical.Inanothersense,itisdebatablewhetheranindustrywouldbehandicappedbecauseithadunexpectedgrowthinthelastyear.Figure9showsthattheEmsigrowthrateismatchingtheWF2012-2022growthrate.Asmorehistoric(2015)databecomesavailable,andEmsiupdatesitsforecastingattheendof2016,wecanre-evaluatethesetrajectories.
ConcerningtheUKCES’sconsiderationofoutsidefactorsIthisindustry,wewouldneedmoreinformationaboutwhatisinfluencingtheirprojection,howeverthe20-yearhistorictrendiscertaintobepartoftheequation.Emsiconsiderslinearregressions,butbylookingatshortertermtrends(3,5and10yeartrends),weplacemoreweightontherecentpast,whileadjustingfortheUKCESprojectionsattheregionalandnationalleveltobringinthelongerhistoricperspectiveforindustries.
100120140160180200220240260280300
Y1990
Y1991
Y1992
Y1993
Y1994
Y1995
Y1996
Y1997
Y1998
Y1999
Y2000
Y2001
Y2002
Y2003
Y2004
Y2005
Y2006
Y2007
Y2008
Y2009
Y2010
Y2011
Y2012
Y2013
Y2014
Y2015
Y2016
Y2017
Y2018
Y2019
Y2020
Y2021
Y2022
Y2023
Y2024
Employment(000
's)
UKCES2014-2024 WorkingFutures2012-2022
UKCES2014-2024Historic WorkingFutures2012-2022Historic
EMSI2016.1 Linear(UKCES2014-2024Historic)
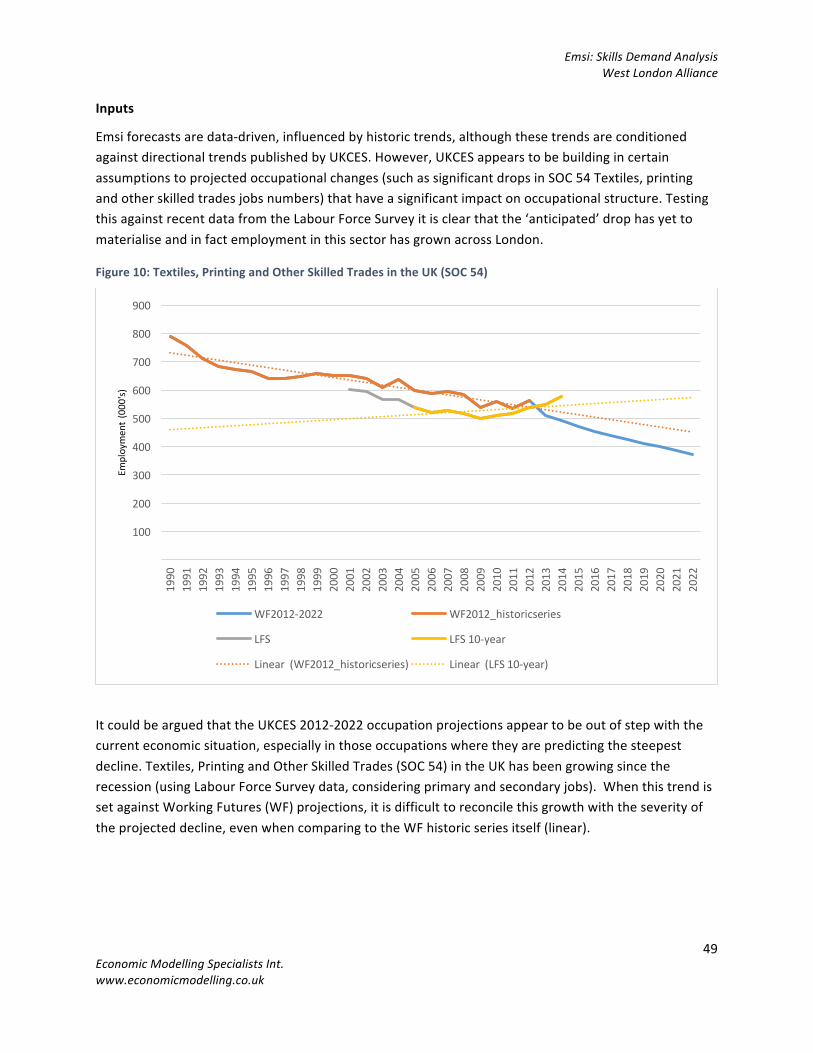
Emsi:SkillsDemandAnalysisWestLondonAlliance
EconomicModellingSpecialistsInt.www.economicmodelling.co.uk
49
Inputs
Emsiforecastsaredata-driven,influencedbyhistorictrends,althoughthesetrendsareconditionedagainstdirectionaltrendspublishedbyUKCES.However,UKCESappearstobebuildingincertainassumptionstoprojectedoccupationalchanges(suchassignificantdropsinSOC54Textiles,printingandotherskilledtradesjobsnumbers)thathaveasignificantimpactonoccupationalstructure.TestingthisagainstrecentdatafromtheLabourForceSurveyitisclearthatthe‘anticipated’drophasyettomaterialiseandinfactemploymentinthissectorhasgrownacrossLondon.
Figure10:Textiles,PrintingandOtherSkilledTradesintheUK(SOC54)
ItcouldbearguedthattheUKCES2012-2022occupationprojectionsappeartobeoutofstepwiththecurrenteconomicsituation,especiallyinthoseoccupationswheretheyarepredictingthesteepestdecline.Textiles,PrintingandOtherSkilledTrades(SOC54)intheUKhasbeengrowingsincetherecession(usingLabourForceSurveydata,consideringprimaryandsecondaryjobs).WhenthistrendissetagainstWorkingFutures(WF)projections,itisdifficulttoreconcilethisgrowthwiththeseverityoftheprojecteddecline,evenwhencomparingtotheWFhistoricseriesitself(linear).
100
200
300
400
500
600
700
800
900
1990
1991
1992
1993
1994
1995
1996
1997
1998
1999
2000
2001
2002
2003
2004
2005
2006
2007
2008
2009
2010
2011
2012
2013
2014
2015
2016
2017
2018
2019
2020
2021
2022
Employment(000
's)
WF2012-2022 WF2012_historicseries
LFS LFS10-year
Linear(WF2012_historicseries) Linear(LFS10-year)

Emsi:SkillsDemandAnalysisWestLondonAlliance
EconomicModellingSpecialistsInt.www.economicmodelling.co.uk
50
Granularity
Emsidataforecastsaredrivenfromasignificantlymoregranularbasis.Bybuildingourhistoricdataatthe4-digitSICandSOCandlocalauthority(LondonBorough)level,Emsiforecastsareresponsivetodetailedchangesinthelocaleconomy.
UKCESandGLAforecastsaretypicallypublishedtotheLondon-Widelevelandat2-digitSOCcodes.Thismeansthatgrowthtrendsaffectingquitedifferentoccupationswithinthesame2-digitparentcategory,maybeaveragedorevenlydistributedtoanextentthatislikelytonotbeaccuratetoanyoneoccupationwithinthegroup.Asqualificationsarebestalignedtothedetailed4-digitSOCcodesthisaveragingcanhaveasignificantimpactontherelevanceoftheskillsplanningdecisionsmade.
MakingassumptionsaboutemploymentdistributionorgrowthtrendsatthegranularSOClevelbasedonthedataandtrendsatmoregeneric(i.e.2-digit)levelwillconcealthedetail,sincemanyoftheoccupationsatthe3and4-digitlevelarequitedifferentfromoneanother,arehighlyunlikelytohavebeengrowingordecliningatthesamerate,ortheiremploymenttobedistributedevenlybetweenthem.Forexample,withinthe2-digitLeisure,TravelandRelatedPersonalServiceOccupations(SOC62)therearesuchdisparateoccupationsasTravelAgents,Caretakers,HairdressersandBarbers,andSportsandLeisureAssistants,but2-digitSOCanalysiswilltreatthemasahomogenousgroup.
Driversofchangeandextraneousfactorstothemodel
Intermsofforecasts,Emsi’sapproachisspecificallytrenddatadriven,whileUKCES’approachbuildsinassumptionsaboutstructuralshiftsinoccupationsthatareexpectedtoaffector‘disrupt’certainoccupationgroupsinthefuture.
Figure11:UKCESTheLabourMarketStory:SkillsfortheFuture

Emsi:SkillsDemandAnalysisWestLondonAlliance
EconomicModellingSpecialistsInt.www.economicmodelling.co.uk
51
Thesestructuralshiftshaveyettomanifestdirectlyinofficialdata,withnoguaranteeiforwhentheywilldoso,andsoarenotaffectingEmsi’sforecastsatthistime.Itissuggested,therefore,thatEmsi’sdatashouldbetreatedasamoreconservative,shortertermindicator.
UKCESdatamayrepresentamoreextremeposition,ifcertainfactorscomeintoplay,andshouldbeusedtoguidelongertermthinking–withthecaveatthatshorttermtrendsaremonitoredcloselytoevidencewhetherthestructuralshiftproposeddoesinfactcomethroughinthedata.
Related Documents