THE RELATIONSHIP BETWEEN LOAN PORTFOLIO SECTORAL CONCENTRATION AND CREDIT RISK OF COMMERCIAL BANKS IN KENYA WESLEY KIPLANGAT KOECH D61/82315/2015 A RESEARCH PROJECT PRESENTED IN PARTIAL FULFILLMENT OF THE REQUIREMENTS FOR THE AWARD OF THE DEGREE OF MASTER OF BUSINESS ADMINISTRATION, SCHOOL OF BUSINESS, UNIVERSITY OF NAIROBI NOVEMBER, 2018

Welcome message from author
This document is posted to help you gain knowledge. Please leave a comment to let me know what you think about it! Share it to your friends and learn new things together.
Transcript

THE RELATIONSHIP BETWEEN LOAN PORTFOLIO SECTORAL
CONCENTRATION AND CREDIT RISK OF COMMERCIAL BANKS IN
KENYA
WESLEY KIPLANGAT KOECH
D61/82315/2015
A RESEARCH PROJECT PRESENTED IN PARTIAL FULFILLMENT OF
THE REQUIREMENTS FOR THE AWARD OF THE DEGREE OF MASTER
OF BUSINESS ADMINISTRATION, SCHOOL OF BUSINESS, UNIVERSITY
OF NAIROBI
NOVEMBER, 2018

ii
DECLARATION
This research project is my original work and has not been submitted for
examination to any other university.
Signature ……………………… Date ………………………
Wesley Kiplangat Koech
This research project has been submitted for examination with our approval as
University of Nairobi Supervisors.
Signature ……………………… Date ………………………….
MR PATRICK KIRAGU
Lecturer, Department of Finance and Accounting
School of Business
University of Nairobi
Signature ……………………… Date ……………………………
DR. WINNIE NYAMUTE
Senior Lecturer, Department of Finance and Accounting
School of Business
University of Nairobi

iii
ACKNOWLEDGEMENT
I acknowledge the contribution of the following for the successful their
contribution in the completion of this research project.
First I thank God for enabling me to complete this project as per my timelines.
I extend my gratitude to supervisors Dr. Winnie Nyamute and Mr. Patrick
Kiragu for his guidance timely response of my concerns from the beginning to
the conclusion of this project.
I would sincerely appreciate my family starting from my wife Mrs. Caroline
Koech and children Shirleen Chebet, Shelma Chepkirui and Sheldon Kiptoo
I thank you for giving me an enabling environment and a great opportunity to
pursue my current study.
I also extend my appreciation to my friends who have always been close to me in
my academic journey all of whom I cannot mention here but best represented by
General Manager Police Sacco Mr. Simon Tanui and my friend from High
School Mr. Ben Siele.
Last I give my appreciation to the University of Nairobi for according me an
opportunity to learn in their institution from undergraduate level up to the
current Masters Level. You remain my best choice of reference.

iv
DEDICATION
I thank God for the provision of good health, energy and resources to finance
this project. My special dedication goes to my lovely wife Mrs. Caroline Koech,
my parents Mr. Joseph Boiyon and Mrs. Ruth Boiyon and my uncle Mr. Philip
Boiyon whose commitment for my education is immeasurable as they kept
encouraging me to pursue further education. I thank you for trusting my
abilities and pray for God to bless you all.
v
TABLE OF CONTENTS
DECLARATION.......................................................................................................... ii
ACKNOWLEDGEMENT ......................................................................................... iii
DEDICATION............................................................................................................. iv
LIST OF TABLES ..................................................................................................... vii
LIST OF FIGURES ................................................................................................. viii
ABBREVATIONS AND ACRONYMS .................................................................... ix
ABSTRACT .................................................................................................................. x
1.1 Background of the Study ...................................................................................... 1
1.1.1 Loan Portfolio Sectoral Concentration .......................................................... 2
1.1.2 Credit Risk ..................................................................................................... 4
1.1.3 Loan Portfolio Sectoral Concentration and Credit Risk ................................ 6
1.1.4 Commercial Banks in Kenya ......................................................................... 7
1.2 Research Problem ................................................................................................. 8
1.3 Research Objectives ........................................................................................... 11
1.4 Value of the Study .............................................................................................. 11
CHAPTER TWO: LITERATURE REVIEW ......................................................... 13
2.1 Introduction ........................................................................................................ 13
2.2 Theoretical Foundations ..................................................................................... 13
2.2.1 Modern Portfolio Theory ............................................................................. 13
2.2.2 Traditional Banking Theory ........................................................................ 15
2.2.3 Trade-off Theory ......................................................................................... 16
2.3 Determinants of Credit Risk ............................................................................... 17
2.3.1 Economic Environment ............................................................................... 17
2.3.2 Inflation ....................................................................................................... 18
2.3.3 Money Supply.............................................................................................. 19
2.3.4 Market Interest Rate .................................................................................... 20
2.3.5 Foreign Exchange Rate ................................................................................ 20
2.3.6 Bank Specific Factors .................................................................................. 21
2.4 Empirical Studies ............................................................................................... 22
2.5 Conceptual Framework ...................................................................................... 26
2.6 Summary of Literature and Research Gap ......................................................... 27

vi
CHAPTER THREE: RESEARCH METHODOLOGY ........................................ 28
3.1 Introduction ........................................................................................................ 28
3.2 Research Design ................................................................................................. 28
3.3 Population of the Study ...................................................................................... 28
3.4 Data Collection ................................................................................................... 29
3.5 Diagnostic Tests ................................................................................................. 29
3.6 Data Analysis ..................................................................................................... 30
3.6.1 Tests of Significance ................................................................................... 31
CHAPTER FOUR: DATA ANALYSIS, FINDINGS AND INTERPRETATION
...................................................................................................................................... 32
4.1 Introduction ........................................................................................................ 32
4.2 Response Rate .................................................................................................... 32
4.3 Diagnostic Tests ................................................................................................. 32
4.4 Descriptive Analysis .......................................................................................... 34
4.5 Correlation Analysis ........................................................................................... 35
4.6 Regression Analysis ........................................................................................... 37
4.7 Interpretation of Research Findings ................................................................... 40
CHAPTER FIVE: SUMMARY, CONCLUSION AND RECOMMENDATIONS
...................................................................................................................................... 42
5.1 Introduction ........................................................................................................ 42
5.2 Summary of Findings ......................................................................................... 42
5.3 Conclusion .......................................................................................................... 43
5.4 Recommendations .............................................................................................. 44
5.5 Limitations of the Study ..................................................................................... 45
5.6 Suggestions for Further Research ...................................................................... 46
REFERENCES ........................................................................................................... 48
APPENDICES ............................................................................................................ 55
Appendix I: Data Collection Form I (Loan Portfolio Concentration) ...................... 55
Appendix II: Data Collection Form II ...................................................................... 56
Appendix III: Licensed Commercial Banks in Kenya ............................................. 57

vii
LIST OF TABLES
Table 4.1: Multicollinearity Test for Tolerance and VIF ............................................ 33
Table 4.2: Normality Test ............................................................................................ 33
Table 4.3: Autocorrelation Test ................................................................................... 34
Table 4.4: Descriptive Statistics .................................................................................. 35
Table 4.5: Correlation Analysis ................................................................................... 36
Table 4.6: Model Summary ......................................................................................... 37
Table 4.7: Analysis of Variance................................................................................... 38
Table 4.8: Model Coefficients ..................................................................................... 39

viii
LIST OF FIGURES
Figure 2.1: Conceptual framework .............................................................................. 26

ix
ABBREVATIONS AND ACRONYMS
ABC : African Banking Corporation
CBK : Central Bank of Kenya
CRBs : Credit Reference Bureaus
CRK : Concentration Ratio
GDP : Gross Domestic Product
HHI : Herfindahl-Hirschman Index
I&M : Investments and Mortgage
Ksh. : Kenya Shillings
MFB : Microfinance Banks
MPT : Modern Portfolio Theory
MRPs : Money Remittance Providers
NIC : National Industrial Credit
NPL : Non Performing Loans
OECD : Organisation for Economic Cooperation and Development
SBM : Southern Bank of Mauritius
USA : United States of America
ROA : Return on Assets
x
ABSTRACT
The business activity in the banking industry is very sensitive as they handle depositors’
money which on average constitutes 85% of their liability portfolio in their balance
sheets. The questions that comes to the mind of commercial banks management while
advancing credit facilities is whether they need to minimise their risk through
diversification of the loan portfolios by advancing loans to various market sectors or
they need to concentrate their loans to a few sectors that they have adequate knowledge.
This study pursued to determine the impact of loan portfolio sectoral concentration on
credit risk of commercial banks in Kenya. The study’s population comprised of all 42
commercial banks operating in Kenya. Data was obtained from 40 out of the 42 banks
giving a response rate of 95.24%. Loan portfolio sectoral concentration was the
independent variable and was measured by the HH1 index on an annual basis. The
control variables were liquidity as measured by the current ratio, bank size as measured
by natural logarithm of total assets and management efficiency as measured by cost to
income ratio per year. Credit risk was the dependent variable which the study sought to
explain and it was measured by total non performing loans to total advanced loans on
an annual basis. Secondary data was collected for a total period of 5 years (from January
2013 to December 2017) on an annual basis. The study employed a descriptive cross-
sectional research design and a multiple linear regression model was used to analyze
the association between the variables. Data analysis was undertaken using the Statistical
package for social sciences version 21. The results of the study produced R-square
value of 0.396 which means that about 39.6 percent of the variation in the Kenyan
commercial banks’ credit risk can be explained by the four selected independent
variables while 60.4 percent in the variation of credit risk of commercial banks was
associated with other factors not covered in this research. The study also found that the
independent variables had a strong correlation with credit risk (R=0.629). ANOVA
results show that the F statistic was significant at 5% level with a p=0.000. Therefore
the model was fit to explain the relationship between the selected variables. The results
further revealed that management efficiency produced negative and statistically
significant values for this study while loan portfolio sectoral concentration, banks size
and liquidity were established to be statistically insignificant determinants of credit risk
among commercial banks. This study thus recommends that good measures should be
put in place to enhance management efficiency among commercial banks as this will
help reduce credit risk.
1
CHAPTER ONE: INTRODUCTION
1.1 Background of the Study
The core of traditional commercial banking is the extension of credit to borrowers at a
premium above the return to the depositor. Extension of credit facility to borrowers
brings with it risk to the lender in the sense that if unworthy borrower is advanced a
loan facility and become unable to service it, then bank level of credit risk is affected.
Therefore, it becomes imperative that a bank carefully selects and monitor potential
borrowers with a view to effectively assessing their credit worthiness and therefore
increasing their chance of repaying the loans (Ferreira, Santos, Marques, & Ferreira,
2014).
In the case of business firms, different sectors are affected differently by market forces
such as economic, environmental, competitive and regulatory steps and this directly
affects their performance and ability to service their loan commitments. Rachdi (2013)
is of the view that credit risk level in a bank is a factor of loan portfolio, sectoral
concentration, management quality in screening potential borrowers’ requests and the
effectiveness of the loan process quality. With regard to the loan sectoral concentration,
Muhammad (2012) in his study found out that that the more a bank focuses on a
particular sector in its lending policies, the more knowledge and industry-specific
expertise it realises which translates to improved performance in terms of reduced credit
risk of the loan portfolio.
In banks, risk is manifested in different areas and thus various entities are exposed to
different financial risks. Credit risk being one of the financial risks results from defaults
of inter-party commitments. Credit risk concentration in bank results from risk
2
concentration caused by lending to single borrower or a particular sector of an economy
or risk concentration caused by possibility of contamination of various risks. Avinash
and Mitchell-Ryan (2009) point that a bank whose loan portfolio is concentrated in a
particular sector experiences increased credit risk due to high probability of default by
borrowers in a particular economic sector.
Banks that are focused in a particular sector will generally accumulate necessary
expertise and therefore will be in a position to detect increased credit risk from the
lending and take appropriate action. On the other hand, a concentrated bank is more
susceptible to economic depressions, due to exposure to limited number of economic
sectors and therefore increased banking risk (Rachdi, 2013).Therefore the
understanding of the effect of concentration of loan portfolio on credit risk will be
important in understanding the effect of bank lending policies on loan performance.
1.1.1 Loan Portfolio Sectoral Concentration
Concentration is the total loans number in banks’ credit portfolio while sectoral
concentration is the number of economic sectors in a particular portfolio (Tabak, Fazio
& Cajueiro, 2011). Acharya et al., (2006) combined the two and defined loan
concentration as being concerned with advancement of credit facilities to only few
sectors of the economy, leading to a high proportion of a bank loan being held by firms
in a few sectors of the national economy. As a result of concentrating the bank loans in
a few firms, the financial institution will have to make a choice between monitoring
benefits and risk of concentration. Concentration risk is a banking term denoting the
overall spread of a bank's outstanding accounts over the number or variety of debtors
to whom the bank has lends money. It is calculated using a "concentration ratio" which

3
explains what percentage of the outstanding accounts each bank loan represents
(Ciccarelli & Peydró, 2015).
This is because financial institutions with concentrated credit portfolio has enhanced
abilities to monitor their portfolio resulting to low loan portfolio’s credit risk but at the
same time, they are might be faced with increase in credit risk due to specific sectoral
concentrations risks (Hayden et al., 2007). Further, Böve and Pfingsten (2008) suggests
that if loan’s risk return profile is influenced by banks’ external forces, the credit risk
would increase to higher levels as compared with banks whose credit portfolio is less
diversified.
Boyd and Prescott (1986) highlights that the traditional banking theory is of the view
that banks should be as diversified as possible in regard to their loan portfolio. This is
because concentrated banks would be more susceptible to economic slowdowns, due to
exposure to few economic sectors. In addition, different intermediation theories argue
that diversification enables lenders to have high monitoring and screening skills.
Contrary to this, corporate finance theory postulates that it is essential for firms to
concentrate their activity only on definite economic sectors to gain on expertise in
running business in these sectors. Banks that are focused to limited sectors tend to have
high skills and expertise in the sectors of specialization, and therefore will be in a
position to detect earlier default signal among their borrower’s and will be in a position
to manage risk at early stage (Owino, 2013).
Hibbeln (2010) further expounded that credit risk concentrations is caused by uneven
allocation of credit portfolio of banks and to estimate the extent of a bank concentration,
concentration ratios are used. The two common measures of loan portfolio sectoral
concentration are concentration ratio (CRk) and the Herfindhal-Hischman Index (HHI)
4
(Ávila et al., 2012). Concentration ratio CRk, as a measure of loan concentration sums
up the shares of largest commitments ‘k’ in entire credit portfolio and then divides by
the individual firm ratio. It assumes a fractional form with values constrained between
0 and 1 and values near to 1 shows high loan portfolio concentration. This method has
its limitation as it chooses the number k arbitrarily meaning that limited large sectoral
exposures are taken into consideration.
Herfindahl-Hirschman Index (HHI) is a common measure of concentration and is
basically the sum of squares of the shares of each economic sector exposures of the
entire bank’s credit portfolio. This measure is widely used as it takes into account all
exposures which make it sensitive to both large and small economic entities. A lower
HHI signifies low concentration and exposures are evenly distributed whereas the
opposite indicates higher loan concentration levels. HHI is mostly used by regulators
for screening purposes whereas bankers are using it as a tool for both planning and
monitoring (Rhoades, 1993). HHI has been used by Acharya et al., (2006) in assessing
the impact of credit portfolio concentration/diversification on risk and return of banks
in Italy. The current study will use HHI in determining the effect of sectoral portfolio
loan concentration on commercial banks’ credit risk
1.1.2 Credit Risk
Credit risk is the probability that a counterparty or bank’s borrower in lending
arrangements may not be in a position to meet its obligations as per the contractual
terms and conditions Lapteva (2012) and remains the most challenging and costly risk
among all financial institutions in comparison with other risks as it impacts heavily on
banks solvency (Chijoriga, 1997). It is notable that various financial institutions have
experienced challenges over the years mainly due low debt repayment capacity among
5
the borrowers, lack of quality risk management of credit portfolio, or failure in
mitigation on the impact on economic cyclicality amongst other conditions impacting
on credit standing of a bank’s borrowers (Basel, 1999).
Consequently, credit risk is a leading cause of uncertainties about bank's current and
future financial standing and to cushion from the impact of eventual losses arising from
credit risk, banks are supposed to allocate a high percentage of equity to finance its
operations (Ávila et al., 2012). Were, Nzomoi, and Rutto (2012) suggest that
concentration of credit risk in a bank arises due to uneven distribution of credit
advanced to debtors, level of commitment, economic sectors or respective geographical
area of operation. Based on the fact that concentrated loan portfolio may result in
financial losses and bank's solvency due to concentration of loans in individual
institutions or the risk arising from advancing credit facilities to few sectors in an
economy.
Bhusal (2012) argued that for a bank to reduce the risk from advancement of loans to
few debtors, a bank should granulise its investment portfolio into a high number of
individuals or economic sectors. The cause of sectoral concentration is banks failure to
advance credit to diverse sectors as segmented into geographical regions or industry.
Credit risk arising from concentration leads to the worsening of some specific industries
or geographic regions in a country, in relation to what the bank has adopted an unduly
high exposure. Bonti et al., (2015) found out that sectoral credit concentration risk is
one of the main factors in determining capital requirements level for credit risk.
The proportion of Non Performing Loans (NPL) to the entire bank's credit portfolio is
the widely used measure of banks credit risk. NPL being the main variable is referred
6
to as the most appropriate measure of the real credit Loss arising from the lending
activity of banks, which is normally ascertained from banks’ audited annual reports.
1.1.3 Loan Portfolio Sectoral Concentration and Credit Risk
Acharya, Hasan, Saunders (2006) ascertained that sectoral loan concentration decreases
bank return and on the other hand leads to increase of riskier credit facilities in the
banking sector. This is because, banks with higher loan portfolio concentration can
easily have an estimation of the risks and solvency of potential borrowers and this
capacity is increased with increased monitoring capability. Similarly, Bhusal (2012)
find that loan portfolio sectoral concentration result in less efficient risk return trade off
among the banks with high risks while diversification based on geographical regions
and industry leads to increase in the risk return trade off for low risk level commercial
banks. The positive impact of monitoring could be an explanation for the home bias
which has been recognized and studied by various empirical studies.
Waemustafa and Sukri (2015) identified several sources of a bank credit risk to include
low institutional capability, inadequate policies in credit management and interest rates
volatility. Consequently, banks reduce their credit risk by employing various screening
and monitoring tools that enable them to identify each borrower’s capability to service
the loan advanced. In the same line, Ciccarelli and Peydró (2015) found that when
banks lend to many borrowers, they face an information overload which hinders their
ability to oversee their loans in an effective way.
Similarly the learning effect sets in because with high loan concentration, banks become
familiar with their borrowers and able to recognize upcoming repayment challenges
faster and be able to take remedial actions. Based on these various findings, there is
7
every reason for a bank to concentrate its loan portfolios to a few sectors that it is versed
with its operations and this is likely to reduce its level of non-performing credit
portfolio and therefore lower credit risk as opposed to sectoral loan diversification.
1.1.4 Commercial Banks in Kenya
In Kenya banks are regulated by Central Bank of Kenya (CBK) and the banking
industry comprises of CBK, as the regulator, 43 banking institutions out of which 42
are commercial banks and one Mortgage Finance Company, 8 foreign banks offices
representatives, 77 Seven foreign exchange (forex) bureaus (CBK, 13 Microfinance
Banks (MFBs), 17 Money Remittance Providers (MRPs) and 2016) and 3 credit
reference bureaus (CRBs) (CBK, 2016)
The banking sector capital and reserves increased by 9.58 per cent from Ksh. 540.60
billion by end of the year 2015 to Ksh. 592.42 billion by the end of the year 2016. This
growth in core capital and reserves was mainly due to retained earnings and the
additional capital injections for meeting the core capital and total capital regulatory
requirements. Banks realised improved economic performance in 2016 with pre-tax
profit growing by 10.0 per cent to Ksh. 147.4 billion as at the end of 2016 from Ksh.
134.0 billion for the year 2015. The upsurge in profitability was accredited to 5.7 per
cent income increase compared to expenses increase by 3.8 per cent (CBK, 2016).
On the other hand, customer deposits increased by 5.3 per cent from Ksh. 2,485.9
billion for the year ending 2015 to Ksh. 2,618.4 billion for 2016. Net loan and advances
increased by 4.4 per cent from Ksh. 2,091.4 billion as at December 2015 to Ksh. 2,182.6
billion for the year 2016. The increase in loan portfolio is as a result of increased
demand for credit by all eleven economic sectors. A difficult business environment

8
experienced during the period negatively affected the loan portfolio quality caused by
among other factors; failure by both private and public entities in making payments and
poor weather conditions. As such, NPLs increased by 45.5 per cent to Ksh. 214.3 billion
in 2016 up from Ksh. 147.3 billion in 2015 year end. Similarly, the ratio of Non
performing Loans to total loans rose from 6.8 per cent for the year 2015 up to 9.2 per
cent at the end of year 2016 (CBK, 2016).
1.2 Research Problem
The business activity in the banking industry is very sensitive as they handle depositors’
money which on average constitutes 85% of their liability portfolio in their balance
sheets (Saunders & Cornett, 2011). The questions that comes to the mind of commercial
banks management while advancing credit facilities is whether they need to minimise
their risk through diversification of the loan portfolios by advancing loans to various
market sectors or they need to concentrate their loans to a few sectors that they have
adequate knowledge (Demyanyk & Van Hemert 2009). Various studies undertaken in
USA, for example, supports diversification due to its positive effect on bank
performance but that credit growth to highly volatile activities offset, the gains. In other
studies done in other advanced countries such as Germany, Italy and China, there has
been evidence that concentration of loans improves financial performance and reduces
the level credit risk. The dominant tool however, has been that diversification is an
appropriate tool for mitigation of risk due to its significant relation to market-based risk
measures (Chaibi & Ftiti 2015).
Commercial banks in Kenya face more credit risks due to the incapacity to manage
risks effectively, lack of adequate resources to screen and monitor loan borrowers in

9
comparison to their counterparts in developed countries. In addition, local banks are
affected more by economic shocks which extend to the loan borrowers and
consequently affecting their ability to service their loan obligations. According to the
CBK (2016), the largest proportion of the banking industry loan portfolio were
concentrated on Real Estate, Trade, Personal/ Household and Manufacturing Sectors
accounting for 70.89 per cent of total loans in December 2016. At the same time
Personal/households, Trade and Agriculture sectors accounted for the 98.21 per cent
being the highest number of loan accounts. Further, Trade, Personal/household, Real
Estate and Manufacturing sectors accounted for 70.05 per cent being the highest value
of non-performing loans. This was mainly caused by delayed remittances by employers,
reduced and slow uptake of housing units and delay in payments from private and
public sectors (CBK, 2016). It is therefore imperative that the influence of sectoral
concentration of loan portfolio of commercial banks in Kenya is investigated
The question on whether lending concentration reduces or increases banks’ risk and
return is a matter of great concern within the realm of modern finance literature and
policy. Leon (2017) sought to determine implications of loan portfolio concentration in
Cambodia and found that the relationship between loan concentration and banks’
performance to be economically relevant and statistically significant implying that
diversification appears to be more advantageous than concentration. Chen, Shi, Wei
and Zhang (2013) sought to determine the impact of loan portfolio sectoral
diversification on risk and return among the listed Chinese commercial banks. The
results were that loan portfolio sectoral diversification is related with both low bank's
returns and low credit risk. Jahn, Memmel and Pfingsten (2013), studied on
diversification verses concentration of credit portfolio among the Germany banks and
10
found that high credit portfolio concentration has reduced level of the estimated write
offs and write downs in their loan portfolio and the unanticipated credit risk of the bank.
In Kenya, Geitangi (2015) pursued to research on the connection between credit risk
management practices and loan portfolio performance in Kenya. He established that
there is negative and stastistically significant relationship between use of credit risk
control and non performing loans level. This implies that the continued use of credit
risk control practices by commercial banks in Kenya leads to reduction in the overall
non-performing loans levels. Mwangi and Moturi (2016) investigated the impact of
management of credit on loan repayment performance of Kenya’s commercial banks
and found a positive significance association between the variables. Murira (2010)
studied on the relationship between loan portfolio composition and financial
performance of commercial banks in Kenya and concluded that every bank should
establish an optimal loan mix as it was found that some types of loans (mortgage loans,
business loans, and government loans) have great impact on financial performance of
commercial banks.
Granted that different studies have been done in ascertaining the link between a bank
loan portfolio concentrations or non-concentration on the bank performance, there has
been mixed results even in studies carried out in developed countries. There has been
no study in Kenya, at least that the researcher is aware of, that has sought to link loan
portfolio sectoral concentration and bank credit risk. Consequently, these two gaps that
relate to studies done previously and the lack of research that examines the impact of
sectoral concentration of loan portfolio on bank credit risk locally forms main
motivation for undertaking the present research. This therefore leads to the current
11
research question to be investigated: What is the relationship between loan portfolio
sectoral concentrations on credit risk of commercial banks in Kenya?
1.3 Research Objectives
To establish the relationship between loan portfolios sectoral concentration and credit
risk of commercial banks in Kenya
1.4 Value of the Study
The relationship between lending concentration and bank credit risk in Kenya will be
beneficial to academics, to the bank’s management and to the policy making by various
regulatory stakeholders. For the regulators, this study will be of importance in
controlling risk in promotion of financial standings and increased banks profitability.
Therefore, it will help in determining credit limits for specific economic sectors with
high systematic risk like real estate to mitigate the likely occurrence of “subprime
tragedy” in Kenya.
For the commercial banks, they will be able to focus on the sectors that have lower
credit risk and be able to establish whether diversification of loan portfolios or lending
to limited sectors will be prudent to reduce cost and consequently achieve higher return.
The management of commercial banks by use of this study will best placed to make an
informed decision on the best lending practice and how to screen potential borrowers.
Hence the research will be of great significance to the business as its recommendation
will enable banks to improve on both optimal credit management practices in lending
activity and quality of service.

12
In the academic field, this study is useful as it will help to widen the research agenda in
the wider area of credit risk management practices and controls. This study will be
useful for future academic researchers for reference purposes and also will enable them
in suggestion of future research undertakings to be explored.

13
CHAPTER TWO: LITERATURE REVIEW
2.1 Introduction
This section will cover various research works on loan concentration and credit risk in
banks. The main sections covered in this chapter include; theoretical framework,
determinants of credit risk, review of empirical studies, conceptual framework and
summary of literature review.
2.2 Theoretical Foundations
This section will explore theories that are of great significance in the area study on
bank’s loan portfolio sectoral concentration, credit risk and its relationship. This
research is guided by three main theories, namely; Modern Portfolio Theory,
Traditional Banking Theory and Trade-off Theory.
2.2.1 Modern Portfolio Theory
The theory was mainly expounded by Harry Markowitz (1927) through chain of
publications and articles and further extended and refined by William Sharpe (1934).
Modern portfolio theory is therefore a theory of finance which endeavours in
maximization of portfolio anticipated return within certain level of risk in a portfolio,
or help in reducing risk within certain level of anticipated yield to minimal level, by
creating a suitable choice of various assets proportionally.
The argument advanced by Markowitz (1952) was that by investing in assets whose
returns with different levels of returns, investors are able to offset certain common risks
in individual stocks and hence recommends that investors are required to choose certain
14
financial assets in an investment portfolio determined by each individual asset portfolio
contribution in the mean and variance of the entire portfolio (Lintner, 1975).
Indeed, according to Kaplan and Schoar (2005), portfolio theory is considered one of
the influential economic theories and asserts that an "efficient frontier” asset portfolios
at optimal levels if developed may offer possible optimal expected return for a specified
risk level stated. This means therefore that in addition to reviewing the expected risk
and return of an individual asset there is need to make informed analysis on the
combined portfolio risk and return trade off the importance of portfolio diversification,
specifically the minimization of the riskiness of the portfolio.
The main assumption of the theory is that all investors are risk averse and are not
considering risky assets portfolio unless with minimal risks and higher expected rate of
return. It helps in assessing risk and return in a mix of securities and its association. In
banks, the assets are represented by loans and thus it is relevant in explaining the need
for banks to have a mix of portfolio from different economic sectors and industries that
yields high returns with possible minimal risks (Lintner, 1975). Despite the theory
being widely accepted in the finance and economic field, it has some limitations in the
banking industry as it does not explain how banks can determine and form a mix of
loan portfolio that minimizes risks and maximizes returns and does not address various
risks in managing bank’s loan portfolio thus leaving study gap in the wider field of
credit risk management especially in ascertaining optimal sectoral portfolio mix with
high returns and minimal risks.
15
2.2.2 Traditional Banking Theory
Traditional banking theory through the work of Diamond in 1984 intimates that
portfolio diversification is positively related to with portfolio returns reason being that
when bank increases its credit portfolio to relatively new sectors in an economy, the
credit portfolio quality increases hence the decline in credit risk (Mercieca et al., 2007).
Diversified banks credit portfolio has low vulnerability to economic slowdowns in most
sectors. The theory hints that given asymmetric information, credit diversification is a
means of reducing risk in assets portfolio and further points out that diversification
bring down the financial intermediation cost and also increases monitoring incentives
(Diamond, 1984). Further, the theory proposed that firms needs to be less concentrated
in order to decrease credit risk through the allocation of various credit lines to more
sectors will lead to decrease in the level of risk.
Proponents of this theory argue that least concentrated banks can be affected by dilution
of relative gain of administration by exceeding current expertise consequential from
diversification drawing antagonism in the industry (Winton, 1999), and higher agency
costs mainly from reduced personal risk by the activities of the management (Berger et
al., 2010). Loan portfolio diversification also reduces idiosyncratic risk, decreased
monitoring efforts leading to lower operational costs, which under normal
circumstances causes higher efficiency levels: idiosyncratic risk proposition supports
that loan portfolio concentration has inverse relationship with cost efficiency (Rossi,
2009).
The theory has been widely accepted however, corporate finance theory in contrast
considers the diversification of the asset portfolio as inversely related to bank's returns.
In their studies, Denis et al., (1997); and Meyer and Yeager (2001) outlined that
16
normally financial institutions concentrate their business activities on particular
economic sectors in an industry in order to gain on the benefits of their expertise in
lending to only few sectors.
2.2.3 Trade-off Theory
The earlier trade-off models in the field of finance influenced capital structure in
finance. The tax benefit bankruptcy cost trade-off models forecast that companies
maintains capital structure at optimal level by matching the gains and the corresponding
costs of debt at level where marginal benefits equals marginal cost (Jensen & Meckling,
1976). The benefits comprise of tax shield while the costs comprise projected distress
overheads. As per the agency theoretical model, Jensen (1986) posits that organizations
use importance of reduction of likely challenges in free cash flow and other likely
struggles between shareholders and managers, in compensation of the associated costs
resulting from asset substitution problems and underinvestment.
According to Markowitz (1952) and Sharpe (1964), there is always a trade-off amid
risk and return (as one is prepared to receive more returns than the corresponding costs.
Nevertheless, trade-off is applicable only for the unsystematic risk, and not from
avoidable risks by way of diversification. The theory, thus forecasts that diversified
banks earns more expected returns than concentrated ones. The question is ascertaining
the trade- off between likely risk of loan default and resultant loss, and the return arising
from interest income and commission fees.
The above question is answered through analysis of the risk- return trade- off, is the
crux of all investment decisions; the return on risky assets ought to incorporate
estimated credit losses (Thygerson, 1995). In this case a high risk of default requires

17
commensurately high returns and the challenge in management is to make sure that the
losses are lowers than or equal to the expected level at the acquisition time and asset
pricing by the firm. To achieve this position, management are required to do origination
through strategic portfolio diversification and its management (Johnson, 2000).
This theory has explained the significance of trade-off between risk and return but only
focused on perfect capital markets thus may not be very relevant to banks due to lack
of clarity on the ideal loan portfolio level that maximizes banks’ return and minimizes
risk and how to determine the optimal level. Therefore the theory creates a study gap
in credit risk and loan portfolio concentration in determining the sectoral loan portfolio
mix where there is trade-off between returns and risk.
2.3 Determinants of Credit Risk
The banks credit risk and its causes have attracted a number of empirical studies. The
main consensus is that credit risk determinants of banks can be categorised as
macroeconomic and bank specific factors. In broad-spectrum, bank's credit risk refers
to the risk a loan not being repaid fully or partially by the borrower to the lender
(Athanasoglou et al., 2005). It is imperative to appreciate the determinants of credit risk
since provides signal to the banking sector at the time when the industry are exposed to
economic downturns.
2.3.1 Economic Environment
A country’s’ economic conditions might worsen during periods of stagnation and
recession and during such a period; the financial intermediation risk increases
(Llewellyn, 2002). Koch and McDonald (2003) established that throughout vibrant
economic situation both lender and borrower’s lender are assertive on investment

18
projects undertaken and subsequently their capability in repayment of their financial
obligations. Under such a business cycle, banks will be keen to lessen their credit
principles and standards and becomes more risk averse. Conversely, Jiménez and
Saurina (2012) found out that the association between bank risk exposure and economic
cycle is dialectical since during period of economic boom, the general growth in
economic activities and cash collateral levels held by both households and businesses
increases.
Consequently, under such business environment, borrowers are able to meet their
financial obligation, leading to bank credit risk reduction. Zribi and Boujelbene (2011)
affirmed this position when they found inverse relationship between credit risk and
Gross domestic product. Similarly, in Slovenia, Aver (2008) established that loan
portfolio credit risk is dependent on macro economic variables such as employment
level, rate of interest and on the stock exchange index value. However, Fofack (2005)
in prior study in Sub-Sahara countries did not find any linkage between bank’s credit
risk and country’s GDP.
2.3.2 Inflation
Vogiazas and Nikolaidou (2011) identified inflation as key macroeconomic factor that
has impact on the banking sector efficiency and credit risk. This is because high level
of inflation depletes money value and thus reduces the rate of return in banking sector.
In any economy, a high inflation rate generally has positive relationship with loan
interest rate, increasing which ultimately leads to increase in cost of borrowing and if
the borrowers cannot sustain the interest cost, it will result in a high credit risk. Indeed,
Brissimis et al., (2008) found out that inflation negatively impacts on banks profitability
19
since in most cases the banks' operating expenses increases faster than inflation rate and
this negatively impacts on the overall financial performance.
Castro (2013) note that if banks accurately forecast inflation, they will be able to control
interest rates by way of adjusting so as to be in a position to increase their revenues at
a faster rate than the resultant cost of mitigation of the negative effect of high inflation.
In a study to seek and determine effect of inflation on credit risk, Thiagarajan, Auuapan
et al., (2011) established strong relationship between the prevailing rate of inflation and
credit risk.
2.3.3 Money Supply
The assessment of the effect of relationship between money supply and credit risk is
supported by a research by Kalirai and Scheicher (2002) in a study conducted in
Austrian banking system. Ahmad and Ariff (2007) assert that if the banks’ regulator is
determined to pursue an expansionary monitory policy, then its effect is to reduce the
essential reserve rate which ultimately leads to discount rate reduction with money
supply increasing.
Bofondi and Ropele (2011) in their study established a positive association between
credit risk and money supply among Italian banks. Therefore, an increase in the supply
of money results in reduced rate of interest which ultimately leads to availability of
cheap funds to public in an economy. Availability of cheap funds leads to increased
borrowing which ultimately leads to an increased default and credit risk as some of the
borrowers have no capacity to repay the loans together with interest.

20
2.3.4 Market Interest Rate
The rate of interest in the market rate is a very important macroeconomic factor of the
credit risk exposed to a bank through its lending process because it has a direct effect
on the debt servicing burden incurred by a borrower. Nkusu (2011) notes that the
interest rate has a positive effect on credit risk level because increase level of debt
burden, to a borrower, occasioned by increase in interest rates results in increase non-
performing loans levels. Though, an increase in interest rates, bank interest income
from the newly lend loan increases, but if not closely monitored may expose bank to
the challenges of increased credit risk.
Richard (1999) in his study found a significant and inverse association between banks'
rate of interest measured by 3 year's treasury notes nominal rate of interest rate less the
inflation rate. Fofack (2005) too supported this position in a study carried out among
banks in Sub-Sahara Africa countries and found out a strong positive association
between credit risk and rate of interest. Jiménez and Saurina (2012) used inter-bank rate
of interest in measuring the effect of interest rate on problematic loans and found
positive and significant association between interest rates and non-performing loans.
2.3.5 Foreign Exchange Rate
Zameer and Siddiqi (2010) posit that foreign exchange rate is also another
macroeconomic deerminant which increases the instability of a country economy
among the developing countries. Exchange rate, being a measure of the local currency
value against other currencies, affects firm’s imports because continued increase in
value of foreign currencies in relation to the local currency results in increase in prices
of imported goods which ultimately affect the commodity prices traded locally (Sirpal

21
2009). As the local currency value against foreign exchange rate rises, its value is
depreciated and therefore it becomes expensive to purchase foreign goods and services
due to increase in cost and the purchaser require additional local currency units to
purchase similar quantities of foreign goods and services more than the earlier period
(Ngerebo, 2011).
The rise in commodity pricing due to exchange rate volatility will result in the rise in
the demand for credit facilities in banks to finance the increased expenditure
necessitated by depreciation of local currency (Ngerebo, 2011) and reduce the
profitability of firms. Zribi and Boujelbene (2011) also researched in Tunisia through
the use of the proportion of risk weighted assets of the total assets as banks credit risk
proxy measure and found an inverse relationship between foreign exchange rate level
and credit risk.
2.3.6 Bank Specific Factors
It is essential to note that apart from macroeconomic factors bank specific factors also
affects bank’s NPL. Bank size, ownership structure, profitability and efficiency, credit
portfolio composition, management quality, interest rate policy, deposit liabilities size
and bank’s risk profile are vital factors of NPL. Salas and Saurina (2002) in the study
of Spanish banks identified that capital ratio, credit growth, Real GDP and bank size as
the major variables affecting credit risk levels) explained the association between bad
loans and the ownership structure among the banks in Taiwan and determined that
banks size was inversely linked to non-performing loans. It was also established that
state owned banks had reduced levels of NPLs.

22
Moreover, Sufian (2014) points out that larger conventional bank are able to diversify
their asset portfolio efficiently and in the process being able to reduce credit risks.
Similarly, Cabiles (2012) is of the opinion that large banks employs strong risk
management tools and take high risk without compromising credit risk in their portfolio
and thus generates stable return and further take more risk by increasing securitization
level to cushion against risk uncertainties.
2.4 Empirical Studies
Kozak (2015) researched on the effect of bank concentration of loan portfolio exposure
on its risk and how to determine the same among the Polish banks. The study data
covered the period 2008 – 2013 and used information from the various economic
literature, Central banks reports, and annual audited financial reports of Poland banks
listed on the Warsaw Stock Exchange (WSE). In his study, he found out that by
estimating the surplus capital requreiment portion in certain banks in Poland shows that
banks ought to allocate 4 per cent and 2 per cent of their required core capital to cushion
against credit portfolio concentrations risks on individual borrowers and economic
sectors respectively. The study did not use data from individual banks but rather from
the regulators which is different from the present study in which the data will be
generated from the financial statements of individual banks.
Chen, Shi, Wei and Zhang (2013) researched on the impact of diversification of credit
portfolio on banks’ credit risk and returns among all the Listed Commercial Banks in
China for period between 2007 and 2011. Through developing of a new measure
diversification by considering systematic risk of various economic sectors by way of
weighting them with their betas and comparing with the widely used measure
23
Hirschman-Herfindhl index (HHI). The dependent variable in their study was ROA
and the measure of credit risk was the proportion of non performing loans to total loans.
The control measures used were ratio of loan to deposit, asset ratio and equity ratio. By
comparing average HHI of all banks in China with earlier studies, they found that banks
in China were more diversified with HHI of 0.237 (Acharya et al. 2006) than its
counterparts in Italy whose HHI was 0.291 (Hayden et al. 2007). In comparison with
emerging markets they found out that Brazil had HHI 0.316 (jahn et al. 2013) and
Argentina had HHI of 0.55 (Bebczuk, Galindo 2008) hence were highly concentrated
than Chinese banks.
Jahn, Memmel and Pfingsten (2013) examined the effect of concentration of credit
portfolio versus diversification among German commercial banks. The investigation
covered the period between 2008 and 2012 and used a unique dataset that used specific
banks' sectoral exposure to the real economic sectors on Germany, comprising 27
industries/sectors categorized into three brackets based on maturity along with the
matching write-offs and write-downs by commercial banks. They found out that the
higher the concentrated the bank credit portfolio is, the lower the anticipated write-offs
and write-downs in banks’ loan portfolio. In addition, the study established that more
concentrated banks had a lower unanticipated credit risk in the portfolio in that the
unanticipated loss is measured loan loss rate standard deviation measure. As opposed
to the present study, Jahn et al (2013) did not employ a regression methodology and
more so did not link with the credit risk of the banks unlike the present study which
will consider the effect of bank loan concentration on credit risk.
Figini and Uberti S (2013) researched on the effect of measures of concentration in risk
management practices among the Italian banks. The study covered the period 2008 –

24
2010 and the main objective was to ascertain useful novel index for measuring credit
risk concentration through integration of single name and sectoral components. They
arrived at a new index useful in measuring both sector and single name concentration
for credit risk by use of one step approach. This study differs from the present because
it used primary data while I intend to use secondary data only. At the same time, the
Italian banks operate in a more advanced economy unlike the Kenyan ones whose level
of regulation is still high and government intervention in the banking sector is common.
Ehikioya and Mohammed (2013) researched on commercial banks’ credit accessibility
and its impact on sectoral output performance in the Nigerian economy from the year
1986 and 2010. They employed the ordinary least square technique to augment a growth
mode and determine the relationship amongst various credits by banks and its growth
in sectoral output. In the study, the variables involved were verified using stationary
and co-integration analysis using the Augmented Dickey-Fuller test. The study findings
also shows that credit by commercial banks has direct and inconsequential effect on
sectoral output performance but cumulative supply and demand for credit in the
previous period has direct and substantial effect on the growth of manufacturing,
services and agriculture sectors output.
Locally, Mwangi and Moturi (2016) investigated the impact of management of credit
on loan repayment performance of Kenya’s commercial banks. Through use of primary
data, with a sample size of 55 respondents drawn using purposive sampling, the found
that there exist a positive significance relationships between the variables all set at
p<.05 and that organisational credit policies correlated at coefficient of 0.380, while
risk identification processes correlated at coefficient of 0.692, debt collection processes
at 0.417 and credit scoring correlated at 0.323. Further, they found that commercial
25
banks’ effectiveness in implementing their organizational credit policies would result
to an improvement in the loan repayment among its borrower. The study differs from
the present study because a primary data collection approach was adopted while in this
case secondary data will be used and thus facilitating establishment of relationship.
Geitangi (2015) sought to determine the association between credit risk management
practices and loan portfolio performance of commercial banks in Kenya. The research
used descriptive survey research design by carrying out a census of all the banks that
operated from the year 2010 to 2014. Semi structured questionnaires was used to collect
primary data while banks’ audited financial reports and CBK supervisory reports being
the source for secondary data. The study findings were that commercial banks used
credit risk control practices in credit risk management to a very great extent to minimize
credit loss. The study found out that there is strong negative relationship between use
of credit risk control and level of non-performing loans by banks in Kenya.
Murira (2010) studied on the association between loan portfolio composition and
Kenya’s commercial banks financial performance. The researcher used causal research
design with the population consisting of 43 commercial banks in Kenya then. The
researcher used simple random sampling design to come up with a sample size of thirty
commercial banks. For purposes of analysis, the researcher used inferential statistics
whereby correlation, collinearity and logistic regression models were used. The
findings were that every bank should establish an optimal loan mix as it was found that
some types of loans including mortgage loans, business loans, and government loans
have great impact on commercial bank’s financial performance in kenya. This study
differs from the present research because it did not seek to investigate the effect of
sectoral loan concentration on credit risk of the banks.
26
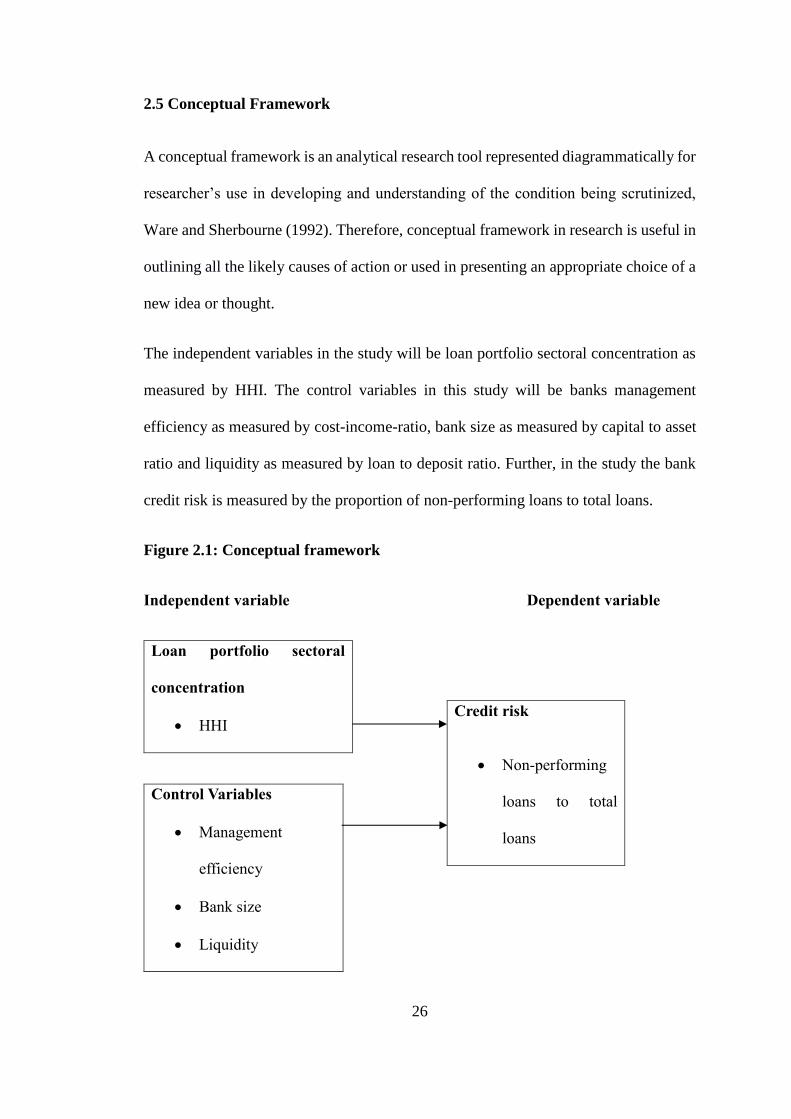
2.5 Conceptual Framework
A conceptual framework is an analytical research tool represented diagrammatically for
researcher’s use in developing and understanding of the condition being scrutinized,
Ware and Sherbourne (1992). Therefore, conceptual framework in research is useful in
outlining all the likely causes of action or used in presenting an appropriate choice of a
new idea or thought.
The independent variables in the study will be loan portfolio sectoral concentration as
measured by HHI. The control variables in this study will be banks management
efficiency as measured by cost-income-ratio, bank size as measured by capital to asset
ratio and liquidity as measured by loan to deposit ratio. Further, in the study the bank
credit risk is measured by the proportion of non-performing loans to total loans.
Figure 2.1: Conceptual framework
Independent variable Dependent variable
Loan portfolio sectoral
concentration
• HHI
Credit risk
• Non-performing
loans to total
loans
Control Variables
• Management
efficiency
• Bank size
• Liquidity
27
Source: Researcher (2018)
2.6 Summary of Literature and Research Gap
The understanding of the factors that impact on the credit risk has received a lot of
attention, both at the international, regional and local scene. In the developed countries
(USA, Britain, Italy and Germany), the studies have tended to look at concentration
measures and its influence on bank's credit risk level and returns on investment. In the
Asian countries such as Cambodia and China, the studies have delved more on the loan
concentration and its implication on the bank operating performance. In Kenya, most
of the studies reviewed have looked at the effect of risk management practices on
commercial banks performance. However, though risk management practices
encompass the portfolio diversification, there is a need to establish only the aspect of
loan concentration as opposed to diversification. In addition, the results on the studies
undertaken have been varied and more studies need to be carried out.
It is notable that the effect of loan concentration on the credit risk of Kenyan banks has
not been addressed on the previous research works. Few commercial banks in Kenya
such as Imperial bank and Chase Bank have gone under receivership due to, among
others, having most of their loan portfolios on a few sectors of the economy and
consequently, whenever the sector is not performing, it has a ripple effect on the overall
financial performance of the banks. In addition, the earlier studies findings have been
conflicting and more studies are required to bridge the gap.
28
CHAPTER THREE: RESEARCH METHODOLOGY
3.1 Introduction
This section entailed the discussion of the summary of the research methodology which
was used in the study. It focused on research design, methods of data collection and
was finalized with data analysis and methods of data presentation that was used in this
study.
3.2 Research Design
The research design was descriptive research design that included the cross sectional
data. A descriptive study is where data is collected from the information provided
without changing or manipulating the outcome. The reason for using this design is that
descriptive research determines and reports the way things are (Cooper & Schindler,
2007). This research design was considered appropriate for the current study as it
enables the researcher to make conclusions about the variables under the study without
experiencing any form of manipulation hence full control of the measurements.
3.3 Population of the Study
A study population comprises of group of individuals or companies being investigated
by the researcher (Sekaran & Bougie, 2010). It is therefore defined in terms elements
availability, specific time frame, topic of interest and geographical boundaries. In this
study, the study population comprised of all the commercial banks operating in Kenya.
As per Central bank of Kenya (CBK), as at the end of year 2017, there were 42 banks
that operated in Kenya (Appendix II) which formed the study population.

29
3.4 Data Collection
In this study secondary data was obtained from annual CBK’s supervisory reports,
commercial banks annual reports and financial statements from 2013 – 2017 from the
sampled commercial banks. From the financial statements, the researcher collected
data on the banks, Non-performing loans level, Sectoral distribution of Loans, Cost to
income ratio, Bank Size based on assets to capital ratio and Bank’s Liquidity.
3.5 Diagnostic Tests
Linearity show that two variables X and Y are related by a mathematical equation
Y=bX where c is a constant number. The linearity test was obtained through the
scatterplot testing or F-statistic in ANOVA. Stationarity test is a process where the
statistical properties such as mean, variance and autocorrelation structure do not change
with time. Stationarity was obtained from the run sequence plot. Normality is a test for
the assumption that the residual of the response variable are normally distributed around
the mean. This was determined by Shapiro-walk test or Kolmogorov-Smirnov test.
Autocorrelation is the measurement of the similarity between a certain time series and
a lagged value of the same time series over successive time intervals. It was tested using
Durbin-Watson statistic (Khan, 2008).
Multicollinearity is said to occur when there is a nearly exact or exact linear relation
among two or more of the independent variables. This was tested by the determinant of
the correlation matrices, which varies from zero to one. Orthogonal independent
variable is an indication that the determinant is one while it is zero if there is a complete
linear dependence between them and as it approaches to zero then the multicollinearity
30
becomes more intense. Variance Inflation Factors (VIF) and tolerance levels were also
carried out to show the degree of multicollinearity (Burns & Burns, 2008).
3.6 Data Analysis
The data collected from the different sources was organized in a manner that can help
address the research objective. Statistical Package for Social Sciences version 22 was
utilized for data analysis purposes. Both descriptive and inferential statistics were
carried out. In descriptive statistics, the minimum, maximum, mean, standard deviation,
skewness and kurtosis were computed for each variable. In inferential statistics, both
regression and correlation analysis were carried out. Correlation analysis involved
determining the extent of relationship between the study variables while regression
analysis involved establishing the cause and effect between the dependent variable
(credit risk) and independent variables: Loan portfolio sectoral concentration, bank’s
management efficiency, bank size and bank’s liquidity.
The study applied the following regression model:
Y = βo + β1X1 + β2X2 + β3X3 + β4X4 + ε
Where:
Y = Credit risk measured by expressing total non performing loans to total loans
advanced on an annual basis.
Βo = Constant (Y intercept)
β1- β4 = Regression coefficient for independent variables
X1 = Loan portfolio sectoral concentration as measured by Hirschman-Herfindahl
Index (HHI) on an annual basis.
31
X2 = Bank’s management efficiency measured by cost-income-ratio on an
annual basis
X3 = Bank size measured by natural logarithm of total assets on an annual basis
X4 = Bank’s liquidity measured by loan deposit ratio on an annual basis
ε = Error term
The HHI was calculated as
𝐻𝐻𝐼 =∑
𝑛
𝐼=1
𝑆2
Which is the sum of squares of relative economic sector exposure of bank’s loan
portfolio at a given time period and that S is relative exposure of a bank to economic
sector measured by proportion of single economic sector to the entire loan portfolio.
HHI ranges from 0 to 1 with the highest value of 1 denoting full sectoral Loan
concentration whereas 0 denotes full diversification. This formula has been used before
by scholars such as Rhoades (1993) and Acharya et al., (2006).
3.6.1 Tests of Significance
The researcher carried out parametric tests to establish the statistical significance of
both the overall model and individual parameters. The F-test was used to determine the
significance of the overall model and it was obtained from Analysis of Variance
(ANOVA) while a t-test was used to establish statistical significance of individual
variables.
32
CHAPTER FOUR: DATA ANALYSIS, FINDINGS AND INTERPRETATION
4.1 Introduction
This chapter focused on the analysis of the collected data from the Central Bank of
Kenya to ascertain the effect of loan portfolio sectoral concentration on credit risk of
the Kenyan commercial banks. Using descriptive statistics, correlation analysis and
regression analysis, the indings of the study were presented in table forms as shown in
the following sections.
4.2 Response Rate
This study targeted the 42 commercial banks in Kenya as at 31st December 2017. Data
was obtained from 40 banks representing a response rate of 95.24%. From the
respondents, the researcher was able to obtain secondary data on loan portfolio sectoral
concentration, bank size, liquidity, management efficiency and credit risk of banks.
4.3 Diagnostic Tests
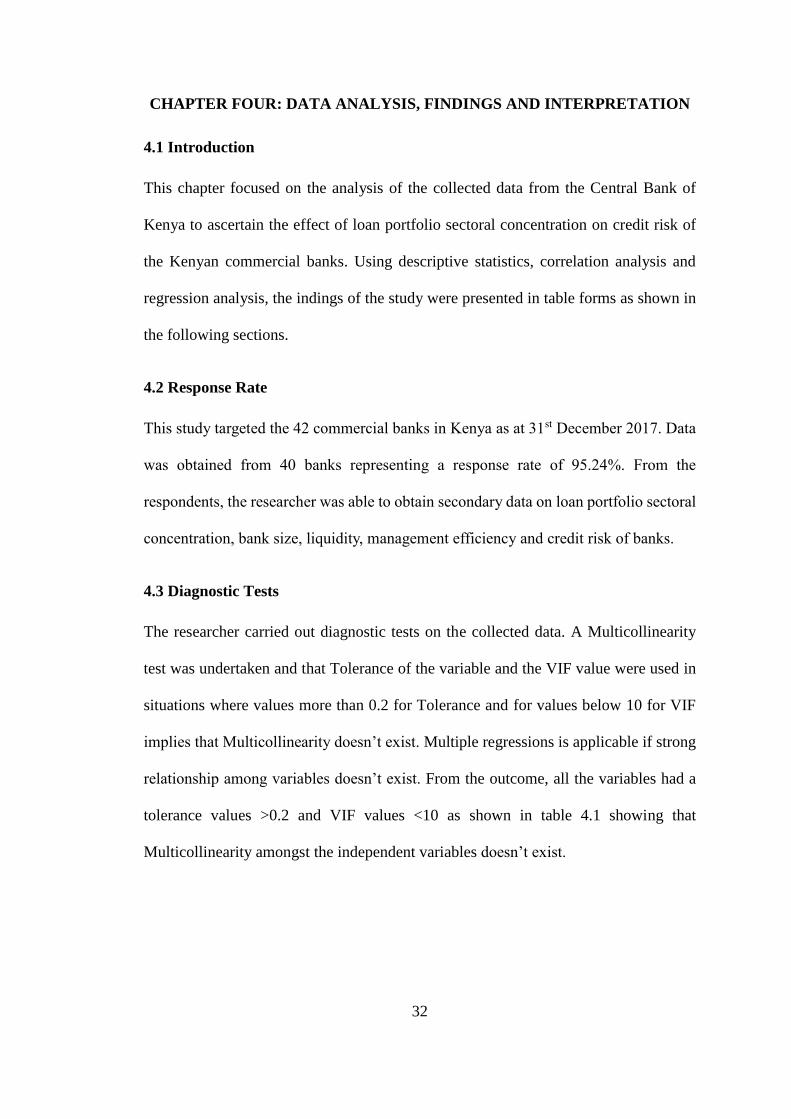
The researcher carried out diagnostic tests on the collected data. A Multicollinearity
test was undertaken and that Tolerance of the variable and the VIF value were used in
situations where values more than 0.2 for Tolerance and for values below 10 for VIF
implies that Multicollinearity doesn’t exist. Multiple regressions is applicable if strong
relationship among variables doesn’t exist. From the outcome, all the variables had a
tolerance values >0.2 and VIF values <10 as shown in table 4.1 showing that
Multicollinearity amongst the independent variables doesn’t exist.
33
Table 4.1: Multicollinearity Test for Tolerance and VIF
Collinearity Statistics
Variable Tolerance VIF
Loan portfolio sectoral concentration 0.392 1.463
Management efficiency 0.398 1.982
Bank liquidity 0.388 1.422
Bank size 0.376 1.398
Source: Research Findings (2018)
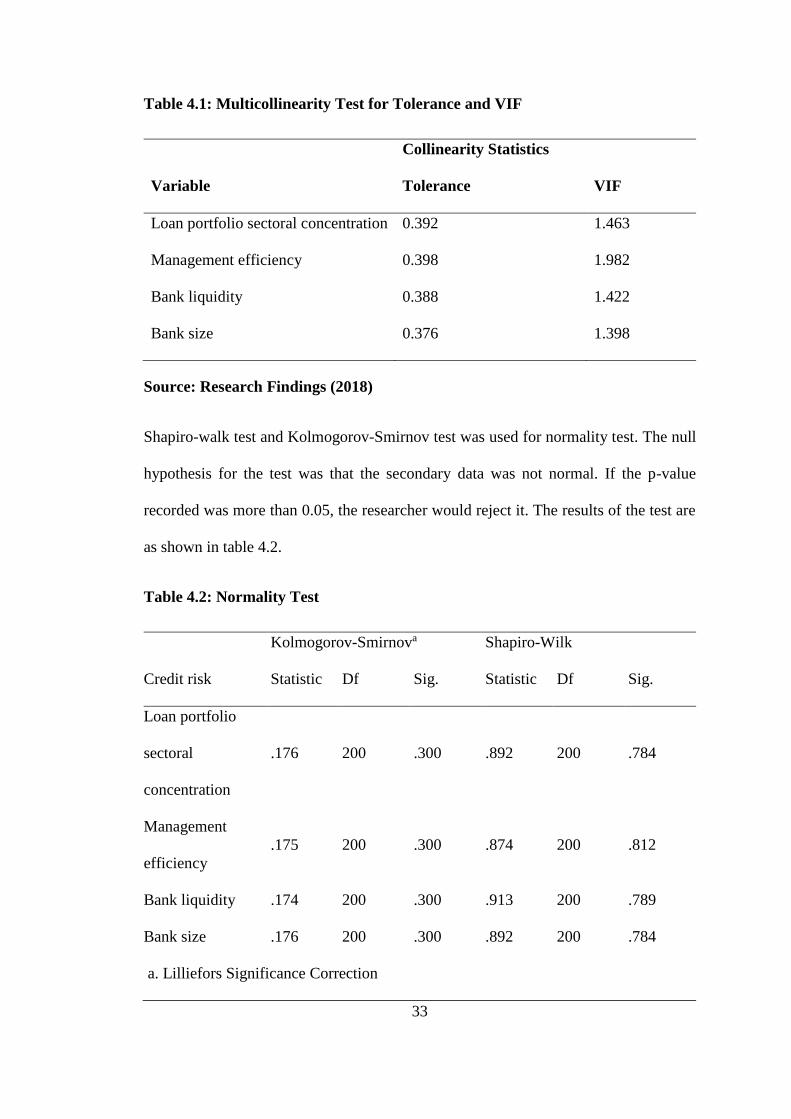
Shapiro-walk test and Kolmogorov-Smirnov test was used for normality test. The null
hypothesis for the test was that the secondary data was not normal. If the p-value
recorded was more than 0.05, the researcher would reject it. The results of the test are
as shown in table 4.2.
Table 4.2: Normality Test
Credit risk
Kolmogorov-Smirnova Shapiro-Wilk
Statistic Df Sig. Statistic Df Sig.
Loan portfolio
sectoral
concentration
.176 200 .300 .892 200 .784
Management
efficiency
.175 200 .300 .874 200 .812
Bank liquidity .174 200 .300 .913 200 .789
Bank size .176 200 .300 .892 200 .784
a. Lilliefors Significance Correction
34
Source: Research Findings (2018)
Both Kolmogorov-Smirnova and Shapiro-Wilk tests recorded o-values greater than
0.05 which implies that the research data was distributed normally and thus the null
hypothesis was rejected. The data was therefore useful for use to conduct parametric
tests such as regression analysis, Pearson’s correlation and analysis of variance.
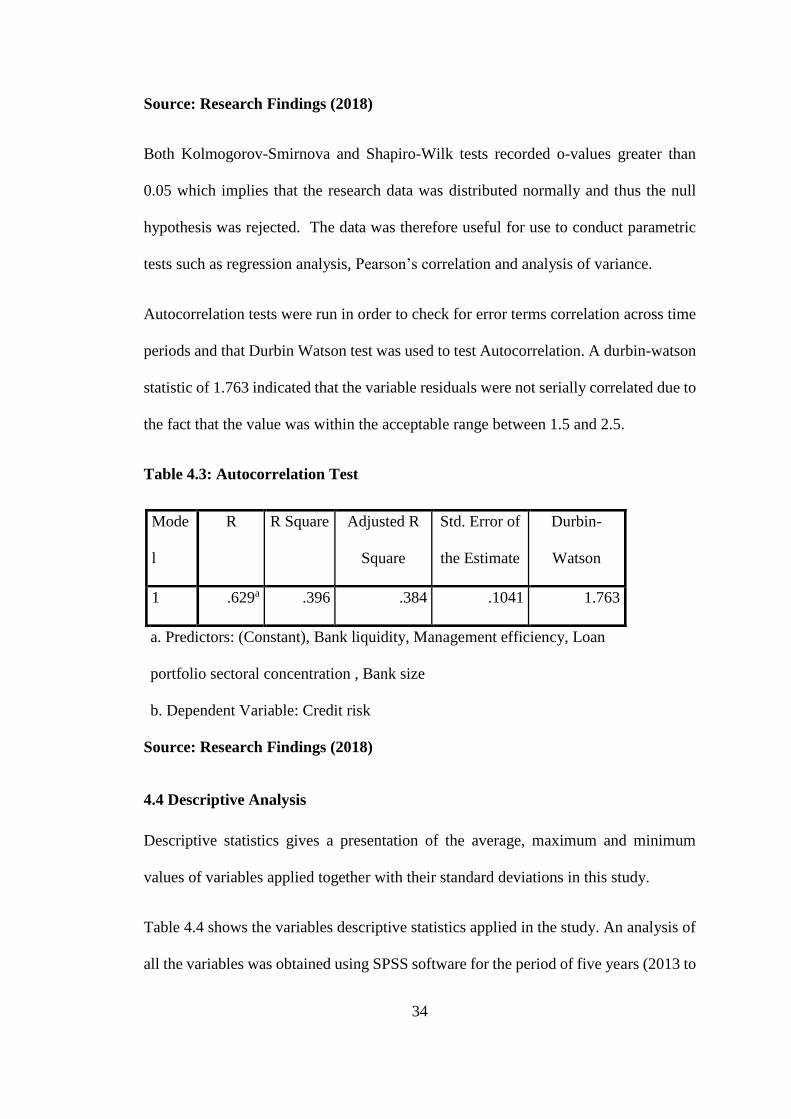
Autocorrelation tests were run in order to check for error terms correlation across time
periods and that Durbin Watson test was used to test Autocorrelation. A durbin-watson
statistic of 1.763 indicated that the variable residuals were not serially correlated due to
the fact that the value was within the acceptable range between 1.5 and 2.5.
Table 4.3: Autocorrelation Test
Mode
l
R R Square Adjusted R
Square
Std. Error of
the Estimate
Durbin-
Watson
1 .629a .396 .384 .1041 1.763
a. Predictors: (Constant), Bank liquidity, Management efficiency, Loan
portfolio sectoral concentration , Bank size
b. Dependent Variable: Credit risk
Source: Research Findings (2018)
4.4 Descriptive Analysis
Descriptive statistics gives a presentation of the average, maximum and minimum
values of variables applied together with their standard deviations in this study.
Table 4.4 shows the variables descriptive statistics applied in the study. An analysis of
all the variables was obtained using SPSS software for the period of five years (2013 to
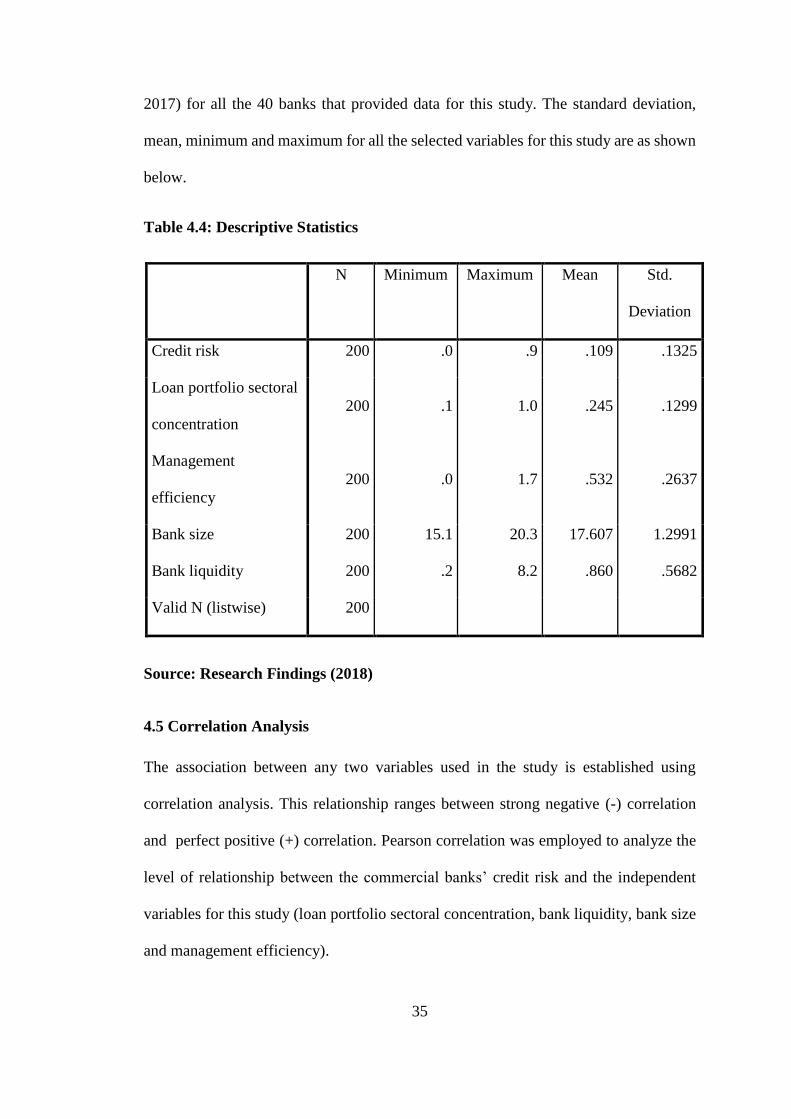
35
2017) for all the 40 banks that provided data for this study. The standard deviation,
mean, minimum and maximum for all the selected variables for this study are as shown
below.
Table 4.4: Descriptive Statistics
N Minimum Maximum Mean Std.
Deviation
Credit risk 200 .0 .9 .109 .1325
Loan portfolio sectoral
concentration
200 .1 1.0 .245 .1299
Management
efficiency
200 .0 1.7 .532 .2637
Bank size 200 15.1 20.3 17.607 1.2991
Bank liquidity 200 .2 8.2 .860 .5682
Valid N (listwise) 200
Source: Research Findings (2018)
4.5 Correlation Analysis
The association between any two variables used in the study is established using
correlation analysis. This relationship ranges between strong negative (-) correlation
and perfect positive (+) correlation. Pearson correlation was employed to analyze the
level of relationship between the commercial banks’ credit risk and the independent
variables for this study (loan portfolio sectoral concentration, bank liquidity, bank size
and management efficiency).
36
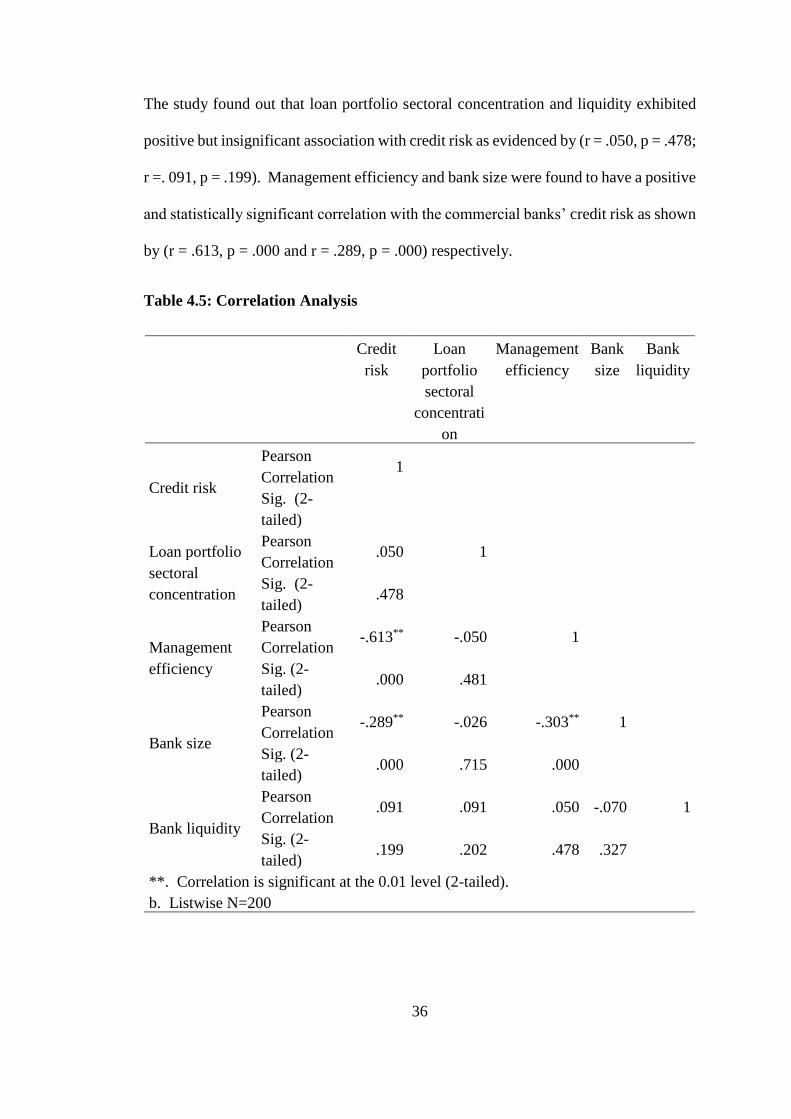
The study found out that loan portfolio sectoral concentration and liquidity exhibited
positive but insignificant association with credit risk as evidenced by (r = .050, p = .478;
r =. 091, p = .199). Management efficiency and bank size were found to have a positive
and statistically significant correlation with the commercial banks’ credit risk as shown
by (r = .613, p = .000 and r = .289, p = .000) respectively.
Table 4.5: Correlation Analysis
Credit
risk
Loan
portfolio
sectoral
concentrati
on
Management
efficiency
Bank
size
Bank
liquidity
Credit risk
Pearson
Correlation 1
Sig. (2-
tailed)
Loan portfolio
sectoral
concentration
Pearson
Correlation .050 1
Sig. (2-
tailed) .478
Management
efficiency
Pearson
Correlation -.613** -.050 1
Sig. (2-
tailed) .000 .481
Bank size
Pearson
Correlation -.289** -.026 -.303** 1
Sig. (2-
tailed) .000 .715 .000
Bank liquidity
Pearson
Correlation .091 .091 .050 -.070 1
Sig. (2-
tailed) .199 .202 .478 .327
**. Correlation is significant at the 0.01 level (2-tailed).
b. Listwise N=200

37
4.6 Regression Analysis
Credit risk was regressed against four predictor variables; loan portfolio sectoral
concentration, bank liquidity, bank size and bank management efficiency. The
regression analysis was executed at a significance level of 5%. The critical value
obtained from the F – table was measured against the one acquired from the regression
analysis.
The study obtained the model summary statistics is shown below in table 4.6.
Table 4.6: Model Summary
Model R R Square Adjusted R
Square
Std. Error of
the Estimate
Durbin-
Watson
1 .629a .396 .384 .1041 1.763
a. Predictors: (Constant), Bank liquidity, Management efficiency, Loan
portfolio sectoral concentration , Bank size
b. Dependent Variable: Credit risk
Source: Research Findings (2018)
From the outcome in above table 4.6, the value of R square was 0.396, a discovery that
39.6 percent of the deviations in credit risk of commercial banks is caused by changes
in loan portfolio sectoral concentration, bank liquidity, bank size and bank management
efficiency. Other variables not in the model consititute for 60.4 percent of the variance
in credit risk of the Kenyan commercial banks. Also, the results revealed that there
exists a strong relationship among the selected independent variables and the credit risk
as shown by the correlation coefficient (R) equal to 0.629. A durbin-watson statistic of
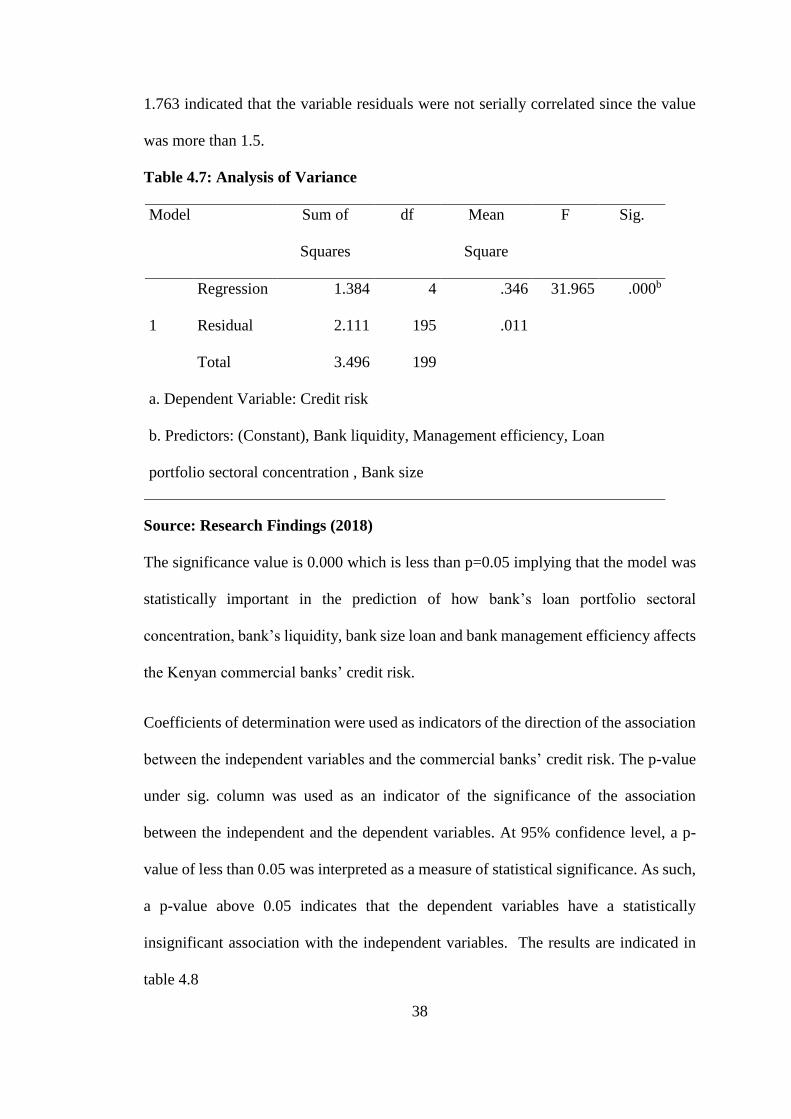
38
1.763 indicated that the variable residuals were not serially correlated since the value
was more than 1.5.
Table 4.7: Analysis of Variance
Model Sum of
Squares
df Mean
Square
F Sig.
1
Regression 1.384 4 .346 31.965 .000b
Residual 2.111 195 .011
Total 3.496 199
a. Dependent Variable: Credit risk
b. Predictors: (Constant), Bank liquidity, Management efficiency, Loan
portfolio sectoral concentration , Bank size
Source: Research Findings (2018)
The significance value is 0.000 which is less than p=0.05 implying that the model was
statistically important in the prediction of how bank’s loan portfolio sectoral
concentration, bank’s liquidity, bank size loan and bank management efficiency affects
the Kenyan commercial banks’ credit risk.
Coefficients of determination were used as indicators of the direction of the association
between the independent variables and the commercial banks’ credit risk. The p-value
under sig. column was used as an indicator of the significance of the association
between the independent and the dependent variables. At 95% confidence level, a p-
value of less than 0.05 was interpreted as a measure of statistical significance. As such,
a p-value above 0.05 indicates that the dependent variables have a statistically
insignificant association with the independent variables. The results are indicated in
table 4.8

39
Table 4.8: Model Coefficients
Model Unstandardized
Coefficients
Standardized
Coefficients
t Sig.
B Std. Error Beta
1
(Constant) .118 .114 1.035 .302
Loan portfolio sectoral
concentration
.074 .057 .072 1.293 .197
Management efficiency -.293 .029 -.582 -9.941 .000
Bank size -.011 .006 -.107 -1.830 .069
Bank liquidity .011 .013 .048 .854 .394
a. Dependent Variable: Credit risk
Source: Research Findings (2018)
From the resukts above, it is clear that apart from management efficiency, all the other
three independent variables produced non-statistically significant values for this study
(low t-values, p > 0.05). Management efficiency was established to be a significant
statistically as a determinant of credit risk among commercial banks as shown by a p
value below 0.05.
The following regression equation was estimated:
Y = 0.118 + 0.074X1- 0.293X2- 0.011X3 + 0.011X4
Where,
Y = Credit risk
X1=Loan portfolio sectoral concentration
X2= Management efficiency
40
X3= Bank size
X4= Bank liquidity
On the estimated regression model above, the constant = 0.118 shows that if selected
dependent variables (loan portfolio sectoral concentration, bank liquidity, bank size and
bank management efficiency) were rated zero, the commercial banks’ credit risk would
be 0.118. A unit increase in loan portfolio sectoral concentration or liquidity will result
in an increase in credit risk by 0.074 and 0.011 respectively while a unit increase in
management efficiency and bank size leads to a decrease in credit risk by 0.293 and
0.011 respectively.
4.7 Interpretation of Research Findings
The study sought to determine the association between loan portfolio sectoral
concentration and credit risk of the Kenyan commercial. In this study Loan portfolio
sectoral concentration was the independent variable and was measured by the HH1
index on an annual basis. The control variables were liquidity as measured by the
current ratio, bank size as measured by natural logarithm of total assets and
management efficiency as measured by cost to income ratio per year. Credit risk was
the dependent variable which the study sought to explain and it was measured by total
non performing loans to total loans advanced on an annual basis.
The Pearson correlation coefficients between the variables revealed that loan portfolio
sectoral concentration have a positive but statistically insignificant correlation with the
commercial banks’ credit risk. The study also found out that a significant and negative
correlation exists between bank size and management efficiency with commercial
banks credit risk in Kenya. Liquidity exhibited positive but insignificant association
with credit risk of commercial banks in Kenya.
41
The model summary revealed that the independent variables: loan portfolio sectoral
concentration, bank liquidity, bank size and bank management efficiency explains
39.6% of shifts in the dependent variable as revealed by R2 value meaning this model
doesn’t include other factors that account for 60.4% of changes in the commercial
banks’ credit risk. The model is fit at 95% level of confidence since the F-value is
31.965. This shows that the overall multiple regression model is significant statistically
and is an adequate model in prediction and explaination of the influence of the selected
independent variables on the Kenyan commercial banks’ credit risk.
The results concur with Jahn, Memmel and Pfingsten (2013) who examined the effect
of concentration of credit portfolio versus diversification among German commercial
banks. The investigation covered the period between 2008 and 2012 and used a unique
dataset that used specific banks' sectoral exposure to the real economic sectors on
Germany, comprising 27 industries/sectors categorized into three brackets based on
maturity along with the matching write-offs and write-downs by commercial banks.
They found out that the higher the concentrated the bank credit portfolio is, the lower
the anticipated write offs and write downs in banks’ loan portfolio. In addition, the study
established that more concentrated banks had a lower unanticipated credit risk in the
portfolio in that the unanticipated loss is measured loan loss rate standard deviation
measure.

42
CHAPTER FIVE: SUMMARY, CONCLUSION AND RECOMMENDATIONS
5.1 Introduction
The summary of the results of the former chapter, conclusion and the limitations of the
study are given in this chapter. The chapter also elucidates the policy recommendations
that policy makers can implement to achieve the expected credit risk of the Kenyan
commercial banks. Finally, suggestions for further research, which could be of great
use to future researchers, are presented.
5.2 Summary of Findings
The study sought to examine the impact of loan portfolio sectoral concentration on the
Kenyan financial bank’s credit risk. The independent variables for the study were loan
portfolio sectoral concentration, bank liquidity, bank size and bank management
efficiency. A descriptive cross-sectional research design was employed in the study.
Secondary data was obtained from the Central Bank of Kenya and was analyzed using
SPSS software version 21. The study used annual data for 40 commercial banks
covering a period of five years from January 2013 up to December 2017.
Based on correlation analysis results loan portfolio sectoral concentration was found to
have a positive but statistically insignificant correlation with the commercial banks’
credit risk. It was also determined that a positive and insignificant correlation exists
between management liquidity and credit risk while management efficiency and bank
size exhibited a strong and significant negative association with commercial banks’
credit risk.
The co-efficient of determination R-square value was 0.396 which means that about
39.6 percent of the variation in credit risk of the Kenyan commercial banks is associated
43
by the four selected independent variables while 60.4 percent in the variation of credit
risk was associated with other factors not covered in this research. The study also found
a strong correlation between the independent variables and the commercial banks’
credit risk (R=0.629). ANOVA results indicate that the F statistic was at 5%
significance level with a p=0.000 and therefore the model was fit in explaining the
association between the varables selected.
The regression results indicated that when all the selected independent variables for the
study are at zero level the commercial banks’ credit risk will be 0.118. A unit increase
in loan portfolio sectoral concentration or liquidity will result in an increase in credit
risk by 0.074 and 0.011 respectively while an increase in one unit in management
efficiency and bank size will result into a reduction in credit risk by 0.293 and 0.011
respectively.
5.3 Conclusion
It can be concluded from the findings that the Kenyan commercial banks’ credit risk is
significantly affected by management efficiency. Thus a conclusion is made that that a
unit increase in management efficiency leads to a significant reduction in credit risk of
commercial banks. The study established that loan portfolio sectoral concentration is a
statistically insignificant determinant of credit risk and therefore this study concludes
that this variable does not influence to a large extent the Kenyan commercial bank’s
credit risk
This study concludes that independent variables selected for this study loan portfolio
sectoral concentration, bank liquidity, bank size and bank management efficiency
influence to a large extent credit risk of commercial banks in Kenya. Thus, it’s adequate

44
to make a conclusion that these variables greatly affect credit risk of commercial banks
as shown by the p value in anova summary. The fact that the four of the independent
variables accounts for 39.6% of changes in credit risk indicate that the variables not
incorporated in the model explains 60.4% of the variations in credit risk the commercial
banks
This finding concurs with Jahn, Memmel and Pfingsten (2013) who examined the effect
of concentration of credit portfolio versus diversification among German commercial
banks. The investigation covered the period between 2008 and 2012 and used a unique
dataset that used specific banks' sectoral exposure to the real economic sectors on
Germany, comprising 27 industries/sectors categorized into three brackets based on
maturity along with the matching write-offs and write-downs by commercial banks.
They found out that the higher the concentrated the bank credit portfolio is, the lower
the anticipated write offs and write downs in banks’ loan portfolio. In addition, the
study established that more concentrated banks had a lower unanticipated credit risk in
the portfolio in that the unanticipated loss is measured loan loss rate standard deviation
measure.
5.4 Recommendations
The study established that loan portfolio sectoral concentration has a positive but
insignificant impact on credit risk of commercial banks in Kenya. Therefore the study
wishes to make the following recommendations for policy change: Commercial banks
in Kenya should make informed decisions before concentrating loan portfolios in
certain sectors as this can lead to increased credit risk that can negatively influence
financial performance and indeed the wealth of the bank owner’s which is the main
goal of a bank and any firm in general.
45
The study established a significant and negative relationship exists between credit risk
and management efficiency. This study thus recommends that shareholders and
directors of commercial banks in Kenya should come up with measures of improving
efficiency of managers by ways of either reward or punishment as an increase in
management efficiency has been found to have a significant influence on reducing the
credit risk among commercial banks.
The study found out that a negative relationship exists between credit risk and size of a
bank and this implies that larger banks are likely to have less credit risk. This study
recommends that banks’ management and directors should aim at increasing their asset
base by coming up with measures and policies aimed at enlarging the banks’ assets as
this will eventually have a direct effect on credit risk. From the findings of this study,
big banks in terms of asset base are expected to have lower credit risk compared to
small banks and therefore banks should strive to grow their asset base.
5.5 Limitations of the Study
The research scope was for a period of five years from 2013 to 2017. It has therefore
not been determined whether the results would hold for a longer period of study.
Furthermore there is uncertainty on whether same findings would hold beyond 2017.
As such a longer period of study is neccesary as it will take into considerations major
economic conditions such as booms and recessions.
Data quality is one of the study limitations. From this research, it is hard to conclude
whether the results present the true facts about the situation. The data that has been used
is only assumed to be accurate. There is also a great inconsistency in the measures used
depending on the prevailing conditions. Secondary data was employed in the study

46
which was already in existent as opposed to primary data which was raw information
for use in research . Furthr, the study also considered selected determinants of and did
not consider all the factors affecting credit risk of commercial banks mainly due to
limitation of data availability.
For data analysis purposes, the researcher applied a multiple linear regression model.
Due to the shortcomings involved when using regression models such as erroneous and
misleading results when the variable values change, the researcher cannot be able to
generalize the findings with certainty. If more and more data is added to the functional
regression model, the hypothesized relationship between two or more variables may
not hold.
5.6 Suggestions for Further Research
This study mainly focused on loan portfolio sectoral concentration and credit risk of
commercial banks in Kenya and depended on secondary data. A research study where
data collection depends on primary data i.e. in depth questionnaires and interviews
covering all the 42 commercial banks registered with the Central Bank of Kenya is
recommended so as to compliment this research.
The study was not exhaustive of the independent variables affecting credit risk of
commercial banks in Kenya and it’s recommended that further studies be carried out to
incorporate other variables like capital adequacy, growth opportunities, industry
practices, age of the firm, political stability and other macro-economic variables.
Establishing the effect of each variable on credit risk will enable policy makers know
what tool to use when controlling the credit risk.
47
The study concentrated on the last five years since it was the most recent data available.
Future studies may use a range of many years e.g. from 2000 to date and this can be
help confirm or disapprove this study’s findings. The study limited itself by focusing
on financial institutions. The recommendations of this study are that further studies be
conducted on other non-financial institutions operating in Kenya. Finally, due to the
inadequacies of the regression models, other models such as the Vector Error
Correction Model (VECM) can be used in explaining the different associations between
the variables.

48
REFERENCES
Acharya, V. V., Hasan, I., & Saunders, A. (2006). Should banks be diversified?
Evidence from individual bank loan portfolios. The Journal of Business, 79(3),
1355-1412.
AF Ferreira, F., P. Santos, S., SE Marques, C., & Ferreira, J. (2014). Assessing credit
risk of mortgage lending using MACBETH: a methodological framework.
Management Decision, 52(2), 182-206.
Ahmad, N. H., & Ariff, M. (2007). Multi-country study of bank credit risk
determinants. International Journal of Banking and Finance, 5(1), 6-11.
Athanasoglou, P. P., Brissimis, S. N., & Delis, M. D. (2008). Bank-specific, industry-
specific and macroeconomic determinants of bank profitability. Journal of
international financial Markets, Institutions and Money, 18(2), 121-136.
Aver, B. (2008). An empirical analysis of credit risk factors of the Slovenian banking
system. Managing Global Transitions, 6(3), 317-334.
Ávila, F., Flores, E., López-Gallo, F., & Márquez, J. (2013). Concentration indicators:
Assessing the gap between aggregate and detailed data. IFC Bulletin, 36, 542-
559.
Avinash, R., & Mitchell-Ryan, T. (2009). An Assessment of the Impact of The sectoral
Distribution of Commercial Bank credit on Economic Growth and
Development in Trinidad and Tobago. Central Bank of Trinidad and Tobago":
CBB Working Paper, 2010.
Basel (1999). Measuring and controlling large credit exposures. Reported by Basel
Committee on Banking Supervision. 8 p.
Bebczuk, R., & Galindo, A. (2008). Financial crisis and sectoral diversification of
Argentine banks, 1999–2004. Applied Financial Economics, 18(3), 199-211.

49
Berger, A. N., Hasan, I., & Zhou, M. (2010). The effects of focus versus diversification
on bank performance: Evidence from Chinese banks. Journal of Banking &
Finance, 34(7), 1417-1435.
Bhusal, B. P. (2012). Impact of financial policy reforms on financial development and
economic growth in Nepal. International Journal of Business and Social
Science, 3(14), 214-221.
Bofondi, M., & Ropele, T. (2011). Macroeconomic determinants of bad loans: evidence
from Italian banks.
Bohachova, O. (2008). The impact of macroeconomic factors on risks in the banking
sector: a cross-country empirical assessment (No. 44). IAW-
Diskussionspapiere.
Bonti, G., Kalkbrener, M., Lotz, C., & Stahl, G. (2006). Credit risk concentrations under
stress. Journal of Credit Risk, 2(3), 115-136.
Böve, R., & Pfingsten, A. (2008). Why do specialized banks succeed? An empirical
investigation of the credit business of cooperative and savings banks.
Boyd, J. H., & Prescott, E. C. (1986). Financial intermediary-coalitions. Journal of
Economic theory, 38(2), 211-232.
Cabiles, N. A. S. (2012). Credit risk management through securitization: Effect on loan
portfolio choice. In Fifth phd conference in economics.
Castro, V. (2013). Macroeconomic determinants of the credit risk in the banking
system: The case of the GIPSI. Economic Modelling, 31, 672-683.
Central Bank of Kenya, (2016). Banking Sector Performance, Regulation and Bank
Supervision, Annual Report.
Chaibi, H., & Ftiti, Z. (2015). Credit risk determinants: Evidence from a cross-country
study. Research in International Business and Finance, 33(2), 1-16.

50
Chen, Y., Wei, X., & Zhang, L. (2013). A New Measurement of Sectoral Concentration
of Credit Portfolios. Procedia Computer Science, 17, 1231-1240.
Chen, Y., Wei, X., Zhang, L., & Shi, Y. (2013). Sectoral diversification and the banks’
return and risk: Evidence from Chinese listed commercial banks. Procedia
Computer Science, 18, 1737-1746.
Chijoriga, M. M. (1997). An application of credit scoring and financial distress
prediction models to commercial bank lending: the case of Tanzania. na.
Ciccarelli, M., Maddaloni, A., & Peydró, J. L. (2015). Trusting the bankers: A new look
at the credit channel of monetary policy. Review of Economic Dynamics, 18(4),
979-1002.
Demyanyk, Y., & Van Hemert, O. (2009). Understanding the subprime mortgage crisis.
The Review of Financial Studies, 24(6), 1848-1880.
Denis, D. J., Denis, D. K., & Sarin, A. (1997). Agency problems, equity ownership, and
corporate diversification. The Journal of Finance, 52(1), 135-160.
Diamond, D. W. (1984). Financial intermediation and delegated monitoring. The
review of economic studies, 51(3), 393-414.
Ehikioya, I., & Mohammed, I. (2013). Commercial bank credit accessibility and
sectoral output performance in a deregulated financial market economy:
empirical evidence from Nigeria. Journal of Finance and Bank Management,
1(2), 36-59.
Figini, S., & Uberti, P. (2013). Concentration measures in risk management. Journal of
the Operational Research Society, 64(5), 718-723.
Fofack, H. L. (2005). Nonperforming loans in Sub-Saharan Africa: causal analysis and
macroeconomic implications. The World Bank.

51
Geitangi, D. M. (2015). The Relationship between Credit Risk Management Practices
and the Performance of Loan Portfolio of Commercial Banks in Kenya
(Doctoral dissertation, University of Nairobi).
Hayden, E., Porath, D., & Westernhagen, N. V. (2007). Does diversification improve
the performance of German banks? Evidence from individual bank loan
portfolios. Journal of Financial Services Research, 32(3), 123-140.
Hibbeln, M. (2010). Risk Management in Credit Portfolios: Concentration Risk and
Basel II. Springer Science & Business Media.
HU, J. L., Li, Y., & CHIU, Y. H. (2004). Ownership and nonperforming loans:
Evidence from Taiwan's banks. The Developing Economies, 42(3), 405-420.
Jahn, N., Memmel, C., & Pfingsten, A. (2013). Banks' concentration versus
diversification in the loan portfolio: New evidence from Germany.
Jensen, M. C. (1986). Agency costs of free cash flow, corporate finance, and takeovers.
The American Economic Review, 76(2), 323-329.
Jiménez, G., Ongena, S., Peydró, J. L., & Saurina, J. (2012). Credit supply and
monetary policy: Identifying the bank balance-sheet channel with loan
applications. American Economic Review, 102(5), 2301-26.
Kalirai, H., & Scheicher, M. (2002). Macroeconomic stress testing: preliminary
evidence for Austria. Financial Stability Report, (3), 58-74.
Kaplan, S. N., & Schoar, A. (2005). Private equity performance: Returns, persistence,
and capital flows. The Journal of Finance, 60(4), 1791-1823.
Koch, T. W. and McDonald (2003). Bank Management. 3rd edition, Sydney, Thomson.
Kozak, S. (2015). Concentration of credit exposure as a significant source of risk in
banking activities: the idea and methods of estimation. e-Finanse, 11(3), 103-
115.
52
Leon, F. (2017). Implications of loan portfolio concentration in Cambodia. Economics
Bulletin, 37(1), 282-296.
Lintner, J. (1975). The valuation of risk assets and the selection of risky investments in
stock portfolios and capital budgets. In Stochastic Optimization Models in
Finance (pp. 131-155).
Llewellyn, D. T. (2002). An analysis of the causes of recent banking crises. The
European journal of finance, 8(2), 152-175.
Markowitz, H. (1952). Portfolio selection. The journal of finance, 7(1), 77-91.
Mercieca, S., Schaeck, K., & Wolfe, S. (2007). Small European banks: Benefits from
diversification? Journal of Banking & Finance, 31(7), 1975-1998.
Meyer, A. P., & Yeager, T. J. (2001). Are small rural banks vulnerable to local
economic downturns?. Federal Reserve Bank of St. Louis Review, (Mar), 25-38.
Mwangi, B. W., & Muturi, W. (2016). Effects of credit risk management on loan
repayment performance of commercial banks in Kenya. International Academic
Journal of Economics and Finance, 2(2), 1-24.
Ngerebo, T. A. (2012). The impact of foreign exchange fluctuation on the
intermediation of banks in Nigeria (1970 2004). African Journal of Business
Management, 6(11), 3872-3879.
Nkusu, M. (2011). Non-performing Loans and Macrofinancial Vulnerabilities in
Advanced Economies Strategy. Policy and Review Department, IMF Working
Paper, WP/11/161, Jully.
Owino, M., & Otieno, M. (2013). The Effect of the Lending Policies on the Levels of
Non-Performing Loans (NPLS) of Commercial Banks in Kenya. Unpublished
Thesis, University of Nairobi.
53
Rachdi, H. (2013). What determines the profitability of banks during and before the
international financial crisis? Evidence from Tunisia. International Journal of
Economics, Finance and Management, 2(4), 29-37.
Rhoades, S. A. (1993). The Herfindahl-Hirschman Index. Federal Reserve Bank of St.
Louis Economic Review, March, 188-189.
Richard, E. (2011). Factors that cause non–performing loans in commercial banks in
Tanzania and strategies to resolve them. Journal of management policy and
practice, 12(7), 2011.
Rossi, S. P., Schwaiger, M. S., & Winkler, G. (2009). How loan portfolio diversification
affects risk, efficiency and capitalization: A managerial behavior model for
Austrian banks. Journal of Banking & Finance, 33(12), 2218-2226.
Salas, V. and Saurina, J., 2002. Credit risk in two institutional regimes: Spanish
commercial and savings banks. Journal of Financial Services Research, 22(3),
pp.203-224.
Saunders, A., & Cornett, M. M. (2011). Financial Institutions Management: Risk
management Approach. (7 th edn) Singapore: Mc Hill International.
Sekaran, U., & Bougie, R. (2010). Theoretical framework In theoretical framework and
hypothesis development. Research methods for business: A skill building
approach, 80.
Sharpe, W. F. (1994). The sharpe ratio. Journal of portfolio management, 21(1), 49-58.
Sirpal, R. (2009). Methods of payment and foreign-exchange risk management among
firms in Brunei Darussalam. The Journal of Risk Finance, 10(4), 377-392.
Sufian, F. (2014). The nexus between economic freedom and Islamic bank
performance: Empirical evidence from the MENA banking sectors.
Contemporary Review of the Middle East, 1(4), 411-439.
54
Tabak, B. M., Fazio, D. M., & Cajueiro, D. O. (2011). The effects of loan portfolio
concentration on Brazilian banks’ return and risk. Journal of Banking &
Finance, 35(11), 3065-3076.
Thiagarajan, S., Ayyappan, S., & Ramachandran, A. (2011). Credit risk determinants
of public and private sector banks in India. European Journal of Economics,
Finance and Administrative Sciences, 34, 147-154.
Thygerson, K. J. (1995). Management of financial institutions. Scott, Foresman.
Vogiazas, S. D., & Nikolaidou, E. (2011). Investigating the determinants of
nonperforming loans in the Romanian banking system: An empirical study with
reference to the Greek crisis. Economics Research International, 2011.
Waemustafa, W., & Sukri, S. (2015). Bank specific and macroeconomics dynamic
determinants of credit risk in Islamic banks and conventional banks.
International Journal of Economics and Financial Issues, 5(2), 476-481.
Ware Jr, J. E., & Sherbourne, C. D. (1992). The MOS 36-item short-form health survey
(SF-36): I. Conceptual framework and item selection. Medical care, 473-483.
Were, M., Nzomoi, J., & Rutto, N. (2012). Assessing the impact of private sector credit
on economic performance: Evidence from sectoral panel data for Kenya.
International Journal of Economics and Finance, 4(3), 182-191.
Winton, A. (1999). Don't put all your eggs in one basket? Diversification and
specialization in lending.
Zameer, S., & Siddiqi, M. W. (2010). The impact of Export, FDI and External Debt on
Exchange Rate Volatility in Pakistan. International Journal of Contemporary
Research in Business, 2(7), 337-354.
Zribi, N., & Boujelbegrave, Y. (2011). The factors influencing bank credit risk: The
case of Tunisia. Journal of accounting and taxation, 3(4), 70-78.

55
APPENDICES
Appendix I: Data Collection Form I (Loan Portfolio Concentration)
Name of the Bank......................................................................................................
No. Year 2013 2014 2015 2016 2017
1. Trade
2. Personal/Household
3. Real Estate
4. Manufacturing
5 Building and construction
6. Transport and
Communication
7. Agriculture
8. Energy and Water
9. Tourism, restaurant and
Hotels
10. Financial services
11 Mining and Quarrying
Total Gross Loans
HHI will be calculated as
𝐻𝐻𝐼 =∑
𝑛
𝐼=1
𝑆2
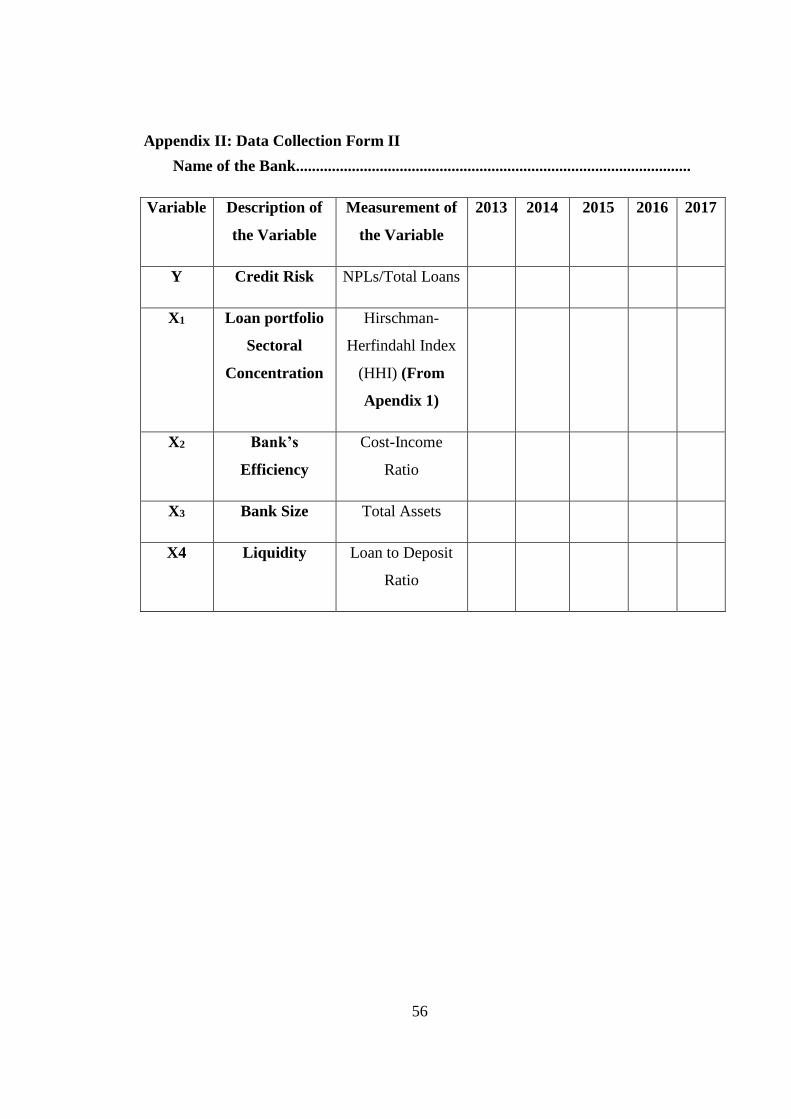
56
Appendix II: Data Collection Form II
Name of the Bank...................................................................................................
Variable Description of
the Variable
Measurement of
the Variable
2013 2014 2015 2016 2017
Y Credit Risk NPLs/Total Loans
X1 Loan portfolio
Sectoral
Concentration
Hirschman-
Herfindahl Index
(HHI) (From
Apendix 1)
X2 Bank’s
Efficiency
Cost-Income
Ratio
X3 Bank Size Total Assets
X4 Liquidity Loan to Deposit
Ratio
57
Appendix III: Licensed Commercial Banks in Kenya
1. ABC Bank (Kenya)
2. Bank of Africa Ltd
3. Bank of Baroda (K) Limited
4. Bank of India
5. Barclays Bank of Kenya Limited
6. Citibank N.A Kenya
7. Commercial Bank of Africa
8. Consolidated Bank of Kenya
9. Cooperative Bank of Kenya Limited
10. Credit Bank Limited
11. Development Bank of Kenya Limited
12. Damond Trust Bank Limited
13. Dubai Islamic Bank (Kenya) Limited
14. Ecobank Kenya Limited
15. Equity Bank Limited
16. Family Bank Limited
17. First Community Bank Limited
18. Guaranty Trust Bank (K) Ltd
19. Guardian Bank Limited
20. Gulf African Bank Limited
21. Habib Bank A.G Zurich
22. Housing Finance Company of Kenya
23. I&M Bank Limited
58
24. Imperial Bank Kenya (In Receivership)
25. Jamii Bora Bank
26. Kenya Commercial Bank (Kcb)
27. Mayfair Bank Limited
28. Middle East Bank (K) Limited
29. National Bank of Kenya
30. NIC Bank Limited
31. M-Oriental Commercial Bank
32. Paramount Universal Bank Limited
33. Prime Bank Limited
34. SBM Bank Kenya Limited
35. Sidian Bank Limited
36. Spire Bank Limited
37. Stanbic Bank Kenya Limited
38. Standard Chartered Bank Kenya Limited
39. Trans National Bank Limited
40. UBA Kenya Bank Limited
41. Victoria Commercial Bank Limited
Source: Central Bank of Kenya (CBK) report 2017
Related Documents