Near-Source Strong Ground Motion Characteristics of the 2008 Wenchuan Earthquake by Zengping Wen, Junju Xie, Mengtan Gao, Yuxian Hu, and K. T. Chau Abstract The free-field strong ground motions recorded at 64 sites within 200 km from the ruptured Longmen Shan fault during the 12 May 2008 M w 7.9 Wenchuan earthquake were used to examine the near-source strong ground motioncharacteristics. The magnitude of vertical and horizontal peak ground accelerations (PGAs), frequency content, and duration of acceleration histories are analyzed. The observed peak ground accelerations at distances exceeding 60 km from the ruptured fault were significantly higher than those predicted by the Next Generation Attenuation (NGA) model, whereas, for periods of larger than 1 s, the spectral accelerations are much smaller than those of the NGA model. The same is also true for the observed peak ground velocities (PGVs). The duration of ground shaking is longer than for most earthquakes of comparable similar magnitude. For sites within 60 km from the ruptured fault, the accelerations observed on the hanging wall are larger than those observed on the footwall. The duration of ground shaking along the rupture direction (or the forward direction) is shorter than that opposite to the rupture direction (or the backward direction). There is also a systematic increase of PGA and PGV at sites located in the direction of the rupture propagation, whereas no such clear trend was found in the stations located along the backward direction. From the observed acceleration time histories at various locations, the rupture process of the 2008 Wenchuan appears to be more complicated than the focal mechanism interpreted from far-field seismic records. For example, the generation mechanism of the two distinct wave trains observed at Wolong and other stations need more detailed studies. Introduction At 06:28:01 UTC (14:28 Beijing time) on 12 May 2008, a great earthquake measuring M w 7.9 struck Wenchuan County, Sichuan Province, China, with the epicenter close to the town of Yingxiu (31.0° N, 103.4° E). The energy radiated by the Wenchuan earthquake was so tremendous that shaking could be felt in most parts of China and was felt as far as Pakistan and Thailand, with the most violent shaking being felt in Sichuan, Gansu, and Shanxi Provinces. The severe ground shaking of up to 1g caused heavy damage to many reinforced concrete buildings, bridges, and lifelines in an elongated zone from Yingxiu to Beichuan, with a modified Mercalli intensity (MMI) of XI in this zone. Numerous landslides and debris flows were triggered by the extremely strong shaking, causing heavy casualties and economic losses. Geologically, the 2008 Wenchuan earthquakewas caused by dynamic rupture along two major faults (i.e., the Beichuan–Yingxiu fault and the Guanxian–Jiangyou fault) within the northeast trending Longmen Shan thrust belt, one of the intraplate thrust-faulting systems along the eastern mar- gin of the Tibetan Plateau. Field investigations after the earth- quake revealed that both the Beichuan–Yingxiu fault and the Guanxian–Jiangyou fault caused clear surface ruptures (Xu et al., 2008). The surface rupture along the Beichuan– Yingxiu fault extends for some 240 km, while the surface rupture along the Guanxian–Jiangyou fault extends for some 72 km. Both surface ruptures show a dominant thrust-faulting component with a minor right strike-slip component. Previous studies suggest that a complicated source rup- ture process was involved in the 2008 Wenchuan earthquake (Parsons et al., 2008; Wang et al., 2008; Koketsu et al., 2009; Zhang et al., 2009). Inverse analysis on the focal mechanism (e.g., Du et al., 2009) gives the following plausible rupture scenario, but it is by no means the actual one. It was inferred that the fault-rupture of the earthquake may exceed 300 km in length, originating at 15 km beneath the town of Yingxiu in Wenchuan County and terminating at Qingchuan County in the northeast. The source rupture might last as long as 90 s, with the largest slip displacement occurring underneath Ying- xiu and Beichuan. The average slip displacement of the whole ruptured surface is about 2.4 m. The rupture process may be divided into two phases: the former lasting for 50 s with a length of about 110 km and the latter lasting for about 40 s 2425 Bulletin of the Seismological Society of America, Vol. 100, No. 5B, pp. 2425–2439, November 2010, doi: 10.1785/0120090266

Welcome message from author
This document is posted to help you gain knowledge. Please leave a comment to let me know what you think about it! Share it to your friends and learn new things together.
Transcript

Near-Source Strong Ground Motion Characteristics
of the 2008 Wenchuan Earthquake
by Zengping Wen, Junju Xie, Mengtan Gao, Yuxian Hu, and K. T. Chau
Abstract The free-field strong ground motions recorded at 64 sites within 200 kmfrom the ruptured Longmen Shan fault during the 12 May 2008 Mw 7.9 Wenchuanearthquake were used to examine the near-source strong ground motioncharacteristics.The magnitude of vertical and horizontal peak ground accelerations (PGAs), frequencycontent, and duration of acceleration histories are analyzed. The observed peak groundaccelerations at distances exceeding 60 km from the ruptured fault were significantlyhigher than those predicted by the Next Generation Attenuation (NGA) model,whereas, for periods of larger than 1 s, the spectral accelerations are much smallerthan those of the NGA model. The same is also true for the observed peak groundvelocities (PGVs). The duration of ground shaking is longer than for most earthquakesof comparable similar magnitude. For sites within 60 km from the ruptured fault, theaccelerations observed on the hanging wall are larger than those observed on thefootwall. The duration of ground shaking along the rupture direction (or the forwarddirection) is shorter than that opposite to the rupture direction (or the backwarddirection). There is also a systematic increase of PGA and PGV at sites located in thedirection of the rupture propagation, whereas no such clear trend was found in thestations located along the backward direction. From the observed acceleration timehistories at various locations, the rupture process of the 2008 Wenchuan appears to bemore complicated than the focal mechanism interpreted from far-field seismic records.For example, the generation mechanism of the two distinct wave trains observed atWolong and other stations need more detailed studies.
Introduction
At 06:28:01 UTC (14:28 Beijing time) on 12May 2008, agreat earthquakemeasuringMw 7.9 struckWenchuanCounty,Sichuan Province, China, with the epicenter close to the townof Yingxiu (31.0° N, 103.4° E). The energy radiated by theWenchuan earthquake was so tremendous that shaking couldbe felt inmost parts of China andwas felt as far as Pakistan andThailand, with the most violent shaking being felt in Sichuan,Gansu, and Shanxi Provinces. The severe ground shaking ofup to 1g caused heavy damage to many reinforced concretebuildings, bridges, and lifelines in an elongated zone fromYingxiu to Beichuan, with a modified Mercalli intensity(MMI) of XI in this zone. Numerous landslides and debrisflowswere triggered by the extremely strong shaking, causingheavy casualties and economic losses.
Geologically, the 2008Wenchuan earthquakewas causedby dynamic rupture along two major faults (i.e., theBeichuan–Yingxiu fault and the Guanxian–Jiangyou fault)within the northeast trending Longmen Shan thrust belt, oneof the intraplate thrust-faulting systems along the eastern mar-gin of the Tibetan Plateau. Field investigations after the earth-quake revealed that both the Beichuan–Yingxiu fault and the
Guanxian–Jiangyou fault caused clear surface ruptures(Xu et al., 2008). The surface rupture along the Beichuan–Yingxiu fault extends for some 240 km, while the surfacerupture along the Guanxian–Jiangyou fault extends for some72 km. Both surface ruptures show a dominant thrust-faultingcomponent with a minor right strike-slip component.
Previous studies suggest that a complicated source rup-ture process was involved in the 2008 Wenchuan earthquake(Parsons et al., 2008; Wang et al., 2008; Koketsu et al., 2009;Zhang et al., 2009). Inverse analysis on the focal mechanism(e.g., Du et al., 2009) gives the following plausible rupturescenario, but it is by no means the actual one. It was inferredthat the fault-rupture of the earthquake may exceed 300 km inlength, originating at 15 km beneath the town of Yingxiu inWenchuan County and terminating at Qingchuan County inthe northeast. The source rupture might last as long as 90 s,with the largest slip displacement occurring underneath Ying-xiu and Beichuan. The average slip displacement of thewholeruptured surface is about 2.4 m. The rupture process may bedivided into two phases: the former lasting for 50 s with alength of about 110 km and the latter lasting for about 40 s
2425
Bulletin of the Seismological Society of America, Vol. 100, No. 5B, pp. 2425–2439, November 2010, doi: 10.1785/0120090266

with a length of 190 km. The energy radiation originated fromthe southwest end of the Beichuan–Yingxiu fault; and, as timewent on, the origin of energy radiation shifted graduallytoward the northeast, finally terminating at the northeast endof the Beichuan–Yingxiu fault (Du et al., 2009). We shouldemphasize that this is only one of the many plausible rupturescenarios and that the actual rupture process remains to beinvestigated. In particular, to our best knowledge, nobodyhas been able to replicate the strong ground motiontime his-tories observed in the near-field based on the inferred rupturedprocess (such as the one just described herein).
The Wenchuan earthquake left behind the first compre-hensive set of strong groundmotion records from an intraplatelarge earthquake in China, and they are extremely useful inexamining the process of earthquake rupture, as well as pro-viding the basis for formulating a further design responsespectrum for China. More specifically, more than 1400 accel-erograms were recorded by 460 strong motion stations ofChina’s National Strong Motion Observation Network (threeeast–west, north–south, and up–down components at eachstation). There are 115 strong-motion stations recording peakground accelerations (PGAs) larger than 100 Gal, 42 strong-motion stations with PGAs larger than 200 Gal, 16 strong-motion stations with PGA larger than 400 Gal, and 7strong-motion stations with PGA larger than 600Gal (Li et al.,2008; Yu et al., 2009). These provide us with an unusualopportunity to investigate the characteristics of near-sourcestrong ground motions.
In this paper, a total of 64 near-field strong groundmotion acceleration records are used to examine the earth-quake rupture characteristics, the rupture directivity, andhanging-wall effects. All 64 strong ground motionstationsare located within 200 km from the ruptured Beichuan–Yingxiu fault and Guanxian–Jiangyou fault. These recordsare examined and compared to the Next Generation Attenua-tion (NGA) relationships that were established for shallowcrustal earthquakes from thousands of records compliedworldwide.
Peak Ground Accelearation (PGA), Peak GroundVelocity (PGV), and Durations of Strong
Ground Motion Records
Within 200 km of the ruptured Beichuan–Yingxiu faultand Guanxian–Jiangyou fault, 64 strong ground motionobservation stations successfully recorded the accelerationtime histories during the Wenchuan earthquake. Figure 1shows the locations of these strong motion stations togetherwith the two surface ruptures of the Beichuan–Yingxiu faultand Guanxian–Jiangyou fault and the locations of the townsof Yingxiu, Beichuan, Qingchuan, and the city of Chengdu.These stations are divided into four groups according to thelocation of strong-motion stations relative to the causativefault: (1) northeast of the causative fault (solid squares);(2) southwest of the causative fault (open squares); (3) onthe hanging wall (solid triangles); and (4) on the footwall
(open triangles). In determining whether a station is on thehanging wall or footwall, we have used only the surface rup-ture of Beichuan–Yingxiu fault because of its much longerrupture surface (240 km) compared to the surface rupture ofthe Guanxian–Jiangyou fault (72 km). All strong–motionstations were equipped with a three-component, force-balance accelerometer. Most of the digital accelerometerswere either an ETNA or an MR2002 with a 18-bit resolutionand a 108-db dynamic range. The full scale of the recordingsystem is�2g, and the sampling rate was 200 or 500 data persecond. Each recording system was operated in trigger modewith a 20-s pre-event memory (Lu and Li, 2008). The siteconditions of these stations will be presented in later sec-tions, and we generally follow the site classification systemof rock sites, hard soil sites (with average VS > 250 m=s forthe top 30 m of soil), and soft soil sites (with average VS <250 m=s for the top 30 m of soil). This classification differsfrom that adopted in the Chinese code (2001), which isreproduced in Table 1 for reference. In general, Class I cor-responds to rock site or site with less than a few meters of
102ºE
51LDJ
51LDD51LDL
51LDS
51KDT
51LXS
51XJD51XJB
51MEZ
51MED
51XJL
51HSD
51BXD51BXY
51BXZ
51LSF51TQL51LSH
51LSJ
51HYJ
51HYW
51YAL
51HYY51HYQ
51JKH
51WCW
51LXT
51HSL
51LXM
51HYK51YAS51YAD
51YAM
51QLY51DXY
51PJD51PJW
51CDZ
51MZQ
51MXD
51MXT51JYH
51JZB
51SPA
51SPC51SPT
51JZW
Beichuan-Yingxiu fault
51JZG62WIX
62WUD
62TCH
51PWM
62SHW
51JZY
51AXT51MXN
51PXZ
51SFB 51DYB
Guanxian-Jiangyou fault
51GYZ
51GYS
51JYC51JYT 51CXQ
Chengdu
Beichuan
Qingchuan
Yingxiu
104ºE
31ºN
32ºN
33ºN
34ºN
30ºN
105ºE 106ºE103ºE
29ºN
Epicenter
City
Town
0 40km
Figure 1. Locations of 64 free-field, three-component, digitalseismic stations. Solid and open triangles indicate the stations lo-cated on hanging wall and footwall, respectively, whereas solid andopen squares indicate the stations located in the forward directivityarea and in the backward directivity area. Surface ruptures of theBeichuan–Yingxiu fault and Guanxian–Jiangyou fault are sketchedin the middle with the locations of Yingxiu, Beichuan, Qingchuan,and Chengdu.
2426 Z. Wen, J. Xie, M. Gao, Y. Hu, and K. T. Chau

soil, whereas the classification of Classes II, III, and IVdepends on both soil wave speed and soil thickness. Theactual data of the acceleration time histories of these stationsare available from the China Strong Motion Networks Center(see Data and Resources section).
The spatial distribution of the maximum horizontalground acceleration (MHA) is shown in Figure 2 by plottingthe horizontal PGA of the 64 stations shown in Figure 1. Thehighest value of horizontal acceleration is 955.7 Gal (east–west) recorded at Wolong (station 51WCW in Figure 1 andFigure 2), which is located about 23 km southwest of theepicenter on the hanging-wall side of the Beichuan–Yingxiufault. The second highest value of horizontal acceleration is824 Gal observed at Qingping (station 51MZQ in Figure 1
and Figure 2), which is located near the center of the surfacerupture of the Beichuan–Yingxiu fault on the footwall side.The third highest value of horizontal ground accelerationwas recorded at Bajiao (station 51SFB in Fig. 1 and Fig. 2),which is again near the center of the surface rupture of theBeichuan–Yingxiu fault on the footwall side. Figure 2 showsthat the highest MHA values are strongly influenced by thesurface rupture of the Beichuan–Yingxiu fault and that PGAattenuation along the forward direction of the rupture isslower than that in the opposite direction; that is, there isa northeast directivity effect. Figure 2 also shows that theattenuation of PGA on the mountainous hanging-wall sideis slower than that on the footwall side on the Sichuan basin.This is one of the main reasons why Chengdu did not suffersevere damage during the Wenchuan earthquake.
The spatial distribution of the maximum horizontalground velocity (MHV) is plotted in Figure 3. The highestpeak ground velocity (137:7 cm=s) was recorded in Qingp-ing (station 51MZQ). Similar to the conclusion drawn fromFigure 2, the highest MHV values are mainly concentratedalong the elongated northwest-trending zone coinciding withthe surface rupture of the Beichuan–Yingxiu fault.
A special feature shown in Figure 2 and Figure 3 is thatthe MHA and MHV values at stations 51GYZ and 51GYS,which are located on the northwest side of the rupture sur-face, appear to be larger than those stations at comparable
Table 1Site Classification System Adopted in China in 2001
Equivalent ShearWave Velocity (m=s)*
Depth of Overlay Soil (m)
Class I Class II Class III Class IV
VSe > 500 0 — — —250 < VSe ≤ 500 <5 ≥5 — —140 < VSe ≤ 250 <3 3 ∼ 50 >50 —VSe ≤ 140 <3 3 ∼ 15 15 ∼ 80 >80
*VSe is the equivalent shear wave velocity of the upper soil layer atthe site.
Chengdu
51XJB
51XJL
51XJD
51HSD
51MEZ
51MED 51HSL
51LXM
51LXS
62SHW
62TCH
62WUD
51GYS
51JYC
51CXQ
51PJW
51CDZ
51DXY
51PXZ
51JZY
62WIX
51JZG
51PWM
51SPC
51SPA
51SPT
51JZW
51JZB
51MXD
51JYH
51MZQ 51AXT
51HYW
51HYQ
51PJD
51QLY51BXZ
51BXY
51SFB51DYB
51LXT
51GYZ
51MXT
51WCW
51JYT
51LSH
51TQL
51HYJ
51YAS
51JKH
51HYK
51KDT
51LDD
51LDL
104ºE 105ºE 106ºE103ºE102ºE
31ºN
30ºN
29ºN
32ºN
33ºN
34ºN
Epicenter
Rupture fault
Buried fault
960 Gal0
Figure 2. Maximum horizontal PGA distribution along the rup-tured faults.
Chengdu
62SHW
51JZY62WUD
62TCH
51JZB
51JZW51JZG
51SPT
51SPC62WIX
51YAL
51LSH
51LSF51TQL
51LSJ
51YAS
51KDT
51LDS
51LDL
51HYQ51LDJ
51LDD
51QLY
51XJB
51BXY
51XJD
51XJL
51LXS
51LXT
51HYK
51PJD
51HYJ
51JKH51HYW
51PJW
51DXY
51LXM51MEZ
51HSL
51HSD
51MED
51MXD
51CDZ
51PXZ
51SFB
51MZQ 51AXT
51JYH
51SPA
51JYC
51CXQ
51GYS
51GYZ
51MXT51JYT
51DYB
51BXZ
51YAM
51PWM
51BXD
104ºE 105ºE 106ºE103ºE102ºE
31ºN
30ºN
29ºN
32ºN
33ºN
34ºN
Epicenter
Rupture fault
Buried fault
140cm/s0
51WCW
Figure 3. Maximumhorizontal PGVdistributionalong the faults.
Near-Source Strong Ground Motion Characteristics of the 2008 Wenchuan Earthquake 2427

distance from the rupture surface along the backward (south-west) direction.
Figure 4 shows the spatial distribution of the duration ofthe strong ground motions. To systematically analyze theduration of the time histories, we use the so-called “signifi-cant duration” (DS), which is defined as the time intervalneeded to build up 5% to 95% of the Arias intensity of thetime history record (Dobry et al., 1978; Trifunac and Brady,1975). Arias intensity is defined by the integration (Arias1970; Travasarou et al., 2003)
IA � π2g
ZT
0
a2�t�dt; (1)
where a�t� is acceleration time history, g represents gravita-tional acceleration (i.e., 9:81 m=s2) and T represents totalduration of the time history. Arias intensity is proposedto provide an objective measure of earthquake intensity.Figure 4 shows that most DS at these strong stations fallbetween 60 and 120 s, which is comparatively longer thanother earthquakes of similar magnitude. For example, the1999 Kocaeli earthquake, with a slightly smaller magnitudeofMw 7.4, falls between 30 and 40 s (Youd et al., 2000). TheDS of ground motions at sites located southwest of the faultswere found to be systematically larger than those at siteslocated northeast of the epicenter. Clearly, DS of groundshaking depend strongly on the direction of the rupture
propagation. In short, long shaking DS in stations is foundin the backward directivity area (or southwest region), andshorter shaking DS is found in stations in the forward direc-tivity area (or northeast region). In general, the DS of groundshaking during the Wenchuan earthquake is unusually long.
Accleration and Velocity Time Historiesand Response Spectra
Figure 5 plots the three components (east-west or EW,north-south or NS, and up-down or UD) of the accelerationtime histories at Wolong (51WCW), Qingping (51MZQ),Bajiao ( 51SFB), and Jiangyou (51JYH). As shown inFigure 5, these four stations are located along the two rupturesurfaces of the Beichuan–Yingxiu and Guanxian–Jiangyoufaults. Wolong (51WCW) and Qingping (51MZQ) are lo-cated on the hanging wall of the Beichuan–Yingxiu fault,whereas Bajiao (51SFB) and Jiangyou (51JYH) are locatedon the footwall. These four stations have the highest valuesof peak ground accelerations among all 64 stations shownin Figure 1. The highest acceleration recording was observedat Wolong (51WCW), which has the shortest epicentral dis-tance of about 23 km, with PGA values in EW, NS, and UDdirections being 957.7 Gal, 652.9 Gal and 948.1 Gal, respec-tively. Note that the vertical PGA is about the same as thePGA of the EW component. The second highest PGA is ob-served at Qingping (51MZQ), which has the closest distancefrom the fault line of about 3 km. The EW, NS, and UD com-ponents of the observed PGA at Qingping are 824.1 Gal,802.7 Gal, and 622.9 Gal, respectively. The third highestvalue of PGA is recorded at Bajiao (51SFB), with PGAvaluesin EW, NS, and UD being 556.1 Gal, 581 Gal, and 633 Gal,respectively. It should be noted that at Bajiao the verticalPGA exceeds that of the horizontal one. It appears that theacceleration traces at different locations along the causativefault exhibit significantly different behaviors.
In the acceleration traces for Wolong (51WCW), it wasclearly observed that two wave trains are separated by aphase of weaker motions which lasts for 15 s. The PGA ofthe first wave train is up to 1gwhereas the second one is up to0:5g. The time histories at Wolong given in Figure 5 suggestthat the Wenchuan earthquake is a result of two separatestrong earthquakes. However, such a distinct two-wave-trainphenomenon cannot be easily seen from other near-fault sta-tions such as Qingping, Bajiao, and Jiangyou. At Qingping(51MZQ) and Bajiao (51SFB), there are still traces of super-position of two wave trains, but the second wave trainappears to have a much smaller magnitude; and, at Jiangyou(51JYH) it is hard to tell whether the resulting time historyis a superposition of two wave trains. The fault-rupturemechanism leading to this peculiar strong ground motionis still not well known. We speculate that it may relate to thefact that two distinct surface ruptures were observed (i.e., theBeichuan–Yingxiu and Guanxian–Jiangyou faults), suggest-ing there were two separate rupture processes during theWenchuan earthquake.
Chengdu
51BXZ51BXY
51BXD
51XJD51XJB
51YAS
51YAD51YAL
51HYQ51HYY
51TQL
51HYJ
51LDL
51LDJ
51LDS
51SFB
51AXT
51JYT
51DYB
51MXN51MZQ51LXS
51LXM51LXT
51MXT
51JZG
51XJL
51MEZ
51MED51HSD 51HSL 51MXD
51SPA
51SPT
51SPC
51JZW
51JYH51JYC
51PWM
62WIX
51GYS
62WUD
62SHW
51JZB
51JZY
51CXQ
51GYZ
51CDZ
51HYW 51JKH
KDT
62TCH
51WCW51PXZ
51PJD
51QLY
51LSF
51HYK
104ºE 105ºE 106ºE103ºE102ºE
31ºN
30ºN
29ºN
32ºN
33ºN
34ºN
Epicenter
Rupture fault
Buried fault
130s0
Figure 4. The distribution of the significant duration (DS) of theacceleration time histories.
2428 Z. Wen, J. Xie, M. Gao, Y. Hu, and K. T. Chau

The velocity traces of the Wolong, Qingping, Bajiao,and Jiangyou (51WCW, 51MZQ, 51SFB, and 51JYH)stations, integrated from acceleration records, are shown inFigure 6. A very clear, distinct, strong velocity pulse wasobserved at Qingping (51MZQ), which is located about 3 kmfrom the surface rupture. The velocity pulse was 8 seconds induration. Note also that this pulse did not occur at the begin-ning of the record, suggesting that it may be a result of largefault slip in the Beichuan area, instead of from Yingxiu (theepicenter region). There is also a very distinct velocity pulseof period of 8 s observed at Jiangyou, which is located to thenortheast of Qingping, whereas the velocity pulse is not clearat Wolong and Bajiao. The actual slip mechanism leading tothis localized effect of velocity pulse remains to be studied,but this nevertheless shows the complexity of the slipmechanism of the Wenchuan earthquake.
This period of 8 s at 51MZQ and 51JYH is much longerthan those observed during the Chi-Chi earthquake (Tsaotunstation, 4.3 s) and the Kobe earthquake (Kobe University,1.6 s) (Somerville, 2003). It is consistent with the conclusionby Somerville (2003) that the near-fault velocity pulse periodbecomes longer as earthquake magnitude gets larger. Fieldinvestigations showed that both the town of Yingxiu in theepicenter area and the town of Beichuan near Qingping suf-fered from an MMI XI macrointensity motion. This seems toagree with the strong ground motion records observed atWolong and Qingping. Again, the velocity trace of 51WCW
demonstrates two separate short-duration wave trains, and itis evident that the source rupture process involves at leasttwo major rupture events. As mentioned before, these wavetrains may correspond to the two successive subevents of theBeichuan–Yingxiu fault and Guanxian–Jiangyou fault thattook place with a 25-s separation.
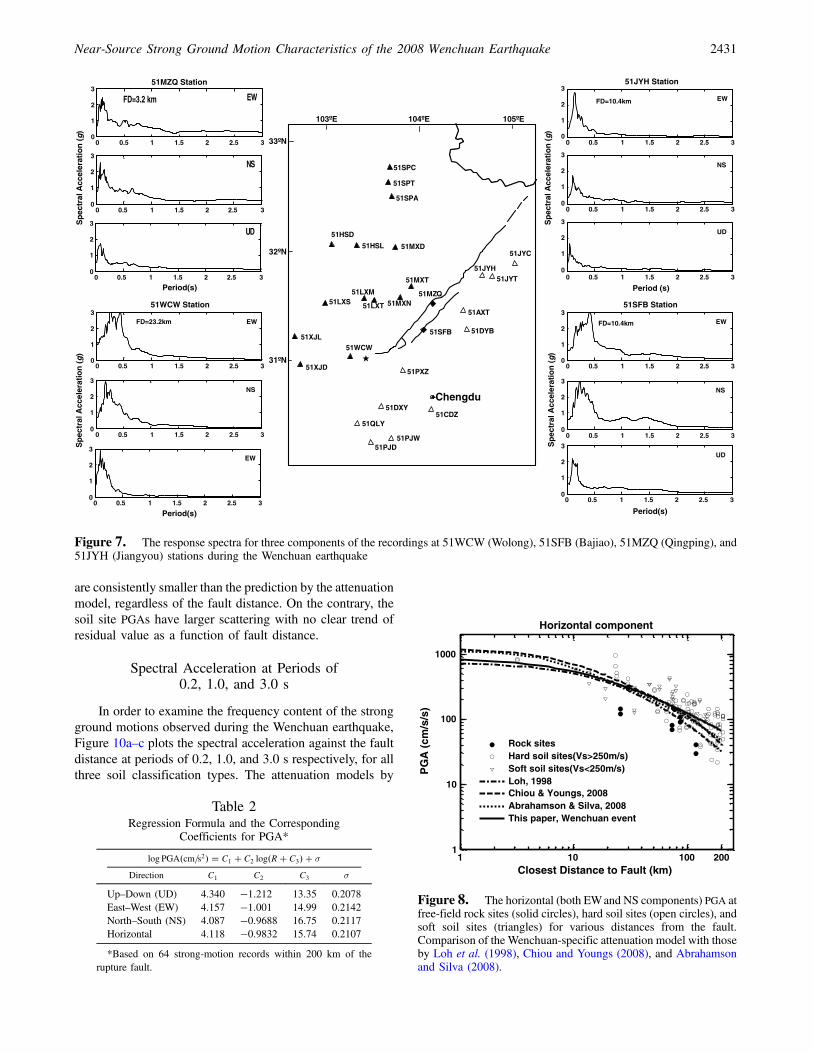
Figure 7 shows the response spectra calculated fromstrong motions recorded at these four stations (51WCW,51MZQ, 51SFB, and 51JYH). The acceleration responsespectra were computed at 5% damping. Figure 7 shows thatthe predominant ground shaking is with a period of 1 s or less,and there are not many low-frequency or long-period compo-nents in the near-fault ground motions. An independentshaking table test has been recently conducted at the HongKong Polytechnic University, suggesting that strong shakingwith a period of less than 1 s is responsible for the overtoppingof the Han Emperor Statue in the town of Hanwang (which isvery close to Bajiao andQingping). Details of this experimentwill be reported separately.
Attenuation of Ground Motions and Comparisonto the NGA Model
The abundance of strong ground motion records within200 km from the rupture fault provides us a unique oppor-tunity to establish an attenuation model for the LongmenShan area and allows us to compare its characteristics with
51LXS
51XJL
51XJD
51WCW
51QLY
51LXM
51LXT
51HSD
51SPA
51SPT
51SPC
51MXD51HSL
51MXT
51MXN51MZQ
51PJD
51CDZ
51PXZ
51DXY
51PJW
51SFB
51JYC
51JYH51JYT
51AXT
51DYB
Chengdu
104°E 105°E103°E
31°N
32°N
33°N
0 50 100 150
0 50 100 150
0 50 100 150
0 50 100 150
0 50 100 150
0 50 100 150
51MZQ Station
EWFD=3.2 km
NS
Time (s)
UD
0 50 100 150
0 50 100 150
51JYH Station
EWFD=13.6 km
NS
UD
-1000
0
1000
-1000
0
1000
-1000
0
1000
51WCW Station
EWFD=23.2 km
Acc
eler
atio
n (
cm/s
/s) -1000
0
1000
-1000
0
1000
-1000
0
1000Acc
eler
atio
n (
cm/s
/s)
-1000
0
1000
-1000
0
1000
-1000
0
1000Acc
eler
atio
n (
cm/s
/s) -1000
0
1000
-1000
0
1000
-1000
0
1000
Acc
eler
atio
n (
cm/s
/s)
NS
Time (s) Time (s)
UD
0 50 100 150
0 50 100 150
0 50 100 150
Time (s)0 50 100 150
51SFB Station
EWFD=10.4 km
NS
UD
Figure 5. Three components of acceleration at the 51WCW (Wolong), 51SFB (Bajiao), 51MZQ (Qingping), and 51JYH (Jiangyou)stations during the Wenchuan earthquake
Near-Source Strong Ground Motion Characteristics of the 2008 Wenchuan Earthquake 2429

the global attenuation relationship (such as the NGA model).The following attenuation relation for the Wenchuan earth-quake is proposed:
log�PGA� � C1 � C2 log�R� C3� � σ; (2)
where PGA is in cm=s2; R is the rupture distance in km; andC1, C2, and C3 are regression coefficients. Results of theregression analyses for PGA are listed in Table 2.
The resulting horizontal PGA attenuation relation isshown in Figure 8, together with other attenuation models.In particular, the attenuation relation given in equation (2)and Table 2 is compared with the attenuation relation forMw 7.9 given by Loh et al. (1998), Chiou and Youngs (2008),andAbrahamson and Silva (2008). The raw data (both EWandNS components) were plotted as a function of the site condi-tion (see Table 1), with solid circles, open circles and opentriangles representing rock sites, hard soil sites (VS >250 m=s), and soft soil sites (VS < 250 m=s), respectively.Compared to the predictions of the NGA models of Chiouand Youngs (2008) and Abrahamson and Silva (2008), withVS � 250 m=s, Figure 8 shows that our attenuation modelgives a smaller PGA for fault distance of less than 30 kmbut a larger PGA value for fault distance larger than 30 km.Equivalently, the ground shaking attenuation appears to beslower in the Longmen Shan area. On the other hand, theattenuation model of Loh et al. (1998) with VS > 250 m=s
consistently gives smaller PGAs than does the present model.Note, however, that there are only a few data points of PGA(circles or triangles in Fig. 8) for fault distance of less than20 km, so detailed comparison with other attenuation inthe near-fault region may not be very meaningful and mustbe done with caution. However, it seems clear that Wenchuanearthquake PGA data for fault distance of larger than 60 kmappear to be consistently larger than those values predicted byother attenuationmodels. Similar observations have also beenmade during the Loma Prieta earthquake and Landers earth-quake (Campbell, 1991; Campbell and Bozorgnia, 1994). Ingeneral, the rock site PGAs are consistently smaller than thevalues given for the attenuation models by Loh et al. (1998),Chiou andYoungs (2008), andAbrahamson and Silva (2008).For soil site conditions, there appears to be no clear trend oflarger or smaller PGA when comparing the three models,depending on the fault distance of the stations; however, ingeneral, most of the soil site PGA data are larger than thevalues predicted by the three attenuation models.
Figure 9 plots the residual of the logarithm of the ratio ofobserved PGA to the predicted PGA versus the fault distance.A positive residual implies that the recorded value is largerthan that predicted by the model given in equation (2) andTable 2. Conversely, a negative residual indicates that therecorded value is smaller than that predicted by the model.It is clear from Figure 9 that the observed PGAs at rock sites
51LXS
51XJL
51XJD
51WCW
51QLY
51LXM
51LXT
51HSD
51SPA
51SPT
51SPC
51MXD51HSL
51MXT
51MXN51MZQ
51PJD
51CDZ
51PXZ
51DXY
51PJW
51SFB
51JYC
51JYH51JYT
51AXT
51DYB
Chengdu
104ºE 105ºE103ºE
-100
0
100
51MZQ Station
EW
-100
0
100
Vel
oci
ty (
cm/s
)
NS
FD=3.2 km
-100
0
100
-100
0
100
-100
0
100
Vel
oci
ty (
cm/s
)
-100
0
100
-100
0
100
-100
0
100
Vel
oci
ty (
cm/s
)
-100
0
100
-100
0
100
-100
0
100
Vel
oci
ty (
cm/s
)
-100
0
100UD
51JYH Station
EW
NS
FD=13.6 km
UD
51WCW Station
EWFD=23.2 km
NS
UD
51SFB Station
EW
NS
FD=10.4 km
UD
Time (s)0 50 100 150
Time (s)0 50 100 150
Time (s)0 50 100 150
Time (s)0 50 100 150
0 50 100 150
0 50 100 150
0 50 100 150
0 50 100 1500 50 100 150
0 50 100 150
0 50 100 150
0 50 100 150
Figure 6. Three components of velocity at the 51WCW (Wolong), 51SFB (Bajiao), 51MZQ (Qingping) and 51JYH (Jiangyou) stationsduring the Wenchuan earthquake
2430 Z. Wen, J. Xie, M. Gao, Y. Hu, and K. T. Chau
are consistently smaller than the prediction by the attenuationmodel, regardless of the fault distance. On the contrary, thesoil site PGAs have larger scattering with no clear trend ofresidual value as a function of fault distance.
Spectral Acceleration at Periods of0.2, 1.0, and 3.0 s
In order to examine the frequency content of the strongground motions observed during the Wenchuan earthquake,Figure 10a–c plots the spectral acceleration against the faultdistance at periods of 0.2, 1.0, and 3.0 s respectively, for allthree soil classification types. The attenuation models by
51LXS
51XJL
51XJD
51WCW
51QLY
51LXM
51LXT
51HSD
51SPA
51SPT
51SPC
51MXD51HSL
51MXT
51MXN51MZQ
51PJD
51CDZ
51PXZ
51DXY
51PJW
51SFB
51JYC
51JYH51JYT
51AXT
51DYB
Chengdu
104ºE 105ºE103ºE
31ºN
32ºN
33ºN0
1
2
351JYH Station
EWFD=10.4km
0
1
2
3
Sp
ectr
al A
ccel
erat
ion
(g
)
NS
0
1
2
3
Period (s)
UD
0 0.5 1 1.5 2 2.5 3
0 0.5 1 1.5 2 2.5 3
0 0.5 1 1.5 2 2.5 3
0
1
2
351MZQ Station
EWFD=3.2 km
0
1
2
3
Sp
ectr
al A
ccel
erat
ion
(g
)
NS
0
1
2
3
Period(s)
0 0.5 1 1.5 2 2.5 3
0 0.5 1 1.5 2 2.5 3
0 0.5 1 1.5 2 2.5 3
Period(s)
0 0.5 1 1.5 2 2.5 3
0 0.5 1 1.5 2 2.5 3
0 0.5 1 1.5 2 2.5 3
0 0.5 1 1.5 2 2.5 3
0 0.5 1 1.5 2 2.5 3
0 0.5 1 1.5 2 2.5 3
Period(s)
UD
0
1
2
351WCW Station
EWFD=23.2km
0
1
2
3
Sp
ectr
al A
ccel
erat
ion
(g
)
NS
0
1
2
3EW
0
1
2
351SFB Station
EWFD=10.4km
0
1
2
3
Sp
ectr
al A
ccel
erat
ion
(g
)
NS
0
1
2
3UD
Figure 7. The response spectra for three components of the recordings at 51WCW (Wolong), 51SFB (Bajiao), 51MZQ (Qingping), and51JYH (Jiangyou) stations during the Wenchuan earthquake
Table 2Regression Formula and the Corresponding
Coefficients for PGA*
log PGA�cm=s2� � C1 � C2 log�R� C3� � σ
Direction C1 C2 C3 σ
Up–Down (UD) 4.340 �1:212 13.35 0.2078East–West (EW) 4.157 �1:001 14.99 0.2142North–South (NS) 4.087 �0:9688 16.75 0.2117Horizontal 4.118 �0:9832 15.74 0.2107
*Based on 64 strong-motion records within 200 km of therupture fault.
1 10 100 2001
10
100
1000
Closest Distance to Fault (km)
PG
A (
cm/s
/s)
Horizontal component
Rock sitesHard soil sites(Vs>250m/s)Soft soil sites(Vs<250m/s)Loh, 1998Chiou & Youngs, 2008Abrahamson & Silva, 2008This paper, Wenchuan event
Figure 8. The horizontal (both EWand NS components) PGA atfree-field rock sites (solid circles), hard soil sites (open circles), andsoft soil sites (triangles) for various distances from the fault.Comparison of the Wenchuan-specific attenuation model with thoseby Loh et al. (1998), Chiou and Youngs (2008), and Abrahamsonand Silva (2008).
Near-Source Strong Ground Motion Characteristics of the 2008 Wenchuan Earthquake 2431

Sadigh et al. (1997) and Chiou and Youngs (2008) are alsoshown for comparison. Similar to the observation made forFigure 8, the spectral acceleration scattering increases withthe fault distance at period of 0.2 s. Again, the rock site spec-tral acceleration values are consistently smaller than thevalues given by the models of Sadigh et al. (1997) and Chiouand Youngs (2008) (with only one exception). Within thefault distance of 40–60 km, the observed spectral accelera-tions on soft sites were consistently larger than those on hardsoil sites. Figure 10b,c shows that the observed spectralaccelerations at periods 1.0 s and 3.0 s are significantly andconsistently smaller than those values estimated from theattenuation models of Sadigh et al. (1997) and Chiou andYoungs (2008) over the range of fault distance to about110 km. It again confirms the conclusion from Figure 7 thatthe spectral acceleration value for low-frequency or long-period contents is small. Therefore, the main period contentis of 1 s or smaller. These spectral values at long-period rangeare smaller than those observed during the Northridge earth-quake (Chang et al., 1996) and the Chi-Chi earthquake(Chang and Yu, 2002).
Figure 11 plots the peak horizontal velocity versus thefault distance for various site conditions, together with theattenuation models by Chiou and Youngs (2008) and Abra-hamson and Silva (2008).A regression analysis of thevelocityattenuation of the form similar to equation (2) is conductedand the result is given in Table 3; this attenuation model isalso plotted in Figure 11. The comparison shows that theobserved peak ground velocities during the Wenchuan earth-quake are consistently and significantly smaller than thevalues estimated from the attenuation models by Chiou andYoungs (2008) and Abrahamson and Silva (2008).
As shown in Figure 4, the DS of the Wenchuan earth-quake is unusually long. These duration data are replottedagainst the fault distance in Figure 12 for various site condi-tions (rock, hard soil, and soft soil sites), together with the
predictions by themodels of Bommer et al. (2009) andKemp-ton and Stewart (2006) for soil site with VS � 250 m=s.Figure 12 also shows the median curve and the median curveswith plus one and minus one standard deviation. The durationdata do not show any special trend for either the rock sites or
0 50 100 150 200-0.6
-0.4
-0.2
0
0.2
0.4
0.6
Closest Distance to Fault(km)
Res
idu
al [
Lo
g(P
GA
ob
s/P
GA
pre
d)]
Rock sitesHard soil sites(Vs>250m/s)Soft soil sites(Vs<250m/s)
Figure 9. Site effects on PGA residual from theWenchuan earth-quake. Residuals plotted as functions of distance for rock sites (solidcircles), hard soil sites (open circles), and soft soil sites (triangles).
1 10 1000.01
0.1
1
10
Closest Distance to Fault (km)
Sp
ectr
al A
ccel
erat
ion
(g
), 5%
dam
pin
g
T=0.2s
Rock sitesHard soil sites(Vs>250m/s)Soft soil sites(Vs<250m/s)Sadigh, 1997(soil sites)Chiou & Youngs, 2008(Vs=250m/s)
1 10 1000.001
0.01
0.1
1
2
Closest Distance to Fault (km)
Sp
ectr
al A
ccel
erat
ion
(g),
5% d
amp
ing
T=1.0s
Rock sitesHard soil sites(Vs>250m/s)Soft soil sites(Vs<250m/s)Sadigh, 1997(soil sites)Chiou & Youngs, 2008(Vs=250m/s)
1 10 1000.001
0.01
0.1
1
Closest Distance to Fault (km)
Sp
ectr
al A
ccel
erat
ion
(g
), 5%
dam
pin
g
T=3.0s
Rock sitesHard soil sites(Vs>250m/s)Soft soil sites(Vs<250m/s)Sadigh, 1997(Soil sites)Chiou & Youngs, 2008(Vs=250m/s)
(a)
(b)
(c)
Figure 10. The spectral acceleration over various faultdistances, together with the attenuation models by Sadigh et al.(1997) and Chiou and Youngs (2008) for periods of (a) 0.2 s,(b) 1.0 s, and (c) 3.0 s.
2432 Z. Wen, J. Xie, M. Gao, Y. Hu, and K. T. Chau

the soil sites. Figure 12 shows that most of the DS data fallbetween 60 and 120 s, which is much longer than the predic-tions by Bommer et al. (2009) and Kempton and Stewart(2006). The energy generated by dislocation of the faultwould attenuate quickly at larger distances from the sourcepoint and thus would not contribute to the duration at the ob-servation station. Based on this fact, Bolt (1973) suggestedthat the DS could not increase indefinitely with magnitudeand that it should level off at about 35–40 s. Clearly, this argu-ment could not be applied to understand the unusual longground shaking observed during the Wenchuan earthquake.
Hanging-Wall and Footwall Effects
For earthquakes induced by thrust faulting, it is wellknown that the shaking on the hangingwall is generally stron-ger than that on the footwall (e.g., Abrahamson and Somer-ville, 1996; Shabestari and Yamazaki, 2003). To investigatethe hanging-wall effect, Figure 13 plots the residual of thelogarithm of the ratio of the observed PGA to the predictedPGA against the fault distance. The negative values are forsites on the footwall (on the southeast side of the surface rup-ture shown in Fig. 1) and positive values are for sites on thehanging wall (on the northwest side of the surface rupture
shown in Figure 1). There are 17 stations or 34 data on thehanging wall (1 EWand 1 NS datum for each station), whereasthere are 13 stations or 26 data on the footwall (1 EWand 1 NSdatum for each station), as shown in Figure 1. The PGA resi-duals for observations on the hanging wall show a positivebias trend for the rupture distance range within 60 km, withthemean bias of 0:17� 0:02. In contrast, on the footwall sitesthere is no significant bias over the same distance range, withthe mean residual of�0:10� 0:03. The maximum differencein the residual on the hanging wall and footwall over this dis-tance range is observed at about 3 ∼ 40 km, which means theexpected PGAvalues on the hanging wall are 30 ∼ 40% largerthan those values on the footwall side for the same distance.There is, however, no hanging-wall effect when the faultdistance exceeds 60 km (see Fig. 13).
1 10 100 2001
10
100
500
Closest Distance to Fault (km)
PG
V (
cm/s
)
Rock sitesHard soil sites(Vs>250m/s)Soft soil sites(Vs<250m/s)Chiou & Youngs, 2008Abrahamson & Silva, 2008This event
Figure 11. The horizontal PGVover various distances for rocksites, hard soil sites, and soft soil sites, together with the attenuationmodel by Abrahamson and Silva (2008) and Chiou and Youngs(2008).
Table 3Regression Formula and the CorrespondingCoefficients for Horizontal Component
of the PGV*
log PGA�cm=s� � C1 � C2 log�R� C3� � σ
C1 C2 C3 σ
Horizontal 3.216 �1:098 12.58 0.1986
*Based on 64 strong-motion records within 200 km of therupture fault.
1 10 100 2000
20
40
60
80
100
120
140
160
Closest Distance to Fault (km)
Sig
nif
ican
t D
ura
tio
n, 5
–95%
Ds
(s)
Rock sitesHard soil sites(Vs>250m/s)Soft soil sites(Vs<250m/s)Median curveMedian+σ curveMedian-σ curveBommer et al., 2009Kempton & Stewart, 2006
Figure 12. Comparison of significant duration of accelerationtime history with the relationships proposed by Bommer et al.(2009) and Kempton and Stewart (2006). Solid circles, recordedvalues on rock sites; open circles, recorded values on hard soil sites;triangles, recorded values on soft soil sites.
-160 -120 -60 0 60 120 160-0.6
-0.4
-0.2
0
0.2
0.4
0.6
Closest Distance to Fault (km)
Res
idu
al [
Lo
g(P
GA
ob
s/P
GA
pre
d)]
hanging wall footwall
Rock sitesHard soil sitesSoft soil sites
Figure 13. Residual of PGA on hanging-wall sites (positiveside) and footwall sites (negative side).
Near-Source Strong Ground Motion Characteristics of the 2008 Wenchuan Earthquake 2433

Rupture Directivity
It is obvious from the previous discussions that thestrong ground motions in the Longmen Shan area show highvariability in intensity, spectral shape, and duration of groundshaking, depending on the distance of the observation stationfrom the fault plane, as well as its orientation from therupture faults. In this section, directivity effects on groundshaking are examined in more detail. In particular, shakingcharacteristics at stations in the northeast (forward) directionis compared to those in the southwest (backward) direction.Figure 14 shows the horizontal component of PGA and PGVfor various fault distances compared with the NGAmodels byChiou and Youngs (2008) and Abrahamson and Silva (2008).In general, the PGA values in the forward direction are largerthan those of the NGA models, whereas those in the back-ward direction can be larger or smaller than those of the NGAmodels, depending on the values of fault distance. For thePGV plot, most of the values are smaller than those of theNGA models. Both the PGA and PGV values appear to havea lower attenuation rate in the forward stations than those inthe backward stations, thus suggesting rupture propagationdirectivity along the fault. To further examine the fault direc-tivity effect, Figure 15 plots the acceleration response spectraat 5% damping ratio at four pairs (or eight) strong-motionstations (exact locations of these stations are shown in Fig. 1),with each pair of stations having roughly the same distancefrom the rupture fault. The four distances from the rupturefault are about 30 km, 50 km, 70 km, and 90 km. To elim-inate potential bias due to site effects, each pair of strongstations are selected such that they are of the same sitecategory. The class II site condition given in Figure 15 is
defined in Table 1. Those response spectra in the forwarddirection are plotted as thick lines, whereas those in the back-ward direction are shown as thin lines; EW components areplotted as solid line, whereas the NS components are plottedas dashed lines. At short distances of 50 km or less from therupture fault, the peak values of response spectra at stationsin the forward direction (such as 51MXT and 51PWM) aremuch larger than those in the backward direction (such as51PXZ and 51DXY), showing a strong rupture directivityeffect. However, for distance farther than 70 km, the peakvalues of response spectra are about the same for stationsin both forward and backward directions.
In Figure 16, we compare the DS of acceleration timehistories that are recorded at stations located both in theforward directivity area and backward directivity area.Longer durations were recorded at stations in the backwarddirectivity direction (open triangles), and they are larger thanthe median values; in contrast, shorter durations were re-corded at stations in the forward directivity (solid triangles),and they are smaller than the median values. This directivityeffect is expected because the duration of the time history isshort when a rupture propagates toward an observation site,whereas duration of the time history is long when the rupturepropagates away from an observation site. Thus, a clear rup-ture directivity effect is observed.
Spatial Variation of Strong-Motion Waveforms
The typical EW components of the acceleration time his-tories and velocity time histories of 10 stations (51BXZ,51BXD, 51LSJ, 51YAM, 51HYK, 51YAS, 51TQL, 51LDS,51HYQ, 51LDD) on the southwest side and 10 stations
0 40 80 120 160 20010
100
1000
Closest Distance to Fault (km)
PG
A (
cm/s
/s)
0 40 80 120 160 2001
10
100
Closest Distance to Fault (km)
PG
V (
cm/s
)
Forward (Rock sites)
Forward (Hard soil sites)
Forward (Soft soil sites)
Backward (Hard soil sites)
Backward (Soft soil sites)
Chiou & Youngs, 2008
Abrahamson & Silva, 2008
Forward (Rock sites)
Forward (Hard soil sites)
Forward (Soft soil sites)
Backward (Hard soil sites)
Backward (Soft soil sites)
Chiou & Youngs, 2008
Abrahamson & Silva, 2008
Figure 14. PGA and PGV for various fault distances, together with the NGA attenuation models of Chiou and Youngs (2008) and Abra-hamson and Silva (2008). The PGA and PGV at stations located in the forward direction are shown by thick lines, while those in backwarddirection are shown by thin lines.
2434 Z. Wen, J. Xie, M. Gao, Y. Hu, and K. T. Chau

(51PWM, 51GYS, 51GYZ, 62WIX, 62WUD, 51JZW,51JZG, 51CXQ, 62SHW, 62TCH) on the northeast side ofthe Beichuan–Yingxiu fault are shown in Figure 17 andFigure 18 respectively. Differences are observed in the overallacceleration and velocity trace pattern between the southwestside of the fault and the northeast side of the fault. Figure 17shows that, on the southwest side of fault, the accelerationincreases very rapidly, rising to a high level within a very shortperiod of time. The energy carried by wave trains in theforward directivity region appears comparatively concen-trated, while the energy from wave trains in the backwarddirectivity region appears intermittently, at times strong andat other times weak. Figure 18 shows that the velocity tracepattern on the southwest side of the fault appears disorderlyand irregularly, whereas on the northeast region there is a clearvelocity pulse in the velocity time history. This again suggestsa strong directivity effect on the appearance of velocity pulse.
To examine variation of waveform patterns with the dis-tance from the hypocenter, Figures 19 and 20 compare theacceleration and velocity time histories to the hypocentraldistance. Both the variations of waveform along the forwarddirection and backward direction are plotted. All time his-tories have been shifted depending on the hypocentral dis-tance such that all time axes are referred to as having afixed time frame. Note that the scale bar in Figure 19 in theforward direction plots is 1g whereas that in the backward
direction plots is only 0:2g. It is clear that the PGAs alongthe forward directivity region are much larger than those inbackward directivity region. In Figure 20, the scale bar for
0 1 2 30
0.5
1
1.5
Sp
ectr
al A
ccel
erat
ion
(g
)
51PWM, Rrup = 51.6 km
Site:class II (Vs = 392m/s)
51DXY, Rrup = 54.6km
Site:class II (Vs=310m/s)
0 1 2 30
0.1
0.2
0.3
0.462WIX, Rrup=76.8kmSite: Bedrock
51CDZ, Rrup=73.5km
Site: Bedrock
0 1 2 30
0.5
1
1.5
Period (s)
51MXT, Rrup=30.2 kmSite: Bedrock51PXZ, Rrup=25.7kmSite: Bedrock
0 1 2 30
0.5
1
1.5
Period (s)
51JZG, Rrup = 99.7km
Site:class II (Vs = 271m/s)
51PJD, Rrup = 92.2km
Site:class II (Vs=318m/s)
Figure 15. Comparison of the acceleration spectra at 5% damping ratio for two horizontal components (solid line, EW; dashed line, NS)registered at the stations located in the forward and backward directivity region. Spectral accelerations in the forward direction are shown asthick lines, and those in the backward direction are shown as thin lines.
1 10 100 2000
20
40
60
80
100
120
140
160
Closest Distance to Fault(km)
Sig
nif
ica
nt
Du
rati
on
,Ds(
s)
Records on hanging wallRecords on footwallRecords in forward regionRecords in backward regionMedian curveMedian+σ curveMedian-σ curve
Figure 16. Duration of horizontal ground motion recorded atdifferent locations along the causative fault with respect to faultdistance. Solid circles, recorded values on the hanging wall; opencircles, recorded values on footwall; solid triangles, recorded valuesin the forward directivity region; open triangles, recorded values inbackward directivity region.
Near-Source Strong Ground Motion Characteristics of the 2008 Wenchuan Earthquake 2435

the forward plots is 100 cm=s whereas that for the backwardplots is 20 cm=s. Again, it is clear that the PGV along theforward directivity region is also much larger than thosein the backward directivity region. In general, velocity pulseis clearer along the forward direction. Therefore, a strongrupture directivity effect is observed in the waveform of bothacceleration and velocity time histories with respect to thehypocentral distance.
Discussion and Conclusions
A total of 64 strong ground motion records were used toanalyze the near-field shaking characteristics during the 2008Wenchuan earthquake. These stations were further subdi-vided into four groups: (1) hanging wall, (2) footwall, (3) for-ward rupture direction, and (4) backward rupture direction.The site conditions of these stations are also classified intothree categories: (1) rock site; (2) hard soil site (average wavespeed larger than 250 m=s in the top 30 m); and (3) soft soilsite (average wave speed less than 250 m=s in the top 30 m).Various plots were used to analyze the spatial variations ofshaking characteristics, including spatial distribution plots ofthe horizontal PGA, horizontal PGV, andDS. The accelerationand velocity time histories and response spectra at the fourstations with the strongest shaking (Wolong, Qingping,Bajiao, and Jiangyou) were examined. The EW, NS, and UD
components of PGA at Wolong are 0:98g, 0:66g, and 0:97g,respectively. The EW, NS, and UD components of PGA atQingping are 0:84g, 0:82g, and 0:64g, respectively. AtBajiao, the EW, NS, and UD components are 0:57g, 0:59g,and 0:65g, respectively. The largest component at Bajiao isthe vertical (UD) component. In seismic design of structures,the vertical component of PGA is either not considered or isassumed as 2=3 of the horizontal PGA. This normal practiceappears to be nonconservative in the near-fault areas andprobably needs to be reconsidered. The peculiar phenomenonof two wave trains at Wolong and other stations is discussed.The possibility of two subevents during the Wenchuan earth-quake is discussed in view of the two surface ruptures alongthe Beichuan–Yingxiu fault and the Guanxian–Jiangyoufault, and the length of these surface ruptures are 240 kmand 72 km, respectively.
Attenuation models of PGA and PGV were developedfrom the strong ground motion of the Wenchuan earthquakesand were compared with the NGA models of Chiou andYoungs (2008) and Abrahamson and Silva (2008) and withthe model of Loh et al. (1998). In general, the NGA modelsgive larger PGA values than the present model at fault dis-tance less than 60 km but give smaller PGAs at fault distanceof larger than 60 km. Spectral accelerations with distancewere plotted at periods of 0.2 s, 1.0 s, and 3.0 s. The spectralaccelerations at a long-period ranges of 1 s or longer are
-2000
200 51YASFD=142.7km
-2000
200
Acc
eler
atio
n (
cm/s
/s)
51TQLFD=162.3km
-2000
200
Time(s)
51LDSFD=174.5km
-2000
200 51HYQFD=182.4km
-2000
200 51LDDFD=199.8km
51JZWFD=99.7km
51JZGFD=112.6km
51CXQFD=113.7km
62SHWFD=139.9km
62TCHFD=184.8km
0 50 100 150-200
0200 51BXZFD=79.5km
0 50 100 150
0 50 100 150
0 50 100 150
0 50 100 150
0 50 100 150
0 50 100 150
0 50 100 150
0 50 100 150
-2000
200 51BXDFD=98.2km
-2000
200 51LSJFD=111.7km
-2000
200 51YAMFD=113.5km
-2000
200
Acc
eler
atio
n (
cm/s
/s)
-2000
200
-2000
200
-2000
200
-2000
200
-2000
200
Acc
eler
atio
n (
cm/s
/s)
-2000
200
-2000
200
-2000
200
-2000
200
-2000
200
Acc
eler
atio
n (
cm/s
/s)
51HYK
Time(s)0 50 100 150
0 50 100 150
0 50 100 150
0 50 100 150
0 50 100 150
Time(s)
0 50 100 150
0 50 100 150
0 50 100 150
0 50 100 150
0 50 100 150
Time(s)0 50 100 150Time(s)
FD=128.2km
51LDS
51LDD
51BXD
51BXZ
51TQL51HYK
51LSJ51YAM
51HYQ
51YAS
51JZW51JZG
62WIX
62TCH
62WUD
62SHW
51GYZ51PWM
51CXQ
51GYS
Chengdu
31ºN
30ºN
29ºN
32ºN
33ºN
34ºN
106ºE105ºE104ºE103ºE102ºE
51PWMFD=51.6km
51GYSFD=70.6km
51GYZFD=77.6km
62WIXFD=81.8km
62WUDFD=93.8km
Figure 17. Typical acceleration time histories of strong ground motion in the forward directivity region and backward forward directivityregion.
2436 Z. Wen, J. Xie, M. Gao, Y. Hu, and K. T. Chau

found to be much smaller than those of the NGA models. ThePGV values were found to be smaller than predicted by theNGA models, while the durations of time histories (about60–120 s) are substantially larger than those predicted bythe models of Bommer et al. (2009) and Kempton and Stew-art (2006). The ground-shaking duration in the forwarddirection is much shorter than those in the backward direc-tion, showing a strong rupture directivity effect. For fault dis-tances within 60 km, a strong hanging-wall effect of strongground shaking is observed, but such an effect is not clear fordistances farther than 60 km. The response spectra of fourpairs of seismic stations of comparable fault distance (about30 km, 50 km, 70 km, and 90 km) are compared. A strongdirectivity effect on the response spectra was observed forrupture distances less than or equal to 50 km, whereas therewas no directivity effect for rupture distances of 70 km orlarger. In Figures 17 and 18, both acceleration and velocitytime histories are plotted in the forward (northeast) and back-ward (southwest) regions. The energy carried by wave trainsin the forward directivity region appears comparatively con-centrated, while the energy from wave trains in the backwarddirectivity region appears intermittent, at times strong and atother times weak. In Figures 19 and 20, acceleration andvelocity time histories are plotted against hypocentral dis-tance, both along the forward (northeast) and backward
(southwest) directions. Stations along the forward directionshow much clearer velocity pulses than are shown by stationsalong the backward direction. For example, a velocity pulsewith an 8-s period is observed at both the Qingping (51MZQ)and Jiangyou (51JYH) stations in the forward direction,while no obvious pulse can be seen in the velocity traceof backward stations such as 51BXZ and 51LSJ.
In summary, the Wenchuan earthquake shows a complexspatiotemporal source rupture process, with a chain of ruptureevents releasing energy by stages at different locations. Themain rupture starts in the south near the town of Yingxiu andextends northeast towards Qingchuan. The ruptures at differ-ent segments show different characters. In the south (nearYingxiu), rupture is characterized by dominant reverse fault-ing; in the north (near Beichuan County), rupture is charac-terized by both reverse and strike-slip mechanisms (Zhanget al., 2009. The near-source strong motion records exhibitcomplexity and directivity of the rupture process of theWenchuan earthquake. The acceleration time history of51WCW presents two obviously separate short-durationwave groups, while the acceleration time histories from sta-tion 51MZQ, 51SFB, and 51JYH each contain two overlap-ping long-duration wave groups. This suggests two majorevents in the source rupture process. One possible explanationcan be described by one rupture sequence near the town of
62SHW
FD=139.9kmFD=139.9km
62TCH
51JZW
51JZG
51CXQ
FD=99.7km
FD=112.6km
FD=113.7km
FD=139.9km
FD=184.8km
-10
0
10
-10
0
10
-10
0
10
-10
0
10
FD=79.5km 51BXZ
51BXDFD=98.2km
51LSJFD=111.7km
51YAMFD=113.5km
0 50 100 150
0 50 100 150
0 50 100 150
0 50 100 150
0 50 100 150
-10
0
10
Vel
oci
ty (
cm/s
)
-10
0
10
-10
0
10
-10
0
10
-10
0
10
-10
0
10
Vel
oci
ty (
cm/s
)
Time(s)0 50 100 150
0 50 100 150
0 50 100 150
0 50 100 150
0 50 100 150
0 50 100 150
0 50 100 150
0 50 100 150
0 50 100 150
0 50 100 150
Time(s)
Time(s)0 50 100 150
0 50 100 150
0 50 100 150
0 50 100 150
0 50 100 150
Time(s)
51HYKFD=128.2km
51YASFD=142.7km
51HYQFD=182.4km
51LDSFD=174.5km
51LDDFD=199.8km
51TQLFD=162.3km
-200
2051GYSFD=70.6km
-200
20
Vel
oci
ty (
cm/s
)
51GYZFD=77.6km
-20
0
2051PWMFD=51.6km
-20
0
2062WIXFD=81.8km
-20
0
20
-20
0
20
-20
0
20
Vel
oci
ty (
cm/s
)
-20
0
20
-20
0
20
-20
0
20
62WUDFD=93.8km
51LDS
51LDD
51BXD
51BXZ
51TQL51HYK
51LSJ51YAM
51HYQ
51YAS
51JZW51JZG
62WIX
62TCH
62WUD
62SHW
51GYZ51PWM
51CXQ
51GYS
Chengdu
31ºN
30ºN
29ºN
32ºN
33ºN
34ºN
106ºE105ºE104ºE103ºE102ºE
Figure 18. Typical velocity time histories of strong ground motion in the forward directivity region and backward forward directivityregion.
Near-Source Strong Ground Motion Characteristics of the 2008 Wenchuan Earthquake 2437

Yingxiu in Wenchuan that was subsequently followed byanother rupture sequence near Beichuan; another possibleexplanation is due to the sequential process of rupture alongthe Beichuan–Yingxiu fault and then the Guanxian–Jiangyoufault, leading to two distinct surface ruptures. Azimuthalvariation of strong motion shows consistently significant dif-ferences in the overall acceleration and velocity trace patternbetween the forward directivity region and backward directiv-ity region. These significant differences may be closely re-lated with the spatiotemporal rupture process at the fault zone.
Further study is still needed to determine what ruptureprocess or sequence in the source zone would have led to thecomplex strong ground motions observed during the Wench-uan earthquake. Nevertheless, the present paper shouldprovide an important step toward such analysis.
Data and Resources
The actual data of the acceleration time histories of thesestations can be obtained from the China Strong MotionNetworks Center by applying through their web site,http://www.csmnc.net (last accessed August 2010).
Acknowledgments
Helpful comments from anonymous reviewers greatly improved themanuscript. The authors wish to express their appreciation for their com-ments. Financial support of this study was fully provided by the NationalBasic Research Program 973 (2007CB714201) of China, Natural ScienceFoundation of Beijing (8062026), the Specific Fund of Seismological Indus-try (200808009), the Special Fund of the Institute of Geophysics, ChinaEarthquake Administration (DQJB0825), and Project No. 1-BBZF of theHong Kong Polytechnic University. The strong ground motion data of theWenchuan earthquake are provided by the Strong Ground Motion Observa-tion Network of China. The authors wish to express thanks for their support.
0 20 40 60 80 100 120 140 160 180 2000
40
80
120
160
200
240
280
Time (s)
Hyp
oce
ntr
al
dis
tan
ce (
km)
EW Component
51GYS 51CXQ
51PWM
51JYC
51JYT51JYH
51DYB
51MZQ
51SFB
51WCW
Fo
rwar
d
1.0g
0 20 40 60 80 100 120 140 160 180 200
0
20
40
60
80
100
120
140
160
180
200
220
Time (s)
Hyp
oce
ntr
al d
ista
nce
(km
)
EW Component
51LDD
51LDS
51TQL
51YAL
51LSF
51BXD
51BXZ
51DXY
51PXZ
51LSJ
Bac
kwar
d
0.2g
Figure 19. Comparison of the full acceleration waveforms atstations in the forward directivity (northeast) and the backward di-rectivity (southwest) regions (see Fig. 1 on their exact locations).Acceleration time histories are plotted versus the station’s distanceform the hypocenter and all time axes are plotted with respect to afixed time frame.
0 20 40 60 80 100 120 140 160 180 2000
40
80
120
160
200
240
280
Time (s)
Hyp
oce
ntr
al
dis
tan
ce (
km)
EW Component
51GYS 51CXQ
51PWM
51JYC
51JYT51JYH
51DYB
51MZQ
51SFB
51WCW
Fo
rwar
d
100cm/s
0 20 40 60 80 100 120 140 160 180 200
0
20
40
60
80
100
120
140
160
180
200
220
Time (s)
Hyp
oce
ntr
al d
ista
nce
(km
)
EW Component
51PXZ
51DXY
51BXZ
51BXD
51LSJ
51LSF
51YAL
51TQL
51LDS
51LDD
Bac
kwar
d
20cm/s
Figure 20. Comparison of the full velocity waveforms at sta-tions in the forward directivity (northeast) and the backward direc-tivity (southwest) region (see Fig. 1 on their exact locations).Velocitytime histories are plotted versus the station’s distance from the hy-pocenter and time axes are plotted with respect to a fixed time frame.
2438 Z. Wen, J. Xie, M. Gao, Y. Hu, and K. T. Chau

References
Abrahamson, N. A., and W. J. Silva (2008). Summary of the Abrahamsonand Silva NGA ground-motion relations, Earthq. Spectra 24, no. S1,67–97.
Abrahamson, N. A., and P. G. Somerville (1996). Effects of the hanging walland footwall on ground motions recorded during the Northridgeearthquake, Bull. Seismol. Soc. Am. 86, no. 1, 93–99.
Arias, A. (1970). A measure of earthquake intensity, in Seismic Design forNuclear Power Plants, R. J. Hansen (Editor), Massachusetts Instituteof Technology Press, Cambridge, MA, 438–483.
Bolt, B. A. (1973). Duration of strong ground motion, Proc. 5th WorldConf. on Earthquake Engineering, Rome, Italy, 25–29 June 1973.
Bommer, J. J., P. J. Stafford, and J. E. Alarcón (2009). Empirical equationsfor the prediction of the significant, bracketed and uniform durationof earthquake ground motion, Bull. Seismol. Soc. Am. 90, no. 6,3217–3233.
Campbell, K. W. (1991). An empirical analysis of peak horizontal accelera-tion for the Loma Prieta, California, earthquake of 18 October 1989,Bull. Seismol. Soc. Am. 81, no. 5, 1838–1858.
Campbell, K. W., and Y. Bozorgnia (1994). Empirical analysis of strongground motion from the 1992 Landers, California, earthquake, Bull.Seismol. Soc. Am. 84, no. 3, 573–588.
Chang, T. P., and G. K. Yu (2002). A study of strong motion responsespectrum in west-central Taiwan, Terr. Atmos. Ocean. Sci. 13,no. 2, 135–152.
Chang, S. W., J. D. Bray, and R. B. Seed (1996). Engineering implication ofground motions from the Northridge earthquake, Bull. Seismol. Soc.Am. 86, no. 1B, S270–288.
Chiou, B. S.-J., and R. R. Youngs (2008). An NGA model for the averagehorizontal component of peak ground motion and response spectra,Earthq. Spectra 24, no. S1, 173–215.
Dobry, R., I. M. Idriss, and E. Ng (1978). Duration characteristics ofhorizontal components of strong-motion earthquake records, Bull.Seismol. Soc. Am. 68, no. 5, 1487–1520.
Du, H. L., L. S. Xu, and Y. T. Chen (2009). Rupture process of the 2008great Wenchuan earthquake from the analysis of the Alaska-array data,Chin. J. Geophys. 52, no. 2, 372–378.
Kempton, J. J., and J. P. Stewart (2006). Prediction equations for significantduration of earthquake ground motions considering site and near-source effects, Earthq. Spectra 22, no. 4, 985–1013.
Koketsu, K., Y. Yokota, H. Ghasemi, K. Hikima, H. Miyake, and Z. Wang(2009). Source process and ground motions of the 2008 Wenchuanearthquake, paper no. 804, Proc of the International Conf. on Earth-quake Engineering for the 1st Anniversary of Wenchuan Earthquake,Chengdu, China, 10–12 May 2009.
Li, X. J., Z. H. Zhou, M. Huang, R. Z. Wen, H. Y. Yu, D. W. Lu, Y. N. Zhou,and J. W. Cui (2008). Preliminary analysis of strong-motion recordingsfrom the magnitude 8.0 Wenchuan, China, earthquake of May 12,2008, Seismol. Res. Lett. 79, no. 6, 844–854.
Loh, C. H., C. S. Hwang, and Y. W. Jean (1998). Seismic demand based ondamage control model-considering basin effect and source effect, SoilDynam. Earthq Eng. 17, 335–345.
Lu, S. D., and X. J. Li (2008). Wenchuan Ms 8 Earthquake AccelerationRecordings, Report on Strong Earthquake Motion Records in China,
12, no. 1, China Seismological Press, Beijing, People’s Republic ofChina (in Chiinese).
Parsons, T., J. Chen, and E. Kirby (2008). Stress changes from the 2008Wenchuan earthquake and increased hazard in the Sichuan basin,Nature 454, 509–510.
Sadigh, K., C. Y. Chang, J. A. Egan, F. Makdis, and R. R. Youngs (1997).Attenuation relationship for shallow crustal earthquakes based onCalifornia strong motion data, Seismol. Res. Lett. 68, no. 1, 180–189.
Shabestari, K. T., and F. Yamazaki (2003). Near-fault spatial variation instrong ground motion due to rupture directivity and hanging walleffects from the Chi-Chi, Taiwan earthquake, Earthq. Eng. Struct.Dynam. 32, no. 14, 2197–2219.
Somerville, P. G. (2003). Magnitude scaling of the near fault directivitypulse, Phys. Earth Planet. In. 137, 201–212.
Travasarou, T., J. D. Bray, and N. A. Abrahamson (2003). Empirical attenua-tion relationship for Arias intensity, Earthq. Eng. Struct. Dynam. 32,no. 7, 1133–1155.
Trifunac, M. D., and A. G. Brady (1975). A study on duration of strongearthquake ground motion, Bull. Seismol. Soc. Am. 65, no. 3, 581–626.
Wang, W. M., L. F. Zhao, J. Li, and Z. X. Yao (2008). Rupture process of theMs 8.0 Wenchuan earthquake of Sichuan, China,Chin. J. Geophys. 51,no. 5, 1403–1010.
Xu, X. W., X. Z. Wen, J. Q. Ye, B. Q. Ma, J. Chen, R. J. Zhou, H. L. He,Q. J. Tian, Y. L. He, Z. C. Wang, Z. M. Sun, X. J. Feng, G. H. Yu,L. C. Chen, G. H. Chen, S. E. Yu, K. Y. Ran, X. G. Li, C. X. Li, andY. F. An (2008). The Ms 8.0 Wenchuan earthquake surface rupturesand its seismogenic structure, Seismol. Geol. 30, no. 3, 597–629(in Chinese with English abstract).
Youd, T. L., J. P. Bardet, and J. D. Dray (2000). Kocaeli, Turkey, earthquakeof August 17, 1999 Reconnaissance Report, Earthq. Spectra 16(suppl. A), 65–96.
Yu, H. Y., D. Wang, Y. Q. Yang, Q. C. Jian, W. X. Jiang, and B. F. Zhou(2009). The preliminary analysis of strong ground motion records fromthe Ms 8.0 Wenchuan earthquake, Earthq. Eng. Eng. Vib. 29, no. 1,1–13 (in Chinese).
Zhang, Y., W. P. Feng, L. S. Xu, and Y. T. Chen (2009). Spatial-temporalrupture process of 2008 great Wenchuan earthquake, Sci. ChinaEarth Ser., 52, no. 2, 145–154.
Institute of GeophysicsChina Earthquake AdministrationBeijing, 100081 People’s Republic of Chinawenzp@cea‑igp.ac.cn
(Z.W., J.X., M.G., Y.H.)
Department of Civil and Structural EngineeringThe Hong Kong Polytechnic UniversityHong Kong, China
(K.T.C.)
Manuscript received 31 August 2009
Near-Source Strong Ground Motion Characteristics of the 2008 Wenchuan Earthquake 2439
Related Documents