Wellman International Limited Licence No. P0236-02 Annual Environmental Report March 2017

Welcome message from author
This document is posted to help you gain knowledge. Please leave a comment to let me know what you think about it! Share it to your friends and learn new things together.
Transcript

Wellman International Limited
Licence No. P0236-02
Annual Environmental Report
March 2017

WELLMAN INTERNATIONAL LIMITED.
AER January 2016-December 2016 1
Table of Contents Page No:
Facility Information Summary 5
1.0 Introduction 5
1.1 Products 6
1.2 Raw material 8
1.3 Production process 9
Fibre process stage 1 10
Fibre process stage 2 10
1.4 Environmental issues 11
1.5 Environmental policy 11
2.0 Emissions to atmosphere 12
2.1 Boiler emissions 12
2.2 Process air emissions 13
2.2.1 Description 13
2.2.2 Results 14
2.2.3 Non-compliances 15
3.0 Emissions to water 18
3.1 Wastewater discharges 18
3.2 Priority substances 21
3.3 Acute toxicity 21
3.4 Macroinvertebrate bioassessment 23
4.0 Waste 24
4.1 Waste management indices 24
4.2 Sludge analysis 26
5.0 Resource consumption 27
5.1 Water consumption 27
5.2 Energy and fuel consumption 28
6.0 Environmental incidents and complaints summary 29
6.1 Incidents 29
6.2 Complaints 29
7.0 Environmental management programme & schedule of 30
environmental targets
8.0 Pollution release and transfer register 34
9.0 Noise monitoring 35
10.0 Groundwater monitoring summary 38
11.0 Surface water monitoring summary 40

WELLMAN INTERNATIONAL LIMITED.
AER January 2016-December 2016 2
12.0 Bund integrity testing 41
13.0 Inspection of underground effluent & foul sewer pipes 42
14.0 Spending on environmental protection 43
15.0 Decommissioning Management Plan 44
16.0 Environmental Liabilities Risk Assessment 44
List of Tables Page No: Table 1:
Combustion equipment emissions at A1-2 12 Table 2: Concentration results for bi-annual air emissions monitoring 1 16 Table 3: Concentration results for bi-annual air emissions monitoring 2 16 Table 4 Mass flow emission results for bi-annual air emissions monitoring 1 16 Table 5 Mass emission results for bi-annual air emissions monitoring 2 16 Table 6 Volumetric flow results for air emissions monitoring 17 Table 7 Wastewater discharges (2016 Results at SW1) 18 Table 8: Heavy metal contents at SW1 2010 – 2016 21 Table 9: Acute toxicity testing at SW1 22 Table 10: River Borora Water Quality Ratings 23 Table 11: Waste management indices 2010 – 2016 24 Table 12: Quantity waste land filled: 2001 – 2016 25 Table 13: Sludge analysis 2016 26 Table 14: River water consumption 2010 – 2016 27

WELLMAN INTERNATIONAL LIMITED.
AER January 2016-December 2016 3
Table 15 EMP projects & schedule of annual targets 31 Table 16 Noise monitoring summary 2016 36 Table 17: Groundwater monitoring results 38
List of Figures Page No:
Figure 1: Percentage recycled bottle flake in raw-material mix 8 Figure 2: TA Luft Organics Class 1 14 Figure 3: TA Luft Organics Class II 15 Figure 4: TA Luft Organics Class III 15 Figure 5: BOD at SW1 2010-2016 18 Figure 6: Suspended solids at SW1 2010-2016 19 Figure 7: Fats, oils & grease at SW1 2010-2016 19 Figure 8: Ortho-phosphates at SW1 2010-2016 20 Figure 9: Ammonia at SW1 2010-2016 20 Figure 10: Waste produced, recovered & disposed, 2010 - 2016 25 Figure 11: Energy consumed per tonne fibre produced 2010-2016 28 Figure 12: Monitoring at M/235/S 2010-2016 40 Figure 13: Monitoring at M/000/S 2010-2016 40

WELLMAN INTERNATIONAL LIMITED.
AER January 2016-December 2016 4
Appendices Page No: Appendix I Environmental Policy 46
Appendix II EPA AER Returns Worksheet 48
Appendix III Environmental Management Program Projects 56
Project 1.4 Up-Grade & Refurbishment Projects in the Effluent 57
Treatment Plant
Project 2.3 Reduce noise levels from the plant 60
Project 3.0 Develop a culture of environmental sustainability within 63 the organisation
Project 4.1 Waste management projects 65
Project 5.3 Optimisation of energy & water usage 67
Project 6.3 Groundwater protection 70
Project 8.2 Alternative energy sources 73 Project 9.0 Environmental communications 76
Appendix IV Noise Monitoring Locations 78 Appendix V Register of Mobile Bunds 80

WELLMAN INTERNATIONAL LIMITED.
AER January 2016-December 2016 5
Facility Information Summary
Licence register number: P0236-02
Name & location: Wellman International Ltd., Mullagh, Kells, Co. Meath.
NACE code: 1310
Class of activity: 8.4 Manufacture of synthetic fibres
Significant changes/environmental performance during reporting period:
72% flake was used in the raw material mix. This is the equivalent of recycling 2.5
billion post-consumer bottles. This results in a saving of 239,000T of CO2 equivalent
from processing recycled material V’s the use of virgin chip.
Less than 3% of waste transferred off-site was disposed to landfill.
A CCTV survey of all foul lines were completed.
Hydrogeological assessment of groundwater was completed as per agreement.
Excellent wastewater treatment performance in Q3 & Q4 ensured that ELVs post
2015 were achievable.
There were no EPA reportable incident
No complaints were received
All air emissions monitoring results were compliant
All water monitoring results were compliant
Noise levels were compliant.
Internal auditor training was completed.
1.0 Introduction
This Annual Environmental Report of Wellman International Limited (WIL) covers the period
January 2016 to December 2016.
For 40 years WIL has been a recognised leader in Europe of the innovative use of recycled
materials. WIL began operations in 1973 to convert post-industrial waste polymer materials
into first grade fibre products. Polyester fibres made from these raw materials are sold across
Europe to customers who in turn make a wide variety of finished goods such as car parts,
soft filled household and bed products, furniture and personal hygiene items.
Bottle flake, sourced from household collection systems is a main source of raw material for
Wellman International Limited, with over to 5 million post consumer PET bottles being
recycled at the plant daily.

WELLMAN INTERNATIONAL LIMITED.
AER January 2016-December 2016 6
Wellman International Limited is situated close to the village of Mullagh, Co. Cavan, fifty
miles from Dublin. In addition to the four-storey production plant, the 27-acre site contains
storage silos, warehouses, workshops, an ESB substation, a wastewater treatment plant and
firewater retention ponds. The total covered area is 33,500m2. The company employs 260
people.
1.1 Products
Polyester staple fibre products manufactured by Wellman International Limited (WIL) are sold
worldwide under trade names that include Fillwell®, Fillwell® Hygiene, Fillwell® Softflex,
Wellene®, Cirrus®, Sensifil™, Fillwell® Wellbond, Dreamfil™, Wellman HealthGuard, Wellcare
Protect, Wellcare AM and Wellman Profile. WIL fibres are widely used in non-woven and
filling applications including home furnishings, car interiors, carpets, hygiene products,
geotextiles and technical textiles. The end uses to which these products are put are shown
in the following table.
In line with changing market demands, business objectives and WIL’s commitment to be
Europe’s leading producer of polyester staple fibre the company have developed and now
produce a range of fibres which offer the high performance characteristics required for the
demanding hygiene market sector. These speciality fibre products are manufactured to
exacting standards of quality and performance and are independently tested and approved
for hygiene applications. The manufacture of fibres for this market is a key element of WIL’s
future business strategy helping to ensure company’s continued position as a leading
European supplier of polyester stable fibre.

WELLMAN INTERNATIONAL LIMITED.
AER January 2016-December 2016 7
Product Product
Fillwell® Regular Polyester fibre 1 Cirrus
® Moisture Management Polyester 8
Fillwell® Plus Resilient Polyester fibre 2 Fillwell
® Wellcare Anti Dust/Microbial Polyester Fibre 9
Fillwell® h Hollow Polyester fibre 3 Fillwell
® Hygiene Hygiene Polyester Fibre 10
Fillwell®
hs Hollow Siliconised Polyester 4 Fillwell® Wellbond Bi-component Polyester fibre 11
Fillwell® huf Hollow Soft Hand Polyester 5 Wellene Spun dried Black & White Polyester 12
Fillwell® softflex Hollow Spiral Polyester Filling 6 Wellman HealthGuard Anti Dust/Microbial Polyester Fibre 13
Dreamfil™ Lightweight Polyester 7 Sensifil™ Allergy and sensitive friendly 14
Product 1 2 3 4 5 6 7 8 9 10 11 12 13 14 Description
Abrasive Products * *
Domestic and industrial cleaning and scouring pads
Apparel products Skiwear
* * * * * * * Non-woven interlinings
Pile fabrics
Bedding products Quilts
Sleeping Bags
* * * * * * * * * * * * * Pillows
Mattresses
Waterbeds
Construction Products Geotextiles
* * * * * * Insulations
Concrete/Asphalt
Flame Retardant
Roofing felts
Filtration products Heavy industrial
filters
* * * * * Air conditioning filters
Liquid filters
Domestic appliances filters Floor covering
products Spun Yarn
Carpet Backing
* * Needlepunch
Automotive Products Bootliners
* * * * * Footwells
Headliners
Filters
Carpet
Hygiene Products *
Distribution layers in diapers
Femcare Products
Femcare Products

WELLMAN INTERNATIONAL LIMITED.
AER January 2016-December 2016 8
1.2 Raw Material
Raw materials are sourced world-wide. Raw materials can be broken down into the following
categories:
PET post consumer bottles, which are sorted, washed and granulated prior to delivery to
site.
Fibre from other major polyester fibre production plants.
Out-of specification polymer granules from polymer production plants.
By-products from the major producers of film and packaging materials.
Virgin chip
WIL itself uses almost 5 million post-consumer bottles daily that would otherwise have to be
sent to landfill or incinerated. 72% of our raw material mix in 2016 came from post-consumer
bottle flake. 300,000 tonnes of harmful air emissions are saved annually by the recycling
activities of WIL alone. The percentage of recycled bottle flake used in the raw material is
shown in Figure 1.
Figure 1: Percentage recycled bottle flake in raw-material mix

WELLMAN INTERNATIONAL LIMITED.
AER January 2016-December 2016 9
1.3 Production Process
The process of making staple fibre is shown schematically overleaf and can be summarised
as follows:
Raw material is tested, sorted, prepared and dried for delivery to the extruder.
The clean, dried raw material is melted and filtered in the extruder and molten polymer is
delivered at pressure to spin packs.
The spin pack creates thousands of individual strands of polymer fibre which are cooled
using air.
The material is collected in cans as a tow band.
The tow bands are heated and stretched to give it strength.
The strands are crimped to give bulk and set to maintain the crimp.
They are then coated with a lubricant to enable further processing by the customers.
Finally the strands are cut to the required length, baled and wrapped for delivery to the
customer.

WELLMAN INTERNATIONAL LIMITED.
AER January 2016-December 2016 10
Fibre process stage 1
Fibre process stage 2

WELLMAN INTERNATIONAL LIMITED.
AER January 2016-December 2016 11
1.4 Environmental Issues
As an organisation involved in the recycling of plastic material there is a strong awareness of
environmental issues. Since WIL was established, the company has demonstrated their
commitment to sound management practice and a sustainable business model. This is
demonstrated through good business and environmental standards and practice. This
commitment has been shown through registration to the following standards and achievement
of awards:
1990 Registered to ISO 9002
1997 Registered to ISO 14001/IS 3.10
1998 Obtained Integrated Pollution Control Licence. (Classification of Activity: 8.4 - The
Manufacture of Synthetic Fibres.)
2001 Registered to ISO 9001:2000
2004 Registered to OHSAS 18001
2005 Registered to ISO 14001 2004
2007 Registered to OHSAS 18001:2007
2007 Short-listed in the Sustainable Energy Awards for a project entered into the ‘Energy
Efficiency in Large Industries’ category
2007 Commendation in IBEC Environmental Awards
2008 Obtained technical amendment to existing licence which brings it up to IPPC standard
2009 Re-accredited to ISO 14001:2004
2012 Sustainable exporter of the year
2013 IPPC P0236-02 issued
2014 Licence confirmed as IPC licence
2014 Re-certified to ISO 14001:2004 by NSAI & IQNet
1.5 Environmental Policy
A copy of the integrated health and safety, environmental and product quality policy is
attached as Appendix I.

WELLMAN INTERNATIONAL LIMITED.
AER January 2016-December 2016 12
2.0 Emissions to atmosphere
2.1 Boiler Emissions
Process steam requirements are supplied by a main boiler, which operates on natural gas.
This boiler has a capacity of 8000 kg/hr and operates at 250 psi. Backup is provided by a
standby boiler, which is also run on natural gas. This boiler has a capacity of 7000 kg/hr and
operates at 250 psi.
Boiler emissions are monitored at emission point reference number A1-2 as per Schedule 1
(iii) of the licence. Outlined in Table 1 below are the results for boiler emissions for the last
seven years.
Table 1 Combustion equipment emissions at A1-2
Year CO, mg/m3 NOx, mg/m3
2010 0 28
2011 8.11 18.2
2012 5 62
2013 1 88
2014 <1 75.3
2015 12.1 74.6
2016 <1.7 79.2
Space heating is provided by three domestic type burners, which heat the canteen and the
training centre. These are not considered to present any significant environmental impact
and as such no routine monitoring is carried out.

WELLMAN INTERNATIONAL LIMITED.
AER January 2016-December 2016 13
2.2 Process Air Emissions
2.2.1 Description
There are ten licensed process air emission points currently being monitored. A brief
description of each is presented below.
Monomer Exhausts (A2-2, A2-3, A2-5, A2-6, A2-8, A2-12)
The monomer exhausts are fume extract systems, which also assist in the quenching of fibre
on exit from the spinnerette. On quenching of molten fibre, volatile organic compounds may
be released. These emission points are monitored biannually for TA Luft Organics Class I, II
and III compounds.
Rosin Dryers (A2-27)
The rosin dryers are used to dry raw materials prior to extrusion. Since the raw materials
used are recycled, volatile organic compounds in addition to moisture may be released
during drying. Air from the dryers is treated using a water spray scrubber prior to discharge
through a single emission point (ref: A2-27). This emission point is monitored biannually for
TA Luft Organics Class I, II and III compounds.
Unit 3 Dryer (A2-10, A2-11)
The unit 3 dryer is also used to dry raw material prior to extrusion. As with the rosin dryers,
volatile organic compounds in addition to moisture may be given off. Biannual monitoring is
conducted for TA Luft Organics Class I, II, and III compounds.
Hypox (A2-28)
The hypox system is used for cleaning purposes and removes contaminants and residual
polymer from the metal components used in the fibre spinning process. It is monitored
biannually for TA Luft Organics Class I, II and III compounds.

WELLMAN INTERNATIONAL LIMITED.
AER January 2016-December 2016 14
2.2.2 Results
The following graphs present a summary of air emission monitoring results from the last
seven years (Fig. 2, 3 & 4).
Monitoring is conducted bi-annually and the mass emission rate in Kg/annum is determined
from the measured concentration (mg m-3) and flow rate. The emission rate depicted below is
an average value of each set of results.
All monitoring results, including concentration limits, mass flows and volumetric flows for
2016 were within licensable parameters (Refer to Tables 2, 3, 4, 5 & 6). Emissions are
variable due to raw material blend at time of monitoring.
Figure 2: TA Luft Organics Class 1

WELLMAN INTERNATIONAL LIMITED.
AER January 2016-December 2016 15
Figure 3: TA Luft Organics Class II
Figure 4: TA Luft Organics Class III
2.2.3 Non-compliances
There were no non-compliances with the licence in terms of air emissions during 2016.

WELLMAN INTERNATIONAL LIMITED.
AER January 2016-December 2016 16
Table 2 Concentration results for bi-annual air emissions monitoring 1
IPPC Limits Concentration (mg/m3)
ELV mg/m3
A2-2 A2-3 A2-5 A2-6 A2-8 A2-10 A2-11 A2-12 A2-27 A2-28
TA Luft Organics Class I 20 <1.13 <0.83 <0.72 <0.74 <0.95 <1.09 <0.83 <0.72 <0.74 6.20
TA Luft Organics Class II 100 <1.13 <0.83 <0.72 <0.74 <0.95 <1.09 <0.83 <0.72 <0.74 <0.82
TA Luft Organics Class III 150 <1.13 <0.83 <0.72 <0.74 <0.95 <1.09 <0.83 <0.72 <0.74 <0.82
* The concentration ELV doesn’t apply as the mass flow is lower than the ELV mass flow.
Table 3 Concentration results for bi-annual air emissions monitoring 2
IPPC Limits Concentration (mg/m3)
ELV mg/m3
A2-2 A2-3 A2-5 A2-6 A2-8 A2-10 A2-11 A2-12 A2-27 A2-28
TA Luft Organics Class I 20 <0.88 <0.75 <0.81 <0.77 <0.72 <0.88 <0.75 <1.21 <0.67 <35.71
TA Luft Organics Class II 100 <0.88 <0.75 <0.81 <0.77 <0.72 <0.88 <0.75 <1.21 <0.67 <1.19
TA Luft Organics Class III 150 <0.88 <0.75 <0.81 <0.77 <0.72 <0.88 <0.75 <1.21 <0.67 <1.19
Table 4 Mass flow emission results for bi-annual air emissions monitoring 1
Mass flow threshold kg/h
Flow (kg/h)
A2-2 A2-3 A2-5 A2-6 A2-8 A2-10 A2-11 A2-12 A2-27 A2-28
TA Luft Organics Class I 0.1 <0.0118 <0.0104 <0.0035 <0.0044 <0.0137 <0.0016 <0.0030 <0.0096 <0.0009 <0.0002
TA Luft Organics Class II 2.0 <0.0118 <0.0104 <0.0035 <0.0044 <0.0137 <0.0016 <0.0030 <0.0096 <0.0009 <0.00003
TA Luft Organics Class III 3.0 <0.0118 <0.0104 <0.0035 <0.0044 <0.0137 <0.0016 <0.0030 <0.0096 <0.0009 <0.00003
Table 5 Mass emission results for bi-annual air emissions monitoring 2
Mass flow threshold kg/h
Flow (kg/h)
A2-2 A2-3 A2-5 A2-6 A2-8 A2-10 A2-11 A2-12 A2-27 A2-28
TA Luft Organics Class I 0.1 <0.0075 <0.0073 <0.0049 <0.0050 <0.0118 <0.0014 <0.0055 <0.0165 <0.0032 <0.00039
TA Luft Organics Class II 2.0 <0.0075 <0.0073 <0.0049 <0.0050 <0.0118 <0.0014 <0.0055 <0.0165 <0.0032 <0.00001
TA Luft Organics Class III 3.0 <0.0075 <0.0073 <0.0049 <0.0050 <0.0118 <0.0014 <0.0055 <0.0165 <0.0032 <0.00001

WELLMAN INTERNATIONAL LIMITED.
AER January 2016-December 2016 17
Table 6 Volumetric flow for air emissions monitoring
Monitoring
location IPPC limit
Bi-annual monitoring 1
Flowrate (m3/h)
Bi-annual monitoring 2
Flowrate (m3/h)
A2-2 17000m3/h 10409 8863
A2-3 17000m3/h 12429 9692
A2-5 17000m3/h 4810 5981
A2-6 17000m3/h 5819 6524
A2-8 23150m3/h 14404 16226
A2-12 23150m3/h 13263 13578
A2-27 10000m3/h 1156 4794

WELLMAN INTERNATIONAL LIMITED.
AER January 2016-December 2016 18
3.0 Emissions to water
3.1 Wastewater discharges
Wastewater is discharged from the site at monitoring point SW1. COD, BOD, Suspended
solids (suspended solids) and FOGs were analysed on a weekly basis and Total Ammonia
and Ortho-P were monitored monthly. All results were within the requirements of the licence.
The emission limit values together with the range of results for 2016 are outlined in Table 7.
This final effluent is then mixed with non-contact cooling and storm water and returned to
the River Borora.
Table 7 2016 Results at SW1
Parameter ELV (mg/L) Maximum results
achieved in 2016
COD (mg/L) None 950
BOD (mg/L) 40 32
SS (mg/L) 50 27
FOG (mg/L) 25 13
Total ammonia (mg/L) 10 0.9
Ortho-P (mg/L) 2 1.9
Figures 5, 6, 7, 8 & 9 provide a comparison of BOD, SS, FOG, Ortho-P and ammonia results
over the last 7 years.
Figure 5: BOD at SW1 2010-2016

WELLMAN INTERNATIONAL LIMITED.
AER January 2016-December 2016 19
Figure 6: SS at SW1 2010-2016
Figure 7: FOGs at SW1 2010-2016

WELLMAN INTERNATIONAL LIMITED.
AER January 2016-December 2016 20
Figure 8: Ortho-P at SW1 2010-2016
Figure 9: Ammonia at SW1 2010-2016

WELLMAN INTERNATIONAL LIMITED.
AER January 2016-December 2016 21
3.2 Priority substances
A heavy metal scan is carried out on wastewater discharges at SW1 on an annual basis
as outlined in Schedule C.2.2 of the licence. The results of this monitoring are outlined
below. Samples of waste water discharge from SW1 were taken in March 2016; ANUA
completed the required analysis.
Table 8 Heavy metals content at SW1 (2010-2016)
Parameter 2010 2011 2012 2013 2014 2015 2016
Aluminium, ppb 12 16 517 5 <50 36 2
Antimony, ppb 17 111 7 350 195 132 295
Arsenic, ppb <2 <2 7 <2 <2 <2 <2
Barium, ppb 347 258 26 152 167 65 168
Beryllium, ppb <2 <2 <2 <2 <1 <2 <2
Cadmium, ppb <2 <2 <2 <2 <0.5 <2 <2
Chromium, ppb <2 2 3 <2 <3 3 <2
Cobalt, ppb <2 9 <2 4 2.44 2 <2
Copper, ppb 3 413 27 <2 <4 216 <2
Iron, ppb 300 <2 2.2 (ppm) 0.15 (ppm) 0.05 (ppm) 0.3 (ppm) <0.1 (ppm)
Lead, ppb <2 6 6 <2 <0.5 6 <2
Manganese, ppb 14 62 465 30 12 12 12
Mercury, ppb <1 <1 <1 <1 <0.02 Not
measured
<1
Nickel, ppb <2 10 6 4 5 7 <2
Selenium, ppb <2 <2 4 <2 <1 <2 <2
Silver, ppb <2 <2 <2 <2 <2 <2 <2
Tin, ppb <2 <2 <2 <2 <3 <2 <2
Zinc, ppb 18 474 28 38 60.7 114 35
3.3 Acute Toxicity
Acute toxicity testing was carried out on a sample of the final effluent in September
1999, March 2003, January 2006, September 2009, September 2012, November 2013
and June 2016.
These reports are summarised in Table 9 below.

WELLMAN INTERNATIONAL LIMITED.
AER January 2016-December 2016 22
Table 9 Acute toxicity testing at SW1
1999 2003 2006 2009 2012 2013 2016
Sample
Desc
Test
Required Test Species No. Toxic
Units No. Toxic
Units No. Toxic
Units No. Toxic
Units
No. Toxic
Units
No. Toxic
Units
No. Toxic
Units Comments
Effluent
48h EC50 to
Daphnia
magna Daphnia magna
<1 @ 100% vol/vol
<1 @ 100% vol/vol
<1 @ 100% vol/vol
<1 @ 100% vol/vol
1.9 @
51.7%
vol/vol
<1 @ 100%
vol/vol
2.07 @
LC50 48.3%
(48 hour
test)
2016 sample classified as non-toxic
Effluent
15 min EC50
to Vibrio
fischeri
(30min EC50
in 2012)
Vibrio fischeri <2.2 @ 45%vol/ vol
<2.2 45%vol/ vol
<2.2 @ 45%vol/ vol
<2.2 @ 45%vol/ vol
<2.2 @
45%vol/
vol
<1 @ 100%
vol/vol
(toxicity, no
light
inhibition
test
conducted)
1.5 @LC50
of 65.5% (5
min test)
1.8 at LC50
of 55.5% (15
min test)
2016 sample classified as non-toxic
This monitoring will be repeated in 2019.
Monitoring Point Reference No. SW1

WELLMAN INTERNATIONAL LIMITED.
AER January 2016-December 2016 23
3.4 Macroinvertebrate bioassessment
A macroinvertebrate bioassessment of the River Borora, upstream and downstream of
the WIL wastewater discharge point was conducted in September 2016.
A Sample was taken at one location upstream of the discharge point (S1). S1 is located
50m upstream of the Wellman discharge point. Five samples were taken down stream
from the discharge point (S2, S5, S6, S3 & S4) at points immediately downstream, 60m
downstream, 250m downstream and 2 samples taken at 2 1km downstream
respectively. Results are outlined in Table 10.
The dissolved oxygen results range from 9.7 – 10.8 mg/L which indicates sufficient
dissolved oxygen present to sustain life within the river. The temperature of the river was
12.3-13.10C.
Overall water quality has improved from the previous assessment done in 2013. Water
quality varied from unpolluted in close proximity to the discharge point to moderately
polluted 50m upstream and 1km downstream. It was previously thought that background
pollution may be attributable to agricultural practices in neighbouring lands. Wellman
discharge does not appear to be affecting the quality of the water.
Table 10 River Borora Water quality ratings (based on macroinvertebrate
bioassessment)
Sample point Location Q-rating Interpretation
S1 50m upstream 2-3 Moderately polluted
S2 Immediately downstream 3-4 Slightly polluted
S5 60m downstream 4 Unpolluted
S6 250m downstream 4 Umpolluted
S3 1km downstream 3 Moderately polluted
S4 1 km downstream 3 Moderately polluted

WELLMAN INTERNATIONAL LIMITED.
AER January 2016-December 2016 24
4.0 Waste
Waste removed from the site during 2016 is outlined in Appendix II (EPA AER Returns
Worksheet).
4.1 Waste management indices
Gross WaMI
= [Waste Produced (t) / Raw Material Usage (t)] x 100
Nett of Process WaMI
= [Waste Produced (t) – Amount Recovered on Site (t)] x 100
Raw Material (t)
Nett of Site WaMI
= [Waste Produced (t) – Amount Recovered on Site (t) – Amount Recovered off Site (t)] x100
Raw Material Usage (t)
Raw Material (Nett): 85403 tonnes
Waste Produced on Site: 6216 tonnes
Amount Recovered On-Site: 4392 tonnes
Amount Recovered Off-Site: 1768 tonnes
Table 11 Waste management indices 2010-2016
2010 2011 2012 2013 2014 2015 2016
Gross WaMI 7.2 6.99 7.2 7.05 6.99 7.3 7.28
Nett of Process WaMI 2.33 2.4 2.3 2.21 2.45 2.34 2.14
Nett of Site WaMI 0.89 0.8 0.2 0.1 0.04 0.051 0.07
Waste generation has been relatively consistent over the last number of years. A very
small volume of waste, in terms of raw material input, is being sent off-site for treatment.
Considerable efforts have been made to reduce the volume of waste produced and to
recycle any waste that is produced.
The volume of waste produced on annual basis is directly related to fibre production. On
average 65-70% of the total waste produced on-site is recycled through the

WELLMAN INTERNATIONAL LIMITED.
AER January 2016-December 2016 25
manufacturing process. The volume of waste generated, recycled and disposed of from
2010 to 2016 is depicted in Figure 10.
Figure 9: Waste produced, recovered and disposed, 2010-2016
In 2016, only 54.5 Tonnes of waste was disposed to landfill. This represents less than
3% of the total waste sent off-site. This figure includes 17T of asbestos that was
removed from site during a construction project. Table 12 outlines the reduction in
volumes of waste disposed to landfill over the last 15 years.
Table 12 Quantity waste landfilled, 2001-2016
Year Landfill, tonnes
2001 1555.74
2006 740.45
2007 583.82
2008 570.07
2009 538.8
2010 663.8
2011 610.22
2012 149.21
2013 68.06
2014 35.00
2015 43.64
2016 54.5

WELLMAN INTERNATIONAL LIMITED.
AER January 2016-December 2016 26
4.2 Sludge analysis
As per Schedule C4 of the IPPC licence the sludge from the wastewater treatment
process is analysed for organic content, heavy metals and water content each year. The
wastewater treatment plant is de-sludged from the biotower and the aeration
tank/settlement tank at alternate times. The sludge from each system is dried using a
de-watering press, loaded into a skip and removed off-site for composting. The results
are outlined in Table 13 below:
Table 13 Sludge analysis 2016
Parameter Biotower de-watered
sludge
Aeration tank de-
watered sludge
Heavy metals
Antimony 115 µg/g 39 µg/g
Arsenic <0.5 µg/g <0.5 µg/g
Barium 12 µg/g 6.5 µg/g
Beryllium <0.5 µg/g <0.5 µg/g
Cadmium 0.276 µg/g 0.5 µg/g
Chromium 10 µg/g 12.45 µg/g
Cobalt 1.3 µg/g 0.88 µg/g
Copper 13.5 µg/g 17.78 µg/g
Iron 370 µg/g 0.47 µg/g
Lead 2.025 µg/g 5 µg/g
Manganese 2.3 µg/g 2.6 µg/g
Selenium 0.775 µg/g 2.25 µg/g
Silver <0.5 µg/g 0.5 µg/g
Zinc 41mg/kg 69.5 µg/g
Mercury 0.055mg/kg 0.177 µg/g
Organic content 5924mg/kg 9650mg/kg
Moisture 71.4% 66.8

WELLMAN INTERNATIONAL LIMITED.
AER January 2016-December 2016 27
5.0 Resource consumption
5.1 Water consumption
Process water is supplied primarily from the nearby river Borora. A totaliser on the
pumps records the volume of water consumed.
The volume of river water consumed over the last seven years is summarised below
(Table 14).
Table 14 River water consumption 2010-2016
Year m3/year m3/tonne
2010 82955 1.03
2011 76719 0.99
2012 68073 0.86
2013 63385 N/A
2014 62167 N/A
2015 60485 N/A
2016 70605 N/A
Water is also supplied to the site from two wells. In total 85706 m3 water was consumed,
this is equivalent to 1.01 m3/tonne fibre produced.
In 2016 the average daily abstraction rate (per production day) was 210 m3 from the river
and 45 m3 from the wells.

WELLMAN INTERNATIONAL LIMITED.
AER January 2016-December 2016 28
5.2 Energy and Fuel consumption
5.2.1 Energy
Three sources of energy are used at WIL; Natural Gas, LPG and Electricity. Almost half
of the energy used is from electricity and slightly more than half is natural gas. The total
amount of energy consumed in the last seven years has varied between a maximum
usage of 1096 kWh per tonne in 2010 and a minimum of 1030 kWh per tonne in 2015.
2015 has been the best achievement to-date in terms of energy consumption per tonne
fibre produced.
Considerable resources have been put into reducing energy consumption. Information
relating to improvements made in energy consumption can be reviewed in additional
detail in Appendix III, Project 5.3
Figure 11 Energy consumed per Tonne fibre produced 2010-2016

WELLMAN INTERNATIONAL LIMITED.
AER January 2016-December 2016 29
6.0 Environmental incidents and complaints summary
6.1 Incidents There were no reportable incidents in 2016.
6.2 Complaints No complaints were received during the period January 2016 to December 2016.

WELLMAN INTERNATIONAL LIMITED.
AER January 2016-December 2016 30
7.0 Environmental management programme & schedule of
environmental targets
In order to manage the effect our business has on the environment, Wellman International
Limited has an Environmental Management System (EMS) accredited to ISO 14001.
Within the EMS there is an Effects Register and a Register of Legislation. Based on both
these registers WIL have set the following core environmental objectives:
1.0 Reduce the impact of effluent discharges on the water quality of the River Borora.
2.0 Reduce noise emissions from the site
3.0 Develop a culture of environmental sustainability within the organisation
4.0 Optimise energy efficiency and resource usage
5.0 Minimise risk posed to groundwater
6.0 Waste Management Projects (Minimise waste generation, promotion of the use of
renewable resources and sustainable treatment methods for handling waste).
7.0 Environmental Communication
Under these core objectives a number of 5-year projects have been implemented and each
year a set of targets are established under each project. Additionally, targets are set based
on Environmental Communications and findings from internal and external audits. Details of
the 5-year projects and the annual targets for 2016 are provided in Table 15. Appendix III
provides a detailed report of the progress made on each EMP project in 2015.

WELLMAN INTERNATIONAL LIMITED.
AER January 2016 – December 2016 31
Table 15 EMP Projects & Schedule of Annual Targets
Core objective
reference
Project title Project timeframe 2017 targets
1.0 Up-grade & refurbishment projects in the effluent
treatment plant (Project No. 1.4)
Jan. 14 – Dec. 19 Establish a WWTP team with responsibility for
establishing ownership structure, future planning,
impact assessments of trials/production plans and
setting objectives & targets.
6-sigma project on the reduction of finish use in
spinning
Review options to replace belt press
2.0 Reduce noise levels from the plant (Project No. 2.3) Jan. 16 – Dec. 20 Lag pipework at Silo’s 19 & 20.
Review options to replace tannoy system
Investigate operation of QFT on baler condenser
fans.
Deliver training/communication program on current
noise levels on site, likely impact of changes to
operations and importance of following internal
Environmental Impact Assessment for all projects.
3.0 Develop a culture of environmental sustainability
within the organisation. (Project 3)
Jan.16 – Dec. 20 Establish a team with responsibility for managing
sustainability planning within the organisation.
Review corporate sustainability requirements,
collate relevant data.
4.0 Energy reduction projects (Project No. 5.3)
Jan. 13 – Dec. 17
Establish an Energy Team to review 2016 Energy
audit and implement recommendations.

WELLMAN INTERNATIONAL LIMITED.
AER January 2016 – December 2016 32
Alternative energy sources (Project 8.2)
Up-grade Cylon energy monitoring system.
Replace existing lights on A, B & C line cutters with
LED lighting.
6 sigma project to reduce gas consumption on the
final dryers
5.0 Groundwater Protection (Project 6.3)
Jan. 15 – Dec. 19 Scope and complete repair works as outlined in
2016 CCTV survey
Investigate options to clean up bandsaw area.
Up-grade floor in Automatic Finish Mixing Area
Complete ‘priority substances’ risk assessment and
review procedures accordingly
Review options to provide weather protection for
outdoor chemstore units.
6.0 Waste Management Projects ( Waste minimisation, use of
renewable resources, sustainable disposal/recovery
methods for handling waste generated.) (Project 4.1)
Jan. 17 – Dec. 21 Complete an audit of 2 waste contractors
Implement procedure to remove aerosol from
silicone spray cans.
Install hot water at IBC wash area.
7.0 Environmental Communications Jan. 16 – Dec. 20 Complete internal auditor training for ISO auditors.
Prepare high level environmental training plans for
specific roles within the organisation.
Review options to integrate emergency response
clauses of ISO 14001 and 18001 management
systems and related documents.

WELLMAN INTERNATIONAL LIMITED.
AER January 2016 – December 2016 33
Review emergency response procedure in relation
to firewater management.
Complete a review and gap analysis on the
requirements of the new ISO14001:2015, which will
replace the existing standard in 2018.
Establish a team to scope and define the context of
the organisation and needs and expectations of
stakeholders in preparation for future ISO
14001:2015 registration.
Investigate the feasibility of providing root cause
analysis training for managers and supervisors.
Review environmental procedures as per 2017
review program.

WELLMAN INTERNATIONAL LIMITED.
AER January 2016 – December 2016 34
8.0 Pollution Release and Transfer Register
Outlined below is a list of releases to air and water from our facility which have been reported in
compliance with SI123 of 2007.
Air
Carbon di-oxide (CO2)
Nitrogen oxides (NOx)
Carbon monoxide (CO)
Sulphur dioxide (SO2)
Particulate matter (PM10)
TA Luft Class I, II & III were monitored at the licensed emission points.
Water
Arsenic & compounds
Chromium & compounds
Copper & compounds
Lead & compounds
Nickel & compounds
Zinc & compounds
Cadmium & compounds
Details of the emissions are recorded in the EPA AER Returns Worksheet (Appendix II)
Variances in air emissions compared to 2015 data are due to variable nature of raw material.
Reductions in water emission values are due to improved controls at the wastewater treatment
plant and the reduction of the volume of highly concentrated waste finish being treated in the
wastewater treatment plant.

WELLMAN INTERNATIONAL LIMITED.
AER January 2016 – December 2016 35
9.0 Noise Monitoring
Noise monitoring was conducted in the second half of 2016 in accordance with the EPA
Guidance note NG4. Daytime and night-time noise levels are within the licence criteria at all
nearest sensitive location
The results of the survey are included in the Effects Register and noise reduction projects
are devised accordingly. Progress with noise reduction projects is addressed through the
annual Objectives & Targets programme.
Table 16 summarises the results of the Annual Noise Survey Report from the Wellman
International Ltd (WIL) site, conducted in 2016. The full report is available on-site.

WELLMAN INTERNATIONAL LIMITED.
AER January 2016 – December 2016 36
Table 16 Noise monitoring summary
Date of
monitoring Time period
Noise
location NSL LAeq LA90 LA10 LAmax LART
Tonal or impulsive
noise
If tonal/impulsive was
5dB penalty applied Comments
19/10/16 12:44–12:59 N2 47 43 49 70 47 No N/A Silo farm noise, product conveying through
pipework, dogs barking in the distance. 19/10/16 13:00-13:15 N2 48 45 49 58 48 No N/A
19/10/16 13:16-13:31 N2 47 43 49 58 47 No N/A
25/08/16 04:46-05:01 N2 43 42 44 51 Product impacts, blowers turning on & off, dogs
barking in the distance. 25/08/16 05:02-05:17 N2 46 44 48 55
02/11/16 14:40-14:55 N4 X 56 55 57 61 56 No N/A Fans on Spinning roof, product impacts through
pipework, diverter valves opening & closing 02/11/16 14:56-15:11 N4 X 55 55 56 61 55 No N/A
02/11/16 15:12-15:27 N4 X 55 54 56 59 55 No N/A
25/08/16 05:32-05:47 N4 X 56 55 57 59 Fans on Spinning roof, product impacts through
pipework, diverter valves opening & closing 25/08/16 05:48-06:03 N4 X 56 55 57 61
19/10/16 09:10-09:25 N5 X 61 58 64 68 61 No N/A Fans on Spinning & Finishing roofs, product
impacts through pipework. Dogs barking in the
distance.
19/10/16 09:26-09:41 N5 X 62 58 65 67 62 No N/A
19/10/16 09:42-09:57 N5 X 62 58 64 68 62 No N/A
24/08/16 23:01-23:16 N5 X 59 53 65 70 Fans on Spinning & Finishing roofs, product
impacts through pipework. Dogs barking in the
distance. 24/08/16 23:17-23:32 N5 X 60 53 65 72
02/11/16 11:52-12:07 N7 X 43 38 46 60 43 No N/A Fans on Spinning roof, bulk material filling to
silos, blower noise & product impacts. 02/11/16 12:08-12:23 N7 X 43 39 46 53 43 No N/A
02/11/16 12:25-12:40 N7 X 45 41 47 57 45 No N/A
25/08/16 00:25-00:40 N7 X 44 43 45 51 Fans on Spinning roof, blower noise & product
impacts. 25/08/16 00:41-00:56 N7 X 44 44 45 49
02/11/16 13:00-13:15 N8 X 50 49 52 53 50 No N/A Forktruck activity in the yard, fan and product
impacts through pipework. 02/11/16 13:16-13:31 N8 X 49 48 50 56 49 No N/A
02/11/16 13:32-13:47 N8 X 49 48 51 54 49 No N/A
25/08/16 01:10-01:25 N8 X 61 60 62 65 Fan & product impacts through pipework.
25/08/16 01:26-01:41 N8 X 61 60 62 65

WELLMAN INTERNATIONAL LIMITED.
AER January 2016 – December 2016 37
Date of
monitoring
Time period Noise
location
NSL LAeq LA90 LA10 LAmax LART Tonal or impulsive
noise
If tonal/impulsive was
5dB penalty applied
Comments
02/11/16 10:35-10:50 N10 X 51 44 53 63 51 No N/A Blowers turning on & off, product impacts
through pipework & dogs barking in the
distance.
02/11/16 10:51-11:06 N10 X 50 47 53 57 50 No N/A
02/11/16 11:08-11:23 N10 X 51 48 53 60 51 No N/A
24/08/16 23:42-23:57 N10 X 50 40 56 62 Blowers turning on & off, product impacts
through pipework, dogs barking in the distance. 24/08/16 23:59-00:14 N10 X 52 50 54 55
19/10/16 14:01-14:16 N13 X 54 52 55 65 54 No N/A Fans on Spinning roof, product impacts through
pipework. 19/10/16 14:17-14:32 N13 X 53 52 54 61 53 No N/A
19/10/16 14:34-14:49 N13 X 53 52 54 60 53 No N/A
25/08/16 01:50-02:05 N13 X 55 53 56 61 Fans on Spinning roof, product impacts through
pipework. 25/08/16 02:06-02:21 N13 X 55 53 56 60
25/08/16 02:43-02:58 N13(a) 44 43 44 47 This is a supplementary measurement,
conducted at the nearest noise sensitive
location to monitoring point N13. This
measurement was conducted to ensure license
compliance based on night-time noise levels
measured at monitoring point N13.
25/08/16 02:59-03:14 N13(a) 43 42 45 48
19/10/16 11:49-12:04 N14 49 47 51 59 49 No N/A Blowers turning on & off, product impacts
through pipework, dogs barking in the distance. 19/10/16 12:05-12:20 N14 50 48 51 68 50 No N/A
19/10/16 12:21-12:36 N14 49 47 51 56 49 No N/A
25/08/16 04:10-04:25 N14 46 45 48 51 Blowers turning on & off, product impacts
through pipework, dogs barking in the distance. 25/08/16 04:26-04:41 N14 47 46 48 50
19/10/16 10:45-11:00 N15 46 43 48 58 46 No N/A Fan noise and faint product impacts through
pipework, local farmyard activity. 19/10/16 11:01-11:16 N15 46 42 49 65 46 No N/A
19/10/16 11:17-11;32 N15 44 41 46 60 44 No N/A
25/08/16 03:20-03:35 N15 37 36 38 48 Fan noise and faint product impacts through
pipework. 25/08/16 03:36-03:51 N15 37 36 38 41
All noise results were within licensable limits.

WELLMAN INTERNATIONAL LIMITED.
AER January 2016 – December 2016 38
10.0 Groundwater monitoring summary
Ground water monitoring is scheduled to be carried out bi-annually, as outlined in Schedule
C.6 of the licence. The results for the monitoring completed in 2016 are summarised below.
Table 17 Groundwater Monitoring Results
Parameter GW1
(cooling water) GW2
(drinking water) *Drinking water std (µg/l) Mar-16 Sep-16 Mar-16 Sep-16
pH 7 7.1 7 7.1 6.5-9.5
COD (mg/l) 5 6 4 3
Conductivity mS/cm@20
oC
610 610 630 630 2500
Nitrate (mg/l asN) 2.5 2.3 2.9 2.4 50
Total Nitrogen (mg/l) 1.2 2.6 1.6 2.6
Chloride (mg/l) 46.5 41 33 48 250
DRO (µg/l) <10 N/A <10 N/A
Speciated TPH (µg/l) <11 N/A <11 N/A
Trace Organics (mg/l) Methanol <0.5 <0.5 <0.5 <0.5 -
Acetonitrile <0.5 <0.5 <0.5 <0.5 -
Ethanol <0.5 <0.5 <0.5 <0.5 -
Acetone <0.5 <0.5 <0.5 <0.5 -
IPA <0.5 <0.5 <0.5 <0.5 -
USEPA 524.2 (µg/L)
<3.0 <3.0 <3.0 <3.0 -
Heavy Metals Aluminium <2 <2 <2 <2 200
(µg/l) Boron 27 11 <2 19.5 1000
Iron (mg/l) <2 <0.1 <0.1 <0.1 200
Manganese <2 <2 <2 <2 50
Copper 2 9.19 10 30 2000
Zinc <2 18.6 <2 30.7 -
Barium <2 14.2 3 19.5 -
Arsenic <2 <2 <2 <2 10
Cadmium <2 <2 <2 <2 5
Chromium <2 <2 <2 <2 50
Mercury <1 <1 <1 <1 1
Nickel <2 4.9 <2 <2 20
Lead <2 <2 <2 <2 25
Antimony <2 <2 <2 <2 5
Selenium <2 <2 <2 <2 10
Cobalt <2 <2 <2 <2 -
Silver <2 <2 <2 <2 -
Beryllium <2 <2 <2 <2 -
Tin <2 <2 <2 <2 -

WELLMAN INTERNATIONAL LIMITED.
AER January 2016 – December 2016 39
The reference numbers for the two groundwater wells on site are GW1 and GW2. GW1 is
located at the Southwest boundary of the site and is used for cooling water purposes and
GW2 is located at the northeast boundary of the site and is used for drinking water purposes.
There is a third well on-site GW3, which is located adjacent to GW2, and is used as a back-
up for GW2. The use of GW2 & GW3 is interchangeable.
Analysis results for GW2 were in compliance with the limits specified in the European
Communities (Drinking Water) (No. 2) Regulations 2007 (S.I. No. 278 of 2007) which is used
for drinking water purposes.
A hydrogeological assessment, taking into account EPA Guidance in relation to
demonstrating compliance with the Environmental Objectives Groundwater Regulations (SI 9
of 2010), was conducted by Dr. Robert Meehan and the report submitted to the EPA. The
assessment was approved by the Agency in April 2015. Quarterly groundwater monitoring
was recommended as part of the report and this is currently underway. A summary report
was submitted to the Agency following each round of monitoring. The complete suite of
analysis concluded the following:
The conceptual model for the site demonstrates that during spells of dry weather the aquifer
goes dry-ish and where pollutants are present they are detected. The levels of PAHs and
TPHs found in the wells in December concur strongly with the outline conceptual model for
the site. Following periods of wet weather such as December 2015 and January and
February 2016, the pollutants are diluted and following dry weather conditions pollutants are
more evident. It is therefore recommended that sampling be completed on an annual basis,
to assess the long-term trend in decreasing pollutants in boreholes across the site.

WELLMAN INTERNATIONAL LIMITED.
AER January 2016 – December 2016 40
11.0 Surface water monitoring summary
Surface water discharges are monitored at M/235/S as outlined in Schedule C.2.3 of the
licence. The results are presented in Fig. 11 below.
The results for M/000/S, the combined discharge to the river are monitored as outlined in
Schedule C.2.2 of the licence. See Fig. 12
Figure 12 Monitoring at M/235/S 2010-2016
Figure 13 Monitoring at M/000/S 2010-2016

WELLMAN INTERNATIONAL LIMITED.
AER January 2016 – December 2016 41
There were no non-compliances in relation to surface water monitoring during 2016.
12.0 Bund integrity testing
The bunds were integrity tested by TGP, Consulting Civil & Structural Engineers in 2015. The
report is available for inspection on-site. A number of minor repairs were recommended on
the report and are currently being closed out.
A program of testing of mobile bunds was completed in 2015. The summary report is
provided in Appendix V. Three bunds failed the integrity test and these were subsequently
decommissioned.
Integrity testing is required again in 2018.

WELLMAN INTERNATIONAL LIMITED.
AER January 2016 – December 2016 42
13.0 Inspection of underground effluent & foul sewer pipes
A CCTV survey of the underground effluent & foul sewer pipes was conducted by JC Enviro
Drain Services during 2016. All foul drains are currently in good condition and require no
further rehabilitation works.
The next survey of the foul system is scheduled for 2019.

WELLMAN INTERNATIONAL LIMITED.
AER January 2016 - December 2016 43
14.0 Spending on environmental protection
Consultants & Environmental Management Fees AES 88,755.80
McBreen Environmental 2,155.00
S.S.I Environmental Limited 3,100.00
EPA 9,392.34
NSAI 14,200.00
TMS Environment 3,826.00
Rowan Engineering Consultants Ltd 500.00
Independent Energy Consultants 6,175.00
ANUA
Robbie Meehan
Traynor Environmental Ltd.
Antaris Consulting
KD Environmental
JC Environmental Drain Specialists
5,105.20
1,500.00
4,750.00
1,800.00
500.00
5,830.00
TOTAL 147,089.34
Capital Projects Floor Cleaner (Omni 32) 12,192.00
New Clunker Storage Area 15,800.00
Remove Old Asbestos Cement Water Main & replace with new HDPE Water main
84,475.00
Upgrade of Auto Finish mixing unit in spinning 12,819.00
TOTAL 125,288.00

WELLMAN INTERNATIONAL LIMITED.
AER January 2016 - December 2016 44
15.0 Decommissioning Management Plan
The Decommissioning Management Plan was accepted by the Agency in July 2015, subject to an
annual review. It was reviewed in May 2016 and the Executive Summary is provided below.
16.0 Environmental Liabilities Risk Assessment
An Environmental Liabilities Risk Assessment was prepared by Rowan Engineering Consultants
Ltd. in 2013. The ELRA was rejected by the Agency. It has been up-dated and further information
submitted. The revised edition was accepted by the Agency. The ELRA will be reviewed in 2017.
Based on ‘worst case scenario’ assessment the maximum liability that may be incurred has been
calculated at €412,324.

WELLMAN INTERNATIONAL LIMITED.
AER January 2016 - December 2016 45
A total of 29 potential risks were identified. There is one medium level risk, relating to the
management of firewater. All remaining risks are low level and indicate a need for continuing
awareness and monitoring on a regular basis.
Statement of Measures
WIL have been in operation for the last 40 years. During this time environmental risk management
has been a core value and it is reflected in the level of reasonably low level of risk identified in the
risk assessment. The proposed/continued mitigation measures are outlined below.
Risk Risk
score
Mitigation measure
Loss of integrity of fuel bunds 3 Continue bund certification
Loss of integrity of diesel bund at
river pump house
4 Continue daily inspection & weekly
maintenance checks of bunds.
Loss of integrity of foul underground
pipelines
2 Carry out CCTV survey of underground
pipelines.
WWTP tanks or sumps overflowing 4 Continue weekly alarm checks
Uncontrolled & prolonged release of
the final discharge outside the ELVs
6 Review & up-date existing WWTP manual
Release of significant noise
emissions beyond the boundary of
the site.
2 Continue annual noise monitoring
Release of uncontrolled gaseous
emissions following malfunction of
equipment.
2 Scrubber checked regularly as part of sites
preventative maintenance
Extreme cold temperatures
(potential impact on WWTP)
3 Review WWTP procedures & controls in place
for cold weather.
Major site fire 8 Review emergency response procedures in
relation to firewater management.
Potential unknown historical legacy
issues
4 Groundwater monitoring
Based on the risk assessment environmental liabilities have been costed at €412,324 which is
‘worst case scenario’ with a 10% contingency.

WELLMAN INTERNATIONAL LIMITED.
AER January 2016 - December 2016 46
Appendix I

WELLMAN INTERNATIONAL LIMITED.
AER January 2016 - December 2016 47

WELLMAN INTERNATIONAL LIMITED.
AER January 2016 - December 2016 48
Appendix II

WELLMAN INTERNATIONAL LIMITED.
AER January 2016 - December 2016 49

WELLMAN INTERNATIONAL LIMITED.
AER January 2016 - December 2016 50

WELLMAN INTERNATIONAL LIMITED.
AER January 2016 - December 2016 51

WELLMAN INTERNATIONAL LIMITED.
AER January 2016 - December 2016 52

WELLMAN INTERNATIONAL LIMITED.
AER January 2016 - December 2016 53

WELLMAN INTERNATIONAL LIMITED.
AER January 2016 - December 2016 54

WELLMAN INTERNATIONAL LIMITED.
AER January 2016 - December 2016 55

WELLMAN INTERNATIONAL LIMITED.
AER January 2016 - December 2016 56
Appendix III

WELLMAN INTERNATIONAL LIMITED.
AER January 2016 - December 2016 57
Project 1.4 Up-Grade & Refurbishment Projects in the
Effluent Treatment Plant
The project was initiated in 2014 and is of 5-years duration. It will be managed as follows:
1. In quarter 1 of each year decide on projects for up-coming year. Projects will be
based on audit findings, results at SW1, new legislation, development of new
technologies.
2. Implement projects, these may be addressed within 1 year or over 5 years
depending on reason for project, size & cost of project etc.
3. Assess the project. Infrastructural projects will be either complete or incomplete.
New equipment will be assessed in terms of benefits achieved.
4. At the end of the 5 year project, a summary report will be prepared, detailing
changes implemented and the effect of those changes.
Overall objective
Improve final effluent quality (suspended solids & COD) by 5% from 2013 levels.
Develop awareness within the site of the impact of production projects & programs on the
WWTP.
Develop method to manage the plant in the event of changes to influent i.e. forward
planning.
Targets set for 2014
Install screen at balance tank
Assess condition of biotower (external engineer)
Investigate options to replace/renovate the biotower.
Progress made in 2014
Screen not installed – carry over to 2016
COD (mg/L) Daily
average
COD (ave. kg/day) SS (mg/L) Daily
average
SS (ave. kg/day)
2013 levels at SW1 1003 124 36 4.4
Expected levels in
2018
952 118 34 4.2

WELLMAN INTERNATIONAL LIMITED.
AER January 2016 - December 2016 58
Biotower has been assessed by Thomas Garland & Partners from a structural point
of view. It is recommended that the biotower be replaced.
The cladding of the biotower has been replaced in some areas. This will help to
maintain the biotower on a short-term basis (approximately 2 years), however
options to replace it are yet to be considered.
Targets set for 2015
Install screen at balance tank.
Investigate options to renovate/replace biotower.
Develop procedure to plan & manage changes to the plant.
Progress made in 2015
Reviewed the Capital Expenditure Financial Request form for the screen prior to re-
submitting. As part of the review it was recommended that a DAF system would be a
better option than the screen and that the introduction of the DAF may bring about
benefits that would remove the requirement for the biotower. Two quotations were
received. It was decided to trial a pilot-scale DAF to ensure that it is the correct
option for the WIL system. This will be carried over to 2016.
During 2015 a consultant reviewed the overall management and efficiency of the
wastewater treatment plant. The main recommendations from their report related to
installation of screen/DAF and further testing and/or pilot studies to get a better
understanding of how the plant is working.
During 2015 a system to separate high strength waste finish from low strength waste
finish was introduced. Both waste streams are then fed to the WWTP in a controlled
manner with a maximum loading of 400kg COD per day. Although controlling the
finish disposal is manual it is a very effective system and final effluent quality
improved since the system of control was introduced. Information in relation to the
volume of finish being disposed of is circulated to Production & Technical Personnel
on a daily basis to increase awareness in relation to the effect of waste finish on the
plant. This has led to tighter controls in these departments also.
Overall knowledge & awareness of wastewater treatment plant has improved
significantly.
A preliminary review of the use of electrolysis to treat waste finish &/or to polish final
effluent was completed. A demonstration was provided by Geomembrane Testing
Services. A laboratory test was conducted on WIL wastewater streams and the

WELLMAN INTERNATIONAL LIMITED.
AER January 2016 - December 2016 59
preliminary results were positive. This will be examined further in terms practicality
and feasibility.
Targets set for 2016
Replace centre well in settlement tank (the old well is corroded and is leading to
blockages within the system.
Trial a DAF system. Determine if it meets expectations in terms of treatment, if
introduced can the biotower be decommissioned, is it financially feasible?
Complete 6σ green-belt project on reducing the volume of highly concentrated
waste finish being generated within the factory.
Determine the practicality & feasibility of pursuing pilot-scale investigation into
the use of electrolysis to treat wastewater streams generated on-site.
Progress made in 2016
The centre well was replaced and this has successfully resulted in a reduction in
blockages.
It was not possible to source to pilot scale DAF to complete this project. Without
completing a pilot scale study it is not possible to determine the suitability of a
DAF system and this project cannot be progressed at this time.
The 6-sigma project was successfully completed. The volume of high with the
load of highly concentrated waste finish being disposed to the wastewater
treatment plant being reduced by 30%.
The success of the six-sigma project has removed the need to investigate
electrolysis at this time.
In 2016 the average COD concentration in the final effluent was 459mg/L and
the average suspended solids concentration was 13mg/L.
Targets set for 2017
Establish a WWTP team with responsibility for establishing ownership structure,
future planning, impact assessments of trials/production plans and setting
objectives and targets.
Six-sigma project on the reduction of finish use in Spinning.
Review options to replace belt press.

WELLMAN INTERNATIONAL LIMITED.
AER January 2016 - December 2016 60
Project No. 2.3: Reduce noise levels from the plant
2.3.1 Relationship to Objectives and Targets
In-line with the company’s objective to reduce noise emissions from the site.
2.3.2 Reason for undertaking project
To ensure that noise levels throughout the site are continuously assessed and that
modifications are made, where practicable, to reduce noise emissions. Although the noise
levels continue to be within the licensable limit, the noise levels at NSL14 at night-time are
close to the limit and it is a main objective of the company to decrease this value where
possible.
2.3.3 Target
Ensure that the night-time limits as specified in the IPPC licence are always met particularly
at N14.
2.3.4 Project summary
Project 2.3 2
0
1
5
2016 2017 2018 2019 2020
Quarter 1 2 3 4 1 2 3 4 1 2 3 4 1 2 3 4 1 2 3 4
Phase 1
Phase 2
Phase 3
Phase 4

WELLMAN INTERNATIONAL LIMITED.
AER January 2016 - December 2016 61
Phase 1:
Set specific annual targets for reducing environmental noise.
This will be reviewed annually in the final quarter.
Phase 2:
Carry out appropriate projects as identified during phase 1.
Phase 3:
Measure noise reductions achieved during each project.
Phase 4:
Assess noise reductions achieved as a result of the implementation of all annual targets.
Particular attention should be paid to noise reductions achieved at NSLs.

WELLMAN INTERNATIONAL LIMITED.
AER January 2016 - December 2016 62
2.3.5 Project implementation
Phase 1: Set specific annual targets for reducing environmental noise
2015 (Potential noise reduction projects identified during Q4, 2015 to be implemented in
2016).
2016 targets
Prepare summary report on Project 2.2 (compare noise results since 2010, list any
correlation with projects completed, include changes to operating conditions that may
counteract achievements Investigate operation of QFT on baler condenser fans (due
to tonal noise detected at N8)
Lag pipework at Silo’s 19 & 20.
Review options to replace tannoy system.
Progress made in 2016
Noise levels at the NSLs had not changed for the duration of the project. The internal
Environmental Impact Assessment that is conducted for major projects ensures that
controls are put in place to ensure there is No negative impact on noise levels.
Lagging of pipework at Silo’s 19 & 20 has not been completed.
The tannoy system has not been replaced.
2017 targets
Lag pipework at Silo’s 19 & 20.
Review options to replace tannoy system.
Investigate operation of QFT on baler condenser fans.
Deliver training/communication program on current noise levels on site, likely impact
of changes to operations and importance of following internal Environmental Impact
Assessment for all projects.
2.3.6 Designation of responsibility
The Managing Director has overall responsibility for this project. The technical department
are responsible for implementing the project.

WELLMAN INTERNATIONAL LIMITED.
AER January 2016 - December 2016 63
Project No. 3.0 Develop a culture of environmental sustainability within the organisation
3.0.1 Relationship to Objectives and Targets
In line with corporate policy on sustainability and environmental
responsibility.
3.0.2 Reason for undertaking project
The project is being undertaken to increase awareness throughout the
organisation of business, corporate and social responsibilities. It will allow
WIL to manage environmental performance with greater understanding of
impact of raw material use and product life cycle analysis. It is also a key
corporate requirement in relation to sustainability and adoption of ISO
14001:2015
3.0.3 Target
Specific targets will be set each year and will be managed through the
objectives & targets programme
3.0.4 Project overview
Project 2.3 2
0
1
5
2016 2017 2018 2019 2020
Quarter 1 2 3 4 1 2 3 4 1 2 3 4 1 2 3 4 1 2 3 4
Phase 1
Phase 2
Phase 3
Phase 4
Phase 1 Dec 2015, 2016, 2017, 2018, 2019

WELLMAN INTERNATIONAL LIMITED.
AER January 2016 - December 2016 64
Set specific targets for improved waste management practices each year.
Phase 2 Mar 2016, 2017, 2018, 2019, 2020
Review all options for meeting targets and evaluate feasibility.
Phase 3 Dec 2016, 2017, 2018, 2019, 2020
Complete approved projects.
Phase 4 Dec 2016, 2017, 2018, 2019, 2020
Evaluate projects.
3.0.5 Project implementation
Phase 1
Dec 2015 (Projects identified in December 2015 for implementation during 2016)
Set-up 5-year project on sustainability
Complete vendor evaluation of WIL suppliers
Dec 2016 (Projects identified in December 2016 for implementation during 2017)
Establish a team with responsibility for managing sustainability planning within the
organisation.
Review corporate sustainability requirements, collate relevant data.
Phase 2
2016
5-Year project on sustainability has been set up
Phase 1 of the vendor evaluation process has been completed - self-assessment forms have been circulated to key vendors.
WELLMAN INTERNATIONAL LIMITED.
AER January 2016 - December 2016 65
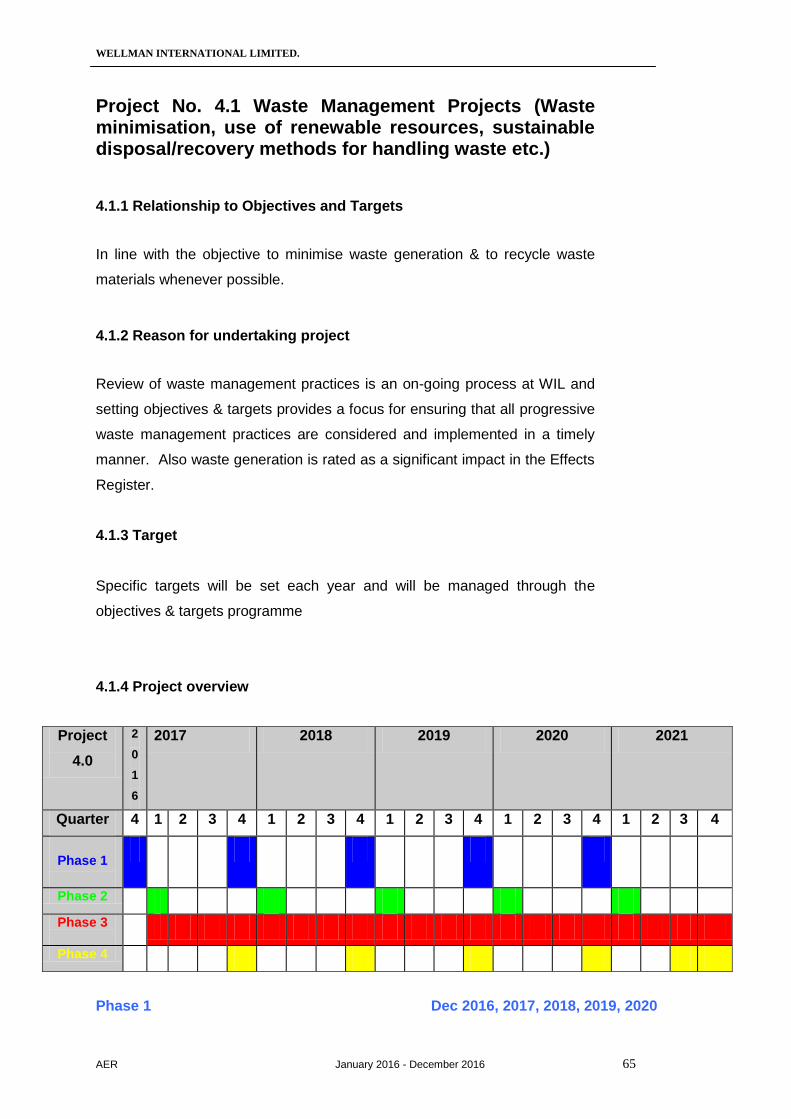
Project No. 4.1 Waste Management Projects (Waste minimisation, use of renewable resources, sustainable disposal/recovery methods for handling waste etc.)
4.1.1 Relationship to Objectives and Targets
In line with the objective to minimise waste generation & to recycle waste
materials whenever possible.
4.1.2 Reason for undertaking project
Review of waste management practices is an on-going process at WIL and
setting objectives & targets provides a focus for ensuring that all progressive
waste management practices are considered and implemented in a timely
manner. Also waste generation is rated as a significant impact in the Effects
Register.
4.1.3 Target
Specific targets will be set each year and will be managed through the
objectives & targets programme
4.1.4 Project overview
Project
4.0
2
0
1
6
2017 2018 2019 2020 2021
Quarter 4 1 2 3 4 1 2 3 4 1 2 3 4 1 2 3 4 1 2 3 4
Phase 1
Phase 2
Phase 3
Phase 4
Phase 1 Dec 2016, 2017, 2018, 2019, 2020

WELLMAN INTERNATIONAL LIMITED.
AER January 2016 - December 2016 66
Set specific targets for improved waste management practices each year.
Phase 2 Mar 2017, 2018, 2019, 2020, 2021
Review all options for meeting targets and evaluate feasibility.
Phase 3 Dec 2017, 2018, 2019, 2020, 2021
Complete approved projects.
Phase 4 Dec 2017, 2018, 2019, 2020, 2021
Evaluate projects.
4.1.5 Project implementation
Phase 1
Dec 2016 (Projects identified in December 2016 for implementation during 2017)
Complete an audit of 2 waste contractors
Implement procedure to remove aerosol from silicone spray cans and render them non-hazardous
Install hot water at IBC wash area to ensure thorough cleaning of IBCs.
4.1.6 Designation of responsibility
The HS & E manager is responsible for the implementation of this project.

WELLMAN INTERNATIONAL LIMITED.
AER January 2016 - December 2016 67
Project No 5.3. Optimisation of energy & water usage
5.3.1 Relationship to Objectives and Targets
In line with the objective to optimise energy efficiency & resource usage.
5.3.2 Reason for undertaking project
Water is one of the main natural resources used on-site. There has been a recent shift to
using well water in conjunction with river water. A water audit has the potential to identify
new projects from which savings can be attained.
5.3.3 Target
Specific targets will be set each year and will be managed through the
objectives & targets programme
2013 targets
Complete water audit/balance for the site
Identify new projects for improved energy efficiency
Progress made in 2013
Water usage is being monitored on a monthly basis. There is a meter on in-coming
water from the river. There is also a meter measuring the portion of river water
going into the factory. Water usage by the boiler can also be monitored. When
there is sufficient data water consumption will be reviewed to determine if there are
any suitable water saving projects.
An independent energy audit was completed by DEVKI Energy Consultants in
December 2013.
2014 targets
Record water consumption on a monthly basis.
Review energy audit and identify suitable energy saving projects.
Progress made in 2014

WELLMAN INTERNATIONAL LIMITED.
AER January 2016 - December 2016 68
Water consumption was recorded throughout the year. The
production processes are similar to previous years, however, the total
volume of water used decreased from 76693m3 in 2013 to 73606m3
in 2015. This is equivalent to using 0.97m3/Ton fibre V’s 0.93m3/Ton
fibre respectively.
Energy saving motors and pumps were sourced for the existing
cooling towers. The energy savings will be evaluated during 2016.
Water and energy usage is considered during the planning phase of
all new projects. Where possible closed-loop systems for water
supply are used for example recycled water is used in the container
washer, the vacuum system on Unit 1 is a closed loop system.
2015 targets
Review Energy Efficiency Regulations and conduct energy audit if
required.
Review options to re-size cooling tower pumps to suit their
application
Progress made in 2015
An energy audit was completed by Independent Energy Consultants
in 2015. The report will be reviewed in 2016.
The Autefa cooling tower pump has been re-sized to suit the
application. Savings made from this project have to be calculated.
2016 targets
Establish an energy team with responsibility for reviewing 2016
Energy Audit and developing, implementing & reviewing an effective
and realistic energy plan.
Up-grade the Cylon energy monitoring system.
Review options to replace existing lights with LED lighting.
Progress made in 2016
The energy audit report was reviewed and a plan for resources and
projects is being compiled. The team will be established in 2017.

WELLMAN INTERNATIONAL LIMITED.
AER January 2016 - December 2016 69
Quotations for up-grading the Cylon energy monitoring system has
been received, work will be completed in 2017.
An option to out-source LED lights to a contractor was investigated
but not deemed feasible. Priority areas will be completed internally in
2017.
2017 targets
Establish an energy team with responsibility for reviewing 2016
Energy Audit and developing, implementing & reviewing an effective
and realistic energy plan.
Up-grade the Cylon energy monitoring system.
Replace existing lights on A, B & C line cutters with LED lighting.
Six sigma project to reduce gas consumption on the final dryers.

WELLMAN INTERNATIONAL LIMITED.
AER January 2016 - December 2016 70
Project No 6.3. Groundwater protection
6.3.1 Relationship to Objectives and Targets
In line with the objective to minimise the potential risk to groundwater from activities on site.
6.3.2 Reason for undertaking project
Following from Project 6.2 further works have been identified to ensure groundwater
protection.
6.3.3 Target
Specific targets will be set each year and will be managed through the
objectives & targets programme
6.3.4 Project overview
Project
6.3
2015 2016 2017 2018 2019
Quarter 1 2 3 4 1 2 3 4 1 2 3 4 1 2 3 4 1 2 3 4
Phase 1
Phase 2
Phase 3
Phase 1 Jan 2015, 2016, 2017, 2018, 2019
Set specific targets for the coming year. The targets should be based on
recommendations from internal audits, external audits, general reviews etc.
Phase 2 Q2 & Q3 2015, 2016, 2017, 2018, 2019
Complete targets as set out during Phase 1
Phase 3 Dec 2015, 2016, 2017, 2018, 2019
Evaluate projects

WELLMAN INTERNATIONAL LIMITED.
AER January 2016 - December 2016 71
6.3.5 Project implementation
2015 targets
Phase II of manhole repairs (front lawn & finishing).
Investigate options to clean up bandsaw area.
Review condition of FWRP & penstock valves. Carry out necessary repairs
Investigate & reduce risk associated with historical oil spill.
Progress made in 2015
Phase II of manhole repairs was completed. The manholes were integrity
tested & certified following the repairs
Options to clean-up bandsaw area were discussed. This project will be carried
over to 2016.
Three rounds of monitoring of existing boreholes in the vicinity of the historical
oil spill were completed in 2015. Results are indicating that natural attenuation
is occurring and that there is little risk of contaminants migrating off-site.
Further investigations will be completed in 2016.
Assessment and refurbishment of FWRPs will be carried over to 2016.
Mobile bunds were integrity tested and certified.
2016 targets
Complete investigation into historic oil spill.
Complete CCTV survey of foul drainage network.
Investigate options to clean up bandsaw area.
Review condition of FWRP & penstock valves. Carry out necessary repairs.
Complete bund register and issue Guidelines for the Use of Bunds.
Progress made in 2016
A CCTV survey of the foul drainage network was completed in 2017. The
drains and manholes are in good condition, with some minor repairs required.
No progress was made on cleaning the bandsaw area. This will be completed
in 2017.
The investigation into the historic oil spill involved hydrogeological testing of
boreholes in the vicinity of the spill on a quarterly basis over a one year period.
It was concluded that the conceptual model for the site holds true The
conceptual model demonstrates that during spells of dry weather the aquifer

WELLMAN INTERNATIONAL LIMITED.
AER January 2016 - December 2016 72
goes dry-ish and where pollutants are present they are detected and following
periods of wet weather the pollutants are diluted It has been recommended that
sampling be completed on an annual basis, to assess the long-term trend in
decreasing pollutants in boreholes across the site.
Bund register has been completed and guidelines issued.
2017 targets
Scope and complete repair works as outlined in 2016 CCTV survey
Investigate options to clean up bandsaw area.
Up-grade floor in Automatic Finish Mixing Area
Complete ‘priority substances’ risk assessment and review procedures
accordingly.
Review options to provide weather protection for out-door chemstore units.
Project evaluation
Overall the risk posed by WIL to groundwater is low. The foul drainage system is in
good condition and is surveyed every three years, there is a program in place for
assessing bunds, chemicals are stored in dedicated storage areas, there is a well-
trained Emergency Response Team on-site to deal with accidental spills and there are
spill-kits located at key locations on-site. The projects/initiatives in 2016 enhance
existing management systems and further reduce risk to groundwater.

WELLMAN INTERNATIONAL LIMITED.
AER January 2016 - December 2016 73
Project No 8.2 Alternative Energy Sources
8.2.1 Relationship to Objectives and Targets
In line with the objective to reduce factory dependence on commercial electricity.
8.2.2 Reason for undertaking project
Project 8.1 was initiated in 2010 however no alternative energy sources have been
introduced due to changes in marketplace, new information and new technologies.
Reducing factory dependence on commercial electricity is still an objective for the
company.
At Wellman International Ltd. over 500kWh of commercial electricity is consumed per
tonne of fibre produced. This equates to an annual usage of almost 40 x 106 kWh with
a significant cost to the business.
A combined heat & power system (CHP) appears to be an attractive option as there is
a significant requirement for steam and heat at the plant.
Due to the location of the factory the use of wind-energy as an alternative energy
supply should be considered.
8.2.3 Target
Specific targets will be set each year and will be managed through the objectives &
targets programme
The overall aim of the project is to reduce the dependence on commercial electricity by
30% (starting from a baseline of 40 x 106 kWh per annum).

WELLMAN INTERNATIONAL LIMITED.
AER January 2016 - December 2016 74
8.2.4 Project overview
Project
8.1
2015 2016 2017 2018 2019
Quarter 1 2 3 4 1 2 3 4 1 2 3 4 1 2 3 4 1 2 3 4
Phase 1
Phase 2
Phase 3
Phase 4
Phase 1 Jan 2015, 2016, 2017, 2018, 2019
Set specific targets for the coming year. The targets should be based on recommendations
from feasibility studies, legislation & initiatives on alternative energy supply etc.
Phase 2 Dec 2015, 2016, 2017, 2018, 2019
Conduct feasibility studies on alternative energy supplies
Prepare planned scope of works for feasible projects
Phase 3 Dec 2017, 2018, 2019
Install alternative energy supplies
Phase 4 Dec 2015, 2016, 2017, 2018, 2019
Evaluate projects
8.2.5 Project implementation
2015 targets
Complete planning & licensing requirement for the implementation of CHP
Progress made in 2015
The project is exempt from planning permission and a Section V notification has been
issued, confirming this. A licence alteration request form was submitted to the EPA and a
licence review was recommended.
A quotation for the licence review has been received, however the feasibility of the
project was queried again and no further actions have been taken.

WELLMAN INTERNATIONAL LIMITED.
AER January 2016 - December 2016 75
2016 targets
Review CHP project again.
Complete licence review if project is deemed feasible.
Progress made in 2016
This project is on-hold.
8.1.6 Designation of responsibility
The Plant Engineer is responsible for the implementation of this project.

WELLMAN INTERNATIONAL LIMITED.
AER January 2016 - December 2016 76
Project No 9.1. Environmental Communications
9.1.1 Relationship to Objectives and Targets
Objectives & targets set to ensure effective communication of policies &
procedures, including ensuring adequate training.
9.1.2 Reason for undertaking project
The project is being undertaken to increase environmental awareness
throughout the organisation (including legal and corporate requirements). It will
allow WIL to optimise environmental performance with the overall objective
being to ensure that all Wellman Employees, contractors, visitors and interested
parties have access to relevant environmental information, that they are aware
of their duties & responsibilities in line with Wellman (& Indorama) policies and
procedures. . It is also a key requirement in relation to sustainability and
adoption of ISO 14001:2015.
9.1.3 Target
Specific targets will be set each year and will be managed through the
objectives & targets programme
9.1.4 Project overview
Project
9.0
2016 2017 2018 2019 2020
Quarter 1 2 3 4 1 2 3 4 1 2 3 4 1 2 3 4 1 2 3 4
Phase 1
Phase 2
Phase 3
Phase 1 Jan 2016, 2017, 2018, 2019, 2020
Set specific targets for the coming year. The targets should be based on recommendations
from internal audits, external audits, general reviews etc.

WELLMAN INTERNATIONAL LIMITED.
AER January 2016 - December 2016 77
9.1.4 Project overview
Phase 1
2016 targets
Set up 5-Year Communications Project
Complete internal auditor training for ISO auditors
Prepare high level environmental training plans for specific roles within the
organisation.
2017 targets
Complete additional internal auditor training
Complete high level training plan – include relevant environmental training
requirements
Review option to integrate emergency response clauses of ISO 14001 and 18001
management systems and related documents.
Review emergency response procedure in relation to firewater management.
Complete a review and gap analysis on the requirements of the new ISO14001:2015,
which will replace the existing standard in 2018.
Establish a team to scope and define the context of the organisation and needs and
expectations of stakeholders in preparation for future ISO 14001:2015 registration.
Investigate the feasibility of providing root cause analysis training for managers and
supervisors.
Review environmental procedures as per 2017 review program.
9.1.5 Project implementation
Progress with 2016 targets
5-Year Communication Project has been set up.
Auditor training for ISO auditing was completed.
High level training template has been completed, the environmental training
requirements may now be filled in.
9.1.6 Designation of responsibility
The HS & E manager is responsible for the implementation of this project.

WELLMAN INTERNATIONAL LIMITED.
AER January 2016 - December 2016 78
Appendix IV

WELLMAN INTERNATIONAL LIMITED.
AER January 2016 - December 2016 79

WELLMAN INTERNATIONAL LIMITED.
AER January 2016 - December 2016 80
Appendix V

WELLMAN INTERNATIONAL LIMITED.
AER January 2016 - December 2016 81
Register of mobile bunds BUND MATRIX
Client:
Wellman International Limited
Date:
23rd
September 2015
Bund Ref No.
Bund Type Construction
Material
Bund Dimensions Bund
Retention
Volume
(m3)
Result of
Hydrostati
c Test
Existin
g New L (cm)
W
(cm) H (cm)
B 02 Portable Plastic 122 61 14 0.1 Pass
B 03 Portable Plastic 25 15 20 0.0075 Pass
B 05 Portable Steel 250 140 20 0.70 Pass
B 09 Portable Steel 125 80 25 0.25 Pass
B 11 Portable Plastic 110 110 30 0.33 Fail
B 12 Portable Steel 200 150 45 1.35 Pass
B 13 Portable Steel 250 140 50 1.95 Fail
B 14 Portable Steel 250 140 50 1.75 Pass
B 15 Portable Steel 235 75 25 0.44 Pass
B 17 Portable Steel 250 140 50 1.75 Pass
B 18 Portable Steel 250 110 20 0.55 Pass
B 19 Portable Steel 250 140 50 1.75 Pass
B 20 Portable Steel 250 140 50 1.75 Pass
B 21 Portable Steel 250 140 50 1.75 Pass
B 22 Portable Steel 250 140 50 1.75 Pass
B 28 Portable Steel 240 160 75 2.88 Pass
B 29 Portable Steel 205 130 60 1.60 Pass
B 30 Portable Steel 200 140 20 0.56 Pass
B 31 Fixed Steel 240 92 86 1.90 Fail
B 33 Portable Steel 250 140 50 1.75 Pass
B 37 Portable Steel 133 125 20 0.33 Pass
CS 38 Portable Steel 250 140 20 0.55 Pass
CS 44 Portable Steel 150 80 25 0.55 Pass
Related Documents