WELLHEAD PROTECTION PLAN FOR THE City of Bertha Nonvulnerable Setting March, 2012

Welcome message from author
This document is posted to help you gain knowledge. Please leave a comment to let me know what you think about it! Share it to your friends and learn new things together.
Transcript

WELLHEAD PROTECTION PLAN FOR THE
City of Bertha
Nonvulnerable Setting
March, 2012
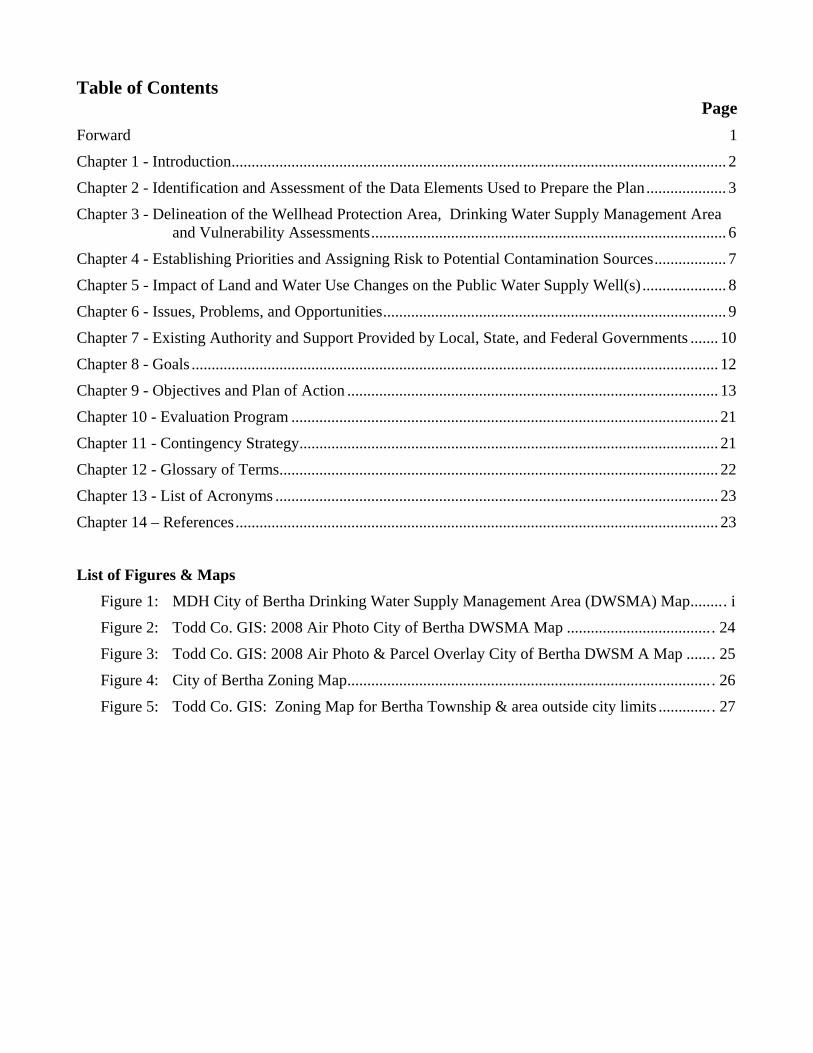
Table of Contents Page
Forward 1
Chapter 1 - Introduction ............................................................................................................................ 2
Chapter 2 - Identification and Assessment of the Data Elements Used to Prepare the Plan .................... 3
Chapter 3 - Delineation of the Wellhead Protection Area, Drinking Water Supply Management Area and Vulnerability Assessments ......................................................................................... 6
Chapter 4 - Establishing Priorities and Assigning Risk to Potential Contamination Sources .................. 7
Chapter 5 - Impact of Land and Water Use Changes on the Public Water Supply Well(s) ..................... 8
Chapter 6 - Issues, Problems, and Opportunities ...................................................................................... 9
Chapter 7 - Existing Authority and Support Provided by Local, State, and Federal Governments ....... 10
Chapter 8 - Goals .................................................................................................................................... 12
Chapter 9 - Objectives and Plan of Action ............................................................................................. 13
Chapter 10 - Evaluation Program ........................................................................................................... 21
Chapter 11 - Contingency Strategy ......................................................................................................... 21
Chapter 12 - Glossary of Terms .............................................................................................................. 22
Chapter 13 - List of Acronyms ............................................................................................................... 23
Chapter 14 – References ......................................................................................................................... 23
List of Figures & Maps
Figure 1: MDH City of Bertha Drinking Water Supply Management Area (DWSMA) Map ........ . i
Figure 2: Todd Co. GIS: 2008 Air Photo City of Bertha DWSMA Map .................................... . 24
Figure 3: Todd Co. GIS: 2008 Air Photo & Parcel Overlay City of Bertha DWSM A Map ...... . 25
Figure 4: City of Bertha Zoning Map ........................................................................................... . 26
Figure 5: Todd Co. GIS: Zoning Map for Bertha Township & area outside city limits ............. . 27
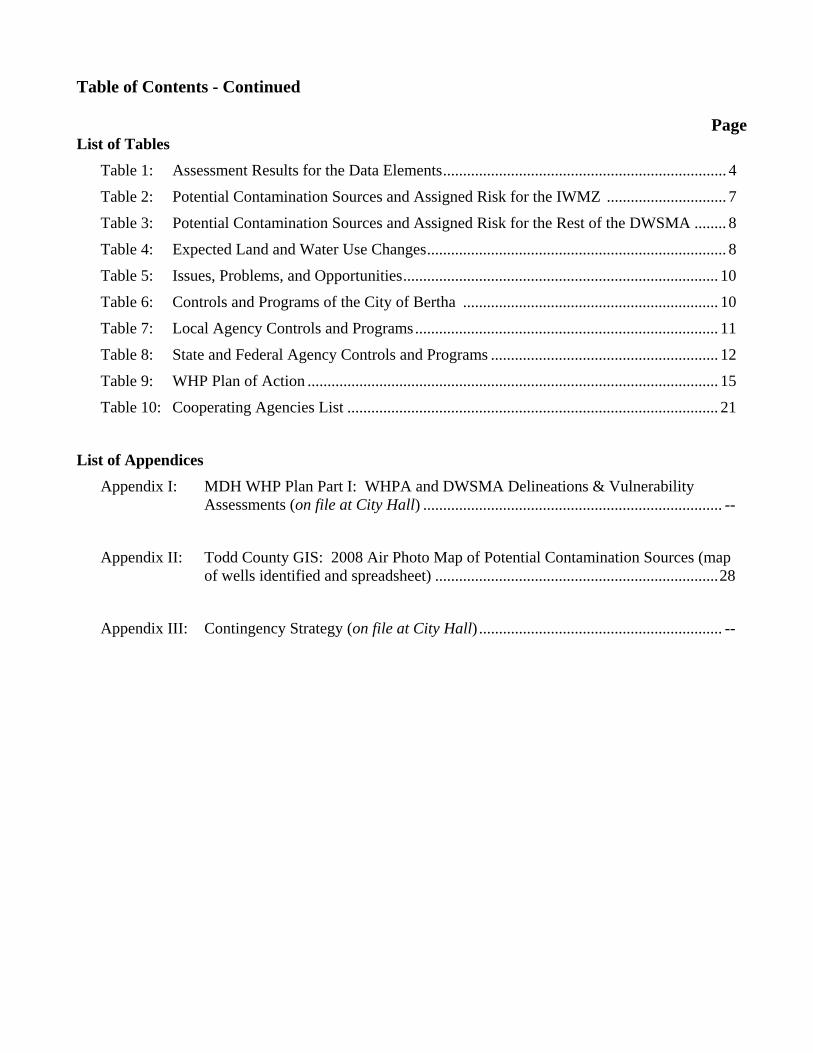
Table of Contents - Continued
Page List of Tables
Table 1: Assessment Results for the Data Elements ....................................................................... 4
Table 2: Potential Contamination Sources and Assigned Risk for the IWMZ .............................. 7
Table 3: Potential Contamination Sources and Assigned Risk for the Rest of the DWSMA ........ 8
Table 4: Expected Land and Water Use Changes ........................................................................... 8
Table 5: Issues, Problems, and Opportunities ............................................................................... 10
Table 6: Controls and Programs of the City of Bertha ................................................................ 10
Table 7: Local Agency Controls and Programs ............................................................................ 11
Table 8: State and Federal Agency Controls and Programs ......................................................... 12
Table 9: WHP Plan of Action ....................................................................................................... 15
Table 10: Cooperating Agencies List ............................................................................................. 21
List of Appendices
Appendix I: MDH WHP Plan Part I: WHPA and DWSMA Delineations & Vulnerability Assessments (on file at City Hall) ........................................................................... --
Appendix II: Todd County GIS: 2008 Air Photo Map of Potential Contamination Sources (map of wells identified and spreadsheet) ....................................................................... 28
Appendix III: Contingency Strategy (on file at City Hall) ............................................................. --

Figure 1

1
Forward This document presents the amended and updated wellhead protection (WHP) plan for the City of Bertha that will help provide for an adequate and safe drinking water supply for community residents. It contains the following components:
Assessment of the data elements used to prepare the plan;
Delineation of the wellhead protection area;
Delineation of the drinking water supply management area;
Assessments of well and drinking water supply management area vulnerability;
Impact of land and water use changes on the public water supply well(s) used by the water supplier;
Issues, problems, and opportunities affecting the well(s), well water, and the drinking water supply management area;
Wellhead protection goals for this plan;
Objectives and plan of action for achieving the wellhead protection goals;
Evaluation program for assessing the effectiveness of this plan; and
Contingency strategy to address an interruption of the water supply.
Water Supply Wells Included in This Plan
Unique Number Well Name or Number Use/Status1
240649 Well # 2 Primary 603142 Well # 3 Primary
1P = Primary Water Supply Well, E = Emergency Backup Well, S = Seasonal Well
WHP Plan Manager Adam Templin P.O. Box 65,
City of Bertha, MN 56437-0065
WHP Team Members Adam Templin, Utilities Superintendent, City of Bertha
Shaun Nelson, Maintenance, City of Bertha Janet Umland, Clerk, City of Bertha Dean Klebs, Mayor, City of Bertha
Steve Kuhnke, Chairman, Bertha Township Byron Hartung, Supervisor, Bertha Township
Kelly Messer, City Resident Amy Piekarski, Water Planner, Todd County Soil & Water Conservation District
Garry Johanson, Administrator, Todd County Planning & Zoning
Written By Gail Haglund, Hydrologist, Minnesota Department of Health Mark Wettlaufer, Planner, Minnesota Department of Health

2
Chapter 1 - Introduction 1.1 Background The wellhead protection (WHP) plan for the City of Bertha is being amended in cooperation with the Minnesota Department of Health (MDH). The second part of the city’s original WHP Plan was approved by MDH in December 7, 2001. The State WHP Rule requires community water suppliers to amend their plan every 10 years (starting in year 8) so that the plan remains current and reflects any changes to the public water supply system, land use, contaminant issues, etc. that may have occurred during the time the original WHP plan was it place. WHP plans are amended to keep up with both new challenges and new opportunities to protect the public water supply wells and aquifer used by the city. This plan contains specific actions that the city will take to fulfill WHP requirements that are specified under Minnesota Rules, part 4720.5510 to 4720.5590. Also, the support that Minnesota state agencies, federal agencies, Todd County and others will provide is presented to identify their roles in protecting the city’s drinking water supply. The plan is effective for 10 years after the approval date specified by MDH and the city is responsible for implementing its WHP plan of action, as described in Table 9 of this report. Furthermore, the city will evaluate the status of plan implementation at least every two-and-one-half years to identify whether its WHP plan is being implemented on schedule. 1.2 Plan Appendices Much of the technical information that was used to prepare this plan is contained in the appendices but is summarized in the main body of this plan. In particular:
Appendix I contains the first part of the plan, consisting of the delineation of the wellhead protection area (WHPA), the drinking water supply management area (DWSMA), and the vulnerability assessments for the public water supply well(s) and the DWSMA. This part of the plan is summarized in Chapter 3.
Appendix II contains the inventory of potential contamination sources. This inventory is discussed in Chapter 4 in terms of assigning risk to the city’s water supply and is also discussed in Chapter 6, relating to issues, problems or opportunities.
Appendix III contains the contingency strategy to provide for an alternate water supply if there is a disruption caused by contamination or mechanical failure. This information is discussed in Chapter 11.
1.3 Plan Development Milestones: Scoping Two Meeting Held December 7, 2011 (4720.5340, Subp. 1) Scoping Two Letter Dated December 29, 2011 (4720.5340, Subp. 2) WHP Management Plan Submitted to March 14, 2012 Local Units of Government (LGU’s) (4720.5340, Subp. 1) WHP Management Plan Review Received from LGU’s May 14, 2012 (4720.5350, Subp. 2

3
Management Plan Review Comments Considered May 14, 2012 (4720.5350, Subp. 3) Public Hearing Conducted May 14, 2012 (4720.5350, Subp. 4) WHP Management Plan Submitted to MDH June 14, 2012 (4720.5360, Subp. 1) Final WHP Plan Review & Notice September 14, 2012 (4720. 5360, Subp. 4)
Chapter 2 - Identification and Assessment of the Data Elements Used to Prepare the Plan The data elements that are included in this plan were used to delineate the WHPA and the DWSMA and to assess DWSMA and well vulnerability and document the need for the WHP measures that will be implemented to help protect the city’s water supply from potential sources of contamination. The city met with representatives from MDH on two occasions to discuss data elements that are specified in Minnesota Rules, part 4720.5400, for preparing a WHP plan. (See Part I of the WHP Plan in Appendix I for more information.) The first scoping meeting, held on March 24, 2011 addressed the data elements that were needed to support the delineation of the WHPA, the DWSMA, and the well(s) and DWSMA vulnerability assessments. The second scoping meeting, held on December 7, 2011 discussed the data elements required to 1) identify potential risks to the public water supply and 2) develop effective management strategies to protect the public water supply in relation to well and DWSMA vulnerability. The results of each meeting were communicated to the city by MDH through a formal scoping decision notice. Not all of the data elements listed in the WHP rule had to be addressed in the WHP plan because of the nonvulnerable nature of the city’s source of drinking water. The following table presents the data element assessment results relative to the overall impact that each data element has on the four items listed. Table 1 is the assessment of the present and future implications of the data elements on the four planning activities. The data elements that are marked high (H) are considered to have a direct implication or impact on the activity. Data elements that have an indirect or marginal impact on an activity are shown as moderate (M). A data element that has little if any impact is shown as low (L). The source of the data is shown under “Data Source.” The “Availability of Data” is “Yes” if planning needs are met and “No” if they are not.

4
Table 1 - Assessment Results for the Data Elements The data elements that are shaded are not required because of the nonvulnerable setting but are included in the table for information purposes only.
Data Element
Present and Future Implications
Data Source
Use
of
the
Wel
l (s)
Del
inea
tion
C
rite
ria
Qu
alit
y an
d
Qu
anti
ty o
f W
ell W
ater
Lan
d a
nd
grou
ndw
ater
U
se in
D
WSM
A
Precipitation MN Climatology Office Geology Maps and geologic descriptions M H M H MGS, DNR, USGS, Consultant Reports
Subsurface data H H H H MGS, MDH, MPCA, DNR, MDA Borehole geophysics H H L H MGS, Consultant Reports Surface geophysics M M L M DNR, MPCA, Consultant Reports Maps and soil descriptions NRCS Eroding lands NRCS Soils Maps and soil descriptions Eroding lands Water Resources Watershed units DNR, USGS List of public waters DNR Shoreland classifications DNR Wetlands map LMIC Floodplain map FEMA Land Use Parcel boundaries map L H L H County Political boundaries map L H L L County PLS map L H L L City, MGEO
Land use map and inventory H L H H Sanborn Fire Maps, Historical Society, City Records, County
Comprehensive land use map M L H H City, County Zoning map M L H H City, County Public Utility Services Transportation routes and corridors
Storm/sanitary sewers and PWS system map City
Oil and gas pipelines map LMIC Public drainage systems map or list County, LMIC
Records of well construction, maintenance, and use H H H M City, CWI, MDH files
Surface Water Quantity Stream flow data L L L L DNR, USGS, Metro Council Ordinary high water mark data DNR
Permitted withdrawals DNR

5
Data Element
Present and Future Implications
Data Source
Use
of
the
Wel
l (s)
Del
inea
tion
C
rite
ria
Qu
alit
y an
d
Qu
anti
ty o
f W
ell W
ater
Lan
d a
nd
grou
ndw
ater
U
se in
D
WSM
A
Protected levels/flows DNR Water use conflicts DNR Groundwater Quantity Permitted withdrawals H H H H DNR Groundwater use conflicts M M H H DNR Water levels H H H M DNR, MPCA, MDA, MDH, City Surface Water Quality Stream and lake water quality management classification DNR
Monitoring data summary MPCA, SWCD, WSD/WMO Groundwater Quality Monitoring data H H H H MPCA, MDH Isotopic data M M M M MDH Tracer studies M M M M Not Available (default description) Contamination site data MPCA, MDA Property audit data from contamination sites City, MPCA
MPCA and MDA spills/release reports City, MPCA

6
Chapter 3 - Delineation of the Wellhead Protection Area, Drinking Water Supply Management Area and Vulnerability Assessments A detailed description of the process used for 1) delineating the WHPA and the DWSMA, and 2) preparing the vulnerability assessments of the city water supply well(s) and DWSMA is presented in the first part of the WHP Plan and included in Appendix I. The City of Bertha requested that MDH do this work and it was performed by Gail Haglund who is licensed as a geoscientist by the State of Minnesota. 3.1 WHPA and DWSMA Delineation Figure 1 shows the boundaries of the WHPA and the DWSMA. The WHPA was delineated using computer simulations of groundwater movement to generate the underground capture zones for city Wells 2 (Unique No. 240649), 3 (Unique No. 603142). The DWSMA boundaries were designated using the following criteria:
Center-lines of highways, streets, roads, or railroad rights-of-ways;
Public Land Survey coordinates;
Property or fence lines;
Center-lines of public drainage systems;
Public utility service lines, and
Political boundaries. 3.2 Well Vulnerability Assessment The construction and water quality obtained from each primary well used by the City of Bertha is included in the assessment of well vulnerability. The vulnerability of the city wells is considered low because they are constructed so that each well is adequately sealed into the borehole and does not pump water that contains human-caused contaminants. 3.3 DWSMA Vulnerability Assessment The low vulnerability assigned to the DWSMA (Figure 1) was determined using geologic, soils, and groundwater chemistry information and indicates that at least 10 feet of clay-rich geological material covers the source water aquifer. (See Part I of the WHP Plan in Appendix 1)

7
Chapter 4 - Establishing Priorities and Assigning Risk to Potential Contamination Sources
The types of potential contamination sources that may exist within the DWSMA were derived from the information collected to satisfy the data element requirements (Chapter 2). The impact assigned to each data element as part of the assessment process (Table 1) was used to assess the types of potential contamination sources that may present a risk to the city’s drinking water supply. The low vulnerability assessment for the DWSMA indicates that, generally, only wells, other types of boreholes, excavations that may reach the aquifer, and certain types of Environmental Protection Agency Class V Wells are likely to impact the city wells.
4.1 Contaminants of Concern None of the human-caused contaminants regulated under the federal Safe Drinking Water Act have been detected at levels indicating that any well itself serves to draw contaminants into the aquifer as a result of pumping. Iron and manganese are naturally occurring contaminants found in the City of Bertha’s water supply. Their presence indicates that the aquifer receives recharge over a long time period and is not likely to be directly impacted by land uses. The City of Bertha is in the process of upgrading their water treatment plant to better sequester iron and manganese from their water supply. 4.2 Inventory Results and Risk Assessment A map and description of the locations of potential contamination sources (wells) is presented in Appendix II. A summary of the results for the IWMZ is listed in Table 2 and Table 3 presents these results for the remainder of the DWSMA. The priority assigned to each type of potential contamination source addresses 1) the number inventoried, 2) its proximity to a city well, 3) the capability of local geologic conditions to absorb a contaminant, 4) the effectiveness of existing regulatory controls, 5) the time required for the City of Bertha to obtain cooperation from governmental agencies that regulate it, and 6) the administrative, legal, technical, and financial resources needed. A high (H) risk potential implies that the potential source type has the greatest likelihood to negatively impact the city’s water supply and should receive highest priority for management. A low (L) risk potential implies that a lower priority for implementing management measures is assigned.
Table 2 - Potential Contamination Sources and Assigned Risk for the IWMZ
Source Type Total Level of Risk
City Well # 1 (Unique # 220423 was sealed in
1998; MDH Sealing Record # HO141074)
1
L
8
Table 3 - Potential Contamination Sources and Assigned Risk for the Rest of the DWSMA
Potential Source Type Total
Number
Number Within Emergency Response
Area and Level of Risk
Number Within Remainder of the
DWSMA and Level of Risk
Monitoring Well 1 0 1 L Domestic Wells 4 0 - 4 L
Not in use former Creamery Well* 1 0 - - -
(* Note: The unused unsealed creamery well noted above is a former interconnect to the city water supply and is just outside of the boundary of the DWSMA.)
Chapter 5 - Impact of Land and Water Use Changes on the Public Water Supply Well(s) The city estimates that the following changes to the physical environment, land use, surface water, and groundwater may occur over the 10-year period that the WHP plan is in effect (Table 4). This is needed to determine whether new potential sources of contamination may be introduced in the future and to identify future actions for addressing these anticipated sources. Land and water use changes may introduce new contamination sources or result in changes to groundwater use and quality. The anticipated changes may occur within the jurisdictional authority of the city, although some may not. Table 4 describes the anticipated changes to the physical environment, land use, and surface water or groundwater in relationship to the 1) influence that existing governmental land and water programs and regulations may have on the anticipated change, and 2) administrative, technical, and financial considerations of the City of Bertha and property owners within the DWSMA.
Table 4 - Expected Land and Water Use Changes
Expected Change (Physical Environment,
Land Use, Surface Water, Groundwater)
Impact of the Expected Change On the Source
Water Aquifer
Influence of Existing Government Programs and Regulations on the
Expected Change
Administrative, Technical, and Financial
Considerations Due to the Expected Change
Physical Environment: No Changes in the physical environment are anticipated in the Bertha DWSMA that would impact the low vulnerable aquifer & PWS Wells.
None anticipated at this time. None anticipated at this time. None anticipated at this time.
Land Use: No major changes in land use in the DWSMA are anticipated. Some homes may be built in the NE part of the City. In 2012, the city is replacing water mains & building a new water treatment plant. These changes may result in a slight increase in water use.
Potential for slight increase in water use.
City hook up requirements require use of the water system if new homes or businesses are constructed in the City / DWSMA in close proximity to the water distribution system..
None anticipated at this time.

9
Surface Water: Not Applicable to NV PWS.
Not applicable Not applicable Not applicable
Groundwater: No major changes in land use or water use are anticipated. No changes in the pumping of the existing city wells or new high capacity wells in the DWSMA were identified at this time.
None anticipated at this time. None anticipated at this time. None anticipated at this time.
Chapter 6 - Issues, Problems, and Opportunities 6.1 Identification of Issues, Problems and Opportunities The City of Bertha has identified water and land use issues and problems and opportunities related to the aquifer used by the city water supply wells, the quality of the well water, or land or water use within the DWSMA. The city assessed input from public meetings and written comments it received, the data elements identified by MDH during the scoping meetings, and the status and adequacy of the city’s official controls and plans on land and water uses, in addition to those of local, state, and federal government programs. The results of this effort are presented in the following table, which defines the nature and magnitude of contaminant source management issues in the city’s DWSMA. Identifying issues, problems and opportunities, including resource needs, enables the city to take advantage of opportunities that may be available to make effective use of existing resources, set meaningful priorities for source management and solicit support for implementing specific source management strategies. 6.2 Comments Received There have been several occasions for local governments, state agencies, and the general public to identify issues and comment on the city’s WHP plan. At the beginning of the planning process, local units of government were notified that the city was going to develop its WHP plan and were given the opportunity to identify issues and comment. A public information meeting was held to review the results of the delineation of the wellhead protection area, DWSMA, and the vulnerability assessments. The meetings of the city’s wellhead protection team were open to the public. Also, a public hearing was held before the completed WHP plan was sent to MDH for state agency review and approval. At this time, no comments have been received on the Bertha WHP Plan.
10
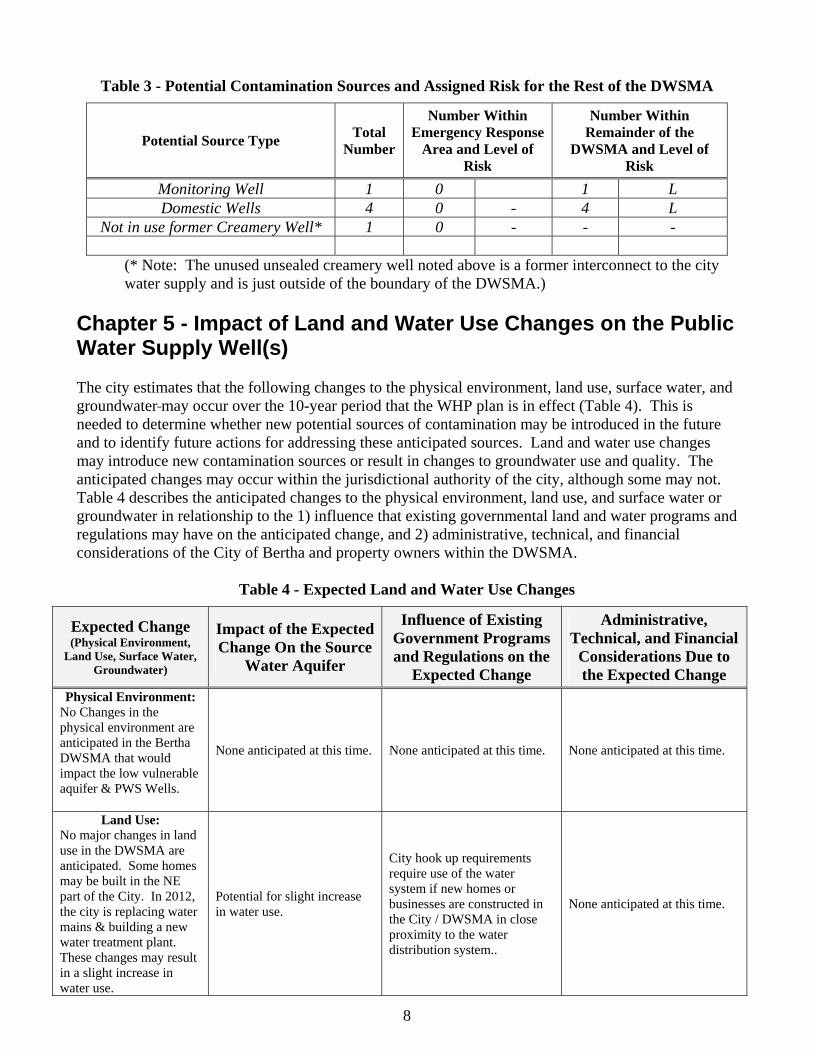
Table 5 - Issues, Problems, and Opportunities
Issue Identified Impacted Feature
Problem Associated with the
Identified Issue
Opportunity Associated with the
Identified Issue
Adequacy of Existing Controls to Address
the Issue
Well # 2 is 3’ within the R.O.W. of State Hwy. 71. (R.O.W. is 165’ wide from Center.)
Public Water Supply Well may be impacted by MNDOT road work or potential accidents.
Potential damage to the well casing could allow potential contaminants to enter the aquifer and impact the city water supply.
Make MNDOT, local responders aware of well locations & take precautions when working in this area. City moves well out of R.O.W. if well needs to be replaced in the future.
City has no authority over MNDOT R.O.W.
The Bertha High School may construct an irrigation well.
Increased pumping and use of the aquifer.
Increased pumping may potentially impact the aquifer
Encourage use of the city water supply to the extent practical. If the school constructs the irrigation well, encourage water use conservation & protection of the well itself.
The City does not have authority to prohibit the construction of the well. Physical construction of the well is regulated by MDH. DNR issues appropriation permit to regulate water use.
Chapter 7 - Existing Authority and Support Provided by Local, State, and Federal Governments In addition to its own controls, the City of Bertha will rely upon partnerships formed with local units of government, state agencies, and federal agencies with regulatory controls or resource management programs in place to help implement its WHP plan. The level of support that a local, state, and federal agency can provide depends on its legal authority, as well as the resources available to local governments. 7.1 Existing Controls and Programs of the City of Bertha Table 6 shows the legal controls and/or programs that the city has identified to support the management of potential contamination sources within the DWSMA.
Table 6 - Controls and Programs of the City of Bertha
Type of Control Program Description
City of Bertha: Land Use Control Ordinance and Building Permits
Protects the Health, Safety and General Welfare of the community through good planning. Reduces conflicts between different land uses and provides an opportunity to establish standards and guidelines to offset potential risk posed by a land use and / or improper construction practices.
City of Bertha: Hook up requirements to the water supply system and cross connection program
Increases the use and support of city infrastructure. Reduces the risk that poor management of wells will become a pathway for contaminants and the pumping of other wells will impact contaminant movement to the city wells.

11
7.2 Local Government Controls and Programs The following departments or programs within Todd County may be able to assist the city with issues relating to potential contamination sources that 1) have been inventoried or 2) may result from changes in land and water use within the DWSMA:
Table 7 - Local Agency Controls and Programs
Government Unit
Name of Control/Program Program Description
Bertha Township
Land Use Control Ordinance
Protects the health and safety of township residents through good planning. Establishes land use zoning districts to reduce conflicts between land uses. Provides a local opportunity to establish standards and guidelines to offset potential risk of some land uses.
Todd County
Land Use Control Ordinances
Same as above. Provides support and overall framework for land use planning in the County.
Todd County
& SWCD
Water Management Plan
Provides mechanism to set local water resource planning priorities in Todd County. Helps coordinate local resources to address priority surface and groundwater protection
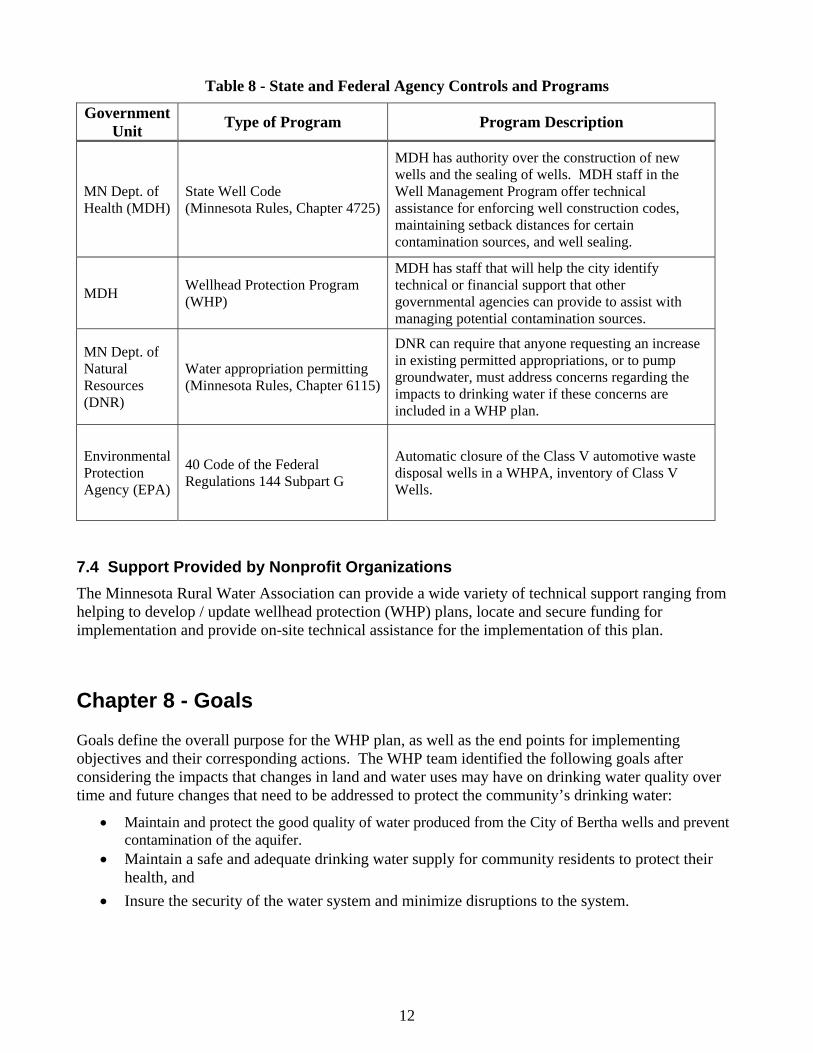
7.3 State Agency and Federal Agency Support MDH will serve as the contact for enlisting the support of other state agencies on a case-by-case basis regarding technical or regulatory support that may be applied to the management of potential contamination sources. Participation by other state agencies and the federal government is based on legal authority granted to them and resource availability. Furthermore, MDH administers state regulations that affect specific potential sources of contamination and can provide technical assistance to property owners to comply with these regulations. The following table identifies the specific regulatory programs or technical assistance that state and federal agencies may provide to the City of Bertha to support implementation of the WHP plan. It is likely that other opportunities for assistance may be available over the 10-year period that the plan is in effect due to changes in legal authority or increases in funding granted to state and federal agencies. Therefore, the table references opportunities available when the city’s WHP plan was first approved by MDH.
12
Table 8 - State and Federal Agency Controls and Programs
Government Unit
Type of Program Program Description
MN Dept. of Health (MDH)
State Well Code (Minnesota Rules, Chapter 4725)
MDH has authority over the construction of new wells and the sealing of wells. MDH staff in the Well Management Program offer technical assistance for enforcing well construction codes, maintaining setback distances for certain contamination sources, and well sealing.
MDH Wellhead Protection Program (WHP)
MDH has staff that will help the city identify technical or financial support that other governmental agencies can provide to assist with managing potential contamination sources.
MN Dept. of Natural Resources (DNR)
Water appropriation permitting (Minnesota Rules, Chapter 6115)
DNR can require that anyone requesting an increase in existing permitted appropriations, or to pump groundwater, must address concerns regarding the impacts to drinking water if these concerns are included in a WHP plan.
Environmental Protection Agency (EPA)
40 Code of the Federal Regulations 144 Subpart G
Automatic closure of the Class V automotive waste disposal wells in a WHPA, inventory of Class V Wells.
7.4 Support Provided by Nonprofit Organizations
The Minnesota Rural Water Association can provide a wide variety of technical support ranging from helping to develop / update wellhead protection (WHP) plans, locate and secure funding for implementation and provide on-site technical assistance for the implementation of this plan.
Chapter 8 - Goals Goals define the overall purpose for the WHP plan, as well as the end points for implementing objectives and their corresponding actions. The WHP team identified the following goals after considering the impacts that changes in land and water uses may have on drinking water quality over time and future changes that need to be addressed to protect the community’s drinking water:
Maintain and protect the good quality of water produced from the City of Bertha wells and prevent contamination of the aquifer.
Maintain a safe and adequate drinking water supply for community residents to protect their health, and
Insure the security of the water system and minimize disruptions to the system.

13
Chapter 9 - Objectives and Plan of Action Objectives provide the focus for ensuring that the goals of the WHP plan are met and that priority is given to specific actions that support multiple outcomes of plan implementation. Both the objectives and the wellhead protection measures (actions) that support them are based on assessing 1) the data elements (Chapter 2), 2) the potential contaminant source inventory (Chapter 4), 3) the impacts that changes in land and water use present (Chapter 5) and 4) issues, problems, and opportunities referenced to administrative, financial, and technical considerations (Chapter 6). 9.1 Objectives The following objectives have been identified to support the goals of the WHP plan for the City of Bertha:
1. Create awareness and general knowledge about the importance of WHP in the City of Bertha and among Bertha Township residents located in the DWSMA.
2. Manage the Inner Wellhead Management Zone to prevent contamination of the aquifer near the public supply wells.
3. Promote proper well management (Sealing of wells and proper well management practices to landowners with private wells.)
4. Gather additional well and aquifer information as opportunities arise to better understand aquifer characteristics in the Bertha area.
5. Track and report WHP implementation efforts to the City Council and MDH. 6. Participate in WHP Meetings with local resource staff (Todd County SWCD & D, MDH, MRWA)
to keep current on WHP issues and discuss plan implementation activities and efforts identified. 7. Keep the Emergency / Contigency plan up to date to be prepared for a potential disruption of
the water distribution system. 9.2 WHP Measures and Action Plan Based upon the factors, the WHP team has identified WHP measures that will be implemented by the city over the 10-year period that its WHP plan is in effect. The objective that each measure supports is noted as well as the lead party and any cooperators, the anticipated cost for implementing the measure and the year or years in which it will be implemented. The following categories are used to further clarify the focus that each WHP measure provides, in addition to helping organize the measures listed in the action plan:
A. WHP Education B. Well Management C. Spill Prevention and Contigency Planning D. Data Collection E. WHP Planning, Coordination & Reporting

14
9.3 Establishing Priorities WHP measures reflect the administrative, financial, and technical requirements needed to address the risk to water quality or quantity presented by each type of potential contamination source. Not all of these measures can be implemented at the same time, so the WHP team assigned a priority to each. A number of factors must be considered when WHP action items are selected and prioritized (part 4720.5250, subpart 3):
Contamination of the public water supply wells by substances that exceed federal drinking water standards.
Quantifiable levels of contamination resulting from human activity.
The location of potential contaminant sources relative to the wells.
The number of each potential contaminant source identified and the nature of the potential contaminant associated with each source.
The capability of the geologic material to absorb a contaminant.
The effectiveness of existing controls.
The time needed to acquire cooperation from other agencies and cooperators.
The resources needed, i.e., staff, money, time, legal, and technical resources. The City of Bertha assigned priority rank for WHP measures below. The following table lists each measure that will be implemented over the 10-year period that the city’s WHP plan is in effect, including the priority assigned to each measure.
15
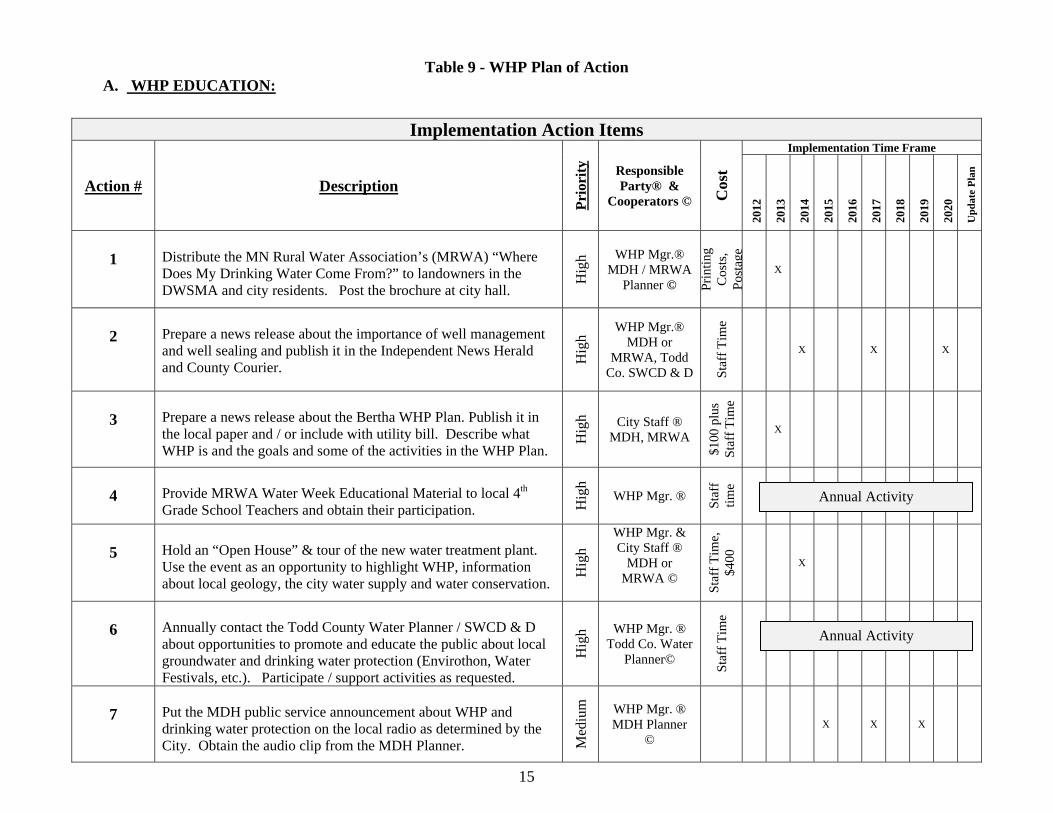
Table 9 - WHP Plan of Action A. WHP EDUCATION:
Implementation Action Items
Action # Description
Pri
orit
y Responsible Party® &
Cooperators © Cos
t
Implementation Time Frame
2012
2013
2014
2015
2016
2017
2018
2019
2020
Up
dat
e P
lan
1
Distribute the MN Rural Water Association’s (MRWA) “Where Does My Drinking Water Come From?” to landowners in the DWSMA and city residents. Post the brochure at city hall.
Hig
h
WHP Mgr.®
MDH / MRWA Planner ©
Pri
ntin
g C
osts
, P
osta
ge
X
2
Prepare a news release about the importance of well management and well sealing and publish it in the Independent News Herald and County Courier.
Hig
h
WHP Mgr.® MDH or
MRWA, Todd Co. SWCD & D S
taff
Tim
e
X X X
3
Prepare a news release about the Bertha WHP Plan. Publish it in the local paper and / or include with utility bill. Describe what WHP is and the goals and some of the activities in the WHP Plan.
Hig
h City Staff ® MDH, MRWA
$100
plu
s S
taff
Tim
e
X
4
Provide MRWA Water Week Educational Material to local 4th Grade School Teachers and obtain their participation. H
igh
WHP Mgr. ®
Sta
ff
tim
e
5
Hold an “Open House” & tour of the new water treatment plant. Use the event as an opportunity to highlight WHP, information about local geology, the city water supply and water conservation.
Hig
h
WHP Mgr. & City Staff ®
MDH or MRWA ©
Sta
ff T
ime,
$4
00
X
6
Annually contact the Todd County Water Planner / SWCD & D about opportunities to promote and educate the public about local groundwater and drinking water protection (Envirothon, Water Festivals, etc.). Participate / support activities as requested.
Hig
h WHP Mgr. ® Todd Co. Water
Planner©
Sta
ff T
ime
7
Put the MDH public service announcement about WHP and drinking water protection on the local radio as determined by the City. Obtain the audio clip from the MDH Planner. M
ediu
m
WHP Mgr. ® MDH Planner
© X X X
Annual Activity
Annual Activity

16
B. WELL MANAGEMENT
Implementation Action Items
Action # Description
Pri
orit
y
Responsible Party ® &
Cooperators © Cos
t
Implementation Time Frame
2012
2013
2014
2015
2016
2017
2018
2019
2020
Up
dat
e P
lan
Municipal Well Management : Inner Zone Management Activities (200’ radius of public water supply wells)
1
City staff will monitor for new potential contaminant sources and setback requirements within the IMMZ (200’) of the PWS wells. If new contaminant sources are identified, staff will take steps needed to protect the public water supply wells. V
ery
Hig
h
WHP Mgr.® City Utility
Staff ©
Sta
ff T
ime
X X X X X X X X X X
2
City Utility staff will assist MDH in updating the IWMZ survey form every 3-5 years for all public supply wells. H
igh City Staff ®
MDH S
taff
T
ime
X X X
3
Maintain existing area around the city wells as open space to provide long term protection of the city wells & water supply. Remind council on the importance to protect area.
Hig
h WHP Mgr.® City Council
Sta
ff T
ime
X X X X X X X X X
4
Send MNDOT a map of the DWSMA and remind them of the locations of the city wells near the R.O.W. and to take precautions when working near the city wells.
Hig
h WHP Mgr. ® MNDOT ©
X
Municipal Well Management: Seal Former Creamery Well
5
Seal former Creamery well that had been used as an inter-connect and back up water supply for the City of Bertha that is currently not in use. Apply for grant funds to help reduce costs to seal the well.
Ver
y H
igh WHP Mgr. ®
SWCD & D, MDH/MRWA
© seal
ing
cost
s un
know
n
X

17
WELL MANAGEMENT, Continued
Implementation Action Items
Action # Description
Pri
orit
y
Responsible Party ® &
Cooperators © Cos
t
Implementation Time Frame
2012
2013
2014
2015
2016
2017
2018
2019
2020
Up
dat
e P
lan
Class V Wells:
6
Step 1: Identify any potential automotive Class V wells in the DWSMA. Step 2: If a Class V Well is identified, work with MDH Planner to provide the property owner with management or permitting options.
Hig
h
WHP Mgr. ® MDH ©
Sta
ff T
ime
Private Well Management:
7
Provide information on the proper management and sealing of wells to landowners in the DWSMA and why this is important. Keep MDH private well management information on file at city hall for future use and promotion.
Hig
h
WHP Mgr., City Staff ®
MDH, MRWA, Todd Co.
SWCD & D ©
Sta
ff T
ime
X X
8
Provide Bertha Twp. Planning & Zoning staff information about managing and sealing wells and why this is important to promote to landowners in the DWSMA and township.
Med
ium
WHP Mgr., City Staff ®
Twp.©
Sta
ff T
ime
X
9
Contact the Todd County SWCD / Water Planner about the availability of well sealing cost share funds and provide this information to landowners in the DWSMA. Ver
y H
igh City Staff ®
Todd Co. Water Planner, SWCD& D © S
taff
Tim
e
X X
This measure describes the importance of identifying a “Class V Well” and steps to take if one is identified.

18
WELL MANAGEMENT, Continued
Implementation Action Items
Action # Description
Pri
orit
y
Responsible Party ® &
Cooperators © Cos
t
Implementation Time Frame
2012
2013
2014
2015
2016
2017
2018
2019
2020
Up
dat
e P
lan
High Capacity Wells:
10
Step. 1: Identify any new high capacity well that is proposed for construction in or within one mile of the DWSMA. Step 2: If a high capacity well is identified: contact MDH Hydrologist to evaluate the effect that proposed pumping may have on the boundaries of the delineated WHP area, and work with MDH Hydrologist, DNR and high capacity well owner to minimize potential impacts that pumping may have on water quantity or quality of the public water supply.
Ver
y H
igh
WHP Mgr. ® MDH, DNR ©
Sta
ff T
ime
11
Work with the Bertha School District to encourage the use of the water supply system. However if an irrigation well is to be constructed in the future, work with them on the placement, management and use of the well to the extent practical so it does not impact the city water supply wells or aquifer.
Ver
y H
igh
WHP Mgr. ® MDH, DNR
This measure describes the importance of identifying a “High Capacity Well” in or within 1 mile of the DWSMA, and steps to take if one is identified.
As Needed
19
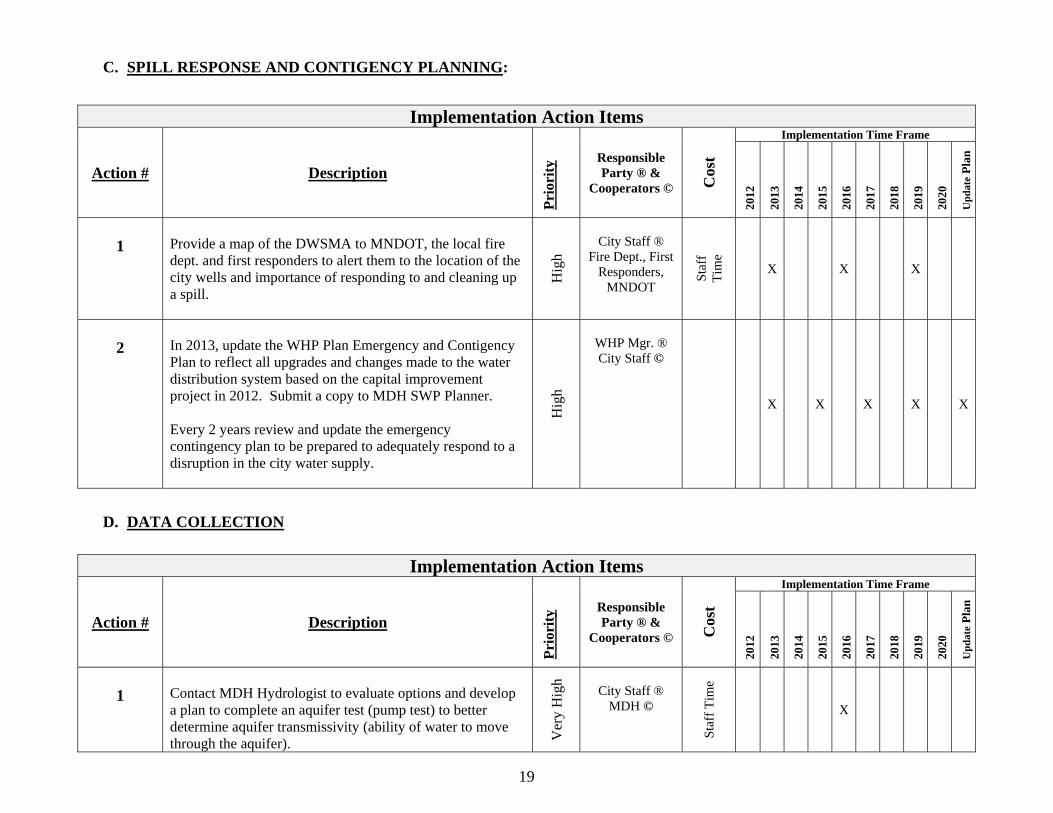
C. SPILL RESPONSE AND CONTIGENCY PLANNING:
Implementation Action Items
Action # Description
Pri
orit
y
Responsible Party ® &
Cooperators © Cos
t
Implementation Time Frame
2012
2013
2014
2015
2016
2017
2018
2019
2020
Up
dat
e P
lan
1
Provide a map of the DWSMA to MNDOT, the local fire dept. and first responders to alert them to the location of the city wells and importance of responding to and cleaning up a spill.
Hig
h
City Staff ®
Fire Dept., First Responders,
MNDOT
Sta
ff
Tim
e
X X
X
2
In 2013, update the WHP Plan Emergency and Contigency Plan to reflect all upgrades and changes made to the water distribution system based on the capital improvement project in 2012. Submit a copy to MDH SWP Planner. Every 2 years review and update the emergency contingency plan to be prepared to adequately respond to a disruption in the city water supply.
Hig
h
WHP Mgr. ® City Staff ©
X X X X X
D. DATA COLLECTION
Implementation Action Items
Action # Description
Pri
orit
y
Responsible Party ® &
Cooperators © Cos
t
Implementation Time Frame
2012
2013
2014
2015
2016
2017
2018
2019
2020
Up
dat
e P
lan
1
Contact MDH Hydrologist to evaluate options and develop a plan to complete an aquifer test (pump test) to better determine aquifer transmissivity (ability of water to move through the aquifer). V
ery
Hig
h City Staff ®
MDH © S
taff
Tim
e X

20
E. WELLHEAD PROTECTION RECOGNITION PLANNING, COORDINATION and REPORTING
Implementation Action Items
Action # Description
Pri
orit
y
Responsible Party ® &
Cooperators © Cos
t
Implementation Time Frame
2012
2013
2014
2015
2016
2017
2018
2019
2020
Up
dat
e P
lan
1
Request Bertha Township to include a map of the Bertha DWSMA with their comprehensive plan and zoning ordinance. H
igh
WHP Mgr. ® Bertha Twp. © S
taff
T
ime
X
2
Request Bertha Township notify the City of Bertha regarding any proposed changes in land use, conditional use permits or changes to the zoning districts that may impact groundwater quality or quantity in the DWSMA.
Hig
h
WHP Mgr. ® Bertha Twp.©
Sta
ff T
ime
X
3
Request the County Water Planner to incorporate the DWSMA Map, WHP issues and activities when the County Water Management Plan is being updated.
Hig
h
WHP Mgr. ®
Todd Co. SWCD & D ©
Sta
ff
Tim
e
X
4
Review and update as needed the city ordinance and requirements for hooking up to the public water supply to encourage use of the system where it is available.
Hig
h
WHP Mgr., City Clerk ® S
taff
T
ime
X
5
Hold a WHP meeting annually to discuss past year’s accomplishments and coordinate upcoming year’s activities. H
igh
WHP Mgr. ® Todd Co. Water Planner, MDH, WHP Team.©
Sta
ff
Tim
e
X X X X X X X X X X
6
Maintain and keep up to date a WHP file that documents all WHP related activities that have been completed.
Ver
y H
igh
WHP Mgr. ®
Sta
ff
Tim
e
X X X X X X X X X X
7
Complete a WHP Evaluation Report every 2.5 years that evaluates the progress of implementing the WHP Measures identified in this plan and the impact of (any) contaminant release on the aquifer supplying the public water supply wells. Submit report to MDH.
Hig
h
WHP Mgr. ®
MDH, MRWA ©
Sta
ff T
ime
X X X

21
9.4 Commitments From Cooperators The agencies listed in Table 10 can support the City of Bertha with implementing the WHP measure(s) in which they are identified.
Table 10 - Cooperating Agencies List
Agency Measure Actions Agency Will Take
Todd Co. SWCD & D A-2,6; B-5, 7, 9; E-3, 5 Provide technical assistance for implementing activities
MDH / MRWA (Items may be supported by either MDH or MRWA unless noted otherwise)
A-1,2,3(4 MRWA)5,(7 MDH); B-2, 5, 7 (MDH 6, 10, 11) D-1 (MDH); E-5, 7
Provide technical assistance for implementing activities
MNDOT B-4; C-1 Support activity
DNR B-10, 11 Support activity
Chapter 10 - Evaluation Program Evaluation is used to support plan implementation and is required under Minnesota Rules, part 4720.5270, prior to amending the city’s WHP plan. Plan evaluation is specified under Measure E-7 and provides the mechanism for determining whether WHP action items are achieving the intended result or whether they need to be modified to address changing administrative, technical, or financial resource conditions within the DWSMA. The city has identified the following procedures that it will use to evaluate the success with implementing its WHP plan:
1. An annual briefing to the city council and WHP Team will provide the basis for documenting whether each action step for that year was implemented.
2. The WHP team will meet annually to assess the status of plan implementation and to identify issues that impact the implementation of action steps throughout the DWSMA;
3. The city will assess the results of each action item that has been taken annually to determine whether the action item has accomplished its purpose or whether modification is needed. Assessment results will be presented in the annual briefing to the city council and WHP Team.
4. The city will prepare a written report every 2. 5 years that documents how it has assessed plan implementation and the action items that were carried out. The reports will be sent to MDH every 2.5 years and also available when MDH holds the first scoping meeting with the city to begin amending the WHP plan.
Chapter 11 - Contingency Strategy The WHP plan includes a contingency strategy that addresses disruption of the water supply caused by either contamination or mechanical failure. The city prepared this strategy using a template provided by MDH and presented in Appendix III of this plan.

22
Chapter 12 - Glossary of Terms Data Element. A specific type of information required by the Minnesota Department of Health to prepare a wellhead protection plan.
Drinking Water Supply Management Area (DWSMA). The surface and subsurface areas surrounding a public water supply well, including the wellhead protection area, that must be managed by the entity identified in the wellhead protection plan. (Minnesota Rules, part 4720.5100, subpart 13). This area is delineated using identifiable landmarks that reflect the scientifically calculated wellhead protection area boundaries as closely as possible.
Emergency Response Area (ERA). The part of the wellhead protection area that is defined by a one-year time of travel within the aquifer that is used by the public water supply well (Minnesota Rules part 4720.5250, subpart 3). It is used to set priorities for managing potential contamination sources within the DWSMA.
Emergency Standby Well. A well that is pumped by a public water supply system only during emergencies, such as when an adequate water supply cannot be achieved because one or more primary or seasonal water supply wells cannot be used.
Inner Wellhead Management Zone (IWMZ). The land that is within 200 feet of a public water supply well (Minnesota Rules, part 4720.5100, subpart 19). The City of Bertha must manage the IWMZ to help protect it from sources of pathogen or chemical contamination that may cause an acute health effect.
Nonpoint Source Contamination. Refers to contamination of the drinking water aquifer that is caused by polluted runoff or pollution sources that cannot be attributed to a specifically defined origin, e.g., runoff from agricultural fields, feedlots, or urban areas.
Point Source Contamination. Refers to contamination of the drinking water aquifer that is attributed to pollution arising from a specifically defined origin, such as discharge from a leaking fuel tank, a solid waste disposal site, or an improperly constructed or sealed well.
Primary Water Supply Well. A well that is regularly pumped by a public water supply system to provide drinking water.
Seasonal Water Supply Well. A well that is only used to provide drinking water during certain times of the year, either when pumping demand cannot be met by the primary water supply well(s) or for a facility, such as a resort, that is closed to the public on a seasonal basis.
Vulnerability. Refers to the likelihood that one or more contaminants of human origin may enter either 1) a water supply well that is used by the City of Bertha or 2) an aquifer that is a source of public drinking water.
WHP Area (WHPA). The surface and subsurface area surrounding a well or well field that supplies a public water system, through which contaminants are likely to move toward and reach the well or well field (Minnesota Statutes, part 103I.005, subdivision 24).
WHP Plan Goal. An overall outcome of implementing the WHP plan, e.g., providing for a safe and adequate drinking water supply.
WHP Measure. A method adopted and implemented by a City of Bertha to prevent contamination of a public water supply, and approved by the Minnesota Department of Health under Minnesota Rules, parts 4720.5110 to 4720.5590.
WHP Plan Objective. A capability needed to achieve one or more WHP goals, e.g., implementing WHP measures to address high priority potential contamination sources within 5 years.

23
Chapter 13 - List of Acronyms
CWI - County Well Index DNR - Minnesota Department of Natural Resources EPA - United States Environmental Protection Agency FSA - Farm Security Administration MDA - Minnesota Department of Agriculture MDH - Minnesota Department of Health MGS - Minnesota Geological Survey MN DOT - Minnesota Department of Transportation MN GEO - Minnesota Geospatial Information Office MPCA - Minnesota Pollution Control Agency NRCS - Natural Resource Conservation Service SWCD - Soil and Water Conservation District UMN - University of Minnesota USDA - United States Department of Agriculture USGS - United States Geological Survey
Chapter 14 – References MN Rural Water Association (MRWA) website: http://www.mrwa.com/ MN Department of Health (MDH) Source Water Protection website http://www.health.state.mn.us/divs/eh/water/swp/index.htm MN Department of Health (MDH) Drinking Water Protection website: http://www.health.state.mn.us/divs/eh/water/ MN Pollution Control Agency (MPCA) website: http://www.pca.state.mn.us/ MN Department of Natural Resources (MN DNR) Water Management website: http://www.dnr.state.mn.us/waters/watermgmt_section/index.html MN Department of Agriculture (MDA) Protecting Our Lands & Waters website: http://www.mda.state.mn.us/protecting.aspx US Environmental Protection Agency (EPA) Source Water protection website: http://water.epa.gov/infrastructure/drinkingwater/sourcewater/protection/index.cfm

Figure 2:
Todd County GIS:
2008 Air Photo City of Bertha DWSMA Map

_̂̂_
10 11
23
COUNTY 24
COUN
TY 23
CENT
RAL A
VE N
COUN
TY 23
3RD
AVE N
E
CHERRY ST NW
2ND ST NW
CHERRY ST NE
1ST ST SW
MAIN ST E
1ST A
V E NE
2 ND
AVE
S E
1ST A
VE N
W
3RD
AVE
SE
1ST ST NE
2ND
AVE
N E
1ST ST SE
2ND
AVE
N W
1ST
A VE
SE 2 ND
AVE
S E
4TH ST NW
CENT
RAL A
VE S
HWY 71 N
1ST
A VE
NE
MAIN ST W
HWY 71 S
2ND ST SE
1ST ST SE
COUNTY 24
US 71
US 71
QUAI
L TRL
444TH ST
MEADOW AVE NW BERTHA
TOWNSHIP
Todd County Soil, Water, Conservation, Development DistrictGIS Unit
347 Central Ave - Ste 1Long Prairie, MN 56347Office: (320) 732-4248Fax: (320) 732-4803
City ofBertha
Wellhead ProtectionPlan
Map Resources:DWSMA, WPA, and ERA MN Department of Health information published December 29, 2010Road Network Todd County E911 System2008 Air Photography
General
DWSMADWSMA
This map is a compilation of records and data located in various government offices affecting the area shown, and is to be used forreference purposes only. Todd County is not responsible for anyinaccuracies herein contained. Use of this map constitutes acceptance of this disclaimer. Please contact [email protected] to report discrepancies or errors.
I
_̂ City wellsEmergency Responce AreaWellhead Protection AreaDWSMACity of BerthaStreams
Bertha DWSMATodd County
Minnesota
0 660 1,320 1,980 2,640330Feet
Path: K:\Projects\Bertha\Projects\Citywide_Map11x17.mxd
Date: 2/16/2012

Figure 3:
Todd County GIS:
2008 Air Photo & Parcel Overlay City of Bertha DWSMA Map

_̂̂_
02-0002600
02-000310002-00
0320
002
-0007
400
02-00
0800
0
02-0008200
02-0008300
02-0008400
02-0008500 02-0008700 02-0008800
02-00
0940
2
02-000950002-000970002-4002400
02-4005300
29-0000100
29-0000101
29-00
0020
029
-0000
300
29-00
0040
029
-0000
401
29-0001500
29-0001700
29-0001800
29-00
0190
0
29-0002000
29-0002001
29-0002100
29-0002101
29-0002200
29-000230029-0002400
29-00
0290
029
-0003
000
29-0003200
29-0003203
29-0003300
29-0003301
29-000340029-0003500
29-0003600
29-0003700
29-000440029-000450029-0004600
29-0004700
29-0004800
29-0004900
29-00
0500
0
29-00
0510
0
29-00
0510
1 29-0005200
29-0005300
29-00
0540
0
29-00
0550
0
29-0005600
29-00
0570
029-0005800
29-0005900
29-00
0600
029
-0006
100
29-00
0620
029
-0006
300
29-00
0640
0
29-00
0650
029
-0006
600
29-00
0670
0
29-00
0680
029-0006900
29-0007000
29-00
0730
0
29-00
0740
0
29-00
0750
0
29-000760029-0007700
29-00
0780
0
29-00
0790
0
29-0008000
29-00
0810
029
-0008
200
29-00
0830
0
29-00
0840
0
29-00
0850
0
29-00
0860
0
29-00
0870
0
29-0008701
29-00
0880
0
29-0008900
29-0009100
29-0009200
29-0009300
29-0009400
29-0009600 29-0009700
29-0009800
29-0009900
29-00
1000
0
29-00
1010
0
29-0010200
29-0010300
29-00
1030
1
29-001
0302
29-0010400
29-0010500
29-00
1060
0
29-0010700
29-0010900
29-0011000
29-0011100
29-0011200
29-00
1120
1
29-00
1130
0
29-00
1140
029
-0011
600
29-00
1170
0
29-001170129-001190029-0012000
29-00
1250
029
-0012
600
29-00
1270
0
29-001320029-0013300
29-001360029-00
1370
0 29-0013800
29-00
1390
0
29-00
1400
0
29-00
1410
0
29-0014200
29-0014600
29-001480029-0014900
29-00
1500
0
29-00
1510
0
29-00
1520
029-
001530
0
29-00
1540
029
-0015
401
29-00
1550
0
29-00
1560
0
29-00
1570
029
-0015
800
29-00
1590
0
29-00
1600
0
29-00
1610
0
29-00
1620
0
29-00
1630
0
29-00
1640
029
-0016
500
29-00
1660
0
29-00
1670
0
29-00
1680
0
29-0016900
29-0017000
29-0017100
29-00
1720
0
29-0017300 29-0017400
29-00
1760
0
29-00
1770
0
29-00
1780
0
29-00
1790
0
29-0018000
29-0018100
29-0018200 29-00
1830
0
29-00
1840
0
29-00
1850
0
29-00
1860
0
29-00
1870
029
-0018
800
29-00
1880
1
29-0018900 29-0019000
29-001910029-0019200
29-00
1930
029-0019400 29-0019500
29-001
9700
29-001
9800
29-001
9900
29-00
20000
29-00
2120
0
29-00
2130
0
29-00
2140
0
29-00
2150
0
29-00
2150
1 29-002160029-002170029-002180029
-0021
900
29-00
2230
029
-0022
301
29-00
2230
2
29-0022303
29-00
2240
029
-0022
500
29-00
2260
029
-0022
700
29-00
2280
0
29-00
2290
0
29-0023000
29-0023100
29-0023200
29-0023300
29-0023400
29-0023500
29-0023600
29-0023700
29-0023800
29-0023900
29-0024000
29-0024200
29-0024300
29-0024400
29-0024500
29-0024600
29-0024700
29-0024800
29-0024900
29-0025000
29-002510029-0025101
29-0025200
29-0025300
29-0025400
29-0025500 29-0025600
29-0025700
29-0025800
29-00
2600
0
29-00
2610
0
29-00
2620
0
29-00
2630
0
29-00
2640
0
29-00
2650
0
29-00
2660
0
29-00
2670
0
29-00
2680
0
29-0026900
29-0027000
29-0027100
29-0027200
29-0027300
29-0027400
29-0027500
29-0027600
29-0027800
29-0027900
29-0028000
29-0028100
29-002820029-0028300
29-0028500
29-0028600
29-0028700
29-0028800
29-00
28900
29-002920029-0029300
29-0029800
29-003010029-0030200
29-003030029-0030400
29-0030500
29-0030600
29-0030700
29-0031000
29-0031100 29-0031800
29-40
0010
0
29-4000300
29-4000600
29-4000700
29-4000800
29-4000900
29-40
0100
0
29-400
1100
29-40
0130
0
29-40
01400
29-40
0190
029-
400210
0
29-4002200
29-400230029-4002400
29-4002500
29-4002700
29-4002800
29-4002900
29-4003000
29-40
0370
0
29-400380029-4003900
29-40
0420
0
29-4004300
29-400440029-4004500
29-4004600
29-4004700
29-4004900
29-4005000
29-4005200
29-40
0530
0
29-4005400
29-40
0550
0
29-4005600
29-4005700
29-4005900
10
2ND
AVE S
W
1ST ST NW
3RD
AVE N
E
US 71
MAIN ST E
2ND
AVE N
W
2ND ST NW
CENT
RAL A
VE N
1ST ST SW
KILBURN ST NW
1ST A
VE N
E
1ST ST SE
1ST A
VE SE
2ND
AVE S
E
1ST A
VE N
W
3RD
AVE S
E
1ST ST NE
2ND ST NE
2ND
AVE N
E
4TH ST NW
CENT
RAL A
VE S
HWY 71 N
MAIN ST W
HWY 71 S
2ND ST SE
COUNTY 24QU
AIL T
RL
135T
H AV
E
MEADOW AVE NW
BERTHATOWNSHIP
Todd County Soil, Water, Conservation, Development DistrictGIS Unit
347 Central Ave - Ste 1Long Prairie, MN 56347Office: (320) 732-4248Fax: (320) 732-4803
City ofBertha
Wellhead ProtectionPlan
Map Resources:DWSMA, WPA, and ERA MN Department of Health information published December 29, 2010Road Network Todd County E911 System2008 Air Photography
Parcel Boundaries
DWSMADWSMA
This map is a compilation of records and data located in various government offices affecting the area shown, and is to be used forreference purposes only. Todd County is not responsible for anyinaccuracies herein contained. Use of this map constitutes acceptance of this disclaimer. Please contact [email protected] to report discrepancies or errors.
I
_̂ City wellsEmergency Responce AreaWellhead Protection AreaDWSMACity of BerthaParcel BoundariesStreams
Bertha DWSMATodd County
Minnesota
0 660 1,320330Feet
Path: K:\Projects\Bertha\Projects\Parcels_Map11x17.mxd
Date: 2/16/2012

Figure 4:
City of Bertha Zoning Map

1234567
272'
238'
33 1/3' 1/3'33
143'
143'
14'
14' ALLEY
33 1/3' 33 1/3'
143'1234567
143'
222'
188'
8
21 3 4 5 6 7 8 9 10 11
33 1/3' 1/3'3382 2/3'
472/3'
144'14'ALLEY
14'66'
1 2 3 4 5 6 7 8 9 10 11 12 13 14 15 16 17 18 19 20
14' ALLEY
14'
1/3'33 1/3'33 35'
1 2 3 4 5 6 7 8 9 10 11 12 13 14 15 16 17 18 19 20
1/3'33 1/3'33
143'
143'
143'
143'
1 2 3 4 5 6 7 8 9 10 11 12 13 14 15 16 17 18 19 20
1/3'33 33 1/3'
144'
144'
14' ALLEY
14'
14'66'
66'
1 2 3 4 5 6 7 8 9 10
632/3'
432/3'
331/3' 1/3'33
18 17 16 15 14 13 12 1119
74'
39'
33 1/3'
148'
93.5'
148'
CHERRY STREET
4 3
1 2
2 1
331/3'
144'91'
ALLEY
12345678
49 2/3' 33 1/3' 1/3'33
148' 144'
312'
12'
9 10 11 12 13 14 15
144'
148'
21.5'
55' 1/3'33 1/3'33
12'
12'1 ALLEY
1/3'331/3'3339'
138'123456
FOURTH STREET
KILBOURN STREET
SECOND STREET NORTH
162/3' 331/3'
138'
78
9
10
11
2
66'
66'
66'
66'
66'
123456789
10 11 12 13 14 15 16 17 18
12'
12'
12'
12'3
33 1/3' 33 1/3'
33 1/3' 33 1/3'
138'
138'
150'
150'
307'
164'
133'
300'
143'
36'33'
1
23
4
5
13
6
5
4
3
2
1
113'
42'
50'50'
3
10 11 12 13 14 15
9 8 7 6 5 4 3 2 1
50' 50'
33 1/3'1/3'33
14'
14' 2
8
14'
1/3'33
9
10
50'
1 14'
57 6 4 3
1/3'33
12
11 12 13 14 15
50'
FIRST STREET NORTH
50' 50'
18 17 16 15 14 13 18 17 16 15 14 13
50'50'
1012 11 9 8 7
50' 50'
143'
143'
143'
143'
143'
143'
143'
143'
143'
143'
143'
143'
143'
143'
8
1/3'33
9
143'
57 6 4 3 12143'
1/3'33
11
143'
10 1412 13 15 16
143'
1817
1/3'331/3'33
114'
14'
50' 50'
143'
143' 56 134 2
8
143' 7
50'
9 10 11
143'12
50'
14'
14'1
123
45
14'
14' 3
25' 25'
143.5'
148.09'
143.8'
144.09'
144.39'
144.68'
144.99'
145.59'
145.82'
146.12'
146.48'
146.78'
1 2 3 4 5 6 7 8 9 10 11 12 1 2 3 4 5 6 7 8 9 10 11 12
25' 25'
147.78'
151.15'
148.17'
148.48'
148.80'
149.02'
149.56'
149.66'
149.96'
150.26'
150.55'
150.85'
1 214'
14'
14'
14'
1 2 3 4 5 6
14'
14'3
50' 50'
152.24'
152.87'
153.44'
154.03'
154.62'
155.22'
90'
1
2
3
4
5
6
7
8
9
10
11
12
13
14
15
16
143'
143'
50'50'
123456789
101112
143'
143'
25'
25'
25'
13
23
18
16
1415
17
21
1920
22
25'
24
143'
143'14'
14'
2 1
2
3
4
10 9
6 5
115' 50' 165'
88'77'
29'40'
40'40'
122'142'
143'
1
214
9
11
25'
12
10
6
87
5
16
25'
143' 14'
1413 143'
15
2 19
1718
20
25'
1
32
25'143' 14' 143'24
2223
1
2
3
4
5
6
7
8
9
2
121110987654321
1
4
21
3
1
9
765
8
121110
14'
14'
21
2324
22
151413
16
18 22019
17
14'
14'
121110987654321
3
165'
165'
33.3
'33
.3'
25'
25'
143'
143'
25'
25'
25'
25'
143'
143'
143'
143'
153'
153'
25'
25'
143'
1/3'33 1/3'33 66'
127'
115.5' 192'
192'
75'
91'180'
180'
140'18'36'
50'50'
50'45'
150'
150'
104'
283'
279'
132'
155.5'
1/3'33 331/3' 24.5' 20'
14'
1 2 3 4 5 6 7 8 9 10 11 12 13 14 15 9
LOT
LOT
10
LOT
8
LOT
1
LOT 2
3LOT
4LOT
LOT 5
LOT 6
LOT 7
LOT 12
1 2 3 4 5 6 7 8 9
LOT
11
140.20'
140.20'
150'150'
1
2
3
4
1
140'
140'
75'75'
20'
20'
75'
2
1140'
23
75'
140'
41
2
3
2
20'
20'
139.77'
139.91'
102'104.10'
102'
102'102'
102.47'
1
2
3
140'
140.01'
140.01'
102'102'
104.87'
102'106.49'
102' 4
5
6
140'
140.01'
106.73'102'
102'
102'108.36'
102'
3
20'
20'
102'109.13'
102'
102'111.38'
102'
195.46'
193.71'
1
2
3
4
193.35'
111.67'80'
80'
90'
210.49'
300.47'
MAIN STREET
FIRST STREET S.
SECOND STREET S.
27.12'
22.68'
102.78'116.31'
100'
100'
200'176.27'
312.36'
112.62'
37.94'
14'
287.94'
109.42'
189.32'
190.20'
272.98'
184.72'
298.72'
100'
100'
66.07'
108.43'100'
207.83'
191.76'
30.56'
208.43'
61.84' 150.93'
93.16'
135'
138.2
0'
100'
73.71'
100'
100'
100'
100'
100'
100'
100'100'
100'100'
100'
250'
250'
250'
250'
250'
250'
1282.41'
1222.69'
257.03'
195.70'
196.47'
197.23'
197.99'
198.75'
135'134'
134'135.60'
133.49'134'
134'134.92'
1
7
6
5
4
3
2
PARK
SECONDST.
1
1
2
3
4
5
6
7
2
4
3
2
1
1
1
2
3
4 5
6
7
8
2
1
2
3
4
149.91'149.91'
149.91' 149.91'
149.91'149.91'
149.91' 149.91'
149.915' 149.915'
125.07'
125'
124.93'
115'
115'
115'
115'
115'
115'
121.56'
119.97'
118.39'
139.68'
139.68'
139.68'
139.68'
139.69'
137.06'135'
135'137.84'
136.36'135'
135'137'
3
55.83'
59.13'
545.53'
544.90'
OU
TLO
T A
KILBURN'S 4TH ADDITION
KILBURN'S 3RD ADDITION
KILBURN'S 2ND ADDITION
KILBURN'S ADDITION
WESTERGREN'S ADDITION
WE
ST
ER
GR
EN
'S 2
ND
AD
DIT
ION
GE
RM
ON
D'S
2N
D A
DD
ITIO
N
GE
RM
ON
D'S
AD
DIT
ION STRASBURG'S ADDITION
ORIGINAL TOWN
CARY'S ADDITIONHOPE ADDITION
HOPE ADDITION ONE
NE
W D
AY
AD
DIT
ION
AUDITOR'S SUBDIVISION
KILBURN'S 3RD
100'100'
50'100'
71
MEAD
OW
STR
EET
SEC
ON
DAVEN
UE
WES
T
FIR
ST
AVEN
UE
WES
T
SEC
ON
DAVEN
UE
EAS
T
TH
IRD
AVEN
UE
EAS
T
166'
213'
475'
2
Block 1
HOPE
685'
310'
313.
5'
789.75'
295'
300'
135'
197'
120'
100'
1
2
3
4
9
10
1112
14
15 16
GOETZADD.
13
LOT 8
366'
365'
149'
66'
167'
231'
165' 66'
264'
266'
47'
597'
693'
630'
CEN
TR
AL
AVEN
UE
FIR
ST
AVEN
UE
EAS
T
B
E
A
R
C
R
E
E
K
TO
WAD
EN
A
TO
EAG
LE B
EN
D
513.75'
610.5'
155'
250'
459'446.
7'
466.7'
841.
7'
210.7'
256'
101'
230'
466.7'
1 2 3 2
45678
14' LOT 1
64.3' 60' 60' 50'
50' 50' 60' 60' 58'
146'
264' 189' 75'
165'
660'
264'
LOT AUDITOR'S KLIMEK'S
SUBD.
RE VISION
71
282.95'
596.
92'
467.
50'
280.08'
VACATED ALLEY
50' 100' 47' 147'
14'
14'
C
I
C
I
R
R
R
M-H
R-R
R-R
OFFICIAL ZONING MAPDISTRICTSR-R RURAL RESIDENTIALR GENERAL RESIDENTIALM-H MOBILE HOMEC COMMERCIALI INDUSTRIALF-P FLOOD PLAIN
F-P
F-P
NO
RT
H
0
( IN FEET )
200 400
Figure 5:
Todd County GIS:
Zoning Map for Bertha Township & area outside city limits

_̂̂_
10 11
23
COUNTY 24
COUN
TY 23
157T
HAV
E
CENT
RAL A
VE N
2ND
AVE
SW
COUN
TY 23
3RD
AVE
NE
CHERRYST NW
2NDST NW
CHERRYST NW
CHERRYST NE
1STST SW
MAIN ST E
KILBURNST NW
1ST
AVE
NE
1STST SE
2ND
AVE
NW
1ST
AVE
SE
3RD
AVE
SE
1STST NE
1STST NW
2ND ST NW2ND
ST NE
2ND
AVE
NE
2ND
AVE N
W
1STST NE
2ND
AVE
NW
1ST
AVE
SE
4TH ST NW
CENT
RAL A
VE S
HWY 71 N
1ST
AVE
NE
MAIN ST W
HWY 71 S
2ND ST SE
1STST SE
4THST NW
COUNTY 24
US 71
US 71
QUAI
L TRL
444TH ST
BERTHATOWNSHIP
Todd County Soil, Water, Conservation, Development DistrictGIS Unit
347 Central Ave - Ste 1Long Prairie, MN 56347Office: (320) 732-4248Fax: (320) 732-4803
City ofBertha
Wellhead ProtectionPlan
Zoning
DWSMADWSMA
This map is a compilation of records and data located in various government offices affecting the area shown, and is to be used forreference purposes only. Todd County is not responsible for anyinaccuracies herein contained. Use of this map constitutes acceptance of this disclaimer. Please contact [email protected] to report discrepancies or errors.
I
(AF-1) Agriculture/Forestry - 1(AF-1-OL) Agriculture/Forestry - 1 - Outlot(AF-2) Agriculture/Forestry - 2(AF-2-OL) Agriculture/Forestry - 2 - Outlot(R-10) Residential - 10(R-2) Residential - 2(UG) Urban Growth(RT) Rural Townsite(C) Commercial
! ! ! ! !
! ! ! ! !
! ! ! ! ! (LMI) Limited Manufacturing/Industry(S) Shoreland(M) Municipality(PW) Protected Water(RDL) Recreational Development Limited
_̂ City wellsEmergency Responce AreaWellhead Protection AreaDWSMACity of BerthaStreams
Bertha DWSMATodd County
Minnesota
0 660 1,320 1,980 2,640330Feet
Path: K:\Projects\Bertha\Projects\Zoning_Map11x17.mxd Date: 2/16/2012
Appendix I:
MDH WHP Plan Part I: WHPA & DWSMA Delineation & Vulnerability Assessment for the City of Bertha

Amendment to the Wellhead Protection Plan
Part I
Wellhead Protection Area Delineation Drinking Water Supply Management Area Delineation
Well and Drinking Water Supply Management Area Vulnerability Assessments
For
The City of Bertha
October 2011
Gail Haglund
Minnesota Department of Health

Table of Contents
Page
Glossary of Terms ...................................................................................................................................... i
Acronyms .................................................................................................................................................. ii
1. Introduction ......................................................................................................................................... 1
2. Assessment of the Data Elements ....................................................................................................... 1
3. General Descriptions .......................................................................................................................... 3
3.1 Description of the Water Supply System .................................................................................. 3
3.2 Description of the Hydrogeologic Setting ................................................................................. 3
4. Delineation of the Wellhead Protection Area ..................................................................................... 4
4.1 Delineation Criteria ................................................................................................................... 4
4.2 Method Used to Delineate the Wellhead Protection Area ......................................................... 6
4.3 Results of Model Calibration and Sensitivity Analysis ............................................................. 6
4.4 Addressing Model Uncertainty .................................................................................................. 7
5. Delineation of the Drinking Water Supply Management Area .......................................................... 9
6. Summary of Comparisons Between Previous (2000) and Current WHPA and DWSMA Delineations ........................................................................................................................................ 9
7. Vulnerability Assessments ................................................................................................................ 10
7.1 Assessment of Well Vulnerability ........................................................................................... 10
7.2 Assessment of Drinking Water Supply Management Area Vulnerability .............................. 10
8. Selected References .......................................................................................................................... 11
9. Figures .............................................................................................................................................. 12
List of Tables
Table 1: Assessment of Data Elements ................................................................................................ 1
Table 2: Water Supply Well Information ............................................................................................ 3
Table 3: Description of the Hydrogeologic Setting .............................................................................. 3
Table 4: Description of WHPA Delineation Criteria ............................................................................ 5
Table 5: Annual Volume of Water Discharged from Water Supply Wells .......................................... 6
Table 6: WHPA Code Model Input Parameters ................................................................................... 8
Table 7: Range of Values Used for the ONEKA Model ...................................................................... 9

Table of Contents - Continued
List of Figures Page
Figure 1: Wellhead Protection Area and Drinking Water Supply Management Area, Bertha, Minnesota .................................................................. 13
Figure 2: Local Groundwater Flow Field
Estimated From Well Records ........................................................................................... 14 Figure 3: Database Map and Trends of Cross Sections .................................................................... 15 Figure 4: Geologic Cross Sections A - A′ and B - B′ ........................................................................ 16 Figure 5: Combined 10-Year Capture Zones From the WHPA Code and ONEKA Models ............ 17 Figure 6: Comparison Between New and Old WHPAs and DWSMAs ........................................... 18

i
Glossary of Terms Data Element. A specific type of information required by the Minnesota Department of Health to prepare a wellhead protection plan. Drinking Water Supply Management Area (DWSMA). The area delineated using identifiable land marks that reflects the scientifically calculated wellhead protection area boundaries as closely as possible (Minnesota Rules, part 4720.5100, subpart 13). Drinking Water Supply Management Area Vulnerability. An assessment of the likelihood that the aquifer within the DWSMA is subject to impact from land and water uses within the wellhead protection area. It is based upon criteria that are specified under Minnesota Rules, part 4720.5210, subpart 3. Emergency Response Area (ERA). The part of the wellhead protection area that is defined by a one-year time of travel within the aquifer that is used by the public water supply well (Minnesota Rules, part 4720.5250, subpart 3). It is used to set priorities for managing potential contamination sources within the DWSMA. Wellhead Protection. A method of preventing well contamination by effectively managing potential contamination sources in all or a portion of the well’s recharge area. Wellhead Protection Area (WHPA). The surface and subsurface area surrounding a well or well field that supplies a public water system, through which contaminants are likely to move toward and reach the well or well field (Minnesota Statutes, part 103I.005, subdivision 24). Well Vulnerability. An assessment of the likelihood that a well is at risk to human-caused contamination, either due to its construction or indicated by criteria that are specified under Minnesota Rules, part 4720.5550, subpart 2.

ii
Acronyms CWI - County Well Index DNR - Minnesota Department of Natural Resources EPA - United States Environmental Protection Agency FSA - Farm Security Administration MDA - Minnesota Department of Agriculture MDH - Minnesota Department of Health MGS - Minnesota Geological Survey MnDOT - Minnesota Department of Transportation MnGEO - Minnesota Geospatial Information Office MPCA - Minnesota Pollution Control Agency SWCD - Soil and Water Conservation District USDA - United States Department of Agriculture NRCS - Natural Resource Conservation Service UMN - University of Minnesota USGS - United States Geological Survey

1
1. Introduction
The Minnesota Department of Health (MDH) amended Part I of the wellhead protection (WHP) plan at the request of the city of Bertha (public water supply identification number 1770001). The work was performed in accordance with the Minnesota Wellhead Protection Rule, parts 4720.5100 to 4720.5590. This report presents the delineation of the wellhead protection area (WHPA), the drinking water supply management area (DWSMA), and the vulnerability assessments for the public water supply wells and DWSMA. Figure 1 shows the boundaries for the WHPA and the DWSMA. The WHPA is defined by a 10-year time of travel. Figure 1 also shows the emergency response area (ERA), which is defined by a 1-year time of travel. Definitions of rule-specific terms that are used are provided in the “Glossary of Terms.” This report also documents the technical information that was required to prepare this portion of the WHP plan in accordance with the Minnesota Wellhead Protection Rule. Additional technical information is available from MDH. The wells included in the WHP plan are listed in Table 2. 2. Assessment of the Data Elements
MDH staff met with representatives of the public water supplier on March 24, 2011, for a scoping meeting that identified the data elements required to amend Part I of the WHP plan. Table 1 presents the assessment of these data elements relative to the present and future implications of planning items that are specified in Minnesota Rules, part 4720.5210.
Table 1 - Assessment of Data Elements
Data Element
Present and Future Implications
Data Source
Use
of
the
Wel
l (s)
Del
inea
tion
C
rite
ria
Qu
alit
y an
d
Qu
anti
ty o
f W
ell W
ater
L
and
and
G
rou
nd
wat
er
Use
in
DW
SMA
Precipitation Geology Maps and geologic descriptions M H H H MGS, DNR, USGS, Subsurface data M H H H MGS, MDH, DNR, Borehole geophysics M H H H MGS, City (None Found) Surface geophysics L L L L City (None Found) Maps and soil descriptions Eroding lands Water Resources Watershed units List of public waters Shoreland classifications Wetlands map Floodplain map

2
Data Element
Present and Future Implications
Data Source
Use
of
the
Wel
l (s)
Del
inea
tion
C
rite
ria
Qu
alit
y an
d
Qu
anti
ty o
f W
ell W
ater
L
and
and
G
rou
nd
wat
er
Use
in
DW
SMA
Land Use Parcel boundaries map L H L L Todd County Political boundaries map L H L L MnGEO, City PLS map L H L L MnGEO Land use map and inventory Comprehensive land use map Zoning map Public Utility Services Transportation routes and corridors L H L NA MnGEO Storm/sanitary sewers and PWS system map
Oil and gas pipelines map Public drainage systems map or list Records of well construction, maintenance, and use H H H H City, CWI, MDH Files
Surface Water Quantity Stream flow data Ordinary high water mark data Permitted withdrawals
Protected levels/flows
Water use conflicts L L L L None Available Groundwater Quantity Permitted withdrawals H H H H DNR Groundwater use conflicts H H H H DNR Water levels H H H H DNR, MDH, City Surface Water Quality Stream and lake water quality management classification
Monitoring data summary Groundwater Quality Monitoring data H H H H MDH Isotopic data M M M M MDH, DNR Tracer studies H H H H Not Available Contamination site data M M M M Not used for Part I WHP Plan Property audit data from contamination sites
MPCA and MDA spills/release reports L L L L Not used for Part I WHP Plan
Definitions Used for Assessing Data Elements: High (H) - the data element has a direct impact Moderate (M) - the data element has an indirect or marginal impact Low (L) - the data element has little if any impact Shaded - the data element was not required by MDH for preparing the WHP plan

3
Acronyms used in this report are listed on page ii, after the “Glossary of Terms.” 3. General Descriptions
3.1 Description of the Water Supply System
The public water supply obtains its drinking water from two primary wells; Table 2 summarizes information regarding them.
Table 2 - Water Supply Well Information
Local Well ID
Unique Number
Use/ Status1
Casing Diameter (inches)
Casing Depth (feet)
Well Depth (feet)
Date Constructed/
Reconstructed Aquifer
Well Vulnerability
2 240649 P 12 128 153 1955 Buried Sand
Not Vulnerable
3 603142 P 8 140 160 1998 Buried Sand
Not Vulnerable
Note: 1. Primary (P) Well 3.2 Description of the Hydrogeologic Setting
The description of the hydrologic setting for the aquifer that is used to supply drinking water is presented in Table 3.
Table 3 - Description of the Hydrogeologic Setting
Attribute Descriptor Data Source
Aquifer Material Sand Interpreted from well records found in the CWI database.
Porosity (type and value) 25% Conservative estimate for glacial materials (Fetter, 1988; Freeze and Cherry, 1979).
Aquifer Thickness Reference Value: 25 feet
(see original Part I WHP Plan, p. 3)
Interpreted from well records, and supported with information contained in the county geologic atlas (Setterholm, 2007; Peterson, 2010).
Stratigraphic Top Elevation 1,263 feet
Interpreted from well records, and inferred from information contained in the county geologic atlas (Setterholm, 2007; Peterson, 2010).
Stratigraphic Bottom Elevation
1,238 feet
Estimated from well records and information contained in the county geologic atlas (Setterholm, 2007; Peterson, 2010). The representative value is weighted toward the base elevation at the wellfield.
Hydraulic Confinement Confined
Aquifer test, well records, and information contained in the county geologic atlas (Setterholm, 2007; Peterson, 2010).

4
Table 3 - Continued
Attribute Descriptor Data Source
Transmissivity (T) Reference Value: 800 ft2/day
(see original Part I WHP Plan, p. 2)
The aquifer test plan was reviewed and approved on May 18, 2011. T was estimated from a 24-hour aquifer test conducted at the wellfield.
Hydraulic Conductivity Reference Value: 32 ft/day
(see original Part I WHP Plan, p. 10)
The reference value was obtained from the reference transmissivity value and using a conservative estimate of 25 feet for aquifer thickness.
Groundwater Flow Field Figure 2 - Local Groundwater Flow Field Estimated from Well Records
Defined by using static water level elevations from well records in the CWI database and information contained in the county geologic atlas (Peterson, 2010).
Several buried sand aquifers have been identified in the Bertha area. Most of these sand layers are relatively thin and of a limited extent. The DNR has established a naming convention for primary sand aquifers. The aquifer serving the city wells is named B1 and is a pre-Wisconsinan glacial sand deposit (Peterson, 2010). This sand aquifer lies below the lowest clay-rich till unit of the Browerville formation. Figures 3 and 4 show the distribution of the buried sand units and their stratigraphic relationships with adjacent geologic materials. They were prepared using well record data contained in the CWI database. The geological maps and studies that were used to further define local hydrogeologic conditions are provided in the “Selected References” section of this report. 4. Delineation of the Wellhead Protection Area
4.1 Delineation Criteria
The boundaries of the WHPA for the public water supplier are shown in Figure 1. Table 4 describes how the delineation criteria that are specified under Minnesota Rules, part 4720.5510, were addressed.

5
Table 4 - Description of WHPA Delineation Criteria
Criterion Descriptor How the Criterion was Addressed
Flow Boundary Hydrologic Boundaries
There are no hydrologic flow boundaries close enough to the public water supply wells to have an impact on their capture areas.
Flow Boundary Geologic
Boundaries - See Figure 3
The aquifer serving the city wells was represented as a single, confined homogeneous sand layer enclosed by lower permeability clay-rich till layers. The boundaries of the aquifer serving the city wells were mapped using information from the records of existing wells and interpreted from information contained in the county geologic atlas (Setterholm, 2007; Peterson, 2010).
Flow Boundary Other High-
Capacity Wells
No other high-capacity wells were included in the model. In the original Part I Plan, the impact of pumping at a nearby creamery well was simulated and incorporated into the delineation approach. However, ownership of the creamery facility has changed and the creamery well has not been used since 2007. Therefore, the creamery well was not included.
Daily Volume of Water Pumped
See Table 5 Pumping information was obtained from the city and DNR Appropriations Permit PA 1975-3265. This was converted to a daily volume pumped by a well.
Groundwater Flow Field See Figure 2 The model calibration process addressed the relationship between the calculated versus observed groundwater flow field.
Aquifer Transmissivity
See Table 3
The previous aquifer test plan was approved on May 18, 2011; T was determined from Theis analysis of the drawdown and recovery data from a 24-hour aquifer test conducted by MDH. Uncertainty regarding aquifer transmissivity was addressed as described in Section 4.4.
Time of Travel 10 years The public water supplier selected a 10-year time of travel.
Previous pumping values have been reported to the DNR, as required by the city’s Groundwater Appropriation Permit PA 1975-3265. This information was used to identify the maximum volume of water pumped annually by each well over the previous five-year period, as shown in Table 5. The estimated future pumping amounts for the next five years were provided by the city’s engineer (Moore Engineering, Inc.) and are also shown in Table 5. The maximum daily volume of discharge used as an input parameter in the model was calculated by dividing the greatest annual pumping volume by 365 days. For comparison purposes, the pumping rates used in the 2000 delineation are also provided in Table 5.
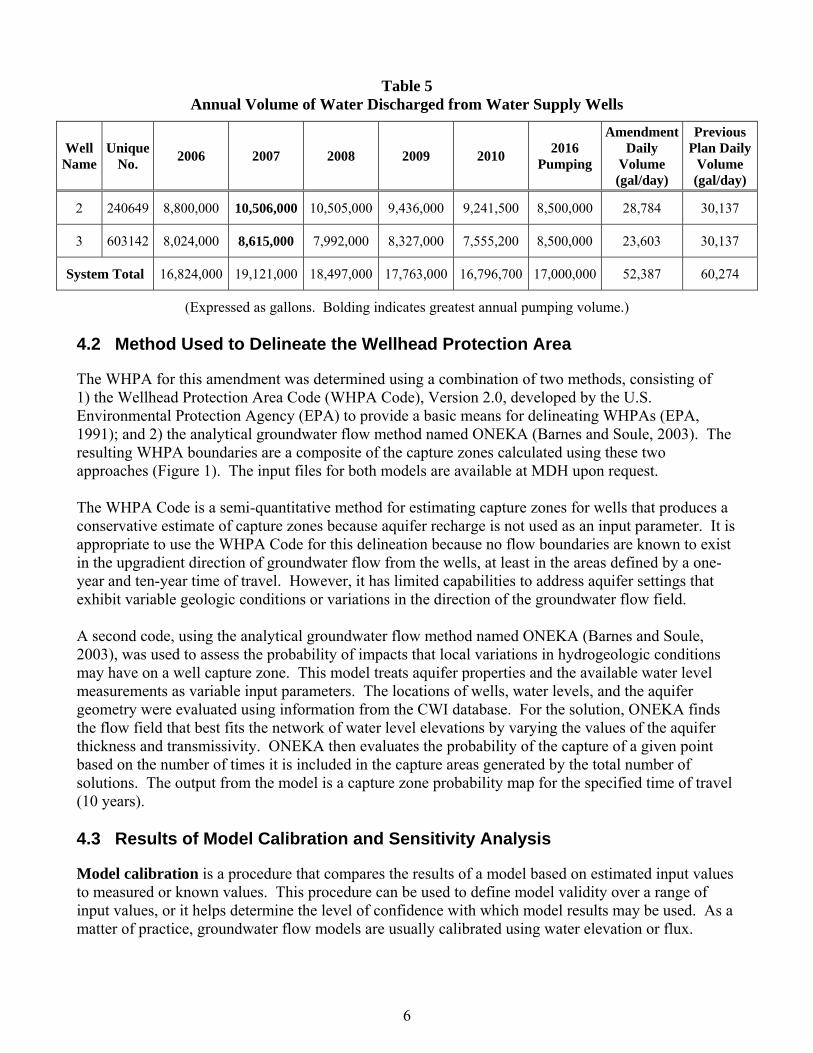
6
Table 5 Annual Volume of Water Discharged from Water Supply Wells
Well Name
Unique No.
2006 2007 2008 2009 2010 2016
Pumping
AmendmentDaily
Volume (gal/day)
Previous Plan Daily
Volume (gal/day)
2 240649 8,800,000 10,506,000 10,505,000 9,436,000 9,241,500 8,500,000 28,784 30,137
3 603142 8,024,000 8,615,000 7,992,000 8,327,000 7,555,200 8,500,000 23,603 30,137
System Total 16,824,000 19,121,000 18,497,000 17,763,000 16,796,700 17,000,000 52,387 60,274
(Expressed as gallons. Bolding indicates greatest annual pumping volume.) 4.2 Method Used to Delineate the Wellhead Protection Area
The WHPA for this amendment was determined using a combination of two methods, consisting of 1) the Wellhead Protection Area Code (WHPA Code), Version 2.0, developed by the U.S. Environmental Protection Agency (EPA) to provide a basic means for delineating WHPAs (EPA, 1991); and 2) the analytical groundwater flow method named ONEKA (Barnes and Soule, 2003). The resulting WHPA boundaries are a composite of the capture zones calculated using these two approaches (Figure 1). The input files for both models are available at MDH upon request. The WHPA Code is a semi-quantitative method for estimating capture zones for wells that produces a conservative estimate of capture zones because aquifer recharge is not used as an input parameter. It is appropriate to use the WHPA Code for this delineation because no flow boundaries are known to exist in the upgradient direction of groundwater flow from the wells, at least in the areas defined by a one-year and ten-year time of travel. However, it has limited capabilities to address aquifer settings that exhibit variable geologic conditions or variations in the direction of the groundwater flow field. A second code, using the analytical groundwater flow method named ONEKA (Barnes and Soule, 2003), was used to assess the probability of impacts that local variations in hydrogeologic conditions may have on a well capture zone. This model treats aquifer properties and the available water level measurements as variable input parameters. The locations of wells, water levels, and the aquifer geometry were evaluated using information from the CWI database. For the solution, ONEKA finds the flow field that best fits the network of water level elevations by varying the values of the aquifer thickness and transmissivity. ONEKA then evaluates the probability of the capture of a given point based on the number of times it is included in the capture areas generated by the total number of solutions. The output from the model is a capture zone probability map for the specified time of travel (10 years). 4.3 Results of Model Calibration and Sensitivity Analysis
Model calibration is a procedure that compares the results of a model based on estimated input values to measured or known values. This procedure can be used to define model validity over a range of input values, or it helps determine the level of confidence with which model results may be used. As a matter of practice, groundwater flow models are usually calibrated using water elevation or flux.

7
There is nothing to calibrate for the WHPA Code delineation because it is based on calculating flowpath lines using equations that reflect 1) a constant pumping rate, 2) direction of groundwater flow, 3) hydraulic gradient, 4) aquifer thickness, 5) aquifer permeability, and 6) aquifer porosity. As such, it is a simple calculation of the portion of the aquifer that contributes water, based on the width of the flow field that is affected by pumping. The ONEKA Model is used to support the WHPA Code results by using an iterative process which provides the best fit for the ranges of values assigned to its input parameters. This helps to define the subset of values for which the delineation results are most likely to reflect local hydrogeologic conditions and, therefore, provide the best calibration results. Model sensitivity is the amount of change in model results caused by the variation of a particular input parameter. Because of the simplicity of the WHPA model, the direction and extent of the modeled capture zone may be very sensitive to any of the input parameters:
The pumping rate directly affects the volume of the aquifer that contributes water to the well. An increase in pumping rate leads to an equivalent increase in the volume of aquifer within the capture zone, proportional to the porosity of the aquifer materials. However, the pumping rate is based on the results presented in Table 5 and, therefore, is not a variable factor that will influence the delineation of the WHPA.
The direction of groundwater flow determines the orientation of the capture area. Variations in the direction of groundwater flow will not affect the size of the capture zone but are important for defining the areas that are the source of water to the well. The ambient groundwater flow field that is defined in Figure 2 provides the basis for determining the extent to which each model run reflects the conceptual understanding of the orientation of the capture area for a well.
A hydraulic gradient of zero produces a circular capture zone, centered on the well. As the hydraulic gradient increases, the capture zone changes into an elliptical shape, with the well centered on the down-gradient focal point. The hydraulic gradient was determined by using water level elevations that were taken from wells that have verified locations (Figure 2). Generally, the accuracy of the hydraulic gradient determination is directly proportional to the amount of available data that describes the distribution of hydraulic head in the aquifer.
The aquifer thickness, permeability, and porosity influence the size and shape of the capture zone. A decrease in either thickness or porosity causes a linear, proportional increase in the areal extent of the capture zone; whereas permeability defines the relative proportions of the capture zone width to length. A decrease in permeability decreases the length of the capture zone and increases the distance to the stagnation point, making the capture zone more circular in shape and centered around the well.
4.4 Addressing Model Uncertainty
Using computer models to simulate groundwater flow necessarily involves representing a complicated natural system in a simplified manner. Local geologic conditions may vary within the capture area of the public water supply wells, but the amount of existing information that is needed to accurately define this degree of variability is often not available for portions of the WHPA. In addition, the current capabilities of groundwater flow models may not be sufficient to represent the natural flow system exactly. However, the results are valid within a range defined by the reasonable variation of input parameters for this delineation setting. WHPA Code - The WHPA Code has limited capabilities to address these kinds of uncertainties, other than by using multiple runs in which the following the six input parameters are varied: 1) constant pumping rate, 2) hydraulic gradient, 3) direction of ambient flow, 4) aquifer thickness, 5) aquifer

8
permeability, and 6) porosity. The uncertainty associated with the WHPA Code results from 1) the model deficiencies mentioned above, 2) the sensitivity of the WHPA model, and 3) the fact that the model cannot be calibrated. The steps employed for this delineation to address model uncertainty were:
1) Pumping Rate - For each well, the maximum historical (2007) pumping rate was used (Minnesota Rules, part 4720.5510, subpart 4).
2) Ambient Flow Field - A composite of capture zones was created from angles of flow that are 10 degrees greater and 10 degrees lesser than the representative angle of ambient flow (Minnesota Rules, part 4720.5510, subpart 5, B2). In addition, capture zones were also calculated using the angle of ambient flow that resulted from the previous model in 2000. The angle of flow simulated by the model used in 2000 had 5 degrees difference from the representative angle calculated from Figure 2. These zones were also included in the final composite area.
3) Probability Analysis - The ONEKA Model was used to estimate capture zone probability. Capture areas were developed for a range of groundwater flow directions, the addition of the proposed irrigation well, and times of travel of one and ten years (Figure 5). As the model code uses constant input values for each run, several runs were required to include all variations in input parameters. Table 6 documents the variables used to address WHPA Code model uncertainty.
Table 6 - WHPA Code Model Input Parameters
Well Name
File Name Discharge (m3/day)
Transmissivity(m2/day)
GradientFlow Angle
Porosity (%)
Aquifer Thickness(meters)
W2 whpabase 108.9 74.3 0.0044 29 25 8
W3 whpabase 89.3 74.3 0.0044 29 25 8
W2 whparun1 108.9 74.3 0.0044 19 25 8
W3 whparun1 89.3 74.3 0.0044 19 25 8
W2 whparun2 108.9 74.3 0.0044 39 25 8
W3 whparun2 89.3 74.3 0.0044 39 25 8
W2 split34 108.9 74.3 0.0044 34 25 8
W3 split34 89.3 74.3 0.0044 34 25 8
W2 Split24 108.9 74.3 0.0044 24 25 8
W3 Split24 89.3 74.3 0.0044 24 25 8
W2 Split44 108.9 74.3 0.0044 44 25 8
W3 Split44 89.3 74.3 0.0044 44 25 8
ONEKA Model - Uncertainty related to the water levels reported on well records is based on the accuracy of the ground elevation assigned to the well using topographic maps and the transient variability of the water levels in the aquifer over time. Water levels that are probably inaccurate were identified using data from 1) the CWI database, and 2) the county geologic atlas (Peterson, 2010). Only water levels that fit the flow field (Figure 2) were used for the ONEKA analysis.
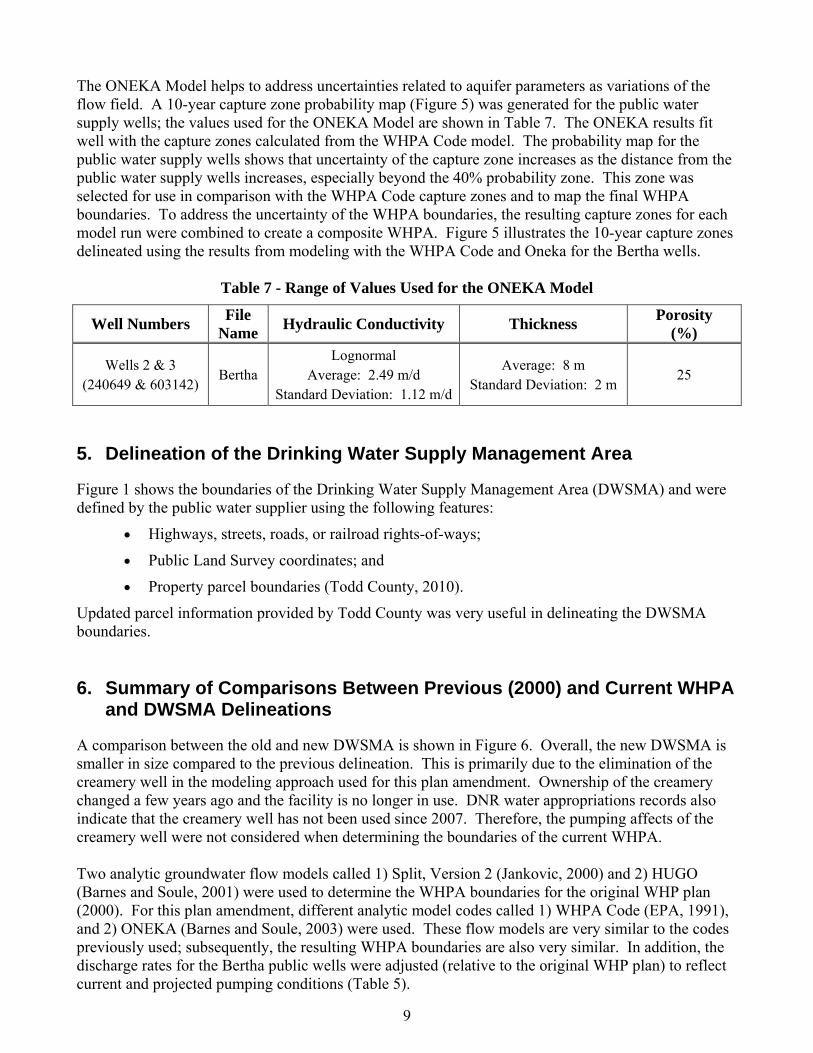
9
The ONEKA Model helps to address uncertainties related to aquifer parameters as variations of the flow field. A 10-year capture zone probability map (Figure 5) was generated for the public water supply wells; the values used for the ONEKA Model are shown in Table 7. The ONEKA results fit well with the capture zones calculated from the WHPA Code model. The probability map for the public water supply wells shows that uncertainty of the capture zone increases as the distance from the public water supply wells increases, especially beyond the 40% probability zone. This zone was selected for use in comparison with the WHPA Code capture zones and to map the final WHPA boundaries. To address the uncertainty of the WHPA boundaries, the resulting capture zones for each model run were combined to create a composite WHPA. Figure 5 illustrates the 10-year capture zones delineated using the results from modeling with the WHPA Code and Oneka for the Bertha wells.
Table 7 - Range of Values Used for the ONEKA Model
Well Numbers File
Name Hydraulic Conductivity Thickness
Porosity (%)
Wells 2 & 3 (240649 & 603142)
Bertha Lognormal
Average: 2.49 m/d Standard Deviation: 1.12 m/d
Average: 8 m Standard Deviation: 2 m
25
5. Delineation of the Drinking Water Supply Management Area
Figure 1 shows the boundaries of the Drinking Water Supply Management Area (DWSMA) and were defined by the public water supplier using the following features:
Highways, streets, roads, or railroad rights-of-ways;
Public Land Survey coordinates; and
Property parcel boundaries (Todd County, 2010).
Updated parcel information provided by Todd County was very useful in delineating the DWSMA boundaries. 6. Summary of Comparisons Between Previous (2000) and Current WHPA
and DWSMA Delineations
A comparison between the old and new DWSMA is shown in Figure 6. Overall, the new DWSMA is smaller in size compared to the previous delineation. This is primarily due to the elimination of the creamery well in the modeling approach used for this plan amendment. Ownership of the creamery changed a few years ago and the facility is no longer in use. DNR water appropriations records also indicate that the creamery well has not been used since 2007. Therefore, the pumping affects of the creamery well were not considered when determining the boundaries of the current WHPA. Two analytic groundwater flow models called 1) Split, Version 2 (Jankovic, 2000) and 2) HUGO (Barnes and Soule, 2001) were used to determine the WHPA boundaries for the original WHP plan (2000). For this plan amendment, different analytic model codes called 1) WHPA Code (EPA, 1991), and 2) ONEKA (Barnes and Soule, 2003) were used. These flow models are very similar to the codes previously used; subsequently, the resulting WHPA boundaries are also very similar. In addition, the discharge rates for the Bertha public wells were adjusted (relative to the original WHP plan) to reflect current and projected pumping conditions (Table 5).

10
The DWSMA was modified to reflect the new WHPA. The northeast portion of the existing DWSMA was eliminated due to the exclusion of the creamery well. The west boundary of the DWSMA was extended several hundred feet because a small portion of the composite capture zone area extended beyond the previous DWSMA boundary. 7. Vulnerability Assessments
The Part I wellhead protection plan includes the vulnerability assessments for the public water supply wells and DWSMA. These vulnerability assessments are used to help select appropriate measures for reducing the potential contaminant source threat to the public water supply. 7.1 Assessment of Well Vulnerability
The vulnerability assessment for each well used by the public water supplier is listed in Table 2 and is based upon the following conditions:
1) The geologic sensitivity of the aquifer at the well sites is considered moderate because of the lack of at least 10 feet of clay-rich geologic materials over the aquifer. However, the driller’s log for Well 3 (603142) indicates the presence of at least 120 feet of sandy clay materials, which provides a significant degree of natural protection to the aquifer from land use activities occurring at the land surface.
2) Isotopic (2000) and water chemistry data from Bertha Well 2 (240649) indicates that the aquifer water has no detectable levels of tritium or human caused contamination. Both of the city wells were sampled for tritium in March 2011 to confirm the vulnerability assessment; however, the results are not yet available from the laboratory.
3) Water samples were collected (March 24, 2011) from the wells and analyzed for chloride and bromide so that chloride/bromide ratios could be calculated and assessed. The chloride/bromide ratio results for Well 2 (240649) indicate that there has been no discernible impact on the aquifer by human activities occurring on the land surface. The chloride/bromide ratio for Well 3 (603142) could not be calculated because there were no detectable levels of bromide (the laboratory reporting limit for bromide is 0.0050 mg/l). However, the low level of chloride (1.97 mg/l) measured also indicates little or no impact to the aquifer by human activities occurring on the land surface.
7.2 Assessment of Drinking Water Supply Management Area Vulnerability
The vulnerability of the aquifer used by the city of Bertha has been determined to be low within the boundaries of the DWSMA. This assessment was based on the following:
1) Isotopic and water chemistry data from wells located within the DWSMA, and the same aquifer, indicate that there are no detectable levels of tritium or human-caused contamination. This assessment will be re-evaluated when the tritium results are available for recent sampling at Bertha Wells 2 and 3 (240649 and 603142).
2) Review of the geologic logs contained in the CWI database and geological maps and reports indicate that the aquifer exhibits a range of very low to moderate geologic sensitivity throughout the DWSMA. The pollution sensitivity map published by the DNR (Peterson, 2010) has determined the aquifer to have a very low sensitivity to pollution.
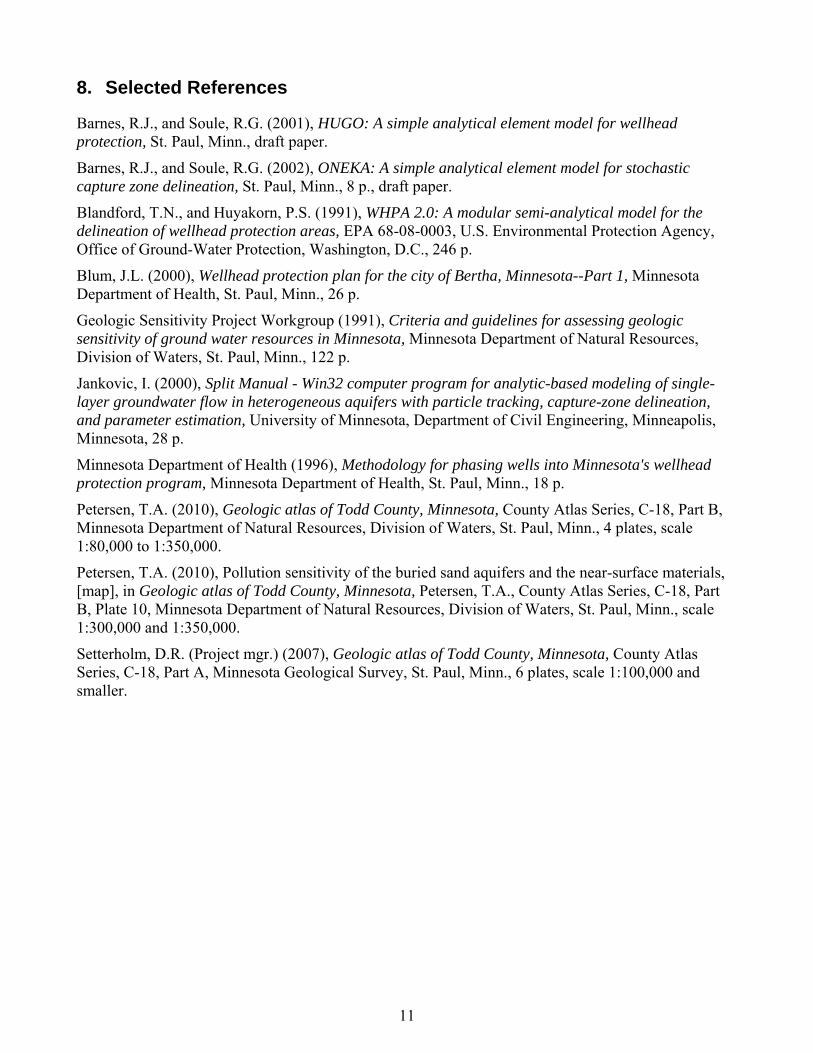
11
8. Selected References
Barnes, R.J., and Soule, R.G. (2001), HUGO: A simple analytical element model for wellhead protection, St. Paul, Minn., draft paper.
Barnes, R.J., and Soule, R.G. (2002), ONEKA: A simple analytical element model for stochastic capture zone delineation, St. Paul, Minn., 8 p., draft paper.
Blandford, T.N., and Huyakorn, P.S. (1991), WHPA 2.0: A modular semi-analytical model for the delineation of wellhead protection areas, EPA 68-08-0003, U.S. Environmental Protection Agency, Office of Ground-Water Protection, Washington, D.C., 246 p.
Blum, J.L. (2000), Wellhead protection plan for the city of Bertha, Minnesota--Part 1, Minnesota Department of Health, St. Paul, Minn., 26 p.
Geologic Sensitivity Project Workgroup (1991), Criteria and guidelines for assessing geologic sensitivity of ground water resources in Minnesota, Minnesota Department of Natural Resources, Division of Waters, St. Paul, Minn., 122 p.
Jankovic, I. (2000), Split Manual - Win32 computer program for analytic-based modeling of single-layer groundwater flow in heterogeneous aquifers with particle tracking, capture-zone delineation, and parameter estimation, University of Minnesota, Department of Civil Engineering, Minneapolis, Minnesota, 28 p.
Minnesota Department of Health (1996), Methodology for phasing wells into Minnesota's wellhead protection program, Minnesota Department of Health, St. Paul, Minn., 18 p.
Petersen, T.A. (2010), Geologic atlas of Todd County, Minnesota, County Atlas Series, C-18, Part B, Minnesota Department of Natural Resources, Division of Waters, St. Paul, Minn., 4 plates, scale 1:80,000 to 1:350,000.
Petersen, T.A. (2010), Pollution sensitivity of the buried sand aquifers and the near-surface materials, [map], in Geologic atlas of Todd County, Minnesota, Petersen, T.A., County Atlas Series, C-18, Part B, Plate 10, Minnesota Department of Natural Resources, Division of Waters, St. Paul, Minn., scale 1:300,000 and 1:350,000.
Setterholm, D.R. (Project mgr.) (2007), Geologic atlas of Todd County, Minnesota, County Atlas Series, C-18, Part A, Minnesota Geological Survey, St. Paul, Minn., 6 plates, scale 1:100,000 and smaller.

12
9. Figures

13
Figure 1. Wellhead Protection Area and Drinking Water Supply Management Area,
Bertha, Minnesota
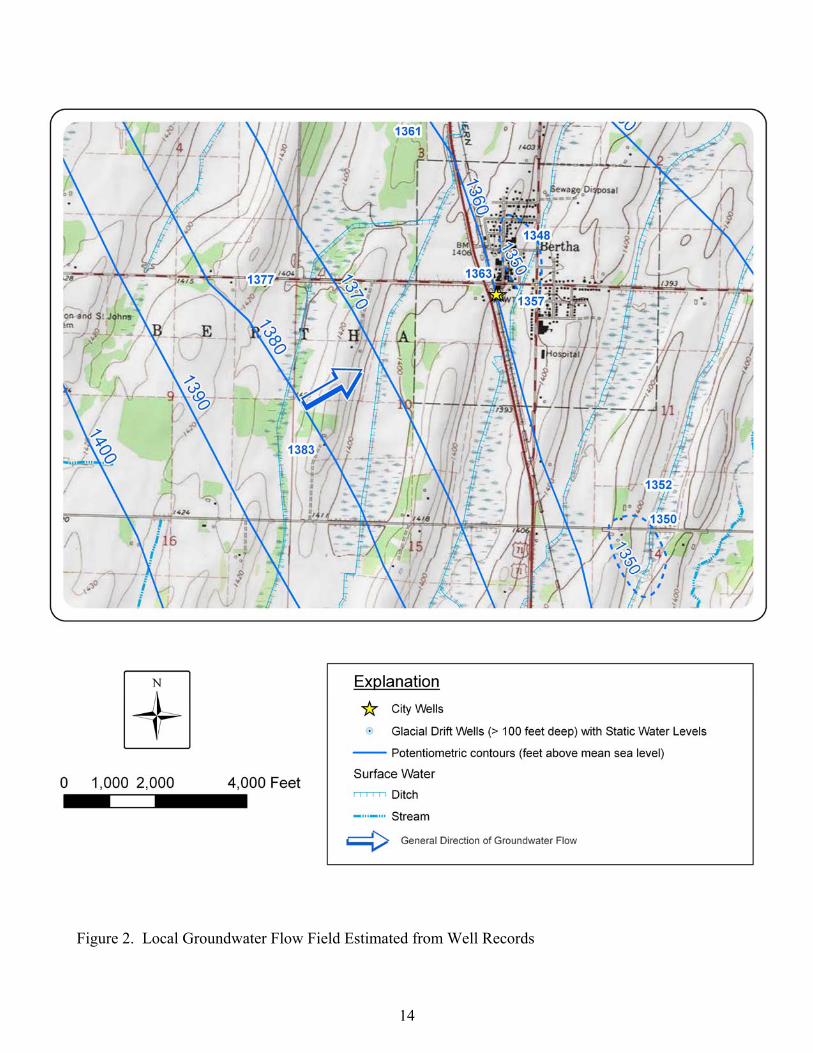
14
Figure 2. Local Groundwater Flow Field Estimated from Well Records

15
Figure 3. Database Map and Trends of Cross Sections
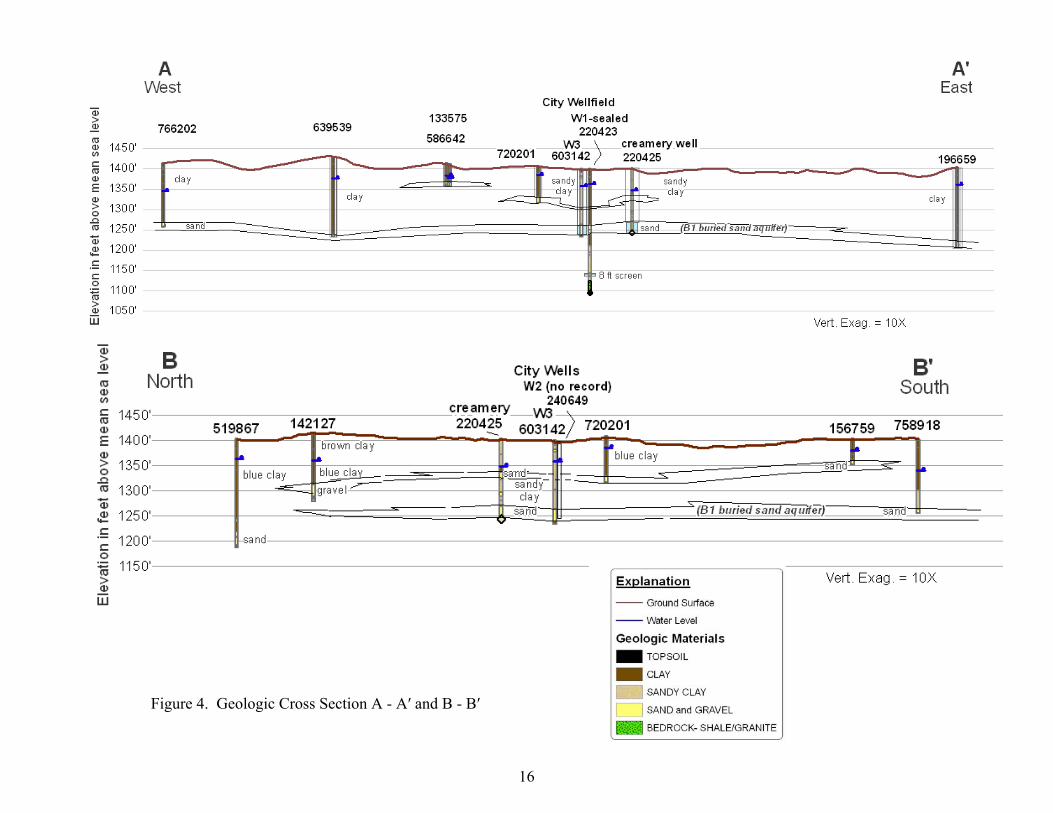
16
Figure 4. Geologic Cross Section A - A′ and B - B′

17
Figure 5. Combined 10-year Capture Zones from the WHPA Code and Oneka Models

18
Figure 6. Comparison Between New and Old WHPAs and DWSMAs

Appendix II:
Todd County GIS:
2008 Air Photo Map of Potential Contamination Sources (map and spreadsheet of wells identified)

_̂̂_
_̂
_̂_̂
_̂
_̂
10 11
23
COUNTY 24
COUN
TY 23
157T
HAV
E
CENT
RAL A
VE N
2ND
AVE
SW
COUN
TY 23
3RD
AVE
NE
CHERRYST NW
2NDST NW
CHERRYST NW
CHERRYST NE
1STST SW
MAIN ST E
KILBURNST NW
1ST
AVE
NE
1STST SE
2ND
AVE
NW
1ST
AVE
SE
3RD
AVE
SE
1STST NE
1STST NW
2ND ST NW2ND
ST NE
2ND
AVE
NE
2ND
AVE N
W
1STST NE
2ND
AVE
NW
1ST
AVE
SE
4TH ST NW
CENT
RAL A
VE S
HWY 71 N
1ST
AVE
NE
MAIN ST W
HWY 71 S
2ND ST SE
1STST SE
4THST NW
COUNTY 24
US 71
US 71
QUAI
L TRL
444TH ST
BERTHATOWNSHIP
Todd County Soil, Water, Conservation, Development DistrictGIS Unit
347 Central Ave - Ste 1Long Prairie, MN 56347Office: (320) 732-4248Fax: (320) 732-4803
City ofBertha
Wellhead ProtectionPlan
Potential Contamination Source Inventory
DWSMADWSMA
This map is a compilation of records and data located in various government offices affecting the area shown, and is to be used forreference purposes only. Todd County is not responsible for anyinaccuracies herein contained. Use of this map constitutes acceptance of this disclaimer. Please contact [email protected] to report discrepancies or errors.
I
_̂ PCSI_̂ City wells
Emergency Responce AreaWellhead Protection AreaDWSMACity of BerthaStreams
Bertha DWSMATodd County
Minnesota
0 660 1,320 1,980 2,640330Feet
Path: K:\Projects\Bertha\Projects\PCSI_Map11x17.mxd
Date: 2/16/2012
Map Resources:DWSMA, WPA, and ERA MN Department of Health information published December 29, 2010Road Network Todd County E911 System2008 Air Photography

CITY OF BERTHA:
POTENTIAL CONTAMINANT SOURCE INVENTORY FOR THE DRINKING WATER SUPPLY MANAGEMENT AREA
(Low Vulnerability)
HIG
H C
AP
AC
ITY
WE
LL
WE
LL
IN U
SE
UN
US
ED
or U
NS
EA
LED
WE
LL
CLA
SS
V W
ELL
S
BE
LOW
GR
OU
ND
STO
RA
GE
TA
NK
AB
OV
E G
RO
UN
D S
TO
RA
GE
TA
NK
(A
ST)
LEA
KY
UN
DE
RG
RO
UN
D T
AN
K (LU
ST)
OTH
ER
MAP # PARCEL NO. NAME PROPERTY ADDRESS WELL UNIQUE # COMMENTS
1 02.0008300 Wallace Harms 13295 County Rd 24, Bertha, MN 56437 133575, 586642 X 2 Wells are in use on property.
2 29.0001500 Jerold & Helen Dahms 101 US 71 North, Bertha, MN 56437 unknown X Residential Well (Not on MDH Well list)
3 29.0029200 Steven Greenwaldt; (BP Gas Station) 316 Main St. West, Bertha, MN 56437 n/a X City Water; monitoring wells sealed; 1 m.w. still in use
4 29.0002100 New Life of God Church 401 Main St. West, Bertha, MN 56437 720201 X Well for Church
5 29.0018900 Roger Brynlarksi; (Bertha Enterprises) 308 2nd Ave. NW, Bertha, MN 56437 220425 X Old Creamery Well; former interconnect with City Water System.
(Former creamery well is outside DWSMA)
02.0008400 Peter & Joan Wallner PO Box 245, Bertha, MN 56437 n/a Farm Bldg.'s w / no well. House & Well on West side of Rd.
City Well # 1 220423 Well Was Sealed in 1998; MDH Sealing # H0141074
NOTES:

Appendix III:
City of Bertha Contingency Strategy
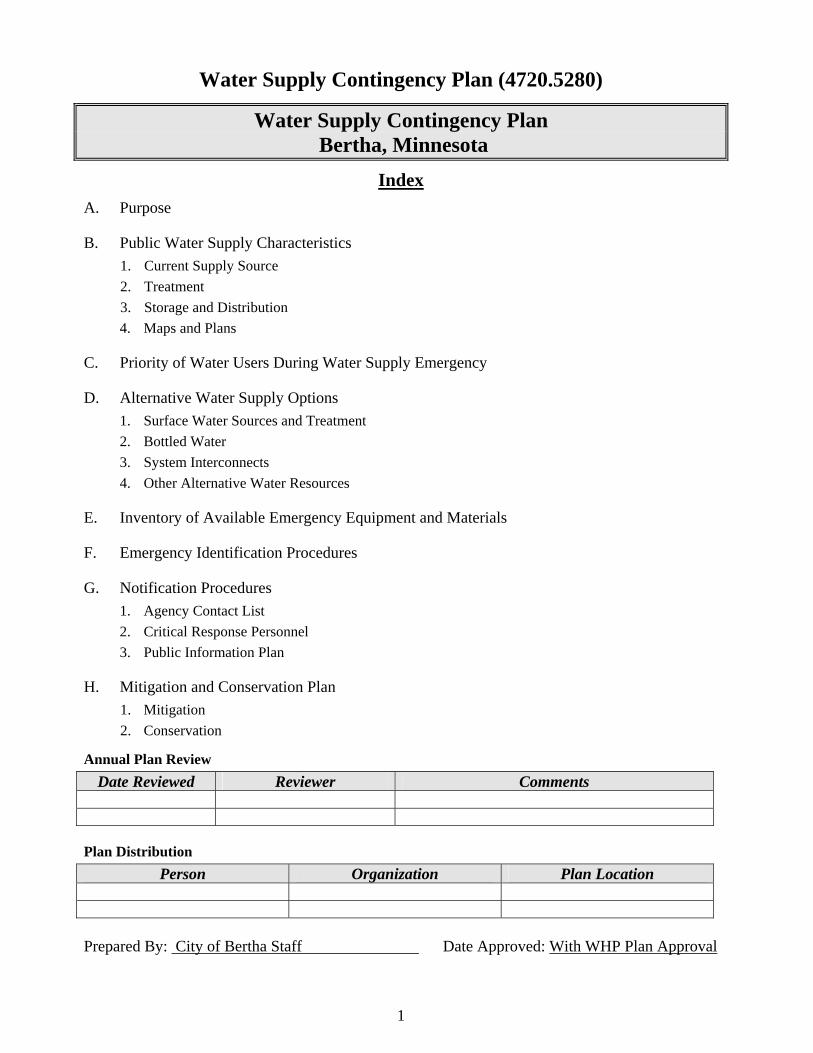
1
Water Supply Contingency Plan (4720.5280)
Water Supply Contingency Plan Bertha, Minnesota
Index
A. Purpose B. Public Water Supply Characteristics
1. Current Supply Source
2. Treatment
3. Storage and Distribution
4. Maps and Plans C. Priority of Water Users During Water Supply Emergency D. Alternative Water Supply Options
1. Surface Water Sources and Treatment
2. Bottled Water
3. System Interconnects
4. Other Alternative Water Resources E. Inventory of Available Emergency Equipment and Materials F. Emergency Identification Procedures G. Notification Procedures
1. Agency Contact List
2. Critical Response Personnel
3. Public Information Plan H. Mitigation and Conservation Plan
1. Mitigation
2. Conservation
Annual Plan Review
Date Reviewed Reviewer Comments Plan Distribution
Person Organization Plan Location Prepared By: City of Bertha Staff Date Approved: With WHP Plan Approval

2
A. Purpose
The purpose of this Contingency Plan is to establish, provide, and keep updated certain emergency response procedures and information for the City of Bertha, MN which may become vital in the event of a partial or total loss of public water supply services.
B. Public Water Supply Characteristics
1. Current supply source:
City of Bertha Well
Number 2 Well
Number 3
Unique Well # 240649 603142
Supply Source Sand Aquifer Sand Aquifer
Well Depth (ft.) 153’ 160’
Well Diameter (in.) 12” 8”
Well Capacity (gpm) 400 200
Well Production (gpm) 300 205
2. Treatment
The raw water is treated with chlorine and fluoride. In 2012 a new water treatment plant is to be built that will also add polyphosphate to sequester iron and manganese.
3. Storage and distribution The City of Bertha currently has one elevated storage tank with a capacity of approximately 56,000 gallons. The existing elevated storage tank and structure is old and will be replaced in 2012. Presently, the water distribution system serves 225 connections. Presently, the water distribution system is not entirely looped, but plans are to loop much of the system and eliminate dead ends as part of the water distribution upgrade project in 2012. City utility staff flush the system two or more times each year.
4. Maps/plans
The City of Bertha has current up to date maps of the water distribution system prepared and on file with Moore Engineering. Copies of the maps are stored at: City Hall, City Maintenance Shed and available through the city engineer.

3
C. Priority of Water Users During Water Supply Emergency Table C1: Water Use Priority Grouping
Priority Group and Rank Maximum Daily Use (gpd) Minimum Daily Use (gpd)
Residential #1 35,000 25,000
Institutional #2 12,000 8,000 (school)
Commercial #3 7,000 5,000
Industrial #4 n/a n/a
Unaccounted n/a n/a
Triggers for Implementing Water Supply Reduction/Allocation Procedures:
In the event of a major system disruption, failure, or an emergency, conservation procedures would be enacted by the Public Works Director, City Administrator, Mayor and City Council.
D. Alternative Water Supply Options
1. Surface water sources and treatment needs. There are no rivers near the City of
Bertha that could readily be used as a surface water source. However, the MN National Guard has the ability to provide the emergency treatment of surface waters for human consumption. (The MN National Guard has the ability to provide Reverse Osmosis Water Purification Units capable of supplying 1500 gph or 25 gpm of potable water.) In the event of a major disruption, the City of Bertha may request water purification equipment or tanks to haul up to 2,000 gallons of water from another city water supply to a distribution point or facility in an emergency for the City of Bertha. The following procedure is recommended for contacting the MN National Guard:
1. Contact the Todd County Sheriff (800) 794-5733 or 911 to request assistance from the MN National Guard.
2. Sheriff contacts the MN National Guard; Division of Emergency Management, State Duty Officer (800) 422-0798; and Community Support Group at (651) 282-4013 to request assistance needed for the city.
2. Bottled water supplies, delivery and distribution: The City of Bertha has identified
the following locations where they can obtain bottled water:
1. Wal Mart, Wadena, MN (218) 631-1068 2. Culligan, Wadena MN (218) 631-1579 3. Seven Oaks Express, Bertha, MN (218) 924-3302
3. System interconnects with other water supplies. Not applicable
4. New well. No other new wells are planned at this time. However, in the event that a city well goes down permanently from an emergency, the City of Bertha will contact the MDH District Engineer (320) 223-7339 to initiate procedures for constructing a replacement water supply well under emergency circumstances.

4
5. Emergency or backup wells: The City of Bertha does not have a designated emergency back-up well. However, the city operates 2 primary wells either of which could be operated separately to supply water in an emergency.
6. Emergency treatment of water system. The City of Bertha is in the process of purchasing a generator capable of supplying power to the water treatment plant and city wells. This is to be completed when the Bertha Authority Improvement Project is completed. In the event there are contaminants in the water the city’s treatment plant cannot address, treatment options will be discussed with the MDH District Engineer.
7. Source management (blending). The City presenting alternates pumping and blends water from the 2 municipal wells.
8. Other. No other alternatives have been identified by the city at this time.
E. Inventory of Available Emergency Equipment and Materials
Table E1 contains a list of services, equipment, and supplies that are available to the City of (system) to respond to a disruption in the water system. It is believed that the items contained in Table E1 would be adequate to respond to most (if not all) water system emergencies.
Table E1: Available Emergency Equipment and Materials
Description Owner Telephone Location Acquisition
Time
Well Repair Thein Well (800) 450-8000 Spicer, MN 4 hrs.
Pump Repair Northern Pump Co. (612) 382-3717 Lakeville, MN 4 hrs.
Electrician Nanik’s Electric
Kirby Kapphahn
(218) 445-5809
(612) 723-1516
Verndale, MN
Bertha, MN
2 hrs.
3hrs.
Plumber RC Plumbing (218) 924-2134 Bertha, MN 2 hrs.
Backhoe/Excavator Daryl Schlueter (218) 924-2784 Hewitt, MN 2 hrs.
Chemical Feed Hawkins (701) 293-9618 Fargo, ND 4 hrs.
Meter Repair Fargo Water (701) 237-0222 Fargo, ND 4 hrs.
Generator City of Bertha (218) 924-4454 Bertha, MN n/a
Valves, Pipe & Fittings
Northern Water Works Supply
(800) 437-4362 Fargo ND 4 hrs.

5
F. Emergency Identification Procedures
Table F1: Emergency Procedural Operations
Incident Response Procedure & Comments
Identify Disruption Person identifying disruption contacts City Hall. City clerk contacts Response Coordinator, and / or Alternate Response Coordinator.
Notify Response Personnel (Coordinator)
Response coordinator contacts others needed to help address the water supply emergency and disruption.
Identify Incident Direction and Control
Response coordinator or Alternate assesses situation and determines incident direction and control, begin solving problem
Identify Internal Communication
Response Coordinator or Alternate contacts City Hall, City Clerk and Mayor to inform of situation
Inform Public Response Coordinator or City Clerk contacts appropriate organizations to inform public of problem
Assess Incident on Continual Basis
Response Coordinator or Alternate continue to monitor/solve problem. Information is reported back to the city clerk, mayor and council as needed.
Assess Contamination Disruption
Response Coordinator or Alternate determines if water supply is contaminated working with Local, State and Federal agencies. Monitor/solve problem as needed
Assess Mechanical Disruption
Response Personnel Coordinator or Alternate assesses mechanical disruption. Monitor and solve disruption as needed.
Provide Alternate Water Supply
If needed, alternate water supply is located and provided.
Impose Water Use Restrictions
If needed, Public Works Director, City Administrator, Mayor and Council may impose water use restrictions.

6
G. Notification Procedures 1. Agency notification
Table G1 contains the names and telephone numbers for contacts at various local and state agencies that may be notified in the event of a public water supply system emergency. Based on the nature of the emergency and the information available, various representatives from this listing will be selected by the response coordinator to be part of the emergency oversight committee, which will then meet throughout the duration of the emergency to aid in decision-making and positive outcomes.
Table G1: Agency Emergency Contact Listing
Personnel Name Home Telephone Work Telephone
Public Works Director Adam Templin (218) 371-7399 (218) 371-7399
Mayor/Board Chair Dean Klebs (218) 924-2764 (218) 640-1379
Council Members Medley Shamp (218) 924-2041 --
Council Members Dennis Zimmerman (218) 639-1991 --
Council Members Darrell Hoemberg (218) 639-1409 --
Council Members Kristi Valley (218) 639-1424 --
Response Coordinator Adam Templin (218) 924-2894 (218) 371-7399 (c)
Alt. Response Coordinator Dean Klebs (218) 924-2764 (218) 640-1379
State Incident Duty Officer N/A N/A (800) 422-0798
County Emergency Director Michael Wisriewski (320) 533-4697 911
Fire Chief Pete Wallner (218) 924-4121 (218) 924-2121
Sheriff Pete Mikkelson -- (800) 794-5733
Police Chief Bobby Berndt 911 (218) 924-2100
System Operator Adam Templin (218) 924-2894 (218) 371-7399 (c)
Alt. System Operator Shaun Nelson (218) 316-2635 (218) 924-2250
School Superintendent Brian Koslofsky (218) 232-6970 (218) 924-2500
Ambulance Bertha Volunteers (218) 639-1658 911
Hospital Wadena Tri County n/a (218) 631-3510
Medical Facility or Doctor Bertha Medical Clinic n/a (218) 924-2250
Power Company MN Power & Light (800) 228-4966 (320) 360-5149
Todd Co. Highway Department Loren Fellbaum, Public Works (320) 285-3744 (320) 732-2722
State Highway Department MNDOT n/a 800-657-3971
Telephone Company ACS Communications n/a (800) 937-4227
Neighboring Water System City of Hewitt: (Aaron Fore) (218) 924-2442 (218) 924-4343
MPCA n/a n/a (800) 657-3864
MRWA Technical Services Dave Neiman (218) 820-0595 (cell) (800) 367-6792
MDH District Engineer John Groethe (320) 808-5009 (320) 223-7339
MDH Source Water Protection Mark Wettlaufer (320) 293-7991 (cell) (320) 223-7342
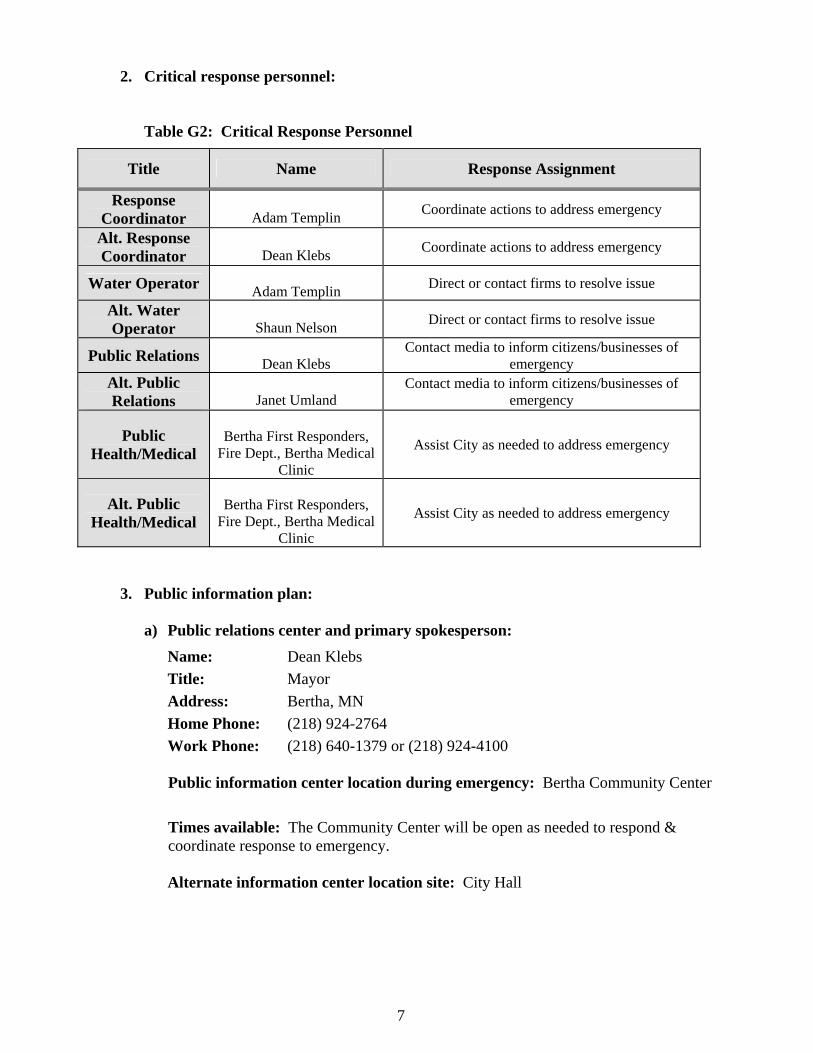
7
2. Critical response personnel: Table G2: Critical Response Personnel
Title Name Response Assignment
Response Coordinator
Adam Templin
Coordinate actions to address emergency
Alt. Response Coordinator
Dean Klebs
Coordinate actions to address emergency
Water Operator
Adam Templin Direct or contact firms to resolve issue
Alt. Water Operator
Shaun Nelson
Direct or contact firms to resolve issue
Public Relations
Dean Klebs Contact media to inform citizens/businesses of
emergency Alt. Public Relations
Janet Umland
Contact media to inform citizens/businesses of emergency
Public Health/Medical
Bertha First Responders,
Fire Dept., Bertha Medical Clinic
Assist City as needed to address emergency
Alt. Public Health/Medical
Bertha First Responders,
Fire Dept., Bertha Medical Clinic
Assist City as needed to address emergency
3. Public information plan: a) Public relations center and primary spokesperson:
Name: Dean Klebs
Title: Mayor
Address: Bertha, MN
Home Phone: (218) 924-2764
Work Phone: (218) 640-1379 or (218) 924-4100 Public information center location during emergency: Bertha Community Center
Times available: The Community Center will be open as needed to respond & coordinate response to emergency. Alternate information center location site: City Hall
8
b) Information checklist to be conveyed to the public and media:
1) Name of water system
2) Contaminant of concern and date
3) Source of contamination
4) Public health hazard
5) Steps the public can take
6) Steps the water system is taking
7) Other information
c) Media contacts:
Media Name Telephone Address
Newspaper
Independent News Herald (218) 738-2532 Clarissa, MN
Television
KCCO (612) 339-4444 Alexandria, MN
Radio KWAD KEYL
(218) 631-1803 (320)732-2164
Wadena, MN Long Prairie, MN
H. Mitigation and Conservation Plan
1. Mitigation
a) Infrastructure maintenance/upgrades/maps: The system is flushed 2 times a year. New water mains are being installed in 2012. Current water infrastructure maps are available at city hall and through Moore Engineering.
b) Regular inspection of tower, well, pump house: All of these items are inspected daily. The well house and chemical rooms have keyed entries and are locked. The water tower is cleaned by McGuire Iron every 5 years.
c) Staff emergency training: Staff receive annual training through the MN Rural Water Association.
d) System security analysis: The city has assessed the likelihood that vandalism may disrupt the water supply and has determined that this can best be avoided by locking all facilities and have keyed entries to buildings. Also, the sheriff department periodically drives by the water supply facilities.
e) Site new backup well: No back up well is planned at this time.
f) System valving to isolate problems: The water system is adequately valved to isolate problems.
9
g) Sanitation procedures for construction/repairs: The city has established
disinfection protocols identified by MDH that must be followed after repair or installation work has been performed on the water system and mains. The city has also enacted a cross control program to help reduce the possibility that contamination may be introduced into the water supply system.
h) Other: All connections are metered which allows for monitoring of water use except a few of the city buildings and churches.
2. Conservation
a) Water meters: All connections are metered and read quarterly by city staff.
b) Public education: The City of Bertha provides their Consumer Confidence Report
annually to water users. Water use conservation tips are occasionally included in the City Newsletter which is placed at area businesses. Water conservation is presented as part of tours of the water treatment plant when high school students visit. Also, the fourth grade class once a year do a coloring contest presented by MN Rural Water Association concerning water conservation as a topic for water week.
c) Rate structure: The City of Bertha reviews water rates on an annual basis. The city
charges a base rate of $18.50 for the first 3,000 gallons, then $1.15 per subsequent 1,000 gallons on a quarterly billing.
Related Documents