Welfare to Careers Welfare to Careers Medger Evers College Medger Evers College Metropolitan College of New York Metropolitan College of New York Pace University Pace University December 2, 2008

Welfare to Careers Medger Evers College Metropolitan College of New York Pace University December 2, 2008.
Dec 17, 2015
Welcome message from author
This document is posted to help you gain knowledge. Please leave a comment to let me know what you think about it! Share it to your friends and learn new things together.
Transcript

Welfare to CareersWelfare to Careers
Medger Evers CollegeMedger Evers CollegeMetropolitan College of New YorkMetropolitan College of New York
Pace UniversityPace University
December 2, 2008

Who are the WTC Students?Who are the WTC Students?
They ranged in age from 18 to 54 when they entered the program, with a mean age of 33.15 years.
The majority are women (98.4%) and single parents (93.3%).
84.3% are identified as African American/Black, while 13.1% are Hispanic/Latino.
42.4% enrolled in Medgar Evers College (n=97) and 57.6% entered Metropolitan College of New York (n=132).
Motivation to Enter the ProgramMotivation to Enter the Program
LocaCareer Oppor
College Reputation
Programs O
ffered
Childcare On Cam
pus
Other
Affordability
Degrees Offered
Location of Cam
pus
pportunities
Freq
uency
40
30
20
10
0

Educational PerformanceEducational Performance
112 participants earned a high school degree
• 45.5% earned these degrees before 1990
40 participants earned GEDs
• 80.0% since 1990
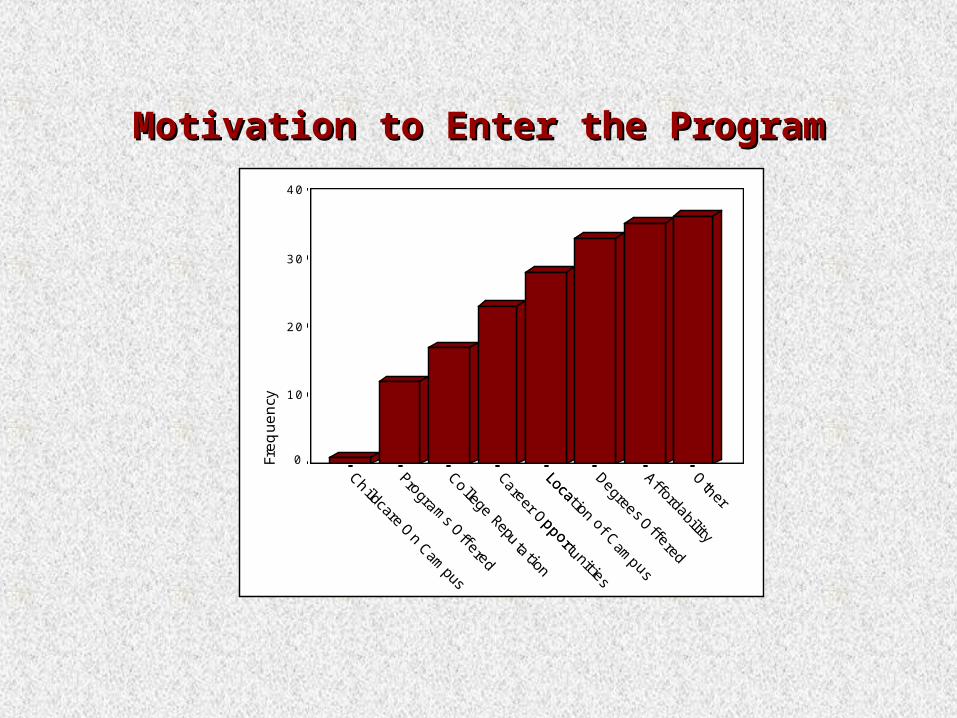
Their average GPA while in college is 2.77.
50.5% have earned a college degree and 11.7% remain registered in school.
Grade Point AverageGrade Point Average
4.003.75
3.503.25
3.002.75
2.502.25
2.001.75
1.501.25
1.00.75
.50.25
0.00
30
20
10
0
Std. Dev = .70 Mean = 2.78
N = 201.00

Student StatusStudent Status
Earned Degree
Dropped
Registered
Wi thd
rawn
Transferred
Not Registered
Repeating
Frequency
120
100
80
60
40
20
0
Metropolitan College
of New York
Medgar Evers College
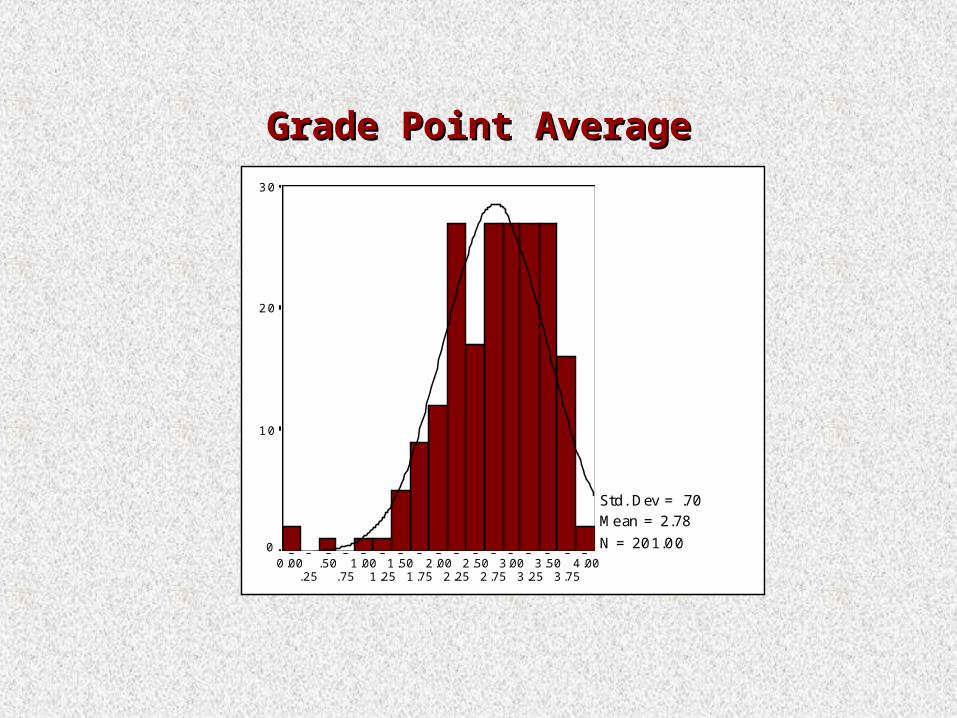
Graduation DatesGraduation Dates
MAY 08AUG 07
MAY 07DEC 06
JUN 06DEC 05
JUL 05MAY 05
AUG 04MAY 04
DEC 03MAY 03
AUG 02JAN 02
Frequency
20
10
0

Degrees EarnedDegrees Earned
BPSBAAAAS
Fre
quency
70
60
50
40
30
20
10
0
Metropolitan College
of New York
Medgar Evers College
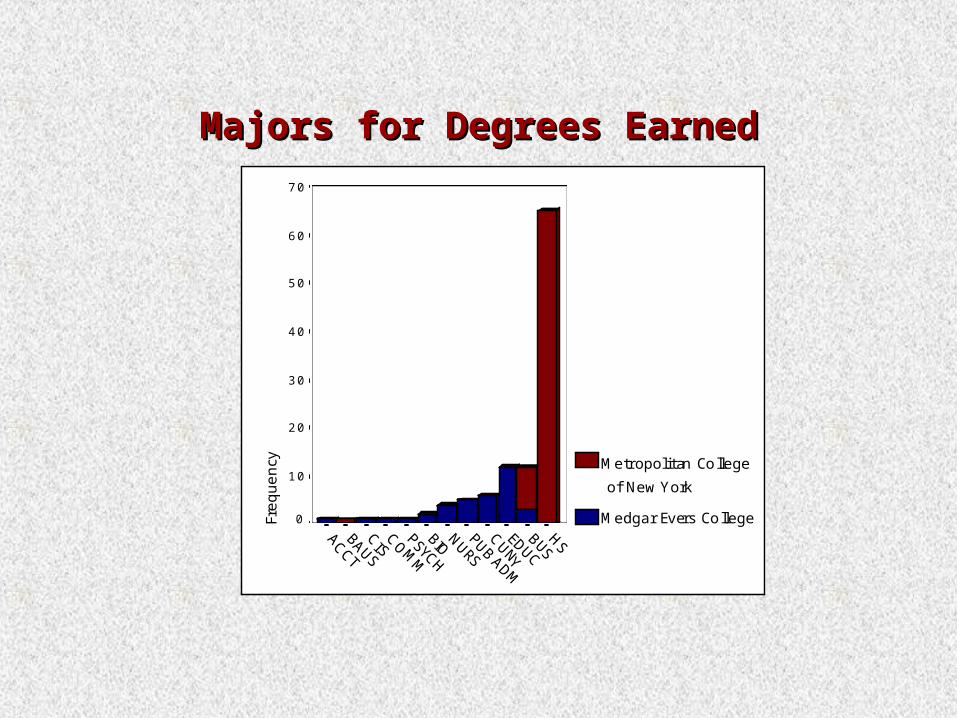
Majors for Degrees EarnedMajors for Degrees Earned
HS
BUSEDUC
CUNY
PUB ADM
NURS
BIOPSYCH
COM
M
CIS
BAUS
ACCT
Frequency
70
60
50
40
30
20
10
0
Metropolitan College
of New York
Medgar Evers College
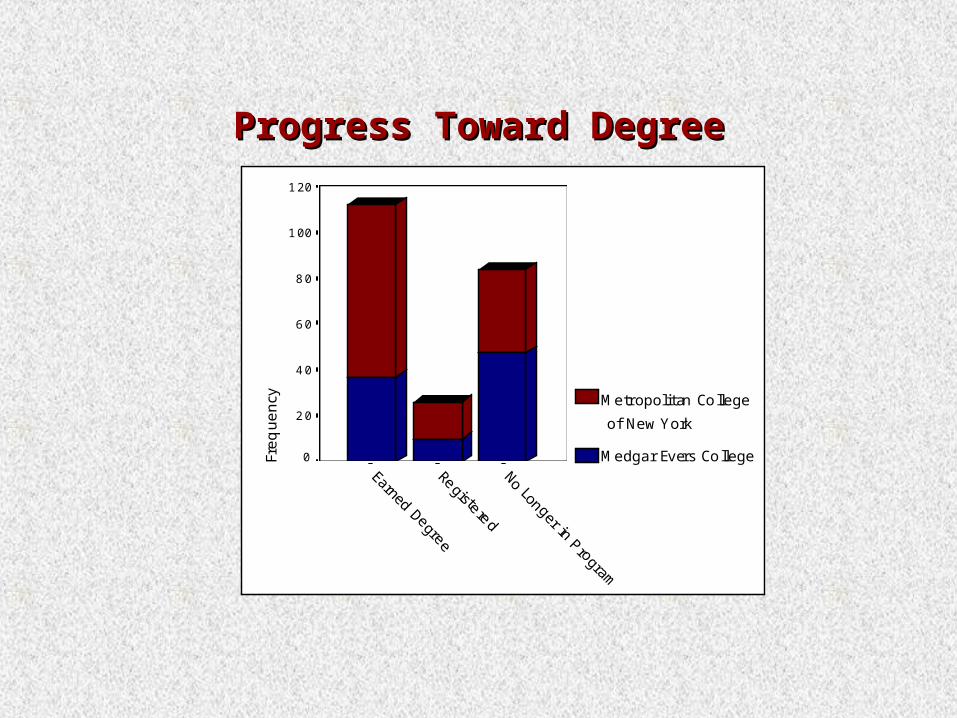
Progress Toward DegreeProgress Toward Degree
No Longer in Program
Registered
Earned Degree
Freq
uency
120
100
80
60
40
20
0
Metropolitan College
of New York
Medgar Evers College
ComparisonsComparisons
The following comparisons will assess the differences among those who
• have graduated,
• are still progressing toward a degree, and
• are no longer in the program.

CollegeCollege
There is some evidence that students enrolled in MCNY are more likely to earn a degree (p < .003).
No Longer in ProgramRegistered
Earned Degree
Fre
quency
80
60
40
20
0
Medgar Evers College
Metropolitan College
of New York

GPAGPA
Those who have graduated from the program have the highest GPAs (p < .01).
Mean GPAs
• Graduates = 3.05
• Progressing toward degree = 2.63
• No longer in the program = 2.37
No Longer in ProgramRegistered
GraduatedM
ean G
PA
3.2
3.0
2.8
2.6
2.4
2.2

MotivationMotivation
Motivation for entering the program was not related to successful completion.
No Longer in Program
Registered
Earned Deg
ree
Frequen
cy
120
100
80
60
40
20
0
Programs Offered
Other
Location of Campus
Degrees Offered
College Reputation
Childcare on Campus
Career Opportunities
Affordability

EmploymentEmployment
There is no statistical difference in part time and full time employment among the groups.
In all three categories, more individuals were employed full time.
No Longer in ProgramRegistered
Earned Degree
Fre
quency
120
100
80
60
40
20
0
PartTime
Full Time
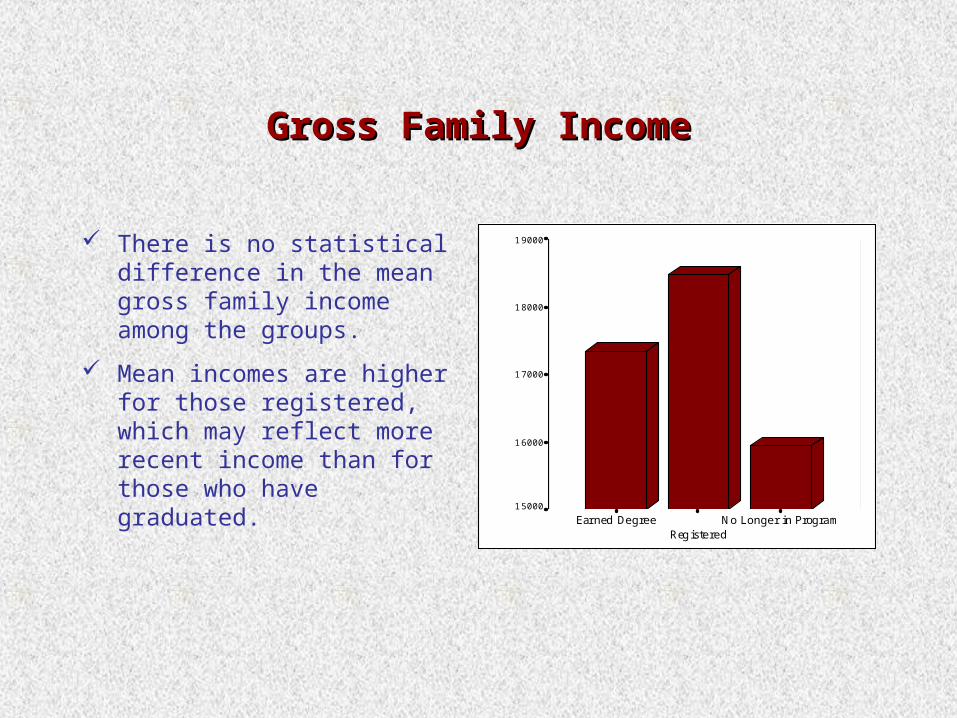
Gross Family IncomeGross Family Income
There is no statistical difference in the mean gross family income among the groups.
Mean incomes are higher for those registered, which may reflect more recent income than for those who have graduated.
No Longer in ProgramRegistered
Earned Degree
Mean G
ross
Fam
ily
Inco
me
19000
18000
17000
16000
15000

Employment Status and IncomeEmployment Status and Income
While it appears that those who work full time have a higher mean gross family income, it is not a statistically significant difference.
PartTimeFull Time
Me
an G
ross
Fam
ily Inco
me
22000
20000
18000
16000
14000
12000
10000

GraduatesGraduates
Upon completion of their degree, participants were asked whether the program was effective in meeting their:
• Educational Goals
• Personal Goals
• Employment Goals
No statistical differences were found between the two schools on these items.
Students were more likely to report that the program met their personal and educational goals.

Was the program effective in Was the program effective in meeting your educational goals?meeting your educational goals?
YesNo
Fre
quency
60
50
40
30
20
10
0

Was the program effective in Was the program effective in meeting your personal goals?meeting your personal goals?
YesNo
Fre
quency
50
40
30
20
10

Was the program effective in Was the program effective in meeting your employment goals?meeting your employment goals?
YesNo
Fre
quency
35
30
25
20
15
10
5
0
ConclusionConclusion
The WTC program is successfully helping a high risk population (many who earn high school degrees before 1990 or GEDs after 1990) enter college and earn degrees.
• 50.5% have earned college degrees
• 11.7% are progressing toward their degrees
• 5.4% indicated their reason for leaving the program was to transfer to another school

Questions for Further ResearchQuestions for Further Research
Further analysis is necessary to identify the factors that place individuals at risk for leaving the program and not completing their degrees.
Are there population or program differences that account for the differences in graduation and dropout/withdrawal rates for the two college?

What factors account for graduating students reporting that the program did not meet their employment goals.
• Are students expectations realistic?
• Are they using Career Services effectively?
• Are the factors external to the program?
Once factors affecting success are identified, can services be developed to improve retention and graduation rates.
Related Documents