WELFARE POLICY AND POVERTY

Welcome message from author
This document is posted to help you gain knowledge. Please leave a comment to let me know what you think about it! Share it to your friends and learn new things together.
Transcript
Despite unprecedented economic growth, substantial improvements in living standards and the achievement of full employment, Ireland still faces considerable challenges in ensuring the welfare of all its people.
For many, economic growth has not been matched by improvements in living standards, and there remains a segment of the population that is unable to escape from circumstances of severe disadvantage and exclusion.
Welfare Policy and Poverty reviews social welfare policy in Ireland over the past two decades and assesses its effectiveness in reducing poverty and social exclusion. It presents a thorough analysis of poverty trends over the period and examines the extent to which these have been influenced by social welfare policies and anti-poverty targets.
With contributions from a number of high profile authors, a comprehensive history of social policy development across a range of areas including health, education and disability unfolds, as well as insights into emerging issues in Irish society such as immigration. Drawing lessons from the past, each chapter contains proposals for future reform with a view to stimulating and informing this important debate.
This book marks several major milestones in the struggle to combat poverty in Ireland – the twentieth anniversary of the report of the Commission on Social Welfare, the twentieth anniversary of the Combat Poverty Agency and the tenth anniversary of the first National Anti-Poverty Strategy.
Bridgewater Centre, Conyngham Road, Islandbridge, Dublin 8 Tel: 01 670 6746 Fax: 01 670 6760 Email: [email protected] Website: www.combatpoverty.ie E20
WelfaRe PolICy anD PoveRty
Welfare P
olicy and Poverty
Welfare Policy and Poverty
Edited by Mel Cousins
AA Prelims 17/09/2007 16:48 Page iii
First published in 2007by theInstitute of Public Administration57–61 Lansdowne RoadDublin 4Irelandwww.ipa.ie
and
Combat Poverty AgencyBridgewater CentreConyngham RoadIslandbridgeDublin 8Irelandwww.combatpoverty.ie
© Combat Poverty Agency 2007
All rights reserved. No part of this publication may be reproduced or transmitted inany form or by any means, electronic or mechanical, including photocopying,recording or any information storage and retrieval system, without permission inwriting from the publisher.
ISBN: 978-1-904541-63-9
British Library cataloguing-in-publication dataA catalogue record for this book is available from the British Library
The views expressed in this text are the authors’ own and not necessarily those ofCombat Poverty Agency.
Publications and printed matter will be made available, on request, in a range offormats, including audio tape, large print, Braille and computer disc.
Cover design by Red Dog Graphic Design Consultants, DublinTypeset by Computertype, DublinPrinted in Ireland by Betaprint, Dublin
AA Prelims 17/09/2007 16:48 Page iv
Contents
Foreword vii
Acknowledgements xi
Chapter 1 Introduction Mel Cousins 1
Chapter 2 Monitoring poverty and welfare policy 1987–2007Jim Walsh 13
Chapter 3 Child poverty and child income supportsJohn Sweeney 59
Chapter 4 Working-aged people and welfare policyMary Murphy 101
Chapter 5 Income support for older peopleAnthony McCashin 139
Chapter 6 Education and povertyRoland Tormey 169
Chapter 7 Health and modern Irish society: The mother and father of a dilemmaCecily Kelleher 201
Chapter 8 Disability and povertyEithne Fitzgerald 229
v
AA Prelims 17/09/2007 16:48 Page v
Chapter 9 Migration and social inclusion policyJane Pillinger 259
Chapter 10 Developing an inclusive society: The way forwardMel Cousins 293
Glossary 325
Index 335
vi
AA Prelims 17/09/2007 16:48 Page vi
Foreword
In 1986 the Commission on Social Welfare published acomprehensive report on the operations of the social welfaresystem including how it related to the taxation system andother social services. It made a number of importantrecommendations to the then Minister for Social Welfare onthe implementation of an anti-poverty plan and it undertookan analysis of the distribution of national resources acrossdifferent income groups with regard to taxation, socialwelfare, education, health and housing.
At its inaugural meeting in 1983 the Minister requested thatthe Commission give priority to considering the establishmentof an organisation to combat poverty. The Commissionresponded to this request and proposed that such anorganisation should have a remit to advise the Minister onspecific measures to combat poverty in the community.
Subsequent to this recommendation, the Combat PovertyAgency was established as a state advisory agency todevelop and promote evidence-based proposals andmeasures to combat poverty in Ireland. It was set up underthe Combat Poverty Agency Act 1986, which sets out fourgeneral functions: policy advice, project support andinnovation, research, and public education. Since itsestablishment, Combat Poverty has sought to promote a justand inclusive society by working for a poverty-free Ireland.
vii
AA Prelims 17/09/2007 16:48 Page vii
Two decades after the Commission on Social Welfare, thesocial and economic context in Ireland has changeddramatically. From a country where the limitations of therevenue available to the exchequer severely restricted welfarepolicies, and where public concern centred on the problemsof unemployment and emigration, Ireland has become one ofEurope’s economic success stories. During this period,various structural reforms were introduced which helped to liftmany people out of poverty.
Recognising that the existence of poverty is an impedimentto growth, both socially and economically, another majordevelopment has been the increased role of the EuropeanUnion in putting poverty and social exclusion at the top of thepolicy agenda, resulting in the coordination of these policiesacross the member states. This commitment by thegovernments of the member states results from theagreement in Lisbon, in 2000, to develop systems of socialprotection and social inclusion which underpin thetransformation of the EU into a ‘knowledge economy’.
However, despite unprecedented economic growth, theachievement of full employment and substantialimprovements in living standards for most people, Ireland stillfaces considerable challenges in ensuring the welfare of all itscitizens. For many, economic growth has not been matchedby improvements in their standards of living and thereremains a segment of the population that is unable to escapefrom circumstances of severe disadvantage and exclusion.
Although there has been a significant reduction in consistentpoverty over the past two decades, it still affects 7 per centof the population. These people, numbering some 289,000 in2005, are living on very low incomes and are deprived of
viii
Welfare Policy and Poverty
AA Prelims 17/09/2007 16:48 Page viii
basic necessities such as adequate heating, clothing and/orfood. The number of people at risk of poverty has alsoremained high. Based on the agreed EU measurement forrelative poverty (60 per cent of the national median income –€193 per week in 2005), close to one in five people living inIreland are surviving on low incomes.
This book marks the twentieth anniversary of two keymilestones in the struggle to eradicate poverty and socialexclusion from Irish society – the report of the Commissionon Social Welfare and the establishment of the CombatPoverty Agency. It examines the progress made and thechanges experienced over the past two decades in a numberof key policy areas such as children, older people, people with disabilities and health. Reflecting the transformation of Irish society, it also deals with issuesthat did not exist twenty years ago, such as the integration ofimmigrants and the emergence of an intercultural society.
The Combat Poverty Agency wishes to thank all thecontributors to this book for sharing their experiences andexpertise. Together they have delivered a comprehensiveinsight into the key issues concerning poverty and socialinclusion within the current policy agenda in Ireland andidentified lessons for the future. Thanks are due in particularto Mel Cousins for his role in shaping this book and hisdedication in bringing it to fruition.
As Combat Poverty’s twentieth anniversary year draws to aclose, we hope that this book will advance thinking andstimulate debate on how the Irish welfare state can evolve toachieve the target of a poverty-free Ireland.
Combat Poverty Agency
ix
Foreword
AA Prelims 17/09/2007 16:48 Page ix

AA Prelims 17/09/2007 16:48 Page x
Acknowledgements
I would like to thank a number of people without whom thispublication would not have been possible. First and foremostI must express my sincere thanks to the authors whocontributed excellent chapters working to rather shortdeadlines. A number of people in the Combat Poverty Agencycontributed to the publication in the conception of the originalidea, its development into this book and by commenting onparticular chapters including Helen Johnston, Jonathan Healyand Kevin O’Kelly. In particular, I would like to thank BevinCody for her indispensable input and support.
Mel Cousins
xi
AA Prelims 17/09/2007 16:48 Page xi

AA Prelims 17/09/2007 16:48 Page xii
Chapter 1
Introduction
Mel Cousins
Introduction
The objective of this book is to provide an overview andanalysis of key issues concerning public policy on poverty andsocial inclusion in Ireland and to draw policy lessons for thefuture. This chapter sets out the book’s conceptual framework.
Building an inclusive society
Policies to combat poverty and social exclusion and to buildan inclusive society are recognised as critically important atboth national and international levels. Ireland was an innovatorin adopting a strategy-based approach to combating povertywith the publication of the National Anti-Poverty Strategy(NAPS) (Ireland, 1997). This document, which followed anextensive consultation process, provided an analysis of thelevel and causes of poverty, discussed the measures taken toaddress poverty and social exclusion and set specific targetsto be achieved through policy measures.1
1
___________
1 The NAPS was revised in 2002 (Ireland, 2002a and 2002b) andintegrated with the EU national action plan on social inclusion process.
Chapter 01 17/09/2007 16:49 Page 1
Subsequently, in 2000, the EU also endorsed a strategicapproach to poverty reduction with the adoption of nationalaction plans on poverty and social inclusion. The EU hasrecently established three overarching objectives for socialprotection and social exclusion policies and three specificobjectives in relation to the eradication of poverty and socialexclusion:2
(a) Social cohesion, equality between men and women andequal opportunities for all
(b) Effective and mutual interaction between different policyobjectives
(c) Good governance, transparency and the involvement ofstakeholders in designing, implementing and monitoringpolicy
(d) Access for all to the resources, rights and servicesneeded for participation in society
(e) Active social inclusion for all
(f) Well-coordinated social inclusion policies.
Ireland’s most recent social partnership agreement – Towards2016 – also recognises the importance of measures to buildan inclusive society (Ireland, 2006). A key policy focus overthe lifetime of this agreement involves ‘the development of aninclusive and sustainable economy and society’ and thesocial partners are committed to the achievement of ‘a
2
Welfare Policy and Poverty
___________2 Arising from a decision of the EU Council in March 2006, this process
brings together strategies in the areas of social inclusion, pensions andhealthcare: http://ec.europa.eu/employment_social/social_inclusion/objectives_en.htm
Chapter 01 17/09/2007 16:49 Page 2
participatory society and economy with a strong commitmentto social justice’.
Ireland has recently published its National Action Plan forSocial Inclusion 2007–2016 (NAPinclusion) (Ireland, 2007a),which builds on commitments in the National DevelopmentPlan 2007–2013 (Ireland, 2007b) and in Towards 2016 and isdiscussed in later chapters.
The importance of setting targets and reviewingprogress
An essential part of a policy to combat poverty and socialexclusion is the setting of targets and indicators and themonitoring of progress to achieve the objectives set instrategy documents. This is recognised at both national andEuropean (Social Protection Committee, 2006) levels, wherespecific targets and indicators of progress have beenestablished in a range of different policy areas. An importantpart of the implementation of the national action plans onsocial inclusion is the monitoring of progress towards themeeting of objectives (see objective c). And, as part ofTowards 2016, the social partners agree that it is important to set real and achievable targets for social inclusionmeasures and to set out specific policy measures to reviewprogress.
It is now very timely to review the progress which Ireland hasmade towards reducing and, where possible, eliminatingpoverty and social exclusion. 2007 marks the tenthanniversary of the publication of the original National Anti-Poverty Strategy and the closing date for the achievement of the targets set in that document (and revised in 2002). It is also the twentieth anniversary of the Commission on
3
Introduction
Chapter 01 17/09/2007 16:49 Page 3
Social Welfare and it is therefore appropriate to reviewdevelopments in welfare policy given the dramatic changesin Irish society over that period.
This publication will review key policy measures taken tocombat poverty and social exclusion in recent years. It willestablish the extent to which progress has been made toachieve targets (or in line with indicators) set in the EU andthe Irish strategy documents. It will also identify newissues which have arisen in recent years such as thechallenges posed by and opportunities arising from thesignificant increase in the level of migration into Ireland.Finally, it will evaluate the positive and negative aspects ofmeasures adopted (or not adopted) in particular policyareas and suggest what needs to be done to ensure thedevelopment of a truly inclusive society.
What is poverty and social exclusion?
The Combat Poverty Agency has always taken a broadand relative definition of poverty and social exclusion. This approach is also adopted in the definition of poverty underpinning the NAPinclusion (Ireland, 2007, p.21):
People are living in poverty if their income andresources (material, cultural and social) are soinadequate as to preclude them from having a standardof living which is regarded as acceptable by Irish societygenerally. As a result of inadequate income and otherresources people may be excluded and marginalisedfrom participating in activities which are considered thenorm for other people in society.
4
Welfare Policy and Poverty
Chapter 01 17/09/2007 16:49 Page 4
There are many different ways in which to measure povertyand social exclusion including the ‘risk-of-poverty’ (or relativeincome poverty) approach adopted by the EU and the‘consistent poverty’ measure used in setting targets for theIrish NAPS (see Chapter 2). The pros and cons of differentmeasures have been discussed extensively elsewhere (seeSocial Welfare Benchmarking and Indexation Group, 2001;Maître et al., 2006) and it is not intended to reopen thediscussion in this book. From a conceptual point of view,poverty and social exclusion are multidimensional and nosingle indicator can fully capture these complex phenomena.As Maître et al. (2006, p. 2) state, ‘when dealing with aphenomenon as complex and multi-faceted as poverty, thereis a strong argument for not relying on any single measure orindicator’. Rather, a range of tiered and interrelated povertyreduction targets may be more appropriate. From a practicalpoint of view, a range of targets and indicators has alreadybeen established using one or other measure of poverty andthis book draws on these different indicators to establish theextent to which policy measures have been able to achievethe targets set by policy-makers.
The broader context
One important context for this review of policy is the NationalEconomic and Social Council’s 2005 publication TheDevelopmental Welfare State. This study is perhaps the mostimportant social policy report the NESC has published in itsthirty-year history and it sets out a clear and intellectuallyargued rationale for a specific approach to welfare.
While recognising Ireland’s strong economic performance, theNESC (2005, p. xiii) starts from the position that:
5
Introduction
Chapter 01 17/09/2007 16:49 Page 5
Ireland’s welfare state and social policies … need tochange further if they are to (i) address the deep-rootedsocial disadvantage of a section of the population that hasshown little mobility off means-tested social assistance, (ii)support people at work as they seek to maintain andimprove their participation in the economy, and (iii) set andreach wholly new standards in how people with disabilitiesand people in institutional care are supported.
The report argues that ‘good economic performance andimproved social protection are neither intrinsically opposednor compelled to occur together in some automatic way’ (p. xiii). Rather, the NESC claims that they can be made tosupport each other and that social policy is ‘not simply anexercise in redistributing a surplus there to be creamed offafter a successful economic performance’ but can contributeto or detract from economic success (p. xiii). The NESC seesIreland as a ‘hybrid’ welfare state combining aspects of otherEuropean models. However, one distinguishing feature is thatIreland uses a ‘moderate to low proportion of nationalresources in providing services and a low proportion inproviding cash transfers’ despite its relatively wealthy statusin EU terms (p. xvi; see also Timonen, 2003).
The NESC proposes a developmental welfare state consistingof three overlapping areas of activity: services (includingeducation, health, childcare, eldercare, housing, transport andemployment services), income supports and activist orinnovative measures.3 It sees access to a wide range ofservices as essential ‘to attaining the workforce quality that
6
Welfare Policy and Poverty
___________3 Because the focus of this book is on national policy we do not focus,
in detail, on the area described by the NESC as involving activist orinnovative measures.
Chapter 01 17/09/2007 16:49 Page 6
underpins a competitive, knowledge-based economy, tomaintaining social cohesion and combating social exclusion’(p. xix). The Council argues that ‘the development of adynamic, knowledge-based economy has inherent socialimplications that can serve social justice and a moreegalitarian society’ and that a move to the developmentalwelfare state is integral to sustaining the dynamism andflexibility of Ireland’s economy (p. xxiii).
The NESC’s approach is clearly influenced by that of Polanyi(1944), who argued that rather than, as economic theorywould suggest, society being subordinate to markets, asuccessful market economy is, in fact, impossible unless it isembedded in society. It also reflects much recent workwhich has emphasised the positive relationship between theeconomy and business and the development of the welfarestate (for example Swenson, 2002; Mares, 2003; Iversen,2005).
It is also important to place issues concerning poverty andsocial inclusion in the broader context of the developingdiscourse around equality and rights-based approaches.Poverty and social exclusion do not, of course, affect allsections of society equally. It has always been the case thatparticular groups, on the basis of, for example, gender,disability or ethnicity, have suffered from particular (andoften cumulative) disadvantages. This emphasises theimportance and value of the equality approach, which isrecognised in the EU national action plan on social inclusionframework (objective a): ‘to promote … equality betweenmen and women and equal opportunities for all throughadequate, accessible, financially sustainable, adaptable andefficient social protection systems and social inclusionpolicies’.
7
Introduction
Chapter 01 17/09/2007 16:49 Page 7
From a legal point of view, Ireland has introduced quitecomprehensive equality legislation (Equal Status Acts 2000 to2004). It has also established a statutory Equality Authoritywhich seeks to achieve positive change in the situation andexperience of those groups and individuals experiencinginequality. This is achieved by stimulating and supporting acommitment to equality within the systems and practices ofkey organisations and institutions as part of the culturalvalues espoused by society and as a dimension to individualattitudes and actions. Nonetheless, there remains a challengeto ensure that principles set out in law are implemented inpractice in all areas of anti-poverty policy.4 This can be ofparticular importance in relation to policies for migrants andethnic minority groups such as Travellers.
A third important contextual issue is the development of amore rights-based approach to anti-poverty policies. In manycases, groups suffering from poverty and social exclusionmay also experience discriminatory attitudes both in societygenerally and in the provision of services. The establishmentof legal rights to services can form an important means bywhich disadvantaged groups can overcome discrimination.Indeed, the importance of rights is recognised in the EUframework and one of the common objectives refers to‘access to all to the … rights … needed to participate insociety’ (objective d). In Ireland, some social services – suchas the social welfare system – are almost entirely rights-
8
Welfare Policy and Poverty
___________4 As can be seen in the case of gender equality, where, for example, the
establishment and implementation of equal pay legislation has still notachieved the objective of ensuring that men and women receivebroadly similar remuneration (taking account of factors such asexperience, qualifications etc.) (see Russell and Gannon, 2002, whofind that a significant pay gap remains).
Chapter 01 17/09/2007 16:49 Page 8
based. However, in other areas, services are provided on amore discretionary and budget-limited basis.
Ireland has adopted a number of important pieces of rights-based legislation, in addition to the Equal Status Acts, suchas the European Convention on Human Rights Act 2003 andthe Mental Health Act 2001.5 However, national strategydocuments on poverty and social inclusion remain somewhatambiguous about the role of a rights-based approach in ananti-poverty strategy, preferring to focus on issuesconcerning quality of service delivery. See, for example, therecent NAPinclusion (Ireland, 2007), which makes frequentreference to ‘access to quality services’.
Structure of the book
The book analyses key developments in anti-poverty policy inIreland. In order to do so, individual chapters focus onparticular policy areas. However, a number of key cross-cutting issues are addressed across chapters. In particular,we have tried to identify the impact of gender in relation toeach of the specific policy areas covered and to makereference to gender data and developments of particularrelevance from a gender perspective. In addition, questionsconcerning equality and rights-based approaches arediscussed where appropriate. Finally, chapters makereference to the EU context insofar as this is relevant.
In Chapter 2, Jim Walsh provides an overview of trends inrelation to poverty since 1987. Drawing on data from the
9
Introduction
___________5 Ireland has also ratified a number of international rights-based
instruments, for example the UN Convention on the Rights of theChild.
Chapter 01 17/09/2007 16:49 Page 9
Living in Ireland Survey and the EU Survey of Income andLiving Conditions, this chapter provides a general overview ofdevelopments in relation to income distribution and povertyand deprivation trends in Ireland over the period in question,putting them in a European context.
Following the approach set out by the NESC in TheDevelopmental Welfare State, the book adopts a lifecycleapproach with individual chapters on income support as itconcerns children, people of working age and older people.In Chapter 3, John Sweeney focuses on issues concerningchildren and income poverty and examines key questionsconcerning the structure of welfare support for children inIreland. In Chapter 4, Mary Murphy looks at pivotal topicsconcerning people of working age from a povertyperspective, including the extent to which people inemployment may be at risk of poverty, issues concerningunemployment, activation strategies to help people make thetransition from welfare to employment and strategies toensure that those in work can obtain quality employment. InChapter 5, Tony McCashin examines current policies toprovide income support for older people, the extent to whichsuch policies are succeeding in their objectives and crucialquestions concerning pension policy.
Given their importance from a poverty perspective, and giventhat quality services are a key objective of the CombatPoverty Agency’s strategic plan (CPA, 2005),6 the bookincludes chapters on education and healthcare. In Chapter 6,Roland Tormey looks at education and poverty, focusing on
10
Welfare Policy and Poverty
___________6 The Agency’s current strategic plan (2005–2007) sets out three
strategic objectives: distribution of income and jobs, access to qualityservices, and local and regional responses to poverty.
Chapter 01 17/09/2007 16:49 Page 10
primary and secondary education and examining issues suchas access to education and the impact of poverty and socialclass on educational outcomes. In Chapter 7 on healthcare,Cecily Kelleher considers key questions concerning healthcareand poverty including access to healthcare and thedeterminants of health outcomes.
In recognition of the importance of disability, and given therecent adoption of the Disability Act, it is important to examinethe close relationship between disability and poverty. InChapter 8, Eithne Fitzgerald looks at recent developments inrelation to disability (including the implementation of theNational Disability Strategy) and identifies key issues andchallenges.
The issue of migration did not really feature in the 1997 NAPS or the 2002 revised NAPS, however recent migrationlevels mean that it must be addressed now as part of anoverall review of poverty and social inclusion in Ireland. Giventhe very significant increase in migration into Ireland over thepast decade, Jane Pillinger looks specifically at migrationissues from a poverty and social inclusion perspective inChapter 9.
The concluding chapter brings together the major themesexplored in the book and identifies key challenges andpossible options from a public policy perspective.
References
CPA (2005), Working for a Poverty-Free Ireland, Dublin: Combat PovertyAgency
Ireland (1997), Sharing in Progress: National Anti-Poverty Strategy, Dublin:Stationery Office
11
Introduction
Chapter 01 17/09/2007 16:49 Page 11
Ireland (2002), Building an Inclusive Society: Review of the National Anti-Poverty Strategy under the Programme for Fairness and Prosperity,Dublin: Department of Social, Community and Family Affairs
Ireland (2006), Towards 2016: Ten-Year Framework Social PartnershipAgreement 2006–2015, Dublin: Stationery Office
Ireland (2007a), National Action Plan for Social Inclusion 2007–2016,Dublin: Office for Social Inclusion
Ireland (2007b), Transforming Ireland: A Better Quality of Life for All,National Development Plan 2007–2013, Dublin: Stationery Office
Iversen, T. (2005), Capitalism, Democracy and Welfare, Cambridge:Cambridge University Press
Maître, B., Nolan, B. and Whelan, C. T. (2006), Reconfiguring theMeasurement of Deprivation and Consistent Poverty in Ireland, Dublin:ESRI
Mares, I. (2003), The Politics of Social Risk, Cambridge: CambridgeUniversity Press
NESC (2005), The Developmental Welfare State, Dublin: NationalEconomic and Social Council
Polanyi, K. (1944), The Great Transformation: The Political and EconomicOrigins of Our Time, Boston: Beacon Press
Russell, H. and Gannon, B. (2002), ‘The Male/Female Wage Gap inIreland’, in Impact Evaluation of the European Employment Strategy inIreland, Dublin: Department of Enterprise, Trade and Employment
Social Protection Committee (2006), Portfolio of Overarching Indicatorsand Streamlined Social Inclusion, Pension, and Health Portfolios,Brussels: European Commission
Social Welfare Benchmarking and Indexation Group (2001), Final Report ofthe Social Welfare Benchmarking and Indexation Group, Dublin:Stationery Office
Swenson, P. (2002), Capitalists against Markets: The Making of LaborMarkets and Welfare States in the United States and Sweden, NewYork: Oxford University Press
Timonen, V. (2003), Irish Social Expenditure in a Comparative InternationalContext, Dublin: Combat Poverty Agency
12
Welfare Policy and Poverty
Chapter 01 17/09/2007 16:49 Page 12
Chapter 2
Monitoring poverty and welfare policy1987–2007
Jim Walsh1
Introduction
This chapter presents an overview of trends in relation topoverty and welfare policies since 1987 and provides thefundamental evidence base which will be further developed inthe thematic chapters. Poverty and welfare policies can beseen as two sides of the one coin. Poverty trends are heavilyinfluenced by government welfare and tax policies whichinfluence the income levels of the population. Welfare and taxpolicies are the most tangible government instruments torespond to poverty trends and are central to the preparationof anti-poverty policies, especially for groups outside thelabour market such as children and older people.
The chapter begins with a review of key developments inpoverty and welfare policy over the last twenty years. Itpresents the findings on poverty trends since 1987, the date
13
___________1 This chapter was written while on a visiting research fellowship at The
Policy Institute, Trinity College, Dublin.
Chapter 02 17/09/2007 16:49 Page 13
of the first national poverty survey. These are compared withpoverty levels in the EU, using common statistical indicatorsdeveloped under the open method of policy coordination onpoverty and social exclusion. The chapter also looks at theevolution of welfare rates over the last twenty years andanalyses the distributive and poverty impact of tax andwelfare policies, in particular under the ten years of theNational Anti-Poverty Strategy (NAPS). Finally, the chapterdraws a number of conclusions for poverty and welfarepolicy.
Key developments
Three key developments are identified in relation tomonitoring poverty and welfare policy over the last twodecades. In terms of poverty, the main developments are theinitiation of regular poverty surveys and reports and theestablishment of official measures of poverty. Regardingwelfare policies, the key development is the establishmentof official benchmarks for welfare adequacy. Underpinningthese developments is an enhanced policy focus on povertyat both national and European levels, as reflected in theNAPS and the EU social inclusion process.
Regular poverty surveys and reportsThe first poverty survey dates from 1987 and was followedby two extended surveys covering the periods 1994 to 2001and 2003 onwards. These dedicated surveys have provideda comprehensive database for understanding the nature andextent of poverty in Ireland, for establishing a comparativeframework on poverty levels across the EU and for informingthe development of anti-poverty policies.
14
Welfare Policy and Poverty
Chapter 02 17/09/2007 16:49 Page 14
Official measures of povertyThe adoption of official measures (or social indicators) ofpoverty is a relatively recent development, dating initially from1997 and later extended in 2001, and is directly linked to theidentification of poverty as a public policy priority at bothnational and European levels. The Irish government firstadopted an official poverty measure as part of the NAPS in1997. The measure was derived in the first instance from theofficial definition of poverty contained in the strategy (Ireland,1997, p. 3):
People are in poverty if their income and resources(material, cultural and social) are so inadequate as topreclude them from having a standard of living which isregarded as acceptable by Irish society generally. As aresult of inadequate income and resources, people may beexcluded and marginalised from participating in activitieswhich are considered the norm for other people in society.
The definition reflects a relative understanding of poverty,based on prevailing living standards. It also highlights theimportance of measuring both inadequate income and a lackof resources. In line with this, the government-approvedmeasure of poverty is a combination of low income anddeprivation of one or more ‘basic lifestyle items’, firstdeveloped by the Economic and Social Research Institute(ESRI) in the early 1990s (Callan et al., 1993; Nolan andWhelan, 1996). Basic lifestyle items include going withoutfood, clothing and heating or experiencing debt due toordinary living expenses, and low income was defined as apercentage of average income (both 50 and 60 per centthresholds are used). This combined income and deprivationmeasure was officially termed ‘consistent poverty’ and usedas the means to express the official government target to
15
Monitoring poverty and welfare policy 1987–2007
Chapter 02 17/09/2007 16:49 Page 15
reduce poverty under the NAPS and its current successor, theNational Action Plan for Social Inclusion 2007–2016(NAPinclusion).2
Consistent poverty is both a measure of poverty and anexpression of a political commitment to tackle poverty. Thishas elevated the status of consistent poverty from a socialindicator of poverty to being the litmus test of governmentprogress on poverty. Monitoring of this indicator/target wasthe responsibility of the ESRI and later the Central StatisticsOffice (CSO). No other poverty measure was identified in theNAPS, although it contained other poverty targets relating toemployment, education and income (housing and healthtargets were added in the 2002 review of the NAPS).
Alongside the designation of a national consistent povertymeasure were developments at European level regarding theselection of agreed measures of poverty. These arose in2001, when, as part of the EU open method of coordinationon poverty, the European Council adopted a set of ‘commonstatistical indicators’ to monitor trends in poverty and socialexclusion in member states across Europe.3 The indicatorswere designed as a balanced and evolving portfolio selectedon a number of normative principles and capturing thediversity of poverty and social exclusion, including income,education, employment, health and material deprivation.
16
Welfare Policy and Poverty
___________2 This was articulated as the global poverty reduction target, with the
aim to reduce the numbers in consistent poverty to between 5 and 10per cent and later to 2 per cent or less by 2007, ‘as measured by theESRI’. The latest formulation is to reduce consistent poverty tobetween 2 and 4 per cent by 2012, with the aim of eliminatingconsistent poverty by 2016, under the revised ESRI definition.
3 The indicators were developed by the Social Protection Committee(2001), informed by a scientific study by Atkinson et al., 2002.
Chapter 02 17/09/2007 16:49 Page 16
A recently revised list of twenty-four indicators (building on aprevious list of eighteen) is broken down into threecategories: primary or lead indicators, secondary orsupporting indicators and context or interpretation indicators.There is also provision for a further set of national indicatorsto reflect the exigencies of the social situation in memberstates (Social Protection Committee, 2006).
At the core of the EU indicators is the standard measure ofrelative income poverty, defined as the percentage of thepopulation below 60 per cent of median income and officiallyreferred to as the ‘risk-of-poverty’ rate. This uniquenomenclature is used to imply that this is not a measure ofpoverty per se, but of the likelihood of poverty (Nolan,2006a).4 Median income is defined at the level of individualmember states and not on an EU-wide basis. However,because the value of the 60 per cent median will vary overtime and between countries, the indicator is to beaccompanied by a statement of value in national andpurchasing power standard currency. Variations of the risk-of-poverty rate are used for a number of other indicators.
There are two other financial indicators, both relating toincome distribution: the income quintile ratio (ratio of totalincome received by the richest 20 per cent of the nationalpopulation to that received by the poorest 20 per cent) andthe Gini coefficient (summary measure of income equalityranging from 0 to 1). The non-financial indicators of povertyare of a more generic nature and relate to causes of poverty,including long-term unemployment, jobless households, early
17
Monitoring poverty and welfare policy 1987–2007
___________4 Risk of poverty is more traditionally used in the technical sense to refer
to the proportion of any population group which falls below therelevant poverty standard (Callan et al., 1996b).
Chapter 02 17/09/2007 16:49 Page 17
school-leaving, low educational attainment, reading literacy,employment of migrants and life expectancy. Two additionalcategories are material and housing deprivation and childwellbeing; the specific details of these indicators are still tobe developed. Reporting on these indicators is theresponsibility of Eurostat, drawing on a variety of datasources including the European Union Survey of Income andLiving Conditions (EU-SILC).
The two official measures of poverty – consistent poverty andrelative income poverty – have greatly influenced theunderstanding of poverty in the Irish context and of trendsover time. However, there has also been a tension betweenthe two measures, especially given the changing economiccircumstances in Ireland and the widening divergencebetween the two measures as to the numbers in poverty (seebelow). The relative income/risk-of-poverty measure has beendownplayed as a legitimate way to measure poverty bygovernment and some social commentators. Criticisms focuson three aspects: it confuses poverty with income inequality,it is misleading in a situation where living standards (andwelfare rates) are rising in real terms and it is not suited tocomparing countries at different stages of development(Social Welfare Benchmarking and Indexation Group, 2001;Beblavy and Mizsei, 2006; Ireland, 2007). Thus, theNAPinclusion 2007–2016 views the risk-of-poverty measureas ‘not … [a] measure [of] poverty as such, but rather theproportion of people below a certain income threshold’(Ireland, 2007, p. 25). Income poverty, though an EU indicatorof poverty, has far less status in Ireland than the national(consistent) poverty measure.
The consistent poverty measure has also attracted somecriticism, notably in relation to its unchanged nature since
18
Welfare Policy and Poverty
Chapter 02 17/09/2007 16:49 Page 18
1987 and methodological issues arising from a change insurvey format (from the Living in Ireland Survey [LIS] to theEU-SILC). It has been suggested that this resulted in a loss ofcredibility for the consistent poverty measure, leading oneacademic analyst to argue that the original measure has‘faded from use’ (Collins, 2006). To address these and otherconcerns, the ESRI undertook a revision of the consistentpoverty measure using EU-SILC data. The revision included atechnical assessment of alternative deprivation items and aconsultation process involving government and broadersocial interests. This process led to a ‘reconfigured’deprivation measure, based on the enforced absence of atleast two items from an enlarged eleven-item list (Maître etal., 2006).5 The new measure was endorsed by governmentand used to express its poverty reduction target in theNAPinclusion 2007–2016. However, some anti-poverty groupshave been unhappy with the new measure, especially itsomission of the debt item. This process highlights the politicaldimension of the establishment of poverty measures.
Welfare adequacy benchmarks An important policy development in the last twenty years hasbeen the establishment of official benchmarks for adequatewelfare payments. The starting point for the setting of welfarebenchmarks is a value judgement that payments should beadequate to provide a living standard that is consideredacceptable in contemporary society. How adequacy is to beassessed is a more difficult issue with a variety of approachesbeing adopted. From a policy perspective, welfare adequacybenchmarks are directly related to the measurement of
19
Monitoring poverty and welfare policy 1987–2007
___________5 Five new indicators were added and two of the original set were
dropped.
Chapter 02 17/09/2007 16:49 Page 19
poverty in society and the growth of average incomes. Givenoverall budgetary constraints, the funding of welfareadequacy benchmarks also represents a trade-off withincome tax rates, either in higher taxes or tax cuts foregone.Thus, a policy concern with welfare adequacy can become animportant shaper of income distribution and work incentives.
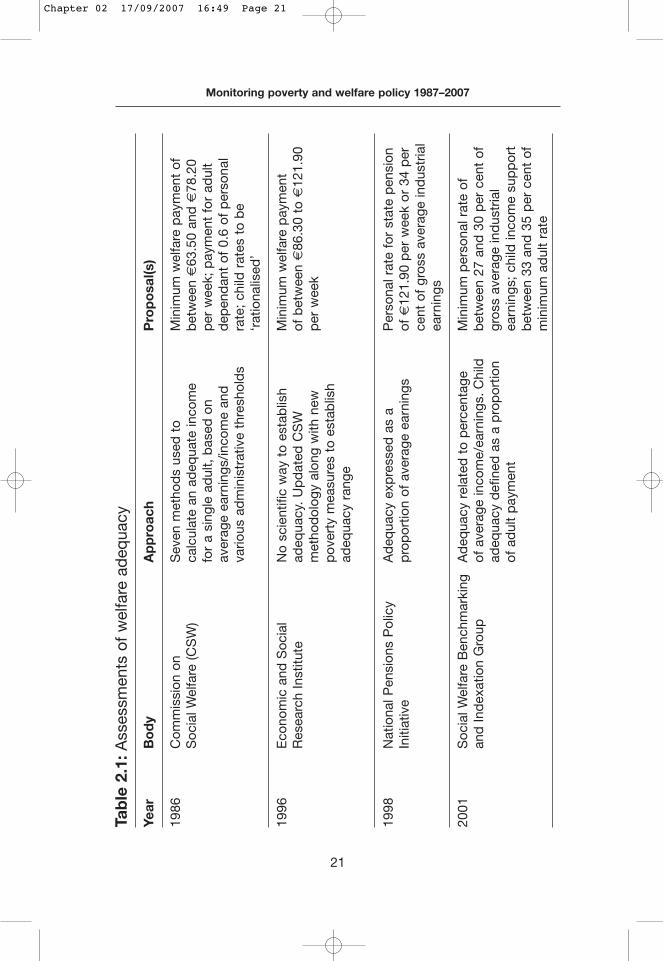
Table 2.1 outlines the various official assessments of welfareadequacy over the last twenty years. These differ in theirpolicy remit and their methodologies to formulate theirrecommendations.
The first assessment of welfare rates was undertaken by theCommission on Social Welfare in 1986. The Commission wasa government-appointed expert body charged withundertaking the first systematic review of the social welfaresystem in Ireland. A central theme of the Commission was thenecessity to establish a benchmark of welfare adequacy toreplace the ad hoc and politically driven approach to thesetting of welfare rates. Drawing on a variety ofmethodologies, the Commission recommended a minimumadequate welfare rate of between €63.50 and €78.20 perweek (£50 to £60), with an immediate priority rate of €57 perweek (£45). The Commission’s recommendations have playedan important part in debates about welfare adequacy and inofficial policy statements (Callan et al., 1996a). The proposalswere endorsed in a succession of social partnershipagreements and programmes for government. TheCommission recommended a payment of 0.6 of the personalrate for adult dependants. It did not propose an adequacytarget for child income support, as it felt that additional workwas required on that issue. Instead, it argued that the existingthirty or more rates of child dependant allowance berationalised.
20
Welfare Policy and Poverty
Chapter 02 17/09/2007 16:49 Page 20
21
Monitoring poverty and welfare policy 1987–2007
Tab
le 2
.1: A
sses
smen
ts o
f w
elfa
re a
deq
uacy
Year
Bo
dy
Ap
pro
ach
Pro
po
sal(s
)
1986
Com
mis
sion
on
Sev
en m
etho
ds
used
to
Min
imum
wel
fare
pay
men
t of
Soc
ial W
elfa
re (C
SW
)ca
lcul
ate
an a
deq
uate
inco
me
bet
wee
n €
63.5
0 an
d €
78.2
0fo
r a
sing
le a
dul
t, b
ased
on
per
wee
k; p
aym
ent
for
adul
t av
erag
e ea
rnin
gs/in
com
e an
d
dep
end
ant
of 0
.6 o
f p
erso
nal
vario
us a
dm
inis
trat
ive
thre
shol
ds
rate
; ch
ild r
ates
to
be
‘rat
iona
lised
’
1996
E
cono
mic
and
Soc
ial
No
scie
ntifi
c w
ay t
o es
tab
lish
Min
imum
wel
fare
pay
men
tR
esea
rch
Inst
itute
ad
equa
cy.
Up
dat
ed C
SW
of
bet
wee
n €
86.3
0 to
€12
1.90
met
hod
olog
y al
ong
with
new
per
wee
k p
over
ty m
easu
res
to e
stab
lish
adeq
uacy
ran
ge
1998
N
atio
nal P
ensi
ons
Pol
icy
Ad
equa
cy e
xpre
ssed
as
a P
erso
nal r
ate
for
stat
e p
ensi
onIn
itiat
ive
pro
por
tion
of a
vera
ge e
arni
ngs
of €
121.
90 p
er w
eek
or 3
4 p
erce
nt o
f gr
oss
aver
age
ind
ustr
ial
earn
ings
2001
S
ocia
l Wel
fare
Ben
chm
arki
ng
Ad
equa
cy r
elat
ed t
o p
erce
ntag
eM
inim
um p
erso
nal r
ate
ofan
d In
dex
atio
n G
roup
of
ave
rage
inco
me/
earn
ings
.Chi
ldb
etw
een
27 a
nd 3
0 p
er c
ent
ofad
equa
cy d
efin
ed a
s a
pro
por
tion
gros
s av
erag
e in
dus
tria
l of
ad
ult
pay
men
tea
rnin
gs;
child
inco
me
sup
por
tb
etw
een
33 a
nd 3
5 p
er c
ent
of
min
imum
ad
ult
rate
Chapter 02 17/09/2007 16:49 Page 21
In the mid-1990s, the government commissioned a reviewand update of the Commission’s minimum welfare rates andan assessment of their impact on poverty, income inequalityand work incentives. The review, carried out by the ESRI(Callan et al., 1996a), provided a new estimate of a minimumadequate income ranging from €86.30 to €121.90 per week(£68 to £96). The new adequacy figures were not explicitlyendorsed in subsequent government policy.
The next statement on welfare adequacy was made by thePensions Board (1998) in its report on the National PensionsPolicy Initiative. The focus here was on providing a‘reasonable’ level of income for older people through thestate pension. The Pensions Board chose the upper end ofthe ESRI minimum welfare rate as this would minimise therisk of poverty and provide income support in the mostefficient way. This rate was expressed as a percentage ofgross average industrial earnings (34 per cent). The PensionsBoard confined its proposals to the state pension.Government welfare policies have never acknowledged thisestimate as official policy. Rather, the government has set asuccession of cash targets for the state pension, the mostrecent being €200 per week to be achieved by 2007 (Ireland,2002a).
The most recent estimation of welfare adequacy wasprovided by the Social Welfare Benchmarking and IndexationGroup, which reported in 2001. This group was establishedunder the Programme for Prosperity and Fairness to addressits objective to provide every person with sufficient income tolive life with dignity, and comprised representatives of thesocial partners. Its remit was to develop a new ‘benchmark’for welfare adequacy for both adults and children, taking intoaccount economic and financial considerations. Influenced by
22
Welfare Policy and Poverty
Chapter 02 17/09/2007 16:49 Page 22
the approach in the National Pensions Policy Initiative, themajority recommendation of the group was for a minimumwelfare payment based on 27 per cent of gross averageindustrial earnings. It also presented the possibility ofincreasing this to 30 per cent in the longer term.
Subsequent to the report of the Social Welfare Benchmarkingand Indexation Group, the government adopted a newwelfare adequacy target in the revised NAPS (Ireland, 2002a).This articulated a minimum welfare rate of €150 per week(2002 values) to be achieved by 2007. This was theequivalent of 30 per cent of gross average industrial earningsat the time, though this link was not explicitly stated (CORIJustice, 2006).
These four official reviews of a minimum welfare rate haveproved very influential in advancing the level of welfarepayments, as will be demonstrated below.
Poverty trends 1987–2005
This section begins with the macroeconomic context for theevolution of poverty since 1987. This leads to an analysis oftrends in poverty over time, using both the relative income(risk-of-) poverty and consistent poverty measures. Selectedyears are used to present the data: 1987, 1994, 1997, 2001,2003 and 2005. The presentation of findings is preceded by ashort discussion on the performance of the two measuresover time relative to overall trends in income, welfare ratesand deprivation levels. The information is presented for thetotal population and for demographic categories identified asbeing particularly vulnerable to poverty in official anti-povertypolicies (children, older people, women and non-Irishnationals). This is followed by a profile of those in poverty
23
Monitoring poverty and welfare policy 1987–2007
Chapter 02 17/09/2007 16:49 Page 23
using household composition, economic status and spatialcategories. The section concludes with an examination ofthe composition of the population in poverty, focusing on thesituation in 2005.
Macroeconomic backgroundThe last twenty years have seen dramatic changes in theIrish economy and society. The 1980s were characterised byhigh unemployment, low economic growth and high levels ofemigration. Since then, there has been a majortransformation in the economy (see Table 2.2). Between1987 and 2005, GNP increased by 216 per cent in realterms, with the bulk of this growth coming in the period from1994. This rapid economic growth had a major impact onthe labour market. The total numbers in employmentincreased from 1.1 million to 1.9 million, a rise of 800,000 (74per cent), with 90 per cent of this increase occurring in theperiod from 1994 to 2005. The growth in employment wasaccompanied by a dramatic fall in unemployment, from226,000 in 1987 to 65,000 in 2001. The change here isconcentrated in the period 1994 to 2001, as since 2001 thenumbers out of work have risen again, to 86,000 in 2005.The unemployment rate fell from 16.9 per cent in 1987 to alow of 3.9 per cent in 2001, before rising slightly to 4.4 percent in 2005. As well as lower unemployment, employmentgrowth has been accompanied by an increase of 50 per centin the size of the total labour force. This increase has beenfuelled by school-leavers, increased labour marketparticipation by women and, most recently, by immigration(replacing the pattern of outward migration in the years 1987to 1994). The latter phenomenon, together with a higherbirth rate, has led to a population increase of over 500,000since 1987 (up 16 per cent).
24
Welfare Policy and Poverty
Chapter 02 17/09/2007 16:49 Page 24
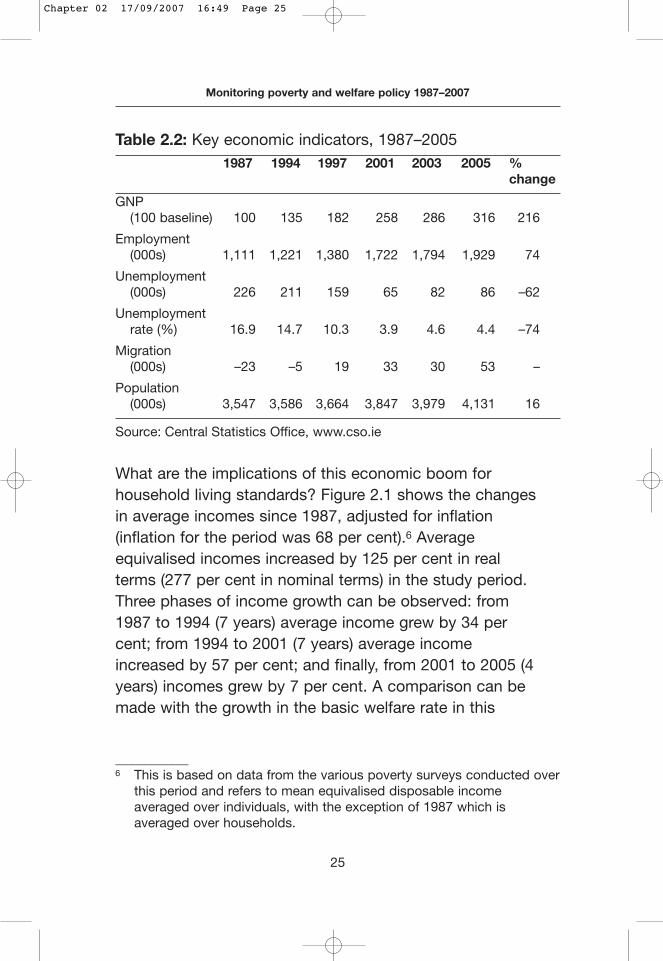
Table 2.2: Key economic indicators, 1987–20051987 1994 1997 2001 2003 2005 %
change
GNP (100 baseline) 100 135 182 258 286 316 216
Employment (000s) 1,111 1,221 1,380 1,722 1,794 1,929 74
Unemployment (000s) 226 211 159 65 82 86 –62
Unemployment rate (%) 16.9 14.7 10.3 3.9 4.6 4.4 –74
Migration (000s) –23 –5 19 33 30 53 –
Population (000s) 3,547 3,586 3,664 3,847 3,979 4,131 16
Source: Central Statistics Office, www.cso.ie
What are the implications of this economic boom forhousehold living standards? Figure 2.1 shows the changesin average incomes since 1987, adjusted for inflation(inflation for the period was 68 per cent).6 Averageequivalised incomes increased by 125 per cent in realterms (277 per cent in nominal terms) in the study period.Three phases of income growth can be observed: from1987 to 1994 (7 years) average income grew by 34 percent; from 1994 to 2001 (7 years) average incomeincreased by 57 per cent; and finally, from 2001 to 2005 (4years) incomes grew by 7 per cent. A comparison can bemade with the growth in the basic welfare rate in this
25
Monitoring poverty and welfare policy 1987–2007
___________6 This is based on data from the various poverty surveys conducted over
this period and refers to mean equivalised disposable incomeaveraged over individuals, with the exception of 1987 which isaveraged over households.
Chapter 02 17/09/2007 16:49 Page 25
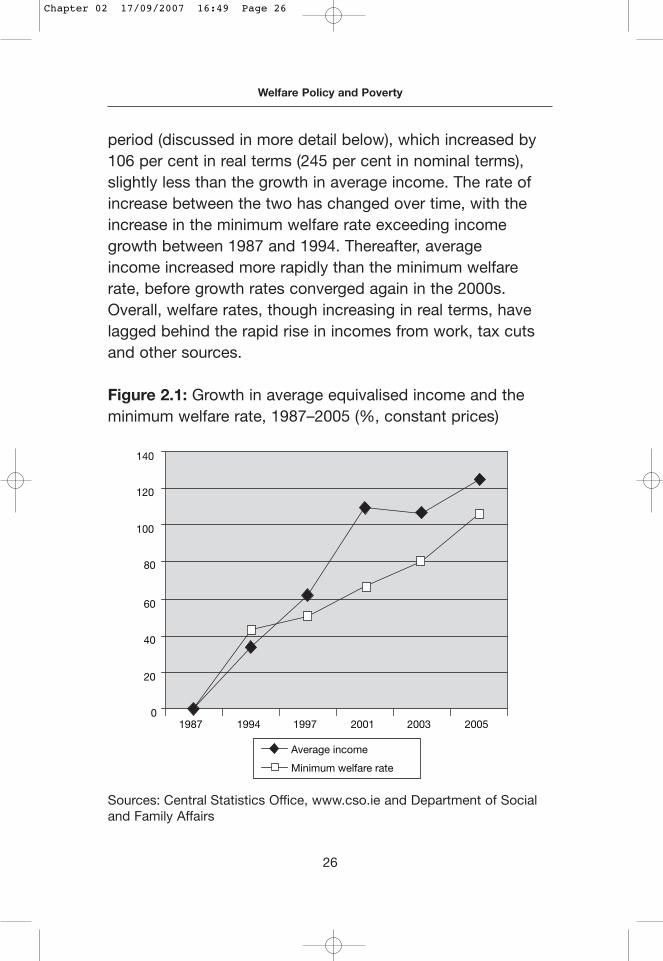
period (discussed in more detail below), which increased by106 per cent in real terms (245 per cent in nominal terms),slightly less than the growth in average income. The rate ofincrease between the two has changed over time, with theincrease in the minimum welfare rate exceeding incomegrowth between 1987 and 1994. Thereafter, averageincome increased more rapidly than the minimum welfarerate, before growth rates converged again in the 2000s.Overall, welfare rates, though increasing in real terms, havelagged behind the rapid rise in incomes from work, tax cutsand other sources.
Figure 2.1: Growth in average equivalised income and theminimum welfare rate, 1987–2005 (%, constant prices)
Sources: Central Statistics Office, www.cso.ie and Department of Socialand Family Affairs
26
Welfare Policy and Poverty
0
20
40
60
80
100
120
140
1987 1994 1997 2001 2003 2005
Average income
Minimum welfare rate
Chapter 02 17/09/2007 16:49 Page 26
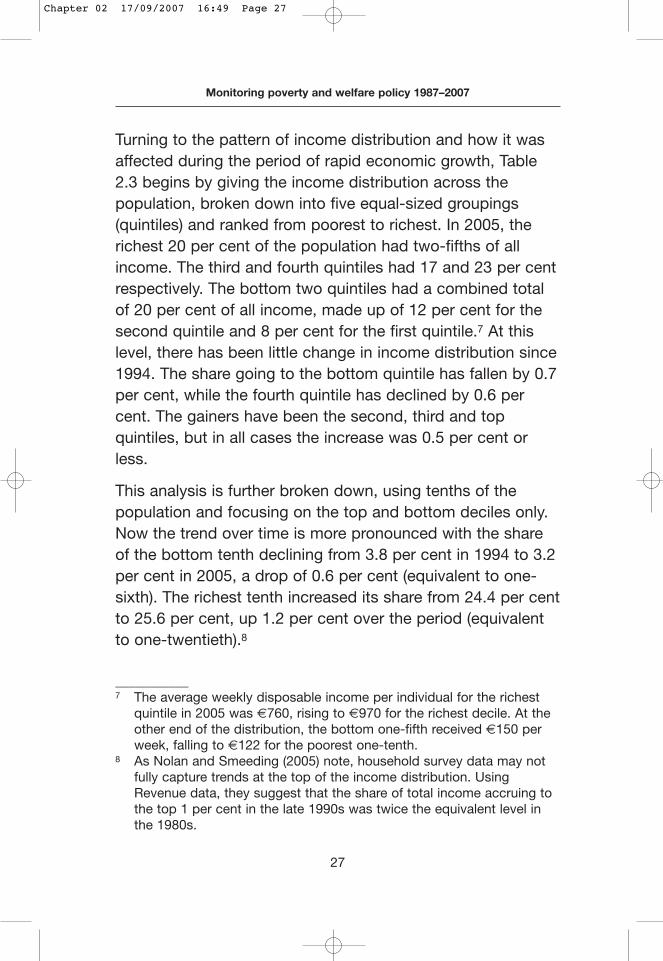
Turning to the pattern of income distribution and how it wasaffected during the period of rapid economic growth, Table2.3 begins by giving the income distribution across thepopulation, broken down into five equal-sized groupings(quintiles) and ranked from poorest to richest. In 2005, therichest 20 per cent of the population had two-fifths of allincome. The third and fourth quintiles had 17 and 23 per centrespectively. The bottom two quintiles had a combined totalof 20 per cent of all income, made up of 12 per cent for thesecond quintile and 8 per cent for the first quintile.7 At thislevel, there has been little change in income distribution since1994. The share going to the bottom quintile has fallen by 0.7per cent, while the fourth quintile has declined by 0.6 percent. The gainers have been the second, third and topquintiles, but in all cases the increase was 0.5 per cent orless.
This analysis is further broken down, using tenths of thepopulation and focusing on the top and bottom deciles only.Now the trend over time is more pronounced with the shareof the bottom tenth declining from 3.8 per cent in 1994 to 3.2per cent in 2005, a drop of 0.6 per cent (equivalent to one-sixth). The richest tenth increased its share from 24.4 per centto 25.6 per cent, up 1.2 per cent over the period (equivalentto one-twentieth).8
27
Monitoring poverty and welfare policy 1987–2007
___________7 The average weekly disposable income per individual for the richest
quintile in 2005 was €760, rising to €970 for the richest decile. At theother end of the distribution, the bottom one-fifth received €150 perweek, falling to €122 for the poorest one-tenth.
8 As Nolan and Smeeding (2005) note, household survey data may notfully capture trends at the top of the income distribution. UsingRevenue data, they suggest that the share of total income accruing tothe top 1 per cent in the late 1990s was twice the equivalent level inthe 1980s.
Chapter 02 17/09/2007 16:49 Page 27
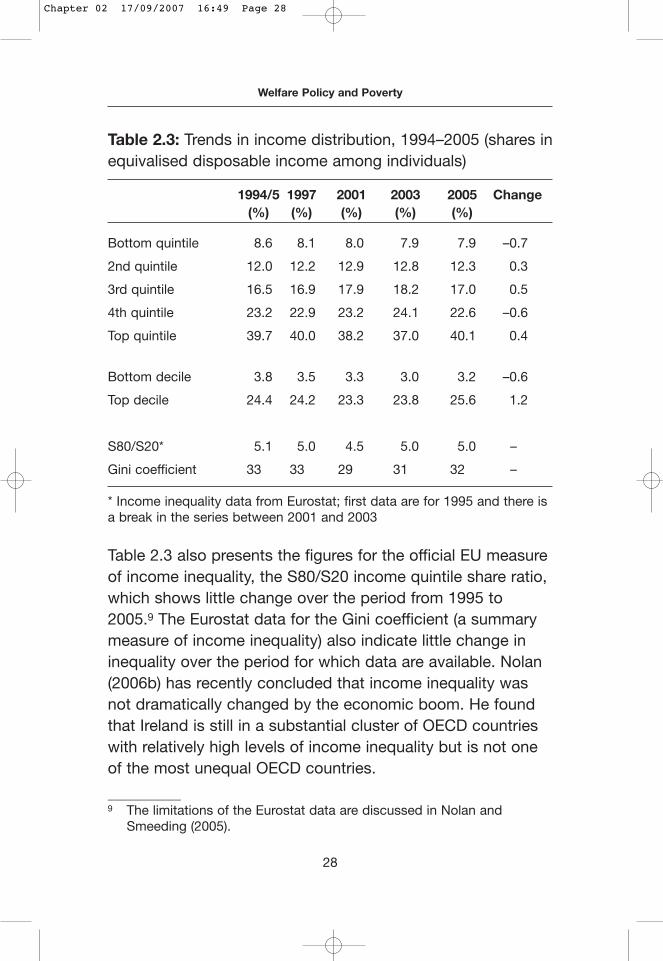
Table 2.3 also presents the figures for the official EU measureof income inequality, the S80/S20 income quintile share ratio,which shows little change over the period from 1995 to2005.9 The Eurostat data for the Gini coefficient (a summarymeasure of income inequality) also indicate little change ininequality over the period for which data are available. Nolan(2006b) has recently concluded that income inequality wasnot dramatically changed by the economic boom. He foundthat Ireland is still in a substantial cluster of OECD countrieswith relatively high levels of income inequality but is not oneof the most unequal OECD countries.
28
Welfare Policy and Poverty
Table 2.3: Trends in income distribution, 1994–2005 (shares inequivalised disposable income among individuals)
1994/5 1997 2001 2003 2005 Change (%) (%) (%) (%) (%)
Bottom quintile 8.6 8.1 8.0 7.9 7.9 –0.7
2nd quintile 12.0 12.2 12.9 12.8 12.3 0.3
3rd quintile 16.5 16.9 17.9 18.2 17.0 0.5
4th quintile 23.2 22.9 23.2 24.1 22.6 –0.6
Top quintile 39.7 40.0 38.2 37.0 40.1 0.4
Bottom decile 3.8 3.5 3.3 3.0 3.2 –0.6
Top decile 24.4 24.2 23.3 23.8 25.6 1.2
S80/S20* 5.1 5.0 4.5 5.0 5.0 –
Gini coefficient 33 33 29 31 32 –
* Income inequality data from Eurostat; first data are for 1995 and there isa break in the series between 2001 and 2003
___________9 The limitations of the Eurostat data are discussed in Nolan and
Smeeding (2005).
Chapter 02 17/09/2007 16:49 Page 28
Trends in risk of poverty, 1987–2005
Performance of risk-of-poverty measure over timeFor this analysis, we concentrate on a poverty cut-off point of60 per cent of the median equivalised income.10 The weeklyvalue in euro of this cut-off point is illustrated in Figure 2.2 forthe period 1987 to 2005, using constant 2005 prices. In 2005,60 per cent of the median was the equivalent of €193 perweek for a single adult.11 The value of 60 per cent of medianincome increased by 127 per cent since 1987 and by 82 percent since 1994 (actual weekly figures were €85 and €107respectively for a single adult in 2005 prices). This increase inthe threshold is in line with the growth in incomes asdemonstrated above. The results emphasise the dramaticchange in the real value of the median threshold in a shortperiod. They also demonstrate the significance of using arelative threshold rather than one fixed in real income termsto measure poverty patterns in an economy undergoing asustained period of growth.12
Another way to interpret the evolution of the 60 per cent ofmedian income threshold is to relate it to prevailing social
29
Monitoring poverty and welfare policy 1987–2007
___________10 Income is defined as total disposable household income, after income
tax and PRSI contributions are deducted. Income is adjusted forhousehold size using an equivalence scale which attributes a weight of1 to the first adult, 0.66 to each subsequent adult (aged 14 or moreand living in the household) and 0.33 to each child (aged less than 14).The equivalised income is attributed to each member of the householdand the median income is then identified.
11 The equivalent value for a household of two adults and two children in2005 would be €447.16.
12 In Figure 2.2, the value of the 60 per cent median threshold between2001 and 2003 records a small decline, which reflects technicalchanges in the measurement of household income between the LISand the EU-SILC. However, as the poverty measure is based on 60 percent of median income in both cases, this does not undermine theresults.
Chapter 02 17/09/2007 16:49 Page 29
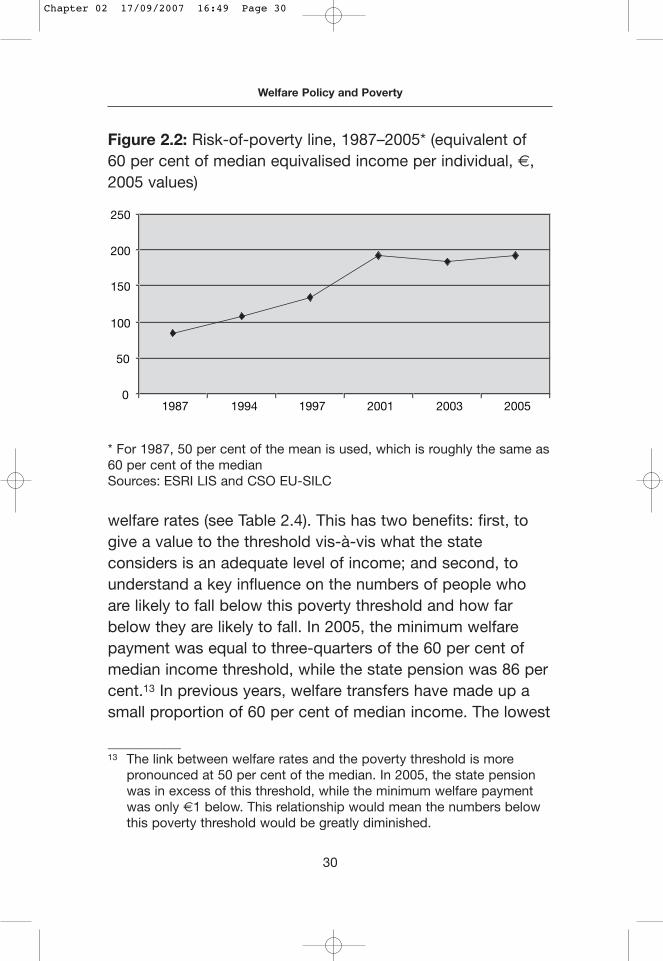
welfare rates (see Table 2.4). This has two benefits: first, togive a value to the threshold vis-à-vis what the stateconsiders is an adequate level of income; and second, tounderstand a key influence on the numbers of people whoare likely to fall below this poverty threshold and how farbelow they are likely to fall. In 2005, the minimum welfarepayment was equal to three-quarters of the 60 per cent ofmedian income threshold, while the state pension was 86 percent.13 In previous years, welfare transfers have made up asmall proportion of 60 per cent of median income. The lowest
30
Welfare Policy and Poverty
Figure 2.2: Risk-of-poverty line, 1987–2005* (equivalent of 60 per cent of median equivalised income per individual, €,2005 values)
* For 1987, 50 per cent of the mean is used, which is roughly the same as60 per cent of the medianSources: ESRI LIS and CSO EU-SILC
0
50
100
150
200
250
1987 1994 1997 2001 2003 2005
___________13 The link between welfare rates and the poverty threshold is more
pronounced at 50 per cent of the median. In 2005, the state pensionwas in excess of this threshold, while the minimum welfare paymentwas only €1 below. This relationship would mean the numbers belowthis poverty threshold would be greatly diminished.
Chapter 02 17/09/2007 16:49 Page 30
figures were in 2001, when the minimum welfare paymentwas equal to 63 per cent of the threshold and the statepension was equal to 72 per cent. Much higher proportionsexisted in the earlier period, with the respective ratesequivalent to 86 and 118 per cent of the threshold in 1987.
Table 2.4: Welfare rates as a percentage of 60 per cent ofmedian income, 1987–2005
1987 1994 1997 2001 2003 2005 (%) (%) (%) (%) (%) (%)
Minimum welfare rate 86 97 82 63 71 77
State pension 118 101 84 72 82 86
Source: Department of Social and Family Affairs (welfare rates)
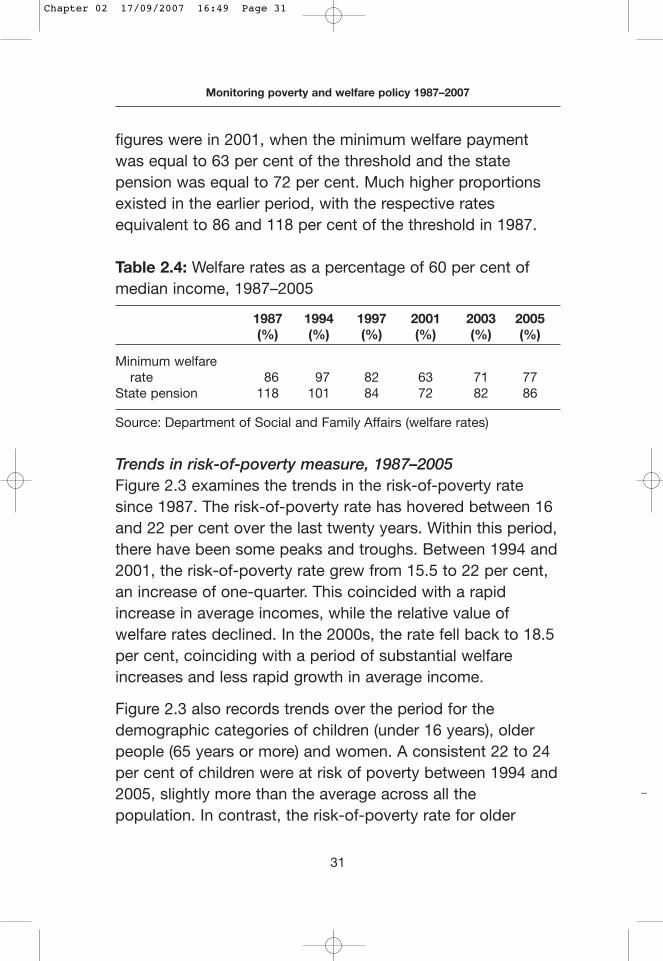
Trends in risk-of-poverty measure, 1987–2005Figure 2.3 examines the trends in the risk-of-poverty ratesince 1987. The risk-of-poverty rate has hovered between 16and 22 per cent over the last twenty years. Within this period,there have been some peaks and troughs. Between 1994 and2001, the risk-of-poverty rate grew from 15.5 to 22 per cent,an increase of one-quarter. This coincided with a rapidincrease in average incomes, while the relative value ofwelfare rates declined. In the 2000s, the rate fell back to 18.5per cent, coinciding with a period of substantial welfareincreases and less rapid growth in average income.
Figure 2.3 also records trends over the period for thedemographic categories of children (under 16 years), olderpeople (65 years or more) and women. A consistent 22 to 24per cent of children were at risk of poverty between 1994 and2005, slightly more than the average across all thepopulation. In contrast, the risk-of-poverty rate for older
31
Monitoring poverty and welfare policy 1987–2007
_
Chapter 02 17/09/2007 16:49 Page 31
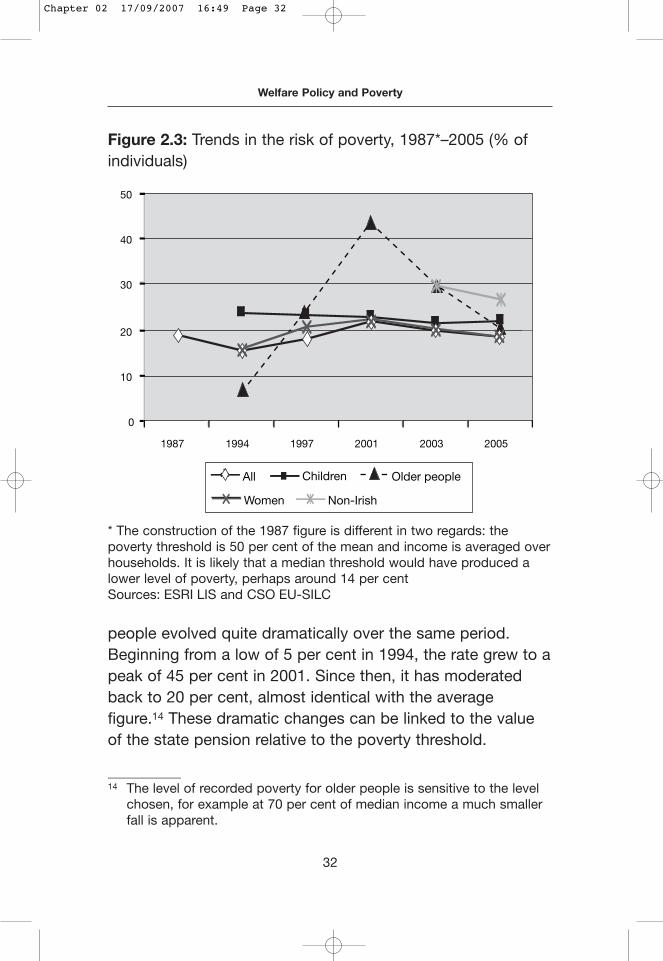
people evolved quite dramatically over the same period.Beginning from a low of 5 per cent in 1994, the rate grew to apeak of 45 per cent in 2001. Since then, it has moderatedback to 20 per cent, almost identical with the averagefigure.14 These dramatic changes can be linked to the valueof the state pension relative to the poverty threshold.
32
Welfare Policy and Poverty
Figure 2.3: Trends in the risk of poverty, 1987*–2005 (% ofindividuals)
0
10
20
30
40
50
1987 1994 1997 2001 2003 2005
All Children Older people
Women Non-Irish
___________14 The level of recorded poverty for older people is sensitive to the level
chosen, for example at 70 per cent of median income a much smallerfall is apparent.
* The construction of the 1987 figure is different in two regards: thepoverty threshold is 50 per cent of the mean and income is averaged overhouseholds. It is likely that a median threshold would have produced alower level of poverty, perhaps around 14 per centSources: ESRI LIS and CSO EU-SILC
Chapter 02 17/09/2007 16:49 Page 32
For women, the risk-of-poverty rate has increased over timefrom a low of 16 per cent in 1994 to a high of 23 per cent in2001, before falling back to 18.5 per cent in 2005. The trendin female poverty is shaped by the pattern for older people,as there is a predominance of women among older people.
Data on the nationality of persons in poverty are availableunder the EU-SILC for 2004/5.15 In 2005, 27 per cent of non-Irish nationals were at risk of poverty, as compared with 18per cent of the national population. In line with the overalltrends, the non-Irish national poverty rate fell by 2 per centfrom 2004.
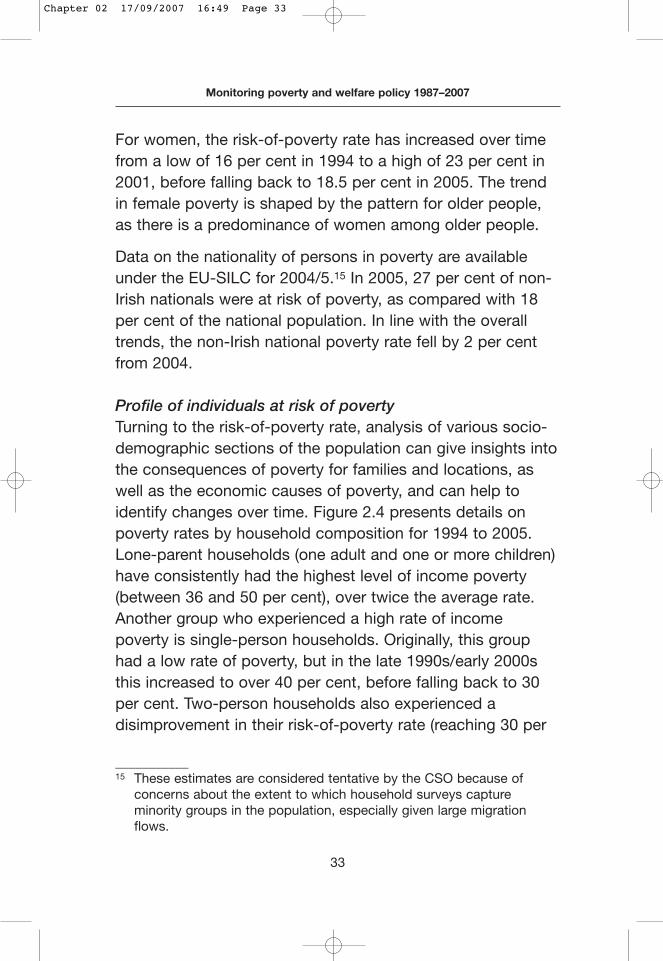
Profile of individuals at risk of povertyTurning to the risk-of-poverty rate, analysis of various socio-demographic sections of the population can give insights intothe consequences of poverty for families and locations, aswell as the economic causes of poverty, and can help toidentify changes over time. Figure 2.4 presents details onpoverty rates by household composition for 1994 to 2005.Lone-parent households (one adult and one or more children)have consistently had the highest level of income poverty(between 36 and 50 per cent), over twice the average rate.Another group who experienced a high rate of incomepoverty is single-person households. Originally, this grouphad a low rate of poverty, but in the late 1990s/early 2000sthis increased to over 40 per cent, before falling back to 30per cent. Two-person households also experienced adisimprovement in their risk-of-poverty rate (reaching 30 per
33
Monitoring poverty and welfare policy 1987–2007
___________15 These estimates are considered tentative by the CSO because of
concerns about the extent to which household surveys captureminority groups in the population, especially given large migrationflows.
Chapter 02 17/09/2007 16:49 Page 33
cent), before coming back in line with the average rate. Inboth these cases, the increase in poverty risk can be linkedwith the higher risk for older people, who represent a largecomponent of such household categories.
The rate of income poverty for couples with children wasgenerally in line with the average, though with some variationsince 2001. Thus, smaller families (one to three children) haveexperienced a reduced risk of poverty, falling from 17 to 13per cent. In contrast, the position of larger families (otherswith children) has deteriorated, with their risk of poverty risingfrom 20 to 25 per cent.
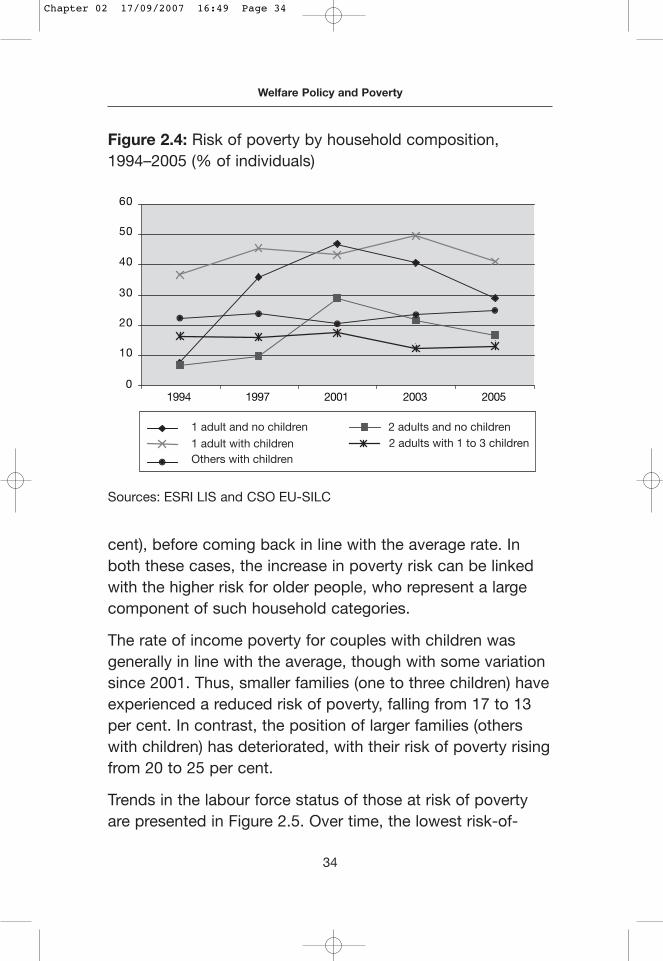
Trends in the labour force status of those at risk of povertyare presented in Figure 2.5. Over time, the lowest risk-of-
34
Welfare Policy and Poverty
Figure 2.4: Risk of poverty by household composition,1994–2005 (% of individuals)
Sources: ESRI LIS and CSO EU-SILC
0
10
20
30
40
50
60
1994 1997 2001 2003 2005
1 adult and no children 2 adults and no children
1 adult with children 2 adults with 1 to 3 childrenOthers with children
Chapter 02 17/09/2007 16:49 Page 34
poverty rate was consistently among those at work, whichhas remained below 10 per cent. People not at work due tounemployment or illness/disability had the highest risk-of-poverty rates, standing at 40 per cent in 2005. This was animprovement on the rates in the middle of the period, whenthey reached 60 and 65 per cent. Other higher risk groups arepeople engaged in home duties and students (28 to 30 percent in 2005). The risk-of-poverty rate for the formerincreased dramatically between 1997 and 2001, before fallingback somewhat by 2005. The rate for retired people has alsoworsened from its low base in 1994, doubling by 2005 to 20
35
Monitoring poverty and welfare policy 1987–2007
Figure 2.5: Risk of poverty by labour force status, 1994–2005(% of individuals)*
0
10
20
30
40
50
60
70
1994 1997 2001 2003 2005
Working
Unemployed
Student
On home duties
Retired
Ill/disabled
* Data for 1994 to 2001 are based on the labour force status of thehousehold reference person, which is then applied to all individuals in thehousehold. Data for 2003 and 2005 relate to each individual aged 16 oroverSources: ESRI LIS and CSO EU-SILC
Chapter 02 17/09/2007 16:49 Page 35
per cent. Overall, these patterns reflect a significant decline inthe incomes of those not at work compared to those inemployment, albeit with a gradual improvement towards theend of the period. However, people of working age but not inwork still face relatively very high rates of risk of poverty, overfive times the rate of those in work and up to twice the ratefor those not in the labour force.
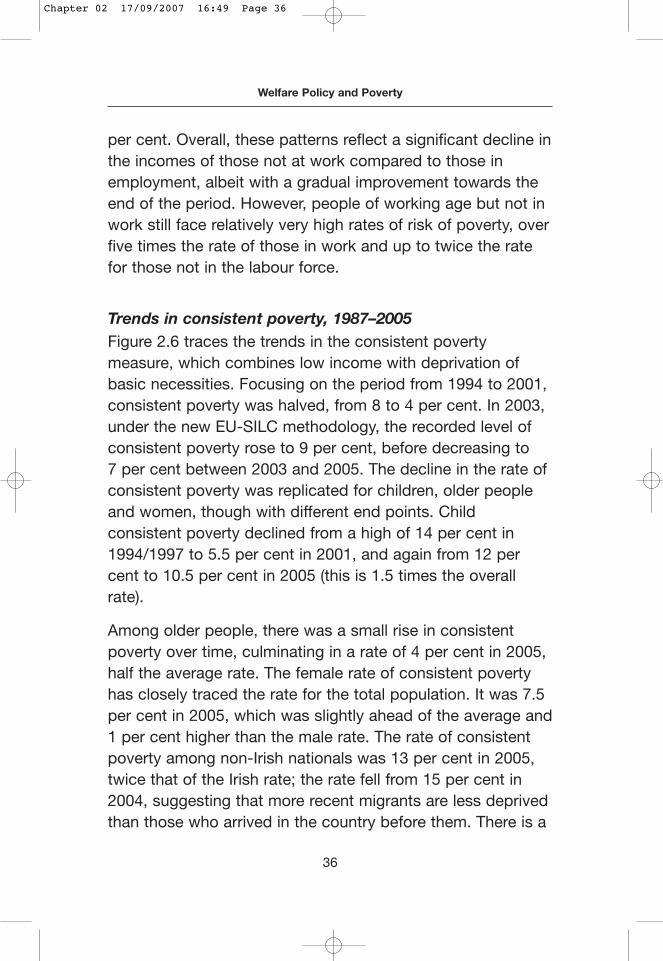
Trends in consistent poverty, 1987–2005Figure 2.6 traces the trends in the consistent povertymeasure, which combines low income with deprivation ofbasic necessities. Focusing on the period from 1994 to 2001,consistent poverty was halved, from 8 to 4 per cent. In 2003,under the new EU-SILC methodology, the recorded level ofconsistent poverty rose to 9 per cent, before decreasing to 7 per cent between 2003 and 2005. The decline in the rate ofconsistent poverty was replicated for children, older peopleand women, though with different end points. Childconsistent poverty declined from a high of 14 per cent in1994/1997 to 5.5 per cent in 2001, and again from 12 percent to 10.5 per cent in 2005 (this is 1.5 times the overallrate).
Among older people, there was a small rise in consistentpoverty over time, culminating in a rate of 4 per cent in 2005,half the average rate. The female rate of consistent povertyhas closely traced the rate for the total population. It was 7.5per cent in 2005, which was slightly ahead of the average and1 per cent higher than the male rate. The rate of consistentpoverty among non-Irish nationals was 13 per cent in 2005,twice that of the Irish rate; the rate fell from 15 per cent in2004, suggesting that more recent migrants are less deprivedthan those who arrived in the country before them. There is a
36
Welfare Policy and Poverty
Chapter 02 17/09/2007 16:49 Page 36
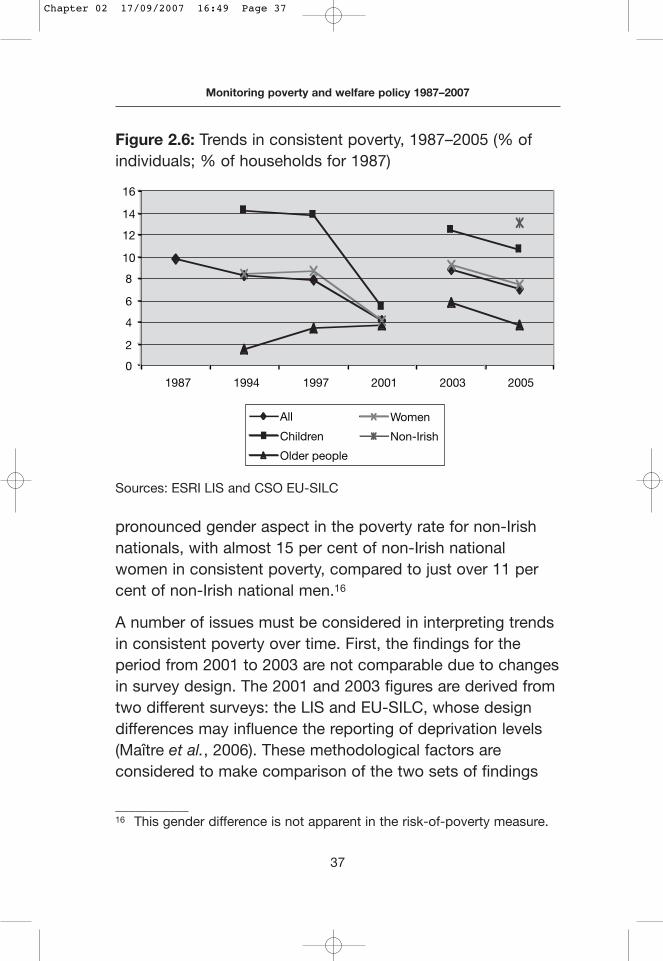
pronounced gender aspect in the poverty rate for non-Irishnationals, with almost 15 per cent of non-Irish nationalwomen in consistent poverty, compared to just over 11 percent of non-Irish national men.16
A number of issues must be considered in interpreting trendsin consistent poverty over time. First, the findings for theperiod from 2001 to 2003 are not comparable due to changesin survey design. The 2001 and 2003 figures are derived fromtwo different surveys: the LIS and EU-SILC, whose designdifferences may influence the reporting of deprivation levels(Maître et al., 2006). These methodological factors areconsidered to make comparison of the two sets of findings
37
Monitoring poverty and welfare policy 1987–2007
___________16 This gender difference is not apparent in the risk-of-poverty measure.
Figure 2.6: Trends in consistent poverty, 1987–2005 (% ofindividuals; % of households for 1987)
0
2
4
6
8
10
12
14
16
1987 1994 1997 2001 2003 2005
All
Children
Older people
Women
Non-Irish
Sources: ESRI LIS and CSO EU-SILC
Chapter 02 17/09/2007 16:49 Page 37
problematic and unreliable. Therefore, in interpreting trendsover time, the period from 1994 to 2001 should be treatedseparately to the period from 2003 to 2005. Second, the listof deprivation items is unchanged since first developed in1987. While intended as a measure of relative deprivationwhich may evolve over time in line with societal expectations,it has been suggested that the static list of items has actedas an absolute measure of poverty, being unaltered over aperiod of twenty years. This aspect is magnified by theunprecedented economic growth and rise in living standardsin the intervening years. In this context, it is inevitable thatdeprivation on a set list of indicators will have greatlyreduced. A third issue is whether the meaning and valueassociated with the various indicators may have changedover time. For example, the debt indicator is open tointerpretation, as debt becomes a more acceptable feature ofmodern living.
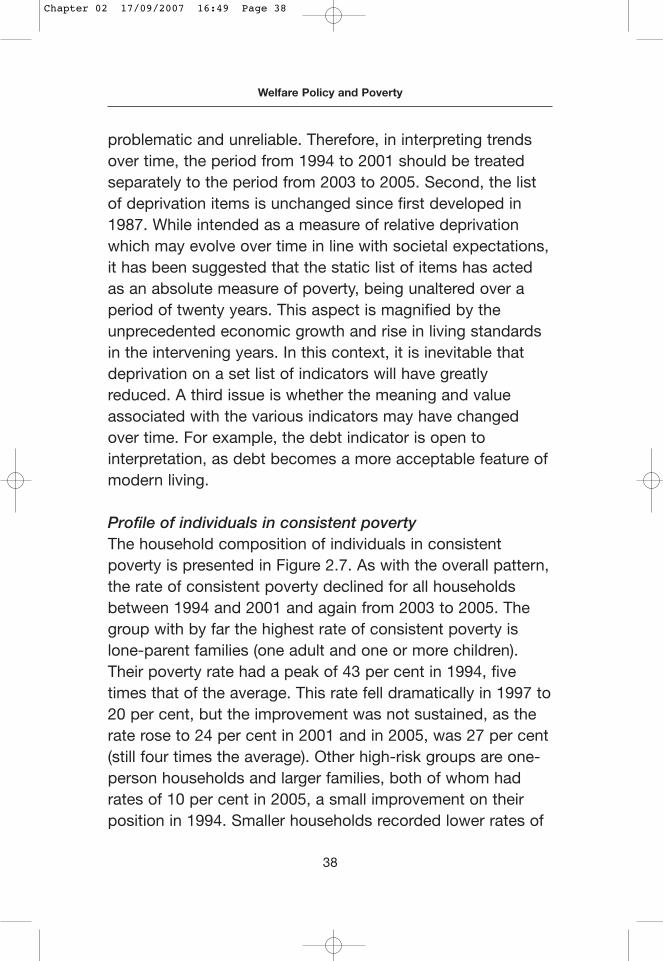
Profile of individuals in consistent povertyThe household composition of individuals in consistentpoverty is presented in Figure 2.7. As with the overall pattern,the rate of consistent poverty declined for all householdsbetween 1994 and 2001 and again from 2003 to 2005. Thegroup with by far the highest rate of consistent poverty islone-parent families (one adult and one or more children).Their poverty rate had a peak of 43 per cent in 1994, fivetimes that of the average. This rate fell dramatically in 1997 to20 per cent, but the improvement was not sustained, as therate rose to 24 per cent in 2001 and in 2005, was 27 per cent(still four times the average). Other high-risk groups are one-person households and larger families, both of whom hadrates of 10 per cent in 2005, a small improvement on theirposition in 1994. Smaller households recorded lower rates of
38
Welfare Policy and Poverty
Chapter 02 17/09/2007 16:49 Page 38
consistent poverty over time, even with the higher resultsunder the EU-SILC. The lowest levels were found in two-person households without children, who were consistentlyclose to or below 5 per cent.
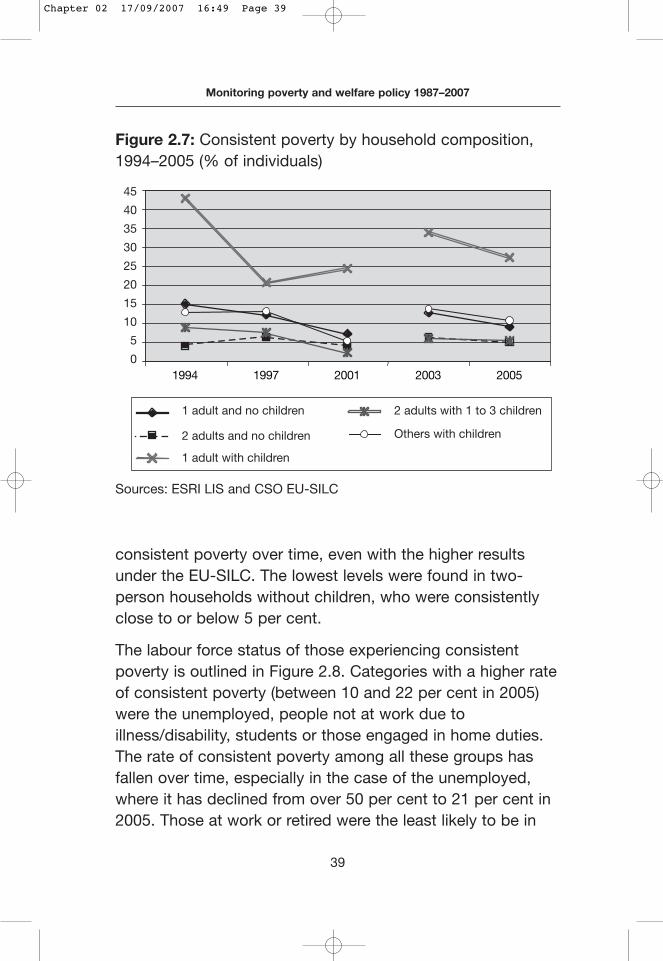
The labour force status of those experiencing consistentpoverty is outlined in Figure 2.8. Categories with a higher rateof consistent poverty (between 10 and 22 per cent in 2005)were the unemployed, people not at work due toillness/disability, students or those engaged in home duties.The rate of consistent poverty among all these groups hasfallen over time, especially in the case of the unemployed,where it has declined from over 50 per cent to 21 per cent in2005. Those at work or retired were the least likely to be in
39
Monitoring poverty and welfare policy 1987–2007
Figure 2.7: Consistent poverty by household composition,1994–2005 (% of individuals)
Sources: ESRI LIS and CSO EU-SILC
1994 1997 2001 2003 2005
45
40
35
30
25
20
15
10
5
0
1 adult and no children
2 adults and no children
1 adult with children
2 adults with 1 to 3 children
Others with children
Chapter 02 17/09/2007 16:49 Page 39
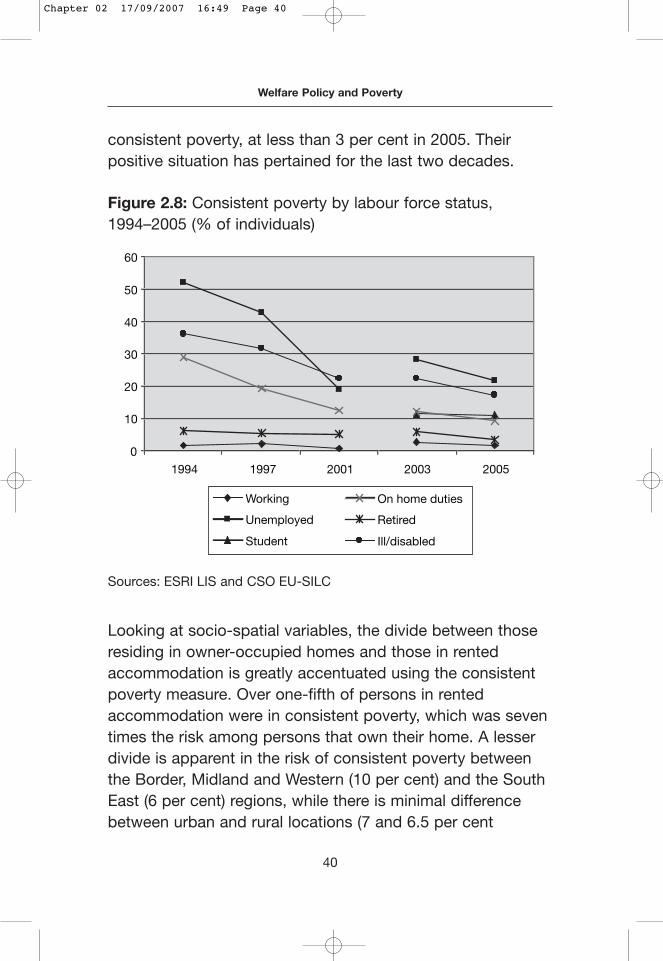
consistent poverty, at less than 3 per cent in 2005. Theirpositive situation has pertained for the last two decades.
Looking at socio-spatial variables, the divide between thoseresiding in owner-occupied homes and those in rentedaccommodation is greatly accentuated using the consistentpoverty measure. Over one-fifth of persons in rentedaccommodation were in consistent poverty, which was seventimes the risk among persons that own their home. A lesserdivide is apparent in the risk of consistent poverty betweenthe Border, Midland and Western (10 per cent) and the SouthEast (6 per cent) regions, while there is minimal differencebetween urban and rural locations (7 and 6.5 per cent
40
Welfare Policy and Poverty
Figure 2.8: Consistent poverty by labour force status,1994–2005 (% of individuals)
Sources: ESRI LIS and CSO EU-SILC
0
10
20
30
40
50
60
1994 1997 2001 2003 2005
Working
Unemployed
Student
On home duties
Retired
Ill/disabled
Chapter 02 17/09/2007 16:49 Page 40
respectively). In terms of trends since 2003, consistentpoverty has decreased across all socio-spatial categorieswith one exception: a small increase in the rate of ruralconsistent poverty, resulting in a narrower differential betweenrural and urban levels.
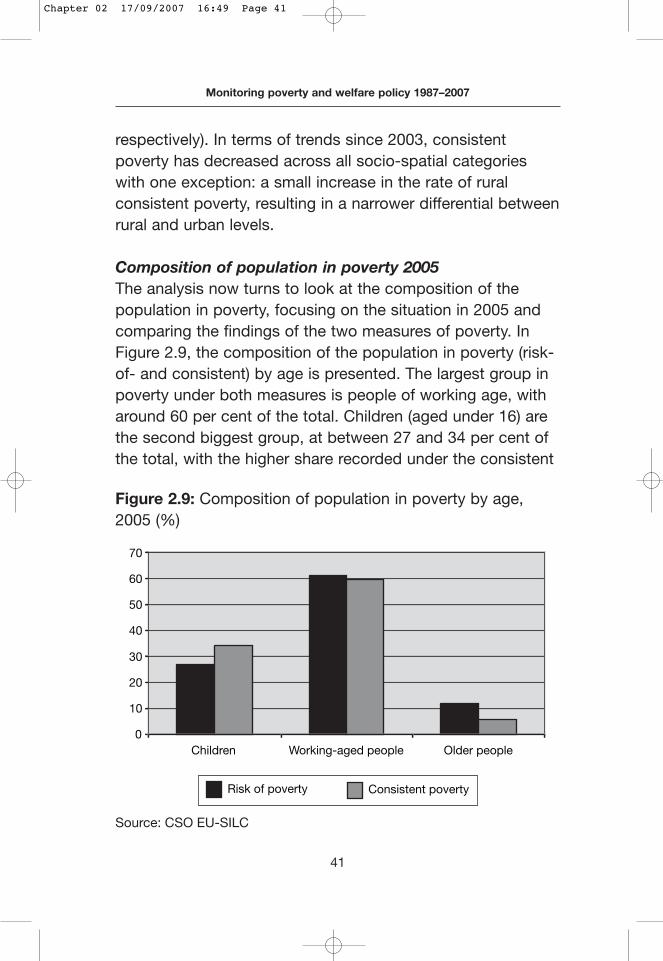
Composition of population in poverty 2005The analysis now turns to look at the composition of thepopulation in poverty, focusing on the situation in 2005 andcomparing the findings of the two measures of poverty. InFigure 2.9, the composition of the population in poverty (risk-of- and consistent) by age is presented. The largest group inpoverty under both measures is people of working age, witharound 60 per cent of the total. Children (aged under 16) arethe second biggest group, at between 27 and 34 per cent ofthe total, with the higher share recorded under the consistent
41
Monitoring poverty and welfare policy 1987–2007
Figure 2.9: Composition of population in poverty by age,2005 (%)
0
10
20
30
40
50
60
70
Children Working-aged people Older people
Risk of poverty Consistent poverty
Source: CSO EU-SILC
Chapter 02 17/09/2007 16:49 Page 41
poverty measure. Older people are the smallest category,representing 6 per cent of those in consistent poverty and 12per cent of those at risk of poverty. If figures were brokendown by gender, they would reveal that women account forslightly more of the population in consistent poverty (54 percent) than men. The population at risk of poverty is divided50:50 between women and men.
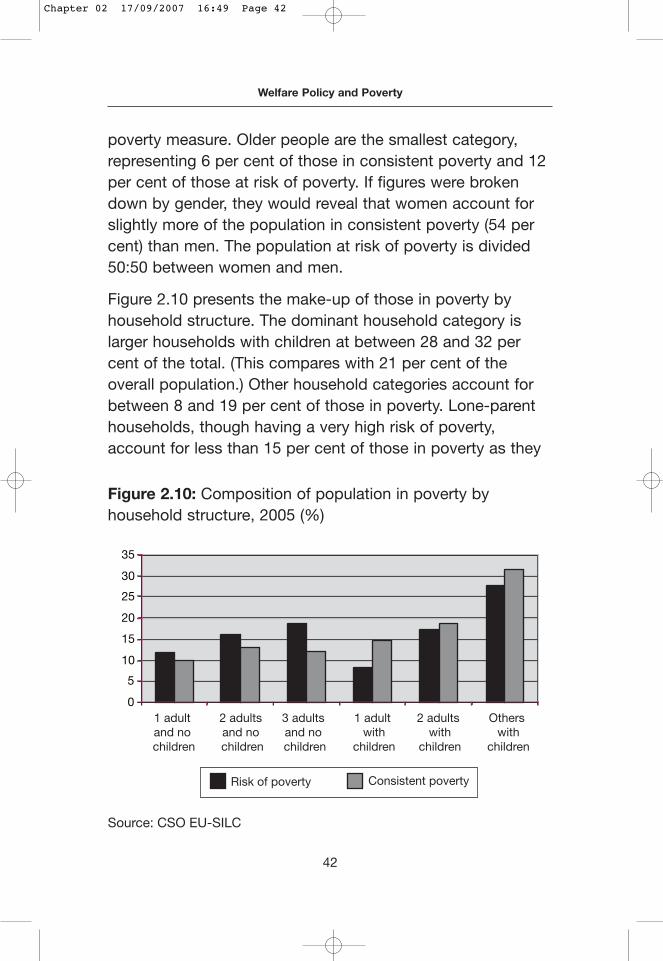
Figure 2.10 presents the make-up of those in poverty byhousehold structure. The dominant household category islarger households with children at between 28 and 32 percent of the total. (This compares with 21 per cent of theoverall population.) Other household categories account forbetween 8 and 19 per cent of those in poverty. Lone-parenthouseholds, though having a very high risk of poverty,account for less than 15 per cent of those in poverty as they
42
Welfare Policy and Poverty
Figure 2.10: Composition of population in poverty byhousehold structure, 2005 (%)
0
5
10
15
20
25
30
35
Risk of poverty Consistent poverty
1 adult and no children
2 adults and no children
3 adults and no children
1 adult with
children
2 adults with
children
Others with
children
Source: CSO EU-SILC
Chapter 02 17/09/2007 16:49 Page 42
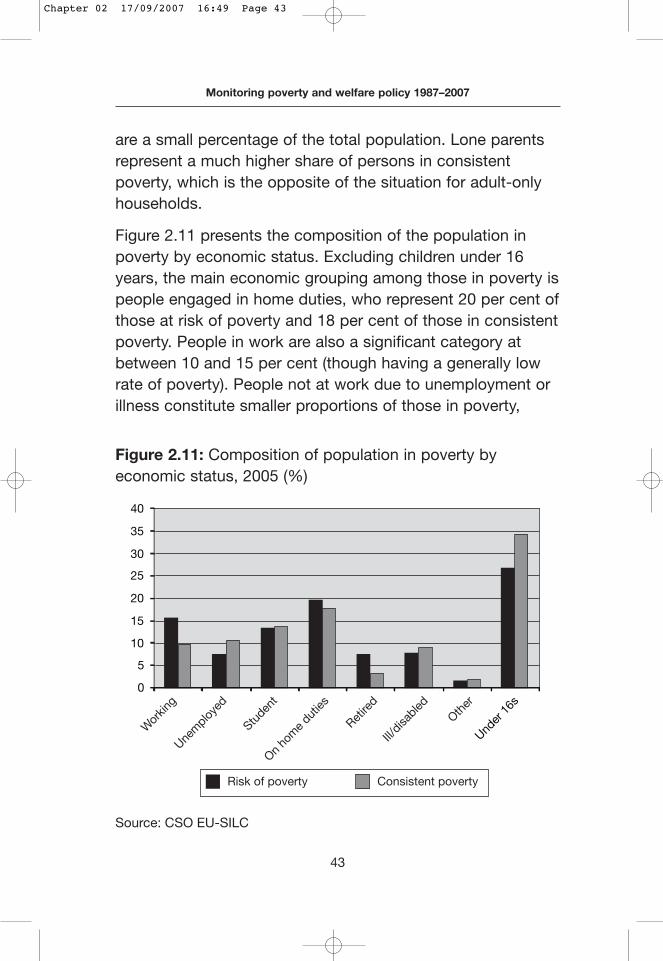
are a small percentage of the total population. Lone parentsrepresent a much higher share of persons in consistentpoverty, which is the opposite of the situation for adult-onlyhouseholds.
Figure 2.11 presents the composition of the population inpoverty by economic status. Excluding children under 16years, the main economic grouping among those in poverty ispeople engaged in home duties, who represent 20 per cent ofthose at risk of poverty and 18 per cent of those in consistentpoverty. People in work are also a significant category atbetween 10 and 15 per cent (though having a generally lowrate of poverty). People not at work due to unemployment orillness constitute smaller proportions of those in poverty,
43
Monitoring poverty and welfare policy 1987–2007
Figure 2.11: Composition of population in poverty byeconomic status, 2005 (%)
0
5
10
15
20
25
30
35
40
Wor
king
Unem
ployed
Studen
t
On ho
me d
uties
Retire
d
Ill/disa
bledOth
er
Under
16s
Risk of poverty Consistent poverty
Source: CSO EU-SILC
Chapter 02 17/09/2007 16:49 Page 43
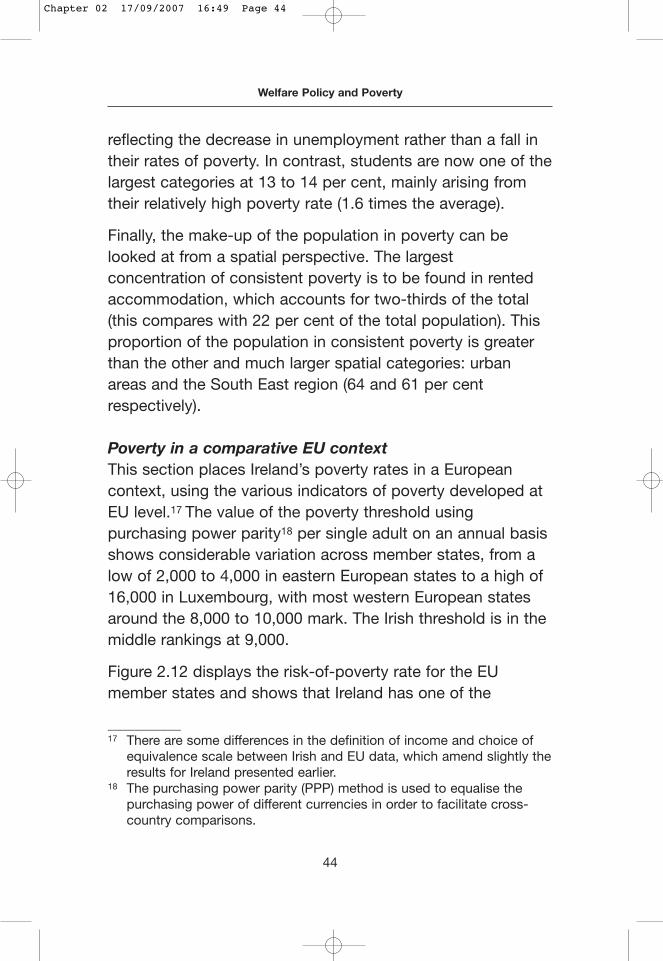
reflecting the decrease in unemployment rather than a fall intheir rates of poverty. In contrast, students are now one of thelargest categories at 13 to 14 per cent, mainly arising fromtheir relatively high poverty rate (1.6 times the average).
Finally, the make-up of the population in poverty can belooked at from a spatial perspective. The largestconcentration of consistent poverty is to be found in rentedaccommodation, which accounts for two-thirds of the total(this compares with 22 per cent of the total population). Thisproportion of the population in consistent poverty is greaterthan the other and much larger spatial categories: urbanareas and the South East region (64 and 61 per centrespectively).
Poverty in a comparative EU contextThis section places Ireland’s poverty rates in a Europeancontext, using the various indicators of poverty developed atEU level.17 The value of the poverty threshold usingpurchasing power parity18 per single adult on an annual basisshows considerable variation across member states, from alow of 2,000 to 4,000 in eastern European states to a high of16,000 in Luxembourg, with most western European statesaround the 8,000 to 10,000 mark. The Irish threshold is in themiddle rankings at 9,000.
Figure 2.12 displays the risk-of-poverty rate for the EUmember states and shows that Ireland has one of the
44
Welfare Policy and Poverty
___________17 There are some differences in the definition of income and choice of
equivalence scale between Irish and EU data, which amend slightly theresults for Ireland presented earlier.
18 The purchasing power parity (PPP) method is used to equalise thepurchasing power of different currencies in order to facilitate cross-country comparisons.
Chapter 02 17/09/2007 16:49 Page 44
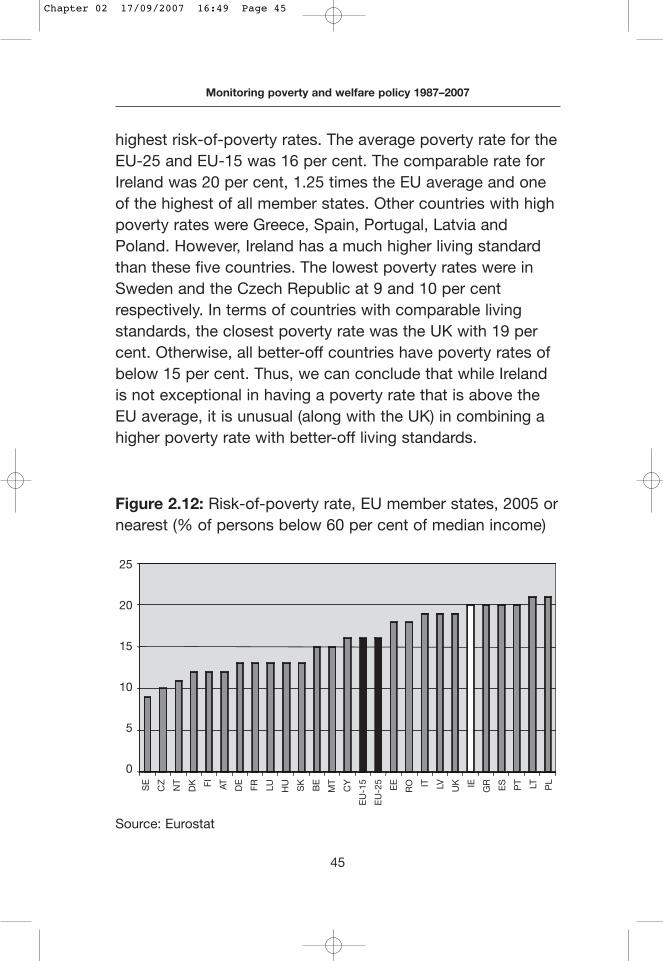
highest risk-of-poverty rates. The average poverty rate for theEU-25 and EU-15 was 16 per cent. The comparable rate forIreland was 20 per cent, 1.25 times the EU average and oneof the highest of all member states. Other countries with highpoverty rates were Greece, Spain, Portugal, Latvia andPoland. However, Ireland has a much higher living standardthan these five countries. The lowest poverty rates were inSweden and the Czech Republic at 9 and 10 per centrespectively. In terms of countries with comparable livingstandards, the closest poverty rate was the UK with 19 percent. Otherwise, all better-off countries have poverty rates ofbelow 15 per cent. Thus, we can conclude that while Irelandis not exceptional in having a poverty rate that is above theEU average, it is unusual (along with the UK) in combining ahigher poverty rate with better-off living standards.
45
Monitoring poverty and welfare policy 1987–2007
Figure 2.12: Risk-of-poverty rate, EU member states, 2005 ornearest (% of persons below 60 per cent of median income)
Source: Eurostat
25
20
15
10
5
0
SE
CZ
NT
DK FI AT DE
FR LU HU
SK
BE
MT
CY
EU
-15
EU
-25
EE
RO IT LV UK IE GR ES PT LT PL
Chapter 02 17/09/2007 16:49 Page 45
Using a measure similar to the Irish consistent poverty level(combining the risk-of-poverty measure with a measure ofdeprivation), Figure 2.13 shows Ireland in a somewhat betterlight but still with a level of consistent poverty higher thanseveral EU countries with a comparable level of wealth.
Why are Irish poverty rates so high? Recent research by theESRI has looked at a range of factors (Callan et al., 2004).The main feature identified was the performance of the socialwelfare system in ameliorating the risk of poverty. This featurecan be illustrated by looking at the risk-of-poverty rate in theEU before and after social transfers. The average pre-transferrisk-of-poverty rate in the EU was 43 per cent. After socialtransfers, this rate was reduced to 16 per cent, a reduction of64 per cent. Ireland had a lower pre-transfer poverty rate at40 per cent; social transfers lowered this rate to 20 per cent,
46
Welfare Policy and Poverty
Figure 2.13: Percentage of individuals at risk of poverty anddeprived, 2003 or nearest
0
2
4
6
8
10
12
14
16
18
Nethe
rland
s
Luxe
mbou
rg
Denm
ark
Fran
ce
Austri
a
Belgium
Irelan
dIta
lySpain
Greec
e
Portu
gal
Source: Eurostat
Chapter 02 17/09/2007 16:49 Page 46
reducing poverty by one-half. However, other richer countriesachieved a poverty reduction effect of 70 per cent.
Tax and welfare policies 1987–2007
Switching focus to the impact of welfare policies on povertyover time, there follows a look at the evolution of welfarerates for adults and children. The analysis is then broadenedto take in tax as well as welfare changes over the last twentyyears, using the ESRI tax/welfare simulation model.
Evolution of adult and child welfare ratesThe evolution of social welfare rates is outlined in Figure 2.14for the key categories of basic personal payment, statepension and qualified adult allowance, together with the levelof income support for children (combining child benefit, childdependant allowance and the clothing and footwearallowance). The basic welfare rate has quadrupled in the lasttwenty years from €43 per week in 1987 to €185 per week in2007. Adjusting for inflation, the increase in real terms is 138per cent. This increase has occurred incrementally over theperiod, though with two significant growth periods. The firstwas between 1987 and 1993 and coincided with theimplementation of the recommendations of the Commissionon Social Welfare. The second runs from 2003 to 2007, whenwelfare policy was focused on achieving the indexed target of€150 per week for the minimum welfare payment. The statepension also increased substantially over this period, thoughby a more modest 85 per cent in real terms.
Also of interest are the performances of the qualified adultallowance (QAA) and the rate of child income support (CIS).The QAA increased by 117 per cent in real terms in thetwenty years. The value of CIS has grown by 120 per cent.
47
Monitoring poverty and welfare policy 1987–2007
Chapter 02 17/09/2007 16:49 Page 47
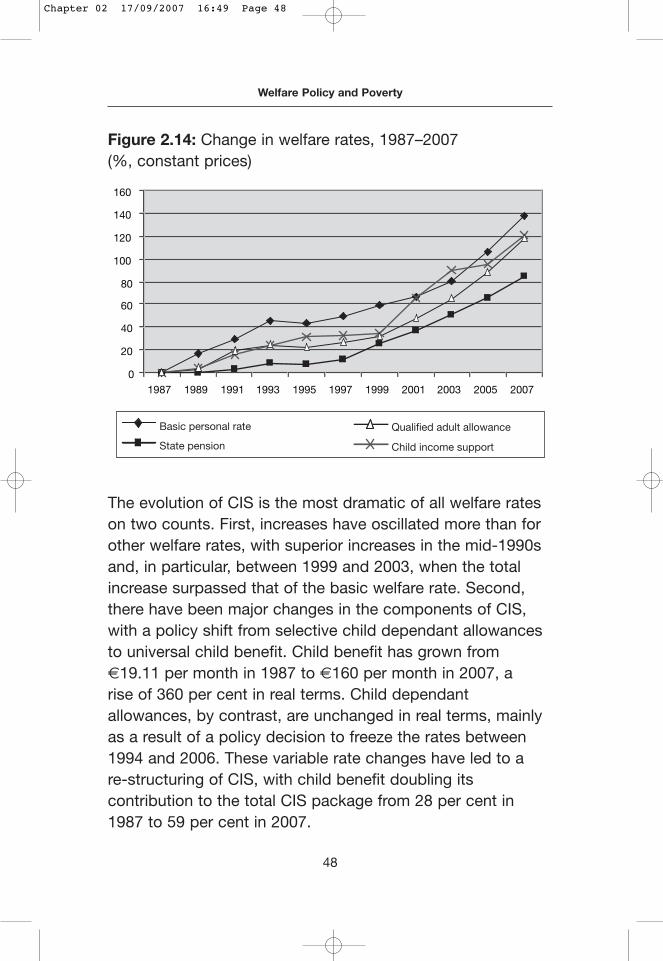
The evolution of CIS is the most dramatic of all welfare rateson two counts. First, increases have oscillated more than forother welfare rates, with superior increases in the mid-1990sand, in particular, between 1999 and 2003, when the totalincrease surpassed that of the basic welfare rate. Second,there have been major changes in the components of CIS,with a policy shift from selective child dependant allowancesto universal child benefit. Child benefit has grown from€19.11 per month in 1987 to €160 per month in 2007, arise of 360 per cent in real terms. Child dependantallowances, by contrast, are unchanged in real terms, mainlyas a result of a policy decision to freeze the rates between1994 and 2006. These variable rate changes have led to are-structuring of CIS, with child benefit doubling itscontribution to the total CIS package from 28 per cent in1987 to 59 per cent in 2007.
48
Welfare Policy and Poverty
Figure 2.14: Change in welfare rates, 1987–2007 (%, constant prices)
0
20
40
60
80
100
120
140
160
1987 1989 1991 1993 1995 1997 1999 2001 2003 2005 2007
Basic personal rate
State pension
Qualified adult allowance
Child income support
Chapter 02 17/09/2007 16:49 Page 48
Distributive and poverty impact of budgetary policyNow, we broaden the analysis to take into account changesin tax policies and also to benchmark welfare (and tax)changes with increases in wages. The latter is important asotherwise welfare rates, while ahead of inflation, may notkeep pace with wage growth, resulting in a relative declinein living standards for welfare recipients (Callan et al.,2001).
The four periods of budgetary policy examined in Table 2.5are closely linked to the periods in office of differentgovernments. Each period covers five budgets, with theexception of the first period when six budgets wereproduced. The economic and political context of eachperiod has its own distinctive features.19
49
Monitoring poverty and welfare policy 1987–2007
___________19 The first period, 1987 to 1992, was an era of modest economic
recovery after the doldrums of the early 1980s. Policy was framed bytwo partnership agreements, the Programme for National Recoveryand the Programme for Economic and Social Progress, while the twogovernments of this time were composed of Fianna Fáil (alone) andFianna Fáil with the Progressive Democrats. The next period, 1993 to1997, opened with an economic slowdown, before the economypicked up. The main partnership agreement was the Programme forCompetitiveness and Work. The two governments of this era were bothcoalitions: Labour and Fianna Fáil for two years and Labour, Fine Gaeland Democratic Left for three years. The third period, 1998 to 2002,was one of exceptional economic growth. The government was madeup of Fianna Fáil and the Progressive Democrats. The two partnershipagreements were Partnership 2000 and the Programme for Prosperityand Fairness, and the National Anti-Poverty Strategy was alsoestablished. The final period, 2003 to 2007, began with a slowdown ineconomic growth, followed by a significant improvement in the lateryears. The government was unchanged, while the new partnershipagreements were Sustaining Progress and Towards 2016.
Chapter 02 17/09/2007 16:49 Page 49
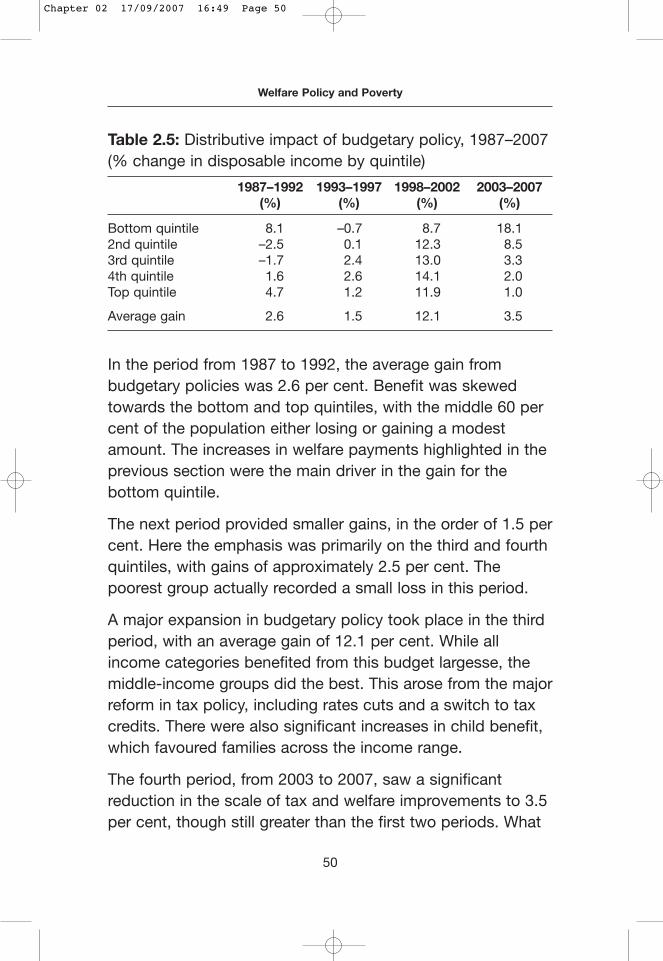
Table 2.5: Distributive impact of budgetary policy, 1987–2007(% change in disposable income by quintile)
1987–1992 1993–1997 1998–2002 2003–2007(%) (%) (%) (%)
Bottom quintile 8.1 –0.7 8.7 18.12nd quintile –2.5 0.1 12.3 8.53rd quintile –1.7 2.4 13.0 3.34th quintile 1.6 2.6 14.1 2.0Top quintile 4.7 1.2 11.9 1.0
Average gain 2.6 1.5 12.1 3.5
In the period from 1987 to 1992, the average gain frombudgetary policies was 2.6 per cent. Benefit was skewedtowards the bottom and top quintiles, with the middle 60 percent of the population either losing or gaining a modestamount. The increases in welfare payments highlighted in theprevious section were the main driver in the gain for thebottom quintile.
The next period provided smaller gains, in the order of 1.5 percent. Here the emphasis was primarily on the third and fourthquintiles, with gains of approximately 2.5 per cent. Thepoorest group actually recorded a small loss in this period.
A major expansion in budgetary policy took place in the thirdperiod, with an average gain of 12.1 per cent. While allincome categories benefited from this budget largesse, themiddle-income groups did the best. This arose from the majorreform in tax policy, including rates cuts and a switch to taxcredits. There were also significant increases in child benefit,which favoured families across the income range.
The fourth period, from 2003 to 2007, saw a significantreduction in the scale of tax and welfare improvements to 3.5per cent, though still greater than the first two periods. What
50
Welfare Policy and Poverty
Chapter 02 17/09/2007 16:49 Page 50
is most defining in this policy period is the overwhelmingfocus on lower income groups, with the bottom 40 per centof the population getting an average income boost ofbetween 8.5 and 18.1 per cent. The gains for the rest of thepopulation were more modest, between 1 and 3.3 per cent.This policy shift in favour of low-income groups can be seenas compensating for the more tax-oriented budgets at theend of the millennium.
We have a particular interest in the ten years from 1998 to2007, which coincided with the ten-year NAPS as well asexceptional budget surpluses. These features warrant an in-depth analysis of the distributive impact of this budgetary era.In addition, the impact on poverty of budgetary policy isinvestigated. Figure 2.15 presents the combined distributiveimpact of the last ten budgets from 1998 to 2007, when theaverage income gain was 16 per cent. The outcome stronglyfavours low-income groups, with an increase of 28 per centfor the bottom quintile and 22 per cent for the secondquintile. At the same time, middle and high income quintilesshow significant gains of 13 to 17 per cent. As noted above,the gains for the poorest quintiles mostly accrued between2003 and 2007, when welfare rates were increased by largeamounts.20
Another perspective on budgetary impact is to examine theshare-out of total budgetary resources (over €10,000 million)over the ten years. Income tax accounted for by far thegreatest allocation of these resources, at 65 per cent. Less
51
Monitoring poverty and welfare policy 1987–2007
___________20 This policy change was first apparent in Budget 2002, with the poorest
40 per cent gaining up to 4 per cent, as compared to an averageincrease of 1 per cent. The average gains in the next three budgetswere modest. It was primarily in Budgets 2006 and 2007 thatsignificant gains were recorded by low-income groups.
Chapter 02 17/09/2007 16:49 Page 51
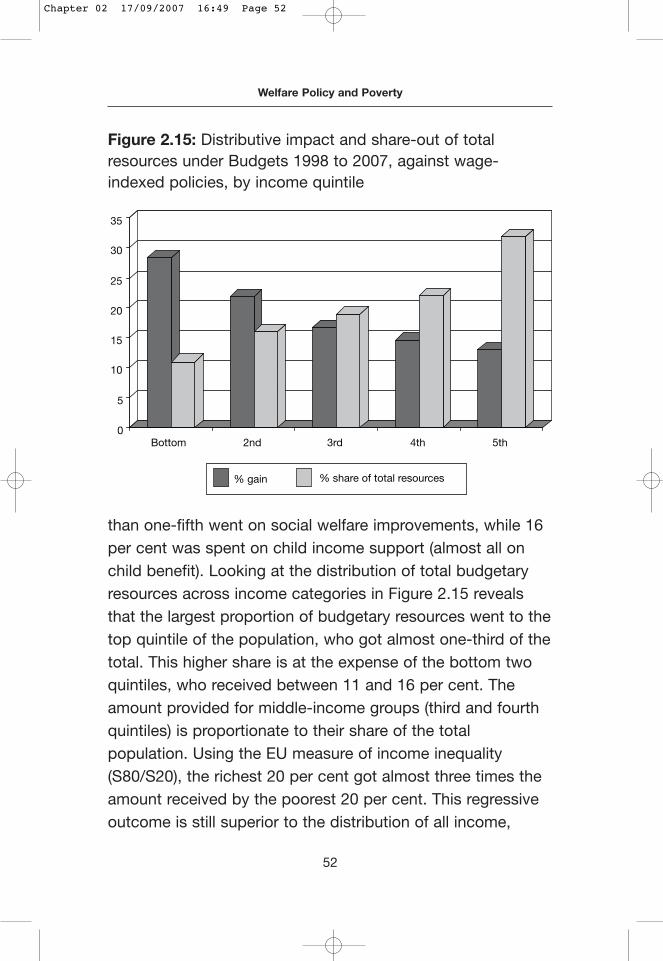
than one-fifth went on social welfare improvements, while 16per cent was spent on child income support (almost all onchild benefit). Looking at the distribution of total budgetaryresources across income categories in Figure 2.15 revealsthat the largest proportion of budgetary resources went to thetop quintile of the population, who got almost one-third of thetotal. This higher share is at the expense of the bottom twoquintiles, who received between 11 and 16 per cent. Theamount provided for middle-income groups (third and fourthquintiles) is proportionate to their share of the totalpopulation. Using the EU measure of income inequality(S80/S20), the richest 20 per cent got almost three times theamount received by the poorest 20 per cent. This regressiveoutcome is still superior to the distribution of all income,
52
Welfare Policy and Poverty
Figure 2.15: Distributive impact and share-out of totalresources under Budgets 1998 to 2007, against wage-indexed policies, by income quintile
0
5
10
15
20
25
30
35
Bottom 2nd 3rd 4th 5th
% gain % share of total resources
Chapter 02 17/09/2007 16:49 Page 52
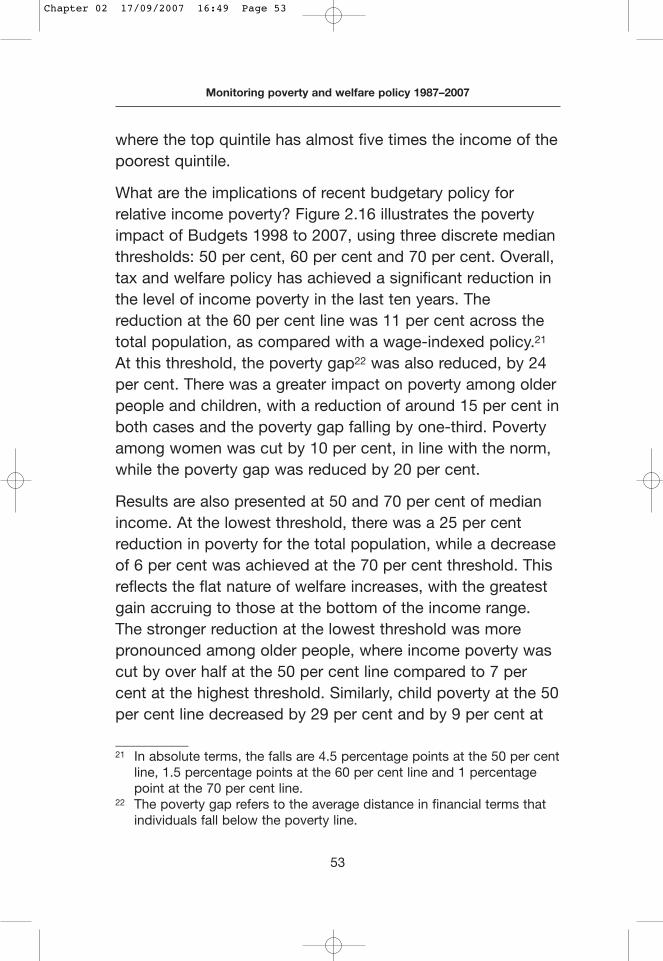
where the top quintile has almost five times the income of thepoorest quintile.
What are the implications of recent budgetary policy forrelative income poverty? Figure 2.16 illustrates the povertyimpact of Budgets 1998 to 2007, using three discrete medianthresholds: 50 per cent, 60 per cent and 70 per cent. Overall,tax and welfare policy has achieved a significant reduction inthe level of income poverty in the last ten years. Thereduction at the 60 per cent line was 11 per cent across thetotal population, as compared with a wage-indexed policy.21
At this threshold, the poverty gap22 was also reduced, by 24per cent. There was a greater impact on poverty among olderpeople and children, with a reduction of around 15 per cent inboth cases and the poverty gap falling by one-third. Povertyamong women was cut by 10 per cent, in line with the norm,while the poverty gap was reduced by 20 per cent.
Results are also presented at 50 and 70 per cent of medianincome. At the lowest threshold, there was a 25 per centreduction in poverty for the total population, while a decreaseof 6 per cent was achieved at the 70 per cent threshold. Thisreflects the flat nature of welfare increases, with the greatestgain accruing to those at the bottom of the income range.The stronger reduction at the lowest threshold was morepronounced among older people, where income poverty wascut by over half at the 50 per cent line compared to 7 percent at the highest threshold. Similarly, child poverty at the 50per cent line decreased by 29 per cent and by 9 per cent at
53
Monitoring poverty and welfare policy 1987–2007
___________21 In absolute terms, the falls are 4.5 percentage points at the 50 per cent
line, 1.5 percentage points at the 60 per cent line and 1 percentagepoint at the 70 per cent line.
22 The poverty gap refers to the average distance in financial terms thatindividuals fall below the poverty line.
Chapter 02 17/09/2007 16:49 Page 53
the 70 per cent line. Finally, among women, the reduction inpoverty was 20 per cent at the lowest threshold and 6 percent at the highest.
Overall, this analysis of budgetary policy highlights thefollowing outcomes:
• Economic growth has a major bearing on the capacity ofpolicy-makers to engage in discretionary tax/welfareexpenditure
• Ambitious welfare commitments under the revised NAPSwere the critical factor in targeting low-income groups
• The most generous budgetary period (1998–2002) in thelast twenty years was dominated by tax reductions
54
Welfare Policy and Poverty
Figure 2.16: Effect on income poverty of Budgets 1998 to2007, against wage-indexed policies (change in poverty rateat 50, 60 and 70 per cent of median income)
–60
–50
–40
–30
–20
–10
0
50% threshold 60% threshold 70% threshold
Whole populationOlder people
ChildrenWomen
Chapter 02 17/09/2007 16:49 Page 54
• Political allegiances do not seem to be a determiningfactor in distributive impact
• Even the most pro-welfare era still gave three times moregovernment resources to the richest quintile than to thepoorest
• Tax/welfare policies can have a major impact on incomepoverty.
Conclusions
This analysis of poverty trends and tax/welfare policieshighlights a number of key conclusions from the last twentyyears. There is now a high level of poverty monitoring inIreland, using both indigenous and international measures ofpoverty and supported by dedicated cross-national data-collection instruments. In Ireland, monitoring poverty hasadded political importance due to the setting of overalltargets under the NAPS.
The income or risk-of-poverty levels remain largelyunchanged over the last twenty years. However, this negativeoutcome must be tempered by the fact that the threshold hasincreased significantly in real terms. The pattern forconsistent poverty is positive, with a reduction of 50 per centbetween 1994 and 2001. This picture is complicated by theestablishment of a new higher benchmark in 2003 under theEU-SILC. There is also concern about the absolute nature ofthe deprivation element of the measure.
In a comparative EU context, Ireland has higher than averagelevels of poverty. A key factor behind this outcome is theweak impact of welfare transfers on underlying poverty rates.However, analysis of recent budgetary changes suggests an
55
Monitoring poverty and welfare policy 1987–2007
Chapter 02 17/09/2007 16:49 Page 55
intensification of the poverty impact of fiscal policies, which may take some time to work its way into EUcomparisons.
Overall, we can see that there have been major welfare gainsin the period under review, driven by policy targets andbudgetary resources. Budgetary policy has been redistributiveand pro-poor, though this has not been a consistent pattern.However, there has been a huge unseen leakage of resourcesthrough tax breaks and incentives (Hughes, 2005; CombatPoverty Agency, 2006). In conclusion, it is critically importantthat welfare rates remain central to the poverty debate as wecan see that policy on welfare rates has made a significantdifference to poverty levels.
References
Atkinson, T., Cantillon, B., Marlier, E. and Nolan, B. (2002), SocialIndicators: The EU and Social Inclusion, Oxford: Oxford UniversityPress
Beblavy, M. and Mizsei, K. (2006), ‘Making Spurious Poverty StatisticsHistory’, Development and Transition, vol. 4, June
Callan, T., Keeney, M. and Walsh, J. (2001), ‘Income Tax and WelfarePolicies: Some Current Issues’, in Callan, T. and McCoy, D. (eds.),Budget Perspectives. Proceedings of a Conference Held on 9 October,2001, Dublin: ESRI
Callan, T., Keeney, M., Nolan, B. and Maître, B. (2004), Why is RelativeIncome Poverty so High in Ireland?, Dublin: ESRI
Callan, T., Layte, R., Nolan, B., Watson, D., Whelan, C. T., Williams, J. andMaître, B. (1999), Monitoring Poverty Trends, Dublin: Stationery Officeand Combat Poverty Agency
Callan, T., Nolan, B. and Whelan, C. T. (1993), ‘Resources, Deprivation andthe Measurement of Poverty’, Journal of Social Policy, vol. 22, no. 2, pp. 141–172
Callan, T., Nolan, B. and Whelan, C. T. (1996a), A Review of theCommission on Social Welfare’s Minimum Adequate Income, Dublin:ESRI
56
Welfare Policy and Poverty
Chapter 02 17/09/2007 16:49 Page 56
Callan, T., Nolan, B., Whelan, B. J., Whelan, C. T. and Williams, J. (1996b),Poverty in the 1990s. Evidence from the 1994 Living in Ireland Survey,Dublin: Oak Tree Press
Central Statistics Office (2005a), EU Survey on Income and LivingConditions (EU-SILC). First Results 2003, Statistical Release, 24January, Dublin/Cork: CSO
Central Statistics Office (2005b), EU Survey on Income and LivingConditions (EU-SILC). 2004 (with revised 2003 estimates), StatisticalRelease, 12 December, Dublin/Cork: CSO
Central Statistics Office (2006), EU Survey on Income and LivingConditions (EU-SILC). 2005, Statistical Release, 16 November,Dublin/Cork: CSO
Collins, M. L. (2006), ‘Poverty: Measurement, Trends and FutureDirections’, in Healy, S., Reynolds, B. and Collins, M. (eds.), SocialPolicy in Ireland. Principles, Practice and Problems, Dublin: The LiffeyPress
Combat Poverty Agency (2006), Promoting Equity in Ireland’s Tax System,Dublin: CPA
Commission on Social Welfare (1986), Report, Dublin: GovernmentPublications
CORI Justice (2006), Socio-Economic Review 2007. AddressingInequality, Dublin: CORI Justice
Guio, A.-C. (2005), Material Deprivation in the EU, Statistics in Focus,Population and Social Conditions, 21/2005, Luxembourg: Eurostat
Hughes, G. (2005), ‘Pension Tax Reliefs and Equity’, in Stewart, J. (ed.),For Richer, For Poorer; An Investigation of the Irish Pension System,Dublin: Tasc
Ireland (2002a), Building an Inclusive Society, Dublin: Stationery Office
Ireland (2002b), National Action Plan against Poverty and Social Exclusion2003–2005, Dublin: Stationery Office
Ireland (2007), National Action Plan for Social Inclusion 2007–2016,Dublin: Stationery Office
Layte, R., Maître, B., Nolan, B., Watson, D., Whelan, C. T., Williams, J. andCasey, B. (1999), Monitoring Poverty Trends and Exploring PovertyDynamics, Dublin: ESRI
Maître, B., Nolan, B. and Whelan, C. T. (2006), Reconfiguring theMeasurement of Deprivation and Consistent Poverty in Ireland, Dublin:ESRI
57
Monitoring poverty and welfare policy 1987–2007
Chapter 02 17/09/2007 16:49 Page 57
Nolan, B. (2006a), ‘The EU’s Social Inclusion Indicators and TheirImplications for Ireland’, in Healy, S., Reynolds, B. and Collins, M.(eds.), Social Policy in Ireland. Principles, Practice and Problems,Dublin: The Liffey Press
Nolan B. (2006b), ‘Trends in Income Inequality in Ireland’, Combat Poverty Agency seminar, 14 March: http://cpa.ie/research/seminars/presentations/2006-03-14_BrianNolan.pdf
Nolan, B. and Callan, T. (eds.) (1994), Poverty and Policy in Ireland, Dublin:Gill & Macmillan
Nolan, B. and Smeeding, T. (2005), ‘Ireland’s Income Distribution inComparative Perspective’, Review of Income and Wealth, vol. 54, no.4, pp. 537–560
Nolan, B. and Whelan, C. T. (1996), Resources, Deprivation and Poverty,Oxford: Clarendon Press
Nolan, B., Gannon, B., Layte, R., Watson, D., Whelan, C. T. and Williams,J. (2002), Monitoring Poverty Trends: Results from the 2000 Living inIreland Survey, Dublin: ESRI
Pensions Board (1998), Securing Retirement Income, Dublin: PensionsBoard
Social Protection Committee (2001), Report on Indicators in the Field ofPoverty and Social Exclusion: http://ec.europa.eu/employment_social/social_protection_commitee/docs/laeken_list.pdf
Social Protection Committee (2006), Portfolio of Overarching Indicatorsand Streamlined Social Inclusion, Pension, and Health Portfolios,Brussels: European Commission
Social Welfare Benchmarking and Indexation Group (2001), Final Report ofthe Benchmarking and Indexation Group, Dublin: Stationery Office
Whelan, C. T., Layte, R., Maître, B., Gannon, B., Nolan, B., Layte, R.,Watson, D. and Williams, J. (2003), Monitoring Poverty Trends: Resultsfrom the 2001 Living in Ireland Survey, Dublin: ESRI
58
Welfare Policy and Poverty
Chapter 02 17/09/2007 16:49 Page 58
Chapter 3
Child poverty and child income supports
John Sweeney
Introduction
‘A comprehensive assessment of the lives and well-being ofchildren and adolescents in the economically advancednations’ (UNICEF, 2007) contains good and bad news forIreland. Though we are still playing catch-up with otheradvanced countries in areas such as early education, childcareand child protection, the overall wellbeing of Ireland’s childrenis ranked ninth of the world’s twenty-one richest countries(ahead, for example, of France in sixteenth place and the UK intwenty-first place). Relative to children in other countries, Irishchildren perceive their lives positively, show a goodpreparedness and ability to cope with pressures, enjoy goodfamily and peer relationships and are well served by theireducational system. That is the good news. The bad news isthat Ireland would have scored even better but for poorrankings on the dimensions of material wellbeing and healthand safety (nineteenth in each). Relatively high percentages ofchildren live in households with low incomes, no parent inemployment and a paucity of educational and culturalresources. By international standards, Irish children areexposed to high levels of risk to their health and safety.
59
Chapter 03 17/09/2007 16:50 Page 59
The UNICEF assessment is dictated by the methodologyemployed and is not intended to provoke. But we should beprovoked. In the first place, to address what appear as ourrelative weaknesses more boldly and imaginatively. Irelandhas achieved an expansion of employment unprecedented inthe industrialised world, disposable incomes and governmentrevenue have risen rapidly, and there have been majorimprovements in child income supports. Yet a large minorityof the nation’s children still do not have an acceptablestandard of living. This chapter is about that challenge –exploring what must be done differently to extend materialwellbeing to all children in Ireland so that, at least, thiselement in the framework of each child’s development isassured. In second place, the UNICEF assessment shouldprovoke us to value and protect what currently appear asIreland’s relative strengths. Individuals, families andcommunities in Ireland may be living through profound socialand cultural changes but Irish children still enjoy a quality tothe non-material dimensions of their lives that children incountries that have been richer for longer might envy.
The focus of this chapter on the role of child income supportsin alleviating child poverty may – in some years’ time –appear dated and reflect a dominant perspective on childpoverty that, with hindsight, will be seen to have beencharacteristic of the 1987 to 2007 period. After all, childrendo not have incomes and the level of their household’sincome is only an indicator of a risk of child poverty and anambiguous guide to their wellbeing. However, if newperspectives are to emerge and strengthen, it is probablynecessary that the concentration on child income supportsfirst occurs. Only when it is clear that relatively little more canbe accomplished through them will fresh analyses and
60
Welfare Policy and Poverty
Chapter 03 17/09/2007 16:50 Page 60
complementary policy developments – particularly of theservices from which socially disadvantaged children benefitdisproportionately – move centre stage in combating childpoverty.
There is unfinished business with child income supports inIreland. If the role of household income in combating childpoverty should not be exaggerated, it should not beminimised either. The first section below, therefore, exploreshow low household income damages children. A secondsection briefly summarises what we now know about why asignificant minority of households with children have seriouslylow incomes. The chapter then reviews how our current set ofchild income supports has been conceptualised andstructured to support low-income families. At the heart of thechapter is a close-up look at the strengths and weaknessesof each of the main instruments that currently subsidise thecosts of parenting. This is followed by suggestions on thedirection that further reform should take and, finally,conclusions on child poverty and child income supports inIreland.
How does low household income affect children?
A first set of relationships between low household incomeand poor childhood conditions must be acknowledged whichare not, properly, a challenge to the levels of child incometransfers and household incomes. Where low householdincomes mean children live in crowded and poorly heatedhomes, are exposed to severe health and safety risks in theirneighbourhoods, attend schools characterised by high levelsof absenteeism and staff turnover, receive prompt medicalattention only by attending hospital accident and emergency
61
Child poverty and child income supports
Chapter 03 17/09/2007 16:50 Page 61
services, and so on, the primary response should not be toboost household incomes so that families can escape thosehomes, neighbourhoods, schools etc. The real challenge is toimprove the standards of housing, neighbourhoods, schoolsand health services available to families on low incomes whilethey are on low incomes.
This is a major challenge to service-providers which theymust, and by and large do, assume. Nothing is gained byhaving public policy feed a process whereby access to coreservices of a high standard is dependent on income. Publiclyfunded service-providers must therefore shoulderresponsibility for breaking links between low family incomeand children’s exposure to poor standards in housing,physical security, education and healthcare. Higher socialwelfare payments, more generous child income supports andbetter-resourced and integrated welfare-to-work policies arenot the appropriate instruments for ensuring that all childrenhave access to quality services.
If families with low incomes had access to quality services fortheir children, would their low incomes still be a legitimateconcern of public policy? Child income supports are,ultimately, additions to household income paid to adults onbehalf of children for whom they have responsibility. It shouldnot be assumed that a child in a household where theequivalent income is below 60 per cent of the median is, onthat evidence alone, in need. The child may even be the leastlikely member of the household to experience deprivation ifparents successfully shield their children from theconsequences of low household income, through self-sacrifice and the quality of the parent–child relationship. It isimportant, therefore, to ‘avoid stigmatising low-incomefamilies with high levels of parenting skills’ (UNICEF, 2005,
62
Welfare Policy and Poverty
Chapter 03 17/09/2007 16:50 Page 62
p. 6). The least ambiguous indicators of child poverty, infact, are provided by non-monetary outcomes (lowbirthweight, sickness and accidents in childhood, neglectand abuse, poor ‘school readiness’, hazardousenvironments etc.). Where the data allow it, such final childoutcomes are more reliable as evidence of child povertythan low household income, which remains an intermediateor instrumental factor.
It is important, therefore, that the convenience of framing achild poverty measure in terms of income does not ‘skewthe policy response excessively towards tax and transferchanges, and away from improving public services forchildren which might have a greater impact on their well-being over the longer term’ (Brewer, 2003, p. 1). In fact,‘research cannot yet tell us whether directing extraresources to parents is better for children’s well-being in thelonger term than improving services for children’ (p. 14).
Granted all this, it is nevertheless possible to distinguishthree important ways in which low household incomesimpact negatively on child members of those households.The first is simply that items which aid children’sdevelopment, and which parents know would do so andwant for their children, are unaffordable (for examplemedicines, children’s furniture, space within the house to dohomework, heating, school trips, a computer). Researchmakes clear that adequately resourced home environmentssignificantly improve opportunities for children’sdevelopment and justify prioritising low-income householdswith resources available for child income support. In otherwords, additional income is important at low levels ofhousehold income, while above a certain thresholdadditional income does little to improve the environment for
63
Child poverty and child income supports
Chapter 03 17/09/2007 16:50 Page 63
children further. The best available data in 2007 suggest thata large minority of children in Ireland by internationalstandards do not have sufficiently well-endowed homeenvironments.1
A second route by which low household income impactsnegatively on children is by undermining the quality ofparenting they receive. Parents who struggle with debt, arethemselves poorly fed, are unable to purchase medicines orto socialise beyond a minimum extent, must work long andawkward hours etc. are more likely to be tired much of thetime, experience ill health or suffer depression. In the processthey become less attentive or more authoritarian parents.Some striking research in Ireland finds that it is the degree offinancial stress experienced by a mother rather than the levelof household income itself which has the stronger influenceon child wellbeing (McKeown and Haase, 2006). While closelyrelated, the two are not one and the same thing. Amonghouseholds with similar levels of income, the extent to whichthe mother was struggling to make ends meet had a strongand independent influence on the parent–child relationshipand the mother’s own health.2
64
Welfare Policy and Poverty
___________
1 UNICEF (2007) uses 2001 data from the World Health Organization’ssurvey on Health Behaviour in School-age Children and 2003 data fromthe OECD’s Programme for International Student Assessment toconclude that Irish children have poor educational and culturalresources in their homes by OECD standards (placed nineteenth out oftwenty-four countries). See, especially, its Figure 1.3b.
2 McKeown and Haase comment: ‘It is clear from [our analysis] thathelping people to cope financially involves much more than money,however important that may be in particular cases. Helping people tocope financially also requires, as a pre-requisite, helping them to copewith themselves and the life events that they experience’ (2006, p. 60).
Chapter 03 17/09/2007 16:50 Page 64
A third route by which low household income impactsnegatively on children hinges crucially on the childrenthemselves. They also notice what money does directly forthem. They too have direct economic concerns (preferredfood, bedroom accessories, trips etc.) whose denial they findhard. More crucially, children too are social beings and feelacutely the judgement of their peers. They can be anguishedwhen denied an item or activity that would strengthen theirgroup belonging and when ‘not having’ marks them out asdifferent. School, in particular, is a hugely important world tochildren in which not being able to afford what protects theirstatus can cause deep unhappiness.
Why do some households with children have very lowincomes?
Children do not have incomes and we consider a child to bebelow an income poverty line only after aggregating allsources of the household’s income and reckoning the shareof that which is specifically available to meet the child’sneeds (this, essentially, is what adjusting household incomeusing an equivalence scale does). Child income povertyfigures can appear to play tricks but once attention is paid tosuch factors as where the poverty line is drawn, theequivalence scale used, the years to which the data refer andthe age group selected, most differences can be explained.The UNICEF report (2007) found that 6 per cent of Irishchildren lived in relative income poverty (using 50 per cent ofmedian income in 2000), whereas the EU-SILC (CSO, 2006)estimated 21 per cent (using 60 per cent of median income in2005), but the conclusion is the same: Ireland has one of theworst performances in the industrialised world on this score.What is even more challenging is that there has been only a
65
Child poverty and child income supports
Chapter 03 17/09/2007 16:50 Page 65
modest fall of 3 to 4 per cent in these proportions despite theonset of the economic boom, the huge drop inunemployment, the major increases in child benefit and otherimprovements in the labour market and tax and social welfarecodes. We should not be satisfied.
To answer what is going on, three sources of householdincome – and their interrelationships – need to be separatelyconsidered: earnings, adult social welfare receipts and childincome supports.
Parental earningsWhat parents earn is the most important determinant ofwhether children are reared in income poverty or not. Analysisof child poverty in 2000 (NESC, 2003) made it clear thatparental non-employment was the single most importantfactor associated with child poverty, much more importantthan whether a child was being reared in a lone-parent orcouple household. For example, children of lone parents in ajob faced a poverty risk of 8 per cent but children with twonon-employed parents faced a poverty risk of 33 per cent.While parental employment did wonders in reducingchildren’s poverty risk, it by no means guaranteed it. Nearlyone-half (46 per cent) of all children in consistent poverty hadparents in employment. This type of evidence has been aclear invitation for some time to develop policy responses tochild poverty that both encourage parents to cross from non-employment to work and provide a continuing element of in-work support where parents have low earnings.
It is clear which parents are having difficulty accessingemployment and earning at a decent level in contemporaryIreland. They are primarily women. The surge in women’semployment rates in Ireland is well documented but, for some
66
Welfare Policy and Poverty
Chapter 03 17/09/2007 16:50 Page 66
groups, they remain exceptionally low by OECD standards.For example, the employment rate3 of mothers in Ireland withtwo or more children aged under 16 is one of the lowest inthe industrialised world (Cournède, 2006); the employmentrate of older women (aged 55 to 64) is low, less than half ofthe rate in Sweden; and the employment rate of women whohave not completed upper secondary education is one of thelowest in the EU (NESC, 2005b). It is, of course, important tobe clear whether and under what conditions it is better for amother with young children and/or with only limited earningspower to take up employment rather than to remain in thehome. But either way the position adopted has majorimplications for the design and resourcing of child incomesupports. Cross-country differences in child poverty rates arerelated to differences in mothers’ employment rates (Försterand d’Ercole, 2005).
The principal challenge of Ireland’s high child income povertyhas been well articulated by UNICEF (2005, p. 30):
A child poverty rate of 15.7 per cent (at the 50% of medianline) puts Ireland close to … the bottom of the childpoverty league. But the problem of Ireland has beenprincipally one of preventing income inequality fromwidening during a period of sustained economic growthand rising median incomes. A child poverty rate based ona percentage of median income will increase unless low-income groups share equally in the benefits of growth.Faced with this challenge, the appropriate response wouldseem to be a more active policy for developing the skills
67
Child poverty and child income supports
___________
3 In full-time equivalent terms, also called the ‘effective labour supply’.
Chapter 03 17/09/2007 16:50 Page 67
and opportunities of low-income parents to enable them tocapture a higher share of the benefits of economicprogress.
Adult social welfare paymentsThe level of the payments to which non-employed parents areentitled, whatever the reason they are not employed, alsoimpacts strongly on the likelihood of their children fallingbelow the income poverty lines. Over the period from 1994 to2006, the proportion of children in Ireland living in joblesshouseholds fell by more than in any other EU-15 country(Eurostat). However, this still left 11 per cent of Irish childrenin jobless households in 2006, the third highest proportion inthe EU, though Ireland was recording the area’s third lowestunemployment rate. (Ominously, all of the reduction wasachieved by 2000 after which there was a slight increase.)
Some of the parents of this 11 per cent of children may havebright futures in the workforce and need phased andsystematic supports to move progressively from their currentreliance on social assistance to decent employment. Life onmeans-tested assistance is not something they want tomodel for their children and their own wellbeing andparenting may improve through having a job. The challengesthis presents to the current social welfare code – itsassumptions, qualifying conditions, benefit withdrawal ratesetc. – are being increasingly well focused.4 However, somecurrently non-employed parents may simply not be in a
68
Welfare Policy and Poverty
___________
4 It is a major theme in the NESC report, The Developmental WelfareState (2005b), in the Government Discussion Paper: Proposals forSupporting Lone Parents (Ireland, 2006a) and in the social partnershipagreement, Towards 2016 (Ireland, 2006b, section 31).
Chapter 03 17/09/2007 16:50 Page 68
position to take up employment, at least in the medium term,because of poor health, an exceptional level of caringcommitments, or other difficulties, and an income sufficient toraise their children with dignity will remain the responsibility ofthe state. For both sets of non-employed parents – thosewho can become self-reliant in the medium term and thosewho cannot – a higher adult payment has an important role toplay in bringing their children above the income poverty lines.It has been cogently observed: ‘Countries with the lowest(child) poverty rates are those in which children benefit agood deal from other transfers not necessarily directed tothem’ (Corak et al., 2005, p. 35).
Each of the strategies employed to date – for examplemeeting the adequacy level set by the 1986 Commission onSocial Welfare (a major benchmark up to 1997), raising ratesby ‘more than inflation’ and to the degree that ‘resourcespermit’ (the discretionary strategy favoured by theDepartment of Finance), reaching ‘€150 a week in 2002terms by 2007’ (the benchmark adopted in the 2002 revisedNAPS) – has its cogent logic, but not one of them guaranteesthat children in welfare-dependent households will be raisedabove the income poverty line.
Child income supportsChildren’s greater likelihood of being income poor comparedto adults in Ireland has been much reduced since 1987 andimprovements in child income supports can claim much ofthe credit for this. Before the large increases in child benefitthat began in 2001 were completed, and on the basis of datagathered for twenty-two countries in July of that year,Ireland’s cash transfers on behalf of children were found to begood by international standards (Bradshaw and Finch, 2002).
69
Child poverty and child income supports
Chapter 03 17/09/2007 16:50 Page 69
They were high relative to average disposable earnings, torecipient households’ total disposable incomes and as aproportion of the overall level of social welfare spending.Indeed, in some family circumstances, the level of cashtransfers in Ireland rated among Europe’s best. When thevalue of state services on behalf of children (support forfamilies in accessing childcare, health services, educationand housing) was added to child income supports in thisinternational comparison, however, Ireland’s high rankingwas abruptly reversed. For example, while Ireland’s totalpackage of supports for an unemployed lone parent withone child was the best of the twenty-two countries studied,it swung to last position when the lone parent was onaverage female earnings and paying for childcare (see alsoNESC, 2005b).
Observing that good levels of child income support byinternational standards are not resulting in low levels of childpoverty by international standards brings us to the heart ofthe matter. Using even the same level of resourcesdifferently, could more be achieved? The remainder of thischapter explores the strengths and weaknesses of theinstruments currently being used. Overall, Ireland is aprominent example of a general characteristic observed ofchild income support arrangements in the English-speakingworld: ‘We find that market incomes play a larger role thanstate transfers in accounting for the cross-national diversityof outcomes for disadvantaged children. The English-speaking countries other than the USA, for example, actuallyprovide quite substantial income transfers to their mostneedy children. The living standards of these children,however, remain relatively low because of low labour-marketincomes’ (Bradbury and Jäntti, 2001, p. 88).
70
Welfare Policy and Poverty
Chapter 03 17/09/2007 16:50 Page 70
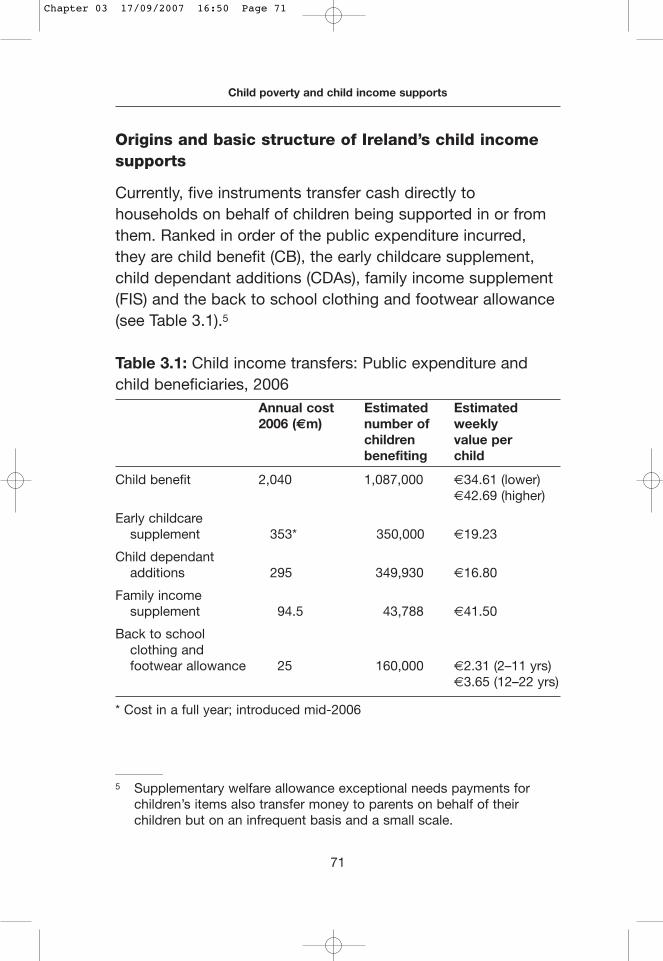
Origins and basic structure of Ireland’s child incomesupports
Currently, five instruments transfer cash directly tohouseholds on behalf of children being supported in or fromthem. Ranked in order of the public expenditure incurred,they are child benefit (CB), the early childcare supplement,child dependant additions (CDAs), family income supplement(FIS) and the back to school clothing and footwear allowance(see Table 3.1).5
Table 3.1: Child income transfers: Public expenditure andchild beneficiaries, 2006
Annual cost Estimated Estimated 2006 (€m) number of weekly
children value per benefiting child
Child benefit 2,040 1,087,000 €34.61 (lower)€42.69 (higher)
Early childcare supplement 353* 350,000 €19.23
Child dependant additions 295 349,930 €16.80
Family income supplement 94.5 43,788 €41.50
Back to school clothing and footwear allowance 25 160,000 €2.31 (2–11 yrs)
€3.65 (12–22 yrs)
* Cost in a full year; introduced mid-2006
71
Child poverty and child income supports
___________
5 Supplementary welfare allowance exceptional needs payments forchildren’s items also transfer money to parents on behalf of theirchildren but on an infrequent basis and a small scale.
Chapter 03 17/09/2007 16:50 Page 71
Between direct spending and tax expenditures6, thegovernment spent the equivalent of 2.2 per cent of grossnational income in 2004 (the last year for which full figures areavailable) on boosting the cash resources at the discretionaryuse of parents via cash transfers and tax reductions.
The development of policyIn broad summary, the more important policy changes since1987 have been:
1986–1992 CDAs were substantially increased1994 CDAs were frozen and CB given a large
increase1998 The calculation of FIS thresholds was moved
to a net income basis (hitherto, gross incomehad determined eligibility)
2001 A major programme of increases in CB began2006 The early childcare supplement was introduced2007 FIS thresholds were recalibrated to increase
support for large families2007 CDAs were increased for the first time since
1994.
However, the basic contours of the system wereconceptualised in the mid-1980s, and reconfirmed in the mid-1990s. This story is important to this chapter.
The 1986 report of the Commission on Social Welfare (CSW)examined child income supports in depth. It rejected two
72
Welfare Policy and Poverty
___________
6 Four tax credits reduce the tax-take from individuals as a directconsequence of their responsibility for rearing children – the one-parent family tax credit, the home-carer’s tax credit, the widowedparent’s tax credit and the incapacitated child tax credit – while childbenefit is exempted from income tax.
Chapter 03 17/09/2007 16:50 Page 72
extreme positions: on the one hand, that the state isresponsible for the full costs of rearing children, regardless oftheir families’ resources; and on the other, that child incomesupport provided by the state should be given only to a smallgroup of low-income families. Instead, it believed that thestate should make ‘a contribution’ to the income of allfamilies but ‘full provision’ for children in families whollyreliant on social welfare (p. 293).
The instrument through which the state makes ‘acontribution’ to the costs of rearing all children is CB (thentermed children’s allowance), which is funded out of generaltaxation. The CSW did not address the question of theproportion of the cost of rearing a child that should besocialised in this way (nor has this issue been systematicallyaddressed in any subsequent Irish study). It recommendedonly that the then rate ‘be improved’ in real terms, noting thatit had been allowed to decline from its peak in 1982.
The instruments through which ‘the State should provide thefull cost of rearing children for families dependent on socialwelfare payments’ were CDAs and CB (p. 201). The CSW didnot try to establish the cost of rearing a child directly butdeduced it instead by applying the appropriate equivalencescale7 to what constituted a minimally adequate weeklyincome for an adult. The same approach was taken in 2002when the revised NAPS (Ireland, 2002) expressed its targetfor CDAs and CB combined as 33 to 35 per cent of thelowest adult social welfare payment.
73
Child poverty and child income supports
___________
7 The CSW noted the absence of Irish research on the appropriateequivalence scale for Irish conditions.
Chapter 03 17/09/2007 16:50 Page 73
The CSW accepted that each instrument had inherentstrengths and weaknesses in helping poor families. On theone hand, increasing CDAs gave greater priority to low-income families and, thus, successfully ‘selectivised’ childincome support. However, if the rates became ‘very high’,they would create a work disincentive for large families. TheCSW emphatically rejected that CDAs at that time wereexercising a significant disincentive effect.8 On the otherhand, CB created no work disincentive, was an independentincome for mothers and adjusted the post-tax incomes ofhouseholds in recognition of children being reared in them.9
However, CB spread child income support thinly across allfamilies at a ‘substantial’ cost to the exchequer. On balance,the CSW favoured ‘the continuation of a significant elementof child dependant allowances’ with, ‘in the long term, amodest relative shift towards [CB] and away from childdependant allowances’ (p. 298).
The CSW did not back the intention in a 1985 governmentplan (Building on Reality) to merge CDAs and CB into asingle, taxable child benefit. It believed the large presence ofchildren in the population and the extent of poverty amongthem made meeting the full cost of rearing a child for familieson social welfare through taxable CB alone too expensive. Itchose to back instead the new FIS, just being introduced, asa third instrument that would provide support for workers onlow earnings who were not entitled to CDAs (because theywere not in receipt of welfare) but whose families needed
74
Welfare Policy and Poverty
___________
8 A strong critique of the huge variety of rates at which CDAs were paidled to an extensive rationalisation and simplification of the paymentstructure in subsequent years.
9 With this last observation, the Commission rehearsed the positionagainst taxing CB taken by the Commission on Taxation in 1982.
Chapter 03 17/09/2007 16:50 Page 74
more support than CB alone. The CSW was not enthusiastic inaccording FIS this role. Its introduction, it noted, had added ‘alayer of complexity to child income supports’ and ‘made moredifficult (their) proper long-term evolution’ (p. 300).10 The CSWrecommended that, as the rate of CB improved over time andmarginal tax rates came down for low-paid employees, FISshould eventually be dispensed with.
In summary, the scenario envisaged from 1986 onwards wasof three instruments providing support to three groups offamilies: CB as a first tier reaching all families; and then CDAsand FIS forming a second tier for low-income families split intotwo groups, those reliant on social welfare receiving CDAsalong with their CB and those on low earnings receiving FIS as well as CB. Twenty years later, the essential contours ofIreland’s child income support system continue to match thisdescription.
Ten years after the CSW, an Expert Working Group on theIntegration of the Tax and Social Welfare Systems (1996)reviewed the whole system and explored some majoralternatives. It was concerned that CDAs and FIS werecreating significant work disincentives: CDAs creating an‘unemployment trap’ because families only got them asincome if they remained unemployed; FIS creating a ‘povertytrap’ because the withdrawal of the benefit as earnings roseadded to rising tax obligations to absorb a major part of anyincrease in earnings.
The context to the 1996 report was significant. Theunemployment rate in 1995 was 13.5 per cent, the same rate
75
Child poverty and child income supports
___________
10 The CSW cited the National Planning Board’s (1984) evaluation of FISas ‘a further ad hoc adjustment to an already complicated andanomalous social welfare code’ (p. 287).
Chapter 03 17/09/2007 16:50 Page 75
as in 1990, and seemed to be responding little to theimprovement in the economy. For much of the period since1986, and contrary to the CSW’s recommendation, priorityhad been given to increasing CDAs rather than CB.11 Aconcern that CDAs had become a work disincentive led to a1994 decision to freeze their value. The impact of doing sowas softened with a major increase in CB (35 per cent) and acommitment to move towards a child benefit supplement‘that would be paid to social welfare recipients and low tomiddle income families’ (then Minister for Finance RuairíQuinn, Budget 1995). In the event, increases in CB alonewere relied upon to compensate recipients of CDAs for thecontinuing erosion of their value and the child benefitsupplement did not materialise.
Much of the analysis of the 1996 report centred on thecalculation of replacement rates and it was clear that CDAswere causing these to be particularly high for welfarerecipients with children.12 CDAs at the time were also costingthe exchequer more than CB (105 per cent of expenditure onCB), making it prohibitively costly to envisage raising CB tocompensate for the abolition of CDAs, even though doing sowould eliminate all disincentive effects.
Led by the principle that in-work income (net of tax andcosts) should be higher than unemployment income (inclusiveof secondary benefits) for people with children, the ExpertGroup examined some major alternatives to the child income
76
Welfare Policy and Poverty
___________
11 From 1986 to 1992, the lowest CDA was increased from £8.70 to£12.50 per week (an increase of 44 per cent); in contrast, the lower CBrate was raised from £15.05 to £15.80 (an increase of 5 per cent).
12 By 1995, for example, CDAs alone accounted for 28 per cent of thetotal income of an unemployed couple with three children.
Chapter 03 17/09/2007 16:50 Page 76
support system in place. Two are particularly relevant to thischapter. A first alternative was to subsume CDAs and FIS intoa higher rate of CB that would be taxable (‘integrated childbenefit’, in effect the Building on Reality proposal of 1985).This was not recommended, however, because it ‘wouldsignificantly increase public expenditure and income taxation,and many of the benefits would accrue to people on higherearnings rather than to those for whom employmentincentives are an issue’ (p. 43).
A second alternative also subsumed CDAs and FIS but thistime into a child benefit supplement (CBS) paid only tofamilies with income below a certain threshold regardless ofwhere their income came from (employment or socialwelfare).13 The Expert Group examined a modest example ofhow such a CBS might work14 and concluded that it wouldbe progressive (direct resources to where they were mostneeded) and flexible (could be made costly or inexpensive byadjusting its key parameters). However, it saw two significantdrawbacks. As more people would receive a CBS thancurrently received CDAs or FIS, more in the population would,therefore, have a benefit withdrawal rate added to theirmarginal tax rate over a range of income. Secondly, a CBSwould pose significant administrative challenges because ofwhich it ‘would take up to two years to implement’ (p. 45).
77
Child poverty and child income supports
___________
13 This, also, was an aspiration in an agreed programme for government(Ireland, 1995).
14 The report considered the case of a CBS that was the same amount asa CDA at the time and withdrawn at a rate of 30 per cent once weeklyfamily income passed £200 (which corresponded then to the averageweekly earnings of women). This meant, for example, that a family withthree children lost all eligibility for the payment when their incomereached 120 per cent of gross average industrial earnings at the time.
Chapter 03 17/09/2007 16:50 Page 77
In the final analysis, the 1996 report did not recommendfundamental reform but instead proposed a range of partialmeasures that could be implemented immediately to smooththe transition from welfare to work (for example retention ofsecondary benefits for a period, retention of CDAs for thirteenweeks for the long-term unemployed, retention of part of themain welfare payment on a declining basis, higher earningsdisregards). It made several pertinent observations on thebalance to be struck between piecemeal and fundamentalreform, however, that remain useful and relevant to thecontemporary challenge of improving Ireland’s child incomesupports:
• Benefit withdrawal rates cannot be avoided ‘in any socialwelfare system [where] earning money implies losingentitlement to benefit’ (p. 7). Either high benefit withdrawalrates are imposed on a relatively small part of thepopulation, or lower tax/withdrawal rates are faced by amuch larger section of the population.
• Making supports universal (like CB) avoids imposingbenefit withdrawal rates on small or large subgroups in thepopulation but only by imposing higher tax rates on thewhole of it. A society which provides an extensive rangeof supports and services, without either income testing oruser charges, must levy taxes at a higher level to ensuresuch ‘free’ access.
• Effective social protection, which respects people’scapacity and need for self-reliance, requires that itsdifferent strands develop in an integrated fashion and notin parallel. The Expert Group essentially wrestled with theunforeseen by-product of what, in isolation, werenecessary social developments – the protection of the real
78
Welfare Policy and Poverty
Chapter 03 17/09/2007 16:50 Page 78
incomes of people out of work and tax reductions forworkers on low earnings: ‘Several policy objectives beingpursued in parallel on their own merits [contributed] tounemployment and poverty traps’ (p. 21).
• There is a path dependence in how instruments of socialprotection develop: ‘[Our] options are discrete options,not steps towards a single solution; in other words, it isnot a question of beginning with the least expensiveoption and hoping to move from there towards the moreexpensive options’ (p. 137). Once an instrument isadopted, it creates constituencies that press for itsextension and improvement, which makes a return tobasic alternatives to it more difficult.
The current instruments of child income support
Child dependant additions (CDAs) 15
As explained, CDAs are additions to the weekly socialwelfare payments of adults made on behalf of children livingwith them. Until 1994, their lowest value (per child) wasequivalent to 22 per cent of the lowest adult social welfarepayment. This had fallen to 10 per cent by 2006, aconsequence of the 1994 decision to freeze their value.Budget 2007 ended this freeze and raised them to €22 aweek, the equivalent of 12 per cent of the lowest adultwelfare payment (see Table 3.2).
79
Child poverty and child income supports
___________
15 ‘Qualified child increases’ is now their official term but, in deference topast practice embodied in the reports reviewed, here the term ‘CDAs’is used. The word ‘allowance’ is often used instead of ‘addition’, evenin the text of Sustaining Progress and NESC reports, but even moreincorrectly. ‘Addition’ and ‘increase’ communicate more accurately thatthey are supplements to payments made to adult recipients on behalfof their child dependants.
Chapter 03 17/09/2007 16:50 Page 79
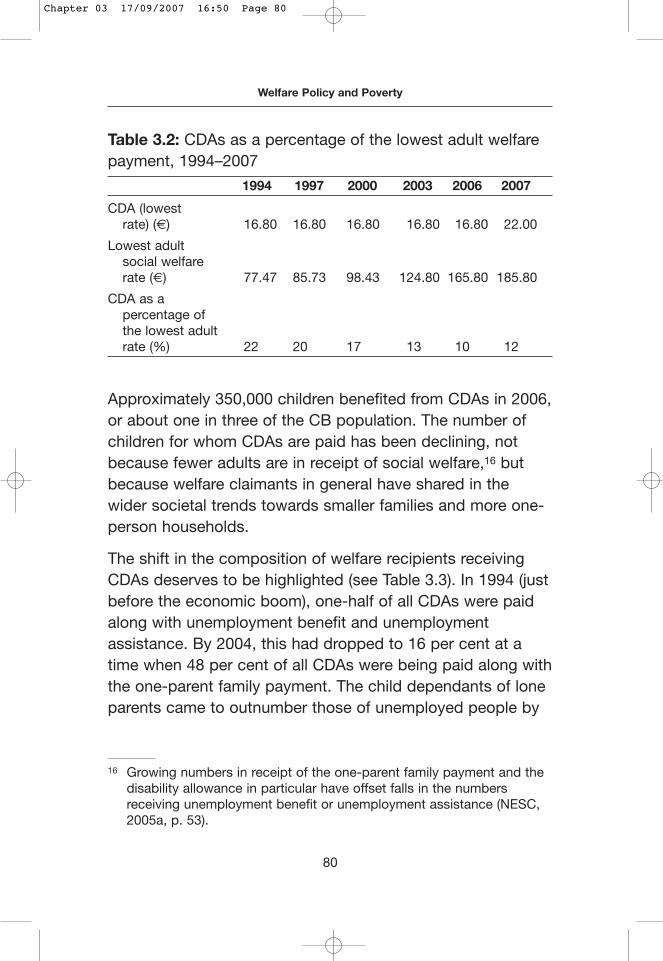
Table 3.2: CDAs as a percentage of the lowest adult welfarepayment, 1994–2007
1994 1997 2000 2003 2006 2007
CDA (lowest rate) (€) 16.80 16.80 16.80 16.80 16.80 22.00
Lowest adult social welfare rate (€) 77.47 85.73 98.43 124.80 165.80 185.80
CDA as a percentage of the lowest adult rate (%) 22 20 17 13 10 12
Approximately 350,000 children benefited from CDAs in 2006,or about one in three of the CB population. The number ofchildren for whom CDAs are paid has been declining, notbecause fewer adults are in receipt of social welfare,16 butbecause welfare claimants in general have shared in thewider societal trends towards smaller families and more one-person households.
The shift in the composition of welfare recipients receivingCDAs deserves to be highlighted (see Table 3.3). In 1994 (justbefore the economic boom), one-half of all CDAs were paidalong with unemployment benefit and unemploymentassistance. By 2004, this had dropped to 16 per cent at atime when 48 per cent of all CDAs were being paid along withthe one-parent family payment. The child dependants of loneparents came to outnumber those of unemployed people by
80
Welfare Policy and Poverty
___________
16 Growing numbers in receipt of the one-parent family payment and thedisability allowance in particular have offset falls in the numbersreceiving unemployment benefit or unemployment assistance (NESC,2005a, p. 53).
Chapter 03 17/09/2007 16:50 Page 80
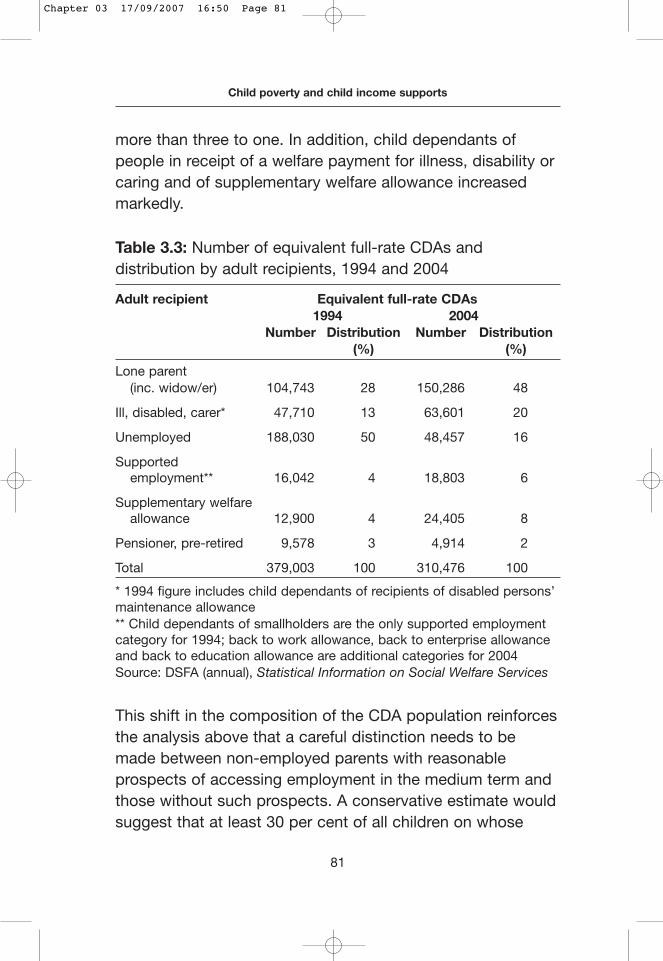
more than three to one. In addition, child dependants ofpeople in receipt of a welfare payment for illness, disability orcaring and of supplementary welfare allowance increasedmarkedly.
Table 3.3: Number of equivalent full-rate CDAs anddistribution by adult recipients, 1994 and 2004
Adult recipient Equivalent full-rate CDAs1994 2004
Number Distribution Number Distribution(%) (%)
Lone parent (inc. widow/er) 104,743 28 150,286 48
Ill, disabled, carer* 47,710 13 63,601 20
Unemployed 188,030 50 48,457 16
Supported employment** 16,042 4 18,803 6
Supplementary welfare allowance 12,900 4 24,405 8
Pensioner, pre-retired 9,578 3 4,914 2
Total 379,003 100 310,476 100
* 1994 figure includes child dependants of recipients of disabled persons’maintenance allowance** Child dependants of smallholders are the only supported employmentcategory for 1994; back to work allowance, back to enterprise allowanceand back to education allowance are additional categories for 2004Source: DSFA (annual), Statistical Information on Social Welfare Services
This shift in the composition of the CDA population reinforcesthe analysis above that a careful distinction needs to bemade between non-employed parents with reasonableprospects of accessing employment in the medium term andthose without such prospects. A conservative estimate wouldsuggest that at least 30 per cent of all children on whose
81
Child poverty and child income supports
Chapter 03 17/09/2007 16:50 Page 81
behalf CDAs were being paid in 2004 had parents who couldnot be expected to take up employment.17
The back to school clothing and footwear allowance (BSCFA)is an additional cash-transfer for children paid once a year onbehalf of a large subset of the CDA population (160,000children benefited from it in 2006, equivalent to 46 per cent ofthe CDA population). It is intended to support families on lowincomes with the cost of their children’s clothing and footwearat the start of the school year. In effect, it functions as an end-of-summer lump sum supplement to a large subset of familiesreceiving CDAs. This subset must have incomes belowspecified thresholds (hence, PRSI-based CDAs are likely to beexcluded) and children aged 2 to 17 years (‘school going’,though 18 to 22 year olds in full-time education also qualify). Inexpenditure terms, the BSCFA is a minnow – its €25 millioncost constituted just 1 per cent of total spending on childincome support in 2006 – but the increase in its value (by 80per cent for 2 to 11 year olds and 136 per cent for 12 to 17year olds over the period from 1994 to 2004) while CDA rateswere frozen means it is now a significant supplement to CDAsfor a large subgroup of the CDA population.
The strengths and weaknesses of CDAs can be summarisedas follows.
Strengths• It can be assumed that practically all the poorest children
in the state have CDAs paid on their behalf. A large part ofthe expenditure on CDAs, therefore, is effectively targeted.
82
Welfare Policy and Poverty
___________
17 These are children whose parents are claiming for three or morechildren, or receiving a pension, pre-retirement allowance, carer’sallowance or blind pension.
Chapter 03 17/09/2007 16:50 Page 82
• Most children on whose behalf CDAs are paid areresident in the state. This means there is little or no‘leakage’ produced by migration in so far as thecontribution of CDAs to reducing poverty within the stateis concerned.18
• The BSCFA is received only by families on low incomesand functions, in effect, as a lump sum, providing anannual boost to the CDA families with the lowestincomes.
Weaknesses• Not all families who receive CDAs have low incomes.
Those paid along with insurance-based benefits (35 percent of all CDAs in 2003, see DSFA, 2004) are not means-tested.19 This means there is some deadweight in usingeven CDAs as an anti-poverty instrument. (The decline inthe proportion of the CDA population who receive theincome-tested BSCFA suggests this element ofdeadweight may be increasing.)
• Expenditure data on CDAs are not routinely provided(though data on the numbers of children are).20 Thiscontributes to their relatively low profile as a child incomesupport.
83
Child poverty and child income supports
___________
18 CDAs payable with payments covered by EU law on social security(Regulation 1408) are exportable.
19 No CDAs are paid if spouses/partners have incomes above a limit incertain instances (principally unemployment benefit and disabilitybenefit where a spouse’s or partner’s income was above €350 in 2005cancelled the right to CDAs).
20 The key source of data on welfare receipt is the annual publication ofthe Department of Social and Family Affairs, Statistical Information onSocial Welfare Services.
Chapter 03 17/09/2007 16:50 Page 83
• If parents receiving CDAs leave social welfare foremployment, the CDAs are withdrawn and there is noautomatic transition to FIS or to any other form of in-workchild income support. The evidence is that only a smallnumber make the transition to FIS (see below).
Family income supplement (FIS)FIS is a subsidy to the weekly net wage of employees withchildren where family net income falls below a specifiedthreshold.21 Employees must be working at least nineteenhours per week, though this can be in conjunction with hoursworked by their spouse or partner. ‘Family income’ is the jointincome of the spouses/partners, net of tax and PRSI. Theamount of the subsidy paid is 60 per cent of the gap betweenthe actual family income and a threshold related to familysize. The withdrawal rate, therefore, is also 60 per cent.Employees themselves must take the initiative to apply forFIS and have to enlist the cooperation of their employer indoing so.
Total expenditure on FIS has been rising rapidly, fuelledprincipally by a higher spend per child (up from a weekly€15.86 on average in 1994 to €41.50 in 2006) and to a lesserextent by a rise in the number of eligible children (up by morethan one-third since 1994). Lone parents have come toaccount for more than one-half of its recipients – up from 15per cent in 1994 – while the proportion claiming for three or
84
Welfare Policy and Poverty
___________
21 Until 2006, the basis on which the threshold was set could bediscerned: it approximated to 1.66 times what a couple with the samenumber of children would receive on unemployment assistance (UA).As of 2006, the basis of its calculation is less clear; expressed as amark-up on the same family’s entitlement under UA, the mark-up nowrises with family size (see Appendix Table A3.1).
Chapter 03 17/09/2007 16:50 Page 84
more children has fallen steadily. It is not clear how much thesteep rise in recipients since 2004 is due to significantnumbers of migrants becoming eligible.
FIS’s double objective – to encourage employment andsupport children – means its support is weighted significantlytowards the one-child family, even after a recalibration of itsincome thresholds in 2006 reduced the bias considerably. In2006, the maximum weekly payment per child that a familywith three children could potentially receive was €48,whereas a one-child family could receive €103.22 In earlieryears, the payment to the one-child family had been almostthree times the per child payment to the three-child family(see Appendix Table A3.1).
FIS enjoys a high profile as the state’s main in-work incomesupport for families with children. This high profile, however,is difficult to justify by either the number of children benefitingor its effectiveness in ensuring that employment is a route outof poverty for parents who take up employment. Given thecontinued growth in relatively low-paying employments thathas been an integral part of Ireland’s expanding labourmarket since 2000, the number of children being helped byFIS still appears low and constitutes evidence that low take-up on the part of eligible families and types of employmentthat make families ineligible (self-employment, employmentfor under nineteen hours per week) continue to be seriouslimitations.
The strengths and weaknesses of FIS can be summarised asfollows.
85
Child poverty and child income supports
___________
22 These are the maximum possible payments. Actual payments willreflect the application of the income test to the circumstances ofindividual applicants.
Chapter 03 17/09/2007 16:50 Page 85
Strengths• FIS is generous. The average weekly payout per qualifying
child is significantly higher than that provided by CB orCDA.
• FIS attempts only a limited responsiveness in its level ofpayment to changes in a family’s circumstances. This bothincreases income security for recipients and reducesadministration costs. Once granted, FIS is paid for fifty-two weeks and remains the same even if weekly earningsincrease (or decrease). If another child is born, the FISpayment is increased as soon as the Department of Socialand Family Affairs is notified.
• FIS is particularly generous towards lone parents. Itsthresholds in their case are a multiple of what a couple,not a single person, would receive on unemploymentassistance.
Weaknesses• FIS has a stubbornly low take-up rate.
• Low-paid employees must take the initiative to apply forFIS and enlist the support of their employer – and of theirspouse’s employer where s/he is also employed – to doso.23
• While FIS is intuitive on one level (the earnings of low-paidworkers need to be supplemented if their in-work income
86
Welfare Policy and Poverty
___________
23 The application form has fifty-five questions. Applicants must have abank or building society account; they must provide two recentpayslips, their P60 and their tax credit certificate; they are asked if theyare cohabiting and, if ever married, the date of the marriage; they arerequired to give full details of all their income sources and of all incomesources of their spouse or partner.
Chapter 03 17/09/2007 16:50 Page 86
is to be greater than their out-of-work support), theamount people stand to receive is difficult to explain.
• FIS does not cover all parents in employment on lowearnings. Self-employed workers and employees whowork less than nineteen hours are not entitled to it.
• It is significantly more generous to small families than tolarge ones.
• FIS has a high withdrawal rate (60 per cent). Thisimproves its targeting and reduces the number of peoplehigher up the earnings ladder who receive a partialpayment, but it generates a significant poverty trap.
• FIS can be paid in respect of children not resident in thestate. The large numbers of EU migrants entering lowerpaid jobs since 2004 make it likely that a growing numberof the children being supported by FIS are outside thestate.
Child benefit (CB)CB is a monthly cash transfer to households with childrenfrom which practically every child in the state benefits.24 Thirdand further children receive a higher payment (23 per centhigher in 2006) than first and second children, and multiplebirths also attract higher support. Any person habitually
87
Child poverty and child income supports
___________
24 The introduction of the Habitual Residence Condition in 2004 meansrecently arrived families (including of returned Irish emigrants) have toshow that they are habitually resident in the state. There is apresumption that they are not habitually resident until two years haveelapsed but a person may be able to show that they are habituallyresident in a much shorter period. In addition, children of asylumseekers whose claims are being processed and of illegal immigrantsmay not be receiving CB.
Chapter 03 17/09/2007 16:50 Page 87
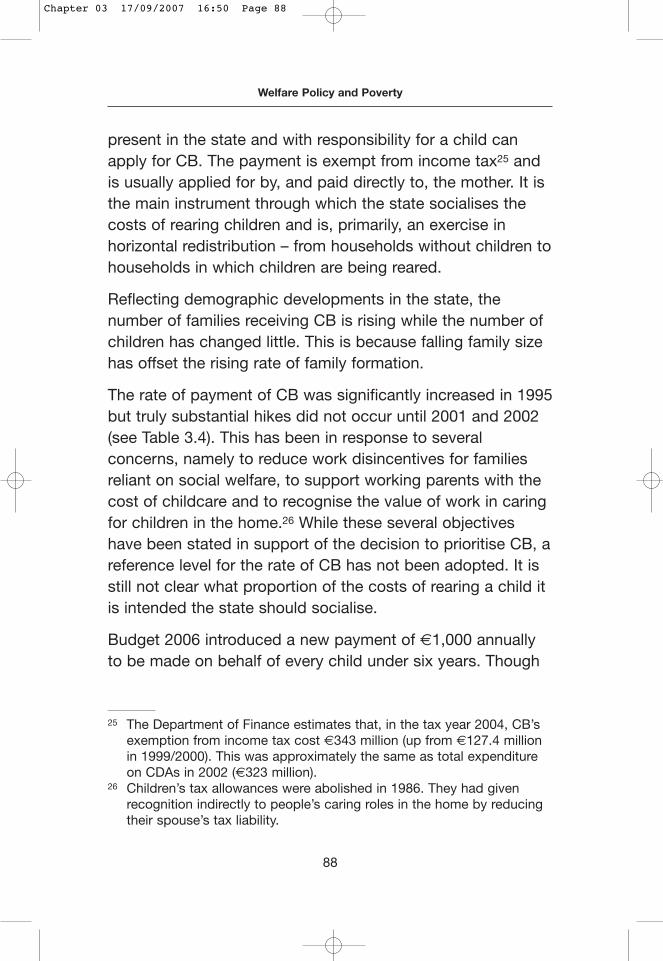
present in the state and with responsibility for a child canapply for CB. The payment is exempt from income tax25 andis usually applied for by, and paid directly to, the mother. It isthe main instrument through which the state socialises thecosts of rearing children and is, primarily, an exercise inhorizontal redistribution – from households without children tohouseholds in which children are being reared.
Reflecting demographic developments in the state, thenumber of families receiving CB is rising while the number ofchildren has changed little. This is because falling family sizehas offset the rising rate of family formation.
The rate of payment of CB was significantly increased in 1995but truly substantial hikes did not occur until 2001 and 2002(see Table 3.4). This has been in response to severalconcerns, namely to reduce work disincentives for familiesreliant on social welfare, to support working parents with thecost of childcare and to recognise the value of work in caringfor children in the home.26 While these several objectiveshave been stated in support of the decision to prioritise CB, areference level for the rate of CB has not been adopted. It isstill not clear what proportion of the costs of rearing a child itis intended the state should socialise.
Budget 2006 introduced a new payment of €1,000 annuallyto be made on behalf of every child under six years. Though
88
Welfare Policy and Poverty
___________
25 The Department of Finance estimates that, in the tax year 2004, CB’sexemption from income tax cost €343 million (up from €127.4 millionin 1999/2000). This was approximately the same as total expenditureon CDAs in 2002 (€323 million).
26 Children’s tax allowances were abolished in 1986. They had givenrecognition indirectly to people’s caring roles in the home by reducingtheir spouse’s tax liability.
Chapter 03 17/09/2007 16:50 Page 88
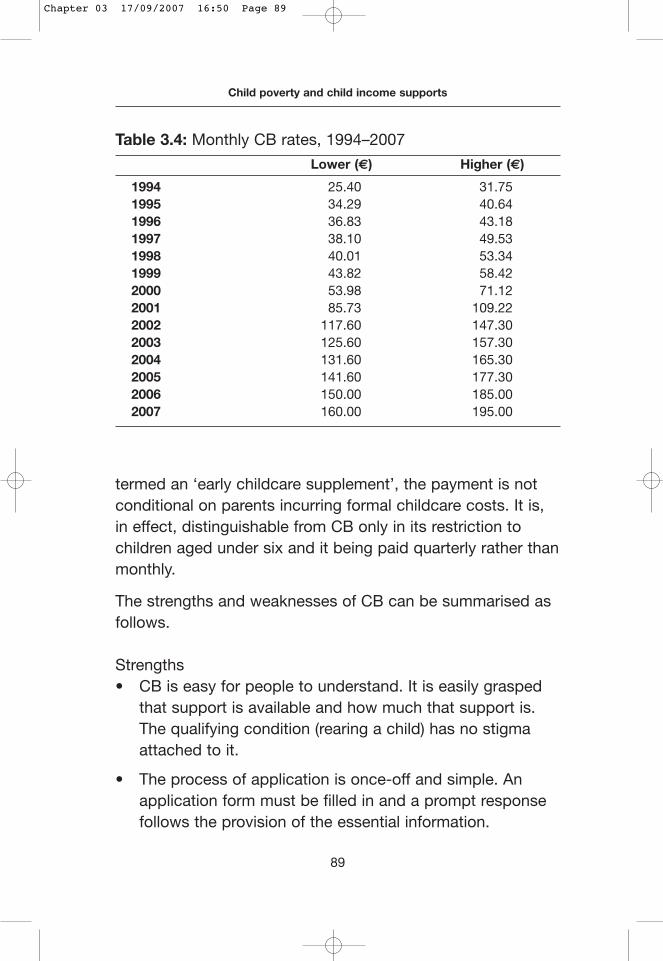
termed an ‘early childcare supplement’, the payment is notconditional on parents incurring formal childcare costs. It is,in effect, distinguishable from CB only in its restriction tochildren aged under six and it being paid quarterly rather thanmonthly.
The strengths and weaknesses of CB can be summarised asfollows.
Strengths• CB is easy for people to understand. It is easily grasped
that support is available and how much that support is.The qualifying condition (rearing a child) has no stigmaattached to it.
• The process of application is once-off and simple. Anapplication form must be filled in and a prompt responsefollows the provision of the essential information.
89
Child poverty and child income supports
Table 3.4: Monthly CB rates, 1994–2007
Lower (€) Higher (€)
1994 25.40 31.75 1995 34.29 40.64 1996 36.83 43.18 1997 38.10 49.53 1998 40.01 53.34 1999 43.82 58.42 2000 53.98 71.122001 85.73 109.222002 117.60 147.302003 125.60 157.302004 131.60 165.302005 141.60 177.302006 150.00 185.002007 160.00 195.00
Chapter 03 17/09/2007 16:50 Page 89
Arrangements are underway whereby the registration of achild’s birth will automatically result in an application formfor CB being sent without waiting for a parent first torequest it.
• CB is the same for people in employment and people onsocial welfare, for people parenting alone and for couples.People may exit or enter employment, exit or enter welfarereceipt and exit or enter ‘couple relationships’ withouttheir entitlement to CB being affected.
Weaknesses
• Because CB is paid on behalf of almost all children in thestate and regardless of parental income, it is an expensive programme. At the same time, it is unable toclaim a significant impact on any one of its tripleobjectives. Even after the substantial increases since2001, it is far from sufficient to prevent poverty on its own, to cover the costs of formal childcare on its own orto be considered to constitute – on its own – a wage forcaring.
• As a poverty-alleviation measure, CB is not efficient. Thisis because it is paid wherever children are present andirrespective of children’s actual needs. It was estimated in2006 that 18.4 per cent of total expenditure on CB wasreceived by the poorest 20 per cent of families in thestate, while 42.4 per cent was received by families in thetop half of the income distribution.
• The alignment of CB with all children in the state has beenblurred by two recent developments. The large numbers ofEU nationals working in the Irish economy mean it is nowpaid on behalf of a non-negligible number of children not
90
Welfare Policy and Poverty
Chapter 03 17/09/2007 16:50 Page 90
resident in Ireland.27 The introduction of the HabitualResidence Condition has made its payment on behalf ofthe children of ‘third country’ nationals living in Ireland nolonger automatic.
A direction for reform
Reflecting on why and how the current child income supportshave developed, and seeing the strengths and weaknesses ofeach instrument, begs the question of whether, and if so how,the system can be improved. There are rumblings in theundergrowth. The NESC, for example, ‘believes that thecontinuing high levels of child income poverty constitute avery poor return to the State and society from the majorincrease in spending on child income supports which hastaken place’ (2005a, p. 155). It goes further: ‘the continuationof existing policies is not desirable in the medium-term’. TheNESC proposes two clear objectives for child income supportpolicy over the coming years: (i) give priority to children inlow-income households in allocating additional resources,and (ii) treat low-income families equitably. The secondobjective is more difficult. The search is on, in effect, for aninstrument that would channel support only to children inlow-income households, reach all such children and betriggered solely by low family income. There are interestingexamples of such instruments in other countries (particularlyin Australia, Canada and the UK) from which significantlessons can be learned.
91
Child poverty and child income supports
___________
27 The value of Ireland’s CB is significant from the perspective of severalof the new EU member states; for example, its value for two children in2006 (€150 * 2) was greater than monthly earnings on the minimumwage – adjusted for purchasing power – in Latvia (€240) and Lithuania(€292) (Eurostat, 2006).
Chapter 03 17/09/2007 16:50 Page 91
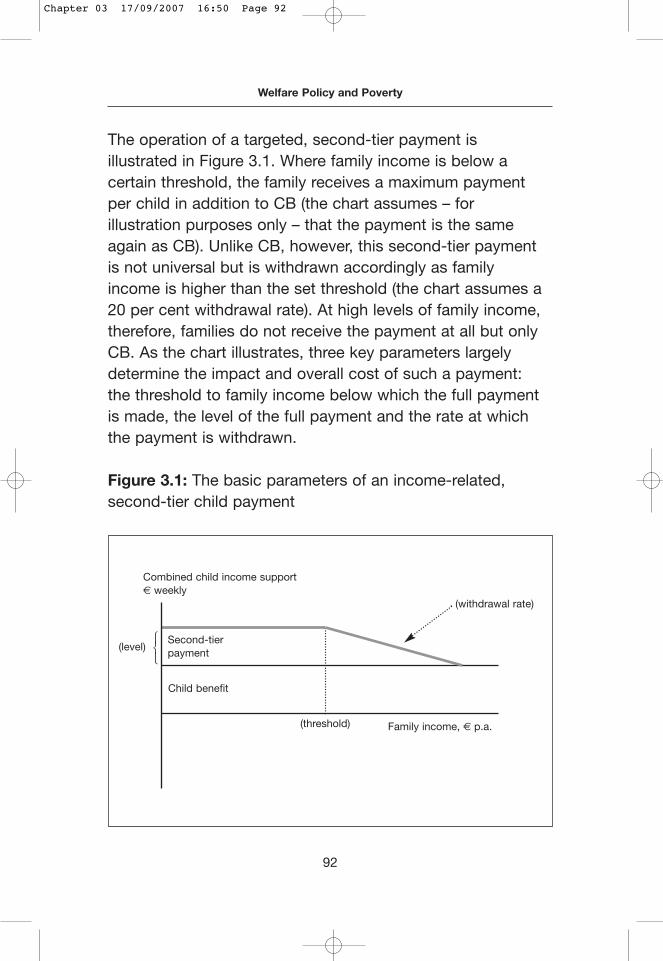
The operation of a targeted, second-tier payment isillustrated in Figure 3.1. Where family income is below acertain threshold, the family receives a maximum paymentper child in addition to CB (the chart assumes – forillustration purposes only – that the payment is the sameagain as CB). Unlike CB, however, this second-tier paymentis not universal but is withdrawn accordingly as familyincome is higher than the set threshold (the chart assumes a20 per cent withdrawal rate). At high levels of family income,therefore, families do not receive the payment at all but onlyCB. As the chart illustrates, three key parameters largelydetermine the impact and overall cost of such a payment:the threshold to family income below which the full paymentis made, the level of the full payment and the rate at whichthe payment is withdrawn.
Figure 3.1: The basic parameters of an income-related,second-tier child payment
92
Welfare Policy and Poverty
Second-tierpayment
Combined child income support€ weekly
(withdrawal rate)
(threshold)
(level)
Child benefit
Family income, € p.a.
⎫⎬⎭
Chapter 03 17/09/2007 16:50 Page 92
It is easy to describe such a second-tier payment but theadministrative difficulties are formidable. For example, itrequires, vitally, that, somewhere in the public administrativesystem, information on the level of income in all householdswith children is routinely, comprehensively and reliablycaptured.
Conclusions
This chapter opened by pointing to the continuing seriousproblem of children being reared in households with lowmoney incomes. There have been major improvements in thisarea since 1987. There has been a significant rise in the realincomes of families reliant on social welfare and the poorestchildren in the state today have a significantly higher standardof living than their counterparts twenty years ago. However, inlight of Ireland’s hugely improved economic and employmentsituation, and the major investment that has taken place inchild income supports which are now at a good level byinternational standards, the numbers of children below thedifferent income poverty lines in Ireland remaindisappointingly high.
In part, this is a challenge to the current structure of childincome support in Ireland and an invitation to redesign it, ifnecessary by creating a new instrument. In particular, a policyshift that privileged CB as the best instrument for channellingincome support to low-income families has run its course anda fresh willingness and capacity to prioritise low-incomefamilies is now needed and beginning to emerge. FIS hasbeen made more generous and its pro-child rather than pro-employment credentials strengthened, and the first increasein CDAs since 1994 took place in 2007. However, a step-
93
Child poverty and child income supports
Chapter 03 17/09/2007 16:50 Page 93
change in the willingness to prioritise children in low-incomefamilies, this author argues, would mean acknowledging thatflaws remain basic to CDAs and FIS and that it is imperativeto tackle the administrative challenges of finally introducing asecond-tier child income support that treats all low-incomefamilies equally. This would be neutral as to the compositionof families’ incomes (social welfare, self-employment oremployee earnings), paid in full when family income is low,withdrawn gradually as family income rises and not paid at allto families with high incomes.
However, while there is unfinished business with regard to thestructure of child income support in Ireland, child incomesupport will less and less be where the action is over thecoming years if, or hopefully as, further inroads are made intoreducing child poverty. On the one hand, child incomesupport is now at a good level by international standards; onthe other hand, child poverty is increasingly associated withjobless parents. Our mindset should now shift, from trying toensure that the costs of rearing children do not pullhouseholds into poverty, to ensuring that jobless adults donot pull children into poverty. The two approaches arecomplementary of course, but their emphases are different.The first focuses on ensuring children do not heighten thepoverty risk facing a household, the second on the povertyrisk facing working-aged adults.
The level of adult welfare payments has always beenimportant to children’s financial circumstances. Currently, insmall families (less than three children), the adult welfarepayment typically accounts for a much larger component offamily income than child income transfers do. This meansadult welfare rates have considerable leverage in thosesituations to raise children out of income poverty. It is more
94
Welfare Policy and Poverty
Chapter 03 17/09/2007 16:50 Page 94
difficult, however, to make the case for major increases inwelfare payments to people of working age in a fullemployment economy than it is to raise income support ‘onbehalf of’ children. Child poverty campaigners then enter thecomplex debate of how to raise welfare payments to working-aged adults substantially without creating dependency.Ideally, the higher payment should instead generate adynamic that motivates and requires the adult recipient tobecome more self-reliant (NESC, 2005b). Significant furtherinroads into child poverty, therefore, are likely to hingeparticularly on success in removing the obstacles that facelow-skilled women in accessing education, training oremployment, and on the unfolding of the Department ofSocial and Family Affairs’ new social and economicprogramme for delivering more intensive engagement on anindividual basis with all people of working age in receipt ofsocial welfare.
While the structure of child income supports and the levels ofand arrangements governing adult welfare payments areareas where changes will contribute to further reducing childpoverty, it is necessary to keep household income inperspective. Some parents’ mental or physical health,addictions and/or lifestyles make their children extremelyunlikely to benefit from additional income transfers to thehousehold. In these circumstances, the household’s need forincome has to be seized as a ‘developmental opportunity’ forchallenging and empowering the parents to move forward intheir lives, as a result of which their children stand to benefitin an irreplaceable way. On a broader level still, there is theneed to learn from, and act on, the research into childwellbeing (including what makes children resilient despitesocio-economic disadvantages). This underlines the crucial
95
Child poverty and child income supports
Chapter 03 17/09/2007 16:50 Page 95
influences on child development and child wellbeing of non-monetary factors, namely the quality of the bonds they havewith their parents, the quality of their neighbourhoods etc. Itwould be a tragedy if, while Ireland successfully climbed theinternational rankings for how well the material wellbeing ofchildren is cared for, Irish children’s overall wellbeing fell, asmore of them became victims of stressful home situationsand less child-friendly environments.
References
Bradbury, B. and Jäntti, M. (2001), ‘Child Poverty Across the IndustrialisedWorld: Evidence from the Luxembourg Income Study’, in K. Vleminckxand T. Smeeding (eds.), Child Well-Being, Child Poverty and ChildPolicy in Modern Nations, Bristol: The Policy Press
Bradshaw, J. and Finch, N. (2002), A Comparison of Child BenefitPackages in 22 Countries – A Summary of the Child Benefit Packagefor Each Country, York: University of York
Brewer, M. (2003), What Do the Child Poverty Targets Mean for the ChildTax Credit? An Update, Briefing Note no. 41, London: Institute forFiscal Studies
Commission on Social Welfare (1986), Report, Dublin: GovernmentPublications
Corak, M., Lietz, C. and Sutherland, H. (2005), The Impact of Tax andTransfer Systems on Children in the European Union, New York:UNICEF
Cournède, B. (2006), ‘Removing Obstacles to Employment for Women inIreland’, Economics Department Working Papers, no. 511, Paris: OECD
CSO (2006), EU Survey on Income and Living Conditions (EU-SILC) 2005,Dublin: Central Statistics Office
DSFA (annual), Statistical Information on Social Welfare Services, Dublin:Department of Social and Family Affairs
DSFA (2004), Review of the Back to School Clothing and FootwearAllowance Scheme, Dublin: Department of Social and Family Affairs
DSFA (2006), Government Discussion Paper: Proposals for SupportingLone Parents, Dublin: Department of Social and Family Affairs
96
Welfare Policy and Poverty
Chapter 03 17/09/2007 16:50 Page 96
Eurostat (2006), Statistics in Focus. Population and Social Conditions, no.9, Luxembourg: Eurostat
Expert Working Group (1996), Integration of the Tax and Social WelfareSystems, Dublin: Stationery Office
Förster, M. and d’Ercole, M. M. (2005), ‘Income Distribution and Poverty inOECD Countries in the Second Half of the 1990s’, OECD Social,Employment and Migration Working Papers, no. 22, Paris: OECD
Ireland (1985), Building on Reality, Dublin: Stationery Office
Ireland (1995), A Programme for Renewal, Dublin: Stationery Office
Ireland (2002), Building an Inclusive Society, Dublin: Stationery Office
Ireland (2006), Towards 2016: Ten-Year Framework Social PartnershipAgreement 2007–2016, Dublin: Stationery Office
McKeown, K. and Haase, T. (2006), The Mental Health of Children and theFactors Which Influence It: A Study of Families in Ballymun, Dublin:Ballymun Development Group for Children and Young People:www.youngballymun.org
NESC (2003), An Investment in Quality: Services, Inclusion and Enterprise,report no. 111, Dublin: National Economic and Social Council
NESC (2005a), NESC Strategy 2006: People, Productivity and Purpose,report no. 114, Dublin: National Economic and Social Council
NESC (2005b), The Developmental Welfare State, report no. 113, Dublin:National Economic and Social Council
UNICEF (2005), ‘Child Poverty in Rich Countries’, Report Card 5,Florence: Innocenti Research Centre
UNICEF (2007), ‘Child Poverty in Perspective: An Overview of Child Well-Being in Rich Countries’, Report Card 7, Florence: Innocenti ResearchCentre
97
Child poverty and child income supports
Chapter 03 17/09/2007 16:50 Page 97
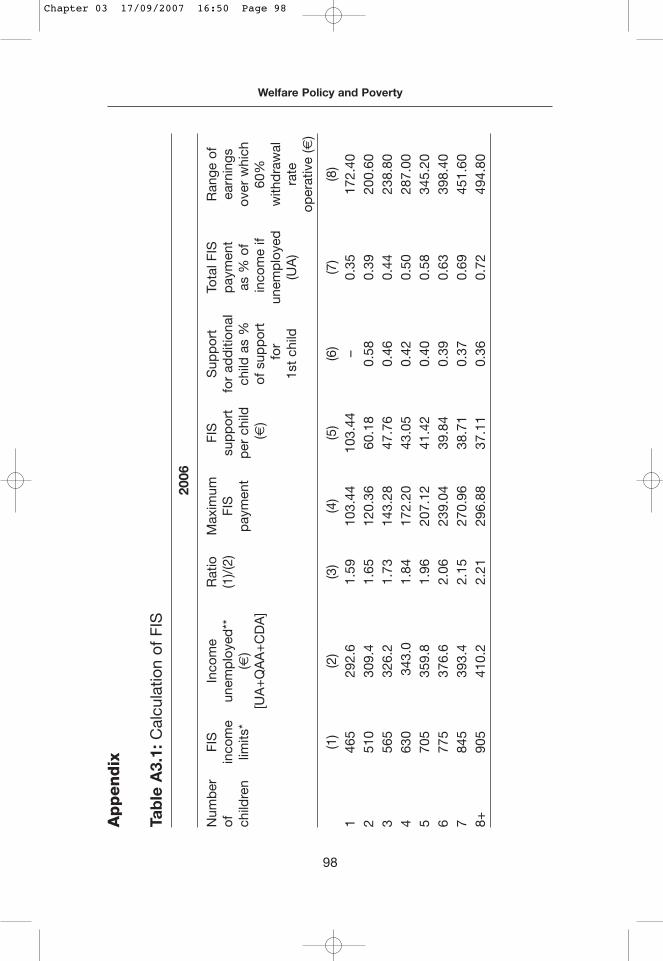
98
Welfare Policy and Poverty
Appendix
Tab
le A
3.1:
Cal
cula
tion
of F
IS
2006
Num
ber
FI
S
Inco
me
Rat
ioM
axim
umFI
SS
upp
ort
Tota
l FIS
R
ange
of
ofin
com
e un
emp
loye
d**
(1)/
(2)
FIS
sup
por
tfo
r ad
diti
onal
pay
men
t ea
rnin
gsch
ildre
nlim
its*
(€)
pay
men
tp
er c
hild
child
as
%
as %
of
over
whi
ch[U
A+
QA
A+
CD
A]
(€)
of s
upp
ort
inco
me
if60
%fo
run
emp
loye
d
with
dra
wal
1st
child
(UA
) ra
te
oper
ativ
e (€
)
(1)
(2)
(3)
(4)
(5)
(6)
(7)
(8)
1 46
5 29
2.6
1.59
10
3.44
10
3.44
–
0.35
17
2.40
2
510
309.
4 1.
65
120.
36
60.1
8 0.
58
0.39
20
0.60
3
565
326.
2 1.
73
143.
28
47.7
6 0.
46
0.44
23
8.80
4
630
343.
0 1.
84
172.
20
43.0
5 0.
42
0.50
28
7.00
570
535
9.8
1.96
207.
1241
.42
0.40
0.58
345.
206
775
376.
62.
0623
9.04
39.8
40.
390.
6339
8.40
784
539
3.4
2.15
270.
9638
.71
0.37
0.69
451.
608+
905
410.
22.
2129
6.88
37.1
10.
360.
7249
4.80
Chapter 03 17/09/2007 16:50 Page 98
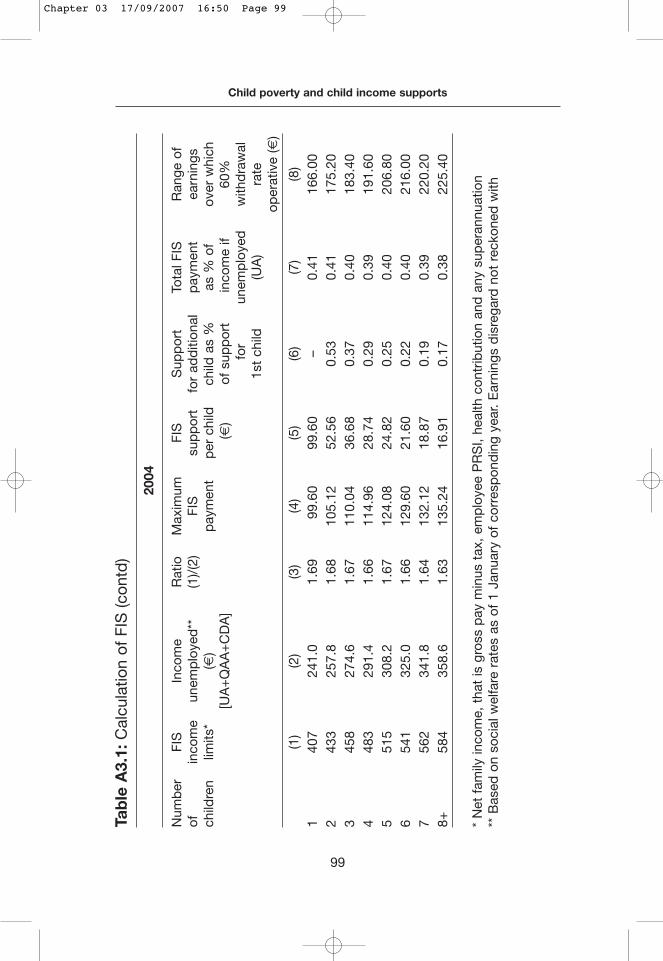
99
Child poverty and child income supports
Tab
le A
3.1:
Cal
cula
tion
of F
IS (c
ontd
)
2004
Num
ber
FI
S
Inco
me
Rat
ioM
axim
umFI
SS
upp
ort
Tota
l FIS
R
ange
of
ofin
com
e un
emp
loye
d**
(1)/
(2)
FIS
sup
por
tfo
r ad
diti
onal
pay
men
t ea
rnin
gsch
ildre
nlim
its*
(€)
pay
men
tp
er c
hild
child
as
%
as %
of
over
whi
ch[U
A+
QA
A+
CD
A]
(€)
of s
upp
ort
inco
me
if60
%fo
run
emp
loye
d
with
dra
wal
1st
child
(UA
) ra
te
oper
ativ
e (€
)
(1)
(2)
(3)
(4)
(5)
(6)
(7)
(8)
140
724
1.0
1.69
99.6
099
.60
–0.
4116
6.00
243
325
7.8
1.68
105.
1252
.56
0.53
0.41
175.
203
458
274.
61.
6711
0.04
36.6
80.
370.
4018
3.40
448
329
1.4
1.66
114.
9628
.74
0.29
0.39
191.
605
515
308.
21.
6712
4.08
24.8
20.
250.
4020
6.80
654
132
5.0
1.66
129.
6021
.60
0.22
0.40
216.
007
562
341.
81.
6413
2.12
18.8
70.
190.
3922
0.20
8+58
435
8.6
1.63
135.
2416
.91
0.17
0.38
225.
40
* N
et f
amily
inco
me,
tha
t is
gro
ss p
ay m
inus
tax
, em
plo
yee
PR
SI,
heal
th c
ontr
ibut
ion
and
any
sup
eran
nuat
ion
** B
ased
on
soci
al w
elfa
re r
ates
as
of 1
Jan
uary
of
corr
esp
ond
ing
year
. E
arni
ngs
dis
rega
rd n
ot r
ecko
ned
with
Chapter 03 17/09/2007 16:50 Page 99

Chapter 03 17/09/2007 16:50 Page 100
Chapter 4
Working-aged people and welfare policy
Mary Murphy
… an Ireland where all people of working age havesufficient income and opportunity to participate as fully as possible in economic and social life …
(Ireland, 2007, p. 40)
Introduction
The maxim ‘a job is the best route out of poverty’ and thelanguage of ‘working-aged’ are now firmly rooted in anti-poverty and social inclusion discourse. Elsewhere, however,this concept of ‘working-aged’ has been ideologicallycontested. To suggest that someone of working age can workmay also be interpreted as suggesting they should work. AsLevitas observes, the language of working age constructssocial exclusion as ‘non-participation in the labour market’(2001, p. 451). She concludes there are anti-povertyimplications when a priority focus on labour marketattachment exists without parallel strategies to enhancewelfare generosity for those who remain without employmentor to examine wider ethnic and gender structural inequalitiesin that labour market and implications for care and other
101
Chapter 04 17/09/2007 16:51 Page 101
unpaid work. A policy that aspires to all working-aged socialwelfare claimants having an attachment to the labour markethas, therefore, very important anti-poverty, rights and genderimplications. These will be discussed throughout this chapter.
The chapter is divided into two parts. The first examines howthe concept and definition of ‘working-aged’ has evolved andthen explores recent key changes, continuities andchallenges for particular subgroups of the 18 to 65 (orworking) age group: the traditional ‘unemployed’, people withdisabilities and different groups of women including loneparents, qualified adults (wives and partners of social welfareclaimants) and carers. This part concludes by defining theworking-aged population and examining the changingcomposition of the working-aged at risk of poverty. Thesecond part of the chapter examines the policy responses tojoblessness. The focus is on five distinct but overlappingpolicy areas: welfare adequacy, making work pay, improvingthe quality of employment, enhancing family-friendlyemployment and activation strategies. The chapter concludesby considering the institutional reforms necessary to achievethe National Action Plan for Social Inclusion 2007–2016(Ireland, 2007) targets and whether such targets offer hope topeople of working age.
What is working-aged and who is working-aged?
The definition of who is considered to be within the scope of‘working-aged’ has changed over time. Seventy wasconsidered the upper limit of the legal working age for manyyears, but this was reduced to 66 years in 1973. It is likely infuture years that, on equality grounds, this older age barrier towork will be removed. The 12 years of age considered the
102
Welfare Policy and Poverty
Chapter 04 17/09/2007 16:51 Page 102
minimum legal working age in 1926 had risen to 16 years by2006, however Irish policy focuses on 18 years as the lowerage for inclusion in working-aged policy and this chapterdefines working-aged as between 18 and 65 years. Just asthe age definition has changed over time so too has thescope of who is considered to be part of the working-agedpopulation. Recently both women and people with disabilitieshave been more fully embraced within the concept of workingage.
The size of the working-aged population also changes withthe size of the total population. It had risen from 1,300,000 in1926 to 2,600,000 people in 2006. This group comprises over2,100,000 in employment and a further 601,979 adults ofworking age claiming social welfare payments (Ireland, 2007).People of working age who are recipients of social welfarepayments are at risk of poverty and have been the primaryfocus of various national employment action plans and anti-poverty strategies. The 2002 revised NAPS (Ireland, 2002)introduced a range of indicators about economic activity inthe adult working-aged group. This reflected progression to abroader working-aged strategy and was consistent with theEU open method of coordination of social inclusion andemployment policy. The different experiences of keysubgroups of working-aged social welfare claimants –unemployed, people with disabilities, lone parents, qualifiedadults and carers – are now reviewed in turn. This part endsby reviewing the shift in composition of the working-aged atrisk of poverty.
The unemployedAs in every country, the definition and measurement formulaefor calculating who is without work in Ireland are socially
103
Working-aged people and welfare policy
Chapter 04 17/09/2007 16:51 Page 103
constructed political choices. The choice of how to defineand measure unemployment has been contested throughoutthe last twenty years. ‘Unemployment’ in the mid-1980sapplied only to those available for and seeking full-timework and appearing on the ‘live register’, an administrativerecord of those receiving some form of unemploymentcompensation. This precluded, by definition, many womenseeking only part-time work who could not provide childcarecover for their children. It also left invisible those ineligiblefor an insurance or means-tested unemployment payment orcredit and unable to ‘register’ as unemployed. Failure toaccess the live register had consequences: these peoplecould not access labour market programmes to help themfind work, education or training. Over time the use of the liveregister to measure unemployment was debated.
A Labour Force Survey measurement based on theInternational Labour Organization’s (ILO) definition ofunemployment – recently actively seeking work of at leastone hour per week – is now generally accepted as a moreaccurate definition of who is immediately available for work.However this definition excludes those who have notrecently actively sought employment and so under-estimates the numbers of ‘inactive’ unemployed. Theprincipal economic status (PES) definition, based on a self-assessment definition of unemployment, includes thosepresently inactive but who, given encouragement andsupports, could work.
The INOU (2007) argues that the 4.5 per cent unemploymentrate in 2007 (based on the ILO definition of unemploymentbut updated by live register trends) is not a true reflection ofunemployment. It argues a PES definition (approximately 10per cent in 2005) would be more accurate. A recent OECD
104
Welfare Policy and Poverty
Chapter 04 17/09/2007 16:51 Page 104
development which measures ‘latent’ labour force supply (orlabour force reserve) was applied by the NESF (2006) toestimate that approximately 75,000 Irish people are notincluded in the formal definition of unemployment. From agender equality perspective, all these definitions areproblematic in that they define employment and job-searchactivity according to male norms and render women’sunemployment patterns less visible.1
From the perspective of unemployment, the differencesbetween 1987, 1997 and 2007 Ireland are striking. Like manyEU countries in 1987, Ireland was a bleak place. In the earlyto mid-1980s, global industrial restructuring meant significantjob losses in key urban, low-skilled employment. By 1985,230,000 were on the live register. The scale of unemploymentand social misery cannot be understood without taking intoaccount the very high annual levels of emigration whichpeaked at around 50,000 in 1986. Despite such high levels ofemigration, live register unemployment peaked at 300,000 inJanuary 1993 before declining to its lowest point of 135,000in May 2001 (it had risen to 155,000 by January 2007).
Those households who find themselves unemployed havealways experienced a high incidence of both relative incomeand consistent poverty. Relative income poverty ratesdecreased from 51.4 per cent in 1994 to settle stubbornly ataround 40.6 per cent in 2004 (CSO, 2005). The very realhardship associated with unemployment is demonstrated by
105
Working-aged people and welfare policy
___________
1 Only those seeking full-time work and entitled to compensation forunemployment can be on the live register. Only those actively seekingwork can be counted in the ILO definition and, because the PES allowsonly one definition of a personal identity, those with the primaryidentity of homemaker, even if seeking work, do not label themselvesas unemployed.
Chapter 04 17/09/2007 16:51 Page 105
the numbers who suffered consistent poverty: 19.2 per centin 2004 when the rate for the population as a whole was 6.8per cent (CSO, 2005). The risk of poverty translated into realand significant psychological distress with the unemployedsuffering seven times higher mental distress than thoseemployed, even when those employed where in low-paid,temporary job contracts (Whelan, 1994). For women, theimpact of poverty was even greater with the pressure ofmanaging money and debt problems leaving them with higherlevels of stress and ill health.
While the agricultural restructuring of previous decadesimpacted most heavily on rural communities, global economicrestructuring has impacted on all Irish society but was feltmost keenly by working-class families in small towns and inthe inner-city and working-class suburban areas of cities.Given the scale of unemployment in the late 1980s and early1990s, government responses were largely limited tocontaining the immediate ills of unemployment and povertyand the focus was on maintaining the real value of welfarepayments. 1988 saw the first community-based socialemployment schemes2 and in 1992 the governmentestablished the first twelve local ‘area-based partnerships’ ofcommunity and statutory service-providers, which focused onintegrated service delivery in areas hardest hit byunemployment. The impact of long-term unemployment,experienced by over 40 per cent of live register claimants,was examined by the NESF (1994). This report recognised thebarriers and obstacles to employment and led to the
106
Welfare Policy and Poverty
___________
2 Later replaced by the community employment developmentprogramme, which was in turn replaced by the communitydevelopment scheme.
Chapter 04 17/09/2007 16:51 Page 106
establishment of the Local Employment Services Network(LESN) targeted at those finding most difficulty accessingemployment.
Government macro responses to unemployment, largelychannelled through social partnership, led to economicgrowth but it was a type of jobless growth. The trend turnedin the mid-1990s and significant job creation led to record jobgrowth in the late 1990s. The challenge became addressinglabour market structural blockages and removing theobstacles to unemployed people taking up these jobs. In1996, emigration trends turned and, for the first time sincethe 1970s, Ireland experienced net immigration. Innovativeback to work allowances and tax reforms aimed at the lowerpaid improved the return from paid employment and LESNsupported people who had previously lost all hope of evergetting paid work again to get back into employment.
In this optimistic environment the first National Anti-PovertyStrategy (NAPS) placed employment as the central route outof poverty and established relatively ambitious targets toreduce both unemployment and long-term unemployment(Ireland, 1997). Steady erosion of unemployment led to arevision of such targets in 2002 to decrease unemploymentamong vulnerable groups to the national average, to eliminatelong-term unemployment by 2007 and to achieve a 70 percent economic participation rate (and 60 per cent for women)by 2007 (Ireland, 2002). These targets were not changed inthe NAPinclusion (Ireland, 2007) even though the economicparticipation targets are largely accomplished. The target toeliminate long-term unemployment has not yet beenachieved, the 1.3 per cent long-term unemployment raterepresents almost 30,000 people or one-quarter of allunemployed. Access to employment or economic inclusion
107
Working-aged people and welfare policy
Chapter 04 17/09/2007 16:51 Page 107
remains very uneven; Travellers for example haveemployment rates of only 17 per cent and over 40 per centunemployment (Ireland, 2007).
People with disabilities Disability not only impacts on the likelihood of finding workbut also on the likelihood of finding decently paid work(Gannon and Nolan, 2004). People with disabilities have a 37per cent employment rate and over 190,000 working-agedpeople with disabilities are without paid employment (Ireland,2007). In 1986, the figure of 80,000 claiming disability benefitwas considered above the norm for this type of payment anda concerted effort to tighten controls and access to thepayment had reduced numbers to 42,000 by 1994 (albeitnumbers claiming the longer term invalidity pension rose by14,000 over the same period). A health board administereddisabled persons’ maintenance allowance was reformed in1996 to disability allowance administered by the Departmentof Social and Family Affairs, and numbers claiming this havegrown from 34,500 in 1996 to 62,800 in 2002 to over 79,000in 2005. While growth in the labour force and generalpopulation will lead to increased numbers claiming disabilitypayments, both FÁS (2004) and the NESC (2005) commentthat the value of decreasing unemployment has been offsetby increases in numbers claiming disability and lone-parentpayments and that the average length of these claims is acause for concern.
People with disabilities experience a significantly high risk ofpoverty. They also experience a significantly higher risk ofconsistent poverty: in 2004 terms, 21.7 per cent experienceddeprivation compared to 6.8 per cent of the total population(CSO, 2005). Men with disabilities experience a 52.9 per cent
108
Welfare Policy and Poverty
Chapter 04 17/09/2007 16:51 Page 108
risk of poverty while women with disabilities experience a 38per cent risk of poverty (CSO, 2005). While Towards 2016(Ireland, 2006) commits to including people with disabilities inthe national employment action plan, the NAPinclusion(Ireland, 2007) has a more limited ambition and adopts ashort-term target of only 7,000 people with disabilitiesaccessing employment by 2010. In the longer term it aims toincrease the employment participation rate of people withdisabilities by 8 per cent to 45 per cent by 2016. This clearlyleaves the majority of working-aged people with disabilitiesvulnerable to poverty.
Lone parentsUntil recently, Irish policy, located in a strong breadwinnerwelfare regime, firmly supported lone parents as mothers notworkers. Irish policy, by providing a specific payment toenable full-time caregiving (like Norway, New Zealand andAustralia), strongly recognised the social right to give andreceive care (Slevik, 2005). The 1994 lone-parent allowanceshifted this policy by introducing disregards for income, traveland childcare to facilitate employment and participation inactive labour market programmes. 1997 reforms renamed theallowance ‘one-parent family payment’ (OPFP), introducedmore work incentives but maintained the choice to parent fulltime. Since then policy and discourse have shifted towards astronger employment focus and in 2006 formal proposalswere made to introduce a work obligation for lone parents(DSFA, 2006b). Towards 2016 commits to including loneparents, like people with disabilities, in the remit of thenational employment action plan.
While Irish lone parents have less economic participation thanwomen in general (47 per cent compared to 60 per cent),
109
Working-aged people and welfare policy
Chapter 04 17/09/2007 16:51 Page 109
when compared to married women with children theirparticipation rates are more or less equal (Rahaleen, 2006).However, despite this level of work participation, 80 per centof Irish households headed by lone parents are in receipt ofsome form of social welfare payment and lone parents inreceipt of OPFP are at the most extreme risk of poverty inthe state. In 2004, compared to a national average of 6.8per cent, 31.1 per cent of lone parents experiencedconsistent poverty and over 40 per cent were likely toexperience debt (CSO, 2005). Children and adults in lone-parent households experienced a 48.3 per cent risk ofrelative poverty compared to a national average of 19.4 percent. Female lone parents experienced a slightly higher riskof poverty than male lone parents.
As with disability payments, negative comment has beenmade about the growth in the numbers of lone parentsclaiming social welfare and in the average duration of such claims. Recently numbers have stabilised, with only a 0.3 per cent rise of 263 lone parents from 2004 to 2005,however the total number of lone parents now exceedsnumbers on unemployment or disability allowances.
Qualified adults (wives and partners)There were 119,223 qualified adults in the Irish socialwelfare system in 2005 (DSFA, 2006a). There is no agebreakdown of this group available but 62,447 live with anold age social welfare recipient and are likely to be ofpension age or at the older end of the working age range.Nonetheless, given that over 124,801 children in suchhouseholds are fully dependent and 83,348 children arepartially dependent on social welfare, households withqualified adults should be a key target for a social inclusion
110
Welfare Policy and Poverty
Chapter 04 17/09/2007 16:51 Page 110
strategy. Arrowsmith (2004) argues that investment will meet the direct social and employment needs these adultshave in their own right but their activation may also triggertheir spouses’ or partners’ activation.
Qualified adults appear to have a lower employmentparticipation rate than lone parents. They are involved inperipheral labour market activity (cleaning, care andhospitality sectors) and limit employment to remain withinqualified adult means test thresholds (Murphy, 2003). Thelabour market needs of qualified adults and other womenmarried to or cohabiting with social welfare claimants orlow-paid male workers were examined by a socialpartnership working group (Ireland, 2000). However,despite some technical income disregard changes in 1996and facilitation of a ‘swap’ in entitlement to labour marketprogrammes between spouses, there was little structuralchange to facilitate such women to access employment(Murphy, 2003). Qualified adults are included in the broadvision of reforms proposed in the 2006 DSFA Proposals toSupport Lone Parents and Budget 2007 reformedqualified adults’ income disregards to make themconsistent with jobseeker’s allowance disregards.However qualified adults are not afforded the samevisibility or priority in working-aged discourse as loneparents (Murphy, 2007). There is more societal andpolitical ambiguity about obliging married working-agedmothers to access paid employment. A second groupwith little visibility are spouses of low-paid workers, whotend to return to only low-paid, part-time employment(Russell et al., 2004) and who need access to appropriatequality labour market supports if they are to progress todecent employment.
111
Working-aged people and welfare policy
Chapter 04 17/09/2007 16:51 Page 111
Carers
The needs of low-income couples can be very complicated.While they share characteristics such as class, education,ethnic group and age, they also appear to share co-dependent health, disability and addiction issues. Healthbarriers of one partner affect the other partner. Many of the25,000 Irish qualified adults living with an illness/disability-related recipient are likely to have significant unpaid careobligations. Given the complicated and inconsistentrelationship between spouses’ social welfare incomedisregards and taxes, the financial implications ofemployment are complex and harder to negotiate. With orwithout such barriers, care of children or adult relatives andassociated domestic barriers are the primary obstacles towork for many working-aged women.
Policy must realistically take into account what needs to bedone to enable access to employment but also to makeemployment more accommodating of the reality of caringobligations. Up to 1990, income support for care of relativeswas addressed by a very limited prescribed relative’sallowance. This was replaced in 1990 by a carer’s allowance,which was then gradually improved in scale and scope overthe 1990s and early 2000s so that by 2005 almost 25,000claimed carer’s allowance and 870 claimed carer’s benefit.Budget 2007 changes allow social welfare claimants who arecaring full time for a relative to claim a half-rate carer’sallowance in addition to their own social welfare. This is likelyto be attractive to many low-income working-aged womenand could distract from the longer term, paid-employmentroute out of poverty. Policy, recognising the long-term povertytrap associated with caring, now also allows carers tomaintain attachment to the labour market by working ten
112
Welfare Policy and Poverty
Chapter 04 17/09/2007 16:51 Page 112
hours per week in paid employment. While in some ways allsuch changes are laudable, it has to be asked whetherwomen (by far the primary recipients of carer’s allowance) arebeing pushed towards a triple burden of childcare, adult careand paid employment and how this is related to the mentaland physical health of these women.
Shift in composition of working-aged at risk of poverty
One of the more remarkable trends in Ireland over the periodfrom 1986 to 2006 was the shift in the composition of typesof households at risk of poverty (see Table 4.1). Over time, asunemployment decreased, the likelihood of unemploymentbeing a risk factor for households experiencing povertydiminished. In 1994, 41 per cent of families experiencingpoverty were unemployed; by 2000, the corresponding figurewas 9.8 per cent. The reduction of unemployment as a riskfactor for poverty between 1994 and 2004 occurred in parallelto increases in the risk of poverty for other groups of theworking-aged – people with disabilities, lone parents, carersand asylum seekers without permission to work (CSO, 2005).3
Lone parents comprise only 4 per cent of the total populationbut 15 per cent of the consistently poor population. Otherworking-aged groups also suffer significant risk of poverty, forexample 13.1 per cent of migrants and 21.6 per cent of thetraditional unemployed, compared to an average risk of 6.5per cent (Ireland, 2007). Over the decade 1995 to 2005,numbers claiming disability and one-parent family paymentsincreased as unemployment payments decreased. This meant
113
Working-aged people and welfare policy
___________
3 Retired people’s risk of poverty increased from 30 per cent in 1994 toover 56 per cent in 2000 before falling back to 47.3 per cent in 2004.The lack of economic opportunity and participation when working ageleads directly to poverty in retirement is discussed further in Chapter 5.
Chapter 04 17/09/2007 16:51 Page 113
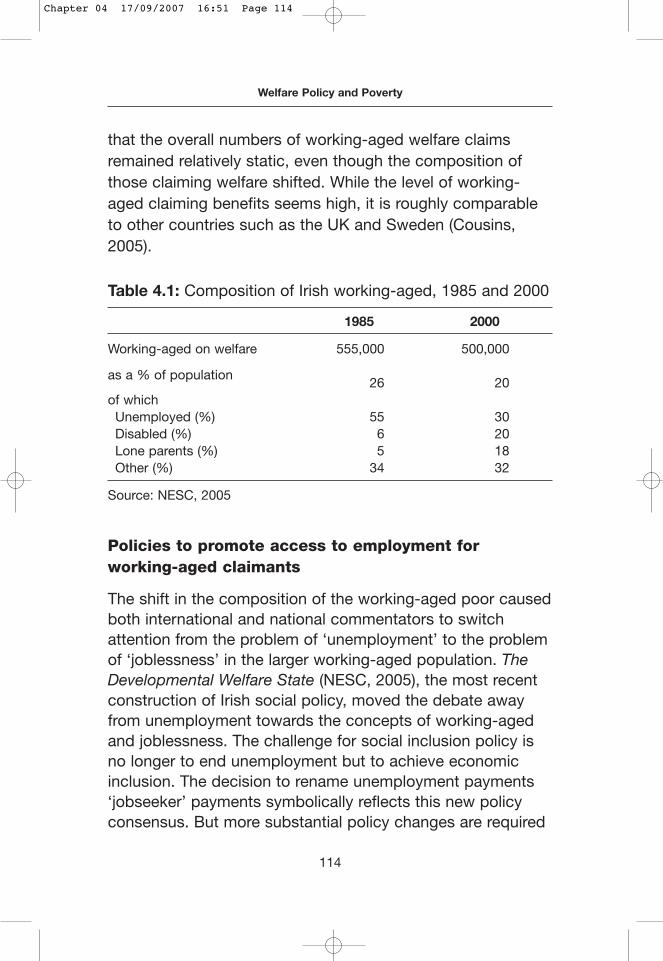
that the overall numbers of working-aged welfare claimsremained relatively static, even though the composition ofthose claiming welfare shifted. While the level of working-aged claiming benefits seems high, it is roughly comparableto other countries such as the UK and Sweden (Cousins,2005).
Table 4.1: Composition of Irish working-aged, 1985 and 2000
1985 2000
Working-aged on welfare 555,000 500,000
as a % of population26 20
of which Unemployed (%) 55 30Disabled (%) 6 20Lone parents (%) 5 18Other (%) 34 32
Source: NESC, 2005
Policies to promote access to employment forworking-aged claimants
The shift in the composition of the working-aged poor causedboth international and national commentators to switchattention from the problem of ‘unemployment’ to the problemof ‘joblessness’ in the larger working-aged population. TheDevelopmental Welfare State (NESC, 2005), the most recentconstruction of Irish social policy, moved the debate awayfrom unemployment towards the concepts of working-agedand joblessness. The challenge for social inclusion policy isno longer to end unemployment but to achieve economicinclusion. The decision to rename unemployment payments‘jobseeker’ payments symbolically reflects this new policyconsensus. But more substantial policy changes are required
114
Welfare Policy and Poverty
Chapter 04 17/09/2007 16:51 Page 114
to realise the ambition of economic and social inclusion forall. The remainder of this chapter reflects on each of thefollowing working-aged policy challenges.
• Defining the target group – Who are the target group forworking-aged policies under the social inclusion strategy(Ireland, 2007)?
• Welfare adequacy – What needs to be done to ensure thatthose who cannot access work will have alternative routesout of poverty?
• Making work pay – How can we ensure that the focus onthe working-aged will impact positively on poverty for allpeople of working age and their families?
• Quality of employment and work–life balance – How canwe ensure that labour market policy is gender-sensitiveand respects social rights and care choices?
• Flexibility and activation – How can we promote a moreactive system and what institutional changes are requiredto shift from a system that prioritised managing highunemployment to a quality system promoting highereconomic participation?
Defining the working-aged target groupThe first challenge is defining the larger population ofworking-aged compared to the previously narrowunemployed target.4 The numbers of working-aged persons
115
Working-aged people and welfare policy
___________
4 While there is an overlap between those economically active and thoseclaiming social welfare, not all the social-welfare-claiming section ofthe working-aged population (approximately 45 per cent of whom aremen and 55 per cent women) are actively seeking work or even wantto work. Government working-aged social inclusion targets refer to thenumbers of working-aged totally dependent on social welfare income.This excludes those in part-time or government-supported (contd)
Chapter 04 17/09/2007 16:51 Page 115
that the government wishes to target to promote lifelonglabour market attachment could be as high as half a million.5
There is no clear definition of who the government considersto be within the scope of the latest social inclusion targets,which makes it difficult to monitor such targets (Ireland,2007). It also makes it difficult to assess whether there aresufficient numbers of decent jobs available or whether thegovernment has invested in the scale of resources necessaryto provide this number of people with sufficient qualitysupports to access decent employment adequate to the taskof lifting them out of poverty? The NAPinclusion (Ireland,2007) suggests, for example, supporting 50,000 in casemanagement. It is not clear how this target is related to thetarget of reducing by 20 per cent the number of those whosetotal income is derived from long-term social welfarepayments by 2016.
116
Welfare Policy and Poverty
___________
4 (contd) employment from inclusion in the target and also excludes118,000 qualified adults depending on social welfare income andwomen living on low incomes and at risk of poverty (many of thesewomen wish to have some form of labour market attachment).
5 In 2004 (DSFA, 2006a), for example, the numbers unemployed were131,539 but there were an additional 470,947 of working-aged and atotal of 602,486 of working-aged depending on social welfare. Oneproxy or method for estimating the target of long-term social welfareclaimants is the number of working-aged depending on socialassistance and means-tested social welfare payments. Of these the main payments are one-parent family payment (80,103), disabilityallowance (72,976), unemployment assistance (3,840), pre-retirementallowance (11,228), widow’s allowance (15,284), deserted wives’allowance (1,458), farm assist (8,350), supplementary welfareallowance (30,748) and carer’s allowance (23,030). Of the socialinsurance payments, the most discussed targets are unemploymentbenefit (57,699) and disability benefit (58,726). This would give a totalof 433,442.
Chapter 04 17/09/2007 16:51 Page 116
Welfare adequacySocial welfare income remains the primary anti-poverty toolfor working-aged people without paid employment. If themost recent NAPinclusion (Ireland, 2007) strategy’s target ofreducing the numbers of working-aged claiming socialwelfare by 20 per cent is successful, it will still leave 80 percent of the present social-welfare-dependent working-aged(up to 400,000 people) on welfare. The traditional Irishprinciple of social security design was to keep paymentsrelatively ungenerous in order to promote and maintain theincentive to work. This raises the policy issue of socialwelfare adequacy.
Relatively low social welfare rates are a direct cause of thehigh risk of poverty presently experienced by people ofworking age (Callan, 2006). In 2004, for example, working-aged social assistance and benefit payments were worthapproximately 65 per cent of the poverty threshold (60 percent of average disposable income). When compared toNorthern Ireland or the UK (where payments are set at only40 per cent of the poverty threshold), the Irish rate seemsrelatively generous. However compared to Nordic rates(Norway 70 per cent, Sweden 89 per cent, Finland 121 percent and Denmark 147 per cent), Irish rates are relatively low.
Substantial increases in Budgets 2005, 2006 and 2007brought the lowest adult social welfare payments toapproximately 30 per cent of the gross average industrialwage.6 However the 2007 combination of child and adult
117
Working-aged people and welfare policy
___________
6 Despite increases over the last number of budgets, analysis by OPEN(2006) shows the combination of social welfare supports for one-parent families (at €248.18 per week in 2006) to be up to €25 perweek below what was required to be above the 2006 poverty line(estimated to be €273.62 per week).
Chapter 04 17/09/2007 16:51 Page 117
social welfare payments is still only 90 per cent of what isrequired to lift one-parent families above the poverty line.Callan (2006) reflects that, while support to take upemployment needs to be a key anti-poverty policy, adultsocial welfare rates are also critical for tackling adult andchild poverty. Benchmarking and indexing social welfareminimum income standards needs a more central place inanti-poverty and social inclusion strategies. In the context ofdefining poverty as the ‘inability to participate in normalactivity’, the minimum income standard has to be set at arate that not only addresses deprivation-based poverty butalso addresses relative income poverty. Goal five of the 2007NAPinclusion – which sets a target to maintain, as resourcesallow, the value of the present weekly payment (€185.60 in2007) – is a relatively weak anti-poverty adequacy target. It isa contingent target which commits to updating a stillinadequate payment by an unstated indexation methodology.
Making work payThe focus on work activation assumes of course that a job isthe best route out of poverty. Overall evidence suggests thisis indeed the case – only 1.7 per cent of those in employmentexperience consistent poverty (Ireland, 2007). However theextent to which people in employment may be at risk ofpoverty is a concern for policy-makers. The ‘working poor’comprise a distinct group of employees experiencing relativepoverty. EU data show that in the EU-25 up to 7 per cent ofthe employed population (14 million people) lived inhouseholds with income below the poverty line in 2001. Ofthe EU-15, 11 million workers or 20 million people (6 per centof the population) lived in households with income below thepoverty line, working poverty impacting on over one-third ofthose at risk of poverty (Vermeylen, 2004). In Ireland the
118
Welfare Policy and Poverty
Chapter 04 17/09/2007 16:51 Page 118
percentage of working poor increased from 3.2 per cent in1994 to 7.4 per cent in 2000 and 9.8 per cent in 2004 (CSO,2005).
In trying to understand the policy challenges involved inmaking sure employment is indeed a route out of poverty, it isnecessary to differentiate between ‘low pay’ and ‘workingpoor’. Vermeylen (2004) defines the working poor as‘individuals who are employed or self-employed and whosehousehold disposable income is less than 60% of nationalmedium income’. This should be distinguished from thedefinition of the low-waged as ‘workers earning less thantwo-thirds of (hourly, weekly, yearly) medium earnings’ (Nolanand Marx, 2000). Ireland has one of the smallest overlapsbetween low pay and poverty of any EU country. Most low-waged workers live in non-poor households and this protectsthe individual on a low wage from experiencing poverty.Indeed income from low wages takes up to one-third of low-paid men, one-fifth of low-paid women and over 50 per centof low-paid separated, divorced or widowed women out ofthe poverty net (Nolan and Marx, 2000).
Other low-waged workers are heads of households with noother adult working and/or with child dependants. Theirindividual wages are insufficient to take these households outof poverty. Lone parents are particularly vulnerable in thisregard as childcare reduces the possibility of full-time work.Low-paid married men with children and non-workingspouses are also a high-risk group. Factors influencing thelikelihood of being working poor include employment status,age, sex, education level, contractual status and working timearrangements. Those working in non-standard employment(neither permanent nor full time) are most at risk of beingworking poor.
119
Working-aged people and welfare policy
Chapter 04 17/09/2007 16:51 Page 119
Nash (2004) and McCabe (2006) review the economicimplications of non-standard employment and highlight howsuch jobs are concentrated in low-paid, low-skilled sectorsand how such workers have less access to training, pensions,health insurance or sick pay cover. Even taking into accounthuman capital differences, non-standard workers still hadlower income than standard workers. Non-permanent, part-time workers fared the worst. Women in non-standardemployment had a higher risk of poverty and financial strainthan their male counterparts, with permanent part-timeworkers having the highest risk. Ensuring that part-time paidemployment lifts people from poverty needs to be part of anygender-sensitive social inclusion strategy. Recent changeshave enhanced social security and the labour rights of part-time workers and the NAPinclusion (Ireland, 2007) commits toconsider recognising the validity of part-time work choices.This recognises that women have little choice but to work part time (it is often the only way they can financially andethically reconcile care obligations and economicparticipation). However the challenge is not only to recognisesuch work as a valid choice but also to ensure that it is aneffective route out of poverty.
Improving the quality of employmentGiven the skills and education levels of many working-agedpoor, low-paid jobs are likely to be the only short-term realistic employment option. While the establishment of aminimum wage had important anti-poverty advantages, apolicy that sought to eradicate low wages fully would impacton employment supply and diminish the very jobs for whichunemployed people can compete. The problem needs a morefocused solution. More hours may need to be worked, but toomany dependants may be relying on income from low-paid
120
Welfare Policy and Poverty
Chapter 04 17/09/2007 16:51 Page 120
employment. Policy requires measures targeted at working-poor households. Childcare provision needs to enable spousesto access employment and lone parents to increase hours ofemployment, this means appropriate and affordable childcare(Coakely, 2005). It also means maximising take-home-pay byfurther improvements in family income supplement or targetedin-work tax-breaks such as in-work refundable tax credits7 orenhanced child income support such as child benefitsupplement or taxable child benefit.
Education and training policy can play a long-term role byenhancing the skill levels of low-paid workers and theirchildren and enabling them to break free of occupationalsegregation. Women’s labour market preparation is dominatedby employment programmes with lower progression outcomesand therefore more focus needs to be given to skilled trainingoptions. There is no tracking of the types of employmentpeople are accessing through the national employment actionplan process. While Indecon (2005) concludes that mostunemployed are exiting the live register to low-paid jobs, we infact know little about the employment and wage trends ofthose exiting the live register. A direct target to limit theincrease in numbers of low-paid workers would be a welcomeaddition to any social inclusion strategy, as would acommitment to monitor trends in this regard.
Focusing on the working-aged as a policy group hassignificant gender and equality implications. Attention needs tobe paid to the quality of employment in this regard. Brunton
121
Working-aged people and welfare policy
___________
7 CORI (2007), for example, points to the government’s failure to devisepolicies to help low-income families who are at risk of poverty but whodo not benefit from mainstream tax changes as, due to their lowincomes, they are effectively outside the tax net.
Chapter 04 17/09/2007 16:51 Page 121
(2006) advises that work ‘spillover’ into family life can bepositive or negative. Work can interact negatively with otherparts of life when there is a mismatch between ideal hoursand real hours.8 Positive spillovers (or job satisfaction) lead toan improved home life.9 The lack of control and choiceassociated with imposed work requirements, combined with alow-quality job, seem likely to provoke more negative thanpositive spillovers.
Enhancing family-friendly employmentTo date the anti-poverty debate has been largely framedaround work requirements without focusing on what needs tobe changed in the worlds of care and work to accommodatepeople’s caring and employment needs. The accommodationof a care ethic in labour market and employment policy is keyfor women. Without restructuring the world of work toaccommodate care, women are likely to end up in non-standard and part-time employment, such employment is nota route out of poverty (Nash, 2004). Coakely (2005, p. 3)reflects that Irish mothers’ decisions are mediated primarilyby childcare responsibilities, they negotiate the world of workfrom the financial, practical and emotional starting point of a‘moral economy’ and prioritise parental responsibility overfinancial gain. Duncan (2003) argues that failing to account forthis ethic of care leads to a ‘rationality mistake’, where policy-makers over-focus on the financial considerations of making
122
Welfare Policy and Poverty
___________
8 Negative outcomes arise when people feel overworked, parentallystressed, unhappy with their lifestyle choice, too tired and distracted topay attention to things at home, have scheduling conflicts and theirhome life is interrupted by work demands and calls.
9 Positive outcomes include wider social networks and enhancedpersonal psychological functioning through self-direction, job controland personal autonomy.
Chapter 04 17/09/2007 16:51 Page 122
work pay at the expense of accommodating the reality ofcare (Lyons and Lynch, 2005). A welfare-to-work policyinformed by an ethics of care would facilitate adult workers tocare, encourage family-friendly work practices and facilitateadequate parental leave over the lifetime of the child in a waythat addresses family-based gender inequality. Householdfunctions are not shared equally in Ireland, with womenworking an average twenty hours per week more than men onunpaid household tasks (McGinnity et al., 2005). Initiatives toincrease the number of working-aged in paid employmentneed also to increase the number of hours men spend inunpaid tasks and encourage or compel men to change theirbehaviour or broaden the scope of their household activities(Williams, 2004).10
One of the major obstacles to achieving better work–lifebalance or family-friendly policy is the attitudes of employerswho fear that greater flexibility for employees will threateneconomic competitiveness. The evidence from Nordiccountries shows high levels of compatibility betweencompetitiveness and work–life balance. However such is thenational reverence of competitiveness that even the principleof ‘an opportunity to balance work and family commitments’in the NAPinclusion has been deliberately qualified and madecontingent on being ‘consistent with employers needs’(Ireland, 2007, p. 40). Employers, rather than providingflexible employment, are increasingly requiring employees tobe more flexible to suit employers’ needs (Murphy, 2007;Duggan and Loftus, 2006). In the absence of satisfactory
123
Working-aged people and welfare policy
___________
10 In 2005, Spain introduced a statutory obligation which obliges menwho marry in civil ceremonies to pledge to share domesticresponsibilities and the care and attention of children and elderly familymembers.
Chapter 04 17/09/2007 16:51 Page 123
voluntary progress through the National FrameworkCommittee on Work–Life Balance, consideration should nowbe given to a stronger legislative approach and a regulatoryframework for work–life balance (Irvine, 2007).
The NAPinclusion qualifies the principle ‘that every personwith caring responsibilities should have access to appropriatesupports to enable them to meet these responsibilities’ byadding ‘in addition to employment and other commitments’(Ireland, 2007, p. 40). Full-time family commitments are noton offer in this social inclusion strategy. A labour marketstrategy that obliges work participation is not necessarilygender or child sensitive and there are potentially negativeconsequences for child and family wellbeing from over-concentrating on work solutions to poverty (O’Brien, 2004).Various social rights (to care for or to be cared for, to childand family wellbeing, to minimum income) could bethreatened by an over-zealous or unbalanced approach toemployment-based social inclusion. Strong legal safeguardsare needed to protect these rights and to ensure fairprocesses of decision-making (Murphy, 2007).
Class and ethnicity are defining features of working-agedpeople’s lives (Armstrong, 2006). In Ireland there remains astrong societal ethos of respecting (and facilitating throughthe tax system) support for full-time mothering. This raisesthe issue of whether it is fair that state supports are beingused to subsidise different working-aged choices for differentclasses of women and men. Class is also a defining featureinfluencing care and parenting choices. Middle-classchildrearing norms are more enabling of maternalemployment; working-class childrearing norms (perhapsrecognising different opportunity costs) place more emphasison direct mothering, ‘being there’ and home-based parenting
124
Welfare Policy and Poverty
Chapter 04 17/09/2007 16:51 Page 124
and childcare options. There are also class differences in theexperience of what it means to juggle motherhood and work.Armstrong (2006) differentiates middle-class women withcapital resources who negotiate flexibility from working-classwomen who are required to be flexible. Indeed middle-classwomen’s flexibility often depends on the flexibility of working-class women.
Ethnicity also defines present policy approaches to access toemployment as asylum seekers are still denied the right towork. Compared to the national average, migrants haveslightly higher economic participation rates but experiencemore than double the rate of consistent poverty. Given thatworking-aged migrants are likely to comprise a growingproportion of the working-aged poor, policy and institutionalresponses need to be sensitive to emerging ethnic trends andneeds and to ensure diversity and equality training.11
FlexicurityThe ebbs and flows of unemployment are to some extent afunction of the international political economy. The threatsand opportunities posed by globalisation and global-levelindustrial restructuring are a constant feature of academicand policy discourse and set the context for Irish labourmarket and anti-poverty strategies (Scharpf and Schmidt,2000). The national social inclusion strategy is embedded inthe national paradigm of maintaining internationalcompetitiveness (Connolly, 2006). This strong national policy
125
Working-aged people and welfare policy
___________
11 The evaluation of the UK New Deal for Lone Parents (Holland, 2005)showed those without English as a first language were least likely toenter employment after work-focused interviews. FÁS (Molloy, 2007)estimates that 50 per cent of people using its employment services in2006 were non-Irish nationals with one-quarter from Poland.
Chapter 04 17/09/2007 16:51 Page 125
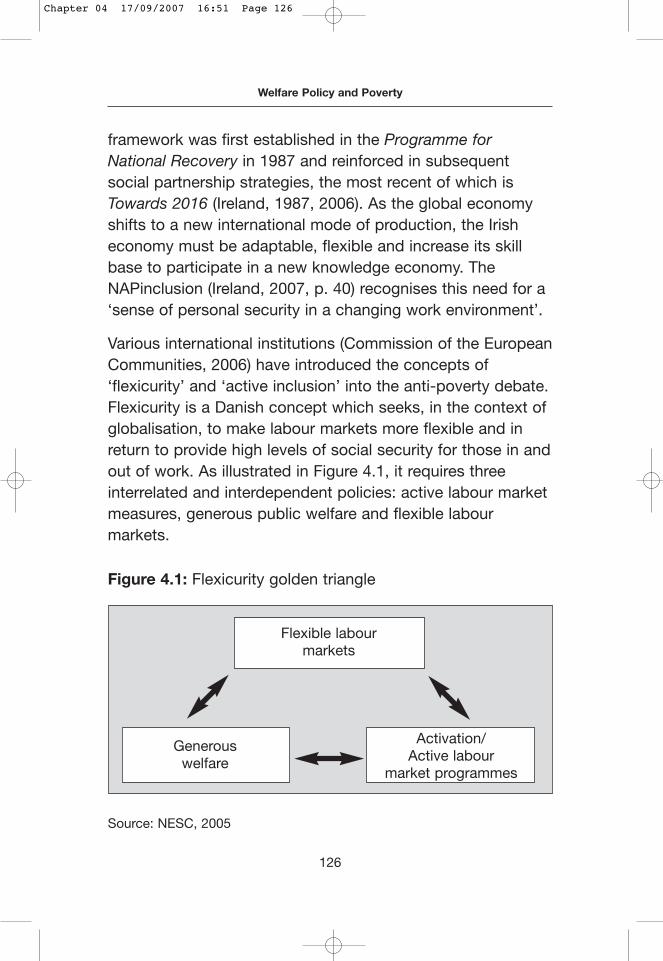
framework was first established in the Programme forNational Recovery in 1987 and reinforced in subsequentsocial partnership strategies, the most recent of which isTowards 2016 (Ireland, 1987, 2006). As the global economyshifts to a new international mode of production, the Irisheconomy must be adaptable, flexible and increase its skillbase to participate in a new knowledge economy. TheNAPinclusion (Ireland, 2007, p. 40) recognises this need for a‘sense of personal security in a changing work environment’.
Various international institutions (Commission of the EuropeanCommunities, 2006) have introduced the concepts of‘flexicurity’ and ‘active inclusion’ into the anti-poverty debate.Flexicurity is a Danish concept which seeks, in the context ofglobalisation, to make labour markets more flexible and inreturn to provide high levels of social security for those in andout of work. As illustrated in Figure 4.1, it requires threeinterrelated and interdependent policies: active labour marketmeasures, generous public welfare and flexible labourmarkets.
Figure 4.1: Flexicurity golden triangle
Source: NESC, 2005
126
Welfare Policy and Poverty
Flexible labour markets
Generouswelfare
Activation/Active labour
market programmes
Chapter 04 17/09/2007 16:51 Page 126
How near is Ireland to a functioning model of flexicurity? WhileIreland has one of the most flexible labour markets in theworld, this flexibility has so far not been compensated for witha generous welfare system involving adequate social welfarerates or quality universal public services. This combination ofstrong flexibility and limited security means Irish policy is aconsiderable distance from a fully functioning flexicurity model.The Irish experience of activation and active labour marketmeasures is more mixed but has not yet reached the level ofconditionality exercised in Nordic activation policy and impliedby flexicurity (Kirby and Murphy, forthcoming). The danger forpeople of working age who are at risk of poverty is that, inattempting to develop ‘an Irish model of flexicurity’, haste willbe made in achieving higher levels of activation orconditionality without achieving the compensatory generouswelfare system. The next section reviews what has beenhappening with Irish activation policy and addresses whatinstitutional and policy changes are required to effect a morefully functioning working-aged activation policy.
Activation strategiesActive labour market expenditure is a long-standing feature ofthe Irish welfare state. Since the early 1990s there has been anew focus on ‘performative inclusion’, which stressesemployment as the best route out of poverty (Dukelow, 2004).This focus has shifted public investment towards active labourmarket spending. Irish spending on active labour marketprogrammes (ALMPs) increased from an already comparativelyhigh 1.46 per cent of GDP in 1985 to 1.53 per cent in 2000,this represents a significant real spending increase given thescale of economic growth over that period (Kirby and Murphy,forthcoming). Between 1994 and 2001, Irish spending onALMPs was 7.2 per cent of public social expenditure or more
127
Working-aged people and welfare policy
Chapter 04 17/09/2007 16:51 Page 127
than double that of the EU average of 3.3 per cent. TheseALMPs were primarily delivered by FÁS through a mix ofemployment services, training and employment programmes.In the early 1990s, the Department of Social and FamilyAffairs (then called the Department of Social Welfare) beganto develop employment support services to facilitate peopleinto jobs (Dukelow, 2004; McCashin, 2004) and introduced anumber of employment subsidies or income supports toenable transition into employment. These included theinnovative and widely acclaimed back to work allowanceschemes.
The scale of spending on activation measures is moreimpressive than the actual progression outcomes achievedthrough activation policy. O’Connell and McGinnity (1997)conclude that while specific skills training and employmentsubsidies had impressive employment outcomes, generaltraining had only weak, and community employment evenweaker, employment outcomes. Denny et al. (2000) andIndecon (2002) stress the importance of active labour marketprogrammes having labour market linkages. Over time,activation policy has become more progression-oriented andlinked to participation obligations. Halpin and Hill (2006)review how participation in ALMPs is associated with entry toand exit from poverty and find that employment schemes (butnot training schemes) are associated with a greater risk ofentry to poverty and a lower chance of exiting poverty. This isexplained by a selection effect, the poorest are most likely tohave less general employment chances and are more likely toenter an employment scheme.
McCashin (2004) and Boyle (2005) argue compulsion isremarkably absent in the Irish policy regime. Empiricalevidence, however, supports the conclusion that policy
128
Welfare Policy and Poverty
Chapter 04 17/09/2007 16:51 Page 128
shows significant supportive and punitive changes whichcombine to push welfare claimants towards employment(Dukelow, 2004; Kirby and Murphy, forthcoming).12
Historically, job-search conditions always applied tounemployment assistance payments and since the mid-1990sstricter work availability tests have been applied to allunemployment payments. The 1987 jobsearch programmewas followed by 1992 legislation increasing and broadeningthe scope of sanctions. From 1996 onwards, fears of labourshortages sparked vigorous debate about the need for moreconditionality. This resulted in a new Live RegisterManagement Unit focused on ‘a more effective application ofconditionality’ (Dukelow, 2004, p. 22). New regulations totighten work availability and job-seeking guidelines wereintroduced in 1997 and 1998.
The 1997 national employment action plan was introducedthrough the European employment strategy’s open method ofcoordination. Since then there has been a policy ofsystematic engagement with unemployed claimants and asignificant level of live register exit (Indecon, 2005). HoweverIrish social policy discourse continues to emphasise‘supportive conditionality’ and ‘sensitive activation’ and policystill deviates from a strong model of conditionality in itsreluctance to extend conditionality to lone parents, spousesof male claimants, and people with disabilities. Since 2005,however, there is a marked shift in discourse. The NESC
129
Working-aged people and welfare policy
___________
12 Up to forty significant punitive or supportive changes took place overthe period from 1986 to 2005, some of which had a substantial impacton the quality of social protection experienced by the claimant.Negative changes included freezing child income support, limitingduration of payments, means-testing insurance payments andrestricting part-time workers’ access to insurance payments.
Chapter 04 17/09/2007 16:51 Page 129
(2005, p. 178) proposes all social assistance payments enable‘a life time attachment to the labour force’ and the DSFA(2006b) proposes to apply work requirements for working-aged lone parents and qualified adults.
Targets and institutional reformsIf the NESC and DSFA proposals are ultimately implemented,Irish policy will be much more ‘active’. However theNAPinclusion (Ireland, 2007) does not clearly or fully committo extending the national employment action plan process tolone parents and people with disabilities. There remains aconsiderable journey to go on the path to a comprehensivewelfare-to-work strategy or a social policy compatible with acompetitive economy (Sweeney and O’Donnell, 2003). Manygroups voice concerns about the levels of supports availableto the unemployed and other working-aged claimants (INOU,2006) and question the relevance of FÁS services to theworking-aged Irish population (Rahaleen, 2006). Significantregional variations in employment levels can only beaddressed with focused, localised, integrated employmentstrategies (NESF, 2006; Duggan and Loftus, 2006).
This raises the question of what national and localinstitutional arrangements are required to implement tightlyintegrated, local labour market programmes aimed at all orsubgroups of the working-aged. Finn (2000, p. 53) observesthat ‘large scale, uniform, inflexible, benefit and employmentand training systems are ending’, local agencies now work inpartnership with community groups in decentralised one-stop-shop gateways with more organisational accountabilityabout responsiveness. OECD ministers have urged‘integration of benefit administration, job brokering andreferral to active measures’ (Finn, 2000, p. 54). More flexible
130
Welfare Policy and Poverty
Chapter 04 17/09/2007 16:51 Page 130
local delivery or differentiation in policy implementationrequires enhancing the capacity of local institutions andnetworks to work to a common agenda (NESF, 2006). Localpartnerships in the EU are often local authority based or ledbut the weak system of local government in Ireland raisesquestions about local capacity to plan and implement locallabour market activation programmes. Towards 2016 and theNAPinclusion highlight the potential social inclusion role ofthe county development boards but there remainconsiderable local challenges to activate this latent potential(Ireland 2006, 2007).
Nicaise (2005) observes that, if anti-poverty outcomes are tobe secured, activation policies need to focus on socialintegration, quality jobs and an ethic of care. Whether Irelandadopts a narrow work-first approach or a broader socialinclusion approach to activation will be determined, not bythe international political economy, but by national politicalmediation. The institutional spaces where such labour marketand anti-poverty policies are mediated have themselveschanged over the years. An innovative feature of the Irishpolicy system is a national social partnership policy-makingstructure which includes groups representing differentcommunities of working-aged people living in poverty. The1997 NAPS underscored this principle of consultation andstressed the importance of consultation with people living inpoverty (Ireland, 1997). An effective implementation strategyrequires actively listening to and learning from people inpoverty about how they experience the delivery of bothstatutory and voluntary services. The more recent focus onworking age brings a new relevance to the debate about thesocial integration needs of working-aged people living inpoverty. Representative organisations are challenged to see
131
Working-aged people and welfare policy
Chapter 04 17/09/2007 16:51 Page 131
the groups they represent not as individual communities ofinterest, such as women, disabled, Travellers or unemployed,but as working-aged people with parallel rights to botheconomic and social inclusion.
Conclusions
How can the government ensure it has a broad socialinclusion strategy rather than a narrow work-first strategy forworking-aged people? A rights-based approach will seek tosafeguard the right to social inclusion and ensure it is notmade contingent solely on economic participation. If it isaccepted that work is not the only route out of poverty then itshould also be accepted that more focus needs to be placedon securing and maintaining welfare adequacy for people ofworking age. Income support policies need to be used in acreative and targeted fashion to make work pay and toenhance the likelihood that economic inclusion will lead toeffective routes out of poverty and into social wellbeing. Atracking mechanism is required to monitor whether work is infact impacting positively on poverty. Pay is not the onlycriteria by which the quality of employment can be measured.A gender mainstreaming approach would ensure that theworld of work is adapted to include an ethic of care andbetter work–life balance. In-work training is needed to ensureworkers in low-paid employment have opportunities forprogression and that all workers have opportunities for thelevel of upskilling and reskilling necessary to keep pace withthe changing needs of this global economy.
The greatest policy challenge however is delivering ameaningful and integrated service that makes sense to theend user. This requires more national and local coordinationthan Irish institutions have been able to deliver. The focus
132
Welfare Policy and Poverty
Chapter 04 17/09/2007 16:51 Page 132
therefore needs to be on institutional reforms that can delivera quantum leap in the capacity to deliver one-stop-shop-typeservices which address comprehensively the range of needsof people trying to return to employment. These institutionalreforms are required at both national and local levels. Nationalreforms will require a rethinking of the institutional relationshipbetween FÁS and the Department of Social and FamilyAffairs. Local reforms, recognising the traditional weaknessesof local government and what has been achieved througharea-based partnerships, will need to use existing structures,such as the county development boards, as more effectivespaces to achieve coherent and comprehensive local labourmarket strategies.
Without such institutional reforms, even the right policies willnot be effectively implemented. Without the appropriatepolicies and implementation strategies, the social inclusiontarget for those of working age could be read as much as a‘threat’ as an ‘opportunity’. There remains a danger that theNAPinclusion (Ireland, 2007) strategy target to reduce thenumbers of working age depending long term on socialwelfare by 20 per cent by 2016 could be as much a cost-saving target as a meaningful anti-poverty target. The firststep in securing effective outcomes for the working-aged isputting in place a national framework for a social-inclusion-ledactivation strategy. This framework requires strong politicalleadership capable of delivering the scale of institutionalreform required to generate integrated service delivery topeople of working age.
References
Armstrong, J. (2006), ‘Beyond ‘Juggling’ and ‘Flexibility’: Classed andGendered Experiences of Combining Employment and Motherhood’,Lancaster University Sociological Research Online, vol. 11, no. 2
133
Working-aged people and welfare policy
Chapter 04 17/09/2007 16:51 Page 133
Arrowsmith, J. (2004), ‘A Review of What We Know About Partners ofBenefit Recipients’, London: Department of Work and Pensions:www.dwp.gov.uk
Boyle, N. (2005), FÁS and Active Labour Market Policy 1985–2004,Studies in Public Policy no. 17, Dublin: The Policy Institute
Brunton, C. (2006), Work, Family and Parenting, Wellington: Centre ofSocial Research and Evaluation, Ministry of Social Development
Callan, T. (2006), ‘Child Poverty and Child Income Support’, presentationto Combat Poverty Agency research seminar series, 27 November
Coakely, A. (2005), Mothers, Welfare and Labour Market Activation,Research Working Paper no. 05/04, Dublin: Combat Poverty Agency
Commission of the European Communities (2006), Concerning aConsultation on Action at EU Level to Promote the Active Inclusion ofthe People Furthest from the Labour Market, COM (2006) 44 final,Brussels: European Commission
Connolly, E. (2006), ‘The Institutionalisation of Anti-Poverty Policy in theSocial Partnership Process’, presentation to Combat Poverty Agencyresearch seminar series, 9 May
Cousins, M. (2005), Explaining the Irish Welfare State, Lewiston, NY: TheEdwin Mellen Press
CORI (2007), ‘Analysis and Critique of Budget 2007’, Dublin: Conferenceof Religious of Ireland: www.cori/budget/2007/accbud07/index.htm
CSO (2005), EU Survey on Income and Living Conditions, Dublin: CentralStatistics Office
Denny, K., Harmon, C. and O’Connell, P. (2000), The Labour MarketImpact of Human Resource Intervention Funding under the 1994–1999Community Support Framework in Ireland, Dublin: ESRI
DSFA (2006a), Annual Statistical Report 2005, Department of Social andFamily Affairs, Dublin: Stationery Office
DSFA (2006b), Proposals to Support Lone Parents, Department of Socialand Family Affairs, Dublin: Stationery Office
Duggan, C. and Loftus, C. (2006), ‘A Study of Labour Market Vulnerabilityand Responses to It in Donegal, Sligo and North Dublin’, Dublin:National Economic and Social Forum: www.nesf.ie
Dukelow, F. (2004), ‘The Path Towards a More “Employment Friendly”Liberal Regime? Globalisation and the Irish Social Security System’,paper presented at the Foundation for International Studies of SocialSecurity Seminar, Stockholm, June
134
Welfare Policy and Poverty
Chapter 04 17/09/2007 16:51 Page 134
Duncan, S. (2003), Mother Knows Best: Social Division and Work andChildcare, Families, Life Course and Generational Research CentreWorking Paper Series no. 31, Leeds: Leeds University
FÁS (2004), The Irish Labour Market Review 2003: Challenges Facing theIrish Labour Market, Dublin: FÁS
Finn, D. (2000), ‘Welfare to Work: The Local Dimension’, Journal ofEuropean Social Policy, vol. 10, no. 1, pp. 43–57
Gannon, B. and Nolan, B. (2004), Disability and Social Inclusion in Ireland,Dublin: ESRI
Halpin, B. and Hill, J. (2006), ‘Active Labour Market Programmes andPoverty Dynamics’, presentation to Combat Poverty Agency researchseminar series, 23 May
Holland, J. (2005), ‘Evaluation of the Extension of the New Deal for LoneParents’ Eligibility’, London: Department for Work and Pensions:www.dwp.gov.uk
Indecon (2002), Review of Active Labour Market Programmes, Dublin:Indecon International Economic Consultants and Department ofEnterprise, Trade and Employment
Indecon (2005), Review of the National Employment Action PlanPreventative Strategy, Dublin: Indecon
INOU (2006), ‘What’s in a Name?: Pre-retirement and Job SeekersAllowance’, Bulletin, March/April, p. 1
INOU (2007), 2007–2010 Strategic Plan, Dublin: Irish National Organisationof the Unemployed
Ireland (1987), Programme for National Recovery, Dublin: Stationery Office
Ireland (1997), Sharing in Progress: National Anti-Poverty Strategy, Dublin:Stationery Office
Ireland (2000), Report of the P2000 Working Group on Women’s Access tothe Labour Market, Dublin: Stationery Office
Ireland (2002), Building an Inclusive Society, Dublin: Stationery Office
Ireland (2006), Towards 2016, Dublin: Stationery Office
Ireland (2007), National Action Plan for Social Inclusion 2007–2016,Dublin: Stationery Office
Irvine, T. (2007), ‘Time We Considered Work Life Balance as a LegalRight’, The Irish Times, 2 February
Kirby, P. and Murphy, M. (forthcoming), ‘Ireland as a Competition State’, inAdshead, M., Kirby, P. and Millar, M. (eds.), Contesting the Irish State,Manchester: Manchester University Press
135
Working-aged people and welfare policy
Chapter 04 17/09/2007 16:51 Page 135
Levitas, R. (2001), ‘Against Work: A Utopian Incursion into Social Policy’,Critical Social Policy, vol. 21, no. 4, pp. 449–465
Lyons, M. and Lynch, K. (2005), ‘States of Care, Time Poverty and theMoral Imperative to Care’, paper presented to Equality, Care andSocial Inclusion conference, UCD/QUB Armagh City Hotel, 24 June
McCabe, B. (2006), ‘Economic Implications of Non-StandardEmployment’, presentation to Combat Poverty Agency researchseminar series, 26 September
McCashin, A. (2004), Social Security in Ireland, Dublin: Gill & Macmillan
McGinnity, F., Russell, H., Williams, J. and Blackwell, S. (2005), Time Usein Ireland 2005 Survey Report, Dublin: ESRI
Molloy, R. (2007), in an interview with Gabrielle Monaghan, The IrishTimes, 2 February
Murphy, M. (2003), A Woman’s Model of Social Welfare, Dublin: NationalWomen’s Council of Ireland
Murphy, M. (2007), Reframing the Irish Activation Debate: AccommodatingCare and Safeguarding Social Rights, Studies in Public Policy, Dublin:The Policy Institute
Nash, V. (2004), ‘Wages and Poverty Risks of Atypical Workers’,presentation to Combat Poverty Agency research seminar series, 28May
NESC (2005), The Developmental Welfare State, Dublin: NationalEconomic and Social Council
NESF (1994), Ending Long-term Unemployment, National Economic andSocial Forum Report no. 4, Dublin: Stationery Office
NESF (2006), Creating a More Inclusive Labour Market, National Economicand Social Forum Report no. 33, Dublin: Stationery Office
Nicaise, I. (2005), ‘Peer Review of Experiment in Social Activation in theNL Peer Review in the Field of Social Inclusion Practices’, EC DGVBelgium: www.peer-review-social-inclusion.net
Nolan, B. and Marx, I. (2000), ‘Low Pay and Household Poverty’, inGregory, M., Salverda, W. and Bacon, S. (eds.), Labour MarketInequalities: Problems and Policies of Low Waged Employment inInternational Perspectives, Oxford: Oxford University Press
O’Brien, M. (2004), Workfare: Not Fair For Kids – A Review of CompulsoryWork Policies and Their Effects on Children, Auckland: Child PovertyAction Group
136
Welfare Policy and Poverty
Chapter 04 17/09/2007 16:51 Page 136
O’Connell, P. J. and McGinnity, F. (1997), Working Schemes? ActiveLabour Market Policy in Ireland, Aldershot: Ashgate
OPEN (2006), ‘Submission in Relation to Government Discussion Paper:Proposals for Supporting Lone Parents’, Dublin: OPEN
Rahaleen (2006), ‘An Evaluation of FÁS Services to Lone Parents’,unpublished document, Dublin: FÁS
Russell, H., Layte, R., Maître, B., O’Connell, P. J. and Whelan, C. T. (2004),Work Poor Households: The Welfare Implications of ChangingHousehold Employment Patterns, Policy Research Series no. 52,Dublin: ESRI
Scharpf, F. and Schmidt, V. (eds.) (2000), Work and Welfare in the OpenEconomy Volume 1, From Vulnerability to Competitiveness, Oxford:Oxford University Press
Skevik, A. (2005), ‘Women’s Citizenship in the Time of Activation: TheCase of Lone Mothers in Needs Based Welfare States’, Social Politics,vol. 12, no. 1, pp. 42–66
Sweeney, J. and O’Donnell, R. (2003), ‘The Challenge of Linking Societyand Economy in Ireland’s Flexible Developmental Welfare State’, paperpresented to the Conference of the Society for the Advancement ofSocial Economics, Aix en Provence, France, 26 to 28 June
Vermeylen, G. (2004), ‘The Working Poor in Europe’, presentation toCombat Poverty Agency research seminar series, 21 September
Whelan, C. T. (1994), ‘Poverty, Unemployment and PsychologicalDistress’, in Nolan, B. and Callan, T. (eds.), Poverty and Policy inIreland, Dublin: Gill & Macmillan
Williams, F. (2004), ‘Rethinking Families, Rethinking Care’, keynoteaddress to the Irish Social Policy Association’s Families, Children andSocial Policy: 10 Years On from the Year of the Family conference,Croke Park, Dublin, 16 to 17 September: www.ispa.ie/documents/160904fwilliams.doc
137
Working-aged people and welfare policy
Chapter 04 17/09/2007 16:51 Page 137

Chapter 04 17/09/2007 16:51 Page 138
Chapter 5
Income support for older people
Anthony McCashin
Introduction
Pensions have been to the forefront in social policycontroversies, both academic and political, in many welfarestates for the last two decades or so. The approximatesource of these controversies is the challenge posed to manydeveloped welfare states by the combined experiences ofpopulation ageing and low economic growth. These problemshave generated questions about the sustainability of socialprotection programmes and pensions in particular, and led toa flurry of policy change and reform (ILO, 2000).
In Ireland too pensions are changing, in the sense thatpension provisions are rapidly evolving, and debate andanalysis about future pension strategy – usually the preserveof specialists and experts – has become politically salient,although not yet intensely controversial. Ireland’s startingpoint in this debate is unusual in an international context.Many countries are adapting their long-standing pensionsystems to cope with economic and demographic burdens.Ireland, however, is still developing its pension system anddebating what system is most compatible with its new-found
139
Chapter 05 17/09/2007 16:52 Page 139
status as a successful ‘developmental state’ (O’Riain andO’Connell, 2000, p. 212) experiencing exceptional economicsuccess without the so-called burden of an ageingpopulation. Briefly, and to anticipate the discussion below,the choices for the future can be distilled into a stronger,more comprehensive state pension supplemented byoccupational and private pensions, or a more modest statepension complemented by a substantial system ofoccupational and private pensions. At the time of writing, agovernment green paper on pensions is awaited, andpresumably it will offer an overview of future policy options.
Against this background, the next section gives a very briefaccount of the development of pensions over the last twodecades. This is followed by a discussion on the substantivepolicy issues at stake and a critical account of the failings ofcurrent provisions and policies. The last substantive sectionsuggests a way forward for the future, given the importanceof pensions to the achievement of the social policy goalsenunciated in the National Action Plan for Social Inclusion2007–2016 (Ireland, 2007) and associated policy frameworks.
The pension system is complex and some clarifications arenecessary at this point. First, the state provides a suite of oldage pensions: state pensions based on the social insurancesystem, and the means-tested state pension.1 Entitlement tothe former is governed by social insurance contributions, andeligibility for the latter is determined by a means test. Manyclaimants of widow(er)’s pension are also over 65 years.
140
Welfare Policy and Poverty
___________
1 The insurance pensions are state pension (transition) and (contributory)(formerly known as the retirement pension and the old age contributorypension); the means-tested pension is the state pension (non-contributory) (formerly the old age non-contributory pension).
Chapter 05 17/09/2007 16:52 Page 140
Taken together, these pensions are referred to as the first tierof the pension system or the state pension system. Thesecond tier comprises supplementary pensions such asoccupational pensions paid by employers (in many cases inaddition to a full or partial first-tier pension) and also pensionsacquired by individuals such as the Personal RetirementSavings Account (PRSA) recommended by the PensionsBoard.2 It is the combination of these two tiers thatdetermines the overall character of the pension system, and itis the balance between them that is the subject of contention.
Developments in pensions 1986–2006
Table 5.1 gives a thematic overview of pension policydevelopments since 1980. These developments cannot beconcisely understood in a strict chronology as they reflectgeneral trends and strategies at work throughout the period,at times overlapping and at other times with onedevelopment predominating.
As Table 5.1 suggests, the construction of the socialinsurance system was a continuing pre-occupation. In themid-1980s the Commission on Social Welfare gave the finalimpetus to the evolution of social insurance, recommendingthat the social security system should adhere broadly to aBeveridge-type system of comprehensive social insurance. In
141
Income support for older people
___________
2 These clarifications simplify matters greatly. In theory a third tier ofpensioner income could be described, comprising investment income,interest on personal savings and so on, and in the future, whencontinued employment becomes more common among older people,their earnings will have to be added into this metaphor of tiers ofincome. Also, the description here ignores retired public sectorworkers who receive occupational pensions outside of the first-tierpension system.
Chapter 05 17/09/2007 16:52 Page 141
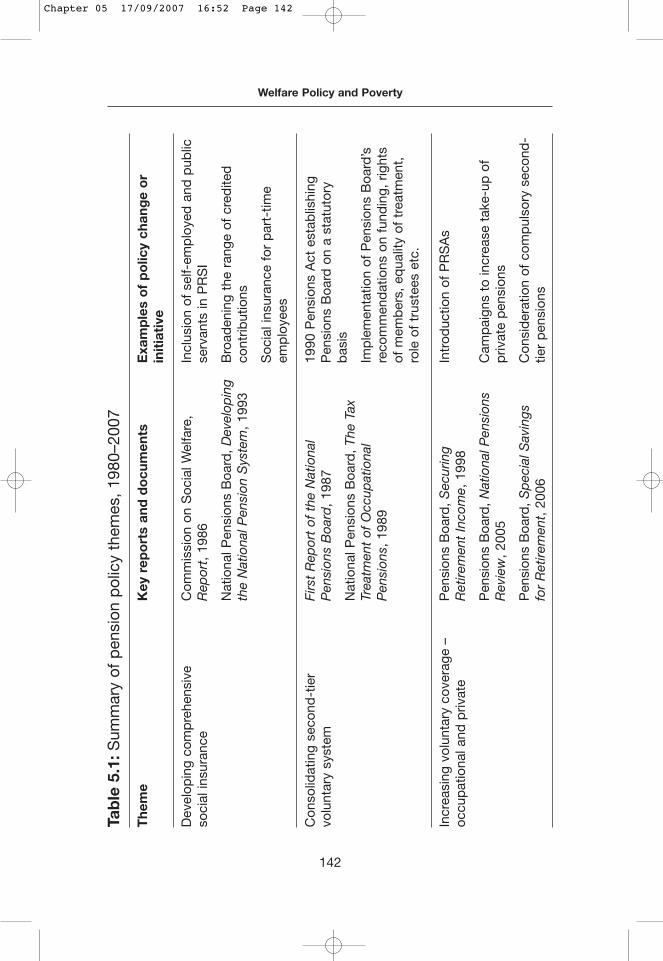
142
Welfare Policy and Poverty
Tab
le 5
.1:S
umm
ary
of p
ensi
on p
olic
y th
emes
, 19
80–2
007
The
me
Key
rep
ort
s an
d d
ocu
men
tsE
xam
ple
s o
f p
olic
y ch
ang
e o
rin
itia
tive
Dev
elop
ing
com
pre
hens
ive
Com
mis
sion
on
Soc
ial W
elfa
re,
Incl
usio
n of
sel
f-em
plo
yed
and
pub
licso
cial
insu
ranc
eR
epor
t, 1
986
serv
ants
in P
RS
I
Nat
iona
l Pen
sion
s B
oard
, D
evel
opin
gB
road
enin
g th
e ra
nge
of c
red
ited
th
e N
atio
nal P
ensi
on S
yste
m,
1993
cont
ribut
ions
Soc
ial i
nsur
ance
for
par
t-tim
eem
plo
yees
Con
solid
atin
g se
cond
-tie
rFi
rst
Rep
ort
of t
he N
atio
nal
1990
Pen
sion
s A
ct e
stab
lishi
ngvo
lunt
ary
syst
emP
ensi
ons
Boa
rd,
1987
Pen
sion
s B
oard
on
a st
atut
ory
bas
isN
atio
nal P
ensi
ons
Boa
rd,
The
Tax
Trea
tmen
t of
Occ
upat
iona
l Im
ple
men
tatio
n of
Pen
sion
s B
oard
’sP
ensi
ons,
198
9re
com
men
dat
ions
on
fund
ing,
rig
hts
of m
emb
ers,
eq
ualit
y of
tre
atm
ent,
role
of
trus
tees
etc
.
Incr
easi
ng v
olun
tary
cov
erag
e –
Pen
sion
s B
oard
, S
ecur
ing
Intr
oduc
tion
of P
RS
As
occu
pat
iona
l and
priv
ate
Ret
irem
ent
Inco
me,
199
8
Pen
sion
s B
oard
, N
atio
nal P
ensi
ons
Cam
pai
gns
to in
crea
se t
ake-
up o
f R
evie
w,
2005
priv
ate
pen
sion
s
Pen
sion
s B
oard
, S
pec
ial S
avin
gsC
onsi
der
atio
n of
com
pul
sory
sec
ond
-fo
r R
etire
men
t, 2
006
tier
pen
sion
s
Chapter 05 17/09/2007 16:52 Page 142
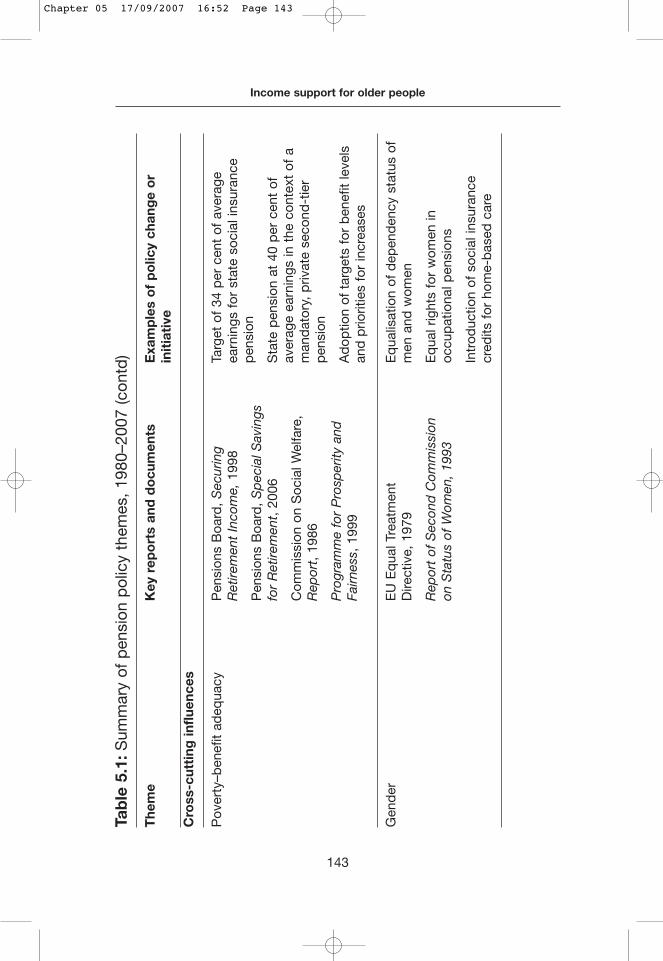
143
Income support for older people
Tab
le 5
.1:S
umm
ary
of p
ensi
on p
olic
y th
emes
, 19
80–2
007
(con
td)
The
me
Key
rep
ort
s an
d d
ocu
men
tsE
xam
ple
s o
f p
olic
y ch
ang
e o
rin
itia
tive
Cro
ss-c
utti
ng in
fluen
ces
Pov
erty
–ben
efit
adeq
uacy
Pen
sion
s B
oard
, Sec
urin
g Ta
rget
of
34 p
er c
ent
of a
vera
geR
etire
men
t In
com
e,19
98ea
rnin
gs f
or s
tate
soc
ial i
nsur
ance
Pen
sion
s B
oard
, S
pec
ial S
avin
gs
pen
sion
for
Ret
irem
ent,
200
6S
tate
pen
sion
at
40 p
er c
ent
of
Com
mis
sion
on
Soc
ial W
elfa
re,
aver
age
earn
ings
in t
he c
onte
xt o
f a
Rep
ort,
198
6m
and
ator
y, p
rivat
e se
cond
-tie
r
Pro
gram
me
for
Pro
sper
ity a
nd
pen
sion
Fairn
ess,
199
9A
dop
tion
of t
arge
ts f
or b
enef
it le
vels
an
d p
riorit
ies
for
incr
ease
s
Gen
der
EU
Eq
ual T
reat
men
t E
qua
lisat
ion
of d
epen
den
cy s
tatu
s of
Dire
ctiv
e, 1
979
men
and
wom
en
Rep
ort
of S
econ
d C
omm
issi
on
Eq
ual r
ight
s fo
r w
omen
inon
Sta
tus
of W
omen
, 199
3oc
cup
atio
nal p
ensi
ons
Intr
oduc
tion
of s
ocia
l ins
uran
cecr
edits
for
hom
e-b
ased
car
e
Chapter 05 17/09/2007 16:52 Page 143
the period to the late 1990s the implications of this policy forpensions unfolded. Part-time employees, public sectorworkers and the self-employed were all included in the socialinsurance contribution system. As a result, there was agrowth over time in the proportion of the retired population inreceipt of a social insurance pension, and of the workingpopulation contributing to the social insurance system.
A second theme was the consolidation of the second tier ofpensions, focused on supporting, regulating and expandingoccupational pensions. This series of developments emergedfrom the aftermath of the pension debates of the late 1970s.A green paper evaluating the rationale for a second-tier statepension was published in 1978, and this was to be followedby a white paper (Department of Social Welfare, 1977).Policy-makers and advocates of pension developmentsseemed to abandon the prospect of substantial improvementto the state pension in the context of the political instabilityand unfolding economic crisis of the early to mid-1980s. Thewhite paper was drafted but never published, and the policyemphasis shifted to occupational pensions. This shift wasfacilitated by political concern over the widely publicisedfailure of some occupational pension schemes, and theCommission on Social Welfare’s recommendation that thestate pension should remain a first-tier, flat-rate benefit.
The net outcome of these developments was theestablishment initially of the advisory National PensionsBoard (NPB) (1986 to 1993) and the subsequentestablishment of the statutory Pensions Board (whichcombines regulatory and advisory functions) in 1990; and thepublication of specialist reports on issues such as theregulation of occupational pensions, the tax treatment ofpensions, social insurance for the self-employed and equal
144
Welfare Policy and Poverty
Chapter 05 17/09/2007 16:52 Page 144
treatment of men and women. Legislation in the early 1990sgave effect to the NPB’s recommendations, resulting in anew regulatory framework for occupational pensionsgoverning the role of trustees, funding standards, auditingprocedures, the rights of pension contributors and so on.Critically, in a 1993 report, the NPB considered what theoverall structure of the pension system should be. TheBoard was divided: a majority argued for a basic statepension combined with a voluntary, regulated second tierunderpinned by tax allowances; a minority (the trade unions)expressed support for a compulsory second-tier pensioneither as part of the social insurance or the occupationalpension system. Briefly, the design advocated by a majorityof the NPB, a modest, but comprehensive, first tiersupplemented by a tax-supported, regulated, voluntarysecond tier, has been implemented.
A third theme emerged in the mid-1990s. Notwithstandingthe improved regulation of the occupational sector and thecontinuation of tax subsidies, coverage of private andoccupational pensions remained stubbornly low – about 50per cent of the labour force as a whole. This led to aconcern about expanding the coverage of second-tierpensions. The Pensions Board invented the PRSA toincrease individual private pension provision, andcampaigned with the private pension industry and thefinancial institutions to exhort the workforce to save forretirement (Pensions Board, 1998). By mid-2005 it was clearthat this new instrument would not increase coverage. Inthat context the option of making second-tier pensionscompulsory emerged, and in its recent reports the Board(2005, 2006) analyses the rationale for that option and howit compares with other approaches.
145
Income support for older people
Chapter 05 17/09/2007 16:52 Page 145
The three broad strands of policy have interacted with othermore general policies to shape current provisions, as thelower half of Table 5.1 shows. Poverty and benefit adequacygenerally have featured in social policy discourse since themid-1980s. A variety of analyses, beginning with theCommission on Social Welfare (1986), examine the linkbetween relative income poverty and the level and structureof benefits. Over the period under review a number ofpoverty-related targets – some specific to pensions and somemore general – have shaped both debate and policy. Forexample, the Commission outlined an indicative target for aminimally adequate benefit for the social security system as awhole, suggesting that social insurance pensions were then inthe range of adequacy. In 1998, the Pensions Board offered atarget specifically for pensions (34 per cent of averageearnings for social insurance pensions) in the context ofsetting a first-tier pension supporting voluntary second-tierpensions that would give an income replacement (in total) ofhalf the average earnings.
Gender was an equally important influence on policy andprovisions. The proximate source of this influence was theEU’s Equal Treatment Directive of 1979 and itsimplementation in Ireland in the 1980s and 1990s. In givingeffect to the Directive, Ireland altered the level and structureof pensions and other benefits and redefined the nature ofdependency in the benefit system as a whole. Aside fromthese formal changes, however, the equal treatment debateboth reflected and reinforced concerns articulated in feministcritiques of social security about the ‘male breadwinner’character of the social security system. In turn, this led tosome degree of individualisation of state pensions and somerecognition of caring roles in the social insurance contributionsystem.
146
Welfare Policy and Poverty
Chapter 05 17/09/2007 16:52 Page 146
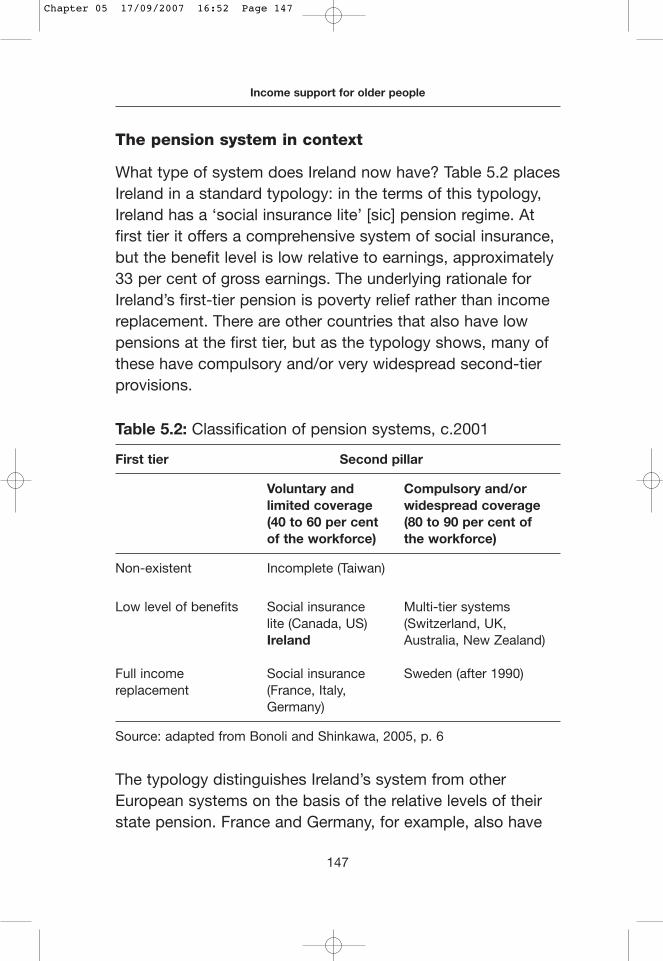
The pension system in context
What type of system does Ireland now have? Table 5.2 placesIreland in a standard typology: in the terms of this typology,Ireland has a ‘social insurance lite’ [sic] pension regime. Atfirst tier it offers a comprehensive system of social insurance,but the benefit level is low relative to earnings, approximately33 per cent of gross earnings. The underlying rationale forIreland’s first-tier pension is poverty relief rather than incomereplacement. There are other countries that also have lowpensions at the first tier, but as the typology shows, many ofthese have compulsory and/or very widespread second-tierprovisions.
Table 5.2: Classification of pension systems, c.2001
First tier Second pillar
Voluntary and Compulsory and/orlimited coverage widespread coverage(40 to 60 per cent (80 to 90 per cent of of the workforce) the workforce)
Non-existent Incomplete (Taiwan)
Low level of benefits Social insurance Multi-tier systemslite (Canada, US) (Switzerland, UK,Ireland Australia, New Zealand)
Full income Social insurance Sweden (after 1990)replacement (France, Italy,
Germany)
Source: adapted from Bonoli and Shinkawa, 2005, p. 6
The typology distinguishes Ireland’s system from otherEuropean systems on the basis of the relative levels of theirstate pension. France and Germany, for example, also have
147
Income support for older people
Chapter 05 17/09/2007 16:52 Page 147
low coverage at the second tier, but their first tier offers ahigh level of income replacement. Prior to its pension reform in the 1990s Sweden was closer to the socialinsurance model, but it now has a funded, compulsorysecond tier.
The debate about pension systems in Ireland can beunderstood as a debate about the cell in the typology towhich Ireland should move. If, for example, the governmentwas to follow the experience of Australia and introduce thecompulsory second tier in the form outlined in SpecialSavings for Retirement (Pensions Board, 2006), it would entaila move to the right in the figure into the multi-tier category.On the other hand, those who have argued for a universalstate second tier (the minority view in the NPB’s 1993 report)aspire to move the Irish system into the social insurancecategory in the lower left-hand cell. The emphasis in thePensions Board’s reports has been on the former: construct amore comprehensive, but private, second tier.
To place Ireland’s current debates and choices in aninternational context, it is useful to note some keyinternational trends and to observe whether they are reflectedin recent Irish developments. The trends identified in theauthoritative review of international pension policy conductedby the International Labour Organization (ILO, 2000) aresummarised below:
• There is a discernible trend towards a reduction in socialsecurity pension benefits. These reductions are usuallyindirect, and phased, and include changes to the detailsof the pension indexation formula (UK), adjustments to theearnings base governing the initial pension benefit(Australia) and greater targeting, through tax clawbacks
148
Welfare Policy and Poverty
Chapter 05 17/09/2007 16:52 Page 148
and means tests, of universal pensions (Finland, Sweden).This pattern does not apply in Ireland’s case.
• Many countries are increasing their social securitycontribution rates. This is being done in some casesthrough outright increases in the core contribution rates(France, Canada) and in other cases through widening theincome base on which contributions are levied (Japan,Norway). Contrary to this trend, Ireland’s contribution rateshave been stable for some time and the base remainsunchanged: earned income.
• Governments are implementing measures that result,directly or indirectly, in an increase in the age at whichpensions are paid. The US, for example, effectivelyreduced pension benefits by phasing in an increase of twoyears (from 65 to 67) in the normal pension age (startingfor workers aged 62 years in 2002). The traditionally lowerpension age for women is also being phased out:Portugal, Greece and the UK are all implementing equalpension ages by increasing the age for women. Also, inthe last decade the historic trend towards lower pensionages and earlier retirement came to an end. Governmentsare increasingly offering (actuarially) reduced pensions atearly retirement and increased pensions for deferredretirement. In Ireland, in the case of the state pension, the age of 66 years has remained unchanged since the late 1970s.
• Nearly one-third of the OECD countries reviewed in theILO study adopted privatisation measures, broadlydefined. In some cases this has entailed permission tocontract out of state second-tier pensions (UK), and inothers it has involved mandatory participation by
149
Income support for older people
Chapter 05 17/09/2007 16:52 Page 149
employers and employees in industry-wide pensionschemes (Netherlands, Switzerland). Australia introduceda private retirement income scheme based on mandatorycontributions by employers, employees and the state todefined contribution funds. In Ireland, this was the modeladvocated by the then Minister for Social and FamilyAffairs Séamus Brennan and analysed in Special Savingsfor Retirement (Pensions Board, 2006).
• There is a shift towards defined contribution arrangementsin the occupational pensions sector and notional definedcontributions in some countries’ social security pensions.In the latter case (Sweden and Italy are examples) pensionbenefits were historically fixed as a proportion of earnings,but these systems have been changed so that part of thecontributions are notionally paid into an individual’saccount; the account is re-valued annually using an indexsuch as GDP growth. An individual’s pension benefits arepartially determined by the fund and a conversion factorthat varies according to the age at retirement. Theoccupational pensions sector in Ireland shows some ofthe same pattern – a shift away from defined benefit todefined contribution schemes and therefore a shift in theburden of risk to employees – but the first-tier pensionshave remained as modest, flat-rate pensions with the level of the pensions determined annually as a politicalmatter.
This comparative sketch suggests that the revision andretrenchment measures adopted internationally to cope withageing and fiscal pressures have not been in evidence inIreland. It also highlights one important feature of current andrecent Irish policy. During a sustained period of economicgrowth, and in the context of a stable demographic structure,
150
Welfare Policy and Poverty
Chapter 05 17/09/2007 16:52 Page 150
policy-makers in Ireland did not use the opportunity toexpand the state pension system, even when it was clear thatthe second tier was not capable of providing a high level ofincome replacement for all.
Pension policy: Key issues
Poverty is clearly a key issue, and here the data tell a sombrestory about the link between pensions (and benefits ingeneral) and incomes in the economy as a whole. As Table5.3 records, relative poverty among older people rose sharplyin the 1990s and beyond, stabilised, and then declined (seePrunty, 2007). Significantly, as the gap between pensionlevels and the evolving poverty line widened and thennarrowed again, the poverty rate rose and then fell intandem.3
The data for the period to 2001 and from 2003 to 2005 arenot strictly comparable and, as can be seen in the table, thereduction in poverty is due to the fact that the poverty linestabilised post-2001 allowing pensioners to ‘catch up’ ratherthan to higher increases in pensions themselves.
151
Income support for older people
___________
3 The poverty data here refer specifically to relative income poverty. Thisis partly to keep the discussion within manageable limits, and partlybecause an analysis of pensions and older people is de facto adiscussion of incomes. Of course, there are data on poverty defined interms of deprivation of specific necessities and the official CentralStatistics Office data from the EU-SILC survey record levels ofdeprivation for the population as a whole, and for subgroups such asolder people. See Chapter 2 for further information.
Chapter 05 17/09/2007 16:52 Page 151
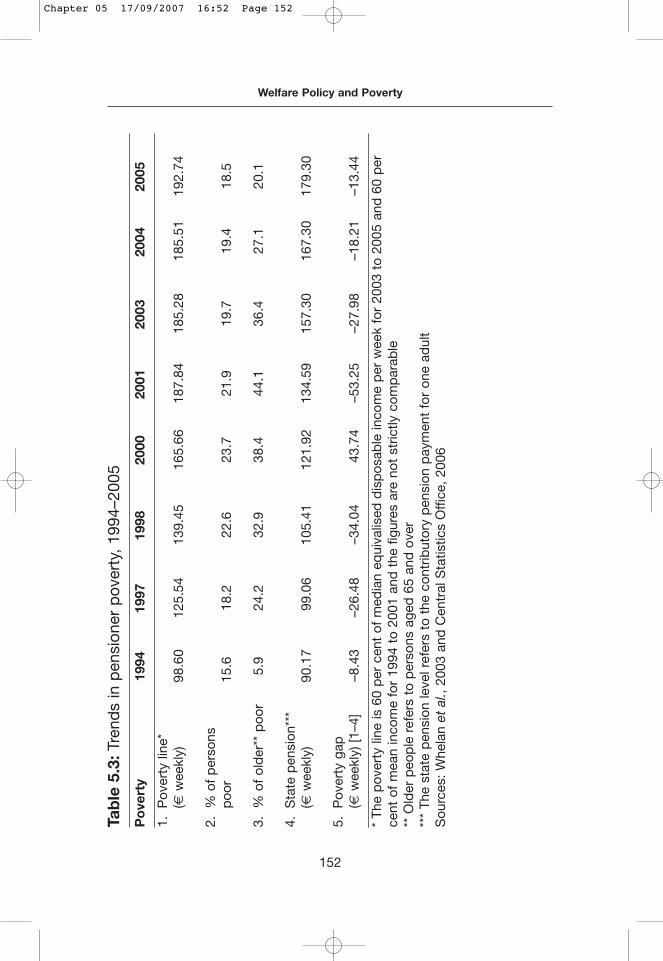
152
Welfare Policy and Poverty
Tab
le 5
.3:T
rend
s in
pen
sion
er p
over
ty,
1994
–200
5
Po
vert
y19
9419
9719
9820
0020
0120
0320
0420
05
1.P
over
ty li
ne*
(€w
eekl
y)98
.60
125.
54
139.
45
165.
66
187.
84
185.
28
185.
51
192.
74
2.%
of
per
sons
poo
r 15
.6
18.2
22.6
23
.7
21.9
19
.7
19.4
18
.5
3.%
of
old
er**
poo
r 5.
9 24
.2
32.9
38
.4
44.1
36
.4
27.1
20.1
4.S
tate
pen
sion
***
(€w
eekl
y)
90.1
7 99
.06
105.
41
121.
92
134.
59
157.
30
167.
30
179.
30
5.P
over
ty g
ap(€
wee
kly)
[1–4
] –8
.43
–26.
48
–34.
04
43.7
4 –5
3.25
–2
7.98
–1
8.21
–1
3.44
* Th
e p
over
ty li
ne is
60
per
cen
t of
med
ian
equi
valis
ed d
isp
osab
le in
com
e p
er w
eek
for
2003
to
2005
and
60
per
cent
of
mea
n in
com
e fo
r 19
94 t
o 20
01 a
nd t
he f
igur
es a
re n
ot s
tric
tly c
omp
arab
le**
Old
er p
eop
le r
efer
s to
per
sons
age
d 6
5 an
d o
ver
***
The
stat
e p
ensi
on le
vel r
efer
s to
the
con
trib
utor
y p
ensi
on p
aym
ent
for
one
adul
tS
ourc
es:
Whe
lan
et a
l., 2
003
and
Cen
tral
Sta
tistic
s O
ffice
, 20
06
Chapter 05 17/09/2007 16:52 Page 152
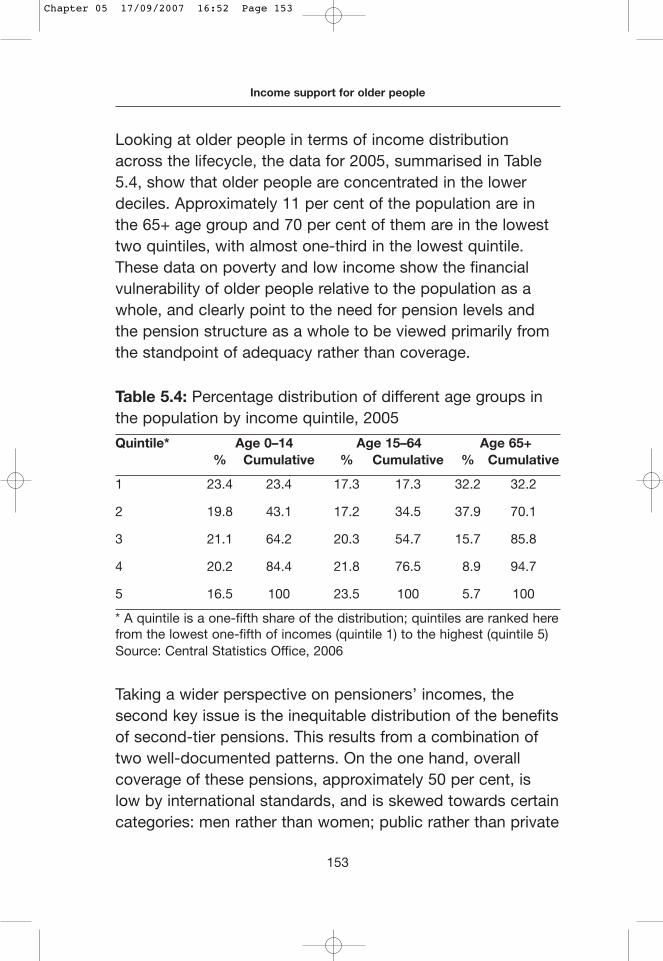
Looking at older people in terms of income distributionacross the lifecycle, the data for 2005, summarised in Table5.4, show that older people are concentrated in the lowerdeciles. Approximately 11 per cent of the population are inthe 65+ age group and 70 per cent of them are in the lowesttwo quintiles, with almost one-third in the lowest quintile.These data on poverty and low income show the financialvulnerability of older people relative to the population as awhole, and clearly point to the need for pension levels andthe pension structure as a whole to be viewed primarily fromthe standpoint of adequacy rather than coverage.
Table 5.4: Percentage distribution of different age groups inthe population by income quintile, 2005
Quintile* Age 0–14 Age 15–64 Age 65+% Cumulative % Cumulative % Cumulative
1 23.4 23.4 17.3 17.3 32.2 32.2
2 19.8 43.1 17.2 34.5 37.9 70.1
3 21.1 64.2 20.3 54.7 15.7 85.8
4 20.2 84.4 21.8 76.5 8.9 94.7
5 16.5 100 23.5 100 5.7 100
* A quintile is a one-fifth share of the distribution; quintiles are ranked herefrom the lowest one-fifth of incomes (quintile 1) to the highest (quintile 5)Source: Central Statistics Office, 2006
Taking a wider perspective on pensioners’ incomes, thesecond key issue is the inequitable distribution of the benefitsof second-tier pensions. This results from a combination oftwo well-documented patterns. On the one hand, overallcoverage of these pensions, approximately 50 per cent, islow by international standards, and is skewed towards certaincategories: men rather than women; public rather than private
153
Income support for older people
Chapter 05 17/09/2007 16:52 Page 153
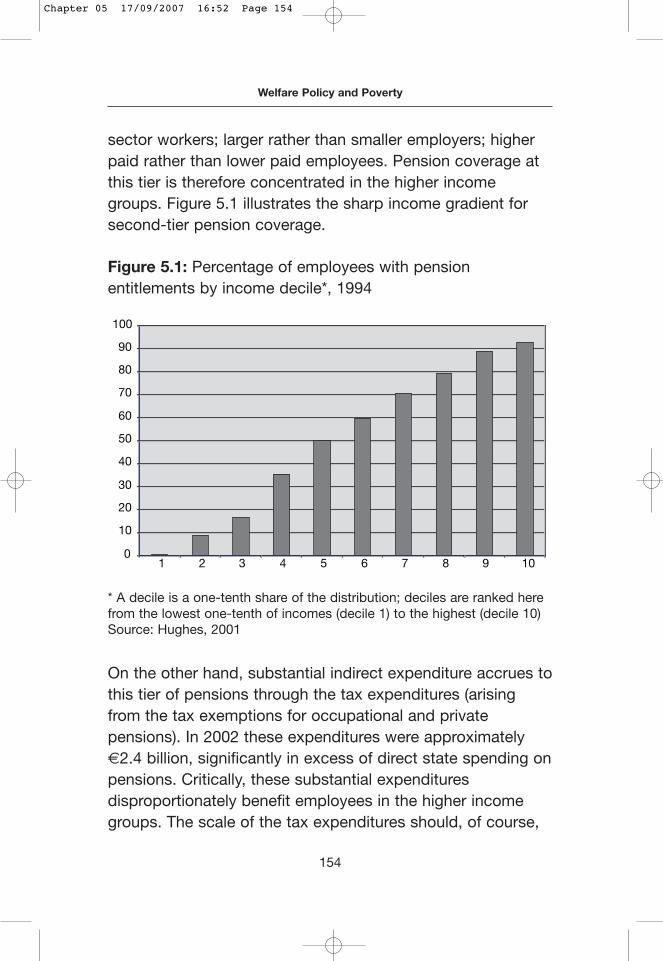
sector workers; larger rather than smaller employers; higherpaid rather than lower paid employees. Pension coverage atthis tier is therefore concentrated in the higher incomegroups. Figure 5.1 illustrates the sharp income gradient forsecond-tier pension coverage.
On the other hand, substantial indirect expenditure accrues tothis tier of pensions through the tax expenditures (arisingfrom the tax exemptions for occupational and privatepensions). In 2002 these expenditures were approximately€2.4 billion, significantly in excess of direct state spending onpensions. Critically, these substantial expendituresdisproportionately benefit employees in the higher incomegroups. The scale of the tax expenditures should, of course,
154
Welfare Policy and Poverty
Figure 5.1: Percentage of employees with pensionentitlements by income decile*, 1994
* A decile is a one-tenth share of the distribution; deciles are ranked herefrom the lowest one-tenth of incomes (decile 1) to the highest (decile 10)Source: Hughes, 2001
0
10
20
30
40
50
60
70
80
90
100
1 2 3 4 5 6 7 8 9 10
Chapter 05 17/09/2007 16:52 Page 154
be considered in the light of the cost implications of improvingthe state pensions. In its reports the Pensions Board (1998,2005) treats the direct expenditures on state pensions and theindirect tax expenditures as quite independent of each other.However, both sets of expenditures are a cost to theexchequer and both have significant distributional effects. Thispoint has practical implications. Clearly, the cost of improvingstate pensions could be offset in part by a reduction in the taxprivileges for pensions, and, equally important, futureprojections of pension costs should include the indirect taxcosts – a practice not reflected in the Pensions Board’sreports.
A third important aspect of pensions is the differential accessof men and women to pensions at first and second tier. It isnot possible with the available data to construct a full profile of the pension status of the retired and working populations,male and female. Tables 5.5 and 5.6 show that,notwithstanding the removal of formal gender discrimination inthe workplace and the social security system, men and womenhave differential access to pensions. The percentage of theolder male population in receipt of a state old age pension issignificantly higher than the proportion for the femalepopulation; 95 per cent in contrast to 80 per cent. More thanthree-quarters of men receive an insurance pension whereasamong women the figure is over one-half.
There are no comparable data for retired men and womenabout second-tier pensions, but the National Pensions Reviewdata on coverage in the current workforce (Pensions Board,2005) indicate a gender difference. The data in Table 5.6referring to second-tier pensions give an overall coverage rateof just over 50 per cent and confirm a noticeably lowercoverage rate among women. This difference is smaller than
155
Income support for older people
Chapter 05 17/09/2007 16:52 Page 155
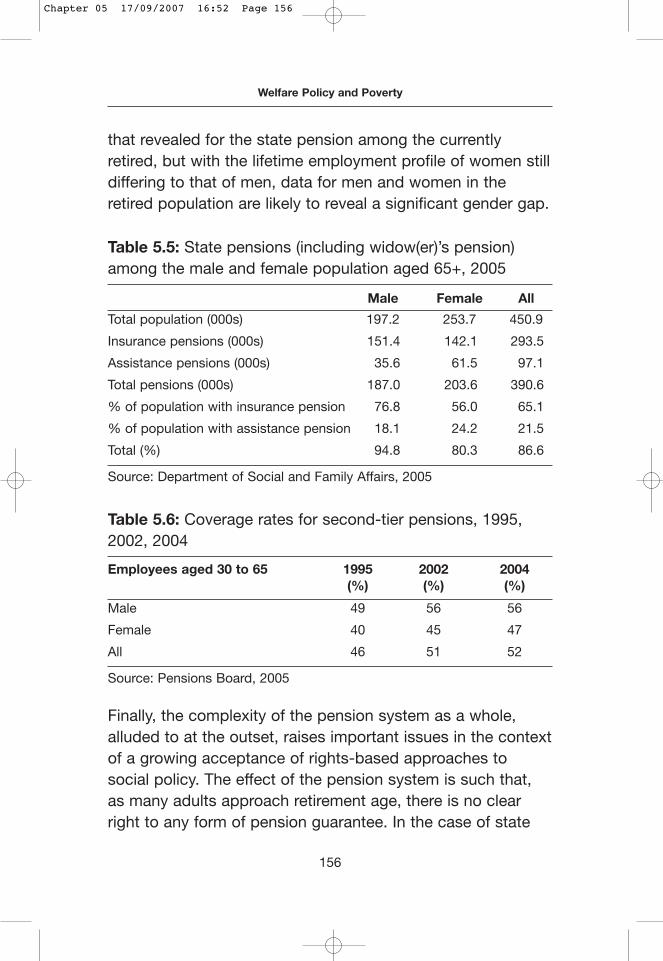
that revealed for the state pension among the currentlyretired, but with the lifetime employment profile of women stilldiffering to that of men, data for men and women in theretired population are likely to reveal a significant gender gap.
Table 5.5: State pensions (including widow(er)’s pension)among the male and female population aged 65+, 2005
Male Female All
Total population (000s) 197.2 253.7 450.9
Insurance pensions (000s) 151.4 142.1 293.5
Assistance pensions (000s) 35.6 61.5 97.1
Total pensions (000s) 187.0 203.6 390.6
% of population with insurance pension 76.8 56.0 65.1
% of population with assistance pension 18.1 24.2 21.5
Total (%) 94.8 80.3 86.6
Source: Department of Social and Family Affairs, 2005
Table 5.6: Coverage rates for second-tier pensions, 1995,2002, 2004
Employees aged 30 to 65 1995 2002 2004(%) (%) (%)
Male 49 56 56
Female 40 45 47
All 46 51 52
Source: Pensions Board, 2005
Finally, the complexity of the pension system as a whole,alluded to at the outset, raises important issues in the contextof a growing acceptance of rights-based approaches tosocial policy. The effect of the pension system is such that,as many adults approach retirement age, there is no clearright to any form of pension guarantee. In the case of state
156
Welfare Policy and Poverty
Chapter 05 17/09/2007 16:52 Page 156
pensions, a higher proportion of the population is likely in thefuture to obtain a state insurance pension. The rules aboutentitlement are so complex, however, that many may judgetheir future entitlements incorrectly and make financial andother decisions accordingly. Over time the real value of thispension has risen, although there is no statutory indexation ofpension levels, and its value relative to earnings fluctuatessomewhat. In the case of the state’s social assistancepension, the amount of any pension awarded is contingent ona number of variables (age, earnings, other income, spouse’sincome, for example). Also, the contribution rules for socialinsurance and the rules relating to social assistance change.This picture must be viewed alongside the uncertain returnsthat second-tier pensions may offer – in particular definedcontribution schemes. In effect, many of the pre-retired inIreland, and in particular women, have no clear rights inrelation to retirement income and no clarity about what theirincome in retirement is likely to be.4
The lack of a firm pension guarantee in some form issignificant in its own right but it has added importance in thelight of prospective developments in pension policy in thenear future. Policy-makers, it seems, are intent on expandingthe second tier of the pension system. The Pensions Boardintroduced the new PRSAs to enhance the take-up ofindividual private pensions, and more recently policy-makershave argued the merits of mandatory private pensions.Critically, the PRSAs are defined contribution in nature, so toowill be any new mandatory private pension: the value ofindividuals’ pensions will be determined by the return on the
157
Income support for older people
___________
4 This does not apply to the retired population with defined benefitoccupational pensions.
Chapter 05 17/09/2007 16:52 Page 157
funds. This will also be the case with the increasing numberof defined contribution occupational pensions. There areimportant social and economic arguments against sucharrangements, but if policy-makers wish to implement themthey should first ensure that first-tier pensions aresignificantly enhanced and that they confer clearer and morepredictable rights.
The future
The first – and very immediate – question is: what structuralchoices should Ireland make in the future? In other words,what cell in Table 5.2 should Ireland attempt to occupy? Theoptions in this regard have been well documented, and thearguments for and against each option have been fullyrehearsed (Commission on Social Welfare, 1986; McCashin,2004; Stewart, 2005; NPB, 1993; Pensions Board, 2005;Department of Social Welfare, 1977). This writer argues thatthe core of the future pension system should be the statepension, and that this first tier should be substantiallyimproved. An acceptance of this argument could imply anumber of variants, but in the context of the specific optionsraised in the Pensions Board’s recent reports it suggests thatthe state pension should be raised to 50 per cent of averageearnings, with an immediate impetus towards this target, andwith the budgetary costs offset by a reduction in the taxexpenditures on private and occupational pensions.
What is the reasoning behind this argument, and why are theoptions of voluntary or mandatory second-tier pensions notappropriate in the Irish context? Briefly, reducing pensionerpoverty among current pensioners requires a substantialincrease in the short term in the state pension. Even if
158
Welfare Policy and Poverty
Chapter 05 17/09/2007 16:52 Page 158
coverage could be substantially improved in the currentworkforce, the impact of improved coverage on pensioners’incomes would not materialise until they retire. It is alsoimportant to stress that the coverage of the state pensionsystem, unlike that of second-tier pensions, is high andcontinuing to rise. When the qualified adults of state pensionrecipients are included, state pensions affect the incomes ofover 90 per cent of the older population.5 It should be notedtoo that a detailed analysis of the composition ofpensioners’ incomes showed that ‘State social securitypayments were the main sources of retirement income’(Stewart, 2005, p. 35). Therefore, because of the coverage ofthe state pension and the relative importance of incomefrom this source, it offers the greatest scope to improve theincomes of older people.
The argument advanced here will be contested on tworelated counts. In the first instance, the question of thesustainability of a more generous state pension is critical, asthe Pensions Board has pointed out. Ireland’s currentsituation is one where the share of the population hasremained remarkably stable, as Table 5.7 indicates, andwhere the cost of state pensions as a share of nationalincome has declined. Furthermore, there is no demographicchallenge of a substantial rise in aged dependency loomingin the near or medium-term future, as the Pensions Board’spopulation projections show (Pensions Board, 2005). In fact,recent academic research is careful to point out that anyprojections about the size and age structure of the Irish
159
Income support for older people
___________
5 Only qualified adults on contributory state pensions and over 66 yearsof age are included. Qualified adults of state pension (non-contributory)are mainly under 66 years.
Chapter 05 17/09/2007 16:52 Page 159
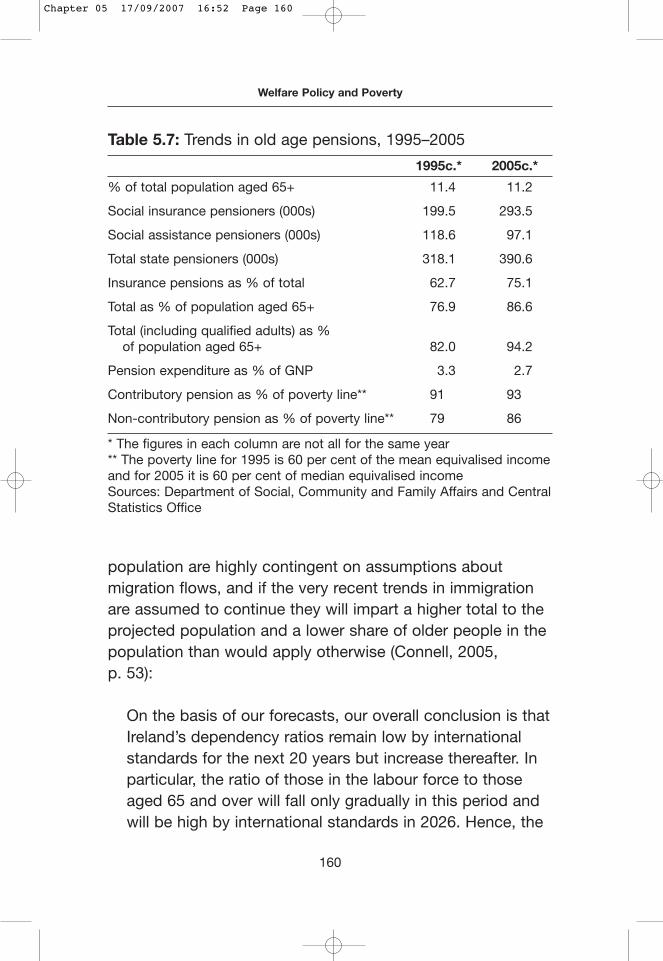
population are highly contingent on assumptions aboutmigration flows, and if the very recent trends in immigrationare assumed to continue they will impart a higher total to theprojected population and a lower share of older people in thepopulation than would apply otherwise (Connell, 2005, p. 53):
On the basis of our forecasts, our overall conclusion is thatIreland’s dependency ratios remain low by internationalstandards for the next 20 years but increase thereafter. Inparticular, the ratio of those in the labour force to thoseaged 65 and over will fall only gradually in this period andwill be high by international standards in 2026. Hence, the
160
Welfare Policy and Poverty
Table 5.7: Trends in old age pensions, 1995–2005
1995c.* 2005c.*
% of total population aged 65+ 11.4 11.2
Social insurance pensioners (000s) 199.5 293.5
Social assistance pensioners (000s) 118.6 97.1
Total state pensioners (000s) 318.1 390.6
Insurance pensions as % of total 62.7 75.1
Total as % of population aged 65+ 76.9 86.6
Total (including qualified adults) as % of population aged 65+ 82.0 94.2
Pension expenditure as % of GNP 3.3 2.7
Contributory pension as % of poverty line** 91 93
Non-contributory pension as % of poverty line** 79 86
* The figures in each column are not all for the same year** The poverty line for 1995 is 60 per cent of the mean equivalised incomeand for 2005 it is 60 per cent of median equivalised incomeSources: Department of Social, Community and Family Affairs and CentralStatistics Office
Chapter 05 17/09/2007 16:52 Page 160
issue of the cost of medium pension payments [sic] is notas important for Ireland as for some other countries.
Another argument about the proposed improvement to thestate pension is a qualitative one: that the future pensionsystem should be less reliant on pay-as-you-go (PAYG)systems (with pensions paid out of current revenues) andshould shift to funded pensions (where they are paid out offunds saved and invested prior to retirement as in the case ofPRSAs or mandatory private provision). This is a complex andcontroversial issue. In this context, it is important to note thatthere is little agreement on it in the theoretical and empiricalliterature. The most recent academic synthesis of thearguments and evidence concludes that funding as a pensionstrategy is not, a priori, to be preferred to a PAYG system(Barr, 2001). It is more important, however, to note theempirical evidence that funding does not seem to generateimproved economic performance, as is claimed by itsproponents, while comprehensive PAYG systems may be more effective at poverty reduction. As recent analyses of thefunding versus PAYG choices in Ireland suggest, the balanceof the argument and the empirical evidence internationallywould not support the adoption of funding strategies such asPRSAs and mandatory private provision (McCashin, 2004;Stewart, 2005).
Whatever the outcome of the continuing debate about thestructure of the pension system, there are two specificneglected issues that arise in pensions. The analysis ofpension levels in the Pensions Board’s reports and in theaccompanying commentary and critique of these has focusedon a target for the level of the contributory pension expressedas a proportion of average earnings. This type of target (forexample 34 per cent of average earnings in the 1998
161
Income support for older people
Chapter 05 17/09/2007 16:52 Page 161
Securing Retirement Income) was identified as one that iscompatible with the goal of achieving a replacement rate of 50per cent of pre-retirement earnings for retired workers whenthe contributory pension is supplemented with a second-tierpension; the target assumes that the state pension will besupplemented with a second-tier pension for medium to highearners. Arguably, the next phase of pension reform shouldfocus on targets related to relative income poverty. Theconcentration of older persons in the lower income groupsand their risk of poverty justify a target chosen on the basis ofpoverty-reduction goals. This approach is now possible, as the annual EU-SILC survey data allow pension levels to bebenchmarked against a representative indicator of incomes inthe economy. A related issue is the non-contributory pension.It is further below the poverty line than the contributorypension. While the role of this means-tested pension in thepension system is declining – 22 per cent of the olderpopulation receive it – future pension policy needs to integratethis pension into the development of targets about pensionlevels and poverty reduction.
The question of gender and access to pensions has beenlargely neglected since the introduction of the formal equalitymeasures in social security and occupational pensions.However, the data in Tables 5.5 and 5.6 show that a gendergap in direct access to old age pensions persists. This maynarrow over time as the pension system begins to reflectincreasing rates of female labour force participation;furthermore, the option for spouses to receive their share ofthe state pension personally (administrative individualisationintroduced in 2002) will also widen access to state pensions.Spouses of pensioners will also benefit from the raising of theallowance for spouses to the rate for the non-contributory
162
Welfare Policy and Poverty
Chapter 05 17/09/2007 16:52 Page 162
state pension.6 There is still a need, however, for the statesocial insurance pension to be reviewed so that more womenbecome recipients of social insurance pensions – thesepensions are at the core of the state pension regime.
Finally, while this chapter is concerned primarily with pensions,these can only be viewed in the light of wider issues affectingolder people. The potential to view pensions in anappropriately broader context is very real in view of thelifecycle framework outlined in the NESC’s The DevelopmentalWelfare State (DWS) and incorporated in Towards 2016, thecurrent national partnership agreement. The DWS model forthe future of social policy in Ireland – a model supposedlycompatible with achieving success in a competitive, globalisedeconomy – would comprise the following: a range of universalservices, sensitive activation measures and a participation-based income support system. Achieving this model will inturn, according to the NESC, require attention to five aspectsof policy development: governance and leadership, rights andstandards, integration at local level, operational effectivenessand support for people over the lifecycle (NESC, 2005). TheNESC document is silent about the detail of policy, whileTowards 2016 expresses a vision of older people beingenabled ‘to maintain their health and well being, as well as tolive active and full lives, in an independent way, in their ownhomes and communities for as long as possible’ (Ireland, 2006, p. 60). Towards 2016 also lists a range of very specificcommitments and targets, spanning housing, healthcare,mobility, employment and so on.
163
Income support for older people
___________
6 The National Action Plan for Social Inclusion 2007–2016 contains aspecific commitment that this will be implemented by 2009 (Ireland,2007).
Chapter 05 17/09/2007 16:52 Page 163
Against this background of a move towards a more coherentapproach to older people and the retired, and an approachframed in terms of active participation in society, a range ofquestions arise about the substance and governance ofpension policy. These are too numerous to be dealt with here,but two key points illustrate the implications for policy-makers of pursuing this lifecycle approach. While pensionsare clearly an important aspect of older people’s welfare, it isno longer obvious that pension policy and analysis should beat one remove from wider debates about the cost of long-term care, health insurance and other issues. Pensionplanning – at both personal and societal levels – is technicaland esoteric, and for this reason the detail of pension policyformulation requires distinct expertise and, perhaps, aseparate structure such as the Pensions Board. However,there is clearly a need for deliberation on pensions to beintegrated into an overall analysis of the needs of olderpeople and for some overarching structure that delivers whatthe NESC terms ‘governance and leadership’; it is notable,for example, that the DWS report calls for an overall nationalplan for older people (NESC, 2005, p. 222).
Some of the issues raised in this chapter – and others thatare implicit – illustrate the need for greater policy integrationin the future. Poverty is defined in this chapter in terms ofrelative income poverty, and therefore poverty among olderpeople, defined in these terms, is de facto about pensionpolicy. However, the levels of poverty are significantlydifferent (in fact, significantly lower) if measured in terms ofdeprivation as recorded by the Central Statistics Office. Thepoint here is not to argue the relative merits of income-basedpoverty lines and deprivation indicators in researchingpoverty in the general population, but to suggest that
164
Welfare Policy and Poverty
Chapter 05 17/09/2007 16:52 Page 164
research based on the needs of older people – rather thanthe incomes of older people – might generate a morenuanced picture of the levels and patterns of pensionerpoverty. In meeting the needs of older people, perhaps themost challenging questions for research and policy are todetermine how significant low income is as a predictor ofgeneral deprivation among older people, and to identify theimportance of improved pensions as opposed to enhancedhealth and social care services in improving the overallwelfare of older people.
This all implies that future policy and research should reflectthe experiences and views of older people themselves indefining what poverty and deprivation mean at this stage ofthe lifecycle. Furthermore, it raises questions about the utilityof general poverty reduction targets of the type outlined in theNational Action Plan for Social Inclusion 2007–2016 (Ireland,2007). This policy document also embraces a lifecycleapproach. However, it expresses its poverty-related goals interms of a reduction in consistent poverty for the populationas a whole to a figure in the 2 to 4 per cent range by 2012and to zero by 2016. In parallel, the plan offers a commitmentto maintain the lowest state pension at its real 2007 value,and also expresses very general aspirations about the widerpolicy goals for this stage of the lifecycle. A lifecycleapproach will require a more careful integration of genericpoverty targets with policy challenges affecting the olderpopulation specifically.
Finally, the lifecycle model in DWS has advanced to the pointwhere Towards 2016 expresses support for specific policychanges about retirement that have potentially importantimplications for pensions. Towards 2016 calls for a range ofmeasures that will facilitate and encourage older persons to
165
Income support for older people
Chapter 05 17/09/2007 16:52 Page 165
be socially involved, and to remain in the labour market ‘tomeet the challenge of an ageing society’ (Ireland, 2006, p.64). It also alludes to phasing-out the pre-retirementallowance for those aged 55 to 64 years and to the need forenhancing the skills of older/low-skilled workers to improvetheir employability. These prospective changes – and thecontext in which they are proposed – again illustrate sharplythe need for coherent policy formulation. The active ageingagenda presumes an increasing element of choice on the partof older people; the choice to be socially active afterretirement requires an adequate income and, perhaps, achoice of retirement age. Remarkably, the pension age for thestate pensions has remained unchanged since the late 1970s.None of the growth in the economy in the last decade hasmaterialised in the form of lower retirement ages for workersdependent on the state pension or any flexibility aboutretirement below the ‘pension age’. Nor has there been anyserious discussion about the topic – it is not mentioned, forinstance, in the relevant chapter in the National Action Planfor Social Inclusion.
The point at issue here is that discussion of retirement policyshould be framed, to begin with, in terms of pensionprovisions, and the next practical step to realising the visionof the National Action Plan for Social Inclusion and Towards2016 of an active, participating older population would be acommitment to reviewing the pension age within a broadlifecycle perspective. This is not to suggest that older workersshould not be encouraged to remain in employment: in fact,once population ageing gets underway and pension costsbegin to rise, increasing the size of the workforce by raisingthe average age of retirement would be a rational policyresponse. However, the danger inherent in the Towards 2016
166
Welfare Policy and Poverty
Chapter 05 17/09/2007 16:52 Page 166
perspective is that low-income workers in the boom economymay retire into a regime where an even higher pension agemight apply. An activation ethos focused on maximising workparticipation has permeated social policy generally in the lastdecade (see Chapter 4). Whatever about the rationale andimpact of this activation strategy on the labour market ingeneral, there are no grounds for supposing that it should beapplied on a general basis to older, low-income workers. Thiswould represent a triumph – and an unnecessary one – ofeconomic calculation over wider social objectives.
References
Barr, N. (2001), The Welfare State as Piggy Bank. Information, Risk,Uncertainty and the Role of the State, Oxford: Oxford University Press
Bonoli, G. and Shinkawa, T. (2005), ‘Population Ageing and the Logics ofPension Reform in Western Europe, East Asia, and North America’, inBonoli, G. and Shinkawa, T. (eds.), Ageing and Pension Reform Aroundthe World. Evidence from Eleven Countries, Cheltenham: Edward Elgar
Central Statistics Office (2006), ‘EU-SILC 2005’: www.cso.ie/eusilc(accessed 16 November 2006)
Commission on Social Welfare (1986), Report, Dublin: GovernmentPublications
Connell, P. (2005), ‘Demographic Projections. Diffusing the Time Bomb’, inStewart, J. (ed.), For Richer, For Poorer. An Investigation of the IrishPension System, Dublin: New Island
Department of Social and Family Affairs (2005), Statistical Information onSocial Welfare Services 2005, Dublin: DSFA
Department of Social Welfare (1977), A National Income-Related PensionScheme, Dublin: Government Publications
Hughes, G. (2001), ‘The Cost and Distribution of Tax Expenditure in theRepublic of Ireland’, in Feldstein, M. (ed.), Thirty-First Geary Lecture,Dublin: ESRI
ILO (2000), Social Security Pensions: Development and Reform, Geneva:International Labour Organization
167
Income support for older people
Chapter 05 17/09/2007 16:52 Page 167
Ireland (1999), Programme for Prosperity and Fairness, Dublin: StationeryOffice
Ireland (2006), Towards 2016. Ten-Year Framework Social PartnershipAgreement 2006–2015, Dublin: Government Publications
Ireland (2007), National Action Plan for Social Inclusion 2007–2016,Dublin: Government Publications
McCashin, A. (2004), Social Security in Ireland, Dublin: Gill & Macmillan
National Pensions Board (1987), First Report of the National PensionsBoard, Dublin: Government Publications
National Pensions Board (1989), The Tax Treatment of OccupationalPensions, Dublin: Government Publications
National Pensions Board (1993), Developing the National Pension System,Dublin: Government Publications
NESC (2005), The Developmental Welfare State, Dublin: NationalEconomic and Social Council
O’Riain, S. and O’Connell, P. J. (2000), ‘The Role of the State in Growthand Welfare’, in Nolan, B., O’Connell, P. J. and Whelan, C. T. (eds.),Bust to Boom? The Irish Experience of Growth and Inequality, Dublin:Institute of Public Administration
Pensions Board (1998), Securing Retirement Income, Dublin: PensionsBoard
Pensions Board (2005), National Pensions Review, Dublin: Pensions Board
Pensions Board (2006), Special Savings for Retirement, Dublin: PensionsBoard
Prunty, M. (2007), Older People in Poverty in Ireland: An Analysis of EU-SILC 2004, Dublin: Combat Poverty Agency
Second Commission on the Status of Women (1993), Report toGovernment, Dublin: Stationery Office
Stewart, J. (2005), ‘Incomes of Retired Persons in Ireland’, in Stewart, J.(ed.), For Richer, For Poorer: An Investigation of the Irish PensionSystem, Dublin: New Island
Whelan, C. T., Layte, R., Maître, B., Gannon, B., Nolan, B., Watson, D. andWilliams, J. (2003), Monitoring Poverty Trends in the Republic ofIreland: Results from the 2001 Living in Ireland Survey, Dublin: ESRI
168
Welfare Policy and Poverty
Chapter 05 17/09/2007 16:52 Page 168
Chapter 6
Education and poverty
Roland Tormey1
Education is central to development. It is the primaryvehicle by which economically and socially marginalizedadults and children can lift themselves out of poverty,better understand and improve their health, createsustainable livelihoods and obtain the means to participatemore fully in their communities.
(Ireland, 2006, p. 43)
Introduction
Although written with overseas development aid in mind, theabove quote effectively summarises the way in which manypeople in Ireland have come to view the role of education intackling poverty. The recognition that education can conferknowledge, skills, cultural and social capital and qualificationsthat can enable people to access better-paid employmentand to improve their life chances has often been central tothe belief that one of the key ways in which anti-poverty workcan be done is through improving educational outcomes. It is
169
___________
1 My thanks to Jim Gleeson, Claire W. Lyons and David Millar for theirassistance in the development of this chapter.
Chapter 06 17/09/2007 16:52 Page 169
no surprise then that the National Anti-Poverty Strategyexplicitly identified that, along with social welfare and taxsystems, ‘the education system has a key role to play inproviding a route out of poverty’ (Ireland, 1997, p. 6).
Research in Ireland and internationally has long identified anassociation between low levels of educational qualificationsand unemployment, as well as between educationalattainment and rates of pay (McCoy and Williams, 2000;Gorby et al., 2005). Research has also found that in times ofeconomic decline those without formal educationalqualifications are most likely to suffer job loss (figures quotedin Boldt and Devine, 1998), and that the gap in income andjob security between those with educational qualificationsand those without widens over time (NESF, 1997). In fact, thislinkage between education and future life chances may evenbe stronger in Ireland than is the case in many otherindustrialised countries (OECD, 1997). In such a context, it islittle surprise that so many people would place such anemphasis on the role of education in enabling people to liftthemselves out of poverty.
The difficulty, however, is that it is precisely those from poorand working-class backgrounds who fare worst within oureducation system and, despite forty years of governmentalattempts to address this relationship, a strong associationbetween poverty and low educational attainment persists.Young people in schools in areas designated asdisadvantaged have a greater risk of having significantreading difficulties when compared with the population as awhole (McDonald, 1998). Studies of school attendancehighlight that absenteeism is notably higher in schools inareas identified as having high levels of disadvantage than isthe case in schools in areas with the lowest levels of
170
Welfare Policy and Poverty
Chapter 06 17/09/2007 16:52 Page 170
disadvantage (Ó Briain, 2006). Following on from this, youngpeople from poverty backgrounds tend to leave school earlierand with fewer qualifications when compared with those fromnon-poor backgrounds (Gorby et al., 2005). Even whereyoung people finish school, there is evidence that studentsfrom working-class backgrounds take fewer honours subjectsat Leaving Certificate and achieve fewer points than thosefrom middle-class backgrounds (Power and Tormey, 2000;Gorby et al., 2005).
Worryingly, Archer and Weir (2004) conclude that althoughIrish intervention schemes to address educationaldisadvantage tend to be in line with international models ofgood practice and tend to be evidence-based in theirformulation, they show little evidence of actually having animpact upon the educational attainment of the targetedpopulations. This, they note (with some degree ofunderstatement), ‘may be regarded as disappointing’ (p. 31).
This issue is not one which has only recently emerged in Irishpolicy debates. Writing in the 1960s, the Investment inEducation team noted, ‘There are … inequalities in theparticipation in post-primary education of children at alllevels, based on social group and geographical location.There is, clearly, a need for public policy to concern itself withthese anomalies’ (OECD, 1965, p. 389). More than twenty-fiveyears later, the Conference of Major Religious Superiorsargued, ‘the continued existence of a link between educationand poverty represents the greatest single challenge facingour education system’ (CMRS, 1992, p. 99). Fifteen years onfrom this second pronouncement, and more than forty yearson from the first, it is arguable that the association betweenpoverty or social class and educational outcomes remains asmuch a feature of the Irish educational landscape as ever.
171
Education and poverty
Chapter 06 17/09/2007 16:52 Page 171
This is not to suggest that we are exactly where we were inthe 1960s or, indeed, in the early 1990s. It is clear that duringthe last forty years the attainment levels and participationrates of working-class and poor young people in educationhave improved significantly. The proportion of school-leaversfrom backgrounds of unemployment who went on to furtherstudy rose from 12 per cent in 1999 to 26 per cent in 2004,for example. Yet, as the learning attainment of working-classand poor young people improved since the 1960s so did thatof those from middle-class backgrounds, ensuring thatwhatever learning gains young people from poorbackgrounds made, they continued to be outpaced by theirmore advantaged counterparts. So, while the educationalgains made by those from unemployed backgrounds between1999 and 2004 are clearly impressive, they remain far behindthe participation levels of those from professionalbackgrounds (69 per cent of whom go on to further study),those from managerial/employer backgrounds (for whom thefigure is 63 per cent) and those from farming backgrounds(over 50 per cent) (Gorby et al., 2005; see also O’Connell etal., 2006). And here we come to the crux of the problem:disadvantage itself can be seen as a function of advantage.As long as there are those who can mobilise their resourcesto do better than others, there must, by definition, be thoseothers who do worse than them. And, as long as theeducational attainment of poor or working-class pupilsimproves, the advantaged either raise the bar or seek to findalternative routes of ensuring their advantage (Layte andWhelan, 2000). As Derman-Sparks has put it, ‘The meaning ofadvantage is the ghost that lurks within the meaning ofdisadvantage’ (2002, p. 59). In other words, it is preciselybecause education can play such a clear role in conferringcompetitive advantage upon learners that it is so hard to
172
Welfare Policy and Poverty
Chapter 06 17/09/2007 16:52 Page 172
address the glaring inequalities in educational outcomes thatcharacterise the system.
In this chapter I explore this conundrum in the Irish context.Beginning by exploring the different ways in which therelationship between poverty and educational outcomes (or‘educational disadvantage’ as this phenomenon tends to becalled) is defined and conceptualised in Ireland, I highlight theideological battle that is played out, often unnoticed, inattempts to address this phenomenon. I then explore one ofthe ways in which the relationship between education and lifechances has been understood in the international community,before using this as a lens to reflect back on what theseinternational debates can tell us about what we havepreviously missed in policy discussions in the Irish context.Ultimately, I argue that the quote at the beginning of thischapter may be misleading and that, rather than seeingpoverty as a function of educational disadvantage, we needto begin to recognise fully the ways in which educationaldisadvantage is a function of the relationship betweeneducation and the economy and, consequently, of economicinequality.
The non-debate about educational disadvantage
When writers start to ‘define their terms’, readers often startto skim through the pages. Definitional debates can appear tobe a fairly academic exercise in the worst sense of that term:sterile debates about words that have little impact on orrelevance for real lives. This is far from being the case withregard to the relationship between education and poverty.Definitional debates in this area are ideological debates whichimpact upon how targets are set and interventions are framedand, consequently, have a major impact upon people’s lives.
173
Education and poverty
Chapter 06 17/09/2007 16:52 Page 173
‘Educational disadvantage’ is the term that is commonly usedto designate the fact that there exists a relationship betweenthe background of learners and their educational attainmentand participation. On the one hand, it is arguable that themeaning of this term should be relatively uncontested giventhat it is defined in law. Section 32, paragraph 9 of theEducation Act 1998 identifies that the term educationaldisadvantage means ‘the impediments to education arisingfrom social or economic disadvantage which preventstudents from deriving appropriate benefit from education inschools’. On the other hand, however, O’Sullivan has notedthat there are many different processes implied by differentpeople in the use of this common term, and that itswidespread usage must be thought of as representing a‘phoney consensus’ or an exercise in avoidance (1999, p. 18).He argues further that the use of this common term in thepolicy process by people who mean different things by itrepresents a process of ‘pastiche’-making, through whichtraces of different understandings become merged and mixedin a manner which ignores or hides the dynamic contestationbetween different positions and, as such, denies thepossibility to think critically about these different positions(2005, p. 319).
O’Sullivan is not the first to draw attention to differentpositions relating to educational disadvantage. There arenumerous accounts within the Irish literature alone which usethe deficit/difference categorisation to identify differentapproaches to educational disadvantage (for example CMRS,1992; Drudy and Lynch, 1993; Kellaghan et al., 1993; INTO,1994). This two-fold categorisation is based on identifyingwhat is seen as being the ‘cause’ of educationaldisadvantage. The ‘deficit’ perspective focuses on a
174
Welfare Policy and Poverty
Chapter 06 17/09/2007 16:52 Page 174
presumed deficit in the family or community of thedisadvantaged person such as particular patterns ofparent–child interaction, neglect or abuse, a culture ofpoverty or an urban ghetto. The ‘difference’ perspectiveidentifies cultural difference or dissonance as being theprimary cause for educational disadvantage. The focus hereis on the cultural capital that is valued by the school(Bourdieu and Passeron, 1977) including the languagechoices the school makes (for example Tizard and Hughes,1984) or on the style of teaching and thinking that the schoolchooses to value.
Although this two-fold division is the standard analyticalframework that is applied to educational disadvantage in theliterature – both in Ireland and internationally – it remainsquite limited in its utility. Any attempt to categorise does, ofcourse, do some degree of violence to the different positionsthat are categorised together, but the task must be toproduce a system of categorisation that can capture adiversity of positions without leaving the area so complex asto render the approach useless. The deficit/difference modeltends to render problematic any attempt to make sense ofthe relationships between and within what are referred to ascommon positions. By reducing a number of diversepositions to just two, the deficit/difference model avoidspastiche but becomes something of a parody. O’Sullivan(1999, 2005) presents a more complex model, with sixdifferent positions which are covered by the term ‘educationaldisadvantage’. These are:
• A sense of the constitutional limitations of the person, thatis identifying that people who are educationallydisadvantaged have a low intellectual capacity
175
Education and poverty
Chapter 06 17/09/2007 16:52 Page 175
• A sense that the socialisation of pre-school childrenmakes them unable to benefit fully from the educationoffered by school and as such leaves them with apersonal deficit
• A sense that the cultural environment of some children isdeficient and that this cultural deficit leads to themdeveloping anti-school and antisocial attitudes and values
• A sense that schooling practices can be derived from amiddle-class culture and, as a consequence, can beculturally irrelevant to working-class pupils or at leastdiscontinuous with their home culture in a way that is nottrue for middle-class pupils
• A sense that the material condition, the wealth or poverty,of the pupil’s community impacts upon their housing, theirhealthcare and, consequently, on their school conditions
• A sense that inequality is a function of the politicaleconomy of our society, and that disadvantage existsbecause some parents are in a position to give theirchildren an advantage in society (through education)thereby placing others at a disadvantage.
For O’Sullivan, the purpose of exploring these diversepositions as diverse positions is precisely that the interplaybetween them generates critical thinking about them. Oneway into this massive task is to look at the way in whichdebates concerning the measuring of educationaldisadvantage have played out, a task I have exploredelsewhere (Tormey, forthcoming) and which I will summarisehere. Although this has the disadvantage of returning to abinary model of thinking about the issues, it does at leastallow one part of the web of oppositions implicit inO’Sullivan’s typology to be explored in greater depth.
176
Welfare Policy and Poverty
Chapter 06 17/09/2007 16:52 Page 176
Throughout the 1990s the measurement of educationaldisadvantage became a key issue as governments sought toquantify the problem in order that progress or a lack ofprogress in addressing the problem could be clearly identified(for example Kellaghan et al., 1995; NESF, 1997; the range ofattempts are summarised by Boldt and Devine, 1998). Powerand Tormey (2000) identify that, broadly speaking, twodifferent sorts of measurement models were used: an outputsmodel which focused on setting minimum standards ofattainment deemed appropriate and then identifying asdisadvantaged those whose attainment fell below theselevels; and a comparative model which sought to identifysystematic differences between social groups in participationor attainment across the educational system. Those using anoutputs model may, for example, identify that those who fallbelow a certain standard on a reading test or those who leaveschool without five passes in the Leaving Certificate areeducationally disadvantaged (for example Crooks and Stokes,1987). A more complex variant of the same approach is toidentify those whose educational attainment falls below acertain level and who are also poor as being educationallydisadvantaged (for example Kellaghan et al., 1995). Thoseusing a comparative model on the other hand will tend tolook for systematic differences between social groups, suchas by exploring how the attainment or participation rates ofpupils of working-class or unemployed parents compareswith those of pupils of middle-class or professionalbackgrounds (for example Clancy, 1995; Clancy and Wall,2000; Power and Tormey, 2000; Gorby et al., 2005; O’Connellet al., 2006).
The outputs approach tends to focus on low levels ofeducational attainment by poor pupils, and, in line with the
177
Education and poverty
Chapter 06 17/09/2007 16:52 Page 177
maxim ‘that which gets measured gets addressed’, thosewho use this approach tend to look for interventions that areaimed at raising the level of educational attainment by thesepupils. As discussed in the introduction, this tends to ignorethe capacity for pupils from middle-class or professionalbackgrounds to raise their own levels of attainment andparticipation as necessary in order to protect theircompetitive advantage or to find alternative routes ofconferring advantage upon themselves, such as the use ofsocial networks. In this respect, the outputs approach tomeasurement is associated with a conservative politicalposition that seeks to work upon the ‘disadvantaged’ whileignoring the role that the ‘advantaged’ play in the creationand perpetuation of inequality in educational attainment andlife chances. The comparative approach on the other hand isassociated with a more liberal and egalitarian political modelthat draws attention to both the role of advantage anddisadvantage and the relationship between the two.2
The tendency to see such measurement positions as atechnical debate, only of concern to those with an interest ineducational statistics, allows the truly political nature of thedecisions about measurement to be obscured (Tormey,forthcoming). In this context it is notable that, while the statehas often used a language which draws on liberalconceptions of equality, the targets that have been set inrelation to educational disadvantage have been politicallyconservative output measures (see Ireland, 1997, 2002).Indeed, this process continues to be evident today, with atleast some of the targets set for the National Action Plan for
178
Welfare Policy and Poverty
___________
2 See Lynch (1999, p. 55ff) for a critical account of this liberal politicalapproach to the measurement of educational inequality.
Chapter 06 17/09/2007 16:52 Page 178
Social Inclusion 2007–2016 being little more than re-heatedversions of previous output measures (Ireland, 2007). While the1997 National Anti-Poverty Strategy set a target of 90 per centof students completing senior cycle by 2000, and 98 per centby 2007, this was later revised downwards to 85 per centschool completion by 2003 and 90 per cent by 2006 (Ireland,1997, 2002). These targets, which have been repeatedlymissed, have now once more been presented in the NationalAction Plan for Social Inclusion 2007–2016, which has set asone of its goals that it will ‘Work to ensure that the proportionof the population aged 20–24 completing upper second-leveleducation or equivalent will exceed 90 per cent by 2013’(Ireland, 2007, p. 33).
There is then, as O’Sullivan (1999) suggests, a need to getbeyond the phoney consensus on educational disadvantageand make sense of the different positions that are hiddenbehind the term. These different positions do not just reflect anacademic debate but also demonstrate widely divergentpolitical perspectives on how educational disadvantage iscaused, on the nature of the problems to which it gives rise, onhow it is to be measured and on how it is to be addressed.These issues should not be treated as technical questions tobe addressed by experts but should be recognised as beingdeeply political and having a real impact upon how the statecomes to intervene to address educational disadvantage. Inthis context, the tendency towards pastiche that O’Sullivandescribes has real political effects.
The international perspective(s)
There have been a number of attempts to identify how we inIreland can learn from the international experience of
179
Education and poverty
Chapter 06 17/09/2007 16:52 Page 179
educational disadvantage. As such there is a body of Irishliterature that looks at the international experience ofinterventions to address low attainment by poor ordisadvantaged pupils (see Kellaghan et al., 1995; Archer andWeir, 2004). It is therefore instructive to choose a perspectivethat has not been used as a lens through which to thinkabout educational policy in Ireland. In this section I will lookat the international debates on the role of educationalmarkets in the perpetuation of inequality, particularly withinthe context of neo-liberal or ‘new-right’ educational policyreforms in many English-speaking countries.
While there is no single new-right reform package ineducation, the reforms that happened in the UK, US, Australiaand New Zealand since the 1980s tended to draw from asimilar menu. At the core of the neo-liberal educationalreforms internationally is the generation of markets ineducation through creating a ‘choice’ for parents (or ‘clients’)as to where to have their children educated. In contexts inwhich the state had played a strong role in overseeing andmanaging schools, management was handed back to schoolsand they became ‘self-managing’. Alongside this, parentswere encouraged to make choices as to where to send theirchildren to school. In order to facilitate this choice, a numberof countries moved to produce comparisons between schools(‘league tables’) that would provide parents with informationupon which to base their decision. While many countries hadseen ‘school zoning’ in the 1960s in order to ensure a socialmix within schools and to combat segregation in education,neo-liberals now promoted the removal of such zoning inorder (they said) to enable those in disadvantaged areas(often city-centre areas) to move into more successful(middle-class, suburban) schools (Coleman, 1990). The
180
Welfare Policy and Poverty
Chapter 06 17/09/2007 16:52 Page 180
implications of these policies are hardly surprising in thecontext of the operation of markets: those schools that scorewell on the league table are expected to attract pupils andthe resources which go with them. Those that score poorlyare expected to attract fewer pupils and consequently fewerresources. This, it was envisaged, would ensure that‘excellent’ schools grow, while ‘failing’ schools are motivatedto improve or will, eventually, be shut down and removedfrom the market.
It is worth remembering that this new-right reform movementfor education did not develop in a vacuum, but as a responseto existing educational ideas. As Brown (1990) observes, thediscourse of educational reform since the end of World War IItended to focus on ideas of equality and meritocracy ineducation. In Britain, this meant increased investment ineducation and, in the 1960s, a move towards comprehensiveeducation in order that working-class pupils and middle-classpupils would be educated side by side rather than in separateschools. The US in the same period, and following on fromthe Brown v. the Board of Education of Topeka (1954)Supreme Court ruling, also saw an end to segregatedschooling. In New Zealand in the 1950s a school zoningpolicy was introduced in order to promote equality ofeducational opportunity (Olssen et al., 2004). As Brown (1990)argues, the end result of this series of policies, in the UK atleast, was an improvement in educational standards and areduction in gender-based and social-class-based inequalitiesin education.
Brown goes on to argue that, in this context, neo-liberalreforms should be seen as undermining the principles ofequality of educational opportunity. His position is vigorouslysupported by a number of authors who argue that school
181
Education and poverty
Chapter 06 17/09/2007 16:52 Page 181
choice simply facilitates middle-class parents, who havegreater freedom of movement due to better transportation(Apple, 2000), as well as a discourse of choice more suited togaining advantage in the educational market (Ball et al., 1995;Gewirtz et al., 1995). Edwards and Tomlinson (2002, cited inOlssen et al., 2004) have also argued that when ‘desirable’schools become over-subscribed the processes of ‘choice’become reversed and schools are able to select pupils ratherthan the other way around. These authors argue that theprocess of choice is far more complex than the sort of‘rational choice’ model implied by neo-liberal proponents ofmarkets in education and that the increase in choice has ledto greater segregation of schools and greater inequality.
While Gorard et al. (2003) find that segregation in schoolsactually fell a little after the market-based reforms in Englandand Wales, they also identify that, from the mid-1990s,segregation increased again in England, but not in Wales. Assuch, they argue that parental choice may have had someimpact on lessening segregation by allowing poorer parentsto opt out of weak local schools. Ultimately, however, thisimpact was limited and short-lived (Gorard and Fitz, 2006).
In English-speaking countries other than Ireland, policydebates in relation to poverty-based and social-class-basedinequalities in education have been dominated for the lastfew decades by the politics of markets and of choice. Forsome, such policies are seen as an assault on the egalitarianideas associated with an earlier period of educational reform.For others, they are a means to overcome bureaucratic andinefficient modes of school governance and, consequently, toreduce restrictions on poorer parents, which may in turncontribute to inequality. While there is sometimes bitterdisagreement between these two positions, it is broadly
182
Welfare Policy and Poverty
Chapter 06 17/09/2007 16:52 Page 182
accepted by all that social segregation in schools isundesirable and, ultimately, that the data do not show marketsystems significantly lessening social segregation, but insteadthat they can facilitate practices of segregation. If this is thelens through which equality issues in education have beenviewed internationally since the 1980s, how can this lens helpus make sense of the Irish context?
Markets and choice in education in Ireland
It is a widely held belief that Ireland has successfully resistedthe new-right educational reform movement since the 1980s.Education for a Changing World: Green Paper on Education(Ireland, 1992) represented a clear movement towards new-right thinking in relation to education (Halton, 2003) and washeavily criticised for its right-wing assumptions by almost theentire educational community (for example Drudy and Lynch,1993). A subsequent change in government (with thereplacement of a very pro-enterprise government with aLabour–Fianna Fáil government, and the appointment of aLabour Party Minister for Education) led to a movement to re-appraise the foundations of the green paper, through thecalling of a National Education Convention (1994). ThisConvention, which drew together the major players in Irisheducation, re-emphasised the existing values base of theeducation system and the shift to the right seemed to behalted.
Hogan (2000) suggests that the employment of this distinctivepartnership model led to Ireland taking a different path to thatof other English-speaking countries at the time. And, whilethere has undoubtedly been a growth in the tendency to referto the education system in terms of its ‘clients’ and
183
Education and poverty
Chapter 06 17/09/2007 16:52 Page 183
‘customers’ (such as in the Department of Education andScience’s ‘Customer Service Charter’ and successivestrategy statements), and in pressure from media sourceseither to publish league tables or to release data which wouldenable them to produce their own crude league tables,Hogan argues that the Education Act 1998 and the TeachingCouncil Bill (which became the Teaching Council Act 2001)reflect Ireland’s decision not to follow the neo-liberal road.The ongoing opposition to the demands for information thatmight allow crude league tables to be constructed onlyreinforces this perception. There is a sense that Ireland haslargely escaped the new-right educational reforms found inthe rest of the English-speaking world, that we have, asHogan puts it (following Robert Frost), taken the road ‘less travelled by, / And that has made all the difference’(2000, p. 19).
Yet the educational reforms found in Ireland, like otherselsewhere, must be seen in their particular and historicalcontext. While in other countries the new right was aresponse to the liberal or left-leaning educational policiesenacted since the end of World War II, it can be argued thatin Ireland there had been few such left-leaning policies. Whileother countries had seen substantial movement towardscomprehensive or de-segregated education, Ireland had seenlittle that was comparable. Although there had certainly beena growth in educational provision at post-primary level sincethe late 1960s, this was not matched by structural reformsuch as a move towards comprehensive education that mightlessen the extent to which the school system wassegregated. Indeed, while there were some attempts tointroduce first comprehensive, then community, schools inIreland in the 1960s and early 1970s, this was something
184
Welfare Policy and Poverty
Chapter 06 17/09/2007 16:52 Page 184
which was always weakly promoted and conceptualised(O’Sullivan, 2005) and did not materialise to anything like theextent envisaged by various government ministers. While thisperiod did see greater access to schools for young peoplefrom poor or working-class families, this access was notfollowed up with the economic resources (see Lee, 1989) orthe cultural change in schools that might have signalled aserious attempt to generate greater equality. As a result,Ireland continued to have a system that allowed forsignificant segregation between secondary/academic andvocational streams (Barber, 1989, p. 84).
Indeed, while the 1980s were marked in other countries bypolicies aimed at increasing local management of schoolsand the generation of a market in education, Ireland alreadyhad locally managed schools and a fully functioning market.Local management of schools has historically been central tothe Irish system of educational management (Coolahan, 1981)and, as O’Sullivan has pointed out, in Ireland, ‘parents havealways been free to seek a place in the school of their choicefor their children’ (2005, p. 168). In urban areas, he notes, thepractice of sending children to schools other than the localone is common and widespread and, even in rural areas, hecites evidence of such practices since the 1960s. It has beenestimated, he says, that one-half of all second-level studentsdo not attend their nearest school. There is also anecdotalevidence that some schools that welcome children from theTraveller community experience a decline in enrolments asparents avail of the market and ‘choose’ to segregate theschool system. Indeed, the suspicion that schools areengaging in informal exclusionary practices recently led theMinister for Education Mary Hanafin to moot the idea of anaudit of school enrolments to identify if some schools show
185
Education and poverty
Chapter 06 17/09/2007 16:52 Page 185
comparatively low levels of children from minority ethnicgroups (Irish Examiner, 29 August 2006), and to identify thatthis audit is showing some informal exclusionary practices(Irish Examiner, 10 October 2006). Smyth’s research, basedon over one hundred schools and 10,000 pupils, has shownthe educational impact of such segregation (1999, p. 49, p.70):
The social class mix (average social class) within a schoolhas a significant impact upon pupil performance [at JuniorCertificate level] … Pupils in predominantly middle classschools tend to have higher exam scores than those inpredominantly working class schools, even when their ownsocial background is taken into account … The socialclass mix of a school has a significant impact uponLeaving Cert grades. Those in predominantly working classschools tend to make less progress over Senior Cycle,relative to their performance at Junior Cert level.
So, while Halton (2003) argues that the new-right tendenciesin Ireland in the early 1990s were associated with theinfluence of the OECD, O’Sullivan (2005) points out thatIreland needed little impetus from any external forces tooperate the education system upon right-wing lines. Putsimply, Ireland did not need new-right educational reformswhen the educational system already operated on the basisof old-right principles. Yet, while inequality debatesthroughout the English-speaking world have focused on suchpractices for the last few decades, this topic has beenremarkably absent from such debates in Ireland. This begsthe question, if these practices are not the subject of thediscussions on the relationship between education andpoverty, what is?
186
Welfare Policy and Poverty
Chapter 06 17/09/2007 16:52 Page 186
Understanding disadvantage and intervening
In Ireland, interventions to address educational disadvantageare characterised by two apparently contradictory principles.First, they tend to be scattered. Second, they tend to betargeted. I will look at these issues in turn.
The major interventions to address educational disadvantagein Ireland have included (see boxed text for further details):
• Designation of schools as being in areas of disadvantage
• Home–School–Community Liaison scheme
• 8–15 Early School-Leavers Initiative (followed by the ‘Stayin School’ Retention Initiative)
• Early Start
• Support Teacher Project (Teacher/Counsellor Project)
• Breaking the Cycle
• Giving Children an Even Break
• Educational Disadvantage Committee
• Education and Welfare Board
• DEIS (Delivering Equality of Opportunity in Schools).
In addition to these might be added the additional supportsprovided through resource teachers, visiting teachers forTravellers and so on. A review of the evaluations of many ofthese initiatives has been undertaken by Archer and Weir(2004; see also Weir and Archer, 2004). They note that someof these schemes show evidence of some successes(particularly when measured in terms of principals’ andteachers’ views of the schemes), and that many of theseschemes are in keeping with some aspects of internationalmodels of best practice, particularly with respect to parental
187
Education and poverty
Chapter 06 17/09/2007 16:52 Page 187
188
Welfare Policy and Poverty
Major schemes to address educational disadvantage
The school-based schemes aimed at addressing educationaldisadvantage in Ireland have been described and reviewed indetail by Archer and Weir (2004). A brief description of the majorschemes is included here.
• The designation of schools as being in areas of disadvantage(DAS) scheme began initially in 1984 but was formalised in1990. This scheme provides for concessionary teaching postsand additional grants to primary and post-primary schools,which are selected on the basis of a number of social,educational and economic indicators. It is broadly felt thatthis scheme does little more than bring income and resourcesof schools in designated disadvantaged areas to a levelcomparable to schools in more advantaged areas (Kellaghanet al., 1995).
• The Home–School–Community Liaison (HSCL) scheme alsobegan in 1990, with an initial fifty-five primary schools. It wassubsequently rolled out to other designated disadvantagedprimary schools and to post-primary schools. The schemeallows a teacher to be appointed full time to the task ofdeveloping a stronger relationship between parents andschools and between the school and its community. Weir andArcher (2004) note that the scheme has been evaluatedpositively by a number of researchers, particularly in relationto its impact upon parental involvement and on teachers’attitudes to parents.
• The Early Start initiative sought to provide early childhoodeducation in a targeted way to some schools in designateddisadvantaged areas. Three-year-old children were providedwith 2.5 hours of pre-school education either in the morningor afternoon throughout the school year. It was envisagedthat this would contribute to the development of the child andmake them more ‘ready’ for school. Practices in Early Start
Chapter 06 17/09/2007 16:52 Page 188
189
Education and poverty
have evolved significantly since the programme wasintroduced, in part due to issues raised in evaluations of thescheme.
• Like the HSCL scheme, the School Completion programmesought to identify the need for engagement from the widercommunity in addressing educational disadvantage. Ittargeted post-primary schools and their feeder primaryschools and provided resources which allow them to developinterventions to support those most vulnerable to droppingout of school. The programme explicitly highlights the needfor a multifaceted response to early school-leaving andidentifies the need for collaboration between the school andcommunity, youth and sporting organisations as well as withinstitutional representatives such as community gardaí, socialworkers, health board personnel and so on.
• The Teacher/Counsellor Project was set up in 1996 to assistin the management of disruptive or introverted pupils. It wasenvisaged that the designated teacher would play a role insupporting whole school work on behaviour, bullying etc., aswell as assisting individual teachers and pupils throughwithdrawal of particular pupils. The scheme received positiveevaluations that highlight its impact upon individual pupilsand on the whole school.
• Breaking the Cycle was introduced in 1995, following thereview of the DAS (Kellaghan et al., 1995). The 1995 reviewhighlighted that the criteria used to designate schools tendedto discriminate against rural schools. It also highlighted thatrural educational disadvantage was a significant issue. Inresponse, the Breaking the Cycle scheme allowed for differentcriteria to be used in selecting urban schools and clusters ofrural schools. The scheme provided extra resources toschools and allowed for the reduction of sizes in juniorclasses to about fifteen pupils per teacher. As with someother schemes, the views of principals and teachers tended
Chapter 06 17/09/2007 16:52 Page 189
190
Welfare Policy and Poverty
to be more positive than the objective and measurable dataseemed to support. There is some evidence that thosestudents selected for inclusion in rural areas did not includethe most disadvantaged, leading Weir and Archer (2004, pp.17–18) to conclude that it ‘may be the case also thatdisadvantaged pupils in rural areas are dispersed acrossschools rather than concentrated in a small number ofschools and, therefore, using the school as the level ofintervention may be inappropriate in rural areas’.
• The 1995 review of the DAS also made it clear that targetingresources at those schools that had the highestconcentrations of disadvantaged pupils in effect meant thatthe majority of disadvantaged pupils (who were not in suchconcentrated settings) were not being addressed at all. TheGiving Children an Even Break scheme sought to dispersefunding more widely in order to reach these students. Almostall schools that made returns under the scheme receivedsome additional funding and a smaller group were allocatedadditional staff. In rural areas, as with Breaking the Cycle,clusters of schools were addressed.
• In 2003, the plethora of schemes available meant that therewas a patchwork of provision rather than an integratedapproach to supporting those at risk throughout theireducational life. As a result, while some schools hostedalmost all of the available initiatives, others hosted only oneor two. In response the DEIS initiative (Delivering Equality ofOpportunity in Schools) was developed in order to provide amore integrated approach to targeting support at thoseschools which have the greatest concentration of educationaldisadvantage. It is envisaged that over a period of five years,Early Start, Giving Children an Even Break, the HSCLscheme, the School Completion programme and the DAS willall be integrated into a comprehensive school supportprogramme, under DEIS.
Chapter 06 17/09/2007 16:52 Page 190
and community involvement, class size reductions andadditional financial support. However, they also note that theschemes do not fare particularly well when measured in termsof objective measures of educational attainment. In thecontext of this mixed assessment they note: ‘In view of thisprogress, the fact that so few of the evaluations of existingschemes found evidence of gains in measured achievement… may be regarded as disappointing. The fact that theperformance of pupils in designated schools continues to fallso far below the performance of other pupils … will also beseen as disappointing’ (p. 31).
The diversity of programmes to address educationaldisadvantage led then Minister for Education Noel Dempseyto describe this list as a ‘menu of programmes frompreschool to lifelong learning’ (Educational DisadvantageCommittee, 2003, p. 5). O’Sullivan (2005) argues, instead,that the concept of pastiche is once more relevant here; aswith the conceptualisation of disadvantage, theseinterventions are something of a tangle of ideas drawn fromdifferent sources and placed alongside each other withoutallowing them to problematise each other or to contribute toa more adequate conceptualisation of the issues. Itcontributes to the impression that a lot is being done toaddress the problem, while at the same time obscuring thequestion as to why we have this problem in the first place.
The second characteristic of Irish responses to educationaldisadvantage is that most are targeted, based on the ideathat we should identify the disadvantaged and address theirspecific needs. As I have noted elsewhere (NESF, 2003), oneof the effects of such targeted responses is to focus attentionon the groups or individuals who are regarded as ‘failing’within the system rather than focusing on the system itself. It
191
Education and poverty
Chapter 06 17/09/2007 16:52 Page 191
should be remembered that the debate as to whethertargeting is even a useful response in the case of educationaldisadvantage remains an open one. Although educationaldisadvantage is often associated in people’s minds withurban areas and high-rise flat complexes, evidence fromKellaghan et al. (1995) notes that over 60 per cent of pupilsidentified as disadvantaged lived in small towns or the opencountryside. Therefore, it is worth taking note of Pringle’sassertion that ‘the concept of targeting is probably almostmeaningless in a rural context’ (1999, p. 271); this view issupported by the comments of Weir and Archer (2004) inrelation to the Breaking the Cycle scheme, cited above.
While targeting may enable us to reach those schools orareas with the greatest concentration of disadvantaged youngpeople, it will probably miss most of the disadvantaged. Insuch a context, interventions which aim to change theeducation system itself are perhaps more appropriate. Even iftargeting was to be defended as an appropriate means ofusing scarce resources (Kellaghan et al., 1995), its role indeflecting attention from systemic responses remains.
What might such systemic responses look like? For a startthey might begin by seeking to address those aspects of theeducational system that may be contributing to inequalities.This would probably involve some move towards acentralised or regional applications and allocations system forprimary and secondary education, which might work tocounter market forces and effectively to de-segregate theschool system. Such a centralised applications system hasalready been put in place in Limerick where a number ofstudents were refused entry by schools in the city (althoughthe focus of this system is not de-segregation as such). Theregional education boards proposed under a Labour Party
192
Welfare Policy and Poverty
Chapter 06 17/09/2007 16:52 Page 192

Minister for Education (Ireland, 1995) might well have been anappropriate regional vehicle for addressing this issuecountrywide, had they not been scrapped by the return topower of a Fianna Fáil–Progressive Democrats coalition.While parents would still be free to ‘buy’ themselves out ofsuch a public education system, it would at least mean thatthe public purse was not actually facilitating and funding thepromotion of inequalities.
A systemic approach would also see other issues, such asschool practices associated with inequality (like streaming orbanding), being addressed. In-career teacher development topromote more appropriate pedagogic models might also be apriority. Again, the education boards might well have played arole in this since they were envisaged as having a focus onpromoting equality of access, participation and benefit fromeducation, and specifically held a brief in relation to curricularprovision, provision of support services to schools andresolving disputes concerning enrolment.
It is notable that, of late, there is some evidence thatsystemic and structural issues are starting to be addressed inpolicy debates. The National Council for Curriculum andAssessment’s proposals in relation to the reform of SeniorCycle education are aimed at improving equality of outcomesthrough the creation of greater flexibility in pathways andaccreditation and a change in school culture which might bemore conducive to retention and attainment by thosestudents who currently do poorly (NCCA, 2005). Recent workby Archer and Weir (2004) for the Educational DisadvantageCommittee also reflects a move in the policy debate, in thattheir review of research into possible interventions to tackleeducational disadvantage addresses school-based factorssuch as teachers’ expectations of pupils and also highlights
193
Education and poverty
Chapter 06 17/09/2007 16:52 Page 193
issues of teacher in-career development. Perhaps we arebeginning to see a change in the content of the debatesaround education and poverty in Ireland. Whether this changein content will factor into a meaningful change in approach,however, remains to be seen.
Conclusions
At the outset I suggested that education is often promoted asa key means to remove people from poverty. The realityhowever is more complex, and it may be that it is preciselythe capacity of education to enable people to access wealthand resources in later life that ensures that those who havean advantage will use the resources at their disposal toensure their advantage is continued. This recognition – thatthe education system will tend to reflect the broaderinequalities in society – is what is often missed (or hidden) byapproaches that focus on the need to raise the educationalattainment levels of poor or working-class young people.
This is not to say that attempts to improve the education ofpoor or working-class young people are misguided – suchinterventions are necessary and even the minimum goals setby the government in social inclusion policies from the 1997National Anti-Poverty Strategy to the National Action Plan forSocial Inclusion 2007–2016 would be welcome were they tobe met. At the same time, these must be recognised asminimum standards and should not be thought of asinterventions that are aimed at greater levels of equality.Educational reforms can play a part, though the distributionof the disadvantaged throughout the country and the extentto which the current market-based structure of education islikely to be contributing to the problem suggests that those
194
Welfare Policy and Poverty
Chapter 06 17/09/2007 16:52 Page 194
responses should be focused on the education system ratherthan just targeted at individuals. At the same time,educational disadvantage is tied to social and economicpower and it cannot be addressed in isolation from thesefactors. Ultimately, we will need to confront the reality thateducational disadvantage is not just related to future povertybut is also an outcome of an unequal society.
This issue has long been identified in research by the ESRIand by Lynch (1999), but has long been ignored in policywork on educational disadvantage. Following on in that ESRItradition, Smyth and Hannan (2000, p. 113) suggest that:
If social groups continue to differ in their financial andcultural resources, then differences in educationalparticipation are likely to persist … Only in Sweden (and toa lesser extent, the Netherlands) has there been anysignificant reduction in inequality of educationalopportunity over time, a process that is attributable notonly to educational reform but also to diminishing socialclass differences in income and living conditions.
Put simply, in order to enable education to help lift people outof poverty, we may also need first to address our problem ofpoverty.
References
Apple, M. (2000), Educating the Right Way: Markets, Standards, God andInequality, London: RoutledgeFalmer
Archer, P. and Weir, S. (2004), Addressing Disadvantage, A Review ofInternational Literature and of Strategy in Ireland, Dublin: EducationalDisadvantage Committee
195
Education and poverty
Chapter 06 17/09/2007 16:52 Page 195
Ball, S., Bowe, R. and Gewirtz, S. (1995), ‘Circuits of Schooling: ASociological Exploration of Parental Choice of School in Social-ClassContexts’, The Sociological Review, vol. 43, pp. 52–78
Barber, N. (1989), Comprehensive Schooling in Ireland, Broadsheet SeriesPaper no. 25, Dublin: Economic and Social Research Institute
Boldt, S. and Devine, B. (1998), ‘Educational Disadvantage in Ireland:Literature Review and Summary Report’, in Doyle, P. (ed.), EducationalDisadvantage and Early School Leaving, Dublin: Combat PovertyAgency
Bourdieu, P. and Passeron, J.-C. (1977), Reproduction in Education,Culture and Society, London: Sage
Brown, P. (1990), ‘The ‘Third Wave’: Education and the Ideology ofParentocracy’, British Journal of Sociology of Education, vol. 11, pp.65–85
Clancy, P. (1995), Access to College: Patterns of Continuity and Change,Dublin: Higher Education Authority
Clancy, P. and Wall, J. (2000), Social Background of Higher EducationEntrants, Dublin: Higher Education Authority
CMRS (1992), Education and Poverty: Eliminating Disadvantage in thePrimary School Years, Dublin: Conference of Major Religious Superiors
Coleman, J. (1990), Achievement and Equality in Education, Boulder:Westview Press
Coolahan, J. (1981), Irish Education, History and Structure, Dublin:Institute of Public Administration
Crooks, T. and Stokes, D. (eds.) (1987), Disadvantage, Learning and YoungPeople: The Implications for Education and Training, Dublin: CDVEC,CDU and TCD
Derman-Sparks, L. (2002), ‘Disadvantage and Diversity: Untangling TheirRoles in Children’s Development and in Education’, in St Patrick’sCollege, Primary Education; Ending Disadvantage. Proceedings andAction Plan of the National Forum, Dublin: St Patrick’s College,Drumcondra
Drudy, S. and Lynch, K. (1993), Schools and Society in Ireland, Dublin: Gill& Macmillan
Educational Disadvantage Committee (2003), Educational DisadvantageForum, Report of the Inaugural Meeting, Dublin: EducationalDisadvantage Committee
196
Welfare Policy and Poverty
Chapter 06 17/09/2007 16:52 Page 196
Gewirtz, S., Ball, S. and Bowe, R. (1995), Markets, Choice and Equity inEducation, Buckingham: Open University Press
Gorard, S. and Fitz, J. (2006), ‘What Counts as Evidence in the SchoolChoice Debate’, British Educational Research Journal, vol. 32, pp.797–816
Gorard, S., Taylor, C. and Fitz, J. (2003), Schools, Markets and ChoicePolicies, London: RoutledgeFalmer
Gorby, S., McCoy, S. and Watson, D. (2005), 2004 Annual School Leaver’sSurvey of 2002/2003 Leavers, Dublin: ESRI
Halton, M. (2003), ‘Benchmarking: Another Attempt to Introduce Market-Oriented Policies into Irish Second-Level Education?’, Pedagogy,Culture and Society, vol. 11, pp. 331–351
Hogan, P. (2000), ‘The Road Not Taken and the One with Better Claim’,Issues in Education, vol. 5, pp. 13–20
INTO (1994), Poverty and Educational Disadvantage, Breaking the Cycle,Dublin: Irish National Teachers Organisation
Ireland (1992), Education for a Changing World: Green Paper onEducation, Dublin: Stationery Office
Ireland (1995), Charting Our Educational Future: White Paper onEducation, Dublin: Stationery Office
Ireland (1997), National Anti-Poverty Strategy, Dublin: Stationery Office
Ireland (2002), Building an Inclusive Society, Dublin: Stationery Office:www.welfare.ie/publications/naps/bais.pdf
Ireland (2006), White Paper on Irish Aid, Dublin: Stationery Office
Ireland (2007), National Action Plan for Social Inclusion 2007–2016,Dublin: Stationery Office
Irish Examiner (2006a), ‘Hanafin Audit To Tackle School “Racism”’, 29August
Irish Examiner (2006b), ‘Audit May Force Schools To Take MinorityStudents’, 10 October
Kellaghan, T., Sloane, K., Alvarez, B. and Bloom, B. S. (1993), The HomeEnvironment and School Learning: Promoting Parental Involvement inthe Education of Children, San Francisco: Jossey-Bass
Kellaghan, T., Weir, S., Ó hUallacháin, S. and Morgan, M. (1995),Educational Disadvantage in Ireland, Dublin: Education ResearchCentre, Combat Poverty Agency and Department of Education
197
Education and poverty
Chapter 06 17/09/2007 16:52 Page 197
Layte, R. and Whelan, C. T. (2000), ‘The Rising Tide of Equality ofOpportunity: The Changing Class Structure’, in Nolan, B., O’Connell, P.J. and Whelan, C. T. (eds.), Bust to Boom? The Irish Experience ofGrowth and Inequality, Dublin: Institute of Public Administration
Lee, J. (1989), Ireland 1912–1985, Politics and Society, Cambridge:Cambridge University Press
Lynch, K. (1999), Equality in Education, Dublin: Gill & Macmillan
McCoy, S. and Williams, J. (2000), 1999 Annual School-Leavers Survey of1997/1998 Leavers, Dublin: ESRI
McDonald, E. (1998), ‘Reading Achievement and EducationalDisadvantage’, Irish Educational Studies, vol. 17, pp. 208–221
National Education Convention (1994), Report on the National EducationConvention, Dublin: National Education Convention Secretariat
NCCA (2005), ‘Proposals for the Future Development of Senior CycleEducation in Ireland’, Dublin: National Council for Curriculum andAssessment
NESF (1997), Early School-Leavers and Youth Unemployment, ForumReport no. 11, Dublin: National Economic and Social Forum
NESF (2003), NAPS Social Inclusion Forum, 30 January 2003, Report,Dublin: National Economic and Social Forum
Ó Briain, E. (2006), Analysis of School Attendance Data at Primary andPost-Primary Levels for 2004/2005, Dublin: National Education andWelfare Board and MORI
O’Connell, P., Clancy, D. and McCoy, S. (2006), Who Went to College in2004?, Dublin: Higher Education Authority
OECD (1965), Investment in Education, Ireland. Report of the Survey TeamAppointed by the Irish Minister for Education, Dublin: GovernmentPublications
OECD (1997), Literacy Skills for the Knowledge Society, Further Resultsfrom the OECD International Literacy Survey, Paris: Organisation forEconomic Co-operation and Development
Olssen, M., Codd, J. and O’Neill, A. M. (2004), Education Policy,Globalisation, Citizenship and Democracy, London: Sage
O’Sullivan, D. (1999), ‘Educational Disadvantage: Excavating TheoreticalFrameworks’, in Fahy, K. (ed.), Strategies to Address EducationalDisadvantage, Galway: Community Workers Co-operative
198
Welfare Policy and Poverty
Chapter 06 17/09/2007 16:52 Page 198
O’Sullivan, D. (2005), Cultural Politics and Irish Education since the 1950s,Dublin: Institute of Public Administration
Power, C. and Tormey, R. (2000), ‘Refocusing the Debate: An Examinationof the Interplay between Measurement and Intervention in EducationalDisadvantage’, CEDR Occasional Paper No. 2, Limerick: Centre forEducational Disadvantage Research
Pringle, D. (1999), ‘Something Old, Something New: Lessons to Be Learntfrom Previous Strategies of Positive Territorial Discrimination’, inPringle, D., Walsh, J. and Hennessy, M. (eds.), Poor People, PoorPlaces: A Geography of Poverty and Deprivation in Ireland, Dublin: OakTree Press
Smyth, E. (1999), Do Schools Differ? Academic and PersonalDevelopment among Pupils in the Second-level Sector, Dublin: OakTree Press
Smyth, E. and Hannan, D. (2000) ‘Education and Inequality’, in Nolan, B.,O’Connell, P. J. and Whelan, C. T. (eds.), Bust to Boom? The IrishExperience of Growth and Inequality, Dublin: Institute of PublicAdministration
Tizard, B. and Hughes, H. (1984), Young Children Learning, Talking andThinking at Home and at School, London: Fontana Press
Tormey, R. (forthcoming), ‘The Silent Politics of Measurement: Contestingthe Measuring of Educational Disadvantage’, in Conway, P., FitzPatrick,S., Boland, J. and Hammond, J. (eds.), Curriculum Contestation,Dublin: Educational Studies Association of Ireland and NationalCouncil for Curriculum and Assessment
Weir, S. and Archer, P. (2004), A Review of School-Based Measures Aimedat Addressing Educational Disadvantage in Ireland; A Report to theEducational Disadvantage Committee, Dublin: Educational ResearchCentre
199
Education and poverty
Chapter 06 17/09/2007 16:52 Page 199

Chapter 06 17/09/2007 16:52 Page 200
Chapter 7
Health and modern Irish society: The mother and father of a dilemma
Cecily Kelleher
Introduction
The health profile of the Irish population has been relativelypoor for decades, both within Ireland itself and amongstmigrants from Ireland across the so-called Irish diaspora.Contemporary health statistics across the EU show relativelypoor life expectancy for both men and women and higherthan average rates of cardiovascular diseases and somecancers in Ireland. Recent data confirm what is seen widely inother industrialised countries, that health inequalities existacross social classes in Ireland and, as the country becomesmore urbanised, pockets of severe disadvantage are apparentat area level. While health indicators are improving and thecountry is experiencing unprecedented economic growth, thegap between richest and poorest is widening and this mustbe addressed.
The international literature confirms that health disadvantagebegins at the earliest stage of life and may follow a trajectory,cumulative or critical period pattern. A recent report onperinatal statistics confirms the social patterning of
201
Chapter 07 17/09/2007 16:53 Page 201
pregnancy-related outcomes and new cohort data supportalso this evidence that long-term health into adult life may beinfluenced by childhood circumstances. This suggests thecritical importance of maternal and child health policies as aninvestment for the future. Research into the influence of areaor location on health suggests that both communitydevelopment strategies that foster social capital andcommunity empowerment but also top-down policystrategies across the relevant sectors of health, education,social welfare, transport and housing are required to produceconcerted public policies that target ghettoisation andmaterial disadvantage. Because health status is determinedacross sectors, all public policy requires health proofing and,where relevant, a health impact assessment.
The health services are undergoing significant administrativeand organisational reform and are receiving considerablemedia attention, though this focuses mainly on acute hospitalservices, particularly the emergency services. There isinsufficient focus on the fact that concerted primary careservices are required and the recommendations of theprimary care strategy (DOHC, 2001a) are not yet being met.The manpower reforms in the hospital sector suggest thatequity of access and consultant-delivered services, withadequate primary care and step-down facilities, should beimplemented. The longstanding two-tier healthcare systemneeds review to provide universal equity of access, in bothprimary and hospital care settings. Any strategy to expandthe private hospital infrastructure should address the realitythat most people in Ireland today are not entitled tocomprehensive healthcare, and the one-half of the populationthat holds private insurance currently receives hospital carepredominantly in the public setting.
202
Welfare Policy and Poverty
Chapter 07 17/09/2007 16:53 Page 202
Irish society has transformed beyond recognition in the lastdecade, ensuring that the future of emerging generations islikely to be very different from the past (CSO, 2007). Howthis future is shaped will be highly determined by publicpolicy, which is nowhere more controversial than in thehealth arena. The promotion of health and provision ofhealthcare are two basic values that on the face of it shouldbe inherent to modern society, yet considerable variationsin health expectancy exist between Ireland and othercountries, and within Ireland according to both the locationand social position of its people.
The commonly held assumption that treatment services arethe main health-determining factor is only true in part. Inreality, population health reflects wider social and economicconditions as well as healthcare provision and this needs tobe understood when putting in place appropriate publicpolicies. To understand the Irish health sector requires aparticular comprehension of both its history and geography.This chapter examines the health status and healthdeterminants of the Irish population, the provision ofappropriate services, both within the health sector itselfand as part of wider public policy, and some of theparadoxes and dilemmas posed by modern healthcareprovision.
Lessons of the past
Ireland traditionally has had a very poor health profileindeed. The Irish famines of the mid-1840s defined apattern that was to be sustained for the century to follow,not alone in Ireland but across the migrant diaspora thatemerged as a consequence of emigration (Kelleher et al.,
203
Health and modern Irish society
Chapter 07 17/09/2007 16:53 Page 203
2004). As is well chronicled, the rapidly expandingpopulation in the late seventeenth and early eighteenthcenturies was based on subsistence farming but a bumperhigh carbohydrate food supply, chiefly from potato crops,was decimated by crop failures, generating a pattern ofstarvation and rampant disease and, for the survivors, ofmass emigration. The migrant profile of Irish people to theUS and the UK was habitually poor. It was understandablethat extremely disadvantaged and debilitated individualsforced into hard labour occupations might experience poorhealth initially. Remarkably, however, that profile of ill healthpersisted across generations of assimilation into the hostcountries, making this a more complex phenomenon tounderstand and interpret. In the US, for instance, the newermigrants from central, southern and eastern Europe movedup the education trajectory relatively more swiftly than theIrish, who remained in traditional blue collar communitiescharacterised by high degrees of bonding and religiosity(Perlmann, 1988). Their lifestyle came under heavy criticismin their adopted countries. Propensity for alcoholconsumption became more than something of a caricatureand undoubtedly racial discrimination was a feature of theirexperience. Additionally, a sociological treatise of the Irishmigrant male as a miserable, depressive and isolatedperson emerges. What is notable is that the Irish in Britaintoday continue to have relatively poorer health than the restof the population, long after this period of migration haspassed.
At home in Ireland severe economic restraints promoted asociety of serious urban deprivation and disadvantage andof rural subsistence, which perpetuated a cycle of povertyand migration. In Ireland in the 1930s and 1940s severe
204
Welfare Policy and Poverty
Chapter 07 17/09/2007 16:53 Page 204
material poverty was pervasive. The psychosocial as wellas the material aspects of this disadvantage are wellstudied, though arguably strong features of so-called socialcapital persisted among the Irish also, including networksand family supports. The role of religion presents complexambiguity. On one level it was a solace in situations ofdeprivation and was strongly associated with politicalresistance and identity. On the other it representedpersonal and social repression of identity and could be apunishing experience for the Irish poor.
The Irish healthcare system grew out of this political history(Barrington, 1987) and its legacy is discernible in publicpolicy today, as will be discussed further in this chapter.The Poor Laws of the Famine period saw the introductionof institutional care for the disadvantaged and many ofthese hospitals are still sites today of modern facilities. Theopportunity in 1911 to introduce comprehensive socialinsurance was vigorously opposed by the emerging middleclasses and the dispensary system that evolved, providingcare on a ticketed basis by general medical practitioners,introduced a two-tier primary care model that in 1970became the general medical services eligibility scheme,which is still the main means-tested source of publichospital and health services eligibility today. Rather thanintroducing a comprehensive system of care, the notion ofmeans testing and the partial subsidy of health insurancefor the more affluent taxpayer became the norm. TheMother and Child controversy of the Fine Gael-led coalitionin the 1940s, which made Dr Noel Browne a householdname, set a principle of non-state interference in familyhealthcare which remains at the heart of public policydebate today.
205
Health and modern Irish society
Chapter 07 17/09/2007 16:53 Page 205
Measures of health status
By comparison with international neighbours, Ireland’scontemporary health status is still poor. Life expectancy atbirth in 2002 was estimated at 75.1 years for men and 80.3years for women, both below the old EU-15 average. Irelandstraddles the gap between the newer accession states in theexpanded EU-25 and the older EU countries. Expectancyfrom the age of 65 is also lower than average and the healthgain in this age group has been negligible in recent years(CSO, 2004). This poor expectancy pattern is partly explainedby the mortality from cardiovascular diseases, which is high,particularly for coronary heart disease. Rates of some of thecommon cancers, particularly colon and bowel in both sexesand for breast cancer in women, are also high. The report onWomen and Cancer in Ireland 1994–2001 (WHC and NCR,2006) notes for instance that all cancer incidence in women inIreland is the third highest in Europe and all cancer mortalitythe second highest. There is evidence of a class gradient tothese patterns also.
The Institute of Public Health in Ireland (2001) illustratesclearly that the mortality difference between the highest andlowest occupational classes is appreciable, with a 300 percent difference for circulatory diseases and a 600 per centdifference for injuries, poisonings and respiratory diseases.There is evidence of a decline in coronary heart disease fromabout the mid-1990s onwards in both men and women, butboth the north and south of Ireland still rank amongst thehighest in Europe.
It is not immediately clear why Ireland should have a poorinternational profile or such adverse within-country gradients.Three main possibilities exist: that treatment and care
206
Welfare Policy and Poverty
Chapter 07 17/09/2007 16:53 Page 206
services are inadequate, that predisposing risk factor profilesare worse than elsewhere or that there are inherent genetic orconstitutional differences among the Irish population. Onedifficulty in assessing the relative influence of these threefactors has been the paucity of adequate populationsurveillance information. To take one example of ourcommonest health problem, coronary heart disease, thetraditional lifestyle risk factors associated with that condition– smoking status and dietary influences leading tohypertension (high blood pressure) and atheroma (theprocess of artery thickening that leads to heart disease) –have not been systematically recorded in the Irish populationand the social distribution of such risk factors still less so.
Data from the Kilkenny Health Project (Shelley et al., 1995) – acommunity intervention programme in the period from 1985to 1992 to promote healthy lifestyles – do show thebeginnings of secular (or generational) declines in risk factorsduring that period and later information from the SLÁNsurveys of lifestyle, attitudes and nutrition in 1998/1999 and2002/2003 show small declines in smoking rates andimprovements in diet between those years (Kelleher et al.,2003a, 2003b) in keeping with downwards secular trends inheart disease. Nonetheless, smoking status shows a clearage and social class gradient in both adults andschoolchildren. As do dietary patterns. Affordability is a keyinfluence on diet in both relative and absolute terms. Forinstance a two parent and two child family on the lowestincome spends 40 per cent on food, compared to a similarfamily in the highest group which spends just 17 per cent(Friel et al., 2004). The National Taskforce on Obesity (DOHC,2005) has highlighted the rapid growth in the problem ofoverweight and obesity across Irish society and the emerging
207
Health and modern Irish society
Chapter 07 17/09/2007 16:53 Page 207
social gradient, consequent on less affluent families beingdependent on cheaper but energy-dense high calorie foods.
Kabir et al. (2007) estimate that if recent trends in majorcardiovascular risk factors simply continued to 2010, targetsto reduce rates in Ireland are unlikely to be achieved, but ifthe tobacco control measures such as the 2004 ban onindoors smoking yield significant falls in smoking prevalencethere will be an improvement that could halve mortality. Suchan improvement is not a given however. Latest evidencesuggests a halt in the downwards trends in overall smokingrates (Boilson et al., 2007) and time trend data in othercountries, whilst showing falls in average population bloodpressure and total serum cholesterol, imply counterbalancingupwards trends in blood sugar and body mass indexassociated with the obesity epidemic (Ulmer et al., 2007;Kelleher et al., 2006).
The Health Promotion Policy Unit of the Department of Healthand Children has had responsibility for over two decades forthe promotion of healthy lifestyles. Its numerous policydocuments have explicitly acknowledged that healthy choicesare not always easy to make without the right context andsupportive environment and that social inequalities must beaddressed (see www.healthpromotion.ie/publications/). Thechallenge for health education and promotion is to ensurethat lifestyle messages can be acted upon equitably acrosssociety so that those least able to afford change do notcontinue to be disadvantaged, in effect widening an existingclass gradient as the more affluent are empowered to makechanges.
Self-rated health (SRH) serves as a good proxy for healthstatus generally and has been shown to predict a wide variety
208
Welfare Policy and Poverty
Chapter 07 17/09/2007 16:53 Page 208
of health outcomes at population level. In several recentanalyses, SRH has been associated not just with adverselifestyle but also with socio-economic circumstances. Thoserating their health as fair to poor were more likely to report apoor quality of life, to have none or primary education only, orto have means-tested general medical services (GMS)eligibility (Kelleher et al., 2002). In a multivariate model, lowereducation status and smoking status each independentlypredicted the health of men, and in women lower educationand GMS eligibility were predictive (Kelleher et al., 2003a). Ananalysis of rural communities showed that low levels offinancial security and dissatisfaction with work are alsopredictive of poor SRH (Tay et al., 2004).
Notably in Ireland, area-level analyses do not show the samevariability as is seen in more industrialised countries. Only inthe larger conurbations where areas of real disadvantage insocial and material terms exist do we find the kind ofdifferences in the standardised mortality ratio commonlyfound in the UK and the US. What this implies is that asIreland changed in the last decades, we moved from moremixed communities where advantaged and disadvantagedpeople lived side by side to a situation, common in othercountries, where people of similar means and occupation areclustered together in urbanised communities. This adds acontextual dimension to understanding the health profile of acommunity. In effect it means that individuals carry the risk oftheir own social status but also the added advantage ordisadvantage of the area in which they live. Particularly in thelast decade of unprecedented economic growth, pressure onhousing and accommodation and net immigration, we areseeing a shift to the kind of public policy dilemmas facingother developed countries.
209
Health and modern Irish society
Chapter 07 17/09/2007 16:53 Page 209
Social determinants of health
Life-course epidemiological or public health perspectives inrecent years suggest a comprehensive life-course approachis appropriate to the study of health and social position (Ben-Shlomo and Kuh, 2002). Thinking has shifted profoundly inthe sense that we now know that in addition to proximalinfluences of, for instance, maternal nutrition or smoking onintra-uterine and infant growth, which we clearly expect(Gambling and McArdle, 2004; Institute of Public Health inIreland, 2007), patterns of cardiovascular development andlong-term susceptibility to adult disease may be set in trainfrom this critical period onwards. The Barker hypothesispostulates that biological growth patterns are influenced inthis first life period (Barker, 2003) and accumulating evidencesuggests that the phenomenon of tracking of growth patternsmay be set from an early age (Eriksson et al., 2003; Eriksson,2005). The implications of this for, for instance, childhoodoverweight and obesity are very important. A child with apropensity to overweight will tend to stay at that level as sheor he grows older and may well be more susceptible to adultobesity and diabetes, particularly if exposed to anunbalanced diet of high-energy foods.
The implications for social position are even more profound.Investigators such as Davey Smith et al. (1998) show thatparental social position, including occupation and education,may independently predict, to a greater or lesser degree,adult health status. Those with a manual worker father haverelatively higher odds of heart disease, stroke, cancer andrespiratory disease in middle age, independent of their ownmanual or non-manual occupation in adult life. Some patternsare mitigated strongly by adult lifestyle behaviour, such assmoking status. Thus, adult lung cancer is predominantly
210
Welfare Policy and Poverty
Chapter 07 17/09/2007 16:53 Page 210
influenced by own smoking habit but conditions such asstomach cancer, now understood to be associated with theinfectious organism helicobacter pylori, whose transmission isfacilitated by overcrowded childhood conditions, are stronglyassociated with childhood socio-economic position.
The search for mechanisms to explain adult risk has beenadvanced by those such as Ben-Shlomo and Kuh (2002), whopoint out that this may be mediated by a variety ofprocesses, some predominantly social or psychosocial, somebehavioural and some biological. Data show that criticalperiod, cumulative and trajectory influences are all importantfor long-term development. For instance, an infant born intopoor circumstances, with inadequate childhood nutrition, mayalso receive inadequate early education, including parentingand school exposure. This sets in place a trajectory pattern ofpoor employment prospects, with inadequate incomeperhaps leading to poor health behaviours. Conversely, achild born in similarly poor childhood standards receiving agood education will have a better outcome but may havesome critical period risks in the long term. Others mayexperience cumulative disadvantage across the life course atevery time point. The significant policy point from this type ofresearch is that investment in maternal and child health maypay dividends long into the future of that child.
Another significant debate in recent years in the healthinequalities literature is the extent to which social positionmay mediate its health influence through material orpsychosocial conditions. Marmot and Wilkinson (2001), forinstance, point out that most health indicators show a socialgradient across all classes, rather than a threshold patternwhere a cut-off is experienced only by the mostdisadvantaged. This graduated pattern applies not just to
211
Health and modern Irish society
Chapter 07 17/09/2007 16:53 Page 211
health behaviours like smoking or diet, but also to intermediatebiological risk factors like total serum cholesterol or healthutilisation indicators. The importance of this graduated pattern,rather than a dichotomous or threshold one where a cleardifferentiation can be made between rich and poor, is that itsuggests social relationships may be important, not alone indriving these patterns of lifestyle and health behaviours acrosssocial groups in society, but also as a reflection of socialorganisation. Perception of disadvantage may exert anindependent influence in itself. Wilkinson (1996), a strongproponent of the psychosocial consequences of disadvantage,indicates that the hierarchical post-industrial society not alonecreates inequality in terms of means and control of resources,as in a classical Marxian economic interpretation, but that italso affects sense of dignity and self-worth in a corrosive way.He cites, for instance, prisoners, who are a highly materiallydisadvantaged group but understand their position in theincarcerated pecking order and express their resentment atinfringements on their dignity. As he points out, socialvariations in health expectancy teach us as much aboutsociety as they do about health.
Other studies show that chronic stress, associated, forinstance, with impending loss of work or unemployment, maymanifest not just in psychological distress as objectivelymeasured by appropriate psychometric scales but also at apatho-physiological level as measured by the stress hormonecortisol secretion patterns. The extension of the social supportliterature, showing essentially that major life events andsignificant others may exacerbate or ameliorate major healthoutcomes like heart disease, to a psychosocial paradigm hasbeen much investigated and debated in recent years(Stansfield and Marmot, 2002).
212
Welfare Policy and Poverty
Chapter 07 17/09/2007 16:53 Page 212
Social capital and community development
The concept of social capital derives from several sourcesbut received major impetus in recent years by Putnam, whohighlights in his book Bowling Alone (2000) the change in USsociety from a more caring and socially supportive voluntaristsociety to one characterised by individualism and intensesocial division. He extends this argument to imply that suchpolarised societies promote inequality by the loss of thisprotective social fabric. The social epidemiology researchgroup at Harvard has shown empirically that states in the USwith high levels of income inequality exhibit both poor socialcapital as measured by indicators of trust and reciprocity butalso more adverse health (Kim and Kawachi, 2007). Thisliterature is controversial but is highly relevant to Ireland, asociety in major economic transition, characterised recentlyby the disappearance of more traditional indicators of socialcapital and support (Taskforce on Active Citizenship, 2007)and ever-increasing income inequality. The National Economicand Social Forum has explicitly examined social capital andnetworks in the context of social inclusion (NESF, 2003). Theargument that community development supports otherwisedisadvantaged communities by processes of empowerment,advocacy and bridge building is intuitively strong.
Communities with state-supported resources and amenitiescreate a public good common to all, irrespective of individualmeans and resources. At one level a bottom-up strategy isinclusive, involves community agendas and concerns andmaximises participation. There are compelling socialmarketing arguments of change. The essential argument, asmade in the book The Tipping Point (Gladwell, 2000), is thatthere comes a point of critical change in a social communitythat leads to a new norm of behaviour. In the Rogers
213
Health and modern Irish society
Chapter 07 17/09/2007 16:53 Page 213
Innovation Diffusion Theory (Rogers, 1995), early adopterslead the way with a new trend, trickling down through societyuntil a critical climate of public opinion is reached by an earlymajority of the population. Social forces as diverse asenvironmental controls on plastic bag purchase and theindoors smoking ban are prosaic if powerful examples. Canthe same processes shift inequality patterns in health?
The converse or neo-material view is that such interpretationsplace undue responsibility on the individual to initiate change,particularly when that person is disadvantaged and has notthe appropriate amenities and resources in place (Muntaneret al., 2002). Critics point out that when a material thresholdof income is reached within a country, the so-calledepidemiological transition, it is true that pure materialdeprivation no longer explains morbidity and mortality.Nonetheless a less stark social gradient remains and healthinequality persists within societies that are clearly meansrelated. In such scenarios corrective actions may relate torobust income re-distribution at policy or taxation level,because the most unequal societies tend to have the most illhealth. The provision of adequate income and of materialamenities remain the primary issues to be addressed.
Public policy implications
The pragmatic position is that both top-down and bottom-upstrategies are required in policy terms. Strategies basedaround community development and local resources mayarguably empower change but if the onus is placedexcessively on voluntarism and community action, theresponsibility of the state, and by extension the taxpayer, isreduced. Such a model is consistent with low taxation,
214
Welfare Policy and Poverty
Chapter 07 17/09/2007 16:53 Page 214
minimalist state intervention and support. The alternative neo-material position stresses robust public spending onamenities such as health and education, adequate thresholdsof social welfare and reduction in income disparity. Thisimplies also a level of stateism that can be equated withnanny interventions to promote, for instance, issues asdiverse as smoking restriction in shared public or workingenvironments, subsidies on foods and food supply,interference with commercial practice in fast food restaurantsand, generally speaking, the movement of the old left to amore moderate lifestyle-associated territory.
Lee (2006) discusses the current issues and challenges forcommunity development in a paper for the Combat PovertyAgency. While she argues that the development of the voiceof people who experience exclusion is key to effective socialchange, the factors that give rise to poverty are generallyneither created nor solved at local level. Communitydevelopment strategies rooted in liberal, humanistic values,with an emphasis on the capacity and worth of individuals,may undermine more radical collective strategies.Empowered communities are not necessarily in positions ofpower. Two practical means of influencing decision-makingare the mainstreaming of social inclusion in public policy (seeO’Kelly, 2006) and the development of health impactassessment tools for proofing of cross-sectoral public policy.Whilst attractive in principle, in practice working tools arerequired to avoid a cumbersome and overly bureaucraticsituation and considerably more dialogue and debate isrequired between sectoral actors to bring this about.
Another clear policy issue is whether we should be moving tocombat poverty, which clearly implies a marginalised groupwho need to be shifted towards a threshold norm, or whether
215
Health and modern Irish society
Chapter 07 17/09/2007 16:53 Page 215
we should be aiming to reduce inequality, which might havethe possibly unintended effect of lowering the healthexpectations of some. Again there are cases to be made forboth positions, depending on circumstances. Measurement ofpoverty usually entails one of three indicators: relativeincome, defined as having an income at 60 per cent of thenational median income; deprivation of at least two of anumber of key material indicators; and consistent poverty,which is the combination of these two (CPA, 2006). At 20 percent, Ireland’s rate of income poverty ranks as one of thehighest across the EU, which averages 16 per cent (seeChapter 2). Notably, lone parents, households headed by aperson with a disability and households with children areinordinately likely to be poor. The Women’s Health Councilhas produced a number of papers indicating the importanceof maternal and child health, the relative importance ofwomen as caregivers in society and the inordinate burdenwomen experience of disadvantage as well as explicitlylinking such circumstances to health outcomes (seewww.whc.ie/publications/factsheets.html). The recognitionthat marginalised groups such as Travellers requireappropriate and culturally sensitive investments is also clear.The gap in health expectancy between Travellers and othersis at least sixteen years for women (CSO, 2007) and in 2007 amajor Traveller health status census survey is planned.
However, wider strategies to reduce health inequities acrosssociety merit consideration also. If the evidence points to thefact that more rapidly developed industrialised societiescreate vast conurbations of essentially ghettoised people,then infrastructural policy must address this issue. Strategiesto date in Ireland around decentralisation, urban and ruraldevelopment and the creation of hub areas are all arguably
216
Welfare Policy and Poverty
Chapter 07 17/09/2007 16:53 Page 216
both somewhat half-hearted and provisional and none aredriven by a clear and explicit health policy agenda. Socialvariations in health expectancy across society are driven bydivisions not alone between the richest and poorest butacross the social spectrum. This presents a policy challengealso in that it means sectors outside the traditional healthbrief must have in place a means of undertaking meaningfulhealth proofing of policies and health impact assessments. AsTussing and Wren (2006) point out, the twenty years of socialpartnership, afforded by an historic agreement to moderatewage claims and a consequent opportunity to cut taxes, laidthe foundations for economic success. The consequence isthat public investment in amenities and public services to thebenefit of all is appropriate. All the evidence is of wideningincome inequality and of major challenges to be addressednow in public spending to improve the overall public healthstill further and to narrow the gap in health status.
Healthcare delivery
The outstanding issue for discussion remains the state of theIrish health services. The health strategy Quality and Fairness:A Health System for You was published in 2001, notably froma cross-sectoral perspective with a foreword by TaoiseachBertie Ahern, as well as then Minister for Health and ChildrenMichéal Martin and Michael Kelly, then Secretary General ofthe Department of Health and Children, who had beenassociated with visionary policy documents dating back toHealth, the Wider Dimensions in 1986. Between 2001 and2006, a number of implementation milestones weredocumented on the Department of Health and Children’swebsite (www.healthreform.ie/news/milestones.html). Thesepredominantly refer to the processes of establishing the
217
Health and modern Irish society
Chapter 07 17/09/2007 16:53 Page 217
Health Service Executive (HSE) and the Health Informationand Quality Authority and apparently represent a more limitedversion of what was originally envisaged.
The vision espoused in the 2001 strategy was for a healthsystem that supports and empowers the individual, the familyand the community to their full health potential. It stressedfour core principles of equity, people-centeredness, qualityand accountability. The four goals were based on betterhealth for everyone, fair access, responsive and appropriatedelivery and high performance. A wide range of serviceobjectives were summarised, many of which were in train atthe time.
The adequacy of the services has since been critiqued widely(see, for instance, Tussing and Wren, 2006) and numerousreports have been produced on the viability of the systemand aspects of potential reform. The ageing population andthe development of effective treatments for major chronicdiseases such as cancers and heart disease mean that theservices must be adequate. As Tussing and Wren assert,many of the stakeholders in this reform process, particularlyaround the primary care strategy, believe little has beenimplemented to date.
Many models of healthcare delivery abound and, asmeasured by efficiency and equity of access, Ireland’s systemdoes not fare well. The stringent cutbacks of the mid-1980swere driven by an historical over-reliance on acute hospitalbeds. Nonetheless cutting back those resources, cruciallywithout the creation of step-down services or adequatecommunity-based care, made inevitable a perception ofinadequacy about the health service as a whole. The generalpractitioner, at the core of primary care delivery, was often
218
Welfare Policy and Poverty
Chapter 07 17/09/2007 16:53 Page 218
single handed without administrative, nursing or paramedicalsupport, inevitably leading to inadequate out-of-hours coverand the practical recognition that for any service to flow theacute hospital had to be the first route into the system formany acutely ill patients.
The consequent focus on the accident and emergency crisisis without question a high-profile media issue but it may beneither as universally bad as painted for most of the peoplemost of the time, as judged by consumer satisfaction surveys(HSE, 2007), nor necessarily the solution to tackle this issuein isolation. It is without doubt a fundamental measure of acompassionate society that the sick and vulnerable shouldnot be left for prolonged periods on makeshift trolley beds inhospital corridors, particularly as taxpaying citizens overdecades who are now in the latter part of their lives, but it isnot necessarily the barometer of well-met health need itimplies and diverts strategic public debate from the realunmet need. While perhaps some hundreds of people a dayin mid-winter experience the inefficiency and ineffectivenessof emergency services in thirty-five acute hospitals (andrecent evidence suggests in fact 76 per cent of people weresatisfied with those services), thousands more areunknowingly going without adequate first line services.
The real crisis in Irish healthcare is not the acute sector butthe slumbering iceberg of primary, continuing and communitycare that could, if configured properly (DOHC, 2001a), deliveron much-needed health service requirements. We require asystem that keeps the maximum number of people fromhospitalisation in the first place and minimises the amount oftime anyone has to spend in hospital. Hospitals should behigh-level specialist investigation units, acute crisis andrespite centres at critical points in care, not facilities where
219
Health and modern Irish society
Chapter 07 17/09/2007 16:53 Page 219
people languish for prolonged periods awaiting investigationand results. Institutionalisation is expensive and inefficient. Thelong-awaited primary care strategy rollout is moving beyondpilot to early implementation stage with 215 primary care teamsplanned to be in place by the end of 2007, but it is clearlynowhere near its stated aims and objectives (DOHC, 2001a).
The low population density compounds the controversy aboutaccess across large parts of the country and the over-relianceon the county hospital model of care, in place since Faminetimes, which seeks to duplicate resources more appropriate toregional centres. The reality is that comprehensive lowtechnology interdisciplinary services at primary care level, withan adequate first line accident and emergency service atcounty level, should deliver the most cost-effective healthoutcome. However, the widespread public perception of beingshort-changed by such a model is difficult to unsettle and isnot helped by instances of apparently appalling individual casemanagement, which receive high-profile media attention butare as likely to reflect bureaucratic communication failures asmalpractice.
In 2003 the Hanly Report of the National Task Force onMedical Staffing was launched and this contained agroundbreaking suggestion (DOHC, 2003). In meeting theovertime ceilings for non-consultant hospital doctors (NCHDs)set in the EU Directive on Working Time, it proposed fourpossible strategies: first to do nothing, second to recruit moreNCHDs, third to create a new permanent career NCHD gradeand fourth was to move to a consultant-provided rather thana consultant-led service, in effect doubling the consultantexpertise and radicalising the hospital delivery system. In thenew model the consultant would provide more direct patientcontact on a daily basis, rather than supervising junior staff. A
220
Welfare Policy and Poverty
Chapter 07 17/09/2007 16:53 Page 220
drawback of this report and of the Fottrell Report of theWorking Group on Undergraduate Medical Education andTraining (DOHC, 2006a) and the Buttimer Report of thePostgraduate Medical Education and Training Group(DOHC, 2006b) was that the consequences for primary carewere not quantified because of their terms of reference.
The provision of consultant-delivered rather than consultant-led services would ensure, in theory, more effective andefficient treatment but in itself, without adequate primary andstep-down care, would not meet long-term need. A healthsystem that created universal access through primary care,because it was no longer means-tested or subsidised byprivate insurance, and that removed the two-tier access routein both primary and acute hospital care would undoubtedlyshift the health services away from a reactive under-resourced hospital infrastructural model. As high technologyintervention for the most sick becomes the norm, demand willinevitably drive its provision, leading to an ethical and valuesdiscussion in Irish society (as in countries everywhere) aboutwhat level of care is appropriate for whom. Ageist definitionsof care delivery are inappropriate but the opportunity cost ofintensive intervention without clear benefit is considerablealso. Initiatives such as the UK’s National Institute for Healthand Clinical Excellence (see www.nice.org.uk) have beenestablished to set out standards of good practice in publichealth, health technologies and clinical practice.
The kind of comprehensive policy approach needed for thiscountry has not materialised. Health Minister Mary Harney’sdocumented policy interest since taking office in 2004 hasbeen on the acute hospital sector and with tackling vestedinterests of the health professionals, particularly medicalpractitioners. She also sought to separate public from private
221
Health and modern Irish society
Chapter 07 17/09/2007 16:53 Page 221
care, not by creating a common waiting list, but byintroducing private hospital construction plans for publichospital sites and the creation of three types of consultantcontract: purely public, purely private and mixed provisioncontracts. Whatever about delivering on consultant practice,such contracts inherently bolster the two-tier system unless itis envisaged that private practice would rapidly become justthat, a system completely separated from the existing publicsystem. Such a strategy may be missing the point, in that apurely private service could not deliver on the scale that thesubsidised system does at present for the one-half of thepopulation who are health insurance subscribers but are alsoentitled as taxpayers to public care, and it runs the risk in theshort term of overloading a public hospital service to whicheveryone is entitled, free of charge, at present.
It is to some degree a matter of ideology what the financialunderpinning of the health service in Ireland should be andagain, as Tussing and Wren (2006) point out, the solutions,whether through universal health insurance, through acomprehensive tax-funded health service or through someform of private health insurance, all have their proponents.What seems clear in any of these models is that equity ofaccess at point of delivery across both primary and acutecare is the only means of ensuring seamless delivery. Untilthat is delivered upon, the Irish healthcare system willcontinue to be relatively inefficient, particularly for the leastaffluent. More seriously troubling is its ineffectiveness, in thatthe drivers of health determinants are being met in toodownstream a manner. Primary care remains inaccessible andunder-developed for the majority of the population and thehealth burden will increase as the population ages unless amore proactive approach is taken.
222
Welfare Policy and Poverty
Chapter 07 17/09/2007 16:53 Page 222
Conclusions and recommendations
What do we know about the health status of thecontemporary Irish population? In common with everycountry the social gradient has been established to exist andthe worst health profiles are in the most economicallydeprived areas as urbanisation spreads. As the economy hasstrengthened, we have replaced a traditional pattern of fairlyuniversal disadvantage with a widening health inequality. Theinverse care law of inadequate provision for the most needyremains true. However, and this is the policy question that isslow to be grasped, it is often amenities and services outsidethe health sector that are likely to make the difference,making health impact assessment across public policiesnecessary.
The shift from a past of rural deprivation, but with mixed,well-integrated communities and supports, to a morepolarised and urbanised society may be expected to translateinto ever-widening inequalities if corrective action is not takenat policy level to plan new communities adequately. Theprovision of affordable and mixed housing (observed in thebreach in the main) is a case in point of well-intentionedpublic policy not being implemented in practice. The need toaddress the ageing population means a shift towards primarycare and step-down policies will be crucial in the nextdecade, but there is no public debate around this question.And ironically it seems, given the controversy generated byNoel Browne’s proposals at the time, it is mother and childservices, as in proper pregnancy and parenting support andearly-life education, that will best address the future equityquestions in Irish society. We therefore have the mother andfather of a dilemma. The health of present and futuregenerations requires constant and concerted input and we
223
Health and modern Irish society
Chapter 07 17/09/2007 16:53 Page 223
need to tackle not just the present-day health needs of thesick and infirm, but policies that are investments for Ireland’sfuture generations, now just being born.
It is recommended that the following actions are taken:
• Implement health impact assessments for all publicpolicies, to ensure that major developments in areas suchas transport, housing and education provision areappropriate and serve to promote, rather than demote, thehealth of the population as a whole. This is an inter-sectoral challenge, deserving high-level national and localgovernment attention
• Introduce comprehensive mother and child servicesacross health, education and social welfare sectors,including non-means-tested primary care eligibility untilchildren reach the age of eighteen. This is justified by themounting scientific literature on life-course influences onlong-term health and may be the best means of ensuringan equitable start from the beginning
• Remove the two-tier structure from both primary andacute hospital care by ensuring equity of access at pointof delivery across both primary and acute care. This canbe addressed irrespective of the form of payment forservices. It is critical to address the primary care sector inconjunction with the hospital sector as the totalperspective is required to ensure the best outcome for all.The policy debate is too upstream, at hospital level, at thispoint
• Implement the primary care team network nationwide.This is rolling out on a graduated basis at present andshould be accelerated as a policy priority
224
Welfare Policy and Poverty
Chapter 07 17/09/2007 16:53 Page 224
• Develop a major primary-care-led health service for olderpeople programme, running the spectrum from healthpromotion and social support through to acute hospitaland pastoral care. The demographic and health statusdata indicate that careful needs assessment planning willbe required into the future.
References
Barker, D. (2003), ‘The Midwife, the Coincidence and the Hypothesis’,British Medical Journal, vol. 327, pp. 1428–1430
Barrington, R. (1987), Health, Medicine and Politics in Ireland 1900–1970,Dublin: Institute of Public Administration
Ben-Shlomo, Y. and Kuh, D. (2002), ‘A Life Course Approach to ChronicDisease Epidemiology: Conceptual Models, Empirical Challenges andInterdisciplinary Perspectives’, International Journal of Epidemiology,vol. 31, no. 2, pp. 481–482
Boilson, A., Craven, F., Fitzsimon, N., O’Mahony, D., Staines, S. andKelleher, C. C. (2007), Findings of the Health Service ExecutiveConsumer Satisfaction Survey 2007, Naas: Health Service Executive
CPA (2006), Poverty in Ireland – The Facts: 2004, Dublin: Combat PovertyAgency
CSO (2004), Health Statistics of the Irish Population, Dublin: CentralStatistics Office
CSO (2007), Census 2006. Principal Demographic Results, Dublin: CentralStatistics Office
Davey Smith, G., Hart, C., Blane, D. and Hole, D. (1998), ‘Adverse Socio-Economic Conditions in Childhood and Cause-Specific Adult Mortality:Prospective Observational Study’, British Medical Journal, vol. 316, pp.1631–1635
DOH (1986), Health, the Wider Dimensions, Dublin: Department of Health
DOHC (2001a), Primary Care – A New Direction, Dublin: Department ofHealth and Children
DOHC (2001b), Quality and Fairness. A Health System for You, Dublin:Department of Health and Children
225
Health and modern Irish society
Chapter 07 17/09/2007 16:53 Page 225
DOHC (2003), Report of the National Task Force on Medical Staffing,Dublin: Department of Health and Children [Hanly Report]
DOHC (2005), Obesity: The Policy Challenges, Report of the NationalTaskforce on Obesity, Dublin: Department of Health and Children
DOHC (2006a), Medical Education in Ireland: A New Direction, Report ofthe Working Group on Undergraduate Medical Education and Training,Dublin: Department of Health and Children [Fottrell Report]
DOHC (2006b), Preparing Ireland’s Doctors to Meet the Health Needs ofthe 21st Century, Report of the Postgraduate Medical Education andTraining Group, Dublin: Department of Health and Children [ButtimerReport]
Eriksson, J. G. (2005), ‘The Fetal Origins Hypothesis – 10 Years On’,British Medical Journal, vol. 330, pp. 1096–1097
Eriksson, J. G., Forsen, T., Tuomilehto, J., Osmond, C. and Barker, D. J.(2003), ‘Early Adiposity Rebound in Childhood and Risk of Type 2Diabetes in Adult Life’, Diabetologia, vol. 46, pp. 190–194
Friel, S., Walsh, O. and McCarthy, D. (2004), Cost of Healthy Eating in theRepublic of Ireland, Dublin: Combat Poverty Agency
Gambling, L. and McArdle, H. J. (2004), ‘Iron, Copper and FetalDevelopment’, Proceedings of the Nutrition Society, vol. 63, pp.553–562
Gladwell, M. (2000), The Tipping Point: How Little Things Can Make a BigDifference, New York: Little Brown
HSE (2007), Health Service Executive Emergency Departments. PatientProfiles, Experiences and Perceptions, Summary Report of a NationalSurvey Among People Who Attended During 2006, Naas: HSE
Institute of Public Health in Ireland (2001), Inequalities in Mortality1989–1998, Dublin: The Institute of Public Health in Ireland
Institute of Public Health in Ireland (2007), Unequal at Birth. Inequalities inthe Occurrence of Low Birthweight Babies in Ireland, Dublin: TheInstitute of Public Health in Ireland
Kabir, Z., Bennett, K., Critchley, J. A. and Capewell, S. (2007), ‘Can FutureChanges in Cardiovascular Risk Factors Predict Large FutureReductions in Coronary Heart Disease Mortality in Ireland?, EuropeanJournal of Epidemiology, vol. 22, no. 2, pp. 83–89
Kelleher, C. C., Friel, S., Nic Gabhainn, S. and Tay, J. B. (2003a), ‘Socio-Demographic Predictors of Self-Rated Health in the Republic ofIreland: Findings from the National Survey on Lifestyle, Attitudes andNutrition, SLÁN’, Social Science Medicine, vol. 57, no. 3, pp. 477–486
226
Welfare Policy and Poverty
Chapter 07 17/09/2007 16:53 Page 226
Kelleher, C. C., Harrington, J. and Friel, S. (2002), ‘Measures of Self-Reported Morbidity According to Age, Gender and General MedicalServices Eligibility in the National Survey of Lifestyles, Attitudes andNutrition’, Irish Journal of Medical Science, vol. 171, no. 3, pp.134–138
Kelleher, C. C., Lynch, J. W., Daly, L., Harper, S., Fitz-Simon, N., Bimpeh,Y., Daly, E. and Ulmer, H. (2006), ‘The “Americanisation” of Migrants:Evidence for the Contribution of Ethnicity, Social Deprivation, Lifestyleand Life-Course Processes to the Mid-20th-Century Coronary HeartDisease Epidemic in the US’, Social Science Medicine, vol. 63, no. 2,pp. 465–484
Kelleher, C. C., Lynch, J., Harper, S., Tay, J. B. and Nolan, G. (2004),‘Hurling Alone? How Social Capital Failed to Save the Irish fromCardiovascular Disease in the United States’, American Journal ofPublic Health, vol. 94, no. 12, pp. 2162–2169
Kelleher, C. C., Nic Gabhainn, S., Friel, S., Corrigan, H., Nolan, G.,Sixsmith, J., Walsh, O. and Cooke, M. (2003b), Results of the NationalHealth and Lifestyle Surveys, Galway: Centre for Health PromotionStudies
Kim, D. and Kawachi, I. (2007), ‘U.S. State-Level Social Capital andHealth-Related Quality of Life: Multilevel Evidence of Main, Mediatingand Modifying Effects’, Annals of Epidemiology, vol. 17, no. 4, pp.258–269
Lee, A. (2006), Community Development: Current Issues and Challenges,Dublin: Combat Poverty Agency
Marmot, M. and Wilkinson, R. G. (2001), ‘Psychosocial and MaterialPathways in the Relation Between Income and Health: A Response toLynch et al.’, British Medical Journal, vol. 322(7296), pp. 1233–1236
Muntaner, C., Lynch, J. W., Hillemeier, M., Lee, J. H., David, R., Benach, J.and Borrell, C. (2002), ‘Economic Inequality, Working-Class Power,Social Capital, and Cause-Specific Mortality in Wealthy Countries’,International Journal of Health Service, vol. 32, no. 4, pp. 629–656
NESF (2003), The Policy Implications of Social Capital, Forum Report no.28, Dublin: National Economic and Social Forum
O’Kelly, K. P. (2006), The Evaluation of Mainstreaming Social Inclusion inEurope, Dublin: Combat Poverty Agency
Perlmann, J. (1988), Ethnic Differences, Schooling and Social StructureAmong the Irish, Italians, Jews and Blacks in an American City1880–1935, New York: Cambridge University Press
227
Health and modern Irish society
Chapter 07 17/09/2007 16:53 Page 227
Putnam, R. (2000), Bowling Alone: The Collapse and Revival of AmericanCommunity, New York: Simon & Schuster
Rogers, E. M. (1995), Diffusion of Innovations, 4th edn, New York: TheFree Press
Shelley, F., Daly, L., Collins, C., Christie, M., Conroy, R., Gibney, M.,Hickey, N., Kelleher, C., Kilcoyne, D., Lee, P., Mulcahy, R., Murray, P.,O’Dwyer, T., Radic, A. and Graham, I. (1995), ‘Cardiovascular RiskFactor Changes in the Kilkenny Health Project, a Community HealthPromotion Programme’, European Heart Journal, vol. 16, pp. 752–760
Stansfield, S. A. and Marmot, M. G. (eds.) (2002), Stress and the Heart,London: BMJ Books
Taskforce on Active Citizenship (2007), Report of the Taskforce on ActiveCitizenship, Dublin: Secretariat of the Taskforce on Active Citizenship
Tay, J. B., Kelleher, C. C., Hope, A., Barry, M., Nic Gabhainn, S. N. andSixsmith, J. (2004), ‘Influence of Sociodemographic andNeighbourhood Factors on Self-Rated Health and Quality of Life inRural Communities: Findings from the Agriproject in the Republic ofIreland’, Journal of Epidemiology and Community Health, vol. 11, pp.904–911
Tussing, A. D. and Wren, M. A. (2006), How Ireland Cares. The Case forHealth Care Reform, Dublin: New Island
Ulmer, H., Kelleher, C. C., Fitz-Simon, N., Diem, G. and Concin, C. (2007),‘Secular Trends in Cardiovascular Risk Factors: An Age-Period CohortAnalysis of 698,954 Health Examinations in 181,350 Austrian Men and Women’, Journal of International Medicine, vol. 261, no. 6, pp. 566–576
WHC and NCR (2006), Women and Cancer in Ireland 1994–2001, Dublin:Women’s Health Council and National Cancer Registry
Wilkinson, R. (1996), Unhealthy Societies: The Affliction of Inequality,London: Routledge
228
Welfare Policy and Poverty
Chapter 07 17/09/2007 16:53 Page 228
Chapter 8
Disability and poverty
Eithne Fitzgerald
Introduction
People with disabilities or long-term health conditions are oneof the groups in Irish society at highest risk of poverty. Thesehigh poverty levels are linked to a very low rate ofparticipation in employment. There is a two-way link betweendisability and poverty. Not only are disabled people morelikely to be poor, but also, in Ireland as elsewhere, peoplewho are poor are more likely to become disabled or todevelop a long-term illness. This reflects the well-establishedlink between income or social class and poorer health.
While the sustained period of economic growth in Irelandfrom the mid-1990s has led to significant reductions ineconomic risk for other groups, people with disabilities haveremained highly vulnerable to poverty and their employmentrates have not risen in spite of the jobs boom. People withdisabilities are also disproportionately likely to experiencesocial exclusion in other areas of life. They have significantlylower participation than others in areas such as education,employment, marital status, car ownership, physical accessto the environment and social life. People with disabilities,
229
Chapter 08 17/09/2007 16:54 Page 229
whatever their age, have on average lower educationalqualifications, which reduce their prospects of being in workand lower their earning capacity if in a job. So lowereducational attainment increases the likelihood of poverty.
For three out of four disabled people, those whoseimpairment or long-term illness restricts them in their day-to-day activities, disability status adds to the degree of povertyand social exclusion they would experience because they are older or less educated than the average. For one in fourdisabled people, those whose impairment does not restrictthem in their day-to-day activities, the higher degree ofpoverty they experience reflects the fact that they are drawn from an older, less educated population than theaverage.
The Commission on the Status of People with Disabilities(1996) drew attention to the high incidence of poverty amongthose out of work due to illness or disability andrecommended enhanced welfare support, a cost of disabilitypayment and actions to raise employment rates. Theincreased focus on disability subsequent to the Commission’sreport led to a number of legislative and other initiatives,culminating in the announcement in 2004 of a nationaldisability strategy to address the exclusion of people withdisabilities through a range of joined-up measures.
This chapter sets out the facts and figures on the poverty andsocial exclusion of people with disabilities and long-termhealth conditions; documents the links between poverty, lowlevels of education and absence from the labour market;traces the evolution of public policy on disability and socialexclusion; and examines how disability has been addressedin successive national strategy documents on poverty.
230
Welfare Policy and Poverty
Chapter 08 17/09/2007 16:54 Page 230
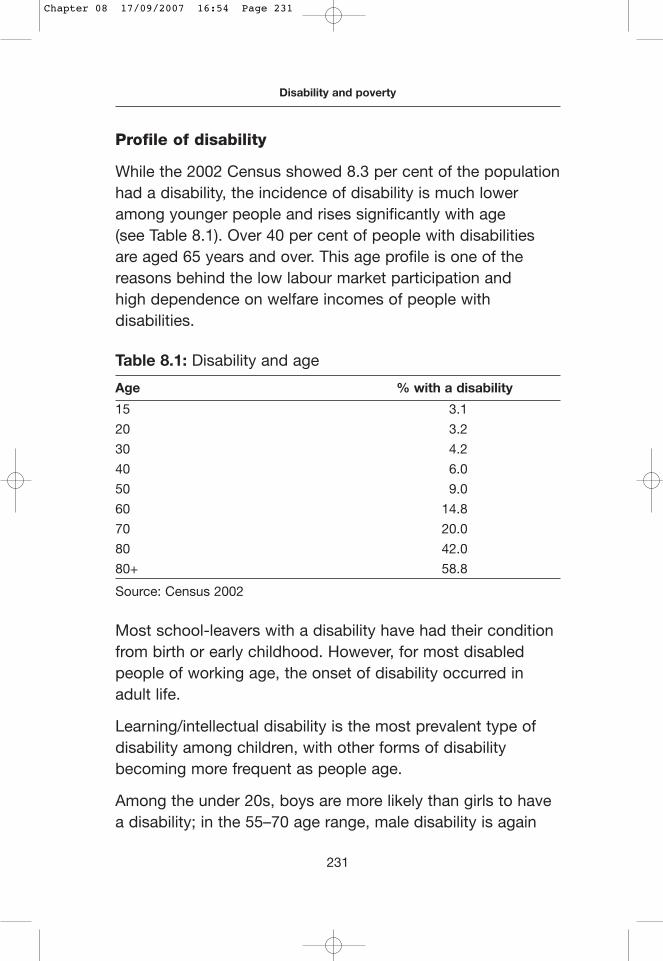
Profile of disability
While the 2002 Census showed 8.3 per cent of the populationhad a disability, the incidence of disability is much loweramong younger people and rises significantly with age (see Table 8.1). Over 40 per cent of people with disabilitiesare aged 65 years and over. This age profile is one of thereasons behind the low labour market participation and high dependence on welfare incomes of people withdisabilities.
Table 8.1: Disability and age
Age % with a disability
15 3.1
20 3.2
30 4.2
40 6.0
50 9.0
60 14.8
70 20.0
80 42.0
80+ 58.8
Source: Census 2002
Most school-leavers with a disability have had their conditionfrom birth or early childhood. However, for most disabledpeople of working age, the onset of disability occurred inadult life.
Learning/intellectual disability is the most prevalent type ofdisability among children, with other forms of disabilitybecoming more frequent as people age.
Among the under 20s, boys are more likely than girls to havea disability; in the 55–70 age range, male disability is again
231
Disability and poverty
Chapter 08 17/09/2007 16:54 Page 231
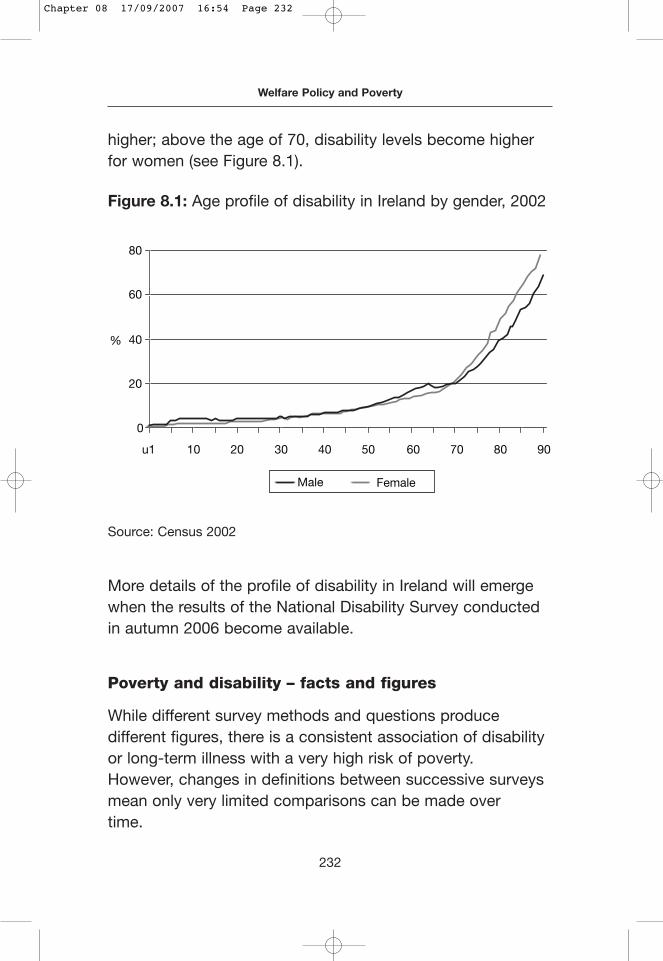
higher; above the age of 70, disability levels become higherfor women (see Figure 8.1).
More details of the profile of disability in Ireland will emergewhen the results of the National Disability Survey conductedin autumn 2006 become available.
Poverty and disability – facts and figures
While different survey methods and questions producedifferent figures, there is a consistent association of disabilityor long-term illness with a very high risk of poverty. However, changes in definitions between successive surveysmean only very limited comparisons can be made over time.
232
Welfare Policy and Poverty
Figure 8.1: Age profile of disability in Ireland by gender, 2002
Source: Census 2002
0
20
40
60
80
u1 10 20 30 40 50 60 70 80 90
%
Male Female
Chapter 08 17/09/2007 16:54 Page 232
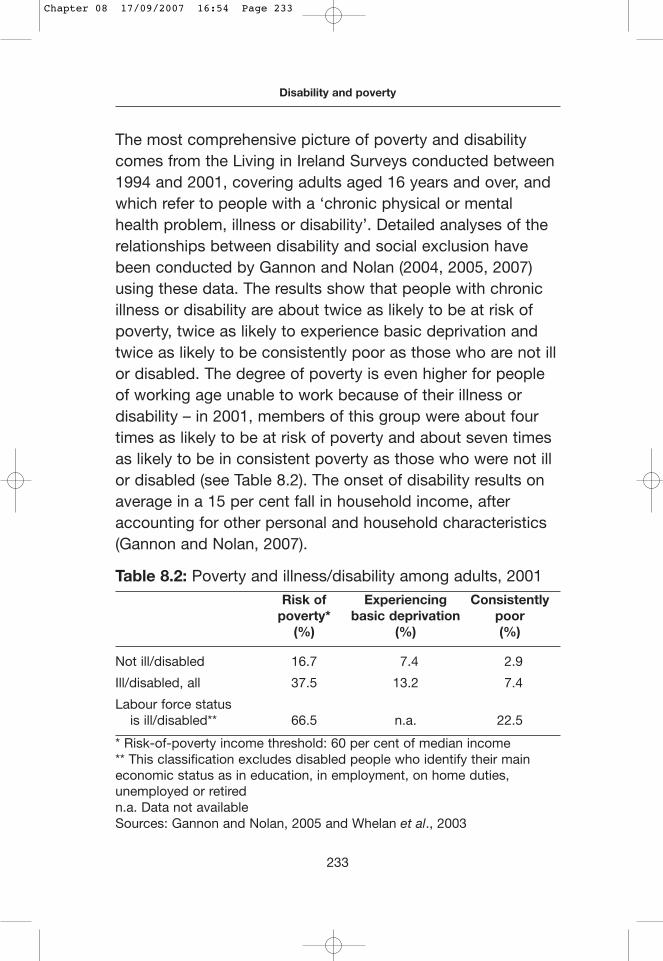
The most comprehensive picture of poverty and disabilitycomes from the Living in Ireland Surveys conducted between1994 and 2001, covering adults aged 16 years and over, andwhich refer to people with a ‘chronic physical or mentalhealth problem, illness or disability’. Detailed analyses of therelationships between disability and social exclusion havebeen conducted by Gannon and Nolan (2004, 2005, 2007)using these data. The results show that people with chronicillness or disability are about twice as likely to be at risk ofpoverty, twice as likely to experience basic deprivation andtwice as likely to be consistently poor as those who are not illor disabled. The degree of poverty is even higher for peopleof working age unable to work because of their illness ordisability – in 2001, members of this group were about fourtimes as likely to be at risk of poverty and about seven timesas likely to be in consistent poverty as those who were not illor disabled (see Table 8.2). The onset of disability results onaverage in a 15 per cent fall in household income, afteraccounting for other personal and household characteristics(Gannon and Nolan, 2007).
Table 8.2: Poverty and illness/disability among adults, 2001Risk of Experiencing Consistently
poverty* basic deprivation poor(%) (%) (%)
Not ill/disabled 16.7 7.4 2.9
Ill/disabled, all 37.5 13.2 7.4
Labour force status is ill/disabled** 66.5 n.a. 22.5
* Risk-of-poverty income threshold: 60 per cent of median income** This classification excludes disabled people who identify their maineconomic status as in education, in employment, on home duties,unemployed or retiredn.a. Data not availableSources: Gannon and Nolan, 2005 and Whelan et al., 2003
233
Disability and poverty
Chapter 08 17/09/2007 16:54 Page 233
Restriction in daily activitiesThree out of every four people with a disability are hamperedin day-to-day activities by their impairment. The higher thedegree of restriction experienced, the greater the likelihood ofbeing in poverty or socially excluded in other ways. In 2001,about one in four of those severely hampered in dailyactivities experienced basic deprivation – that is goingwithout basics because of lack of money, or running into debton day-to-day living expenses (Gannon and Nolan, 2005).This may reflect the extra costs of living associated withhaving a restrictive disability.
Strong link between poverty and joblessnessEmployment figures from Census 2002 show 26 per cent ofdisabled people of working age have a job compared to a 70per cent employment rate for non-disabled people. In 2001,over 80 per cent of chronically ill or disabled people at risk ofpoverty were living in households where no one had a job.Being out of work, or living in a household where no oneworks, is one of the principal explanations for the higherpoverty rate experienced by people with disabilities. Living ina working household lifts people out of poverty – three-quarters of ill or disabled people above the risk-of-povertyline live in homes where there are one or more people in work(Gannon and Nolan, 2005).1 The association betweenpersistent disability and a higher likelihood of being poor isalso significantly linked to the absence of a job (Gannon andNolan, 2007).2 A history of employment, as evidenced byhaving an occupational pension, also led to reduced poverty
234
Welfare Policy and Poverty
___________
1 This finding is similar to that of Burchardt (2003) for the UK.2 Where persistent disability refers to people recorded with a chronic
illness or disability in each year from 1995 to 2001.
Chapter 08 17/09/2007 16:54 Page 234
risk (Gannon and Nolan, 2005).3 This evidence shows thatraising employment rates must be an important part of thestrategy to reduce poverty among people of working age withdisabilities.
People who are already out of work are somewhat more likelyto experience the onset of a chronic illness or disability. Suchonset is associated with a drop of about 20 per cent inemployment participation rates (Gannon and Nolan, 2007).
Education gapThere is a consistent pattern of lower levels of educationachieved by people with disabilities compared to others oftheir generation (NDA, 2005b). This gap is larger for youngergenerations. Chronic illness or disability in childhood cantreble the risk of leaving school with no qualifications, that iswithout having attained at least a Junior Certificate orequivalent, once the impact of age, gender and region oneducation are separated out. The probability that someoneseverely hampered by illness or disability left school with noqualification is 60 per cent compared to 20 per cent for anon-disabled person (Gannon and Nolan, 2005).
There are strong links between low qualifications and theemployment prospects of people with disabilities. Forexample, the employment rate in 2002 of disabled men aged
235
Disability and poverty
___________
3 Gannon and Nolan (2005) find that 67 per cent of those ill/disabled butnot at risk of poverty rely mainly on incomes from work, while 13.7 percent rely mainly on private pensions. 86.5 per cent of ill/disabled atpoverty risk rely mainly on social welfare incomes. Econometricanalysis, taking other background factors into account, shows thathaving a job reduces the likelihood of being below the 60 per cent ofmedian income line by 23 percentage points and of being consistentlypoor by about 5 percentage points.
Chapter 08 17/09/2007 16:54 Page 235
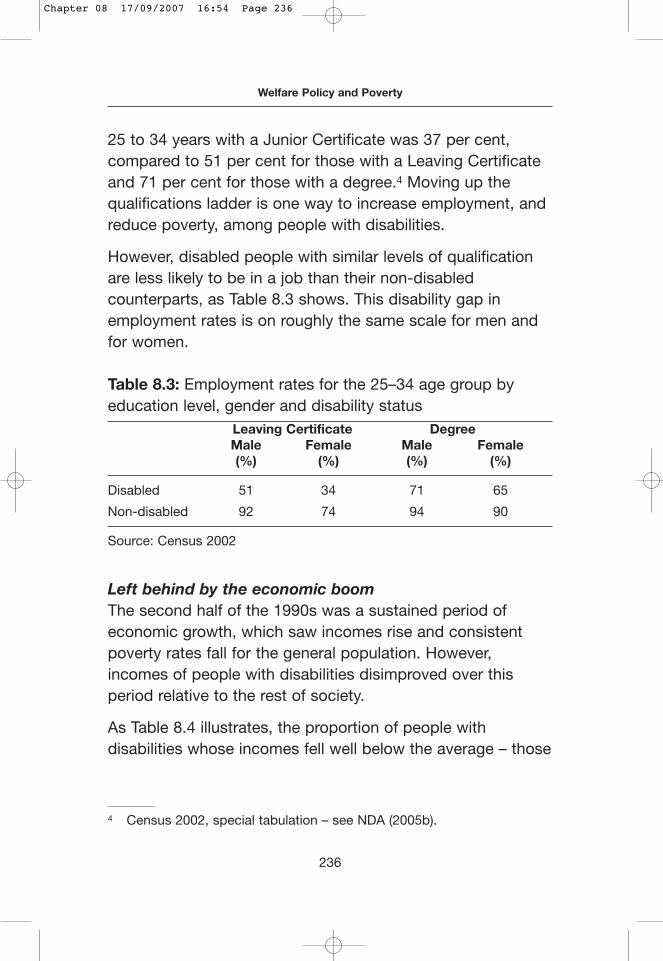
25 to 34 years with a Junior Certificate was 37 per cent,compared to 51 per cent for those with a Leaving Certificateand 71 per cent for those with a degree.4 Moving up thequalifications ladder is one way to increase employment, andreduce poverty, among people with disabilities.
However, disabled people with similar levels of qualificationare less likely to be in a job than their non-disabledcounterparts, as Table 8.3 shows. This disability gap inemployment rates is on roughly the same scale for men andfor women.
Table 8.3: Employment rates for the 25–34 age group byeducation level, gender and disability status
Leaving Certificate DegreeMale Female Male Female(%) (%) (%) (%)
Disabled 51 34 71 65
Non-disabled 92 74 94 90
Source: Census 2002
Left behind by the economic boomThe second half of the 1990s was a sustained period ofeconomic growth, which saw incomes rise and consistentpoverty rates fall for the general population. However,incomes of people with disabilities disimproved over thisperiod relative to the rest of society.
As Table 8.4 illustrates, the proportion of people withdisabilities whose incomes fell well below the average – those
236
Welfare Policy and Poverty
___________
4 Census 2002, special tabulation – see NDA (2005b).
Chapter 08 17/09/2007 16:54 Page 236
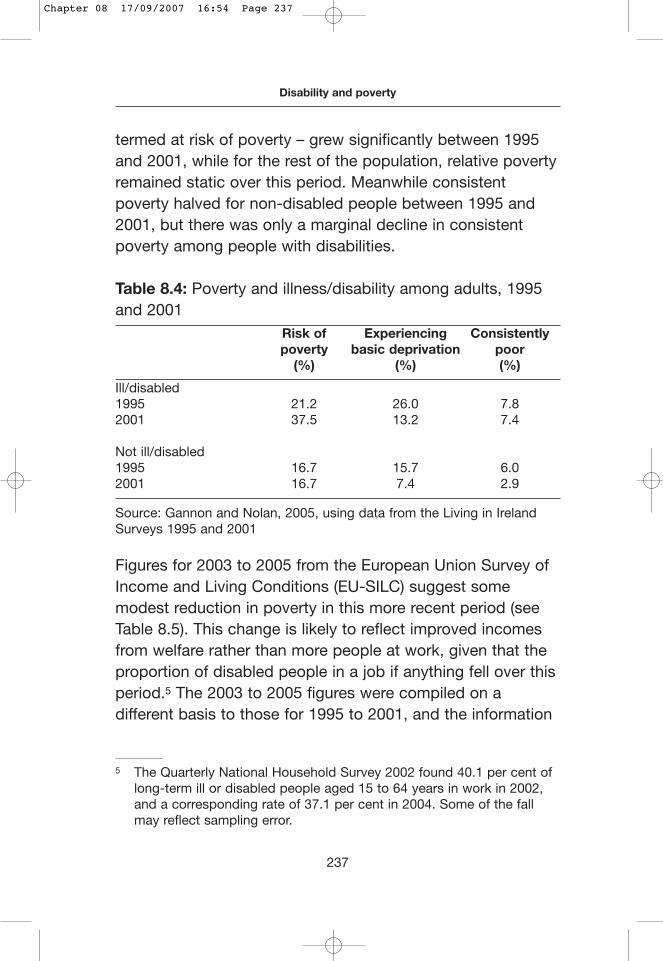
termed at risk of poverty – grew significantly between 1995and 2001, while for the rest of the population, relative povertyremained static over this period. Meanwhile consistentpoverty halved for non-disabled people between 1995 and2001, but there was only a marginal decline in consistentpoverty among people with disabilities.
Table 8.4: Poverty and illness/disability among adults, 1995and 2001
Risk of Experiencing Consistentlypoverty basic deprivation poor
(%) (%) (%)
Ill/disabled1995 21.2 26.0 7.82001 37.5 13.2 7.4
Not ill/disabled1995 16.7 15.7 6.02001 16.7 7.4 2.9
Source: Gannon and Nolan, 2005, using data from the Living in IrelandSurveys 1995 and 2001
Figures for 2003 to 2005 from the European Union Survey ofIncome and Living Conditions (EU-SILC) suggest somemodest reduction in poverty in this more recent period (seeTable 8.5). This change is likely to reflect improved incomesfrom welfare rather than more people at work, given that theproportion of disabled people in a job if anything fell over thisperiod.5 The 2003 to 2005 figures were compiled on adifferent basis to those for 1995 to 2001, and the information
237
Disability and poverty
___________
5 The Quarterly National Household Survey 2002 found 40.1 per cent oflong-term ill or disabled people aged 15 to 64 years in work in 2002,and a corresponding rate of 37.1 per cent in 2004. Some of the fallmay reflect sampling error.
Chapter 08 17/09/2007 16:54 Page 237
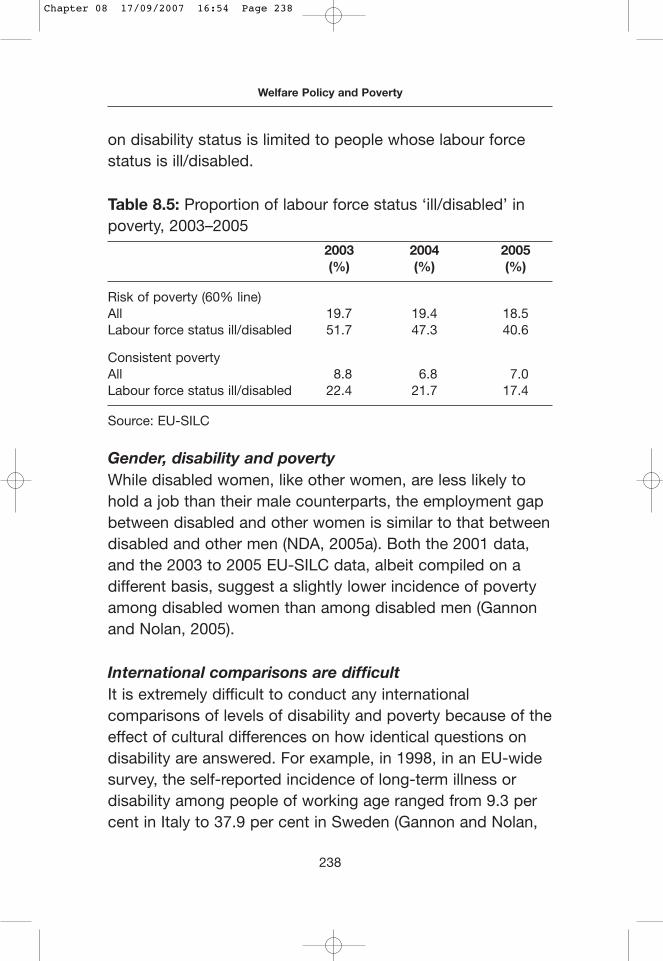
on disability status is limited to people whose labour forcestatus is ill/disabled.
Table 8.5: Proportion of labour force status ‘ill/disabled’ inpoverty, 2003–2005
2003 2004 2005(%) (%) (%)
Risk of poverty (60% line)All 19.7 19.4 18.5Labour force status ill/disabled 51.7 47.3 40.6
Consistent povertyAll 8.8 6.8 7.0Labour force status ill/disabled 22.4 21.7 17.4
Source: EU-SILC
Gender, disability and povertyWhile disabled women, like other women, are less likely tohold a job than their male counterparts, the employment gapbetween disabled and other women is similar to that betweendisabled and other men (NDA, 2005a). Both the 2001 data,and the 2003 to 2005 EU-SILC data, albeit compiled on adifferent basis, suggest a slightly lower incidence of povertyamong disabled women than among disabled men (Gannonand Nolan, 2005).
International comparisons are difficultIt is extremely difficult to conduct any internationalcomparisons of levels of disability and poverty because of theeffect of cultural differences on how identical questions ondisability are answered. For example, in 1998, in an EU-widesurvey, the self-reported incidence of long-term illness ordisability among people of working age ranged from 9.3 percent in Italy to 37.9 per cent in Sweden (Gannon and Nolan,
238
Welfare Policy and Poverty
Chapter 08 17/09/2007 16:54 Page 238
2004). That means that cross-country differences in povertyrates may be attributable to how people describe theirdisability status and not necessarily to underlying differencesin poverty rates across countries.
Wider exclusionLow employment levels and a higher risk of poverty are justtwo aspects of the higher risk of social exclusion faced bypeople with disabilities across widespread aspects of theirlives (NDA, 2005b). Compared to non-disabled people,people with disabilities are:
• Less likely to have achieved any qualifications
• Earning less on average in a job
• Less likely to marry, and more likely to be separated ordivorced
• More likely to experience poor health
• Less likely to be physically active
• More likely to live with their parents well into adulthood
• Less likely to have a car
• More likely to have difficulty with public transport
• Less likely to have a computer or Internet connection
• More restricted in socialising outside the home
• Less likely to have an annual holiday.
In the light of this multidimensional picture of exclusion, it isimportant that public policy to tackle it is equally broadranging. The next section traces how disability policy inIreland has evolved towards a wider focus on inclusion.
239
Disability and poverty
Chapter 08 17/09/2007 16:54 Page 239
The evolution of disability policy
Historically, disability policy in Ireland developed within amedical model, characterised by provision of care in largesegregated institutions. Until the mid-1960s, the stateengaged in little strategic thinking or planning for disabilityservices, with new services largely emerging only where thevoluntary sector had taken an initiative. It was a laissez-faireapproach, where the state neither undertook the duty toprovide services nor acknowledged the rights of individualswith disabilities. Even when the state began to take a moreactive role in the planning and funding of services, forexample following the report of the Commission of Inquiry onMental Handicap (1965), the emphasis initially remained onseparate provision, dependence and inability.
International developmentsIn the last decades of the twentieth century, an increasedinternational focus on disability was marked by a shift inpolicy away from segregation and dependence towardspromoting inclusion, equality and independence. Leadingdisability thinkers argued for replacing the medical model ofdisability with a social model (Oliver, 1989). Years of activismby people with disabilities, including Vietnam War veterans,led to the US’s path-breaking Americans with Disabilities Actin 1990.
The UN’s World Programme of Action on Disability in 1982was followed by a Decade of Disabled Persons (1983–1992)and the UN Standard Rules on the Equalization ofOpportunities for Persons with Disabilities in 1993. As well asthe traditional areas of care and rehabilitation, these Rulescovered accessibility, education, employment, incomes,social security, family life, culture, recreation, sport and
240
Welfare Policy and Poverty
Chapter 08 17/09/2007 16:54 Page 240
religion. This work culminated in the adoption of the UNConvention on the Rights of Persons with Disabilities, whichwas signed by eighty-eight countries, including Ireland, whenthe process for ratification opened in spring 2007.6 A keyfeature of the drafting of this Convention was the involvementof people with disabilities and their representativeorganisations.
In Ireland as elsewhere, people with disabilities and theirfamilies have increasingly found their voice, putting disabilityissues on the public agenda. As Quin and Redmond (2005, p. 144) note: ‘The concept of rights has been of centralimportance in switching the focus from the individual’s“inability” to perform a range of physical and intellectual tasksto a society which takes little or no account of suchdifferences, organising itself in such a way that those whoneed to do things differently from the norm are hampered’.
In 1993, the Department of Equality and Law Reform was setup (from 1997 it was merged into the Department of Justice,Equality and Law Reform) and took over strategic policy ondisability from the Department of Health, marking an explicitbreak with the medical model, and a new focus on disabilityas an equality issue. One of the first acts of the newdepartment was to establish the Commission on the Status ofPeople with Disabilities, which had a majority of membersconsisting of people with disabilities or their immediatefamilies.
The Commission’s landmark 1996 report A Strategy forEquality has guided Ireland’s changed approach to disability
241
Disability and poverty
___________
6 The two-stage process for adoption of the convention is signaturefollowed by ratification.
Chapter 08 17/09/2007 16:54 Page 241
policy. The key principles set out in the Commission’s reportare:
• Equality – that people with disabilities should berecognised and treated as having equal status with allother citizens
• Participation – that people with disabilities have the rightto participate in Irish life to the fullest extent
• Independence and choice – that people with disabilitieshave the right to be able to achieve their full potential,make their own decisions and choices.
Legislation outlawing discrimination in the provision of goodsand services and in employment on grounds of disability(among other grounds) followed: the Employment Equality Act1998, the Equal Status Act 2000 and the Equality Act 2004.
From June 2000, it became official policy to incorporatepolicies and services for people with disabilities into themainstream work of government departments and publicbodies. This was given legal effect in the Disability Act 2005.As an example of the move from specialist to mainstreamprovision, the specialist state disability agency – the NationalRehabilitation Board – was dissolved, its employmentservices were re-assigned to FÁS and its role in advisingindividuals on entitlements went to Comhairle (now theCitizens Information Board).
National disability strategyThe national disability strategy announced in autumn 2004comprises new laws on services and supports, statutoryaction plans on disability (entitled sectoral plans) in six key
242
Welfare Policy and Poverty
Chapter 08 17/09/2007 16:54 Page 242
government departments, a personal advocacy service toassist the most vulnerable people to access the services theyrequire and a multi-annual investment programme for disabilitysupport services. A monitoring mechanism – involving seniorofficials across key departments together with disabilitystakeholders and the National Disability Authority (NDA) – hasbeen set up to oversee coherence and delivery and to reportto the Cabinet Committee on Social Inclusion.
The key legislative elements of the strategy are the DisabilityAct 2005, the Education for Persons with Special EducationalNeeds Act 2004 and the Citizens Information Act 2007. TheDisability Act provides for independent statutory assessmentof disability service needs, and for delivery of services to meetthose needs, subject to resource constraints. A commitmentto €18.8 billion for disability services needs was made in theNational Development Plan 2007–2013 (Ireland, 2007b). TheEducation for Persons with Special Education Needs Actprovides for a parallel system of assessment of children’seducation needs and for allocation of resources to meet these.The emphasis is on integrated education where appropriate.
The Disability Act obliges public bodies to cater for peoplewith disabilities alongside other service users, supported byaccessible information and premises and procurement ofaccessible goods and services. The Act gives legal effect tothe public sector employment target (first set in 1977) thatpeople with disabilities should make up at least 3 per cent ofthe total staff.
Sectoral plansOne of the most innovative features of the Disability Act is therequirement for special disability action plans – entitledsectoral plans – from six of the key government departments.
243
Disability and poverty
Chapter 08 17/09/2007 16:54 Page 243
Covering communications, employment, environment andhousing, health, social welfare and transport, the first planswere adopted by the Oireachtas in October 2006. Disabilityaction plans across a range of government agencies are alsoa feature of the Australian7 and New Zealand disabilitystrategies, but Ireland is unique in giving such plans thestatus of statutory endorsement by parliament.
Each sectoral plan provides for an internal complaintsmechanism and appeal to the Ombudsman. There is astatutory requirement for cross-departmental cooperation inthree key interfaces: between social welfare, health andemployment; between housing authorities and the healthservice; and between transport and the environment.
The sectoral plans set out targets and timetables foraccessible streets, parks and public sector offices; accessiblepublic transport; subtitled television broadcasts; employmentand social welfare; and for independent assessment ofdisability service and care needs. As people with disabilitiesexperience social exclusion which goes well beyond materialpoverty, a broad-ranging and joined-up approach of this kindis essential if the multiple causes and aspects of socialexclusion are to be satisfactorily addressed.
The Department of Enterprise, Trade and Employment’ssectoral plan 2006 promises a comprehensive employmentstrategy for people with disabilities and sets a target for anextra 7,000 people with disabilities in work by 2010. TheDepartment of Social and Family Affairs sectoral plan 2006
244
Welfare Policy and Poverty
___________
7 Originally, Australian government departments adopted separateannual disability action plans; now these plans are integrated intodepartments’ strategy statements and business plans.
Chapter 08 17/09/2007 16:54 Page 244
proposes a systematic programme of engagement withpeople on disability payments to encourage maximumparticipation in society. This is in line with the NESC’s TheDevelopmental Welfare State (2005), which advocates a shiftfrom passive income support to pathways for participation.
The sectoral plans also propose to address benefit trapswhich inhibit entry to the workforce. Research suggests thatthe key issue in this area for people with disabilities is theretention of the medical card (Workway, 2005).
Towards 2016The social partnership agreement Towards 2016 (Ireland,2006) is built around a lifecycle framework, with policiesaddressed at children, working-aged adults, elderly peopleand people with disabilities. On disability, the agreement setsout long-term goals for the ten years to 2016:
• Every person with a disability will have access to anincome which is sufficient to sustain an acceptablestandard of living
• Every person with a disability will, in conformity with theirneeds and abilities, have access to appropriate care,health, education, employment, training and socialservices
• Every person with a disability will have access to publicspaces, buildings, transport, information, advocacy andother public services and appropriate housing
• Every person with a disability will be supported to enablethem, as far as possible, to lead full and independentlives, to participate in work and in society and to maximisetheir potential
245
Disability and poverty
Chapter 08 17/09/2007 16:54 Page 245
• Carers will be acknowledged and supported in their caringrole.
These goals harmonise with the approach to rights set out inthe Disability Legislation Consultative Group’s Equal Citizens(2003, p. 10): ‘A key issue is that a rights-based approachpositions the individual person with disabilities at the centreof service provision, and through needs assessment andservice coordination resources are attached to the personhim/herself’.
Strategic approaches to disability and poverty
In line with an increasing focus on disability issues in publicpolicy generally, the emphasis on disability issues in theNational Action Plan for Social Inclusion 2007–2016 (Ireland,2007a) is significantly greater than in its predecessors.
National Anti-Poverty Strategy 1997
Ireland’s first anti-poverty strategy document Sharing inProgress (Ireland, 1997) touched on disability, but its mainfocus was on preventing and providing pathways out of long-term unemployment. Many of the proposals on disabilityidentified by the Working Group on Long-term Unemploymentwhich fed into the National Anti-Poverty Strategy, such asaction on job retention, an income support payment forpeople who wish to take up employment and initiatives topromote workplace redesign, did not make it into the finalcore strategy. Those actions on disability which were includedcentred on strengthening the 3 per cent employment targetfor people with disabilities throughout the wider public serviceand ensuring a continuum of provision in special education.
246
Welfare Policy and Poverty
Chapter 08 17/09/2007 16:54 Page 246
Building an Inclusive Society 2002Ireland’s second anti-poverty strategy (2002) contained fewtargets on disability and poverty, citing the lack of data. Itproposed raising the proportion of people with disabilities inthird level education to 1.35 per cent in 2003 and 1.9 per centby 2006. Improved respite care arrangements were alsopromised.
National Action Plan for Social Inclusion 2007–2016One of the high-level goals of the latest anti-poverty strategydocument, the National Action Plan for Social Inclusion2007–2016 (Ireland, 2007a), is to raise employment rates ofpeople with disabilities. Its chapter on disability issuesincorporates commitments made in the sectoral plans,Towards 2016 and the National Development Plan2007–2013, including commitments on improved accessibilityof the environment, transport and housing. The action plansets the goal of reducing consistent poverty to between 2and 4 per cent by 2012, but it does not set any separatetargets for reducing poverty rates among people withdisabilities.
Focus on employment
There is now a growing emphasis in official policy onemployment as a strategy to reduce poverty among peoplewith disabilities.
The Commission on the Status of People with Disabilities(1996) set modest targets for measures to expandemployment of people with disabilities – an extra 500 placesin sheltered employment, 500 equipment adaptation grants tobe paid each year and 500 places on the employmentsupport scheme. As data on the scale of the employment gap
247
Disability and poverty
Chapter 08 17/09/2007 16:54 Page 247
have become available, the NDA (2005a) shows that ifemployment rates of those disabled people who are able towork were to rise to that of their non-disabled peers, it wouldmean an extra 14,000 people at work.
Drawing on the experience of reintegrating other marginalisedgroups into employment, the NDA (2006) recommends acomprehensive five-point strategy for employment of peoplewith disabilities, which in summary is to:
• Remove benefit traps and make work pay
• Equip people with disabilities for today’s labour marketthrough effective education, training and work experience
• Achieve leadership from private and public sectors inoffering jobs
• Stem the flow into inactivity by focusing on job retentionand reducing the numbers leaving school early withoutqualifications
• Develop a systematic process of engagement with peoplewith disabilities around their employment aspirations.
This work has informed the targets set in the 2006 sectoralplan on employment and its commitment to develop acomprehensive employment strategy for people withdisabilities.
Social welfare
Over the years, income support through the social welfaresystem has been the main tool used to address povertyissues for people with disabilities. It will remain central tooffering decent incomes to older people with disabilities andothers who are unable to earn their living.
248
Welfare Policy and Poverty
Chapter 08 17/09/2007 16:54 Page 248
Social welfare provisionIn 2005, almost 250,000 people were receiving social welfarepayments each week relating to illness, disability or caring.About 133,000 of these were social insurance payments,payable to people with a history of employment and without ameans test. 81,000 were means-tested payments in respectof long-term disability and 26,000 were carers’ payments. TheCommission on Social Welfare (1986) argued forimprovements in the basic rates of all social welfarepayments rather than higher rates for payments related todisability. The Commission’s approach to raising andharmonising benefit levels has informed social welfare policyin the intervening years. The Social Welfare Benchmarkingand Indexation Group (DSFA, 2001), established under theProgramme for Prosperity and Fairness (Ireland, 1999),recommended targets for welfare payment rates as apercentage of gross average industrial earnings. Adherenceto this approach has retained a relationship between welfareincomes and incomes elsewhere in the community.
Commission on the Status of People with DisabilitiesThe Commission on the Status of People with Disabilities(1996) recommended the introduction of a disability pension,a cost of disability payment and a carer’s allowance for allcarers. It recommended the disability pension be set at theinvalidity pension level, payable to all who qualified, includingpeople living in residential care, without a means test.
Of the Commission’s recommendations, disability allowancehas been extended since 1999 to people entering residentialcare, and from 2007 to all people with disabilities alreadyliving in residential care, most of whom had previously noentitlement to an independent social welfare income.
249
Disability and poverty
Chapter 08 17/09/2007 16:54 Page 249
However people in long-term residential care are now subjectto statutory maintenance charges. Separate schemes ofinsurance-based invalidity pension and a means-testeddisability allowance remain.
From passive welfare payments towards promotingparticipationThe Developmental Welfare State (NESC, 2005) highlights thelargely passive nature of the Irish income support system andargues for tailored progression pathways to be the rule ratherthan the exception for welfare recipients of working age. Thisreport’s strategic thinking informs the sectoral plan on socialwelfare and underpins the Towards 2016 social partnershipagreement. Specifically, the report draws attention to thesteady growth in dependence on disability payment transfers.In the decade to 2005, the numbers receiving these paymentsgrew by about 100,000. In common with the ExpenditureReview on Illness and Disability Payment Schemes (DSFA,2003), the NESC argued for a more flexible system offeringincome support to people who would be partially incapable ofwork. Informed by research highlighting the practical impactof the benefits trap, the earnings limit for people engaged inrehabilitative employment was relaxed, from June 2006, toallow a tapered retention of disability allowance andsecondary benefits where earnings are below €350 per week.
Towards 2016Towards 2016 sets out the following commitment in relationto income support (Ireland, 2006, p. 68):
In terms of ensuring adequate levels of income for peoplewith disabilities, we will work for the continuedenhancement and integration of supports in line with
250
Welfare Policy and Poverty
Chapter 08 17/09/2007 16:54 Page 250
overall social welfare commitments and targets. This willinclude a rationalisation of existing allowances for peoplewith disabilities in the context of the Government’s policyof mainstreaming and the proposed transfer of functionsfrom the Health Service Executive to the Department ofSocial and Family Affairs. Other issues around cost ofdisability will be considered following the development of aneeds assessment system provided for under Part 2 of theDisability Act, 2005.
Cost of disabilityThe Commission on the Status of People with Disabilities(1996) identified the extra costs of living for people with adisability in respect of additional equipment, medical,transport, communication, daily living and care costs. Bothnational and international studies show considerable variationin what those costs are for individuals.8 The Commissioncalled for a variable cost of disability payment to beintroduced where these extra costs were not being met inother ways, such a payment would be linked into a needsassessment process and paid independent of employmentstatus.
People on long-term disability-type payments (disabilityallowance and invalidity pension) qualify for free travel and forthe household benefits package in the same way as
251
Disability and poverty
___________
8 Indecon (2004) gathered together national and international evidenceon the extra costs of living associated with disability. Using amethodology similar to that used to derive equivalence scales for largeand small households, this study tried to quantify the scale ofadditional costs which might be involved, however these estimates aresubject to considerable sampling error given the degree of variationinvolved.
Chapter 08 17/09/2007 16:54 Page 251
pensioners. The blind welfare allowance is a form of cost ofdisability payment, but limited to this particular impairmentonly. The Expenditure Review of Illness and DisabilityPayment Schemes (DSFA, 2003, p. 53) recommends that theadditional costs of disability be met through a separatepayment: ‘Needs arising from the additional costs of disabilityshould be addressed separately rather than through higherbasic income maintenance payments, which would not betargeted at those individuals whose needs are greatest. Theadditional costs of disability are best met in ways that areless dependent on the person’s labour force status’.
The NDA (2004) also recommends introduction of a cost ofdisability payment and estimates that a payment ranging inscale from €10 to €40 a week would cost about €170 millionper year. The sectoral plans and Towards 2016 socialpartnership agreement commit to further consideration of thecost of disability issue when the needs assessment processprovided for in Part 2 of the Disability Act is in place.
Conclusions
People with disabilities are among the groups at highest riskof poverty, with those whose labour force status is ‘unable towork’ and those whose disabilities severely restrict everydaylife the most vulnerable of all to poverty. While employmenthas boomed in Celtic Tiger Ireland, the number of peoplerelying on social welfare disability payments has grown byover two-thirds and the employment rates of people withdisabilities have fallen. If, in the face of the boom years,employment of people with disabilities remained static or fell,it is clear there is a need for a change in the strategicdirection of employment policy.
252
Welfare Policy and Poverty
Chapter 08 17/09/2007 16:54 Page 252
There must be a comprehensive approach which addressessystemic issues such as the benefits trap and the passivenature of income support, which stems the outflow fromemployment by promoting retention and re-employment ofpeople who acquire a disability in adult life and whichengages both private and public sector employers in thistask. Official thinking, as evidenced in the sectoral plans,Towards 2016 and the National Action Plan on SocialInclusion 2007–2016, is moving in this direction. Settingnumerical targets for improving employment numbers andrates provides the impetus to carry through with the changedpolicies to achieve those targets.
However many people with disabilities take up work, therewill always be considerable numbers who remain outside theworkforce, such as the 40 per cent of people with disabilitiesover pension age as well as those whose illness orimpairment restricts their capacity to earn a living. Adequatelevels of welfare payments, which track other incomes insociety, will remain the cornerstone of anti-poverty policiesfor this group.
There is now widespread recognition that the extra costs ofdisability need to be addressed. The cost of disability is a keyissue on the anti-poverty as well as the equality agenda, asthe evidence shows that people with disabilities aresignificantly more likely than others in our society to be goingwithout basic essentials because they cannot afford them.While there are significant practical issues to be addressed incoming up with a fair and workable scheme, earlyconsideration of these practicalities is desirable.
The signing by Ireland of the UN Convention on the Rights ofPeople with Disabilities (2006) should lend a further impetus
253
Disability and poverty
Chapter 08 17/09/2007 16:54 Page 253
to the disability policy developments of recent years (seeAppendix). Tackling poverty needs to remain central to thatdisability agenda.
ReferencesBurchardt, T. (2003), Being and Becoming: Social Exclusion and the Onset
of Disability, Centre for Analysis of Social Exclusion Report no. 21,London: London School of Economics
Commission of Inquiry on Mental Handicap (1965), Report, Dublin:Stationery Office
Commission on Social Welfare (1986), Report, Dublin: Stationery Office
Commission on the Status of People with Disabilities (1996), A Strategyfor Equality, Dublin: Stationery Office
Disability Legislation Consultative Group (2003), Equal Citizens: Proposalsfor Core Elements of Disability Legislation, Dublin: National DisabilityAuthority
DSFA (2001), Interim Report of the Social Welfare Benchmarking andIndexation Group, Dublin: Department of Social and Family Affairs
DSFA (2003), Expenditure Review of Illness and Disability PaymentSchemes, Dublin: Department of Social and Family Affairs
Gannon, B. and Nolan, B. (2004), Disability and Labour MarketParticipation, Dublin: Equality Authority
Gannon, B. and Nolan, B. (2005), Disability and Social Inclusion in Ireland,Dublin: Equality Authority and National Disability Authority
Gannon, B. and Nolan, B. (2007), The Dynamics of Disability and SocialInclusion, Dublin: Equality Authority and National Disability Authority
Indecon (2004), Disability and the Cost of Living, Dublin: National DisabilityAuthority
Ireland (1997), Sharing in Progress: National Anti-Poverty Strategy, Dublin:Stationery Office
Ireland (1999), Programme for Prosperity and Fairness, Dublin: StationeryOffice
Ireland (2002), Building an Inclusive Society, Dublin: Stationery Office
Ireland (2006), Towards 2016: Ten-Year Framework Social PartnershipAgreement 2007–2016, Dublin: Stationery Office
254
Welfare Policy and Poverty
Chapter 08 17/09/2007 16:54 Page 254
Ireland (2007a), National Action Plan for Social Inclusion 2007–2016,Dublin: Stationery Office
Ireland (2007b), Transforming Ireland: A Better Quality of Life for All,National Development Plan 2007–2013, Dublin: Stationery Office
NDA (2004), ‘Foreword’, Disability and the Cost of Living, Dublin: NationalDisability Authority
NDA (2005a), Disability and Work – The Picture We Learn from OfficialStatistics, Dublin: National Disability Authority
NDA (2005b), How Far Towards Equality?, Dublin: National DisabilityAuthority
NDA (2006), A Strategy of Engagement – Towards a ComprehensiveEmployment Strategy for People With Disabilities, Dublin: NationalDisability Authority
NESC (2005), The Developmental Welfare State, Dublin: NationalEconomic and Social Council
Oliver, M. (1989), ‘The Social Model of Disability: Current Reflections’, inJeffs, T. and Smith, M. (eds.), Social Work and Social Welfare YearBook One, Milton Keynes: Open University Press
Quin, S. and Redmond, B. (2005), ‘Disability and Social Policy’, in Quin,S., Kennedy, P., Matthews, A. and Kiely, G. (eds.), Contemporary IrishSocial Policy, Dublin: UCD Press
UN (2006), Convention on the Rights of Persons with Disabilities, NewYork: United Nations
Whelan, C. T., Layte, R., Maître, B., Gannon, B., Nolan, B., Watson, D. andWilliams, J. (2003), Monitoring Poverty Trends in Ireland: Results fromthe 2001 Living in Ireland Survey, Dublin: ESRI
Workway (2005), The Way Ahead: Workway Policy Paper, Dublin:Workway:www.workway.ie/article/index.php?cat_id=708&item_id=19252
255
Disability and poverty
Chapter 08 17/09/2007 16:54 Page 255
Appendix
UN Convention on the Rights of Persons with Disabilities,Article 28 – Adequate Standard of Living and SocialProtection
1. States Parties recognize the right of persons withdisabilities to an adequate standard of living for themselvesand their families, including adequate food, clothing andhousing, and to the continuous improvement of livingconditions, and shall take appropriate steps to safeguardand promote the realization of this right withoutdiscrimination on the basis of disability.
2. States Parties recognize the right of persons withdisabilities to social protection and to the enjoyment of thatright without discrimination on the basis of disability, andshall take appropriate steps to safeguard and promote therealization of this right, including measures:
(a) To ensure equal access by persons with disabilities toclean water services, and to ensure access toappropriate and affordable services, devices and otherassistance for disability-related needs;
(b) To ensure access by persons with disabilities, inparticular women and girls with disabilities and olderpersons with disabilities, to social protectionprogrammes and poverty reduction programmes;
(c) To ensure access by persons with disabilities and theirfamilies living in situations of poverty to assistancefrom the State with disability-related expenses,including adequate training, counselling, financialassistance and respite care;
256
Welfare Policy and Poverty
Chapter 08 17/09/2007 16:54 Page 256
(d) To ensure access by persons with disabilities to publichousing programmes;
(e) To ensure equal access by persons with disabilities toretirement benefits and programmes.
257
Disability and poverty
Chapter 08 17/09/2007 16:54 Page 257

Chapter 08 17/09/2007 16:54 Page 258
Chapter 9
Migration and social inclusion policy
Jane Pillinger
Introduction
Many migrants living in Ireland today experience exclusion,marginalisation and poverty. Compared to other groups in thepopulation their inclusion and belonging is mediated by theiraccess to rights and entitlements associated with immigrationstatus, and therefore to the conditions that facilitate inclusion,such as work and access to services. Until recently, limitedattention has been given to issues that address socialexclusion, poverty, access to services and migrants’integration into Irish society. Whilst migration was not asubject of the original or revised national anti-povertystrategies, in recent years there has been a recognition of theneed to prioritise the integration of migrants within a broadframework of poverty and social inclusion policy in Ireland(Ireland, 2006; IOM, 2006; NESC, 2006).
This chapter discusses why migration has significantimplications for Irish policy on poverty and social inclusion. It argues that the full integration and inclusion of migrants inIrish society requires investment in resources and anunderstanding of how racism and other barriers to
259
Chapter 09 17/09/2007 16:54 Page 259
participation in society can be overcome. This includesaddressing the interrelated areas of inclusion in work,inclusion in community and civil life and inclusion withrespect to how mainstream institutions can meet individualand societal needs in areas such as education, health,employment, social care and housing.
In this context, the scope of social policy in meeting theneeds of migrants must be addressed through the provisionof culturally appropriate, responsive and accessible servicesthat promote their rights, inclusion and autonomy. Access tosocial inclusion is affected by restrictions that are imposed onsome groups in their access to social rights and access tocertain services. Discrimination and racism also impactnegatively on inclusion by reducing opportunities and byperpetuating institutional or systemic forms of discriminationthat result in poor access to rights and services, for examplebecause of language barriers or because of a lack ofunderstanding of a person’s culture or religion.
Most migrants are young and in work and make fewdemands on services; whereas asylum seekers have differentneeds by virtue of the restrictions imposed on theirparticipation in work and education and also because theymay experience unique health and support needs that mayplace additional demands on services.
Migration has affected Ireland’s economy in positive ways.Evidence from Ireland, the UK and the US shows that there isa fiscal gain from immigrants and that migrants are alsoimportant sources of labour in the social care and healthservices by helping to alleviate labour shortages (IOM, 2006;Ruhs, 2005; Minns, 2005). However, many migrants areworking below their potential in jobs that do not utilise theirskills fully (MRCI, 2007; Pillinger, 2006b).
260
Welfare Policy and Poverty
Chapter 09 17/09/2007 16:54 Page 260
The 2006 Census shows that immigration to Ireland hasaccounted for the majority of Ireland’s recent populationgrowth, with 420,000 foreign nationals living in Ireland in 2006(compared to 224,000 in 2002) (CSO, 2007). Fuelled by thebooming economy and a relatively open policy on immigration,Ireland’s population of non-Irish migrant workers is one of thehighest in the EU and currently stands at 10 per cent of thepopulation. This trend is likely to continue and CSO projectionssuggest that the population will continue to grow in a buoyanteconomy and that the immigration of up to 300,000 newmigrants will take place between 2006 and 2016. Migrationgrowth is likely to account for one-half of Ireland’s populationgrowth between 2006 and 2020 (NESC, 2006). This growth isseen to be particularly important if Ireland is to cope with thecare needs associated with an ageing population.
Although there is relatively limited data on migrants in Ireland,non-Irish nationals have higher rates of consistent poverty (13.1per cent) compared to Irish nationals (6.6 per cent) (Ireland,2007a). There is a higher employment rate amongst migrants(71 per cent of non-Irish nationals compared to 60 per cent ofIrish nationals) (CSO, 2007). Non-Irish nationals have higherlevels of education than Irish nationals, with many workingsignificantly below their potential. Twice as many non-Irishnationals have second level educational qualificationscompared to Irish nationals (54 per cent of non-Irish nationals)(Barrett et al., 2006). In particular, women migrant workersexperience higher levels of exclusion and poverty (IOM, 2006;Pillinger, 2006b).
Anti-poverty and social inclusion policy context
Anti-poverty and social inclusion measures are not onlyimportant to promoting inclusion and integration, but also to
261
Migration and social inclusion policy
Chapter 09 17/09/2007 16:54 Page 261
preventing racism and addressing access to services inareas such as health, childcare, training and employment.Underpinning much of the recent development of Irish policyhas been the progression of a multifaceted approach toequality covering both employment equality and equality inthe provision of services. The Equal Status Acts 2000 and2004 play an important role in improving access tohealthcare, welfare, education, employment, housing andother services.
The National Anti-Poverty Strategy (Ireland, 1997), Buildingan Inclusive Society (Ireland, 2002a) and the National ActionPlan against Poverty and Social Exclusion 2001–2003(Ireland, 2002b) were focused on reducing poverty by 2010.Targets were developed in the areas of unemployment,income adequacy, educational disadvantage, health,housing and disadvantaged rural and urban areas. Theyincluded new and emerging groups such as ethnicminorities along with other groups at risk of poverty,although no specific reference to migrants was made. The2005 discussion paper on immigration and residence inIreland (DJELR, 2005a) reinforces the need for a betterintegration of public policy relating to immigration, includingthe impact on services such as education, health andhousing.
National Action Plan for Social Inclusion 2007–2016
Both the National Action Plan for Social Inclusion 2007–2016(NAPinclusion) and the National Development Plan2007–2013, Transforming Ireland: A Better Quality of Life forAll, highlight high-level goals for reducing poverty and socialexclusion (Ireland 2007a, 2007b). The NAPinclusionacknowledges that migrants, amongst other disadvantaged
262
Welfare Policy and Poverty
Chapter 09 17/09/2007 16:54 Page 262
groups, have not benefited equally from the boomingeconomy and are at risk of poverty and exclusion. Theintegration of migrants is one of the NAPinclusion’s high-levelgoals, which are designed to ‘mobilise resources to addresslong-standing and serious deficits’ (Ireland, 2007, p. 21).
The focus of the goal is on the integration of migrants intoIrish society, to be achieved through the provision oflanguage support services in the education sector andmeasures to improve access to other public services to‘develop a strategy aimed at achieving the integration ofnewcomers in our society. As an initial action, resources forthe provision of 550 teachers for language supports in theeducation sector will be provided by 2009 and access toother public services through translation of information andsupports will be improved’ (p. 15). Between 2007 and 2013,€36 million is committed ‘to facilitate coordination initiativesand generally promote integration’ (p. 15) through theprovision of interpretation services in the local offices of theDepartment of Social and Family Affairs (DSFA) and theprovision of web-based information guides about theschemes and services provided by the DSFA in eightlanguages (Arabic, Chinese, French, Polish, Portuguese,Romanian, Russian and Spanish). Other initiatives are thosecontained under the National Action Plan against Racism2005–2008 (see below).
Other commitments concern broad priorities to improveaccess to employment opportunities, second chanceeducation and quality health services for migrants and otherminority ethnic groups. However, there is no specificreference to asylum seekers and refugees in theNAPinclusion, and no reference to the provision ofaccommodation through direct provision.
263
Migration and social inclusion policy
Chapter 09 17/09/2007 16:54 Page 263
National Action Plan against Racism 2005–2008Planning for Diversity: The National Action Plan against Racism2005–2008 (NPAR) is a broad-ranging approach containingsome specific strategic social policy developments (DJELR,2005b). However, the NPAR has no statutory basis nor is aspecific budget allocated for the implementation of the actionsit contains. It identifies a framework for the development of ‘amore inclusive, intercultural society in Ireland … based onpolicies that promote interaction, equality of opportunity,understanding and respect’ (p. 27). The intercultural frameworkincludes a range of measures that focus on the integration ofmigrants within equality policy, anti-poverty policy and publicservice modernisation. The five underpinning objectives haveparticularly important implications for social policydevelopments:
• Protection: effective protection and redress against racism
• Inclusion: economic inclusion and equality of opportunity
• Provision: accommodating diversity in service provision
• Recognition: recognition and awareness of diversity
• Participation: full participation in Irish society.
The methods to be used to achieve the aims of the frameworkare as follows:
• Mainstreaming an intercultural approach into policy-makingprocesses and into all relevant policy areas, with referenceto Ireland’s commitments to equality and human rights
• Targeting of specific strategies to overcome the inequalitiesexperienced by specific groups informed by an evidence-based approach to policy-making
264
Welfare Policy and Poverty
Chapter 09 17/09/2007 16:54 Page 264
• Benchmarking progress through targets and timescalesand the development of statistical strategies to providethe necessary data to measure such progress
• Engagement of key stakeholders and drivers to supportthe implementation of the NPAR, including policy-makers,specialised and expert bodies, the social partners andlocal communities, which include groups representingcultural and ethnic minorities.
The plan calls for the reasonable accommodation of diversityand positive action in the design and implementation ofpolicies, programmes and organisational practices. Althoughit has no resources attached to it, it has provided aframework for engaging policy-makers and raising awarenessof social and economic issues facing migrants in Ireland. Ithas raised the need to address the planning of services aswell as mainstream and targeted policy initiatives. In the areaof policy development there are specific mechanisms tointegrate the needs of migrants into macroeconomic andsocial policy planning, although, concerning migrant workers,this is to be ‘consistent with the requirements of policy onimmigration, employment and equality’ (p. 31).
European and international policy frameworksNational developments are also informed by international andEuropean policy frameworks. There are basic socialstandards established in the United Nation’s Convention onthe Protection of the Rights of All Migrant Workers andMembers of Their Families (not ratified by Ireland). UnderArticle 28, migrant workers and members of their familiesshall enjoy the same treatment granted to nationals, thisincludes the right to receive any medical care that is urgentlyrequired; and Article 30 provides for the basic right of access
265
Migration and social inclusion policy
Chapter 09 17/09/2007 16:54 Page 265
to education based on the principle of equality of treatmentwith nationals. The ILO (2004) has drawn up a non-bindingmultilateral framework for a rights-based approach to labourmigration with guidelines and principles for policies based onbest practice and international standards. The NCCRI (2004)argues that even if these conventions are not ratified andimplemented they should still underpin minimum standards inIrish policy.
The EU’s social policy framework includes reference to theneed to integrate migrants into work and society. TheEuropean Commission’s (2006) Green Paper on an EUApproach to Managing Economic Migration addresses somecore social policy issues, there is a CommissionCommunication on ‘A Common Agenda for Integration:Framework for the Integration of Third-Country Nationals inthe European Union’ (2005a), and the Justice and HomeAffairs Council (2004) has drawn up Common Basic Principleson Integration (discussed below). Other specific provisionsare found in the Directive on Family Reunification(2003/86/EC of 22 September 2003), which seeks to protectmigrant families and family life in accordance with principlesof international law.
Integration: A new framework for social inclusion?
In recent years the debate about the social inclusion ofmigrants has focused on integration. Balancing therecognition of a diversity of cultures and backgrounds and anincreasingly multicultural society with the common values,social cohesion and identity of the host country is a challengefor policy-makers and service-providers. Integration debateshave not been without their difficulties and have beencontested. This has ranged from the need for broad-based
266
Welfare Policy and Poverty
Chapter 09 17/09/2007 16:54 Page 266
measures to promote the social inclusion of immigrants(Spencer, 2004; MRCI, 2006) and that recognise integrationas equal treatment and the prohibition of discrimination (UN,2006) to measures required to foster integration through theprovision of language and introductory courses to promotecivic participation and community activity (Healy, 2007). Atthe other end of the spectrum are more limited integrationmeasures that focus on how migrants can be assimilated intoone society (Healy, 2007; Brubaker, 2001).
As Spencer argues, ‘Integration is not simply about access tothe labour market and services, or about changing attitudesof civic engagement; it is a two-way process of adaptation bymigrant and host society at all of those levels’ (2004, p. 24).Therefore, if integration is to work as a reciprocal process itrequires there to be a balance between granting rights andentitlements to migrants and a willingness to adapt to thenorms of the host country. The objective should be thatintegration impacts positively on migrants through ‘theprocess of learning a new culture, acquiring rights andobligations, gaining access to positions and social status,building personal relationships with members of the hostsociety and forming a feeling of belonging to, andidentification with, that society’ (p. 24). Integration alsobenefits the host society by ‘opening up institutions andgranting equal opportunities to immigrants’ (Bosswick andHeckmann, 2006, p. 5).
Integration is increasingly part of the language of policy-makers in Ireland. It has been linked to participation in societyand cultural identity (Interdepartmental Working Group on theIntegration of Refugees in Ireland, 1999), mutual obligations(DJELR, 2005a), active citizenship and interculturalism(Department of Education and Science, 2000). The
267
Migration and social inclusion policy
Chapter 09 17/09/2007 16:54 Page 267
Immigration, Residence and Protection Bill recommends theestablishment of an immigrant integration unit with the remitto ‘promote and coordinate social and organisationalmeasures’ (DJELR, 2005a, p. 5).
In the EU the Common Basic Principles on Integration includethe promotion of basic knowledge of the receiving society’slanguage, history and institutions, as well as ‘normativeadaptation’. Integration is defined as a two-way process, withintegration policies covering work, social inclusion and theengagement of civil society, all of which are areas that will beimportant for the planning of future social policies. However,in practice, EU policies have been developed within aframework of restricted conditionality that, according toCarrera (2005, p. 1), ‘may negatively affect social cohesionand inclusion, and undermine the fundamental rights ofimmigrants’. With this in mind, integration strategies need tobe focused on the goal of inclusion with a process thatguarantees equality of treatment and full access to social,economic and political rights.
As the experience from other European countries suggests,along with anecdotal evidence in Ireland, many of the newmigrants to Ireland are not temporary migrants, but are hereto stay for the long term, with many aspiring to Irishcitizenship and long-term residency. This suggests that thereis a need for long-term planning for the integration andinclusion of migrants as a feature of Irish society, particularlyto avoid some of the experiences of exclusion andghettoisation of migrants in other countries. Improving accessto public services in areas such as health, education,employment and housing, along with access to Englishlanguage and orientation programmes, can be critical to long-term integration and participation. However, prevailing policy
268
Welfare Policy and Poverty
Chapter 09 17/09/2007 16:54 Page 268
assumptions are that migration is temporary, whilst politicaldiscourse is often focused on limiting migrants’ rights in orderto prevent public hostility, often for short-term political gain.
This results in significant policy gaps which if addressed couldenhance integration and reduce the risks of exclusion andmarginalisation. There are important lessons from othercountries of the need to invest in policies and programmes for those migrants that choose to stay. This can be seen in thehigher levels of disadvantage, poverty and exclusion that aremanifest in under-representation in democratic institutions andpolicy-making, poorer health, higher unemployment,educational under-achievement and poorer housingexperienced by second and third generation migrants.
Migrants who are vulnerable to poverty and exclusion
The social inclusion and equality of migrants is mediated bytheir legal status which in turn influences their social rights andentitlements, including access to social, health, employmentand other services. There are different entitlements for differentgroups of migrant workers (depending on whether they hold awork authorisation/working visa/work permit, are citizens of thenew EU member states or are working students) and refugeesand asylum seekers. There are some groups that areparticularly vulnerable and at risk of social exclusion by virtueof their status, including asylum seekers, unaccompaniedminors, victims of human trafficking and dependent spouses of work permit holders.
Migrant workersThere is a growing body of evidence of the impact of low pay,exploitation and poor working conditions on the exclusion of
269
Migration and social inclusion policy
Chapter 09 17/09/2007 16:54 Page 269
some migrant workers (MRCI, 2006, 2004; ICI, 2005; NESC,2006; IOM, 2006). However, there are differences in statusbetween migrant workers holding work permits (which theemployer has to apply for) and those holding workauthorisation visas/working visas, regarding familyreunification, access to services and legal status. Theworking visa and work authorisation scheme introduced in2000 and the Employment Permits Act 2006 extendedentitlements to highly skilled workers, including settlementand family reunification, two-year visas and quicker routesto gaining residency. In contrast, work permit employershave to apply for work permits on behalf of their employeesfor one year. Since the enactment of the EmploymentPermits Act, the work permit is held by the employee. Workpermits are normally issued to lower skilled occupations inthe horticultural, construction, social care and servicesectors of the economy. There are no rights to familyreunification or for spouses to work.
Access to the labour market was granted to citizens fromthe ten new EU member states in May 2004 and thisresulted in a corresponding reduction in the number of workpermits issued to non-EU migrants. Between May 2004 andFebruary 2006, approximately 186,000 migrants from thenew member states (aged 15 years or over) arrived in thecountry. By mid-2006, approximately 10,000 people fromthese countries were applying for personal public servicenumbers each month (the majority of whom were fromPoland, Lithuania, Latvia and Slovakia). A more restrictiveattitude to EU migration can be seen in the 2006enlargement of the EU to include Romania and Bulgaria,which has not resulted in free access to the Irish labourmarket for Romanian and Bulgarian citizens.
270
Welfare Policy and Poverty
Chapter 09 17/09/2007 16:54 Page 270
Refugees and asylum seekersAlthough global political insecurities and humandisplacement will continue in the future, there has been areduction in the numbers of asylum seekers entering Ireland.Under the 1951 Geneva Convention, Ireland accepts anagreed number of programme refugees as part of itsinternational obligations to protect people fleeingpersecution and by responding to asylum seekers applyingto be recognised as refugees. Asylum seekers receive morelimited entitlements to social supports and are unable towork, although refugee status brings with it similar rights tothose held by Irish citizens, and refugees have the right toapply for citizenship. Government policy can be found inIntegration: A Two Way Process (Interdepartmental WorkingGroup on the Integration of Refugees in Ireland, 1999) andsupport for asylum seekers is covered under a policy ofdispersal and direct provision.
The social inclusion of refugees and asylum seekers hasbeen the subject of concern (Cáirde, 2006; Irish RefugeeCouncil, 2004) and refugee support groups highlight theconcerns about the exclusion resulting from social isolation,not having the right to work or to participate in educationand training, and the limited supports for women asylumseekers with children. In particular, the Irish policy ofdispersal and direct provision has raised a number of socialpolicy challenges concerning access to social networks,healthcare, language classes, interpretation services,childcare and other supports. Specific problems have beenhighlighted about the negative impact of direct provision onmental and physical health and wellbeing.
The Reception and Integration Agency operates aroundseventy accommodation centres across the country for
271
Migration and social inclusion policy
Chapter 09 17/09/2007 16:54 Page 271
asylum seekers, who are provided with full board andaccommodation and a weekly allowance of €19.10 (2006).Many live in reception centres, often in poor quality andovercrowded accommodation, for as long as five yearswhilst waiting for a decision on their status. Asylum seekers are entitled to schooling for children between theages of 6 and 16, English language and literacy supportsprovided within an adult education context, medical cardsand access to healthcare. There are also measures toinclude asylum seekers in local community and culturalactivities.
Asylum seekers living in direct provision frequently reportpoor living conditions. In most cases asylum seekers areliving in hostels where meals are provided; there is also alimited provision of self-catering accommodation. BetweenApril 2000 and November 2006 there were 50,793applications for asylum, with an overall decline in thoseseeking asylum in recent years. At the end of 2006, 4,861people seeking asylum were being accommodated in directprovision with a further 489 people accommodated in self-catering facilities. There is a young age profile of people indirect provision, with 2,559 of the total of 5,350 peopleaccommodated via this system in 2006 being below 25years, 1,436 of whom were under 12 years of age. Legalrestrictions on rent allowances to pay for private rentedaccommodation were introduced to reduce the incentive forasylum seekers to move out of accommodation provided bythe Reception and Integration Agency, thereby reducing theopportunities for asylum seekers to avail of subsidisedprivate accommodation.
Asylum seekers and refugees experience many of the crisesthat are recognised factors in contributing to social
272
Welfare Policy and Poverty
Chapter 09 17/09/2007 16:54 Page 272
exclusion, poor housing and homelessness. The IrishRefugee Council (2000, 2001) states that extended stays in direct provisions contribute to the institutionalisation and deskilling of asylum seekers, whilst social exclusion is a direct effect of restrictions on education and trainingand prohibitions on engaging in paid employment while awaiting decision on their application. The healthimpacts of living in direct provision have been documentedin the HSE’s consultations for the Intercultural Strategy in Health (2007a) and by organisations representing minority ethnic groups (Cáirde, 2006). Difficulties arise forthose who get refugee status in finding accommodation and in obtaining information about how to liveindependently and access accommodation, training andemployment.
The right to citizenship as a result of being an Irish-bornchild ended with the citizenship referendum in 2003 and theprovision allowing parents to have access to residency byvirtue of an Irish citizen child was also ended following adecision of the Supreme Court the following year. Theseprovisions impact on both parents and children regardingaccess to social rights associated with residency andcitizenship.
Additional social supports were recommended under theNPAR and service-providers in the health and educationsectors have put in place additional services and supportsfor asylum seekers and their children. One example of thishas been the development of national performanceindicators on asylum seekers which require the HSE toreport to the Department of Health and Children on theprovision of services.
273
Migration and social inclusion policy
Chapter 09 17/09/2007 16:54 Page 273
Unaccompanied minorsSpecific concerns have been expressed about the care andsupport needs of unaccompanied minors. Around 300unaccompanied minors have gone missing in the state andsome of them could be at risk of labour and sexual abuseand exploitation (Conroy, 2003). Unaccompanied minors arelargely housed in private hostels that are not subject toinspection by the Irish Social Services Inspectorate, incontrast to services for cared for Irish children. Once thesechildren reach the age of eighteen their ‘cared for’ statusends (when they become known as ‘aged out minors’) andtheir only option is to enter the asylum process. Many ofthese children are not eligible for residency and are treated asrefugees under the asylum process, many are subsequentlydeported to countries that they have never lived in and withfew supports.
Victims of human trafficking Although at a level that is lower than other countries therehas been a recent and worrying increase in human trafficking,the majority of which is of the sexual exploitation of womenand children. According to the Report of the Department ofJustice, Equality and Law Reform and An Garda SíochánaWorking Group on Trafficking in Human Beings (DJELR, 2006,p. 8), ‘Ireland is at risk from the same threats as those facingits EU partners and, in particular, our nearest neighbours.Garda operations have uncovered a small number oftrafficking cases’.
In Ireland there has been an absence of a policy frameworkon human trafficking, particularly regarding the support,security, health and care needs of victims of trafficking.Ireland has not signed up to the two main international
274
Welfare Policy and Poverty
Chapter 09 17/09/2007 16:54 Page 274
conventions on human trafficking – the UN’s PalermoProtocol and the Council of Europe’s Convention on HumanTrafficking1 – which include guidance on the support andsecurity needs of victims. The health, accommodation andsupport needs of victims of trafficking have yet to beaddressed in policy and have been largely left to community-based organisations such as Ruhama.
Women migrantsThe concerns and challenges that are unique to theexperience of women migrants are often overlooked. Whilstmigration can benefit the women involved by giving themaccess to higher incomes and possibilities of sendingremittances to family members, they are also open to anincreased risk of gender-specific forms of abuse andexploitation (Migration Policy Institute, 2003). There aredifferent situations and conditions faced by immigrant womenand men in the integration process, including doublediscrimination faced by immigrant women in the labourmarket, poor working conditions and exploitation. In someareas of work, such as domestic service and contractcleaning, where women are isolated and do not have accessto trade unions, there is a greater vulnerability to exploitation(MRCI, 2004; Pillinger, 2006b). The European Commission(2005b) highlights the need for a gender mainstreaming
275
Migration and social inclusion policy
___________
1 The UN Convention against Transnational Organised Crime includes acomprehensive approach to addressing trafficking in human beings: itsProtocol to Prevent, Suppress and Punish Trafficking in Persons,Especially Women and Children (Palermo Protocol, 2000, Supplantingthe UN Convention against Transnational Organised Crime). TheCouncil of Europe Convention on Action against Trafficking in HumanBeings was agreed by the Committee of Ministers on 3 May 2005(signing in Warsaw opened on 16 May 2005).
Chapter 09 17/09/2007 16:54 Page 275
approach in order to integrate a gender perspective intoimmigration and integration policies. This is particularlyimportant because the increasing feminisation of migrationshapes channels of entry and access to services, benefits,work, asylum and family reunification.
There are also many gendered assumptions underlying familyreunification policies which are often embedded inassumptions of women’s dependence in the family, whilst inpractice the majority of migrant women migrate alone.Although the law does not provide a right to familyreunification, migrants granted long-term residency orpermission to remain are permitted to have their familymembers live with them. However, the decision to grantfamily reunification is at the discretion of the Minister forJustice and applicants have to prove sufficient resources tosupport family members. This is a difficult situation for manymigrants, especially women, who may not be granted theright to work in Ireland or whose incomes are very low. As theNational Women’s Council of Ireland (2005, p. 2) states,‘Family reunification is of immense importance to manymigrants and in particular to migrant women who have beenforced to leave their children and families behind when theyemigrate to Ireland. This puts huge strains particularly onmothers of young children as well as on the childrenthemselves’.
Immigrant women represent a larger proportion of full-timeworkers than Irish women (39.8 per cent of those in full-timeemployment compared to 31.1 per cent of Irish women) andare a lower proportion of part-time workers and thoseeconomically inactive. They also tend to be of a youngerworking age, with an average age of 30, an age when womenare likely to be engaged in childbirth and childrearing.
276
Welfare Policy and Poverty
Chapter 09 17/09/2007 16:54 Page 276
Although immigrant women have higher educationalqualifications than Irish women, many of these women areover-represented in the lower skilled jobs compared to bothIrish women and Irish men. They predominate in highlyfeminised sectors such as catering, domestic work, care andhealth services. Women migrant workers are often thepoorest in the community and many work in low-paid,exploitative and invisible employment.
Many women migrate alone and large numbers do so to sendmoney home to their families and the number of women thatare engaged in transnational parenting has grown significantlyin recent years. Social isolation is enhanced because of thesectors that women work in and because many womenmigrants do not have family networks to help them withchildcare (MRCI, 2006; Pillinger, 2006b).
In other cases, women who migrate with spouses who arework permit holders are not allowed to work. This reinforcesdependence on their husbands/partners and an environmentbased on dependence and inequality can in some cases leadto abuse and domestic violence. This has implications forsupport systems for women who experience domesticviolence, pregnancy or social isolation. As a result,organisations such as Women’s Aid have called for greaterlegal protection – for women who experience domesticviolence to be given independent legal status and the right toremain in Ireland. This situation is worsened by the fact thatthe Habitual Residence Condition (see below) enhances theirsocial exclusion, leaving them without access to socialwelfare and other core services.
There is a need for a gender-based analysis of approaches tomigration policy, which could be modelled on the Canadian
277
Migration and social inclusion policy
Chapter 09 17/09/2007 16:54 Page 277
approach which resulted in the assessment of gender-specificimpacts in migration policy and implementation and hasincluded proposals to increase the age of dependence from 18to 22, aimed at dependent daughters who in some culturesmay stay at home until marriage or after divorce. In particular, amore flexible migration system is needed so that spouses ofmigrant workers can work and have access to social welfarebenefits and domestic violence services.
Access to services
Health servicesThe social impacts of migration are only just beginning to beconsidered in Irish health policy planning and reporting. There is no mention of migration as a specific issue in thegovernment’s health strategy Quality and Fairness, nor inother policy documents that have recently underpinned thedevelopment of services, such as the primary healthcarestrategy, and the health promotion strategy (DOHC, 2000,2001a, 2001b). In some respects this is not surprising sincethese policy documents pre-date migration into Ireland. In2006, the Health Service Executive (HSE, 2007a) drew up anIntercultural Strategy in Health, after an extensive consultationprocess with staff working in the HSE and with service-usersfrom minority ethnic communities and migrant community-based organisations. The strategy has highlighted the need for:
• An improved evidence base and data on the utilisation ofservices by different minority ethnic groups and migrants toinform the provision of appropriate health and social careservices so that they take full account of minority ethnicpeople’s diverse health needs
278
Welfare Policy and Poverty
Chapter 09 17/09/2007 16:55 Page 278
• A better understanding of the barriers experienced bydifferent migrant communities, including better access toinformation about accessing health services, and improvedaccess to culturally appropriate services, in particular GP,maternity and mental health services
• Improved training for staff in the provision of culturalcompetence services
• Enhanced access to services for those migrant groups thatdo not access services or that are not aware of how the‘system’ works
• A community development model as an effective andsustainable approach to the provision of culturallyappropriate health services.
Service-users and community organisations identified issuessuch as access to information, interpretation and translation,and the importance of resourcing community development andcommunity-based approaches to health (HSE, 2007b). Barriersidentified in accessing health services include a person’sculture, religion, language and legal status, communicationsand information barriers and significant problems inunderstanding the links between inequality and mental healthdifficulty experienced by some groups, particularly refugeesand asylum seekers. Specific health issues are raised byasylum seekers and refugees concerning the impact on socialisolation and health and wellbeing of living in direct provisionhostels, as well as trauma and post-migration stress, racism,fear of deportation, lack of understanding of services andlanguage barriers (HSE, 2007b).
There has been a growth of peer-led and communitydevelopment approaches to the social inclusion of migrants.
279
Migration and social inclusion policy
Chapter 09 17/09/2007 16:55 Page 279
Examples of this are a support organisation for asylumseekers provided by Spirasi, which offers a health informationprogramme through a peer-led project that trains groups ofasylum seekers and refugees in health issues and resources,using visual, multilingual and audio communication aids.Another example is the community-based organisationCáirde, which provides support, training and community-based programmes to minority ethnic leaders, with specificprogrammes for women.
The Habitual Residence Condition and access to socialwelfare benefitsFollowing the enlargement of the EU in 2004, Ireland providedgeneral access to the labour market for workers of the tennew member states, but put in place a number of restrictionsregarding access to welfare benefits and other forms of socialassistance through the Habitual Residence Condition (HRC).2
This restricts access to welfare benefits for all EU andEuropean Economic Area citizens and is intended to prevent‘welfare tourism’. An applicant for social welfare has todemonstrate that he or she is habitually resident in the state.However, because of the extreme hardship experienced bysome migrant workers, community welfare officers have usedthe discretionary powers to provide exceptional and urgentneeds payments. Although the European Commission didmake some criticisms of the operation of the HRC in the UKin that it was against the principle of free movement of labour,they do not appear to have pursued these and the European
280
Welfare Policy and Poverty
___________
2 Introduced under Section 17 of the Social Welfare (MiscellaneousProvisions) Act 2004 and Schedule 1 to the Act, see now the SocialWelfare (Consolidation) Act 2005. See Department of Social and FamilyAffairs (2005).
Chapter 09 17/09/2007 16:55 Page 280
Court of Justice has upheld the UK HRC as long as it isapplied in a proportionate manner. A review of the HRC wasinitiated by the Department of Social and Family Affairs in 2005with a view to ending confusion about access to emergencysupport through supplementary welfare for all migrant workers.
Housing and accommodation
Low wages are a reality for a large number of immigrants inIreland; many are living in poor quality and overcrowdedaccommodation – with migrants reporting renting propertiesthat are dirty, damp, infested with rodents and without properheating – or in substandard accommodation provided by theiremployers (ICI, 2004). Research by the Homeless Agency (TSA,2006; Pillinger, 2006a) has revealed growing numbers of peoplefrom the new EU member states who are principally homelessbecause of income and work-related problems, includingexploitative work situations, poor information concerning workopportunities and the high cost of living in Dublin in particular.It was estimated that at any one time between thirty-five andeighty-five nationals of the 2004 EU accession states wereaccessing homeless services in Dublin in September 2005,although this was considered an under-estimation of theproblem (TSA, 2006).
The HRC has been applied to the funding of homeless anddomestic violence services and this means that migrants whodo not fulfil the conditions are unable to avail of these services,including refuges for women who experience domesticviolence. Reports of homelessness among migrants, includinga high-profile story concerning a young Ukrainian worker whohad her legs amputated after being found homeless andsuffering from frostbite, underline the links between migrants’social and working environments and their health status.
281
Migration and social inclusion policy
Chapter 09 17/09/2007 16:55 Page 281
EducationAccess to education for children and adults of all ages iscritical for the integration and inclusion of migrants. As theNESC states, ‘the challenge for diversity will be acutely felt inthe education system since education is central to the successof integration’ (2006, p. 199). In particular, the provision ofEnglish language courses is generally viewed as a key elementof the integration into work and of accessing services, rights,entitlements and information (European Commission, 2005;Healy, 2006). Whilst this provision remains very limited, anumber of community organisations have gained funding forthe provision of language classes and language tuition hasbeen introduced into the classroom for children.
A working group on interculturalism has been established bythe Department of Education and Science and the NationalCouncil for Curriculum and Assessment has reviewed nationalcurricula to ensure the promotion of intercultural education.The NPAR sets out a number of recommendations includingthe development of a national intercultural education strategy,an inclusive and intercultural school environment andcurriculum, specific issues covering youth work and enhancingparticipation in education for unaccompanied minors andrefugee and asylum seekers up to 18 years old, and for thosewith leave to remain to have improved access to further andhigher education (DJELR, 2005b).
InformationMany migrants experience problems in accessing informationbecause of language barriers or unfamiliarity with the ‘system’.For example, Ireland’s network of citizen’s information servicesreport on the poor use made of information and adviceprovision by migrant groups. Guidelines have been developed
282
Welfare Policy and Poverty
Chapter 09 17/09/2007 16:55 Page 282
to improve the accessibility of information for those groupsthat experience the greatest barriers, including refugees andasylum seekers and migrant workers (Comhairle, 2005) andgrants for information and advocacy projects have beenfunded through Comhairle (now the Citizens InformationBoard). A number of organisations have produced specialistinformation about specific groups, for example theImmigration Council of Ireland’s Handbook on Immigrants’Rights and Entitlements in Ireland (ICI, 2003). In recent yearsthere has been a significant increase in support organisationsfor migrants. Many of these organisations are migrant-led andprovide accessible information, advice, advocacy andcommunity development programmes. Examples include thePolish Information and Advice Centre, the Migrant RightsCentre Ireland and Akida (for African women).
Conclusions and recommendations
Many migrant groups, especially low-skilled migrants, facesocial exclusion because of language barriers and many arevulnerable in the labour market to exploitation and socialisolation. Immigrants with an undocumented or indeterminatestatus, low-paid and socially isolated migrant workers,women migrants and young migrants are particularlyvulnerable to poverty, poor housing conditions, poor accessto services and exclusion from society (IOM, 2006).
According to the NESC, the challenge for integration policyand social policy is to respond effectively to the scale anddiversity of migration by improving capacity and servicedevelopments: ‘These include improving the collection anduse of data, enhancing the ability of staff to deal with adiversity of users, understanding the vulnerabilities of womenin the migration-integration process and providing the public
283
Migration and social inclusion policy
Chapter 09 17/09/2007 16:55 Page 283
with better information on service entitlements and standards’(2006, p. xvi).
This chapter has shown that some migrants living andworking in Ireland experience poverty, poor living conditions,social exclusion, racism and poor access to employment,particularly well-paid and secure employment. Thevulnerability of certain groups, for example asylum seekers,unaccompanied minors, victims of trafficking, spouses ofwork permit holders, low-paid migrant workers and migrantworkers who do not fulfil the Habitual Residence Condition,raise important challenges for Irish social policy.
Migration is still relatively new to Ireland and there are manyopportunities to develop the best frameworks on integration,multiculturalism and social inclusion, whilst adapting andcreating inclusive and culturally competent services. This canhelp avoid problems – such as institutional racism, socialisolation and disadvantage, as well as hostility andresentment from Irish citizens – being replicated in the future,whilst also ensuring that migration contributes equally toIreland’s economic and social development. The issue is thatimproving access to social rights and to quality services formigrants can also help to improve rights and access toquality services for the whole population.
Research and dataThe limited knowledge and data about migrants’ education,social welfare, employment and healthcare needs haveimplications for policy and planning. Improved data is neededto inform policies on settlement, social inclusion andintegration. More detailed evidence-based research needs tobe put in place to inform policy developments and serviceplanning. This should highlight the experiences of migrants in
284
Welfare Policy and Poverty
Chapter 09 17/09/2007 16:55 Page 284
areas such as family reunification, access to core servicesand social benefits in particular communities and their impacton settlement and integration.
Planning of servicesAttention will need to be given to the long-term planning ofservices that reflect increased numbers of migrants and thediversity of the community, particularly since it is likely thatmany migrants may wish to settle in Ireland. The impact ofthese patterns on social policy planning in education, health,social welfare and housing will need to be considered and theplanning, delivery and monitoring of services proofed for theirimpact on specific migrant groups and communities.
Engagement, involvement and participation of migrantcommunitiesA key factor will be to enhance the engagement of migrantcommunities themselves, particularly through peer-led andcommunity development approaches. The provision ofresources for migrant-led and community organisations willneed to increase if there is to be a wider engagement withmigrant communities in the future. There should be supportfor the involvement and participation of people from, andorganisations representing, migrant communities in theplanning, delivery, monitoring and evaluation of health,education, housing, social welfare and other services.
The social inclusion of the most vulnerable groupsThere needs to be more attention given to the vulnerability ofthose migrants living and working in Ireland who experiencepoverty, poor living conditions, social exclusion, racism andpoor access to employment, particularly well-paid and secureemployment. In particular, the vulnerability of unaccompanied
285
Migration and social inclusion policy
Chapter 09 17/09/2007 16:55 Page 285
minors, spouses of work permit holders and migrant workerswho do not fulfil the Habitual Residence Condition raisesimportant challenges for Irish social policy.
Rights and entitlementsMore efforts need to be made to ensure that migrants arefully aware of their rights and entitlements. There needs to bemore information about rights, entitlements and the structureof health, social care, education, housing and other services,particularly in orientating people when they first arrive inIreland. Some of this preparation could take place beforemigrants leave their home country.
Social welfare and the Habitual Residence ConditionThe review of the Habitual Residence Condition should becarried out with a view to establishing an equitable system forproviding welfare rights to excluded migrant workers.
Policy on integrationIt will be important for future policy developments in the areaof integration to be broad ranging and to cover economic,social, political and cultural rights that impact on work, socialinclusion and the engagement of civil society. It will thereforebe important to ensure that integration policy is based on acomprehensive strategy for inclusion and equality, withsufficient resources for mainstream and targeted actions. Thisshould be progressed through the framework for theintegration of migrants outlined in the NPAR.
Cross-cutting mechanismThere should be a high-level cross-cutting mechanism onmigration introduced so that relevant governmentdepartments develop more effective actions that help to
286
Welfare Policy and Poverty
Chapter 09 17/09/2007 16:55 Page 286
integrate migrants into work and community life. This couldbe formed under the remit of the Cabinet Committee onSocial Inclusion.
Integrating the impact of policies on migrantsThe emerging framework on equality and social inclusion inIreland has resulted in a method for equality and povertyproofing. This system could be further developed to identifythe impact of social policies on all categories of migrants,particularly those that are the most excluded and vulnerable.In this context it will be particularly important for the socialimpacts of migration to be highlighted and reflected in policydiscussions.
A more flexible migration systemThere is a need for a more flexible migration system so thatspouses of migrant workers can work and that there arepossibilities for migrant workers to have permanence andaccess to social benefits.
Family reunificationRights to family reunification should be established in law andshould recognise the constitutional right given to the family.Migrant workers, who pay taxes in the same way as all otherworkers, should have an equal right to family reunification,education, housing and social welfare. Spouses of all migrantworkers should have the right to work.
Gender perspectiveA gender perspective should be included in all policydevelopments concerning migration policy and the integrationand inclusion of migrants in Ireland. In particular, womenexperiencing domestic violence and women and children who
287
Migration and social inclusion policy
Chapter 09 17/09/2007 16:55 Page 287
have experienced trafficking for sexual exploitation should begiven temporary leave to remain in the state and have fullaccess to social welfare and other benefits for their children.Specific targeted support and outreach programmes shouldbe funded for voluntary organisations working with womenmigrant workers, particularly women who are socially isolatedand at risk of abuse or violence.
References
Barrett, A., Bergin, A. and Duffy, D. (2006), ‘The Labour MarketCharacteristics and Labour Market Impact of Immigrants in Ireland’,The Economic and Social Review, vol. 37, no. 1, pp. 1–26
Bosswick, W. and Heckmann, F. (2006), Social Integration of Immigrants:Contribution of Local and Regional Authorities, Dublin: EuropeanFoundation for the Improvement of Living and Working Conditions
Brubaker, R. (2001), ‘The Return of Assimilation? Changing Perspectiveson Immigration and Its Sequels in France, Germany and the UnitedStates’, Ethnic and Racial Studies, vol. 24, no. 4, pp. 531–548
Cáirde (2006), Assessing the Health and Related Needs of Minority EthnicGroups in Dublin’s North Inner City, Dublin: Cáirde
Carrera, S. (2005), ‘Integration as a Process of Inclusion for Migrants? TheCase of Long-Term Residents in the EU’, Centre for European PolicyStudies Working Document no. 219, 1 March
Comhairle (2005), Access to Information for All, Dublin: Comhairle
Conroy, P. (2003), Trafficking in Unaccompanied Minors in the EuropeanUnion Member States – Ireland: Research Summary, Dublin:International Organisation for Migration
CSO (2007), Census 2006. Principal Demographic Results, Dublin: CentralStatistics Office
DES (2000), Learning for Life: White Paper on Adult Education, Dublin:Stationery Office
DOHC (2000), National Health Promotion Strategy 2000–2005, Dublin:Department of Health and Children
DOHC (2001a), Primary Care – A New Direction, Dublin: Department ofHealth and Children
288
Welfare Policy and Poverty
Chapter 09 17/09/2007 16:55 Page 288
DOHC (2001b), Quality and Fairness: A Health System for You, Dublin:Department of Health and Children
DJELR (2005a), Immigration and Residence in Ireland: Outline PolicyProposals for an Immigration and Residence Bill – A DiscussionDocument, Dublin: Department of Justice, Equality and Law Reform
DJELR (2005b), Planning for Diversity: The National Action Plan againstRacism 2005–2008, Department of Justice, Equality and Law Reform,Dublin: Stationery Office
DJELR (2006), Report of the Department of Justice, Equality and LawReform and An Garda Síochána Working Group on Trafficking inHuman Beings, Dublin: Department of Justice, Equality and LawReform
DSFA (2005), Habitual Residence Condition, Dublin: Department of Socialand Family Affairs
European Commission (2005a), ‘A Common Agenda for Integration:Framework for the Integration of Third-Country Nationals in theEuropean Union’, Communication from the Commission to the Council,the European Parliament, the European Economic and SocialCommittee and the Committee of the Regions, Brussels, Com(2005)389 final
European Commission (2005b), Report from the Commission to theCouncil, the European Parliament, the European Economic and SocialCommittee and the Committee of the Regions on Equality betweenWomen and Men, Brussels, Com(2005) 44 final
European Commission (2006), Green Paper on an EU Approach toManaging Economic Migration, Brussels, Com(2004) 811 final
Healy, C. (2007, forthcoming), On Speaking Terms: Language, Integrationand the New Irish, Dublin: Immigrant Council of Ireland
HSE (2007a), Intercultural Strategy in Health, Dublin: Health ServiceExecutive
HSE (2007b), Report of the Consultations: Intercultural Strategy in Health,Dublin: Health Service Executive
ICI (2003), Handbook on Immigrants’ Rights and Entitlements in Ireland,Dublin: Immigrant Council of Ireland
ICI (2004), Voices of Immigrants: The Challenges of Inclusion, Report byKelleher Associates, Dublin: Immigrant Council of Ireland
289
Migration and social inclusion policy
Chapter 09 17/09/2007 16:55 Page 289
ICI (2005), Summary Analysis and Initial Response to the Government’sProposals for an Immigration and Residency Bill, Dublin: ImmigrantCouncil of Ireland
ILO (2004), Non-Binding Multilateral Framework for a Rights-BasedApproach to Labour Migration, Geneva: International LabourOrganization
Interdepartmental Working Group on the Integration of Refugees in Ireland(1999), Integration: A Two Way Process, Dublin: Department of Justice,Equality and Law Reform
IOM (2006), Managing Migration in Ireland: A Social and EconomicAnalysis, Report of the International Organization for Migration for theNational Economic and Social Council of Ireland, Dublin: NESC
Ireland (1997), Sharing in Progress: National Anti-Poverty Strategy, Dublin:Stationery Office
Ireland (2002a), Building an Inclusive Society, Dublin: Stationery Office
Ireland (2002b), National Action Plan against Poverty and Social Exclusion2001–2003, Dublin: Stationery Office
Ireland (2006), National Report for Ireland on Strategies for SocialProtection and Social Inclusion, 2006–2008, Dublin: Stationery Office
Ireland (2007a), National Action Plan for Social Inclusion 2007–2016,Dublin: Stationery Office
Ireland (2007b), Transforming Ireland: A Better Quality of Life for All,National Development Plan 2007–2013, Dublin: Stationery Office
Irish Refugee Council (2000), Asylum Seekers and the Right to Work inIreland, Dublin: Irish Refugee Council
Irish Refugee Council (2001), Direct Provision and Dispersal – 18 MonthsOn, Dublin: Irish Refugee Council
Irish Refugee Council (2004), Reflections by the Irish Refugee Council onWorld Refugee Day, Dublin: Irish Refugee Council
Justice and Home Affairs Council (2004), Common Basic Principles onIntegration, Brussels: Council of the European Union
Migration Policy Institute (2003), The Feminization of InternationalMigration: Issues of Labor, Health, and Family Coping Strategies,Washington DC: Migration Policy Institute
Minns, C. (2005), Immigration Policy and the Skills of Irish Immigrants:Evidence and Implications, Discussion Paper Series, Dublin: TheInstitute for International Integration Studies
290
Welfare Policy and Poverty
Chapter 09 17/09/2007 16:55 Page 290
MRCI (2004), Private Homes, A Public Concern: The Experience of TwentyMigrant Women Employed in the Home in Ireland, Dublin: MigrantRights Centre Ireland
MRCI (2006), Realising Integration: Creating the Conditions for Economic,Social, Political and Cultural Inclusion of Migrant Workers and TheirFamilies in Ireland, Dublin: Migrant Rights Centre Ireland
MRCI (2007), No Way Forward, No Going Back: Identifying the Problem ofTrafficking for Forced Labour in Ireland, Dublin: Migrant’s Rights CentreIreland
National Women’s Council of Ireland (2005), ‘Immigration and Residencein Ireland’, discussion document, Dublin: National Women’s Council ofIreland
NCCRI (2004), ‘Proposed Changes in the Social Welfare Code Arisingfrom EU Enlargement’, submission from the National ConsultativeCommittee on Racism and Interculturalism (NCCRI) to the Departmentof Social and Family Affairs
NESC (2006), Migration Policy, Dublin: National Economic and SocialCouncil
Pillinger, J. (2006a), Preventing Homelessness: A Comprehensive Strategyto Prevent Homelessness in Dublin, 2005–2010, Dublin: HomelessAgency
Pillinger, J. (2006b), An Introduction to the Situation and Experience ofWomen Migrant Workers in Ireland, Dublin: Equality Authority
Ruhs, M. (2005), Managing the Immigration and Employment of Non-EUNationals in Ireland, Studies in Public Policy, no. 19, Dublin: The PolicyInstitute
Spencer, S. (2004), ‘Achieving the Social Inclusion of Migrants’,presentation to the Irish Presidency Conference on ReconcilingMobility and Social Inclusion – The Role of Employment and SocialPolicy, Dublin, 1 and 2 April
TSA (2006), Away from Home. Homeless Quantification and Profile of EU10 Nationals Using Homeless Services and Recommendations toAddress Their Needs, Dublin: Homeless Agency
UN (2006), International Migration and Development: Report of theSecretary-General, New York: United Nations General Assembly
291
Migration and social inclusion policy
Chapter 09 17/09/2007 16:55 Page 291

Chapter 09 17/09/2007 16:55 Page 292
Chapter 10
Developing an inclusive society: The way forward
Mel Cousins
The objective of this book is to provide an overview andanalysis of key issues concerning public policy and povertyand social inclusion in Ireland and to draw policy lessons forthe future. The individual chapters have reviewed policydevelopments in a number of areas which are central todeveloping an inclusive society. This chapter rehearses someof the main findings of previous chapters and identifies keychallenges and possible options from a public policyperspective.
What have we achieved and what remains to beachieved?
Major progress has been achievedThis book highlights the striking progress which has beenmade in Ireland in many areas over the past twenty years.The number of people employed doubled from 1.1 million in1987 to 2.2 million in 2007, unemployment fell from 17 percent to 4 per cent and overall living standards improvedenormously. Research has also found a substantial upgrading
293
Chapter 10 17/09/2007 16:55 Page 293
of the class structure and increased levels of social mobility(Whelan and Layte, 2006). Perhaps the best indicator of thedramatic change that has occurred, however, is theturnaround in migration from a situation in the 1980s when upto 200,000 people left Ireland to look for work abroad to thesituation when over 60,000 people came to Ireland in 2006alone to take advantage of the opportunities that now existhere.1
But major challenges remainDespite the dramatic progress made in many aspects of theIrish economy and Irish society, as shown in this book, majorchallenges remain.
Ireland still has one of the highest risk-of-poverty rates in theEU. As discussed in Chapter 2, this rate has shown littlechange over the period for which comparable data isavailable. In fact, the situation has, if anything, got worse inrelative terms: while our high level of poverty was in line withour relatively low GDP per capita in the 1980s, our high levelof poverty is now completely out of line with our nationalprosperity. Even in terms of the consistent poverty measure(combining income and deprivation) which has been thefocus of official targets since 1997, Ireland has a higher rateof poverty than many of our European neighbours at thesame level of economic development.
As the detailed studies of children, older people, migrantsand people with disabilities have shown, large proportions ofour population are still facing very limited opportunities andare effectively excluded from playing their full role in Irish
294
Welfare Policy and Poverty
___________
1 Data refer to net migration.
Chapter 10 17/09/2007 16:55 Page 294
society. The chapters on health and education indicate theextent to which our health and education systems still lead tohighly unequal outcomes – despite considerable investmentand despite many positive measures which seek to assist themore disadvantaged sections of our population.
Why have we not done better?
The studies in this book suggest that the main problem is thatpublic policy has yet to adopt and implement a coherent anti-poverty approach. It is not the case that policy is clearlyfocused on delivering anti-poverty outcomes but that itsimplementation is faulty. Rather, as we can see in thechapters on health and education, the system is structured insuch a way that unequal outcomes are the likely result.
There is no doubt that poverty and social inclusion have beenseen by successive governments as important policy issueswith the establishment of the first National Anti-PovertyStrategy (NAPS) in 1997 (in advance of EU moves in this area)leading to the 2007 National Action Plan on Social Inclusion(NAPinclusion). Issues relating to poverty and social inclusionhave also featured in a number of national agreements –including the current social partnership agreement Towards2016. Nonetheless, the evidence points to the fact thatgeneral statements, objectives and even specific targets onpoverty have not been translated into actual policy measureslet alone poverty outcomes.
It is, for example, regrettable to note that there is littleindication in this review of welfare policy that the detailedtargets set in the initial and revised NAPS have had a majorimpact on policy. Some targets have been met, some havenot and in other cases the non-availability of data means that
295
Developing an inclusive society
Chapter 10 17/09/2007 16:55 Page 295
progress cannot be assessed. However, even where targetshave been met, there is little indication that policies adoptedas part of the NAPS process – as opposed to broadereconomic and political developments – were a majorcontributor.2
One might suggest that the rapid nature of our economicturnaround and the tendency towards policy convergenceamongst political parties has meant that we have not had thedebates about the appropriate direction for public policy (as itrelates to poverty) which took place in many of the countriesin which anti-poverty policy is more strongly located at thecentre of public policy (see O’Kelly, 2007). Policies whichwere focused on providing basic standards of welfare, healthand education services – which may have been appropriate inthe relatively poor Ireland up to the 1980s – now lead tosignificantly different outcomes and can contribute to socialexclusion (rather than countering it as originally intended).
Connolly’s (2007) examination of the extent to which anti-poverty policy has been institutionalised in social partnershipsuggests that the place of anti-poverty policy over this periodis that of a residual policy category, shaped primarily by theneeds of macroeconomic policy. She argues that the ‘policyframe evident in the social partnership process has proven tobe a barrier to developing anti-poverty policy beyond theparameters laid down in the early agreements’ (p. 38). The
296
Welfare Policy and Poverty
___________
2 It might be argued that the achievement of the income adequacy targetin the NAPS (€150 in 2002 terms by 2007) disproves this assertion.However, the meaning of the specific commitment is, at best, opaqueand could have been ‘achieved’ in a number of different ways. Thissuggests that it was broader policy and political factors which led tothe very significant increases in welfare rates in recent years.
Chapter 10 17/09/2007 16:55 Page 296
implication of these factors, Connolly claims, are that‘incremental change will not significantly alter the place ofanti-poverty policy within Irish public policy and it will requirea reworking of the fundamental ideas that underpin thisinstitutionally embedded policy regime to produce aneffective response to the poverty and inequality in Irishsociety’ (p. 38). The findings of this book are generallyconsistent with that analysis in relation to overall publicpolicy.
A developmental welfare state and poverty policy
As seen in Chapter 1 (and in many of the other chapters), therole of a developmental welfare state has recently beenhighlighted by the NESC (2005a). The NESC’s study isimportant from a poverty perspective for two main reasons.First, it identifies the need for a new approach to welfarepolicy if we are to address the challenges of poverty andsocial exclusion. Second, it provides a coherent rationale forseeing social policy as a central concern of government andas a vital contributor to our economic progress rather than asa residual issue subsidiary to the (more) important economicpolicy issues. The NESC stresses that economic and socialpolicy are closely interrelated. Thus, on the one hand, ‘thedevelopment of a dynamic, knowledge-based economy hasinherent social implications that can serve social justice and amore egalitarian society’ and, on the other, a move to adevelopmental welfare state is integral to sustaining thedynamism and flexibility of Ireland’s economy (p. xxiii).
Building a developmental welfare state?But, accepting the importance of the NESC’s contribution tothe debate, to what extent has its vision of a developmental
297
Developing an inclusive society
Chapter 10 17/09/2007 16:55 Page 297
welfare state been implemented in practice? The NESC holdsan important position in the Irish policy-making constellationand includes members of all the key social partners.However, the social partners do not always prioritise in socialpartnership agreements the more general statements ofpolicy they agree to in the context of the NESC. Nor is itentirely clear that the NESC’s vision influenced politicians inthe formulation of policy positions in the 2007 generalelection campaign.
Looking at subsequent policy statements such as Towards2016 and the National Action Plan on Social Inclusion, wemight suggest that the NESC’s vision has been imperfectlyimplemented to date.
Towards 2016 does state that ‘The Social Partners subscribeto the NESC vision of Ireland in the future, the keyfoundations of which are: a dynamic, internationalised, andparticipatory society and economy, with a strong commitmentto social justice, where economic development isenvironmentally sustainable, and internationally competitive’(Ireland, 2006b). Towards 2016 also adopts a lifecycleframework, as set out by the NESC in The DevelopmentalWelfare State (DWS), which the agreement describes as oneof its key innovative features.
The NAPinclusion 2007–2016 refers on a number ofoccasions to the NESC’s report. For example, it states that, inline with the DWS approach, there is now a greater emphasison services and activation (rather than income measures) as ameans of tackling social exclusion (Ireland, 2007). It alsoagrees with the NESC that access to a wide set of services isessential to underpin the economy, to maintain socialcohesion and to combat social exclusion. As with Towards
298
Welfare Policy and Poverty
Chapter 10 17/09/2007 16:55 Page 298
2016, the NAPinclusion uses a lifecycle approach. Withineach lifecycle area it also reflects the NESC’s emphasis onincome support, services and innovative measures.
The impact of the NESC’s approach appears to have beengreatest in terms of the lifecycle approach. The NESC statesthat ‘a feature of the DWS [is] that differentiated thinking isbrought to bear on income supports for individuals atdifferent stages in the lifecycle’ (2005a, p. xx) – although itdoes not, in fact, use the term ‘lifecycle approach’. However,one might wonder whether this was the most fundamentalaspect of the report or rather a means to an end.
The second area in which the NESC appears to have had animpact is in relation to its proposals for people of workingage. This is, perhaps, unsurprising, as the application of theNESC’s approach is most fully worked out in this area.However, in the critical area of services, the NAPinclusion israther lacking any fundamental reappraisal along the linesrecommended by the NESC (see below). Indeed, in the areaof education, it repeats a target concerning completion ofsecond level education that was originally set in the firstNAPS in 1997 (and unachieved since) while very specific andchallenging health targets set in the revised NAPS (Ireland,2002) have disappeared from the current NAPinclusion.3
While it might be unfair to suggest that the impact of theNESC’s report has been mainly in terms of how the issues arepresented, it is far from clear that its central message has
299
Developing an inclusive society
___________
3 For example, the revised NAPS set a target to reduce the gap inpremature mortality between the lowest and highest socio-economicgroups by at least 10 per cent for circulatory diseases, for cancers andfor injuries and poisonings by 2007 (Ireland, 2002).
Chapter 10 17/09/2007 16:55 Page 299
been taken on board in recent policy agreements andstrategies.
Key policy areas
Examining some of the key issues which need to beaddressed if we are to achieve a more inclusive society, thissection draws on the analysis contained in the NESC’s reportand looks, in particular, at the provision of services andincome supports from an anti-poverty perspective.4
ServicesAs we have seen, the NESC (2005a) identifies access to awide set of services (including education, health, childcare,eldercare, transport and employment services) as ‘essentialto attaining the workforce quality that underpins acompetitive, knowledge-based economy, to maintainingsocial cohesion and combating social exclusion’ (p. xix). TheNESC regards ‘the radical development of services as thesingle most important route to improving social protection’ (p. xix). It sees the first public policy challenge as being toensure that every member of Irish society has access to thelevel and quality of service she or he needs, with quality andequity being assured.
Chapters 6 and 7 in this book highlight the inequality ineducational and health outcomes in Irish society and suggestthat, despite the important work carried out and the recentreforms, quality and equity are still fundamentally lacking inboth areas.
300
Welfare Policy and Poverty
___________
4 Space does not allow a consideration of the third area identified by theNESC, that of ‘activist measures’.
Chapter 10 17/09/2007 16:55 Page 300
EducationTormey (Chapter 6) shows that those from poor and working-class backgrounds fare worst within our education system. Togive some examples:
• Young people in schools in disadvantaged areas have agreater risk of having significant reading difficulties
• Absenteeism is notably higher in schools in highlydisadvantaged areas
• Young people from poor backgrounds leave school earlierand with fewer qualifications
• Even where young people finish school, students fromworking-class backgrounds take fewer honours subjectsat Leaving Certificate and achieve fewer points than thosefrom middle-class backgrounds.
This is particularly important for future life outcomes asresearch in Ireland has identified a link between low levels ofeducational qualifications and unemployment, betweeneducational attainment and rates of pay, and that the gap inincome and job security between those with educationalqualifications and those without widens over time. In fact,Tormey points out that the link between education and futurelife chances may even be stronger in Ireland than in manyother industrialised countries. Tormey highlights the need forsystemic reform of the education system in order to addressthose aspects which are contributing to inequality. Hesuggests a number of measures, including:
• A centralised or regional applications and allocationssystem for primary and secondary education to countermarket forces and to de-segregate the school system
301
Developing an inclusive society
Chapter 10 17/09/2007 16:55 Page 301
• Addressing school practices associated with inequality(such as streaming or banding)
• In-career teacher development to promote moreappropriate pedagogic models.
HealthKelleher (Chapter 7) points out that by comparison withinternational neighbours Ireland’s contemporary health status(based on measures such as life expectancy) is still poor.There is also evidence of a class differential, with anappreciable mortality difference between the highest andlowest occupational classes, for example a 300 per centdifference for circulatory diseases and a 600 per centdifference for injuries, poisonings and respiratory diseases.Kelleher emphasises the need to ensure universal equity ofaccess to healthcare in both primary and hospital carefacilities and proposes a range of measures including:
• The implementation of health impact assessments for allpublic policies to ensure that major developments in areassuch as transport, housing and education provision areappropriate
• Introducing comprehensive mother and child servicesacross health, education and social welfare sectors,including non-means-tested primary care eligibility untilchildren reach the age of eighteen
• Removing the two-tier structure from both primary andacute hospital care
• Implementing the primary care team network nationwide
• Implementing consultant-directed acute hospital serviceswithout re-creating a two-tier public–private infrastructure
302
Welfare Policy and Poverty
Chapter 10 17/09/2007 16:55 Page 302
• Developing a major primary-care-led health service forolder people running the spectrum from health promotionand social support through to acute hospital and pastoralcare.
DisabilityFitzgerald (Chapter 8) discusses the major challenges thatpeople with disabilities in Ireland face in playing their full rolein society. However, one encouraging sign from this review ofwelfare policy and poverty is the extent to which the nationaldisability strategy is an attempt, not simply to address someof the inequalities facing people with disabilities, but rather toplace disability issues right at the centre of the policy-makingprocess through a coordinated programme of legislation(Disability Act, Education for Persons with Special EducationNeeds Act and Citizens Information Act), a multi-annualinvestment programme and departmental sectoral plans.
There has been considerable debate over whether disabilityservices should be rights-based, however Nolan (2003) pointsout that it may be possible to make progress incrementally inimproving the position of people with disabilities withouthaving to resolve the issue as to the appropriate legal basisfor such services. As Nolan argues, it would be a significantadvance if:
• The state, through the relevant authorities, set out clearlywhat level of service provision the current level ofresources is intended to underpin
• People with disabilities not only knew what this level ofservice provision was at an individual level, but had anentitlement to those services with associated enforcementmechanisms
303
Developing an inclusive society
Chapter 10 17/09/2007 16:55 Page 303
• It was set out in concrete terms how services are to beimproved over time as more resources become available.
The national disability strategy holds out the possibility thatdisability issues can be placed at the centre of the policy-making process, leading to the important improvements inservices to which Nolan refers. The key issue will be, ofcourse, the extent to which the promise of the strategy istranslated into a reality for people with disabilities in Ireland.
ImmigrationPillinger (Chapter 9) shows that migrants are another groupwho face important challenges in integrating into Irish society.This is an entirely new challenge for Irish society. On the onehand, research indicates that migrants tend to be quite highlyeducated with migrant workers having significantly highereducational qualifications than the workforce as a whole. Onthe other hand, research also indicates that, controlling foreducation and work experience, immigrants earn 18 per centless than native workers and immigrants from non-Englishspeaking countries are at a 31 per cent wage disadvantagecompared to native workers (Barrett and McCarthy, 2006).5
Pillinger also shows the difficulties facing migrants in otheraspects of their lives – in particular asylum seekers,
304
Welfare Policy and Poverty
___________
5 It should be noted that initial low pay for immigrants would not beunexpected. It has been argued that immigrants may initially lacklocation-specific human capital (such as language). This analysiswould expect immigrants’ earnings to converge with those of Irishpeople over time. However, whether this thesis is correct and whetherconvergence will occur in practice remains to be seen and may verymuch depend on the adoption of appropriate policies of support.
Chapter 10 17/09/2007 16:55 Page 304
unaccompanied minors, victims of trafficking, spouses ofwork permit holders, low-paid migrant workers and migrantworkers who do not fulfil the Habitual ResidenceCondition. This highlights the importance of a societalresponse to ensure that migrants and their families areenabled to have access to the full range of services whichthey require and that they are supported in integrating into Irish society.
Pillinger sets out a range of recommendations including:
• The need for long-term planning of services to reflectincreased numbers and the diversity of the community
• A high-level cross-cutting mechanism on migration sothat relevant government departments develop moreeffective actions that help to integrate migrants intowork and community life
• The engagement of migrant communities themselves,particularly through peer-led and communitydevelopment approaches
• Particular attention given to the vulnerability of thosemigrants living and working in Ireland who experiencepoverty, poor living conditions, social exclusion, racismand poor access to employment
• More information about rights, entitlements and thestructure of health, social care, education, housing andother services
• A more flexible migration and family reunificationsystem.
305
Developing an inclusive society
Chapter 10 17/09/2007 16:55 Page 305
She argues that future policy developments in the area of integration should be broad ranging and cover economic, social, political and cultural rights that impact on work, social inclusion and the engagement of civilsociety.
IncomeThis section reviews the issues concerning income supportover the lifecycle.
Working-agedAs Murphy (Chapter 4) shows, a focus on the concept ofthe working-aged is a recent development in Irish socialpolicy, reflecting the dramatic rise in the employment rate.Previously, the main emphasis had been on theunemployed and those on sickness benefits, with loneparents and people on long-term disability payments beingseen as outside the labour market. The NESC (2005a)highlights the importance of looking at the proportion ofpeople of working age on welfare – rather than the nowoutdated focus on the live register. It envisages thedevelopment of a more inclusive labour market with higheremployment rates which would, in turn, place socialprotection on a sounder footing. An integral part of this is amove away from a ‘passive’ approach to those of workingage on welfare, extending the type of approach tounemployed claimants seen under the national employmentaction plan to broader groups. The NESC recommends thattailored progression pathways should become the norm forworking-aged claimants.
One of the working-aged areas highlighted by the NESC isthat of lone parents. Here the numbers have grown very
306
Welfare Policy and Poverty
Chapter 10 17/09/2007 16:55 Page 306
significantly in recent years albeit that this, in large part,reflects demographic trends and a broadening of the scope of the schemes for lone parents in the 1990s. The more activist approach has already been reflected in a government discussion paper on reform of incomesupports for lone parents and low-income parents (Ireland,2006a). This recommends a quite radical change inapproach to support in this area. It identifies the problemswith the existing schemes, including the fact that childpoverty remains quite high in Ireland, that the conditions ofthe scheme deter family formation and joint custody andthat there is no structured or systematic engagement withthe claimants from a labour market perspective.
Having considered a number of different options for reform,the discussion paper recommends the establishment of anew parental allowance for low-income families with youngchildren. This would replace the current one-parent familypayment and qualified adult allowance (for social assistancepayments). The new payment would be time-limited:payable to families where the youngest child is under aspecified age (the report recommends seven years). Therewould be no employment-related conditions until theyoungest child reached five years. When the youngest childwas between the ages of five and seven, more active andcompulsory engagement would take place involvingattending meetings with a job facilitator to provideinformation and advice on education, training oremployment options. Payment of the allowance would beconditional on participation in this process. When the childreached the cut-off age, payment of the allowance wouldcease and, if the parent was not in employment, the personcould apply for any other appropriate social welfare
307
Developing an inclusive society
Chapter 10 17/09/2007 16:55 Page 307
payment such as jobseeker’s allowance or the back to workallowance.6
The proposal is quite a radical one and aims to achieve anumber of different objectives largely in line with theproposals of the NESC. It would ensure a more active andparticipation-based approach, moving away from thecontingency-based approach which arguably traps loneparents on one-parent family payment, and would involve amove towards partial individualisation of payments.
This activist approach to lone parents is continued in theNAPinclusion (although the status of the specific proposalsremains somewhat unclear). The NAPinclusion proposes thatan active case management approach will be introduced tosupport those on long-term social welfare into education,training and employment. It sets a target to support 50,000such people, including lone parents and the long-termunemployed, with an overall aim of reducing by 20 per centthe number of those whose total income is derived from long-term social welfare payments by 2016 (Ireland, 2007).
While the NESC’s analysis of what needs to be done in thearea of the working-aged population is very clear, there
308
Welfare Policy and Poverty
___________
6 The discussion paper recommends that those in receipt of the parentalallowance should be allowed to retain earnings (up to a certain level)without affecting the payment. It recommends the abolition of theexisting cohabitation rule (which applies to lone-parent payments) andthe abolition of the limitation on the amount of welfare payable to acouple where both are in receipt of a means-tested payment. Thiswould mean that if a person in receipt of the new parental allowancelived with someone in receipt of jobseeker’s allowance or anothermeans-tested payment, he or she would continue to receive the fullpayment in their own right.
Chapter 10 17/09/2007 16:55 Page 308
remains a lot of work to do to implement it. And there is aneed to prioritise the most important steps to take toachieve its objectives. Arguably the most importantmeasure which should be taken is the immediateengagement with people on payments such as one-parentfamily payment and disability allowance which can be done(and has been done on a pilot basis) without any change inthe law. Whether any changes are necessary to makeengagement compulsory (as recommended by the NESC)might best be decided after an initial voluntary approach.However, politicians and administrators appear to havebeen reluctant to attempt such an approach without achange in the underlying legislation.
The role (if any) of in-work benefits requires furtherconsideration. The NESC has taken a somewhatinconsistent approach in this area. It recommends, on theone hand, uprating disregards of earned income (that is,increasing the amount of income a person can earn withoutaffecting their welfare payment); and on the other hand,reducing the duration which people spend on benefits. Butthe increase in disregards may well lead to people stayingon benefits as long or longer and combining work andwelfare income.
The UK and US have been pioneers of in-work benefits andhave distinguished clearly between ‘bad’ welfare benefitsand ‘good’ in-work payments (operating now in bothcountries through the income tax system). This approach atleast allows a clear focus on both reducing benefit durationand supporting work. But in-work benefits, even in thisdeveloped form, are not without problems. As Iversen(2005) points out, a focus on in-work benefits can provide adisincentive to workers to acquire skills, may discourage
309
Developing an inclusive society
Chapter 10 17/09/2007 16:55 Page 309
low-skilled workers from improving their skills throughadditional formal education and may give rise to increasedfiscal costs if a rise in low pay and inequality is to be avoided.Such benefits are dependent on a healthy economy and anover-emphasis on such an approach could lead to pro-cyclical cuts in spending in a downturn as low-wage workerslose both jobs and benefits.
Ireland has the advantage that in-work benefits are currentlyquite small and we can therefore decide whether this is anappropriate path before rather than after we increasespending. Further research might usefully be carried out onthe international experience in this area.
ChildrenRecent research by the OECD indicates that policies toreduce poverty amongst children ‘should not be seen aschoosing between either work or benefits, but require abalanced approach that encourages increased employmentamong parents and also increases the reward of paid work atthe same time’ (Whiteford and Adema, 2007, p. 36). Thusthey will involve both child support measures and working-aged policies.
As Sweeney (Chapter 3) describes, the primary focus ofsupport for children over the past decade has been childbenefit. Beginning in 1994 under the Rainbow coalitiongovernment, child dependant allowances (additionalpayments directly linked to social welfare payments intendedto provide support for child dependants) were frozen in leveland resources directed instead towards the universal childbenefit. However, for a number of years there was noconsistent approach to the appropriate level of child benefit.In 2000, the Fianna Fáil-led government took a very
310
Welfare Policy and Poverty
Chapter 10 17/09/2007 16:55 Page 310
significant step in this area announcing a major programme ofinvestment in child benefit over a three-year period to almosttriple the payment. However, after two years of significantincreases, the implementation of this policy was slowed down7
and the emphasis altered, insofar as coverage of childcarewas concerned, in Budget 2006 with the announcement of anew childcare payment for children under six years.
Given the considerable cost of child benefit increases, theNESC was tasked in Sustaining Progress (Ireland, 2003) withcarrying out a study on whether a new child support paymentcould be established, replacing child dependant allowancesand the current in-work payment (family income supplement).The report arising from this study has not yet been published,presumably due to disagreements amongst the socialpartners.8 However, Sweeney highlights a number of findingsfrom the study – for example the costly nature of child benefitand the limited extent to which it is focused on people on lowincomes – and explores the possibility of introducing atargeted second-tier child support payment which wouldchannel support to children in low-income families.
The NESC argues that the current high rates of child poverty‘represent a very poor return’ for the significant increases inchild benefit in recent years (2005b, p. 155). However analternative perspective would suggest, firstly, that the
311
Developing an inclusive society
___________
7 The original target was eventually ‘reached’ in 2006 but this obviouslydoes not have regard to changes in earnings and the cost of living inthe interim period.
8 This is perhaps an area where it would be preferable, in line with theearlier practice of the NESC, to commission an independent study ofthe options upon which the Council could then comment rather thanattempting to obtain agreement amongst all the social partners inrelation to such a complex issue.
Chapter 10 17/09/2007 16:55 Page 311
objective of child benefit is not only to reduce poverty butthat it also has a horizontal redistributional component, that isto direct support to families with children. Secondly, focusingsolely on the anti-poverty aspect, child benefit does not, it istrue, direct significant resources to those in the lowestincome deciles but this is because those in those decileshave few children. An alternative comparison would be tolook at the distribution of benefits to families (with children).Here studies have shown that those with children (particularlylarge families) have a very high poverty risk and so a universalpayment, such as child benefit, directs resources to suchfamilies in a manner which avoids both the employment andhousehold formation problems implicit in any targetedapproach. Research by the ESRI confirms that the majorincreases in child benefit (and the introduction of the earlychildcare supplement) led to a significant decrease (of 4.2 percent) in the proportion of children falling below the relativeincome poverty line (Callan et al., 2006).
One disadvantage of any targeted second-tier payment iswithdrawal of benefits as income rises. This can be donesharply, which means that people can actually end up worseoff as earned income rises (although this will affect a relativelysmall group of people). Conversely, one can withdraw supportslowly to minimise disincentive effects (although this thenaffects a much wider group of people). Arguably if one adoptssuch an approach the best way to do it is through the incometax system (as in the UK) so that tax and welfare supports arecoordinated. But why then introduce a new taxable childbenefit supplement when the simplest way to introducegreater targeting would be to tax child benefit itself?
Child benefit may be a good example of the paradox ofredistribution (Korpi and Palme, 1998), whereby payment of a
312
Welfare Policy and Poverty
Chapter 10 17/09/2007 16:55 Page 312
universal as opposed to a more targeted benefit in factresults in a greater degree of redistribution because of thegreater level of political and public support provided to sucha cross-class benefit.9
PensionsMcCashin (Chapter 5) describes the development of pensionspolicy and notes that the absence of any earnings-relatedpension system is one of the key challenges facing policy-makers in Ireland. The Pensions Act 2000 required a review ofpension cover to be prepared not later than September 2006.The review was carried out by the Pensions Board (2006a),which re-evaluated the targets, both in relation to the level ofpension provided and of pension cover, set out by theNational Pensions Policy Initiative (NPPI) in 1998. In addition,the Board considered a range of options in order to meet thetargets and enhance pension coverage in Ireland. It generallyendorsed the view that a replacement income target of 50 percent of gross pre-retirement earnings remained appropriateand that the old age contributory pension should be raised to34 per cent of gross average industrial earnings.10 It alsoaccepted the NPPI coverage target that 70 per cent of thoseworking who are aged thirty or over should have occupational
313
Developing an inclusive society
___________
9 One of the difficulties with the introduction of any second-tier paymentis that the relationship between the universal child benefit and thetargeted supplement is unclear. What percentage of total support willthe universal payment – as opposed to the targeted supplement –represent?
10 In the latter case, a number of members believed that a higherminimum pension target is needed. In relation to the sustainability ofthe first-tier pensions, the Board recommended that persons retiringshould be offered the option of deferring their retirement date inexchange for a higher pension.
Chapter 10 17/09/2007 16:55 Page 313
or personal pension cover. However, although most membersagreed that the pension targets would not be met withoutsome change in the present pension system, the Board wasunable to agree on a clear policy direction in this regard.
The Board outlined a number of possible options including asignificant increase in the first pillar pension, the introductionof an earnings-related state pension and making privateprovision mandatory.11 It agreed to recommend specificenhancements to the current voluntary system and manymembers considered that these enhancements could, overtime, achieve significant improvement in coverage andadequacy.12 However, it must be seriously doubted, based onthe evidence in Ireland and other European countries to date,whether these proposals have a realistic chance of increasingpension coverage to the required extent.
When it came to mandatory pension coverage, althoughsome members of the Board believed that a mandatoryapproach was the only certain way of achieving targets,others believed that the cost of this approach was too greatin terms of its potential economic impact. However, thenMinister for Social and Family Affairs Séamus Brennan askedthe Board to complete its consideration on this aspect ofpension policy and, rather than asking whether such a
314
Welfare Policy and Poverty
___________
11 The Board commissioned a number of useful studies in relation tothese options which are appended to its report.
12 Other members of the Board, although not thinking that the proposalswould achieve the targets, nonetheless supported them as a means ofimproving the current situation. Specifically, the Board recommendedthat the state incentive for Personal Retirement Savings Account(PRSA) pension contributions be granted by means of a matchingcontribution of €1 for each €1 invested rather than through tax relief,subject to a maximum amount.
Chapter 10 17/09/2007 16:55 Page 314
pension should be introduced, asked for analysis of whatsuch a pension might look like (Pensions Board, 2006b).Following on from this study, the government committed inTowards 2016 to publish a green paper on pension policyoutlining the major policy choices and challenges in thisarea and taking into account the views of the socialpartners.
The position in Ireland is somewhat similar to that in theUK.13 The options in the UK have been clearly summarisedby the Pensions Commission (2006). Given the projectedrise in older people as a proportion of the population, theseare:
1. Future pensioners will on average be poorer relative toaverage net incomes than today
2. Taxes/insurance contributions will have to rise to pay forpensions or other public spending will be cut to makeroom for pensions
3. Each generation will have to save more and be reliant onthe next generation also choosing to save more andtherefore buying the larger stock of assets accumulatedby the prior generation
4. Average retirement ages will have to rise.
315
Developing an inclusive society
___________
13 The key differences are that while Ireland’s first-tier pension is largelycontributory based, in the UK there is heavy reliance on a means-tested system to achieve adequacy rates; and the UK already has amandatory second-tier pension.
Chapter 10 17/09/2007 16:55 Page 315
If, given the fact that very significant numbers of pensionersare on relatively low incomes at present,14 we rule out optionone, this means that policy must involve some combination ofoptions 2, 3 and 4. The Pensions Board (2006a) discussedraising the pension age and it is sometimes suggested thatthis is necessary to address pension costs. However, manyIrish people currently retire well before the statutory pensionage. Before addressing the controversial topic of raising thepension age (other than on a voluntary basis), it makes moresense to try to get people to work up to the existing pensionage and look at the range of employment and other policiesnecessary to encourage people to stay at work. As McCashinpoints out, raising the pension age on its own is a very bluntinstrument and does not necessarily ensure that retirementage rises accordingly (as people may seek to use alternativeinvalidity or disability payments or rely on occupationalpensions).
Secondly, some form of greatly increased pension will benecessary to provide a decent retirement income. Theintroduction of PRSAs has not led to a significant increase inpension take-up and seems unlikely to do so to a sufficientextent. The Pensions Board has now recommended evenfurther and restructured government incentives to take out apension on a voluntary basis. However, as McCashin argues,tax incentives are already expensive, benefit those on higherincomes most and have been ineffective in raising pension
316
Welfare Policy and Poverty
___________
14 As McCashin shows in Chapter 5, the apparent ‘fall’ in the proportionof older people in poverty after 2001 is due to the fact that the povertyline has only increased marginally, allowing pensions to ‘catch up’ withit. Pensions increased by 31 per cent between 1998 and 2001 butpensioner poverty rose to 44 per cent. Pensions increased by 17 percent between 2001 and 2004 but pensioner poverty fell to 27 per cent.
Chapter 10 17/09/2007 16:55 Page 316
coverage over the period from the 1970s. It is not clear thatrevised incentives will be more successful but they certainlywill be even more costly.
The alternative is some form of mandatory approach, such ashigher social welfare pensions, a state earnings-relatedpension or mandatory (or quasi-mandatory) private pensions(or a combination of these options). McCashin points to thebenefits of a development of the current social welfarepensions with a significant increase in the rate of pension to50 per cent of average industrial earnings.15 It would appearthat the government should make a decision that mandatorycoverage is necessary and carry out any necessary furtherstudies as to the appropriate options rather than going furtherdown the road of voluntary approaches which have yet to beshown to work in any country.
Key cross-cutting issues
As identified in Chapter 1, this book examines a number ofcross-cutting themes, including, in particular, gender andequality and rights-based policies.
GenderAs Walsh highlights in Chapter 2 (and in a range of previousstudies), poverty has a particular gendered impact. At moststages of the lifecycle, women remain much more likely to bein poverty than men. Walsh shows that the risk-of-povertyrate for women has increased over time from a low of 16 per
317
Developing an inclusive society
___________
15 For a discussion of different options see Stewart, 2005; Cousins, 2005;Whelan, 2006; and the studies annexed to the National PensionsReview and the subsequent report on mandatory pensions (PensionsBoard, 2006a, 2006b).
Chapter 10 17/09/2007 16:55 Page 317
cent in 1994 to a high of 23 per cent in 2001, before fallingback to 18.5 per cent in 2005. This trend is shaped by thepattern for older people, as there is a predominance of womenamong older people and they are more reliant on welfarepayments. The level of consistent poverty for women is alsosomewhat higher than the male rate. And these adversefindings extend into other policy areas. Kelleher (Chapter 7)shows that, from a health perspective, cancer incidence inwomen in Ireland is the third highest in Europe and cancermortality the second highest. Pillinger (Chapter 9) highlights thefact that women migrants often experience particulardifficulties including the double discrimination faced byimmigrant women in the labour market, poor workingconditions and exploitation.
These findings highlight the need for policy-makers to putgender issues at the centre of the policy-making process. Inthe area of income support, it emphasises the importance oflooking at issues such as child income support from agendered perspective. It also, as Murphy shows in Chapter 4,accentuates the importance of taking account of gender issues(such as the need for family-friendly and childcare measures) inany policy to encourage currently non-employed welfareclaimants into employment. Equally important is access toincome support for older women, given that older women maybe particularly at risk of poverty. This emphasises theimportance of ensuring access to adequate pensions, but, asMcCashin shows in Chapter 5, the percentage of older men indirect receipt of a state old age pension is significantly higherthan the proportion of the female population – 95 per cent incontrast to 80 per cent – and while three-quarters of menreceive an insurance pension, among women the figure ismuch lower.
318
Welfare Policy and Poverty
Chapter 10 17/09/2007 16:55 Page 318
Equality and rights-based policiesInterestingly, issues concerning rights rarely arose in thechapters dealing with income support. This is clearly becausea legal right to payment already exists in these areas with arelated right of appeal to the independent Social WelfareAppeals Office. Provision of services is generally much lessrights-based. On the one hand, it may be more difficult toadjudicate on issues concerning the right to, for example,health services, which can raise complex medical issues. Onthe other hand, it can be argued that some of the failings ofthe existing services, for example the inability of somechildren to access basic educational services, have been dueto the lack of any rights-based approach in practice.16
Similarly Murphy, in Chapter 4, highlights the need for arights-based approach in the area of active labour marketpolicies so as to safeguard the right to social inclusion andensure it is not made contingent solely on economicparticipation.
In Chapter 9, Pillinger highlights the importance of rights inrelation to migration policy at a number of different levels.First, the importance of respect for international human rightssuch as those set out in the European Convention on HumanRights. Second, the need for a rights-based approach tomigration policy so that people can be aware of the reasonsfor, and be able to challenge, adverse decisions. And third,the importance of ensuring that migrants can enforce rightswhich do exist to, for example, welfare benefits, where they
319
Developing an inclusive society
___________
16 In fact the Irish Constitution provides an obligation on the state toprovide for primary education. However, this right has not been giveneffect through legislation or administrative practice, which means that,in practice, children either cannot enforce it or, a rare minority, have totake proceedings in the High Court to do so.
Chapter 10 17/09/2007 16:55 Page 319
may encounter difficulties because of lack of local knowledgeor language barriers.
The Disability Act 2005 – while not explicitly rights-based – isan interesting attempt to provide statutory rules as toassessment for and the provision of services and to establisha mechanism to enforce the provision of those services. Onthe basis of the debates about that legislation, it may beunrealistic to expect that all services will be established onthe basis of justiciable rights in the immediate future.Nonetheless, there are a number of steps which can be takento improve access to services from an anti-povertyperspective. First, where constitutional and statutory rightsalready exist (as, for example, in relation to aspects of healthand education services), measures should be put in place toallow people to enforce those rights (without having to haveaccess to the courts).17 Second, the potential of the ‘qualitystandards’ approach can be tested to examine thecontribution which it can make in practice to improving theposition of people who are in poverty.18 The Equal StatusActs 2000 to 2004 and the European Convention on HumanRights are likely to become increasingly important over timeboth in helping to establish rights and in ensuring thatparticular groups are not discriminated against in terms ofaccess to services.19 Finally, information, advice and
320
Welfare Policy and Poverty
___________
17 For example, the Health Acts provide for a statutory appeal systemconcerning the refusal of a medical card but this has never beenbrought into force.
18 Through, for example, the recently established complaints procedureunder Part 9 of the Health Act 2004.
19 The Equal Status Act currently excludes statutory services providedunder ‘any enactment’. However, this leaves many aspects of publicservices within the remit of the Act.
Chapter 10 17/09/2007 16:55 Page 320
advocacy services need to ensure that all people can accessthe available rights and services.
Conclusions
The key message of this book is that, despite the importantprogress in many aspects of Irish society, our socialdevelopment – in terms of poverty levels, health andeducation outcomes – has not kept pace with our economicdevelopment. The studies in this book suggest that the mainreason for this is that public policy has yet to adopt andimplement a consistent anti-poverty approach as a corepolicy concern. The NESC’s identification of a coherentapproach to and rationale for a developmental welfare state isan essential first step in the birth of a new welfaredispensation and the development of a more inclusivesociety.
A number of recent studies have identified the links betweendifferent employment and business structures and thedevelopment of welfare states. For example Mares (2003)argues that the presence of skilled workers, firm size and therelative incidence of risk facing a firm can affect employerpreferences for social policy developments. In a similar vein,Iversen (2005) argues that employees who have invested inspecific skills also tend to favour greater welfare statespending. Insofar as the Irish economy will focus in the futureon more internationally traded services and higher skills, thiswould suggest greater pressure for higher welfare statespending. However, welfare state spending cannot simply beread off the employment or business structure of a particularcountry. If the developmental welfare state is to beimplemented in practice, political decisions will be essential.And while it is an important achievement for the social
321
Developing an inclusive society
Chapter 10 17/09/2007 16:55 Page 321
partners to agree on a theoretical approach in the NESC, itmay be unrealistic to expect them to agree to the importantchanges necessary to implement this approach in practice.Here political initiative will be essential.
We are now at a critical juncture in the development of Irishanti-poverty policy. Demographic pressures are relatively low.Economically, Ireland has moved from being a relatively poorperipheral European country to having a GNP per capita thatis one of the highest in the EU. It has long been argued thatsuch economic development is a necessary pre-condition forsocial policy improvements. We now have the economicresources to invest in social policy. Just as important – as hasbeen argued by the NESC and others – social development isessential both in itself and as a necessary component offuture balanced economic growth.
We are now able to make important decisions about thefuture of Irish society. And the decisions we make (or do notmake) now will influence welfare outcomes for the nextdecades. Public policy has set the goal of developing aparticipatory society and economy, with a strong commitmentto social justice. However, as shown in this book, the focus ofpolicies has been on targeted measures to address povertyand social inclusion rather than on ensuring that policiesthemselves are designed to achieve equal and equitableoutcomes.
If we are to achieve in the area of social development whathas been achieved in economic development, it will beessential that policy-makers move the developmentalapproach to the centre of the policy-making process. This isa challenge and a responsibility for us all.
322
Welfare Policy and Poverty
Chapter 10 17/09/2007 16:55 Page 322
References
Barrett, A. and McCarthy, Y. (2006), Immigrants in a Booming Economy:Analysing Their Earnings and Welfare Dependency, Bonn: IZA
Callan, T., Coleman, K., Nolan, B. and Walsh, J. R. (2006), ‘Child Povertyand Child Income Supports: Ireland in Comparative Perspective’, inBudgetary Perspectives 2007, Dublin: ESRI
Connolly, E. (2007), The Institutionalization of Anti-Poverty and SocialExclusion Policy in Irish Social Partnership, Dublin: Combat PovertyAgency
Cousins, M. (2005), Explaining the Irish Welfare State, Lewiston: EdwinMellen
Ireland (1997), Sharing in Progress: National Anti-Poverty Strategy, Dublin:Stationery Office
Ireland (2002), Building an Inclusive Society, Dublin: Stationery Office
Ireland (2003), Sustaining Progress: Social Partnership Agreement2003–2005, Dublin: Stationery Office
Ireland (2006a), Government Discussion Paper: Proposals for SupportingLone Parents, Dublin: Stationery Office
Ireland (2006b), Towards 2016: Ten-Year Framework Social PartnershipAgreement 2007–2016, Dublin: Stationery Office
Ireland (2007), National Action Plan for Social Inclusion 2007–2016,Dublin: Stationery Office
Iversen, T. (2005), Capitalism, Democracy and Welfare, Cambridge:Cambridge University Press
Korpi, W. and Palme, J. (1998), ‘The Paradox of Redistribution andStrategies of Equality’, American Sociological Review, vol. 63, no. 5,pp. 661–687
Mares, I. (2003), The Politics of Social Risk, Cambridge: CambridgeUniversity Press
NESC (2005a), The Developmental Welfare State, Dublin: NationalEconomic and Social Council
NESC (2005b), Strategy 2006: People, Productivity and Purpose, Dublin:National Economic and Social Council.
Nolan, B. (2003), On Rights-Based Services for People with Disabilities,Dublin: ESRI
323
Developing an inclusive society
Chapter 10 17/09/2007 16:55 Page 323
O’Kelly, K. P. (2007), The Evaluation of Mainstreaming Social Inclusion inEurope, Dublin: Combat Poverty Agency
Pensions Board (2006a), National Pensions Review, Dublin: PensionsBoard
Pensions Board (2006b), Special Savings for Retirement, Dublin: PensionsBoard
Pensions Commission (2006), A New Pension Settlement for the Twenty-First Century, London: HMSO
Stewart, J. (ed.) (2005), For Richer, For Poorer: An Investigation of the IrishPension System, Dublin: tasc
Whelan, C. T. and Layte, R. (2006), ‘Economic Boom and Social Mobility:The Irish Experience’, Research in Social Stratification and Mobility,vol. 24, no. 2, pp. 193–208
Whelan, S. (2006), ‘A Constructive Critique of Pension Policy in Ireland’,21st Annual Conference of the Foundation for Fiscal Studies, Dublin,29 March
Whiteford, P. and Adema, W. (2007), What Works Best in Reducing ChildPoverty: A Benefit of Work Strategy?, Paris: OECD
324
Welfare Policy and Poverty
Chapter 10 17/09/2007 16:55 Page 324
Glossary
Benchmarking: A point of reference. It is often used in thepublic sector as a term for comparing the performance inthe public sector with the private sector or for comparingsystems in Ireland with systems in other countries.
Child dependant: see Qualified child.
Community development: The long-term process wherebypeople who are marginalised or living in poverty worktogether to identify their needs, create change, exert moreinfluence in the decisions which affect their lives and workto improve the quality of their lives, the communities inwhich they live and the society of which they are part.
Consistent poverty: A measure of poverty which combinesrelative income poverty with a measure of deprivation, i.e.the lack of basic items such as a warm coat, sufficientfood or adequate heating. The percentage of people livingin consistent poverty is the proportion of the totalpopulation who are living on a lower than normal incomeand who lack certain basic essential items therebyexperiencing a lower standard of living than the rest ofsociety.
325
Chapter 11 - Glossary 17/09/2007 16:57 Page 325
Demographic ageing: Occurs when a relatively higherproportion of the population is made up of ageing or olderpeople, with implications for social spending on pensions,healthcare and other supports.
Direct provision: A support system for asylum seekerswhereby all accommodation costs together with the costof three main meals and snacks, heat, light, laundry,maintenance etc. are paid directly by the state. Inaddition, asylum seekers in receipt of direct provision arepaid €19.10 per adult and €9.60 per child per week.
Economic, social and cultural rights: Refers to the rights ofall persons to live a fully human life which meets theirphysical, emotional, intellectual and social needs. Beingdeprived of these rights is often symptomatic of living inpoverty. See also justiciable rights.
Empowerment: The process of transferring decision-makingpower from influential sectors to poor communities andindividuals who have traditionally been excluded from it.
EU-15, EU-25: Refer to the composition of the EU at differentstages of enlargement. EU-15 refers to the fifteen memberstates before the accession of ten new countries in 2004,while EU-25 refers to the position after that accession.
EU-SILC: European Union Survey of Income and LivingConditions conducted by the Central Statistics Office. Itreplaced the Living in Ireland Survey as the major sourceof poverty data from 2003.
326
Welfare Policy and Poverty
Chapter 11 - Glossary 17/09/2007 16:57 Page 326
GDP, GNP: Measures of the total value of goods and servicesproduced by a nation. Gross national product (GNP) is thevalue of all final goods and services produced within anation in a given year, plus income earned by its citizensabroad, minus income earned by foreigners from domesticproduction. In contrast, gross domestic product (GDP)excludes net income from abroad (that is, interest andprofits from overseas loans and investments, lesspayments on foreign debts and investments in thecountry; and net receipts of workers’ wages).
Gini coefficient: A quantitative measure of income inequalityranging from 0 to 1. The higher the coefficient, the higherthe inequality of the income distribution.
Income deciles: Measuring and comparing the relativeincome of different groups by dividing the total populationinto tenths.
Indexation: A method by which social welfare paymentswould be increased by a certain amount each year. Thisamount would relate to a particular factor index in theeconomy such as inflation, earnings or incomes.
Justiciable rights: Rights provide a claim or entitlement to aparticular resource or opportunity, such as the right tohousing, the right to an adequate standard of living or theright to vote. Justiciable rights refer to rights that are partof the legal structure and that can be brought by anindividual or a group before the courts for judgment onwhether the right can be enforced or can be used toensure the provision of a particular resource.
327
Glossary
Chapter 11 - Glossary 17/09/2007 16:57 Page 327
Lisbon Strategy: An agreement reached by EU heads ofgovernment at the Lisbon European Council in 2000 tointegrate employment, economic and social policies inorder to make the EU the most competitive economy inthe world.
Living in Ireland Survey (LIS): A survey carried out by theEconomic and Social Research Institute from 1994 to2001, the primary source of data on poverty anddeprivation in Ireland. Replaced by the EU-SILC from2003.
Marginalisation: The process whereby certain groupssuffering deprivation, for example the impoverished,unemployed, single parents and those with limited formaleducation, are pushed to the edge of society where theyhave little say in decision-making and are denied themeans to improve their position.
Multiculturalism: The status of several different ethnic, racial,religious or cultural groups coexisting in harmony in thesame society.
NAPinclusion: National action plan on poverty and socialinclusion agreed by each EU member state in order towork towards greater social inclusion through encouragingsustainable economic growth and quality employment forthe poorer sectors of society.
National Anti-Poverty Strategy (NAPS): The ten-year plan ofthe Irish government aimed at tackling poverty, whichinvolves consultation, target setting and poverty proofing.NAPS sought to achieve a better understanding of the
328
Welfare Policy and Poverty
Chapter 11 - Glossary 17/09/2007 16:57 Page 328
structural causes of poverty such as unemployment, lowincome and educational disadvantage. (Now subsumedinto the NAPinclusion.)
National Development Plan (NDP): The Irish government’sstrategy for allocating EU Structural Funds and otherpublic monies aimed at stimulating long-term growth anda fairer distribution of resources across the wholeeconomy.
Open method of policy coordination: A process wherebyEU member states are responsible for nationalemployment and social inclusion policies but are open toevaluation by other member states by submitting nationalaction plans to the European Commission. These arediscussed by the Commission and by social affairsministers at the European Council meeting each spring.Guidelines for the plans are set at EU level and includespecific timetables for achieving goals set, theestablishment of indicators to compare best practice,translating the European guidelines into national andregional policies and periodic monitoring and review.
Poverty: People are said to be living in poverty if their incomeand resources are so inadequate as to preclude them fromhaving a standard of living considered acceptable in Irishsociety. Because of their poverty they may experiencemultiple disadvantage through unemployment, lowincome, poor housing, inadequate healthcare and barriersto education. They are often marginalised and excludedfrom participating in activities that are the norm for otherpeople. See also consistent poverty, relative incomepoverty.
329
Glossary
Chapter 11 - Glossary 17/09/2007 16:57 Page 329
Poverty lines: From a base of average household income,poverty lines show the number of households and familiesfalling below a certain income level and how far belowthat level they are. Poverty lines are usually set at 40 percent, 50 per cent or 60 per cent of the average or medianincome.
Poverty proofing: The process by which governmentdepartments, local authorities and state agencies assesspolicies and programmes at design and review stages inrelation to the likely impact that they will have, or havehad, on poverty and on inequalities that are likely to leadto poverty, with a view to poverty reduction.
PRSA (Personal retirement savings account): A new formof personal pension in Ireland. It is intended to be more‘user-friendly’ than existing pensions and to help increasethe uptake of personal pension cover.
PRSI (Pay-related social insurance): The social insurancecontribution paid by employees, employers and the self-employed to fund certain social welfare benefits.
Qualified adult: A person (normally a spouse or a partner ofthe opposite sex) in respect of whom an increase in asocial welfare payment is paid (formerly known as adultdependant).
Qualified child: A child in respect of whom an increase in asocial welfare payment is paid (formerly known as childdependant).
Quarterly National Household Survey (QNHS): Conductedby the Central Statistics Office every three months, the
330
Welfare Policy and Poverty
Chapter 11 - Glossary 17/09/2007 16:57 Page 330
QNHS provides the official measure of employment andunemployment.
Redistribution: Individuals and groups on higher incomes orwealth distributing to those on lower incomes or wealth.Redistribution by government is usually through transfers,regulation or provision of public services. Transfers involvethe collection of money from people through the taxsystem and the payment of income to people throughpayments such as unemployment assistance or subsidiessuch as mortgage interest relief. The minimum wage orrent controls are examples of regulation. Public transportand local authority housing are examples of the stateprovision of services.
Relative income poverty: Relative income poverty is havingan income that is less than that regarded as the norm insociety, giving a lower than normal standard of living. It is‘relative’ because it is measured by how much less it isrelative to the income of the majority of people. It isusually expressed as a percentage, for example the 60 percent relative income poverty line is 60 per cent of theaverage or median disposable household income. Seealso consistent poverty, risk of poverty.
Rights: see Economic, social and cultural rights.
Risk of poverty: The proportion of people living inhouseholds where their disposable income is below thethreshold of 60 per cent of the national averagedisposable income. The EU measure of risk of poverty isdefined as the proportion of persons with an equivalenttotal net income below 60 per cent of national averageincome.
331
Glossary
Chapter 11 - Glossary 17/09/2007 16:57 Page 331
Schools designated with disadvantaged status: A numberof primary schools are designated as disadvantaged inIreland. This means that they get a greater level of supportin terms of pupil–teacher ratios, special grants etc.
Social capital: Networks, understanding and values thatshape the way we relate to each other and participate insocial activities.
Social cohesion: Bringing together, in an integrated way,economic, social, health and educational policies tofacilitate the participation of citizens in societal life.
Social exclusion: The process whereby certain groups arepushed to the margins of society and prevented fromparticipating fully by virtue of their poverty, low educationor inadequate life skills. This distances them fromemployment, income and education opportunities as wellas social and community networks. They have little accessto power and decision-making bodies, little chance ofinfluencing decisions or policies that affect them and littlechance of bettering their standard of living.
Social inclusion: Ensuring the marginalised and those livingin poverty have greater participation in decision-makingwhich affects their lives, allowing them to improve theirliving standards and their overall wellbeing.
Social partnership: The process where government,employers, trade unions, farmers and the community andvoluntary sector devise economic and social agreementsfor a set timeframe.
332
Welfare Policy and Poverty
Chapter 11 - Glossary 17/09/2007 16:57 Page 332
Sustainable economic and social development: The typeof broad-based, long-term human growth whichencourages the continual development of skills, capacitiesand talents to the fullest possible extent as a means ofchallenging poverty and social exclusion.
333
Glossary
Chapter 11 - Glossary 17/09/2007 16:57 Page 333

Chapter 11 - Glossary 17/09/2007 16:57 Page 334
AA&E crisis, 219active labour market programmes
(ALMPs), 126, 127–8, 131‘aged out minors,’ 274Ahern, Bertie, 217Akida, 283Americans with Disabilities Act
1990, 240Archer, P. and Weir, S., 171, 187,
188, 190, 191, 193–4area-based partnerships, 106Armstrong, J., 125Arrowsmith, J., 111asylum seekers, 271–3, 274, 280,
284, 304Australia, 91, 109, 148, 150, 180,
244
Bback to school clothing and
footwear allowance, 71, 82, 83back to work allowance, 308banding, 193Barker hypothesis, 210Ben-Shlomo, Y. and Kuh, D., 211Boyle, N., 128–9Breaking the Cycle, 187, 189–90,
192Brennan, Séamus, 150, 314–15Brown, P., 181–2
Brown v. The Board of Educationof Topeka, 181
Browne, Dr Noel, 205, 223Brunton, C., 121–2Budget 2007, 111budgetary policy, distributive
impact of, 49–55Building an Inclusive Society
(2002), 247, 262Building on Reality (1985), 74, 77Bulgaria, 270Burchardt, T., 234nButtimer Report, 221
CCáirde, 280Callan, T., 118Canada, 91, 149, 277–8carers, 112–13Carrera, S., 268Census 2002, 231, 234Census 2006, 261Central Statistics Office, 16, 151n,
164, 261child benefit (CB), 71, 72, 75, 78,
87–91, 93, 310–12increase, 76strengths and weaknesses,
74, 89–91child benefit supplement (CBS),
77–8
335
Index
Chapter 12 - Index 17/09/2007 16:57 Page 335
child dependant additions (CDAs),71, 72, 75, 79–84, 93–4, 310
strengths and weaknesses,74, 82–4
work disincentive, 76child income support (CIS), 47–8,
59–96, 121alternatives, 76–9children and low-income
households, 65–70conclusions, 93–6current instruments, 79–91direction for reform, 91–3effects of low household
income, 61–5international comparisons,
69–70origins and structure, 71–9
child poverty, 10and adult health, 210–11health, 224low household income, 61–5recommendations, 310–13reductions in, 53–4risk of poverty, 34
childcare, 121, 311children’s tax allowances, 88nCitizens Information Act 2007, 243,
303Citizens Information Board, 242,
283citizen’s information services,
282–3citizenship, 273Coakely, A., 122Combat Poverty Agency, vii, ix,
215definition of poverty, 4–5strategic plan, 10
Comhairle, 242, 283Commission of Inquiry on Mental
Handicap, 240
Commission on Social Welfare, vii,viii, ix, 3–4, 47, 69, 146, 249
report on CIS, 72–5social insurance, 141–4welfare rates assessment, 20,
22Commission on Taxation, 74nCommission on the Status of
People with Disabilities, 230,241–2, 247, 249–50
costs of disability, 251–2Common Basic Principles on
Integration (EU), 266, 268community care, 219–20community development, 106n,
213–17community schools, 184–5competitiveness, 125–7comprehensive schools, 184–5Conference of Major Religious
Superiors (CMRS), 171Conference of Religious of Ireland
(CORI), 121nConnolly, E., 296–7consistent poverty measure,
15–16, 216, 294criticism of, 18–19individual profiles, 38–41trends, 1987–2005, 36–41
Constitution of Ireland, 319Convention on Human Trafficking,
275Council of Europe, 275county development boards, 131county hospitals, 220Czech Republic, 45
DDAS scheme, 187, 188, 189, 190Davey Smith, G. et al., 210–11debt indicator, 38Decade of Disabled Persons, 240decentralisation, 216–17
336
Welfare Policy and Poverty
Chapter 12 - Index 17/09/2007 16:57 Page 336
Delivering Equality of Opportunityin Schools (DEIS), 187, 190
Democratic Left, 49nDempsey, Noel, 191Denmark, 117, 126Denny, K. et al., 128Derman-Sparks, L., 172Developmental Welfare State, The
(2005), 5–7, 64n, 114, 163–5,245, 250, 297–300, 321
disabilityconclusions, 252–4costs of, 251–2, 253and education, 235–6and employment, 108–9,
234–5, 247–8, 253evolution of policy, 240–6international comparisons,
238–9national strategy, 242–3and poverty, 229–57
consistent poverty, 39facts and figures, 232–40risk of, 11, 35
profile of, 231–2recommendations, 303–4and social welfare, 248–52strategic approaches, 246–7
Disability Act 2005, 11, 242, 251,252, 303, 320
sectoral plans, 243–5disability allowance, 249–50Disability Legislation Consultative
Group, 246dispensary system, 205domestic violence, 277, 287–8Duncan, S., 122–3
EEarly School-Leavers Initiative,
187, 189, 190Early Start, 187, 188–9, 190Economic and Social Research
Institute (ESRI), 15, 16, 19, 311educational disadvantage, 195tax/welfare simulation model,
47welfare rates, 22
education, 121, 295, 319developments needed, 301–2and disability, 235–6educational disadvantage,
173–9conclusions, 194–5definitions, 174–6international perspectives,
179–83outputs model v.
comparative model,177–9
understanding andintervening, 187–94
markets and choice, 180–3,183–6
and migrants, 282participation levels, 172and poverty, 10–11, 169–95targets, 299
Education Act 1998, 174, 184Education and Science,
Department of, 184, 282Education and Welfare Board, 187Education for a Changing World:
Green Paper on Education(1992), 183
Education for Persons with SpecialEducational Needs Act 2004,243, 303
Educational DisadvantageCommittee, 187, 193–4
emigration, 105, 203–4, 294employment, 24, 293
and child poverty, 66–7and disability, 234–5, 247–8,
253and migrants, 284
337
Index
Chapter 12 - Index 17/09/2007 16:57 Page 337
and poverty, 10, 118–20consistent poverty risk,
39–40risk of, 35–6
working-aged people andwelfare policy, 101–33
Employment Equality Act 1998,242
Employment Permits Act 2006,270
Enterprise, Trade and Employment,Department of, 244
Equal Citizens (2003), 246Equal Status Acts, 9, 242, 262,
320Equal Treatment Directive, 146Equality Act 2004, 242Equality and Law Reform,
Department of, 241equality legislation, 8–9equality policy, 7
and health, 215–16key issue, 319–21legislation, 8–9
ethnic minorities, 8, 125school exclusion, 185–6
EU Directive on FamilyReunification, 266
EU Survey of Income and LivingConditions (EU-SILC), 10, 18–19,36, 37, 65, 151n, 162, 237–8
higher benchmark, 55EU Working Time Directive, 220European Commission, 275–8European Convention on Human
Rights Act 2003, 9, 319, 320European Council, 16–17European Union (EU), 220
ALMPs, 128equality, 146life expectancy, 201, 206local partnerships, 131new states, 270pensions, 147–8
poverty rates, 2, 5, 14, 68,118, 216in comparative context,
44–7rights-based approach, 8–9social inclusion, 7, 103‘welfare tourism,’ 280–1
Eurostat, 18Expenditure Review on Illness and
Disability Payment Schemes(2003), 250, 252
Ffamily income supplement (FIS),
71, 72, 75, 84–7, 93–4strengths and weaknesses,
74–5, 85–7family reunification, 266, 276, 286,
287famine, 203–4FÁS, 108, 125n, 128, 130, 242
and Department of Social andFamily Affairs, 133
Fianna Fáil, 49n, 183, 193, 310–11Finance, Department of, 69, 88nFine Gael, 49n, 205Finland, 117, 149Finn, D., 130Fitzgerald, Eithne, 11, 303flexicurity, 125–7Fottrell Report, 221France, 59, 147–8Frost, Robert, 184funded pensions, 161
GGannon, B. and Nolan, B., 233,
235Garda Síochána Working Group on
Trafficking in Human Beings, 274gender equality, 8n, 238
consistent poverty, 37key issue, 317–18
338
Welfare Policy and Poverty
Chapter 12 - Index 17/09/2007 16:57 Page 338
migrants, 276–8, 287–8pensions, 145, 146, 149,
155–6, 162–3general medical services scheme,
205, 209general practitioners, 218–19Geneva Convention, 271Germany, 147–8ghettoisation, 216Gini coefficient, 17–18Giving Children an Even Break,
187, 190Gorard, S. et al., 182Greece, 45, 149Green Paper on an EU Approach
to Managing Economic Migration(2006), 266
HHabitual Residence Condition,
87n, 91, 277, 280–1, 284, 286,305
Halpin, B. and Hill, J., 128Hanafin, Mary, 185–6Handbook on Immigrants’ Rights
and Entitlements in Ireland(2003), 283
Hanly Report, 220–1Harney, Mary, 221–2Harvard University, 213health, 11, 295
healthcare delivery, 217–22history of healthcare, 203–5measures of health status,
206–9and poverty, 201–25public policy implications,
214–17recommendations, 223–5,
302–3social capital and community
development, 213–17social determinants of, 210–12
targets, 299Health, The Wider Dimensions
(1986), 217Health and Children, Department
of, 208, 217–18, 241, 273Health Behaviour in School-age
Children (WHO), 64nHealth Information and Quality
Authority, 218Health Promotion Policy Unit, 208Health Service Executive (HSE),
218, 251, 273, 278Hogan, P., 183–4home duties, 35, 39Home-School-Community Liaison
Scheme, 187, 188, 189, 190Homeless Agency, 281homelessness, 281hospital care, 218–20
two-tier system, 221–2, 224household surveys, 33housing, for migrants, 281human trafficking, 274–5, 284, 305
Iimmigration, 107, 209, 294. see
also migrantsaccess to services, 278–83anti-poverty and social
inclusion measures, 261–9growth, 261integration debates, 266–9international frameworks,
265–6population projections, 159–61recommendations, 283–8,
304–6and social inclusion, 8, 259–88vulnerable migrants, 269–78
Immigration, Residence andProtection Bill, 268
Immigration Council of Ireland, 283in-work benefits, 309–10income distribution, 27
339
Index
Chapter 12 - Index 17/09/2007 16:57 Page 339
income quintile ratio, 17, 28income support, recommendations
on, 306–17Indecon, 121, 251nindividualisation, 162information services, 282–3Institute of Public Health in Ireland,
206Integration: A Two Way Process
(1999), 271Integration of the Tax and Social
Welfare Systems (1996), 75–9Intercultural Strategy in Health
(2007), 273, 278–9interculturalism, 282International Labour Organization
(ILO), 104, 148–50, 266invalidity pension, 108Investment in Education (1965),
171Irish National Organisation of the
Unemployed (INOU), 104Irish Refugee Council, 273Irish Social Services Inspectorate,
274Italy, 150, 238Iversen, T., 309–10, 321
JJapan, 149jobsearch programme, 129jobseeker payments, 114, 308Junior Certificate, 186, 235, 236Justice, Equality and Law Reform,
Department of, 241, 274
KKabir, Z. et al., 208Kellaghan, T. et al., 192Kelleher, Cecily, 11, 302–3, 318Kelly, Michael, 217Kilkenny Health Project, 207
Llabour force, 24
activation policy, 127–30flexibility, 125–7Habitual Residence Condition,
280–1migrant access to, 269–70older people in, 165–7rights-based approach, 319
Labour Force Survey, 104Labour Party, 49n, 183, 192–3language tuition, 282Latvia, 45, 91n, 270Leaving Certificate, 171, 177, 186,
236, 301Lee, A., 215Levitas, 101life expectancy, 201, 206lifecycle model, 298–9
older people, 164–7Limerick, 192Lithuania, 91n, 270Live Register Management Unit,
129Living in Ireland Surveys (LIS), 10,
19, 37, 233living standards, 25–6, 45Local Employment Services
Network, 107local labour market programmes,
130–1lone parents, 109–10, 125n, 306–8Luxembourg, 44Lynch, K., 178n, 195
MMcCabe, B., 120McCashin, Tony, 10, 128–9, 313,
316, 318McKeown, K. and Haase, T., 64Maître, B. et al., 5Mares, I., 321
340
Welfare Policy and Poverty
Chapter 12 - Index 17/09/2007 16:57 Page 340
Marmot, M. and Wilkinson, R. G.,211–12
Martin, Micheál, 217means testing
health care, 205state pension, 140, 162
medical cards, 245Mental Health Act 2001, 9Migrant Rights Centre Ireland, 283migrants, 4, 11, 24. see also
immigrationand CB, 90–1education, 282and employment, 284and FIS, 87housing, 281human trafficking, 274–5lack of information, 282–3and poverty, 33, 36–7refugees and asylum seekers,
271–3unaccompanied minors, 274vulnerable, 285–6women as, 275–8, 287–8workers, 269–70, 305
Mother and Child scheme, 205,223
Murphy, Mary, 10, 306, 318, 319
NNash, V., 120National Action Plan against
Racism 2005–2008 (NPAR), 263,264–9, 273, 282, 286
National Action Plan for SocialInclusion 2007–2016(NAPinclusion), 3, 4–5, 9, 11, 16,102, 107–8, 120, 131, 163n, 165,166, 253, 262–3, 295
cost-saving target, 133developmental welfare state,
298–9education targets, 178–9, 194
flexicurity, 126lone parents, 308pensions, 140persons with disabilities, 246poverty reduction target, 19reducing working-aged people
on welfare, 116, 117risk-of-poverty measure, 18target for CIS, 73welfare target, 23, 118work-life balance, 123, 124working-aged people, 103,
130National Anti-Poverty Strategy
(NAPS), 1, 3, 11, 14, 16, 49n, 55,107, 246, 262, 295–6
education, 170, 194education targets, 179measure of poverty, 15
National Consultative Committeeon Racism and Interculturalism(NCCRI), 266
National Council for Curriculumand Assessment (NCCA), 193,282
National Development Authority,248, 252
National Development Plan2007–2013, 3, 243, 247, 262
National Disability Authority, 243National Disability Strategy, 11National Economic and Social
Council (NESC), 10, 79n, 108,164, 245, 282
and CIS, 91on developmental welfare
state, 5–7, 297–300, 321integration policy, 283–4social capital, 213social policy report, 5–7Sustaining Progress (2003),
311welfare for older people, 163
341
Index
Chapter 12 - Index 17/09/2007 16:57 Page 341
work requirements, 130working-aged people, 130,
306–10National Economic and Social
Forum (NESF), 106–7National Education Convention,
183national employment action plan
(1997), 129–30National Framework Committee on
Work-Life Balance, 124National Institute for Health and
Clinical Excellence, UK, 221National Pensions Board, 144–5National Pensions Policy Initiative,
22, 23, 313–14National Pensions Review (2005),
155National Planning Board, 75nNational Rehabilitation Board, 242National Task Force on Medical
Staffing, 220–1National Taskforce on Obesity,
207–8National Women’s Council of
Ireland, 276Netherlands, 150, 195New Zealand, 109, 180, 181, 244Nicaise, I., 131Nolan, B., 303–4non-consultant hospital doctors,
220–1Northern Ireland, 117Norway, 109, 117, 149
Oobesity, 207–8, 210occupational pensions, 141, 144,
145O’Connell, P. J. and McGinnity, F.,
128OECD countries, 28, 64n, 67, 130
child poverty, 310education, 186
pensions, 149–50unemployment defined, 104–5
older peoplehealthcare, 225income support for (see
pensions)national plan needed, 164–7
one-parent family payment (OPFP),109
O’Sullivan, D., 174, 175–6, 179,185, 186, 191
PPalermo Protocol, 275parental allowance, 307–8parenting, 64, 66–8part-time work, 120Partnership 2000, 49npay-as-you-go pensions, 161pensions, 139–67
age of, 166, 316contribution rates, 149developments, 1986–2006,
141–6future, 158–67key policy issues, 151–8pension system in context,
147–51population projections, 159–61and poverty, 164–5as proportion of earnings, 150recommendations, 313–17second-tier pensions
compulsory, 145, 148distribution of benefits,
153–6spouse allowance, 162–3
Pensions Act 2000, 313Pensions Board, 22, 141, 144, 164,
313–15, 316PRSAs, 157–8second-tier pensions, 148state pension, 159
342
Welfare Policy and Poverty
Chapter 12 - Index 17/09/2007 16:57 Page 342
target, 146tax and pensions, 155
Pensions Commission, 315Personal Retirement Savings
Account (PRSA), 141, 145,157–8, 161, 314n, 316
Pillinger, Jane, 11, 304–6, 318, 319plastic bag levy, 214Poland, 45, 125n, 270Polanyi, K., 7Polish Information and Advice
Centre, 283Poor Laws, 205population projections, 159–61Portugal, 45, 149Postgraduate Medical Education
and Training Group, 221poverty, 1–3
coherent policy needed, 295–7composition of population,
2005, 41–4consultation, 131definition of, 4–5, 15–16deprivation indicators, 164–5and disability, 229–57and education, 169–95EU context, 44–7and health, 201–25impact of budgetary policy,
49–55individuals at risk of, 33–6link with benefits, 146monitoring, 1987–2007, 13–56official measures of, 15–19and pensions, 151, 153, 164–5reduction, 2, 3–4surveys, 14traps, 78–9trends 1987–2005, 23–47
macroeconomicbackground, 24–8
risk-of-poverty rate, 29–36working-aged people, 101–33
Power, C. and Tormey, R., 177
pre-retirement allowance, 166pregnancy, health in, 210, 223, 224primary care strategy, 202, 224–5,
278principal economic status (PES),
104Pringle, D., 192private pensions, 141, 145Programme for Economic and
Social Progress (PESP), 49nProgramme for International
Student Assessment (OECD),64n
Programme for National Recovery(PNR), 49n, 126
Programme for Prosperity andFairness (PPF), 22, 49n, 249
Progressive Democrats (PDs), 49n,193
Proposals to Support Lone Parents(2006), 111
public sectorpersons with disability in,
243–5, 246purchasing power parity (PPP)
method, 44Putnam, R., 213
Qqualified adult allowance (QAA), 47qualified adults, 110–11qualified child increases, 79nQuality and Fairness: A Health
Service for You (2001), 217, 278Quarterly National Household
Survey, 237nQuin, S. and Redmond, B., 241Quinn, Ruairí, 76
Rracism, 204, 259, 260, 262, 284
national action plan (NPAR),263, 264–9, 273, 282, 286
343
Index
Chapter 12 - Index 17/09/2007 16:57 Page 343
Reception and Integration Agency,271–2
refugees, 271–3, 274, 280regional differences, 40–1regional education boards, 192–3relative income poverty, 17, 216
pensions, 151, 153, 162religion, 205retirement, 35–6, 39–40, 113nrights-based approach, 8–9,
319–21pensions, 156–7
‘risk-of-poverty’ rate, 17, 18, 294–5trends, 1987–2005, 29–36
Rogers Innovation DiffusionTheory, 213–14
Romania, 270Ruhama, 275
Sschool applications system, 192–3school attendance, 170–1school league tables, 180–1school zoning, 180–1Securing Retirement Income
(1998), 162self-employed, 144–5self-rated health (SRH), 208–9services, access to, 300Sharing in Progress (1997), 246SLÁN surveys, 207Slovakia, 270smoking, 207, 208, 210–11, 214Smyth, E., 186
and Hannan, D., 195Social and Family Affairs,
Department of, 83n, 86, 130,251
adults on welfare, 95disability allowance, 108employment support services,
128and FÁS, 133
lone-parent support, 111and migrants, 263review of HRC, 281sectoral plan, 244–5working-aged people, 130
social capital, 213–17social class, 124–5, 294
education, 185–6, 195health, 201–2, 207–8, 209,
210–12social employment schemes, 106social inclusion, 1–3, 7
achievements in, 293–5Cabinet Committee, 243, 287developmental welfare state,
297–300key cross-cutting issues,
317–21key policy areas, 300–17and migration, 259–88
integration, 266–9migrant policy context,
261–9in public policy, 215recommendations, 293–322,
321–2social capital, 213–17
social insurance contributions,140, 143–4, 147, 157
social partnership, 217, 296–7Social Protection Committee, 3,
16nSocial Welfare Appeals Office, 319Social Welfare Benchmarking and
Indexation Group, 22–3, 249Social Welfare (Consolidation) Act
2005, 280nSocial Welfare (Miscellaneous
Provisions) Act 2004, 280nSpain, 45, 123nSpecial Savings for Retirement
(2006), 148, 150Spencer, S., 267
344
Welfare Policy and Poverty
Chapter 12 - Index 17/09/2007 16:57 Page 344
Spirasi, 280state pensions, 140–1, 157
need for improvement, 158–62as proportion of earnings,
161–2‘Stay in School’ Retention
Initiative, 187, 189, 190Strategy for Equality, A (1996),
241–2streaming, 193stress, 212students, 35, 39supplementary pensions, 141Support Teacher Project, 187, 189Sustaining Progress (2003), 49n,
79n, 311Sweden, 67, 114, 117, 148, 149,
150, 195, 238Sweeney, John, 10, 310, 311Switzerland, 150
Ttax credits, 121taxation, 312
distributive impact, 49–55, 56and pensions, 154–5, 316–17
teacher development, 193Teaching Council Act 2001, 184Tipping Point, The (2000), 213Tormey, Roland, 10–11, 301–2Towards 2016, 2–3, 49n, 68n, 126,
131, 295, 298–9lone parents, 109older people, 163, 165–6pensions, 315persons with disabilities, 109,
245–6, 247, 250–1, 252, 253Transforming Ireland: A Better
Quality of Life for All (NationalDevelopment Plan 2007–2013),3, 243, 247, 262
Travellers, 8education, 185, 187employment, 108
health, 216Tussing, A. D. and Wren, M. A.,
217, 218, 222
UUkraine, 281UN Convention against
Transnational Organised Crime,275n
UN Convention on the Protectionof the Rights of All MigrantWorkers and Members of TheirFamilies, 265–6
UN Convention on the Rights ofPersons with Disabilities, 241,253–4, 256–7
UN Convention on the Rights ofthe Child, 9n
UN Standard Rules on theEqualization of Opportunities forPersons with Disabilities, 240–1
unaccompanied minors, 274, 284,285–6, 305
unemployment, 94, 102definition of, 104and poverty, 34–5, 39, 234–5working-aged people, 103–8,
114–16unemployment assistance, 84nunemployment benefit, 80nUNICEF, 59–60, 65, 67–8United Kingdom (UK), 45, 59, 91,
117, 209, 234n, 260child benefit, 312education, 180, 181, 182emigration to, 204healthcare, 221HRC, 280–1in-work benefits, 309lone parents, 125npensions, 148, 149, 315welfare claims, 114
United Nations (UN), 240, 275
345
Index
Chapter 12 - Index 17/09/2007 16:57 Page 345
United States of America (USA),70, 204, 260
disabilities, 240education, 180, 181in-work benefits, 309mortality rates, 209pensions, 149social capital, 213
VVermeylen, G., 119
WWalsh, Jim, 9–10, 317–18Weir, S. and Archer, P., 187, 190,
192welfare system, 146
adequacy benchmarks, 19–23and child poverty, 68–9, 94–5developmental welfare state,
297–300and disability, 248–52evolution of rates, 47–8Irish standards, 6monitoring, 1987–2007, 13–56NESC approach, 5–7for older people (see pensions)and poverty reduction, 46–7tax and welfare policies,
1987–2007, 47–55and working-aged people,
101–33widow/widower pension, 140Wilkinson, R., 212women, 33, 53–4, 66–7, 95, 105.
see also gender equalitycarers, 112–13lone parents, 109–10migrants, 275–8, 287–8pension age, 149qualified adults, 110–11
Women and Cancer in Ireland1994–2001 (2006), 206
Women’s Aid, 277Women’s Health Council, 216work-life balance, 122–5work permits, 270, 284, 286, 305working-aged people
carers, 112–13composition of households,
113–14concept and definition,
102–14consultation with, 131–2lone parents, 109–10people with disabilities, 108–9promoting access for, 114–16
activation strategies, 127–30defining target group,
115–16family-friendly employment,
122–5flexicurity, 125–7making work pay, 118–20quality of employment,
120–2targets and institutional
reforms, 130–2welfare adequacy, 117–18
qualified adults, 110–11recommendations, 132–3,
306–10unemployed, 103–8
Working Group on Long-TermUnemployment, 246
Working Group on UndergraduateMedical Education and Training,221
working visas, 270World Health Organization (WHO),
64nWorld Programme of Action on
Disability, 240
346
Welfare Policy and Poverty
Chapter 12 - Index 17/09/2007 16:57 Page 346
Despite unprecedented economic growth, substantial improvements in living standards and the achievement of full employment, Ireland still faces considerable challenges in ensuring the welfare of all its people.
For many, economic growth has not been matched by improvements in living standards, and there remains a segment of the population that is unable to escape from circumstances of severe disadvantage and exclusion.
Welfare Policy and Poverty reviews social welfare policy in Ireland over the past two decades and assesses its effectiveness in reducing poverty and social exclusion. It presents a thorough analysis of poverty trends over the period and examines the extent to which these have been influenced by social welfare policies and anti-poverty targets.
With contributions from a number of high profile authors, a comprehensive history of social policy development across a range of areas including health, education and disability unfolds, as well as insights into emerging issues in Irish society such as immigration. Drawing lessons from the past, each chapter contains proposals for future reform with a view to stimulating and informing this important debate.
This book marks several major milestones in the struggle to combat poverty in Ireland – the twentieth anniversary of the report of the Commission on Social Welfare, the twentieth anniversary of the Combat Poverty Agency and the tenth anniversary of the first National Anti-Poverty Strategy.
Bridgewater Centre, Conyngham Road, Islandbridge, Dublin 8 Tel: 01 670 6746 Fax: 01 670 6760 Email: [email protected] Website: www.combatpoverty.ie E20
WelfaRe PolICy anD PoveRty
Welfare P
olicy and Poverty
Related Documents


