Welcome Welcome to to Presentation session Presentation session

Welcome to Presentation session. Presentation on Capital structure and profitability analysis.
Dec 25, 2015
Welcome message from author
This document is posted to help you gain knowledge. Please leave a comment to let me know what you think about it! Share it to your friends and learn new things together.
Transcript

WelcomeWelcometo to
Presentation sessionPresentation session

PresentationPresentationonon
Capital structure and profitability Capital structure and profitability analysisanalysis

Presented byPresented by
NameName ID:ID: IntakeIntake SectionSection

Company profileCompany profile
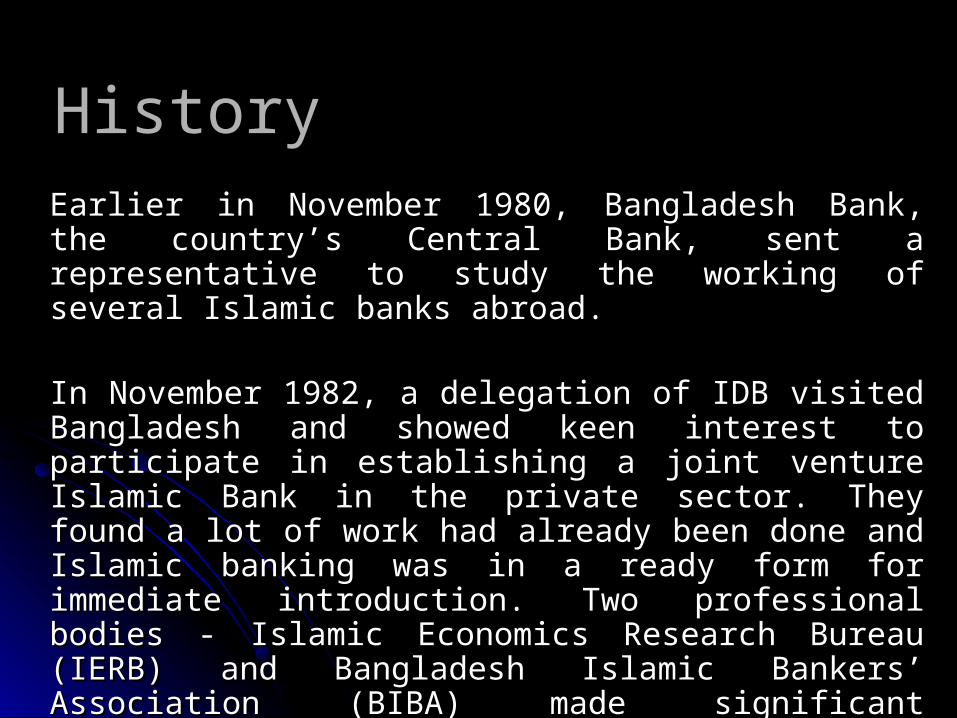
HistoryHistoryEarlier in November 1980, Bangladesh Bank, the country’s Earlier in November 1980, Bangladesh Bank, the country’s Central Bank, sent a representative to study the working of Central Bank, sent a representative to study the working of several Islamic banks abroad.several Islamic banks abroad.
In November 1982, a delegation of IDB visited Bangladesh In November 1982, a delegation of IDB visited Bangladesh and showed keen interest to participate in establishing a joint and showed keen interest to participate in establishing a joint venture Islamic Bank in the private sector. They found a lot of venture Islamic Bank in the private sector. They found a lot of work had already been done and Islamic banking was in a work had already been done and Islamic banking was in a ready form for immediate introduction. Two professional ready form for immediate introduction. Two professional bodies - Islamic Economics Research Bureau (IERB) and bodies - Islamic Economics Research Bureau (IERB) and Bangladesh Islamic Bankers’ Association (BIBA) made Bangladesh Islamic Bankers’ Association (BIBA) made significant contributions towards introduction of Islamic significant contributions towards introduction of Islamic banking in the country.banking in the country.
MissionMission
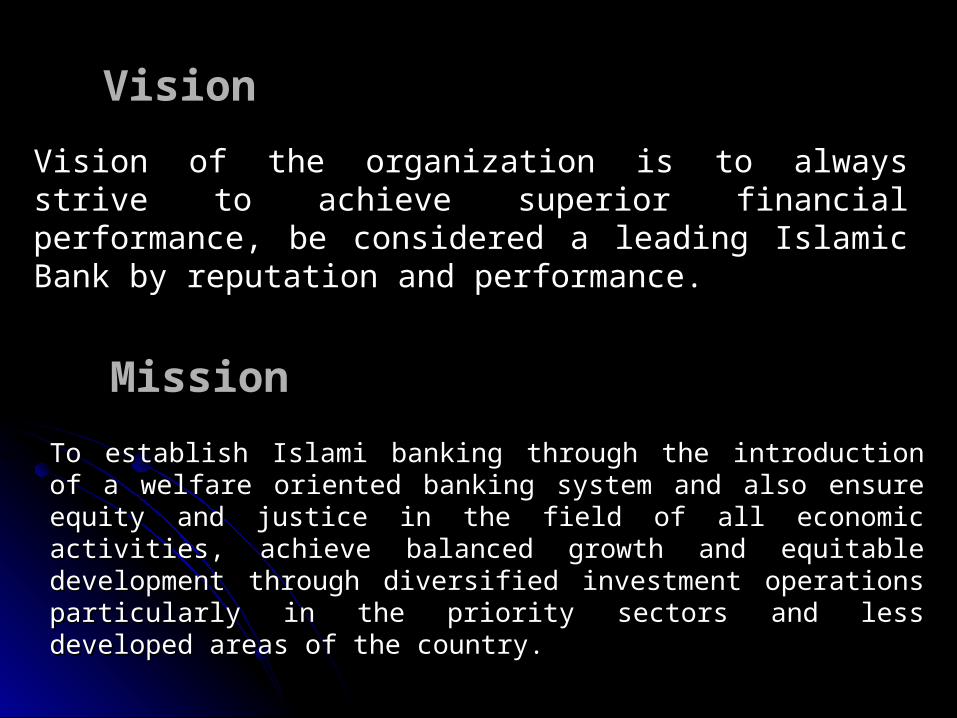
To establish Islami banking through the introduction of a welfare oriented To establish Islami banking through the introduction of a welfare oriented banking system and also ensure equity and justice in the field of all banking system and also ensure equity and justice in the field of all economic activities, achieve balanced growth and equitable development economic activities, achieve balanced growth and equitable development through diversified investment operations particularly in the priority through diversified investment operations particularly in the priority sectors and less developed areas of the country. sectors and less developed areas of the country.
VisionVision
Vision of the organization is to always strive to achieve Vision of the organization is to always strive to achieve superior financial performance, be considered a leading superior financial performance, be considered a leading Islamic Bank by reputation and performance.Islamic Bank by reputation and performance.
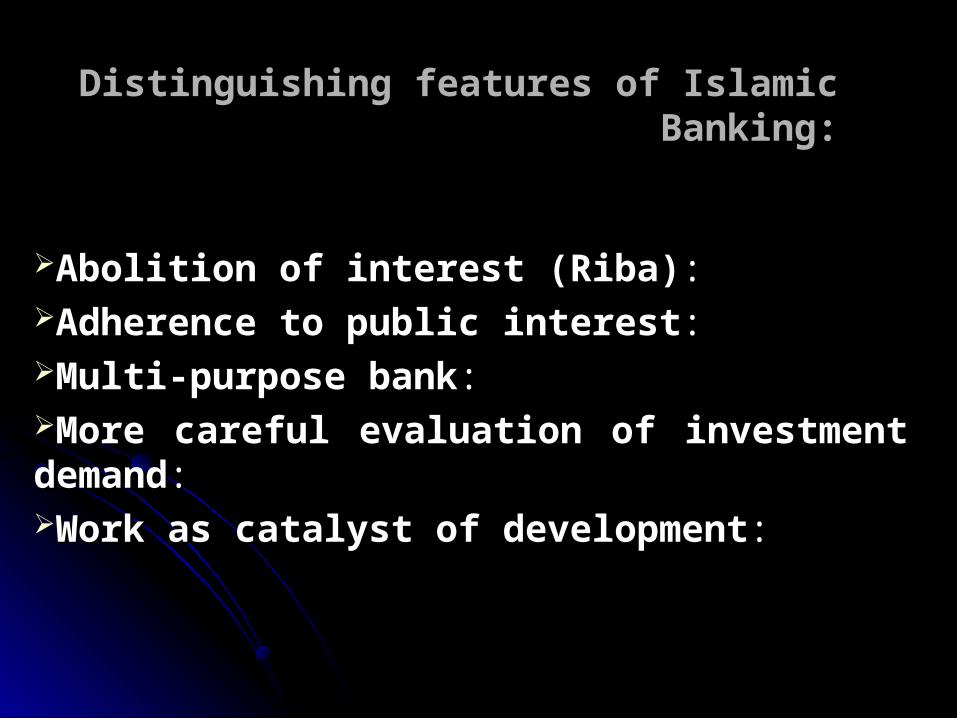
Distinguishing features of Islamic Banking:Distinguishing features of Islamic Banking:
Abolition of interest (Riba)Abolition of interest (Riba)::Adherence to public interestAdherence to public interest: : Multi-purpose bankMulti-purpose bank: : More careful evaluation of investment demandMore careful evaluation of investment demand: : Work as catalyst of developmentWork as catalyst of development::
Capital structure and profitability comparisonCapital structure and profitability comparisonBetweenBetween
Dhaka Bank and BRAC BankDhaka Bank and BRAC Bank

Capital structureCapital structure
Debt ratioThe debt ratio measures what portion of capital in firm’s total assets financed its debt holders. The higher this ratio, the greater the amount of other people’s money being used to generate profits. The ratio is calculated as.
Debt ratio =The debt ratio of Dhaka Bank is 93.61%The debt ratio of BRAC Bank is 90.67%CommentsThis ratio of both company represent higher risk. But it is obvious that in Bank industry this figure is not represent greater risk because it is calculated from total liability where also include the deposit of the people But in consideration of tow companies the Dhaka Bank is in greater risk than that of BRAC Bank.
Dhaka Bank Total Assets Financed by
93.61%
6.39%
Debt capital
Equity capital
BRAC BankTotal Assets financed by
90.67%
9.33%
Debt capital
Equity capital
Capital structureCapital structure
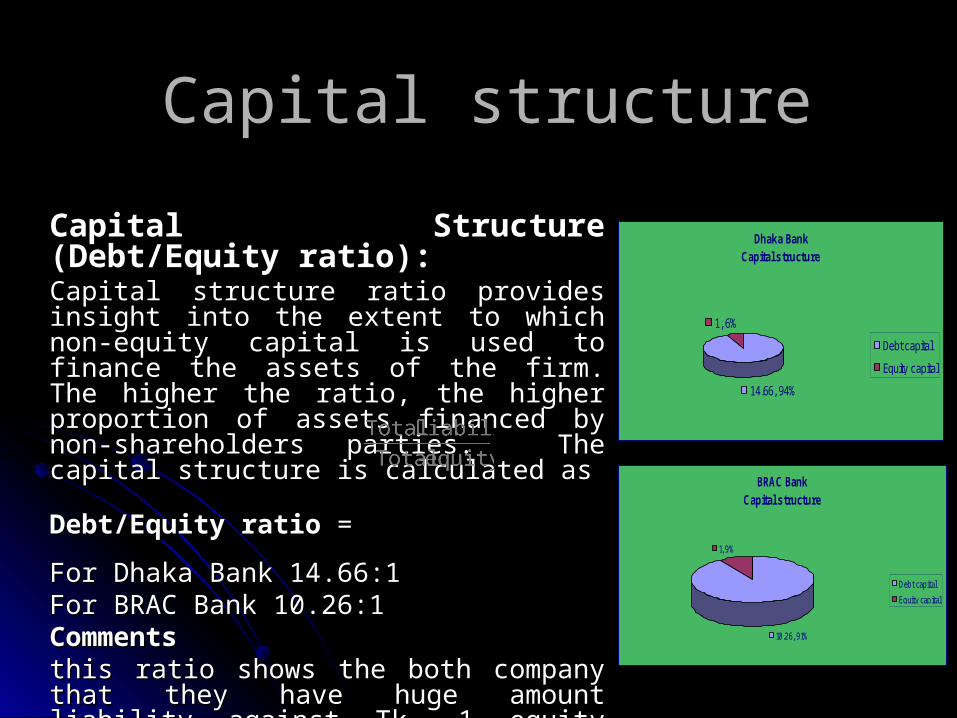
Capital Structure (Debt/Equity ratio):Capital Structure (Debt/Equity ratio):Capital structure ratio provides insight into the Capital structure ratio provides insight into the extent to which non-equity capital is used to extent to which non-equity capital is used to finance the assets of the firm. The higher the ratio, finance the assets of the firm. The higher the ratio, the higher proportion of assets financed by non-the higher proportion of assets financed by non-shareholders parties. The capital structure is shareholders parties. The capital structure is calculated ascalculated as
Debt/Equity ratioDebt/Equity ratio ==
For Dhaka Bank 14.66:1For Dhaka Bank 14.66:1For BRAC Bank 10.26:1For BRAC Bank 10.26:1CommentsCommentsthis ratio shows the both company that they have this ratio shows the both company that they have huge amount liability against Tk. 1 equity capital. huge amount liability against Tk. 1 equity capital. But for the bank industry it is not an abnormal But for the bank industry it is not an abnormal result because in total liability include the deposit result because in total liability include the deposit of the people. of the people.
Dhaka BankCapital structure
14.66, 94%
1, 6%
Debt capital
Equity capital
BRAC BankCapital structure
10.26, 91%
1, 9%
Debt capital
Equity capital
Profitability Profitability
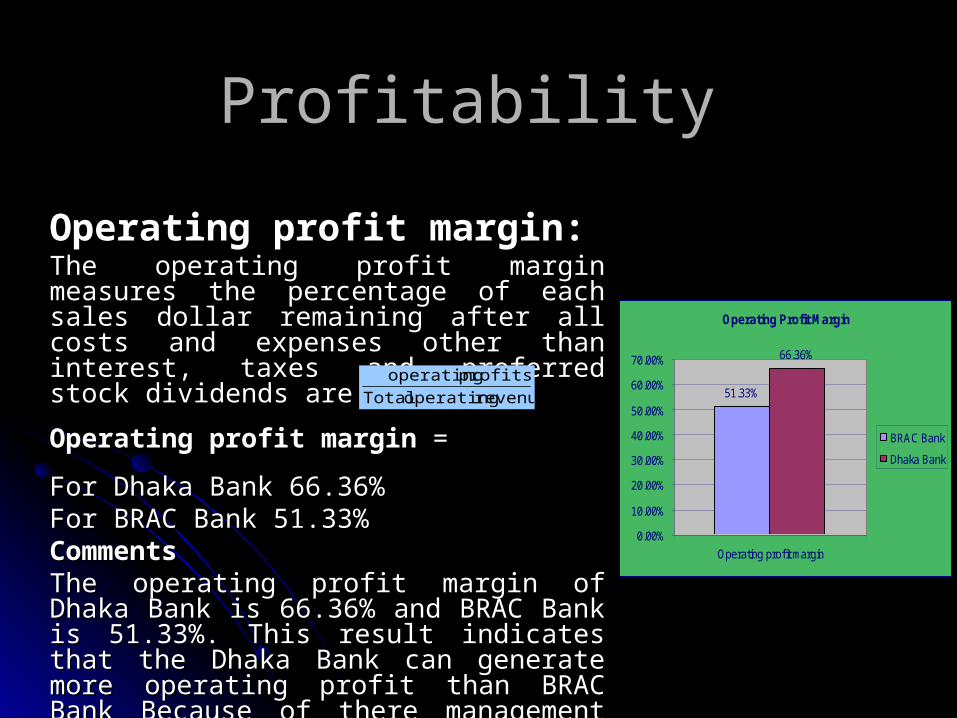
Operating profit margin:Operating profit margin:The operating profit margin measures the The operating profit margin measures the percentage of each sales dollar remaining after all percentage of each sales dollar remaining after all costs and expenses other than interest, taxes and costs and expenses other than interest, taxes and preferred stock dividends are deducted. preferred stock dividends are deducted.
Operating profit marginOperating profit margin ==
For Dhaka Bank 66.36%For Dhaka Bank 66.36%For BRAC Bank 51.33%For BRAC Bank 51.33%CommentsCommentsThe operating profit margin of Dhaka Bank is The operating profit margin of Dhaka Bank is 66.36% and BRAC Bank is 51.33%. This result 66.36% and BRAC Bank is 51.33%. This result indicates that the Dhaka Bank can generate more indicates that the Dhaka Bank can generate more operating profit than BRAC Bank Because of there operating profit than BRAC Bank Because of there management efficiency in operating cost control management efficiency in operating cost control system.system.
revenue operating Total
profits operating
Operating Profit Margin
51.33%
66.36%
0.00%
10.00%
20.00%
30.00%
40.00%
50.00%
60.00%
70.00%
Operating profit margin
BRAC Bank
Dhaka Bank
Profitability Profitability
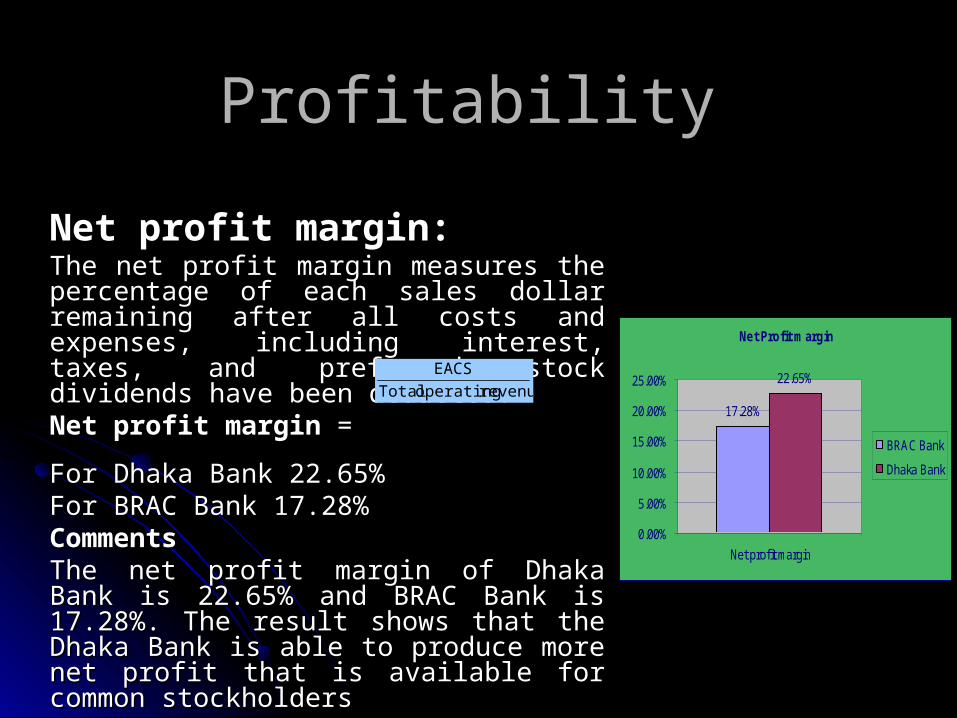
Net profit margin:Net profit margin:The net profit margin measures the percentage of The net profit margin measures the percentage of each sales dollar remaining after all costs and each sales dollar remaining after all costs and expenses, including interest, taxes, and preferred expenses, including interest, taxes, and preferred stock dividends have been deducted. stock dividends have been deducted. Net profit marginNet profit margin ==
For Dhaka Bank 22.65%For Dhaka Bank 22.65%For BRAC Bank 17.28%For BRAC Bank 17.28%CommentsCommentsThe net profit margin of Dhaka Bank is 22.65% The net profit margin of Dhaka Bank is 22.65% and BRAC Bank is 17.28%. The result shows that and BRAC Bank is 17.28%. The result shows that the Dhaka Bank is able to produce more net profit the Dhaka Bank is able to produce more net profit that is available for common stockholdersthat is available for common stockholdersBecause of lower debt in capital structure of BRAC Because of lower debt in capital structure of BRAC Bank their net profit margin did not decline as Bank their net profit margin did not decline as much than the Dhaka bank.much than the Dhaka bank.
revenue operating Total
EACS
Net Profit margin
17.28%
22.65%
0.00%
5.00%
10.00%
15.00%
20.00%
25.00%
Net profit margin
BRAC Bank
Dhaka Bank

Profitability Profitability
Earnings per share (EPS):Earnings per share (EPS):EPS represents the number of dollars earned during EPS represents the number of dollars earned during the period on behalf of each outstanding share of the period on behalf of each outstanding share of common stock. Earnings per share is calculated as common stock. Earnings per share is calculated as follows:follows:EPSEPS ==For Dhaka Bank Tk. 45.09For Dhaka Bank Tk. 45.09For BRAC Bank Tk. 60.98For BRAC Bank Tk. 60.98CommentsCommentsThe earnings per share of Dhaka bank is Tk.45.09 The earnings per share of Dhaka bank is Tk.45.09 and BRAC Bank is Tk.60.98. The result shows that and BRAC Bank is Tk.60.98. The result shows that the BRAC Bank has higher EPS than the Dhaka the BRAC Bank has higher EPS than the Dhaka Bank because of both lower number of shareholder Bank because of both lower number of shareholder and higher Earnings Available for Common and higher Earnings Available for Common Stockholders (EACS) than that of Dhaka Bank.Stockholders (EACS) than that of Dhaka Bank.
sharestock common ofNumber
EACS
EPS in Tk.
60.98
45.09
010203040506070
EPS
BRAC Bank
Dhaka Bank
Profitability Profitability
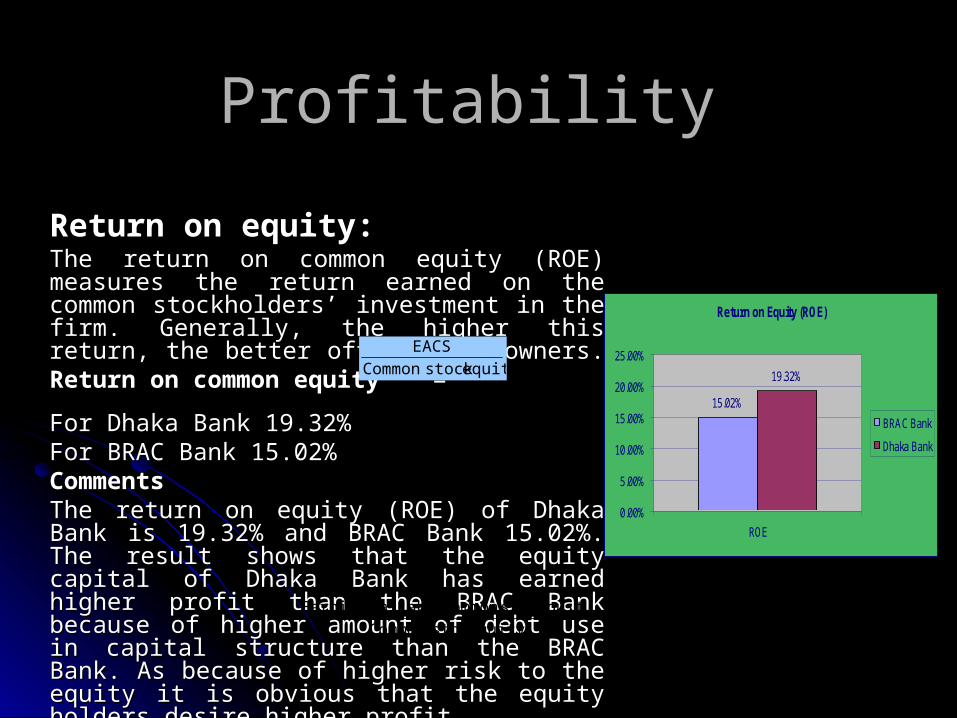
Return on equity:Return on equity:The return on common equity (ROE) measures the return The return on common equity (ROE) measures the return earned on the common stockholders’ investment in the earned on the common stockholders’ investment in the firm. Generally, the higher this return, the better off are firm. Generally, the higher this return, the better off are the owners. the owners. Return on common equityReturn on common equity ==
For Dhaka Bank 19.32%For Dhaka Bank 19.32%For BRAC Bank 15.02%For BRAC Bank 15.02%CommentsCommentsThe return on equity (ROE) of Dhaka Bank is 19.32% The return on equity (ROE) of Dhaka Bank is 19.32% and BRAC Bank 15.02%. The result shows that the and BRAC Bank 15.02%. The result shows that the equity capital of Dhaka Bank has earned higher profit equity capital of Dhaka Bank has earned higher profit than the BRAC Bank because of higher amount of debt than the BRAC Bank because of higher amount of debt use in capital structure than the BRAC Bank. As because use in capital structure than the BRAC Bank. As because of higher risk to the equity it is obvious that the equity of higher risk to the equity it is obvious that the equity holders desire higher profit.holders desire higher profit. equitystock Common
equitystock common for available Earnings
equitystock Common
EACS
Return on Equity (ROE)
15.02%
19.32%
0.00%
5.00%
10.00%
15.00%
20.00%
25.00%
ROE
BRAC Bank
Dhaka Bank
Profitability Profitability
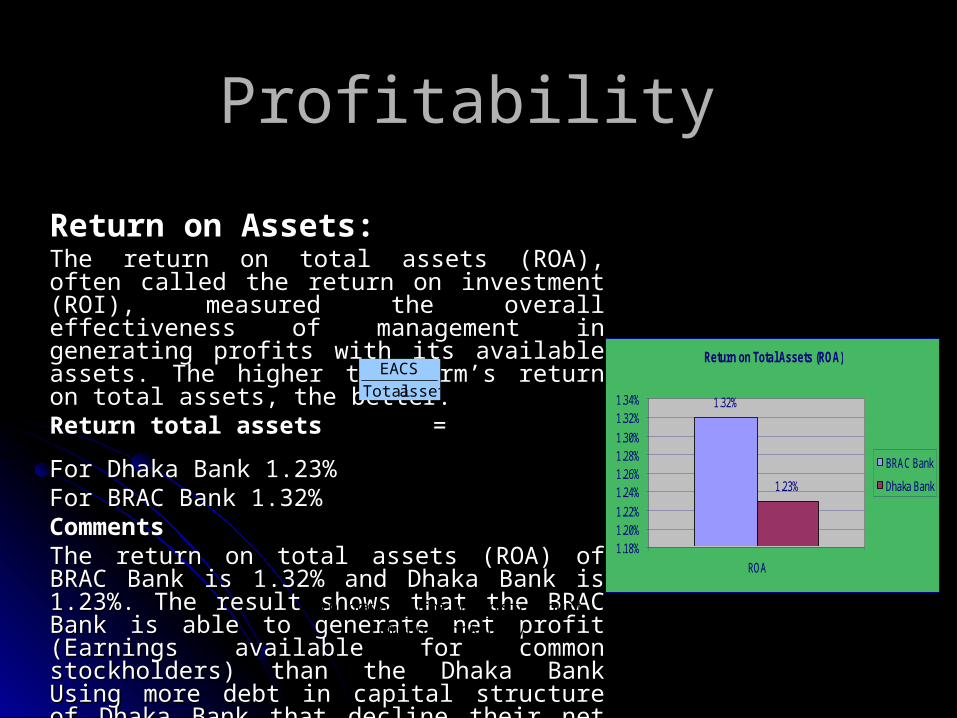
Return on Assets:Return on Assets:The return on total assets (ROA), often called the return The return on total assets (ROA), often called the return on investment (ROI), measured the overall effectiveness on investment (ROI), measured the overall effectiveness of management in generating profits with its available of management in generating profits with its available assets. The higher the firm’s return on total assets, the assets. The higher the firm’s return on total assets, the better.better. Return total assets Return total assets ==
For Dhaka Bank 1.23%For Dhaka Bank 1.23%For BRAC Bank 1.32%For BRAC Bank 1.32%CommentsCommentsThe return on total assets (ROA) of BRAC Bank is The return on total assets (ROA) of BRAC Bank is 1.32% and Dhaka Bank is 1.23%. The result shows that 1.32% and Dhaka Bank is 1.23%. The result shows that the BRAC Bank is able to generate net profit (Earnings the BRAC Bank is able to generate net profit (Earnings available for common stockholders) than the Dhaka Bankavailable for common stockholders) than the Dhaka Bank UUsing more debt in capital structure of Dhaka Bank that sing more debt in capital structure of Dhaka Bank that decline their net profit a large portion in compare to decline their net profit a large portion in compare to operating profit as we earlier said in Net profit margin operating profit as we earlier said in Net profit margin ratio.ratio.
equitystock Common
equitystock common for available Earnings
assets Total
EACSReturn on Total Assets (ROA)
1.32%
1.23%
1.18%1.20%1.22%
1.24%1.26%1.28%1.30%
1.32%1.34%
ROA
BRAC Bank
Dhaka Bank

Profitability Profitability
Return on Assets:Return on Assets:The return on total assets (ROA), often called the return The return on total assets (ROA), often called the return on investment (ROI), measured the overall effectiveness on investment (ROI), measured the overall effectiveness of management in generating profits with its available of management in generating profits with its available assets. The higher the firm’s return on total assets, the assets. The higher the firm’s return on total assets, the better.better. Return total assets Return total assets ==
For Dhaka Bank 1.23%For Dhaka Bank 1.23%For BRAC Bank 1.32%For BRAC Bank 1.32%CommentsCommentsThe return on total assets (ROA) of BRAC Bank is The return on total assets (ROA) of BRAC Bank is 1.32% and Dhaka Bank is 1.23%. The result shows that 1.32% and Dhaka Bank is 1.23%. The result shows that the BRAC Bank is able to generate net profit (Earnings the BRAC Bank is able to generate net profit (Earnings available for common stockholders) than the Dhaka Bankavailable for common stockholders) than the Dhaka Bank UUsing more debt in capital structure of Dhaka Bank that sing more debt in capital structure of Dhaka Bank that decline their net profit a large portion in compare to decline their net profit a large portion in compare to operating profit as we earlier said in Net profit margin operating profit as we earlier said in Net profit margin ratio.ratio.
equitystock Common
equitystock common for available Earnings
assets Total
EACSReturn on Total Assets (ROA)
1.32%
1.23%
1.18%1.20%1.22%
1.24%1.26%1.28%1.30%
1.32%1.34%
ROA
BRAC Bank
Dhaka Bank
ComparisonComparisononon
Textile industry Textile industry
Metro SpinningMetro Spinning
AndAnd
Saiham textileSaiham textile
equitystock Common
equitystock common for available Earnings

Company Profile Company Profile
Metro SpinningMetro Spinning
AndAnd
Saiham textileSaiham textile
equitystock Common
equitystock common for available Earnings

Company Profile Company Profile Metro spinningMetro spinning
Vision:Vision:We see Business as a means to the well being of the We see Business as a means to the well being of the shareholders and all other stakeholders, society at large keeping shareholders and all other stakeholders, society at large keeping in line with the Nation’s interest.in line with the Nation’s interest.
Mission Statement:Mission Statement:Our Mission is to provide world-class products to our valued Our Mission is to provide world-class products to our valued Customers, Maintaining high Ethical Standard business.Customers, Maintaining high Ethical Standard business.
ObjectiveObjectiveOur primary objective is to conduct transparent business Our primary objective is to conduct transparent business operation within legal and social framework with aims to attain the operation within legal and social framework with aims to attain the mission with qualitative quantitative target in business operation.mission with qualitative quantitative target in business operation.equitystock Common
equitystock common for available Earnings
Capital structure and profitability comparison Capital structure and profitability comparison betweenbetween
Metro Spinning and Saiham textileMetro Spinning and Saiham textile
equitystock Common
equitystock common for available Earnings
Capital structure Capital structure
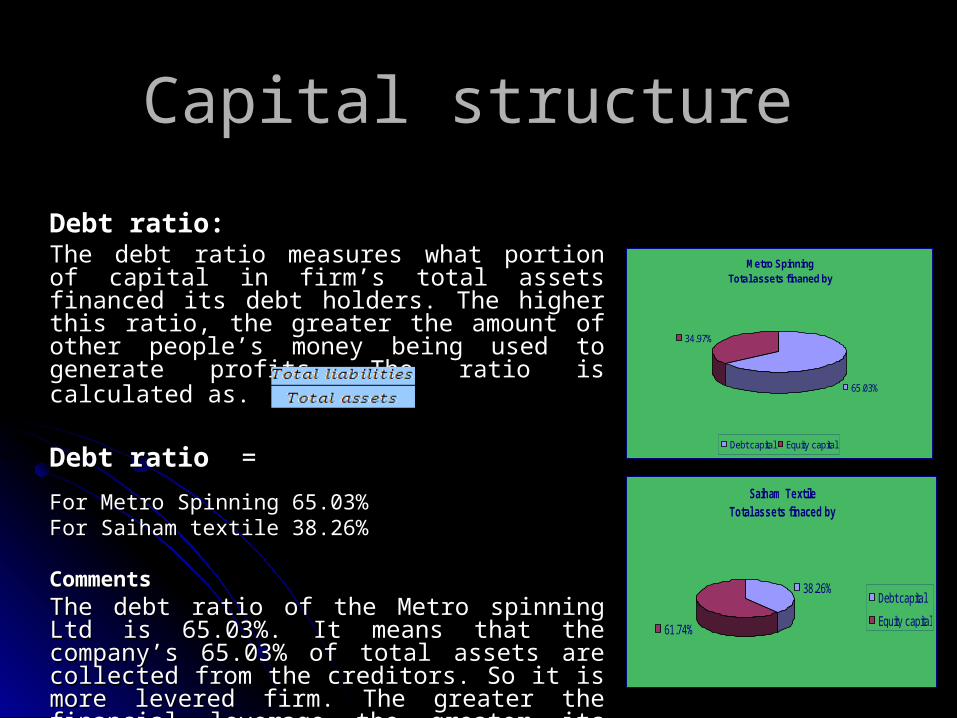
Debt ratio:Debt ratio:The debt ratio measures what portion of capital in firm’s The debt ratio measures what portion of capital in firm’s total assets financed its debt holders. The higher this total assets financed its debt holders. The higher this ratio, the greater the amount of other people’s money ratio, the greater the amount of other people’s money being used to generate profits. The ratio is calculated as.being used to generate profits. The ratio is calculated as.
Debt ratio Debt ratio ==
For Metro Spinning 65.03%For Metro Spinning 65.03%For Saiham textile 38.26%For Saiham textile 38.26%
CommentsComments
The debt ratio of the Metro spinning Ltd is 65.03%. It The debt ratio of the Metro spinning Ltd is 65.03%. It means that the company’s 65.03% of total assets are means that the company’s 65.03% of total assets are collected from the creditors. So it is more levered firm. collected from the creditors. So it is more levered firm. The greater the financial leverage the greater its risk. The greater the financial leverage the greater its risk. Whereas the debt ratio of Saiham textile is 38.26%. So it Whereas the debt ratio of Saiham textile is 38.26%. So it can say that the Saiham textile is in the better position can say that the Saiham textile is in the better position than that of Metro spinning Ltd.than that of Metro spinning Ltd.
Saiham TextileTotal assets finaced by
38.26%
61.74%
Debt capital
Equity capital
Metro SpinningTotal assets finaned by
65.03%
34.97%
Debt capital Equity capital
Capital structure Capital structure
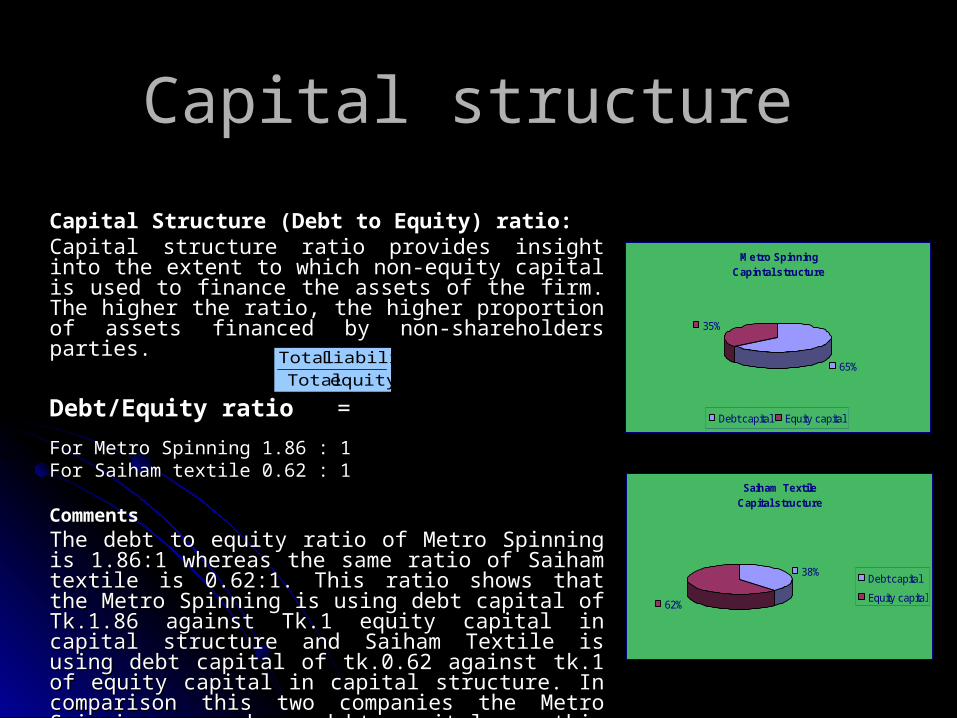
Capital Structure (Debt to Equity) ratio:Capital Structure (Debt to Equity) ratio:Capital structure ratio provides insight into the extent to which Capital structure ratio provides insight into the extent to which non-equity capital is used to finance the assets of the firm. The non-equity capital is used to finance the assets of the firm. The higher the ratio, the higher proportion of assets financed by non-higher the ratio, the higher proportion of assets financed by non-shareholders parties. shareholders parties.
Debt/Equity ratio Debt/Equity ratio ==
For Metro Spinning For Metro Spinning 1.86 : 1 1.86 : 1 For Saiham textile For Saiham textile 0.62 : 10.62 : 1
CommentsComments
The debt to equity ratio of Metro Spinning is 1.86:1 whereas the The debt to equity ratio of Metro Spinning is 1.86:1 whereas the same ratio of Saiham textile is 0.62:1. This ratio shows that the same ratio of Saiham textile is 0.62:1. This ratio shows that the Metro Spinning is using debt capital of Tk.1.86 against Tk.1 Metro Spinning is using debt capital of Tk.1.86 against Tk.1 equity capital in capital structure and Saiham Textile is using equity capital in capital structure and Saiham Textile is using debt capital of tk.0.62 against tk.1 of equity capital in capital debt capital of tk.0.62 against tk.1 of equity capital in capital structure. In comparison this two companies the Metro Spinning structure. In comparison this two companies the Metro Spinning uses huge debt capital so this company is in the greater risk and uses huge debt capital so this company is in the greater risk and has greater chance of financial distress cost than that of Saiham has greater chance of financial distress cost than that of Saiham Textile.Textile.
equity Total
Liability Total
Metro SpinningCapintal structure
65%
35%
Debt capital Equity capital
Saiham TextileCapital structure
38%
62%
Debt capital
Equity capital
Profitability Profitability
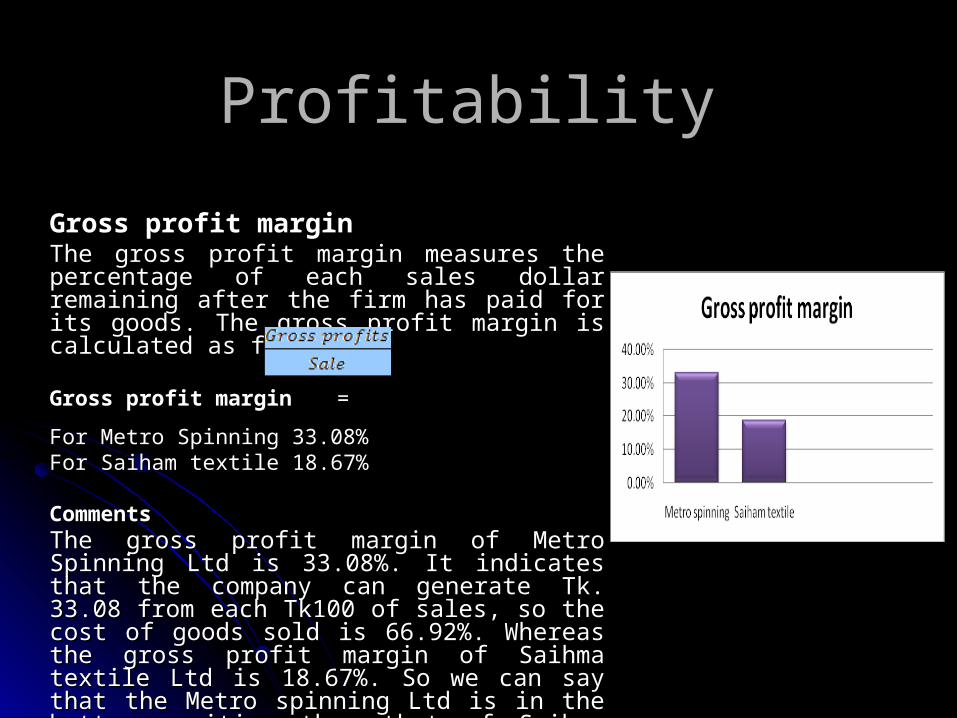
Gross profit marginGross profit marginThe gross profit margin measures the percentage of each The gross profit margin measures the percentage of each sales dollar remaining after the firm has paid for its sales dollar remaining after the firm has paid for its goods. The gross profit margin is calculated as followsgoods. The gross profit margin is calculated as follows
Gross profit margin Gross profit margin ==
For Metro Spinning 33.08%For Metro Spinning 33.08% For Saiham textile For Saiham textile 18.67%18.67%
CommentsCommentsThe gross profit margin of Metro Spinning Ltd is The gross profit margin of Metro Spinning Ltd is 33.08%. It indicates that the company can generate Tk. 33.08%. It indicates that the company can generate Tk. 33.08 from each Tk100 of sales, so the cost of goods sold 33.08 from each Tk100 of sales, so the cost of goods sold is 66.92%. Whereas the gross profit margin of Saihma is 66.92%. Whereas the gross profit margin of Saihma textile Ltd is 18.67%. So we can say that the Metro textile Ltd is 18.67%. So we can say that the Metro spinning Ltd is in the better position than that of Saiham spinning Ltd is in the better position than that of Saiham textile Ltd.textile Ltd.
Profitability Profitability
Operating profit marginOperating profit marginThe operating profit margin measures the percentage of The operating profit margin measures the percentage of each sales dollar remaining after all costs and expenses each sales dollar remaining after all costs and expenses other than interest, taxes and preferred stock dividend are other than interest, taxes and preferred stock dividend are deducted.deducted. Operating profit margin Operating profit margin ==
For Metro Spinning 28.31%For Metro Spinning 28.31% For Saiham textile For Saiham textile 14.48%14.48%
CommentsCommentsThe operating profit margin of Metro Spinning Ltd is The operating profit margin of Metro Spinning Ltd is 28.31%. It indicates that the company is generated Tk. 28.31%. It indicates that the company is generated Tk. 28.31 of operating profit from each Tk. 100 of sales. 28.31 of operating profit from each Tk. 100 of sales. Whereas the Saiham textile Ltd is 14.48%. So we can say Whereas the Saiham textile Ltd is 14.48%. So we can say that the Metro Spinning is more capable to produce more that the Metro Spinning is more capable to produce more operating profit than the Sahiham textile Ltd. because of operating profit than the Sahiham textile Ltd. because of higher capital.higher capital.
Operating profit marg in
0.00%5.00%
10.00%15.00%20.00%25.00%30.00%
Metros pinning
S aihamtextile
Profitability Profitability
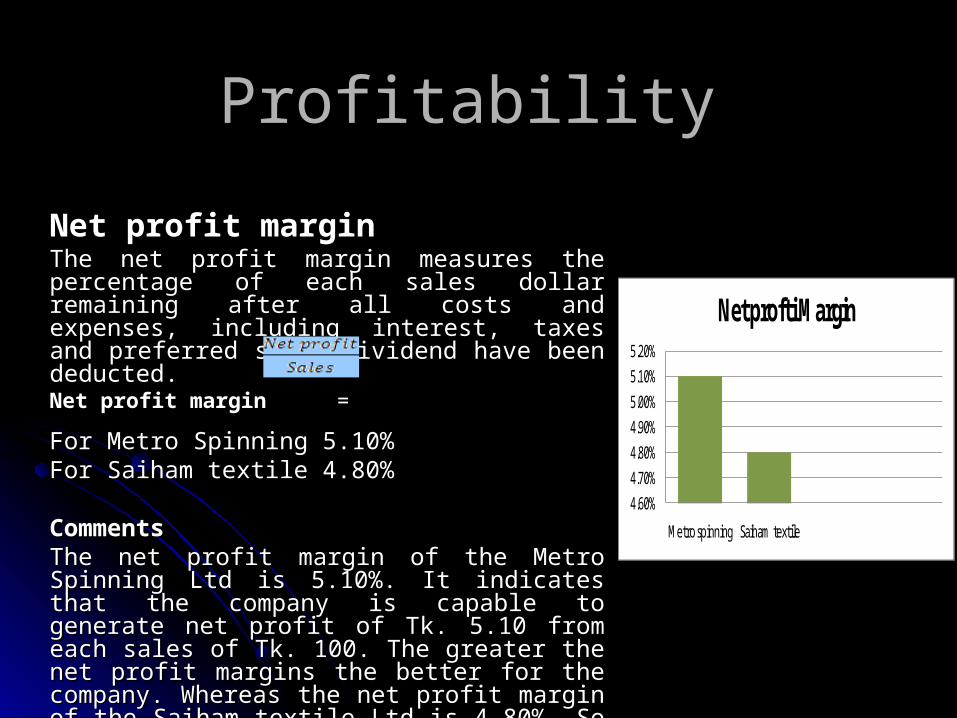
Net profit marginNet profit marginThe net profit margin measures the percentage of each The net profit margin measures the percentage of each sales dollar remaining after all costs and expenses, sales dollar remaining after all costs and expenses, including interest, taxes and preferred stock dividend including interest, taxes and preferred stock dividend have been deducted.have been deducted. Net profit margin Net profit margin ==
For Metro Spinning 5.10%For Metro Spinning 5.10% For Saiham textile 4.80For Saiham textile 4.80%%
CommentsCommentsThe net profit margin of the Metro Spinning Ltd is The net profit margin of the Metro Spinning Ltd is 5.10%. It indicates that the company is capable to 5.10%. It indicates that the company is capable to generate net profit of Tk. 5.10 from each sales of Tk. generate net profit of Tk. 5.10 from each sales of Tk. 100. The greater the net profit margins the better for the 100. The greater the net profit margins the better for the company. Whereas the net profit margin of the Saiham company. Whereas the net profit margin of the Saiham textile Ltd is 4.80%. So in this regard we can say that textile Ltd is 4.80%. So in this regard we can say that Metro Spinning is in the better position than that of Metro Spinning is in the better position than that of Saiham textile Ltd. Saiham textile Ltd.
4.60%4.70%4.80%4.90%5.00%5.10%5.20%
Metro spinning Saiham textile
Net profti Margin
Profitability Profitability
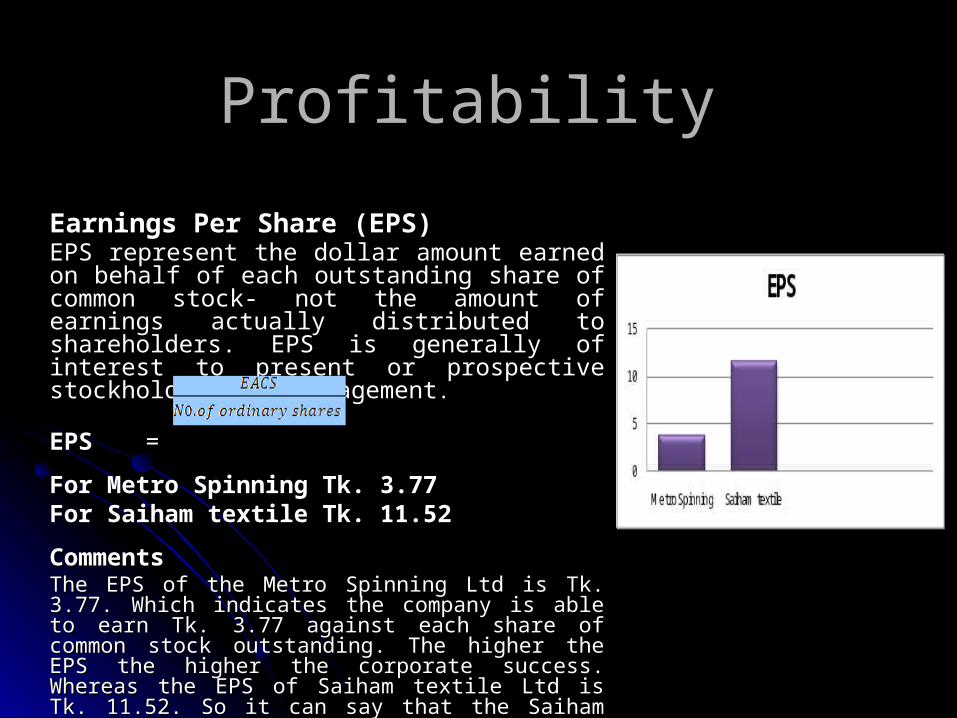
Earnings Per Share (EPS)Earnings Per Share (EPS)EPS represent the dollar amount earned on behalf of each EPS represent the dollar amount earned on behalf of each outstanding share of common stock- not the amount of outstanding share of common stock- not the amount of earnings actually distributed to shareholders. EPS is earnings actually distributed to shareholders. EPS is generally of interest to present or prospective generally of interest to present or prospective stockholders and managementstockholders and management..
EPS EPS ==
For Metro Spinning Tk. 3.77For Metro Spinning Tk. 3.77 For Saiham textile Tk. 11.52For Saiham textile Tk. 11.52
CommentsCommentsThe EPS of the Metro Spinning Ltd is Tk. 3.77. Which indicates The EPS of the Metro Spinning Ltd is Tk. 3.77. Which indicates the company is able to earn Tk. 3.77 against each share of the company is able to earn Tk. 3.77 against each share of common stock outstanding. The higher the EPS the higher the common stock outstanding. The higher the EPS the higher the corporate success. Whereas the EPS of Saiham textile Ltd is Tk. corporate success. Whereas the EPS of Saiham textile Ltd is Tk. 11.52. So it can say that the Saiham textile Ltd is in the better 11.52. So it can say that the Saiham textile Ltd is in the better position than that of Metro Spinning Ltd. because of lower position than that of Metro Spinning Ltd. because of lower number of common stock share.number of common stock share.
Profitability Profitability
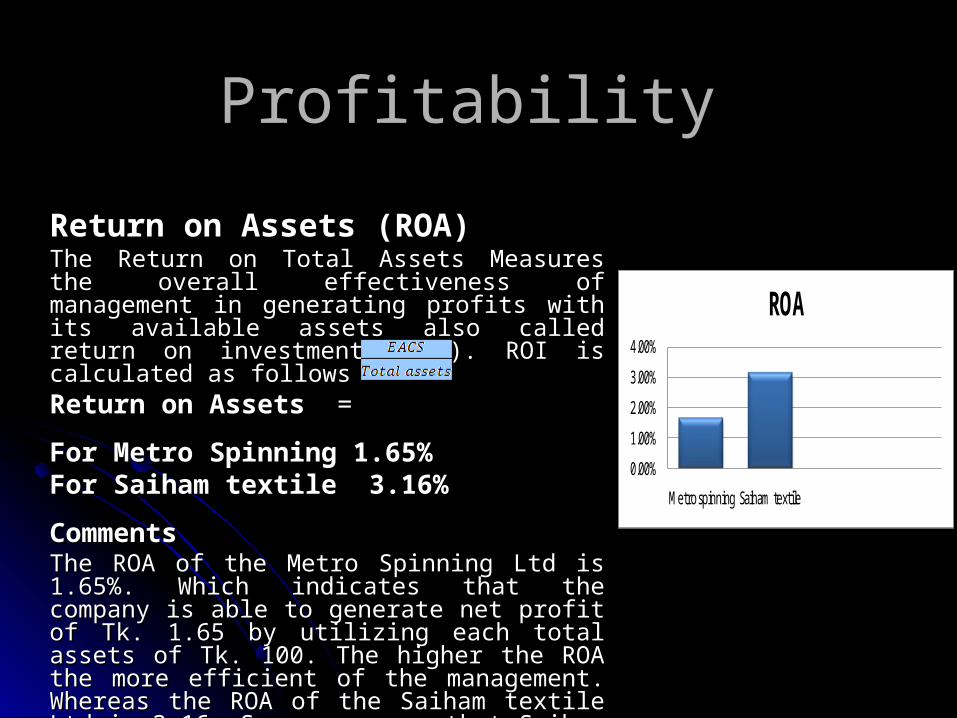
Return on Assets (ROA)Return on Assets (ROA)The Return on Total Assets Measures the overall The Return on Total Assets Measures the overall effectiveness of management in generating profits with effectiveness of management in generating profits with its available assets also called return on investment its available assets also called return on investment (ROI). ROI is calculated as follows(ROI). ROI is calculated as followsReturn on Assets Return on Assets ==
For Metro Spinning 1.65%For Metro Spinning 1.65% For Saiham textile 3.16%For Saiham textile 3.16%
CommentsCommentsThe ROA of the Metro Spinning Ltd is 1.65%. Which The ROA of the Metro Spinning Ltd is 1.65%. Which indicates that the company is able to generate net profit indicates that the company is able to generate net profit of Tk. 1.65 by utilizing each total assets of Tk. 100. The of Tk. 1.65 by utilizing each total assets of Tk. 100. The higher the ROA the more efficient of the management. higher the ROA the more efficient of the management. Whereas the ROA of the Saiham textile Ltd is 3.16. So Whereas the ROA of the Saiham textile Ltd is 3.16. So we can say that Saiham textile is more efficient than that we can say that Saiham textile is more efficient than that of Metro spinning Ltd. because of their total assets is of Metro spinning Ltd. because of their total assets is lower in compare to EACS than that of Metro Spinning.lower in compare to EACS than that of Metro Spinning.
0.00%
1.00%
2.00%
3.00%
4.00%
Metro spinning Saiham textile
ROA
Profitability Profitability
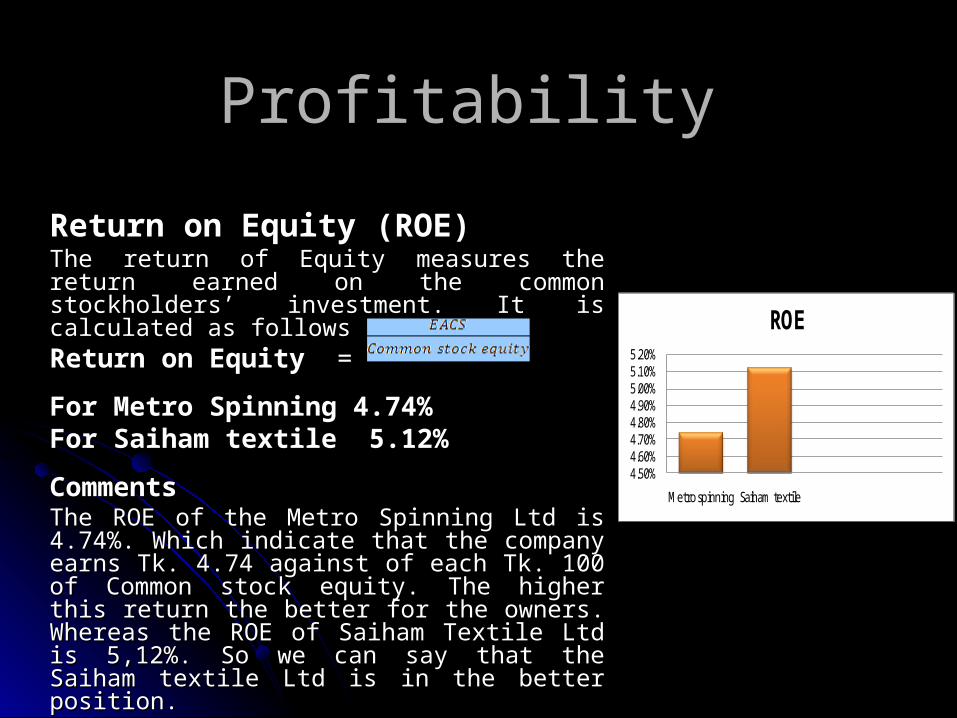
Return on Equity (ROE)Return on Equity (ROE)The return of Equity measures the return earned on the The return of Equity measures the return earned on the common stockholders’ investment. It is calculated as common stockholders’ investment. It is calculated as followsfollowsReturn on Equity Return on Equity ==
For Metro Spinning 4.74%For Metro Spinning 4.74% For Saiham textile 5.12%For Saiham textile 5.12%
CommentsCommentsThe ROE of the Metro Spinning Ltd is 4.74%. Which The ROE of the Metro Spinning Ltd is 4.74%. Which indicate that the company earns Tk. 4.74 against of each indicate that the company earns Tk. 4.74 against of each Tk. 100 of Common stock equity. The higher this return Tk. 100 of Common stock equity. The higher this return the better for the owners. Whereas the ROE of Saiham the better for the owners. Whereas the ROE of Saiham Textile Ltd is 5,12%. So we can say that the Saiham Textile Ltd is 5,12%. So we can say that the Saiham textile Ltd is in the better position. textile Ltd is in the better position.
4.50%4.60%4.70%4.80%4.90%5.00%5.10%5.20%
Metro spinning Saiham textile
ROE

Profitability Profitability
Overall commentsOverall commentsUsing huge debt amount in capital structure of Metro Spinning their net profit Using huge debt amount in capital structure of Metro Spinning their net profit margin is adversely affected. So their profitability ratio shows their worse margin is adversely affected. So their profitability ratio shows their worse performance than that of Saiham textile. So we can say that the capital performance than that of Saiham textile. So we can say that the capital structure of Saiham textile is better.structure of Saiham textile is better.

Findings & Recommendation Findings & Recommendation Bank industryBank industry
Major FindingsMajor FindingsBank industryBank industry
Dhaka Bank has used a huge amount debt capital (93.61%) in capital Dhaka Bank has used a huge amount debt capital (93.61%) in capital structure. So the company is in greater risk than BRAC Bank.structure. So the company is in greater risk than BRAC Bank.
As because of higher interest provide to the debt holders the net profit As because of higher interest provide to the debt holders the net profit margin of Dhaka Bank hugely decline in compare to operating profit margin of Dhaka Bank hugely decline in compare to operating profit margin.margin.
BRAC Bank did not use huge amount of debt that result their net profit BRAC Bank did not use huge amount of debt that result their net profit margin slightly decline.margin slightly decline.
From huge deposited amount and profitable investment BRAC Bank is able From huge deposited amount and profitable investment BRAC Bank is able to produce higher EPS than Dhaka Bank.to produce higher EPS than Dhaka Bank.
As because of huge amount of debt in Dhaka Bank’s capital structure, the As because of huge amount of debt in Dhaka Bank’s capital structure, the equity capital earn more profit because equity posses higher risk than that equity capital earn more profit because equity posses higher risk than that of BRAC Bank.of BRAC Bank.
Huge debt in capital structure of Dhaka Bank that result their net profit Huge debt in capital structure of Dhaka Bank that result their net profit sharply decline that impact on return on total assets.sharply decline that impact on return on total assets.
RecommendationRecommendationBank industryBank industry
Dhaka bank should restructure their capital structure. They should reduce Dhaka bank should restructure their capital structure. They should reduce their debt amount in order to reduce financial distress cost. their debt amount in order to reduce financial distress cost.
Efficient cost management system should be implemented for the both Efficient cost management system should be implemented for the both company.company.
Net profit margin decline sharply because of huge amount of interest Net profit margin decline sharply because of huge amount of interest payment in both company but more in Dhaka bank so debt capital should payment in both company but more in Dhaka bank so debt capital should be reduced.be reduced.

Findings & Recommendation Findings & Recommendation Textile IndustryTextile Industry
Major Findings Major Findings Textile IndustryTextile Industry
The equity capital of Metro Spinning is less than 50% (38.26%) the The equity capital of Metro Spinning is less than 50% (38.26%) the problem is that the firm can be acquired by any other company.problem is that the firm can be acquired by any other company.
The debt capital of metro spinning is higher that posses higher risk.The debt capital of metro spinning is higher that posses higher risk. Net profit margin of Metro Spinning is sharply decline because of higher Net profit margin of Metro Spinning is sharply decline because of higher
interest on higher debt capital used in capital structure.interest on higher debt capital used in capital structure. Earnings per share of Metro spinning (3.77) is less than the Saiham Textile Earnings per share of Metro spinning (3.77) is less than the Saiham Textile
(11.52) because their net profit hugely decline from operating profit (11.52) because their net profit hugely decline from operating profit because of higher interest payment.because of higher interest payment.
The higher interest payment also affect the return on total assets of Metro The higher interest payment also affect the return on total assets of Metro Spinning.Spinning.
The equity of Metro Spinning posses higher risk that result we find that in The equity of Metro Spinning posses higher risk that result we find that in return on equity of this company is (4.74) which is less than Saiham Textile return on equity of this company is (4.74) which is less than Saiham Textile (5.12).(5.12).
Both the companies have effective cost management system that result Both the companies have effective cost management system that result operating income is slightly decline to operating profit marginoperating income is slightly decline to operating profit margin

Recommendation Recommendation Textile IndustryTextile Industry
The Metro Spinning should increase their equity capital slightly more than The Metro Spinning should increase their equity capital slightly more than 50% in order to reduce the chance of hostile takeover from another 50% in order to reduce the chance of hostile takeover from another company.company.
The debt capital of Metro Spinning should slightly decline to reduce the The debt capital of Metro Spinning should slightly decline to reduce the financial distress cost.financial distress cost.
The debt capital of Saiham Textile can be increased to 40%- 50%.The debt capital of Saiham Textile can be increased to 40%- 50%.
The debt capital should decline to reduce the interest payment that The debt capital should decline to reduce the interest payment that adversely affect in profitability ratio of Metro Spinning Ltd.adversely affect in profitability ratio of Metro Spinning Ltd.
The existing Management body should be continued for both the company.The existing Management body should be continued for both the company.

Thank you to allThank you to allFor being attended patientlyFor being attended patiently
Related Documents


