Ooredoo Group 1H 2016 Results 27July 2016

Welcome message from author
This document is posted to help you gain knowledge. Please leave a comment to let me know what you think about it! Share it to your friends and learn new things together.
Transcript

Ooredoo Group1H 2016 Results
27July 2016
2 | | Ooredoo Group Results Call1H 2016
Ooredoo (parent company Ooredoo Q.S.C.) and the group of companies which it forms part of (“Ooredoo Group”) cautions investors that certain
statements contained in this document state Ooredoo Group management's intentions, hopes, beliefs, expectations, or predictions of the future
and, as such, are forward-looking statements.
Ooredoo Group management wishes to further caution the reader that forward-looking statements are not historical facts and are only estimates
or predictions. Actual results may differ materially from those projected as a result of risks and uncertainties including, but not limited to:
– Our ability to manage domestic and international growth and maintain a high level of customer service
– Future sales growth
– Market acceptance of our product and service offerings
– Our ability to secure adequate financing or equity capital to fund our operations
– Network expansion
– Performance of our network and equipment
– Our ability to enter into strategic alliances or transactions
– Cooperation of incumbent local exchange carriers in provisioning lines and interconnecting our equipment
– Regulatory approval processes
– Changes in technology
– Price competition
– Other market conditions and associated risks
This presentation does not constitute an offering of securities or otherwise constitute an invitation or inducement to any person to underwrite,
subscribe for or otherwise acquire or dispose of securities in any company within the Ooredoo Group.
The Ooredoo Group undertakes no obligation to update publicly or otherwise any forward-looking statements, whether as a result of future
events, new information, or otherwise.
Disclaimer
3 | | Ooredoo Group Results Call1H 2016
Contents
Results Review
Operations Review
Additional Information

4 | | Ooredoo Group Results Call1H 2016
Group Results2016 1H Highlights
Global customer base further expanded
• Ooredoo Group customer base increased by 14% to 130 million; driven by strong growth in Indonesia and Myanmar
Solid performance delivered
• Revenue at QAR 16 billion: local currency growth in Qatar, Oman, Indonesia, Myanmar, Algeria, Kuwait, Palestine and the
Maldives. Excluding Foreign Exchange translation impact, revenues would have increased 2%, compared to the reported decline
of 1%.
• Group EBITDA stable at QAR 6.5 billion with an improved EBITDA margin of 41% compared to last year indicating a continued
improvement in operational performance from Q1 2016. Excluding Foreign Exchange translation impact, Group EBITDA would
have increased by 3% year-on-year.
• Group Net Profit to Ooredoo shareholders increased by 46% to QAR 1.5 billion driven by strong contributions from Indonesia,
Myanmar and Algeria supported by positive Foreign Exchange movements.
Results
Review
Operations
Review
Additional
InformationOverview

5 | | Ooredoo Group Results Call1H 2016
Group Results2016 1H Highlights - continued
Strategic investments into networks & data / B2B
• Continued strong data growth from consumer and enterprise customers: data revenue increased to 39% of Group revenue (H1
2015: 34%). Revenue from data contributed QAR 6.2 billion in H1 2016.
• Ooredoo continues to be the data leader in its markets: launch of 4G services in Myanmar (May 2016) and pre- launch phase
finalized in Algeria (July 2016). 4G networks now available in 8 of Ooredoo’s 10 markets.
• B2B revenue increased by 5% to QAR 2.8 billion reflecting Ooredoo’s ongoing investment in services for business customers
• Ooredoo Kuwait acquisition of “FASTtelco”, a Kuwait based ISP, to offer advanced fixed broadband and mobile services finalized
in May 2016.
Successful new funding at attractive cost
• New USD 500 million 10 year 3.75% p.a. bond successfully concluded in June 2016
• New USD 1 billion Revolving Credit Facility Agreement with a six years tenor signed in June 2016
Results
Review
Operations
Review
Additional
InformationOverview

6 | | Ooredoo Group Results Call1H 2016
Note: All Indosat results as reported adhere to IFRS which may in some instances differ from INDOGAAP
Group ResultsRevenue and EBITDA
Revenue growth in local currency terms in the majority of markets
offset by challenging environment in Iraq & Tunisia; EBITDA margin improved to 41%
excluding FX impact: revenue up 2% and EBITDA up 3%
17,026 16,504
16,042 15,914
1H'13 1H'14 1H'15 1H'16
7,612
6,870 6,456 6,478
45% 42% 40% 41%
1H'13 1H'14 1H'15 1H'16
-3%-3%
-1%
-10%-6% 0%
Revenue (QARm) EBITDA (QARm) and EBITDA Margin
Results
Review
Operations
Review
Additional
InformationOverview

7 | | Ooredoo Group Results Call1H 2016
30,248 31,443
29,672 29,593
2.1 2.22.4 2.3
1H'13 1H'14 1H'15 1H'16
Note: Net Debt = Total interest bearing loans and borrowings + contingent liabilities (letters of guarantee + letters of credit + finance lease + vendor financing) – cash (net of restricted cash and below BBB+ rating)
Group ResultsNet Profit and Net Debt
+4%-6% +0%
Net Profit Attributable to Ooredoo Shareholders (QARm) Net Debt (QARm) and Net Debt/EBITDA
Net Foreign Exchange
Net Profit positively impacted by Indonesia, Myanmar and Algeria
Net Debt / EBITDA improving
(114)(109)
(299)
540
1,840 1,705
1,301
922
1H'13 1H'14 1H'15 1H'16
1,731
1,704
1,462
1,002
(109)(1) (299)
(1)
-2%
-41%
+46%
Results
Review
Operations
Review
Additional
InformationOverview

8 | | Ooredoo Group Results Call1H 2016
3,739 3,952
3,847
2,411
22%24% 24%
15%
1H'13 1H'14 1H'15 1H'16
Note: Free Cash Flow = Net Profit plus Depreciation & Amortization less CAPEX; CAPEX excludes license fee obligations; Net Profit adjusted for extraordinary items
Group ResultsFree Cash Flow and Capital Expenditure
2,377
1,859
1,138
3,383
1H'13 1H'14 1H'15 1H'16
-22%
+197%
-37%
+6%
-39%
-3%
Free Cash Flow (QARm) CAPEX (QARm) and CAPEX/Revenue (%)
Free CF benefitted from reduced Capex and FX trends
Capex investments taking advantage of scale of Ooredoo Group
Results
Review
Operations
Review
Additional
InformationOverview
9 | | Ooredoo Group Results Call1H 2016
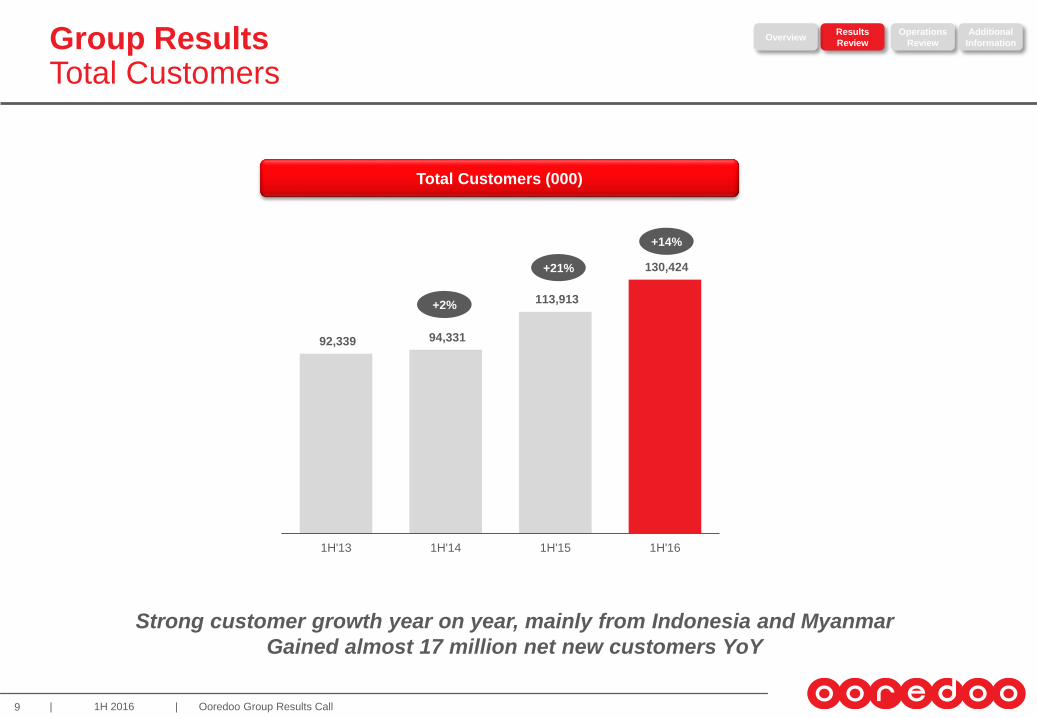
Group ResultsTotal Customers
Total Customers (000)
Strong customer growth year on year, mainly from Indonesia and Myanmar
Gained almost 17 million net new customers YoY
92,339 94,331
113,913
130,424
1H'13 1H'14 1H'15 1H'16
+14%
+2%
+21%
Results
Review
Operations
Review
Additional
InformationOverview

10 | | Ooredoo Group Results Call1H 2016
Note: Qatar debt includes Ooredoo International Finance Ltd. and Ooredoo Tamweel Ltd.
Group ResultsTotal Group Debt Breakdown
33,89638,989 39,233 38,207
8,133
4,204 4,756 7,656
1H'13 1H'14 1H'15 1H'16
45,863
Qatar77%
Indonesia13%
Others10%
Short-term
Long-term
42,19342,02943,989
Total Group Debt (QARm) Total Group Debt Breakdown (as of June 30, 2016)
Total Group debt temporarily slightly higher due to new USD 500m bond
Refinancing requirements have been proactively addressed
Results
Review
Operations
Review
Additional
InformationOverview

11 | | Ooredoo Group Results Call1H 2016
Ooredoo (Q.S.C) Successful funding transactions
Issuer
Guarantor
Status
Rating
Format / Instrument
Currency and Size
Pricing / Settlement Date
Maturity Date
Coupon
Listing
Joint Lead Managers and
Book runners
Roadshows
Ooredoo International Finance Limited
Ooredoo Q.S.C
Senior Notes
A+ (Fitch) / A2 (Moody’s) / A- (S&P)
Rule 144A / Regulation S
USD 500m
15 June 2016 / 22 June 2016
22 June 2026
3.750% p.a.
Irish Stock Exchange
Australia and New Zealand Banking Group
Limited, Citigroup Global Markets Limited,
DBS Bank Ltd., HSBC Bank plc, Merrill
Lynch International, Mitsubishi UFJ
Securities International plc, Mizuho
Securities USA Inc. and QNB Capital LLC
Abu Dhabi, Dubai, Hong Kong, Singapore,
New York, Boston and London
USD 500mn 10 year RegS / 144a Bonds
Arrangers
Facility Agent
Tenor
Proceeds
Qatar National Bank S.A.Q.,
Australia and New Zealand
Banking Group Ltd., Bank of
America Merrill
Lynch International Ltd., The
Bank of Tokyo-Mitsubishi UFJ,
Ltd., Citibank, N.A., London
Branch, DBS Bank Ltd,
HSBC Bank Middle East Ltd.,
Mizuho Bank
QNB
Six years from June 2016
Repayment of previous USD 1bn
RCF due in March 2017
USD 1 billion Revolving Credit Facility (RCF)
Results
Review
Operations
Review
Additional
InformationOverview
12 | | Ooredoo Group Results Call1H 2016
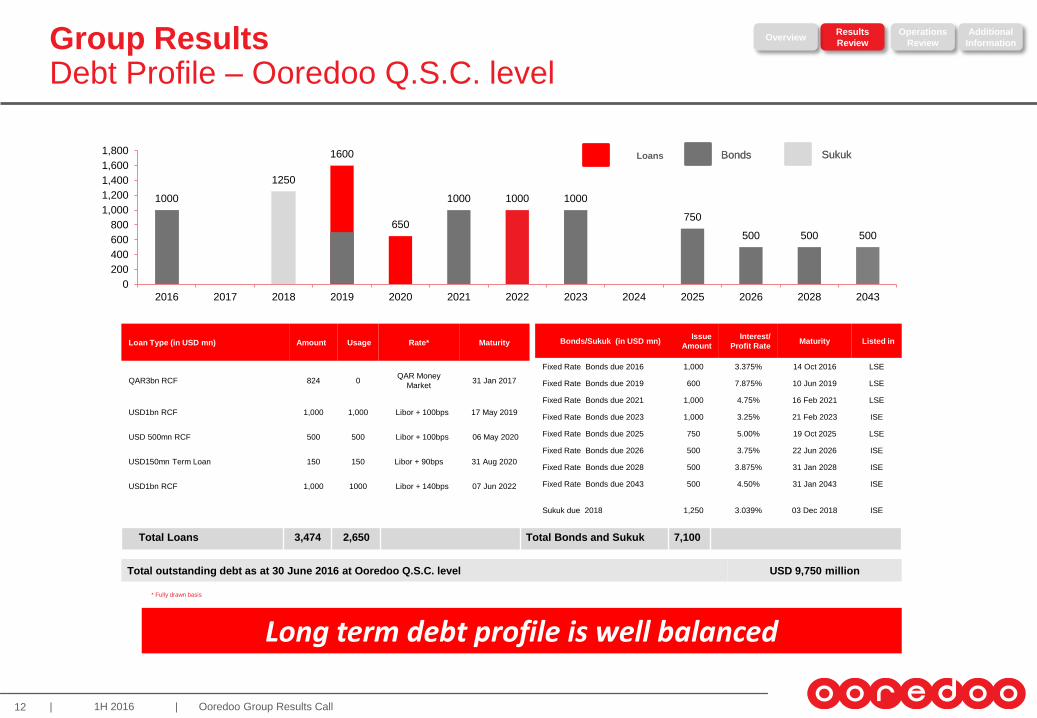
Group ResultsDebt Profile – Ooredoo Q.S.C. level
Total outstanding debt as at 30 June 2016 at Ooredoo Q.S.C. level USD 9,750 million
Long term debt profile is well balanced
Total Loans 3,474 2,650 Total Bonds and Sukuk 7,100
* Fully drawn basis
1000
1250
1600
650
1000 1000 1000
750
500 500 500
0
200
400
600
800
1,000
1,200
1,400
1,600
1,800
2016 2017 2018 2019 2020 2021 2022 2023 2024 2025 2026 2028 2043
Bonds SukukBonds SukukLoans
Loan Type (in USD mn) Amount Usage Rate* Maturity
QAR3bn RCF 824 0QAR Money
Market31 Jan 2017
USD1bn RCF 1,000 1,000 Libor + 100bps 17 May 2019
USD 500mn RCF 500 500 Libor + 100bps 06 May 2020
USD150mn Term Loan 150 150 Libor + 90bps 31 Aug 2020
USD1bn RCF 1,000 1000 Libor + 140bps 07 Jun 2022
Bonds/Sukuk (in USD mn)Issue
Amount
Interest/
Profit RateMaturity Listed in
Fixed Rate Bonds due 2016 1,000 3.375% 14 Oct 2016 LSE
Fixed Rate Bonds due 2019 600 7.875% 10 Jun 2019 LSE
Fixed Rate Bonds due 2021 1,000 4.75% 16 Feb 2021 LSE
Fixed Rate Bonds due 2023 1,000 3.25% 21 Feb 2023 ISE
Fixed Rate Bonds due 2025 750 5.00% 19 Oct 2025 LSE
Fixed Rate Bonds due 2026 500 3.75% 22 Jun 2026 ISE
Fixed Rate Bonds due 2028 500 3.875% 31 Jan 2028 ISE
Fixed Rate Bonds due 2043 500 4.50% 31 Jan 2043 ISE
Sukuk due 2018 1,250 3.039% 03 Dec 2018 ISE
Results
Review
Operations
Review
Additional
InformationOverview

13 | | Ooredoo Group Results Call1H 2016
Group Results2016 1H Performance Summary
Consolidated Revenue (QAR bn) 15.9 -1%
EBITDA (QAR bn) 6.4 0%
Capital Expenditure (QAR bn) 2.4 -37%
% Change
1H 2016 / 1H 20151H 2016
2016 Annual
Guidance
-1% to +2%
-3% to 0%
6.5 bn to 7.5 bn
1H results in line with guidance given for 2016
Results
Review
Operations
Review
Additional
InformationOverview

14 | | Ooredoo Group Results Call1H 2016
Contents
Results Review
Operations Review
Additional Information

15 | | Ooredoo Group Results Call1H 2016
2,020 1,940
50% 48%
1H'15 1H'16
Group OperationsQatar
• Market leadership position maintained -
Ooredoo’s fixed line and mobile networks in Qatar
ranked among fastest globally
• Growth in revenue driven by wireless business,
flat revenue in wireline
• EBITDA impacted by higher marketing cost
(launch TV/ B2B campaigns) and higher share of
handset sales
• Upgraded Supernet: Fibre broadband services
with speeds of up to 1Gbps, launch “Platinum
Homezone” ultimate wifi for large villas; added
Category 9 LTE-Advanced standard enabling
mobile download speed of 325 Mbps
• Ooredoo TV (first 4K TV offering in the region)
attracting more than 30k customers
• More than 70% of customers are using data
• Ooredoo’s Fibre-to-the-Home network continued
to grow; 281k customers connected
4,003 4,033
1H'15 1H'16
Revenue
+1%
EBITDA & Margin
-4%
QARm
• 1 USD = 3.6415 Qatari Riyal (QAR)
Results
Review
Operations
Review
Additional
InformationOverview

16 | | Ooredoo Group Results Call1H 2016
• Double digit cellular revenue growth in local
currency terms year-on-year supported by growth
in all services (voice, SMS, data and VAS)
• EBITDA growth outpaced revenue growth with
EBITDA margin increase of 1ppt year-on-year.
• Positive bottom line due to continued
improvement in operational process, revenue
growth and relatively stable currency movement
• Data revenue grew more than 50% year-on-year,
contributing more than 40% of cellular revenue.
Mobile digital market strongly support data growth.
• 4G coverage has reached 40 cities in Indonesia
Note: (1) As per IFRS; (2) Six month average rate January – June 2016
Group OperationsIndonesia
QARm
IDRbn1
12,62013,942
1H'15 1H'16
5,6946,407
45% 46%
1H'15 1H'16
+10%+13%
3,543 3,787
1H'15 1H'16
+7%
1,598 1,740
45% 46%
1H'15 1H'16
+9%
Revenue EBITDA & Margin
Revenue EBITDA & Margin
• 1 USD = 13,413 Indonesia Rupiah (IDR)2
Results
Review
Operations
Review
Additional
InformationOverview
17 | | Ooredoo Group Results Call1H 2016
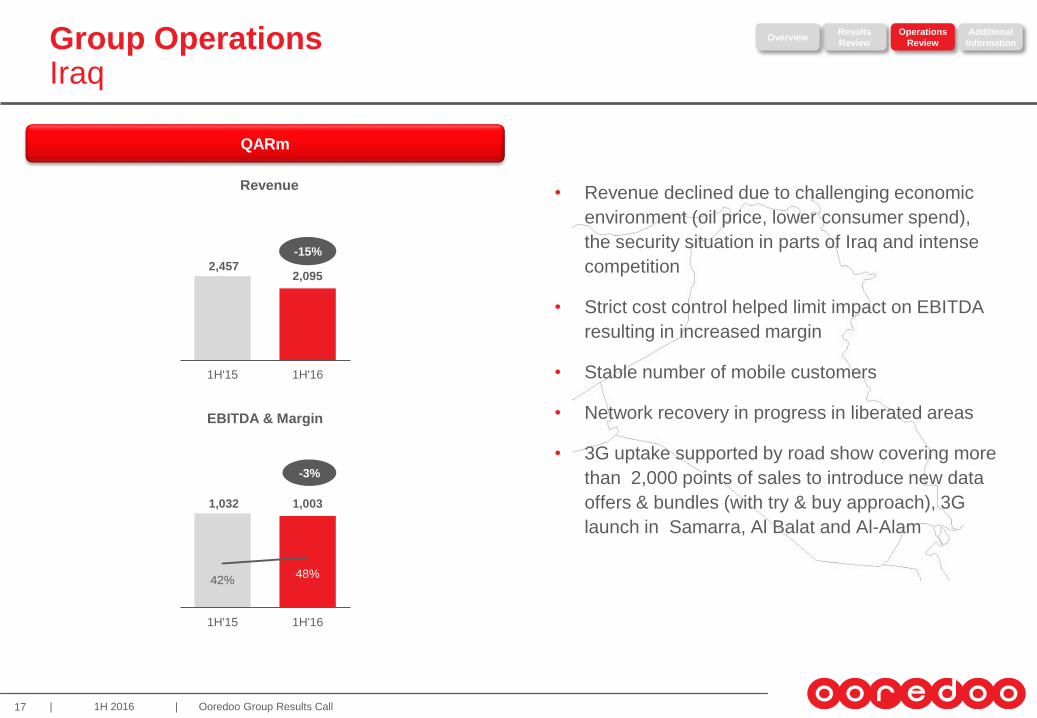
• Revenue declined due to challenging economic
environment (oil price, lower consumer spend),
the security situation in parts of Iraq and intense
competition
• Strict cost control helped limit impact on EBITDA
resulting in increased margin
• Stable number of mobile customers
• Network recovery in progress in liberated areas
• 3G uptake supported by road show covering more
than 2,000 points of sales to introduce new data
offers & bundles (with try & buy approach), 3G
launch in Samarra, Al Balat and Al-Alam
1,032 1,003
42%48%
1H'15 1H'16
Group OperationsIraq
Revenue
QARm
2,457 2,095
1H'15 1H'16
-15%
-3%
EBITDA & Margin
Results
Review
Operations
Review
Additional
InformationOverview

18 | | Ooredoo Group Results Call1H 2016
1,194 1,298
1H'15 1H'16
648695
54% 54%
1H'15 1H'16
• Ooredoo Oman again showing strong growth on
all levels: Revenue, EBITDA, Net Profit and
customer numbers
• Growth driven by both mobile and fixed data
revenue, now data is 50% of revenue; smart
device penetration 80%
• Number of customers up 3% year on year driven
by fixed and mobile increase (pre and postpaid)
• First wave of LTE800 launched
• OO Customer service have won the “Best call
center award for service assurance” & “The best
VOC Program”
Note: (1) Constant pegged currency
Group OperationsOman
Revenue
QARm
+9%
+7%
EBITDA & Margin
Results
Review
Operations
Review
Additional
InformationOverview
• 1 USD = 0.38463 Omani Rial (OMR)1

19 | | Ooredoo Group Results Call1H 2016
• Ooredoo Kuwait displayed local currency growth
in a highly competitive market.
• Revenue up 10% YoY
• EBITDA up 4%YoY
• Growth driven by postpaid and wireless
broadband (WBB) segments
• Aggressive prepaid (price) and data (data
allowances) market
• Operating costs are under control and is lower
than previous year but high handset subsidies and
price competition still impacting the margins.
• Customer benefitting from improved voice and
data network, highest quality networks based on
independent benchmarks
21 21
22% 21%
1H'15 1H'16
91 100
1H'15 1H'16
Note: (1) Six month average rate January – June 2016
Group OperationsKuwait
QARm
KWDm
Revenue EBITDA & Margin
Revenue EBITDA & Margin
1,111 1,210
1H'15 1H'16
250 257
22% 21%
1H'15 1H'16
+9%
+3%
+10%+4%
• 1 USD = 0.3017 Kuwait Dinar (KWD)1
Results
Review
Operations
Review
Additional
InformationOverview
20 | | Ooredoo Group Results Call1H 2016
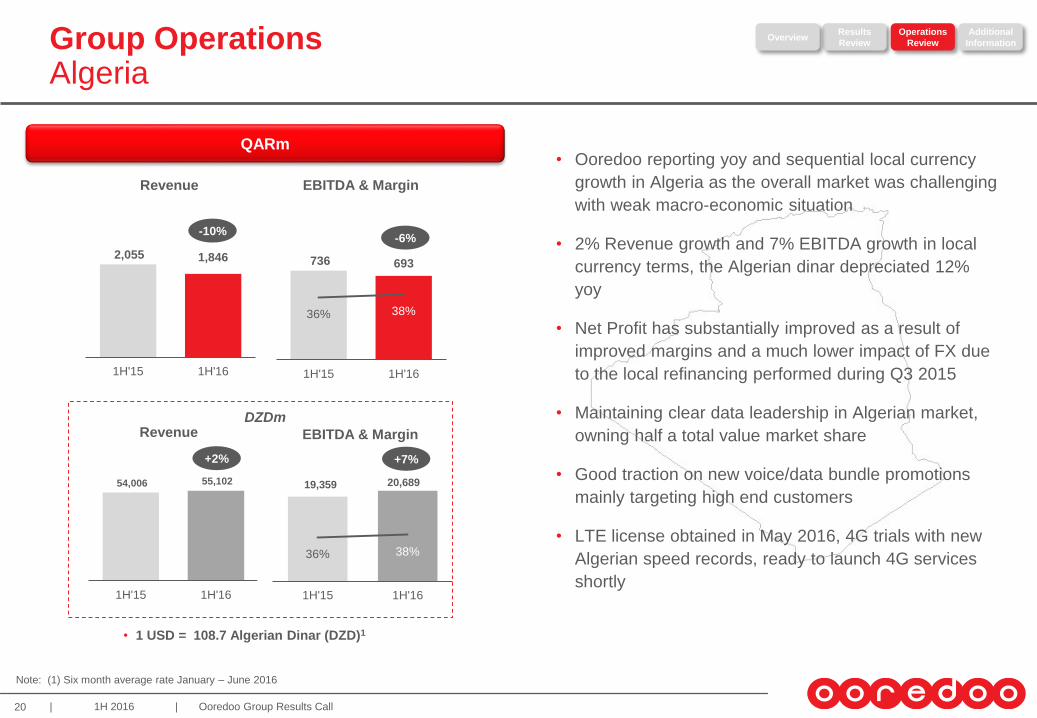
• Ooredoo reporting yoy and sequential local currency
growth in Algeria as the overall market was challenging
with weak macro-economic situation
• 2% Revenue growth and 7% EBITDA growth in local
currency terms, the Algerian dinar depreciated 12%
yoy
• Net Profit has substantially improved as a result of
improved margins and a much lower impact of FX due
to the local refinancing performed during Q3 2015
• Maintaining clear data leadership in Algerian market,
owning half a total value market share
• Good traction on new voice/data bundle promotions
mainly targeting high end customers
• LTE license obtained in May 2016, 4G trials with new
Algerian speed records, ready to launch 4G services
shortly
54,006 55,102
1H'15 1H'16
19,359 20,689
36% 38%
1H'15 1H'16
2,055 1,846
1H'15 1H'16
736 693
36% 38%
1H'15 1H'16
Note: (1) Six month average rate January – June 2016
Group OperationsAlgeria
QARm
DZDm
Revenue EBITDA & Margin
Revenue EBITDA & Margin
-10%-6%
+2% +7%
• 1 USD = 108.7 Algerian Dinar (DZD)1
Results
Review
Operations
Review
Additional
InformationOverview
21 | | Ooredoo Group Results Call1H 2016
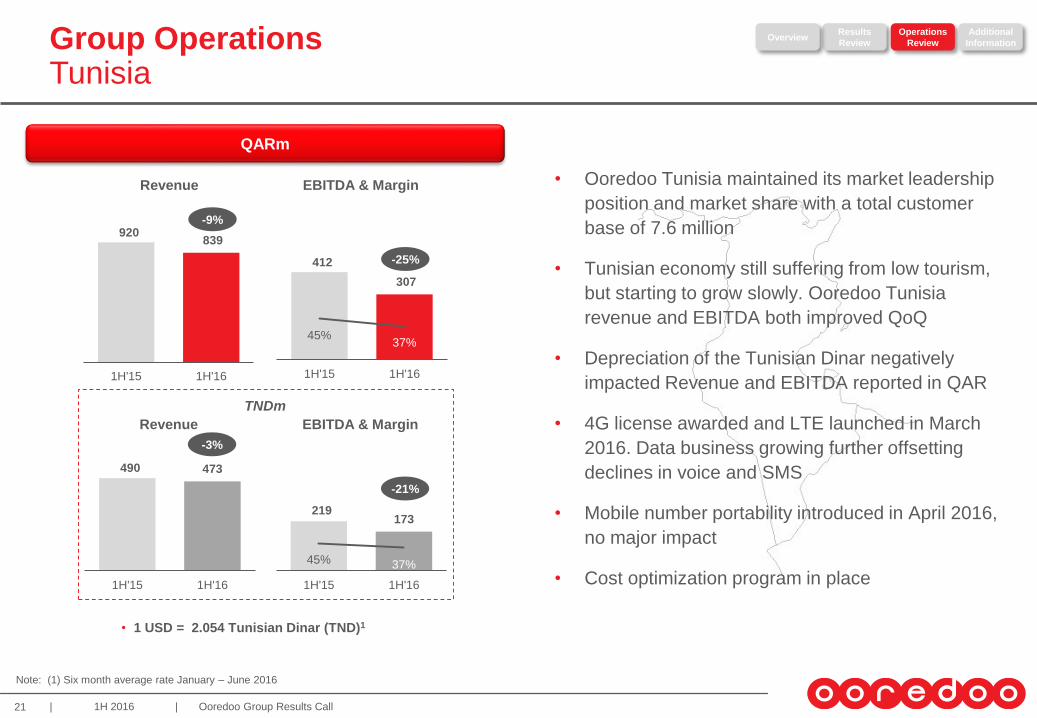
490 473
1H'15 1H'16
219173
45% 37%
1H'15 1H'16
• Ooredoo Tunisia maintained its market leadership
position and market share with a total customer
base of 7.6 million
• Tunisian economy still suffering from low tourism,
but starting to grow slowly. Ooredoo Tunisia
revenue and EBITDA both improved QoQ
• Depreciation of the Tunisian Dinar negatively
impacted Revenue and EBITDA reported in QAR
• 4G license awarded and LTE launched in March
2016. Data business growing further offsetting
declines in voice and SMS
• Mobile number portability introduced in April 2016,
no major impact
• Cost optimization program in place
920 839
1H'15 1H'16
412
307
45%37%
1H'15 1H'16
Note: (1) Six month average rate January – June 2016
Group OperationsTunisia
QARm
TNDm
Revenue EBITDA & Margin
Revenue EBITDA & Margin
-9%
-25%
-3%
-21%
• 1 USD = 2.054 Tunisian Dinar (TND)1
Results
Review
Operations
Review
Additional
InformationOverview
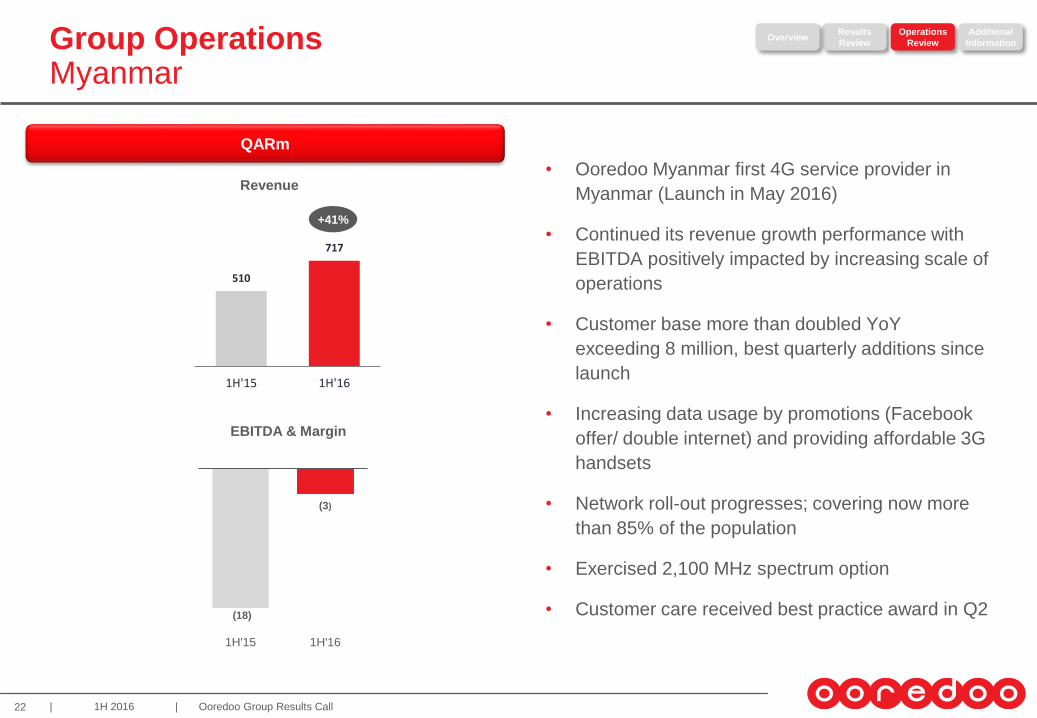
22 | | Ooredoo Group Results Call1H 2016
• Ooredoo Myanmar first 4G service provider in
Myanmar (Launch in May 2016)
• Continued its revenue growth performance with
EBITDA positively impacted by increasing scale of
operations
• Customer base more than doubled YoY
exceeding 8 million, best quarterly additions since
launch
• Increasing data usage by promotions (Facebook
offer/ double internet) and providing affordable 3G
handsets
• Network roll-out progresses; covering now more
than 85% of the population
• Exercised 2,100 MHz spectrum option
• Customer care received best practice award in Q2
Group OperationsMyanmar
Revenue
QARm
EBITDA & Margin
(18)
(3)
1H'15 1H'16
510
717
1H'15 1H'16
+41%
Results
Review
Operations
Review
Additional
InformationOverview

Q & A
24 | | Ooredoo Group Results Call1H 2016
Contents
Results Review
Operations Review
Additional Information
25 | | Ooredoo Group Results Call1H 2016
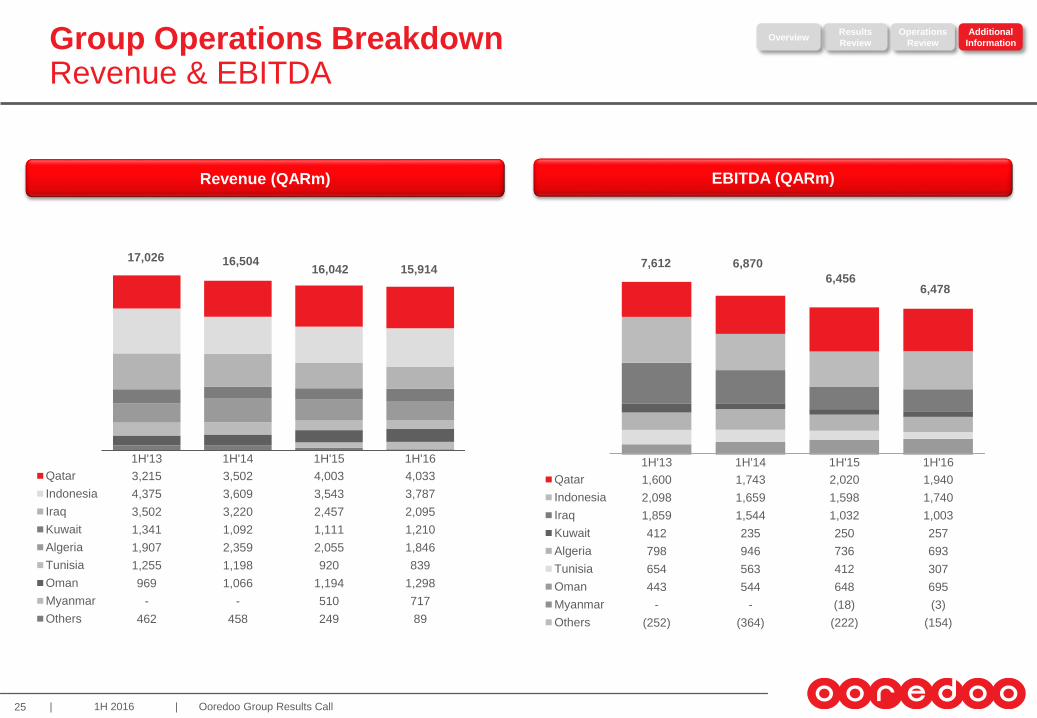
1H'13 1H'14 1H'15 1H'16
Qatar 3,215 3,502 4,003 4,033
Indonesia 4,375 3,609 3,543 3,787
Iraq 3,502 3,220 2,457 2,095
Kuwait 1,341 1,092 1,111 1,210
Algeria 1,907 2,359 2,055 1,846
Tunisia 1,255 1,198 920 839
Oman 969 1,066 1,194 1,298
Myanmar - - 510 717
Others 462 458 249 89
16,042 15,914
Group Operations BreakdownRevenue & EBITDA
Revenue (QARm) EBITDA (QARm)
Results
Review
Operations
Review
Additional
InformationOverview
16,504
1H'13 1H'14 1H'15 1H'16
Qatar 1,600 1,743 2,020 1,940
Indonesia 2,098 1,659 1,598 1,740
Iraq 1,859 1,544 1,032 1,003
Kuwait 412 235 250 257
Algeria 798 946 736 693
Tunisia 654 563 412 307
Oman 443 544 648 695
Myanmar - - (18) (3)
Others (252) (364) (222) (154)
6,4566,478
6,8707,61217,026

26 | | Ooredoo Group Results Call1H 2016
Group Operations BreakdownCAPEX & Customers
1
CAPEX Breakdown Customers Breakdown
Qatar16.6%
Iraq9.2%
Indonesia18.7%
Oman9.5%
Kuwait6.4%
Algeria12.3%
Mynamar 19.3%
Tunisia5.8%
Others2.2%
Qatar2.6% Iraq
8.3%
Indonesia61.7%
Oman2.2%
Kuwait1.9%
Algeria10.2%
Tunisia5.8%Myanmar
6.3%
Others1.0%
1H 2016 CAPEX = QAR 2,411 million 1H 2016 Total Customers = 130.4 million
Results
Review
Operations
Review
Additional
InformationOverview
27 | | Ooredoo Group Results Call1H 2016
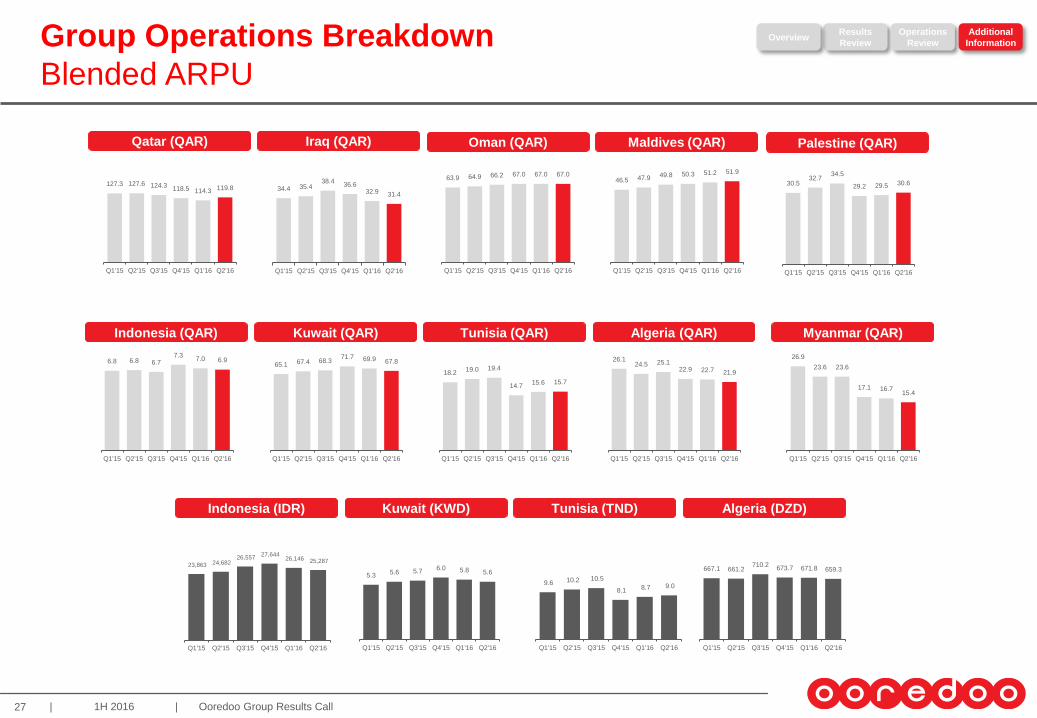
Algeria (QAR)Tunisia (QAR)Kuwait (QAR)Indonesia (QAR)
Group Operations Breakdown
Blended ARPU
127.3 127.6 124.3118.5 114.3 119.8
Q1'15 Q2'15 Q3'15 Q4'15 Q1'16 Q2'16
34.4 35.438.4
36.632.9 31.4
Q1'15 Q2'15 Q3'15 Q4'15 Q1'16 Q2'16
63.9 64.9 66.2 67.0 67.0 67.0
Q1'15 Q2'15 Q3'15 Q4'15 Q1'16 Q2'16
46.5 47.9 49.8 50.3 51.2 51.9
Q1'15 Q2'15 Q3'15 Q4'15 Q1'16 Q2'16
6.8 6.8 6.77.3
7.0 6.9
Q1'15 Q2'15 Q3'15 Q4'15 Q1'16 Q2'16
65.1 67.4 68.371.7 69.9 67.8
Q1'15 Q2'15 Q3'15 Q4'15 Q1'16 Q2'16
26.124.5 25.1
22.9 22.7 21.9
Q1'15 Q2'15 Q3'15 Q4'15 Q1'16 Q2'16
18.219.0 19.4
14.715.6 15.7
Q1'15 Q2'15 Q3'15 Q4'15 Q1'16 Q2'16
Qatar (QAR) Iraq (QAR) Oman (QAR) Maldives (QAR) Palestine (QAR)
30.532.7
34.5
29.2 29.5 30.6
Q1'15 Q2'15 Q3'15 Q4'15 Q1'16 Q2'16
23,863 24,682 26,557
27,644 26,146 25,287
Q1'15 Q2'15 Q3'15 Q4'15 Q1'16 Q2'16
5.3 5.6 5.7 6.0 5.8 5.6
Q1'15 Q2'15 Q3'15 Q4'15 Q1'16 Q2'16
9.6 10.2 10.5
8.1 8.7 9.0
Q1'15 Q2'15 Q3'15 Q4'15 Q1'16 Q2'16
667.1 661.2710.2
673.7 671.8 659.3
Q1'15 Q2'15 Q3'15 Q4'15 Q1'16 Q2'16
Algeria (DZD)Tunisia (TND)Kuwait (KWD)Indonesia (IDR)
Myanmar (QAR)
26.9
23.6 23.6
17.1 16.715.4
Q1'15 Q2'15 Q3'15 Q4'15 Q1'16 Q2'16
Results
Review
Operations
Review
Additional
InformationOverview

28 | | Ooredoo Group Results Call1H 2016
Additional InformationStatutory Corporate Tax Rates
Algeria 26% 4 years
Indonesia 25% 5 years
Iraq 15% 5 years
Kuwait 15% 3 yearsGCC companies (including NMTC)are exempted and are subjected to 4.5% Zakat, KFAS &
national Labour Support Tax on consolidated profits
Maldives 15% 5 years
Myanmar 25% 3 years
Oman 12% 5 years
Palestine 20% 5 years
Qatar 10% 3 years Qatari/GCC owned companies and companies listed on Qatar Exchange are exempt
Singapore 17% Indefinitely
Tunisia 35% 5 years1) 25% is the standard tax rate; 2) 35% tax rate applies to oil companies, banks, financial
institutions including insurance companies and telecommunication companies
NotesStatutory
Tax Rate
Losses C/Fwd
Allowed
Results
Review
Operations
Review
Additional
InformationOverview

Related Documents