Welcome message from author
This document is posted to help you gain knowledge. Please leave a comment to let me know what you think about it! Share it to your friends and learn new things together.
Transcript


1/17
July 2020

2/17
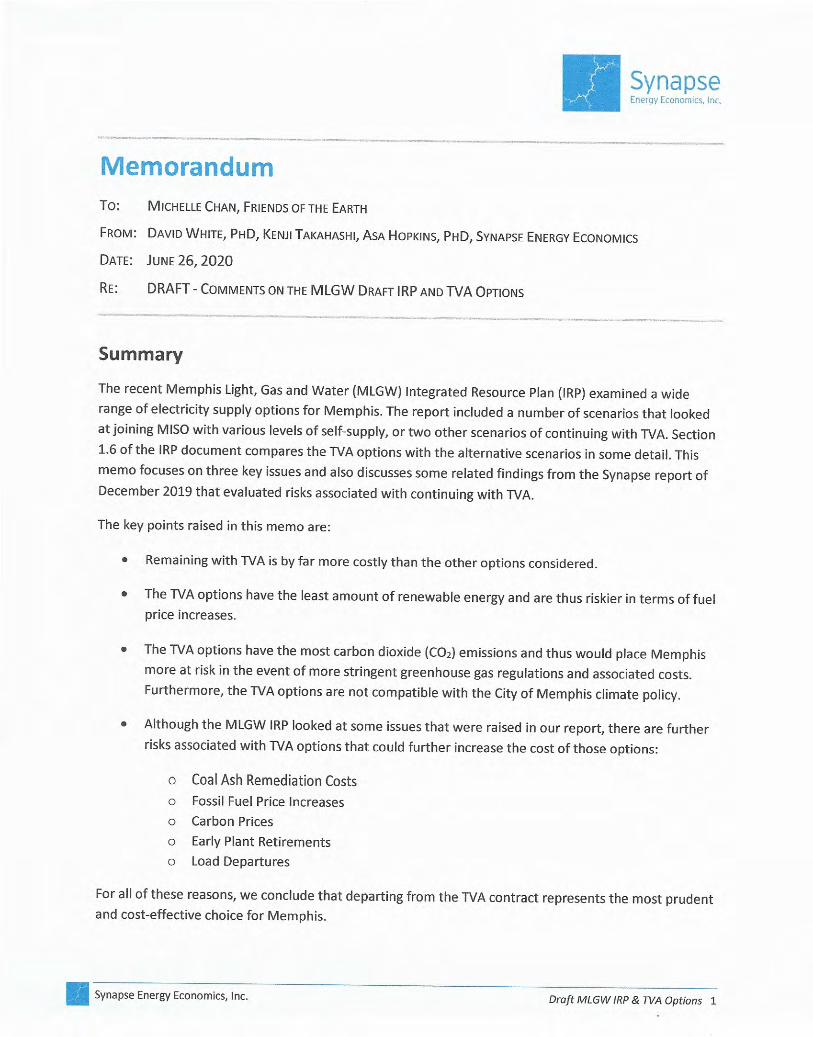
OVERVIEW Renewable energy demand is growing. Renewable energy prices have plummeted over the past few years. Renewable energy prices have declined by 70-90% just since 2009.1 In many parts of the country, renewable energy is now cost competitive against traditional energy resources. Utilities like Southwestern Electric Power Company (Louisiana/Arkansas)2, MidAmerican (Iowa)3, and Georgia Power4 have announced multi-gigawatt renewable energy power purchase agreements. North Carolina has over 6,400 megawatts of solar power installed.5 Corporations and other non-utility buyers are finding innovative mechanisms to directly invest in renewable energy. These voluntary announcements are due to the low costs of renewable energy.6 The Southern Renewable Energy Association (SREA) is a nonprofit, renewable energy industry-led initiative that promotes responsible use and development of wind energy, solar energy, energy storage and transmission solutions in the South. Our vision is for renewable energy to become a leading source of energy in the South. To achieve our vision, SREA frequently engages in integrated resource plan (IRP’s) processes throughout the southeast, including the Tennessee Valley Authority’s (TVA) 2015 IRP and 2019 IRP. In both efforts, SREA filed comments noting significant deficiencies in both plans that would hamper renewable energy development to the detriment to TVA customers, like Memphis Light, Gas & Water (MLGW). SREA’s recommendations were not implemented in either IRP, and TVA has failed to accomplish major renewable energy development; development that its own IRPs show would reduce overall system costs and improve air quality. SREA commends MLGW for initiating its own IRP to evaluate its energy future. Siemens’ IRP analysis for MLGW corrected a number of deficiencies found in TVA’s IRP and evaluated broader solutions for MLGW to reduce overall costs. Siemens also provided a high level of transparency in cost assumptions, inputs, and methodologies – a level of transparency that TVA has absconded. The overwhelming conclusion of MLGW IRP is that renewable energy resources are the lowest-cost resources for Memphis. SREA would like to provide the following comments regarding MLGW’s IRP for consideration. TVA IS FAILING MLGW MLGW is 100% dependent on TVA for all its energy decisions. Without TVA’s approval, MLGW is prohibited from engaging the free market and encouraging competition among energy providers. Similarly, whatever environmental or economic goals MLGW may wish to implement are all entirely
1 Lazard (November 2019). Lazard's Levelized Cost of Energy Analysis - Version 13.0. [https://www.lazard.com/media/451086/lazards-levelized-cost-of-energy-version-130-vf.pdf] 2 Clean Technica (July 27, 2017). USA’s Largest & World’s Second-Largest Onshore Wind Farm (2 Gigawatt Farm) To Be Built In Oklahoma. [https://cleantechnica.com/2017/07/27/invenergy-ge-team-2-gw-worlds-second-largest-us-largest-onshore-wind-farm/] 3 Greentech Media (August 31, 2016). New $3.6B Project in Iowa Could Be One of Many ‘Mega’ Wind Orders [https://www.greentechmedia.com/articles/read/iowas-new-3.6b-wind-project-could-be-one-of-many-mega-wind-orders] 4 Georgia Public Service Commission (July 16, 2019). Commission adds 2,210 MW of renewable energy in Georgia Power 2019 Integrated Resources Plan. [https://psc.ga.gov/site/assets/files/4279/media_advisory_for_7-16-19_gpc_irp_for_web.pdf] 5 Solar Energy Industries Association (2020). North Carolina Solar. [https://www.seia.org/state-solar-policy/north-carolina-solar] 6 American Wind Energy Association (June 11, 2020). Wind Powers American Business Report [https://www.awea.org/resources/publications-and-reports/corporate-purchasers-market-reports/wind-powers-american-business]

3/17
contingent on TVA’s nod of approval. As such, TVA has the highest responsibility to conduct fair and accurate analysis for MLGW and all other local power companies. TVA has failed to fulfill its responsibility to MLGW. As mentioned previously, SREA was heavily involved in TVA’s 2015 IRP and 2019 IRP. In both processes, SREA found significant deficiencies that hampered renewable energy development. TVA did not adequately address these deficiencies. TVA’s 2015 IRP indicated a significant need for both wind and solar energy resources in the early 2020’s; however, that need has gone unfulfilled. Perhaps the most high-profile failure of TVA’s lack of renewable energy vision was the Clean Line Plains and Eastern high voltage direct current transmission project. That project would have intertied directly into the Shelby County substation and provide up to 3,500 megawatts of low cost, high value wind energy and solar energy resources from western Oklahoma.7 TVA’s failure was so spectacular that senior energy reporter for the Wall Street Journal, and award-winning investigative journalist Russell Gold, wrote a book chronicling the failure. In Superpower: One Man's Quest to Transform American Energy. Gold writes,
“In early 2017, TVA opened a state-of-the-art $1 billion Paradise Fossil Plant in Muhlenberg County, Kentucky, running General Electric’s newest, most efficient gas turbines…it used about $20 worth of natural gas for every megawatt hour of electricity. That didn’t include debt payments on the $1 billion price tag or labor or maintenance….Still, TVA passed on Clean Line’s latest proposal.”…“Invenergy and Clean Line sent the new terms on February 2, 2017…the companies were offering to sell TVA electricity at the ‘extremely compelling price’ of $18.50 per megawatt hour…”8
Gold writes that TVA management never provided the TVA board with the updated contract prices from Clean Line, a fact corroborated by TVA board members.9 Gold further writes that,
“[TVA CEO Bill] Johnson said its analysis showed that Clean Line didn’t save TVA any money…When I [Russel Gold] asked to see the analysis, he [Johnson] said that was impossible. I asked about what assumptions TVA made about future gas or coal prices. This too was a secret…The analysis was never shared with the board of directors – and there is no regulator that scrutinizes the TVA’s decisions.”10
After TVA’s 2015 IRP went unfulfilled, a portion of Clean Line’s Plains and Eastern wind project decoupled from the transmission project. That large wind project has now been approved by
7 Clean Line Energy Partners (August 2016). Plains & Eastern Clean Line Project Overview. [https://www.energy.gov/sites/prod/files/2016/10/f33/2.%20HVDC%20Panel%20-%20Michael%20Skelly%2C%20Clean%20Line%20Energy.pdf] 8 Russell Gold (2019). Superpower: One Man's Quest to Transform American Energy. [https://www.russellgold.net/superpower] Pgs. 241-245 9 Russell Gold (2019). Superpower: One Man's Quest to Transform American Energy. [https://www.russellgold.net/superpower] Pgs. 241-245 10 Russell Gold (2019). Superpower: One Man's Quest to Transform American Energy. [https://www.russellgold.net/superpower] Pgs. 241-245

4/17
regulators in Arkansas and Louisiana for delivery to the Southwestern Electric Power Company.11 In short, another electric utility acted on TVA’s failure. In 2019, TVA conducted another IRP. TVA’s draft 2019 IRP proposed effectively doing nothing for renewable energy by 2023. By 2028, TVA has just 5% renewable energy penetration, up from a current 3% penetration level. However, TVA touted its final IRP as leading to significant quantities of solar power, despite having no intention of actually implementing such a robust renewable energy portfolio.12 Recent actions by TVA to undermine local power companies’ ability to self-generate renewable energy strongly indicates that the upper management culture within TVA has not changed over the past five years.13 In short, MLGW currently has no ability to make its own decisions, and TVA has a notoriously bad history of neglecting renewable energy development. TVA’S FLEET IS OVERLY DEPENDENT ON EXPENSIVE COAL In 2019, the nonprofit organization Energy Innovation published a report entitled, “The Coal Cost Crossover: Economic Viability of Existing Coal Compared to New Local Wind and Solar Resources.” This report compared existing coal-fired power plants against local renewable energy resource opportunities. TVA’s natural gas and coal are all imported from out-of-state. The findings for TVA were stunning. Nearly all of TVA’s coal-fired power plants are operating at costs 25% or more than renewable energy options. By 2025, almost 9 gigawatts of Tennessee-based coal resources are substantially at risk of being over-priced compared to renewable alternatives.14 These results by an independent third-party corroborate Siemens’ IRP analysis for MLGW.
11 Renewables Now (May 28, 2020). SWEPCO gets Louisiana's nod for 810 MW wind buy, plans 200-MW solar RfP. [https://renewablesnow.com/news/swepco-gets-louisianas-nod-for-810-mw-wind-buy-plans-200-mw-solar-rfp-700472/] 12 Stephen Smith and Maggie Shober (September 19, 2019). TVA deceives the public and the press with misleading claim of solar commitment. Southern Alliance for Clean Energy. [https://cleanenergy.org/blog/tva-deceives-the-public-and-the-press-with-misleading-claim-of-solar-commitment/] 13 Daniel Tait (May 29, 2020). "TVA Cuts “Flexibility” Promises to Local Power Companies by 80%, Enters Into Questionable Contracts," Energy and Policy Institute. [https://www.energyandpolicy.org/tva-cuts-flexibility-promises-to-local-power-companies-by-80-enters-into-questionable-contracts/] 14 Energy Innovation and Vibrant Clean Energy (March 2019). “The Coal Cost Crossover: Economic Viability of Existing Coal Compared to New Local Wind and Solar Resources.” [https://energyinnovation.org/wp-content/uploads/2019/04/Coal-Cost-Crossover_Energy-Innovation_VCE_FINAL2.pdf]

5/17
Source: Energy Innovation 201915
CORPORATIONS DEMAND CLEAN ENERGY, TVA TURNS AWAY The American Wind Energy Association recently published a report showing many corporations are planning on achieving 100% renewable energy goals over the next five to ten years. AWEA noted this uptick in renewable energy procurement is particularly pronounced in areas that have a “wholesale electricity markets, retail choice, or green tariff program.”16 As a wholesale electricity market, MISO has enabled a number of corporate renewable energy deals. Corporation demand for renewable energy has been previously highlighted to TVA as an important component of attracting new businesses and keeping existing customers happy. Yet, TVA has dragged its feet. As Gold notes, “…Clean Line filled an appendix with letters of support from large corporations interested in expanding their operations in the TVA service area if they could purchase inexpensive renewable energy. Owens Corning…Mars, General Motors, Kellogg’s, Ikea…Facebook. Honda argued that TVA could play a role as a conduit for renewable energy to surrounding utilities…The letters and proposal were sent to Bill Johnson and executives at TVA, and filed away. They were never shown to board members.”17 Currently, MLGW is effectively prohibited from developing corporate renewable energy programs.
15 Energy Innovation and Vibrant Clean Energy (March 2019). “The Coal Cost Crossover: Economic Viability of Existing Coal Compared to New Local Wind and Solar Resources.” [https://energyinnovation.org/wp-content/uploads/2019/04/Coal-Cost-Crossover_Energy-Innovation_VCE_FINAL2.pdf] 16 American Wind Energy Association (June 11, 2020). Wind Powers American Business. [https://www.awea.org/Awea/media/Resources/Publications%20and%20Reports/Wind_Powers_American_Business.pdf] 17 Russell Gold (2019). Superpower: One Man's Quest to Transform American Energy. [https://www.russellgold.net/superpower] Pg. 233

6/17
MISO OFFERS ENERGY MARKET COMPETITION, RENEWABLE ENERGY MISO is a nonprofit organization designed to create a wholesale power market. It does not operate like a traditional electric utility – where power plants and power lines are all owned by one entity, like TVA. MISO is a market, much like Ebay, where buyers and sellers meet to make power deals. MISO owns no power plants and owns no transmission lines. MISO operates as the platform for companies to exchange business, scheduling power flows every minute of every day from Canada to Louisiana. Power plant owners bid power into an hourly auction and MISO sorts the power offers and then selects the lowest cost power resources every hour. This power market structure allows renewable energy resources to bid in a zero operational cost, ensuring wind and solar resources are always granted first access to the grid system. Utilities and corporate buyers of renewable energy resources have bilateral contracts signed with those renewable energy projects in the MISO footprint, guaranteeing an energy price across any hour of any day from those specific renewable energy projects. The Southern Renewable Energy Association is an official nonprofit stakeholder within MISO’s stakeholder sectors, specifically the Environmental/Other Sector. SREA has participated in many of MISO’s stakeholder venues, processes, and commenting opportunities. MISO recently indicated it anticipates its members are likely to achieve significant carbon reduction goals. MISO’s role is to ensure its members are coordinated and working together to reduce overall costs.18 In other words, MISO incorporates its members’ plans into its overall plan, not the other way around.
MISO TRANSMISSION EXPANSION PLAN FUTURES
Source: MISO 202019
18 Midcontinent Independent System Operator (April 27, 2020). MISO Futures Whitepaper. [https://cdn.misoenergy.org/20200427%20MTEP%20Futures%20Item%2002b%20Futures%20White%20Paper443656.pdf] 19 Midcontinent Independent System Operator (April 27, 2020). MISO Futures Whitepaper. [https://cdn.misoenergy.org/20200427%20MTEP%20Futures%20Item%2002b%20Futures%20White%20Paper443656.pdf]

7/17
MISO SOUTH HAS SIGNIFICANT RENEWABLE POTENTIAL MISO also conducts the generator interconnection (GI) process. Independent power producers that develop renewable energy projects file plans to MISO for evaluation in the GI process. MISO only evaluates a renewable energy project’s technical viability and makes recommendations on interconnection upgrades and required improvements to protect the grid. In its GI process, MISO is agnostic to renewable energy development and is only serving as an electrical engineering role. TVA also conducts its own GI process, but in addition to the technical review, TVA also conducts its own economic review. In effect, TVA holds all the cards whether a renewable energy project gets built. In MISO South alone, there are over 9,000 megawatts of renewable energy projects working their way through the GI process – projects ready and able to compete in a request for proposal from MLGW.20 If MLGW issues a request for proposals for renewable energy resources in any part of MISO, even more renewable energy projects would begin MISO GI process.
RENEWABLE ENERGY PROJECTS IN MISO’S GI QUEUE
Source: MISO 202021
20 Midcontinent Independent System Operator (2020). Generator Interconnection Queue - Active Projects Map. [https://api.misoenergy.org/PublicGiQueueMap/index.html] 21 Midcontinent Independent System Operator (2020). Generator Interconnection Queue - Active Projects Map. [https://api.misoenergy.org/PublicGiQueueMap/index.html]

8/17
RENEWABLE ENERGY PROJECTS IN MISO’S GI QUEUE, SOUTH (MEGAWATTS)
Battery Solar Wind
Arkansas 160 2,694 330
Louisiana 145 4,130
Mississippi 90 1,030 167
Texas 645
Source: MISO May 202022 REVIEW OF MLGW’S IRP SREA has reviewed and engaged with dozens of IRP’s throughout the southeast. Having had direct experience with some of the best and worst IRP’s in the region, Siemens and MLGW conducted a robust IRP analysis, and deserve accolades for such an effort. Collaboration with MISO also deserves praise for its foresight and independent verification efforts. MLGW’s IRP is one of the most robust and consequential in the southeast. On a cost-basis, all ten portfolios developed by Siemens are very similar. The lowest cost portfolios are Portfolio 5 ($14.5B NPVRR), Portfolio 9 ($14.5B NPVRR), Portfolio 10 ($14.6B NPVRR), and Portfolio 6 ($14.7B NPVRR). The highest cost portfolios are Portfolio 4 ($15.1B NPVRR), Portfolio 2 ($15.1B NPVRR), and Portfolio 3 ($15.2B NPVRR). However, the cost differential between the least expensive portfolio (Portfolio 5) and the most expensive (Portfolio 3) is just 5% over 20 years.
Source: MLGW IRP 2020
The two least cost options are Portfolios 5 and 9. Both are effectively the same, except Portfolio 9 moves gas CT construction ahead of schedule to meet reliability benchmarks. Compared to Portfolios 5/9, Portfolio 10 significantly curtails renewable energy development, adds natural gas resources, and relies more heavily on MISO market purchases.
22 Midcontinent Independent System Operator (May 2020). Generator Interconnection Queue - Active Projects Map. [https://api.misoenergy.org/PublicGiQueueMap/index.html]

9/17

10/17

11/17
Siemens used up-to-date information regarding wind energy and solar energy costs and performance levels and compared its cost assumptions to the National Renewable Energy Annual Technology Baseline (NREL ATB). The NREL ATB is an industry-standard data source for generation performance and cost data across various technology types. Siemens’ generation supply inputs are similar to inputs used by MISO in its Transmission Expansion Planning (MTEP) process. TVA’s IRP did not use NREL’s ATB, and instead relied on outdated renewable energy cost assumptions. SREA provided significant comments to TVA regarding its inaccurate data inputs, yet no changes were made to its IRP to reflect the updated data provided.23 This partially explains why MLGW’s IRP would show significant cost savings associated with adopting substantial quantities renewable energy resources, while TVA’s IRP shows relatively small amounts of renewable energy adoption. As part of MLGW’s IRP, MISO conducted its own assessment.24 MISO’s base capacity expansion plan added 1.6 GW of gas in MLGW, 1 GW of solar in MLGW, 0.5 GW of solar in Arkansas, and 0.2 GW of wind in Arkansas by 2025/2026. By 2036, the model would add another 0.6 GW of solar in Arkansas, and another 150 MW of wind in Arkansas. MLGW would receive approximately 75% of its energy from renewable energy resources. ENERGY STORAGE MODELING IMPROVEMENTS ARE NEEDED Based on the MLGW IRP results, it appears energy storage resources are not being adequately evaluated in the various model scenarios. Due to the newness of energy storage, IRP modeling software programs are often unable to adequately evaluate the full range of value associated with energy storage. This is an industry-wide problem, and not one specific to Siemens or its use of the Aurora modeling software program. Software programs such as PROMOD, Plexos, and Aurora all have individual strengths and weaknesses regarding energy storage modeling. For example, the Aurora program used by Siemens only evaluated hourly power flows; missing the sub-hour flexibility of energy
23 Southern Renewable Energy Association (Spring 2019). Comments on TVA's Draft 2019 IRP. [https://www.southernrenewable.org/uploads/1/9/8/9/19892499/f-srea_comments_tva_draft_2019_irp.pdf] 24 Midcontinent Independent System Operator (May 29, 2020). Memphis Light, Gas and Water (MLGW) Power Supply Advisory Team Meeting. [http://www.mlgw.com/images/content/files/pdf/PSAT_Meeting%20Presentation_05292020_FINAL.pdf]
12/17
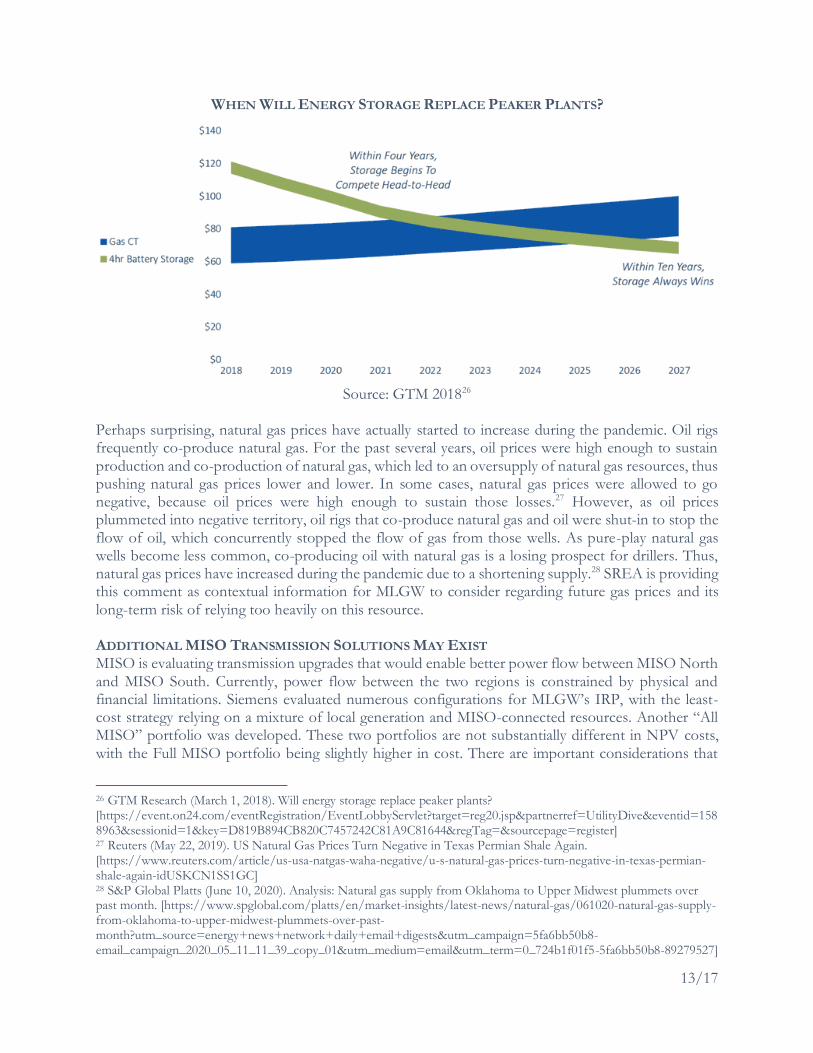
storage. Thus, no firm conclusions regarding energy storage can or should be based on MLGW’s IRP results at this time. On June 4, 2020, MLGW and Siemens hosted a community meeting regarding the draft IRP. Energy storage issues were discussed. The Siemens team indicated that energy storage devices were charged during the day and discharged at night25, which seems at odds with traditional power pricing in the MISO market. If storage devices were modeled in a fixed charge/discharge schedule, that would impact the ability of those devices to maximize revenue. Again, this can be a legacy problem associated with IRP software programs. Further, forecasting energy storage value has limited data. Forecasting energy arbitrage (charging batteries when energy locational marginal prices are low, and discharging when energy prices are high), and even capacity value might have some veracity; however, energy storage resources also provide substantial ancillary services that are frequently ignored in IRP modeling, such as frequency and voltage support, ramp up and down, and synthetic inertia. Even if these ancillary services were accounted for in IRP modeling software, little forecasting data exist to account for the value of those services. In effect, energy storage can provide value that is unaccounted for in IRP modeling. MISO is working to develop some of these ancillary market products, but very little clarity exists at this time to create conclusive forecasts. MLGW would need to work with its contractors and partners to create a framework to properly evaluate the full value stack of energy storage devices, to ensure that MLGW is not unintentionally missing opportunities. CONSIDER MODELING NATURAL GAS AS A SHORT-TERM RESOURCE At a presentation given by GTM Research in 2018, cost forecasts for energy storage showed that within ten years, energy storage would always be the cheaper option compared to new combustion turbine gas units. Given that energy storage prices are plummeting at an increasingly rapid pace, new-build natural gas units may not have the traditional 30-40 year life expectancies that most utilities traditionally assume. Instead, as a sensitivity, natural gas power plants should be modeled in IRP’s as a 10-year asset.
25 Siemens (June 4, 2020). Community Meeting. [https://youtu.be/oOQHkJ7RhuE?t=6026]
13/17
WHEN WILL ENERGY STORAGE REPLACE PEAKER PLANTS?
Source: GTM 201826
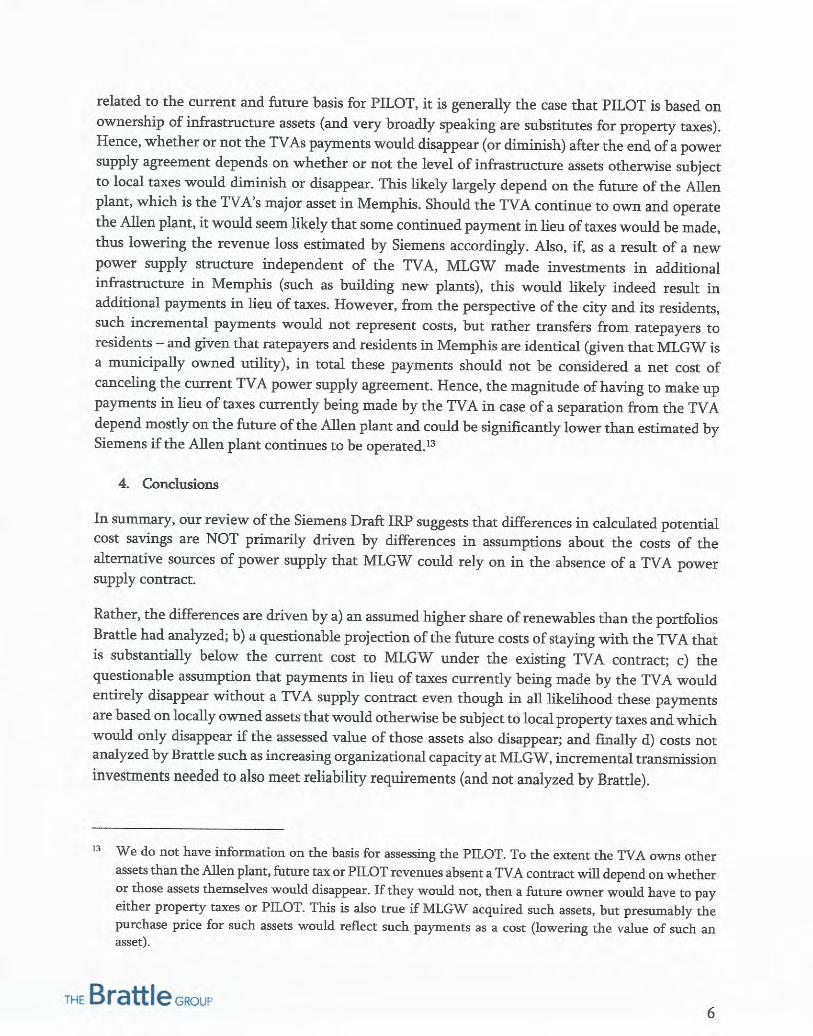
Perhaps surprising, natural gas prices have actually started to increase during the pandemic. Oil rigs frequently co-produce natural gas. For the past several years, oil prices were high enough to sustain production and co-production of natural gas, which led to an oversupply of natural gas resources, thus pushing natural gas prices lower and lower. In some cases, natural gas prices were allowed to go negative, because oil prices were high enough to sustain those losses.27 However, as oil prices plummeted into negative territory, oil rigs that co-produce natural gas and oil were shut-in to stop the flow of oil, which concurrently stopped the flow of gas from those wells. As pure-play natural gas wells become less common, co-producing oil with natural gas is a losing prospect for drillers. Thus, natural gas prices have increased during the pandemic due to a shortening supply.28 SREA is providing this comment as contextual information for MLGW to consider regarding future gas prices and its long-term risk of relying too heavily on this resource. ADDITIONAL MISO TRANSMISSION SOLUTIONS MAY EXIST MISO is evaluating transmission upgrades that would enable better power flow between MISO North and MISO South. Currently, power flow between the two regions is constrained by physical and financial limitations. Siemens evaluated numerous configurations for MLGW’s IRP, with the least-cost strategy relying on a mixture of local generation and MISO-connected resources. Another “All MISO” portfolio was developed. These two portfolios are not substantially different in NPV costs, with the Full MISO portfolio being slightly higher in cost. There are important considerations that
26 GTM Research (March 1, 2018). Will energy storage replace peaker plants? [https://event.on24.com/eventRegistration/EventLobbyServlet?target=reg20.jsp&partnerref=UtilityDive&eventid=1588963&sessionid=1&key=D819B894CB820C7457242C81A9C81644®Tag=&sourcepage=register] 27 Reuters (May 22, 2019). US Natural Gas Prices Turn Negative in Texas Permian Shale Again. [https://www.reuters.com/article/us-usa-natgas-waha-negative/u-s-natural-gas-prices-turn-negative-in-texas-permian-shale-again-idUSKCN1SS1GC] 28 S&P Global Platts (June 10, 2020). Analysis: Natural gas supply from Oklahoma to Upper Midwest plummets over past month. [https://www.spglobal.com/platts/en/market-insights/latest-news/natural-gas/061020-natural-gas-supply-from-oklahoma-to-upper-midwest-plummets-over-past-month?utm_source=energy+news+network+daily+email+digests&utm_campaign=5fa6bb50b8-email_campaign_2020_05_11_11_39_copy_01&utm_medium=email&utm_term=0_724b1f01f5-5fa6bb50b8-89279527]

14/17
Siemens and MLGW may have not accounted for in the Full MISO portfolio that could reduce the costs, and risks, associated with that option. For example, the MLGW IRP suggests building 950-1,824 MW’s of new natural gas generation, either locally, or elsewhere in MISO South. Better connection with MISO North may enable MLGW access to a more diversified portfolio of market opportunities, and already-existing generation at a lower cost than self-building new generation; avoiding the construction of new 30+ year natural gas assets. Accessing shorter-term and lower-cost resources from MISO North would avoid risks associated with large capital expenditures of potentially stranded natural gas assets in the very near future. Both Portfolio 9 and Full MISO require some significant transmission upgrades to adequately connect Memphis to the MISO system. However, there may be cost allocation savings to the Memphis system if those more significant transmission upgrades also align with MISO’s goal of better connecting MISO North and MISO South. In June 2019, the Organization of MISO States Board of Directors approved a list of principles for long-range transmission planning. Principle 3 states, “The long-range planning must develop and assess cost-effective solutions to known physical and contractual system constraints, including the Regional Directional Transfer Limit (i.e. the north-south constraint).”29 The MISO North/South seam has been a problem for MISO for a number of years, and some top solutions are estimated to cost the MISO system $152-$262 million. MISO’s cost allocation methodology shares transmission costs among benefiting entities based on a cost benefit analysis and a “beneficiary pays” principle. Principle 7 states, “Cost allocation, based on beneficiary pays, is a critical and necessary aspect of long-range transmission planning and development.” Memphis’ joining the system could lead to a more robust connection between the North and South, reducing the cost to MISO members to upgrade that seam and reducing the transmission costs for Memphis to interconnect to MISO, while enabling Memphis better access to market power beyond Arkansas.
29 Organization of MISO States (June 13, 2019). Organization of MISO States Statement of Principles re Long-Range Transmission Planning. [https://www.misostates.org/images/20190613_Long-Range_Transmission_Planning_Principles_-_Approved__Combined.pdf]

15/17
Source: MISO 201930
POTENTIAL MISO NORTH/SOUTH INTERTIE SOLUTIONS
New Transmission Solution Rating (MVA) Cost (2019-$M) 20-yr B/C ratio aggregate
Jim Hill – Berntie 345kV 2574 152 2.04
Jim Hill – Lutesville 345kV 2574 249 1.16
Jim Hill – Kelso 345kV Jim Hill – Berntie 161kV
2302 262 1.10
Joppa – Sans Souci 500kV* 2229 542 0.73
Joppa – W. Memphis 500kV* 2229 738 0.53
Source: MISO 202031, *MISO 201932 Three new transmission projects would be required to integrate Memphis into the MISO system, including a 500kV line from San Souci to Shelby, a 500kV line from West Memphis to New Allen, and a 230kV line from Twinkletown to New Allen. Siemens estimated these transmission upgrades, stating “Therefore, the total estimated transmission capital expenditure is approximately $696.5 million, or $2.11/MWh of 2025-2039 NPV assuming 30-year repayment schedule for the Base
30 Midcontinent Independent System Operator (July 25, 2019). MTEP19 Market Congestion Planning Study (MCPS) Screening Results for the North-South Constraint Focus Area, MCPS TSTF. [https://cdn.misoenergy.org/20190725%20MCPS%20TSTF%20Item%2002c%20MTEP19%20North-South%20Screening%20Results_reposted366407.pdf] 31 Midcontinent Independent System Operator (May 27, 2020). MTEP19 MCPS NorthSouth Interface Focus Area Conclusions. [https://cdn.misoenergy.org/20200527%20MCPS%20TSTF%20Item%2003%20North-South%20Interface448455.pdf] 32 Midcontinent Independent System Operator (July 25, 2019). MTEP19 Market Congestion Planning Study (MCPS) Screening Results for the North-South Constraint Focus Area, MCPS TSTF. [https://cdn.misoenergy.org/20190725%20MCPS%20TSTF%20Item%2002c%20MTEP19%20North-South%20Screening%20Results_reposted366407.pdf]
16/17
Strategy 3 investments.”33 Transmission projects tend to be 40+ year assets, lowering the overall annualized cost. For a Full MISO portfolio, Siemens added another transmission project, a 500kV line between Dell-MISO to Shelby-MLGW with two new transformers. Estimated cost for this upgrade would be $248.3 million, a cost fully allocated to MLGW by Siemens’ analysis.34 In short, if MISO and MLGW conducted another study, and included assumptions regarding regional cost allocation, a MISO North/South intertie solution may be highly valuable to both MLGW and MISO. Memphis’ interconnection with MISO, if also tied to improving the North/South seam, would be mutually beneficial for MLGW and MISO. Previously, MISO has studied improving its North/South seam with several different options, including improved connection with to the Sans Souci substation – the same substation identified by Siemens as a key interconnection point for MLGW. MISO’s analyses have previously shown a more robust transmission solution between Joppa (southern Illinois) directly to West Memphis; however, those solutions did not result in a net cost benefit – potentially because those solutions did not incorporate the likelihood of Memphis paying for a portion of those transmission projects. Similarly, the Siemens IRP analysis likely did not evaluate this more robust Joppa to West Memphis costs as being cost-shared with MISO. Because other MISO stakeholders would see cost savings associated with the Joppa to West Memphis project, those other entities would also pay to construct the project – a cost savings not considered by Siemens. Robust study by MISO and MLGW would be necessary to evaluate this opportunity. HVDC options should also be evaluated for interconnection purposes. Smaller and shorter-distance transmission projects do not suit HVDC use; however, linking together several smaller projects together into an individual larger project would make HVDC options more economically feasible. MISO stakeholders35 have noted limitations in MISO’s transmission expansion planning software and modeling problems that do not adequately evaluate HVDC options, limitations that potentially apply to MLGW’s IRP.
33 Siemens (May 29, 2020). Transmission Assessment for MLGW IRP. [http://www.mlgw.com/images/content/files/pdf/Siemens%20PTI%20RPT%20MLGW%20IRP%2020200529_web%202%20of%203.pdf] 34 Siemens (May 29, 2020). Transmission Assessment for MLGW IRP. [http://www.mlgw.com/images/content/files/pdf/Siemens%20PTI%20RPT%20MLGW%20IRP%2020200529_web%202%20of%203.pdf] 35 Midcontinent Independent System Operator (February 24, 2020). Feedback was received for: MCPS: N-S Focus Area Robustness Testing (20200128). https://cdn.misoenergy.org/20200527%20Stakeholder%20Comments%20on%20N-S%20Constraint447983.pdf

17/17
RECOMMENDATIONS MLGW’s IRP suggests that the best performing portfolios may save approximately $1.5 billion over 20 years, compared to staying with TVA while delivering a cleaner, more consumer-friendly energy mix. The best performing portfolios have substantial renewable energy resources developed, reducing costs, creating jobs, and improving climate metrics. In order to ground-truth the results of its IRP, MLGW should immediately begin the development and issuance of an all source request for proposals (RFP). All source RFP’s are now industry standard in the utility industry and enable utilities to accurately compare various proposals across numerous metrics.36 SREA recommends issuing a draft RFP for comment prior to issuing the final RFP, which would enable stakeholders to provide recommendations on improvement. MLGW may wish to issue several rounds of RFPs to allow new projects enough time to enter into the MISO queue and subsequently file a proposal with follow-on RFP rounds. MLGW should also re-engage with MISO to evaluate the North/South seam issue as a new potential path for energy and capacity resources. SREA commends MLGW and Siemens on its IRP and we are available to assist in any way possible.
36 John Wilson, Mike O'Boyle, Ron Lehr, Mark Detsky (April 2020). Making the Most of the Power Plant Market: Best Practices for All-Source Electric Generation Procurement. [https://energyinnovation.org/wp-content/uploads/2020/04/All-Source-Utility-Electricity-Generation-Procurement-Best-Practices.pdf]
Related Documents