Public Health Monograph Series No. 9 ISSN 1173-6844 WEIGHTING THE 81, 86, 91 & 96 CENSUS-MORTALITY COHORTS TO ADJUST FOR LINKAGE BIAS NZCMS Technical Report No. 5 Jackie Fawcett Tony Blakely June Atkinson October 2002 Department of Public Health, Wellington School of Medicine and Health Sciences ISBN 0-473-09112-7 ISBN: 0-473-09116-X (electronic)

Welcome message from author
This document is posted to help you gain knowledge. Please leave a comment to let me know what you think about it! Share it to your friends and learn new things together.
Transcript

Public Health Monograph Series
No. 9
ISSN 1173-6844
WEIGHTING THE 81, 86, 91 & 96CENSUS-MORTALITY
COHORTS TO ADJUST FORLINKAGE BIAS
NZCMS Technical Report No. 5
Jackie Fawcett
Tony Blakely
June Atkinson
October 2002
Department of Public Health, Wellington School of Medicine and Health Sciences
ISBN 0-473-09112-7 ISBN: 0-473-09116-X (electronic)
CopyrightAll rights reserved. No part of this publication may be reproduced, stored in a retrievalsystem, or transmitted, in any form or by any means, electronic, mechanical,photocopying, recording, or otherwise, without the prior permission of the authors.
Published by the Department of Public HealthWellington School of Medicine and Health SciencesPO Box 7343Wellington SouthWellingtonNew Zealand
ISBN 0-473-09112-7 ISBN: 0-473-09116-X (electronic)

Weighting for linkage bias, 81, 86, 91 and 96
Fawcett et al, 2002 1
TABLE OF CONTENTS
Statistic New Zealand’s Security Statement................................................................... 5Chapter 1 : Introduction .................................................................................................. 8Chapter 2 : Linkage by social and demographic variables......................................... 10Chapter 3 : Methods ....................................................................................................... 21
3.1 Summary ........................................................................................................... 213.2 Derivation of the linkage weighting values ...................................................... 23
3.2.1 Stratification of the data by demographic variables ..................................... 233.3 Weighting of non-linked census records........................................................... 28
Chapter 4 : Validation of weighting .............................................................................. 314.1 Correcting for linkage bias by sex and age....................................................... 314.2 Comparison of weighted number of Maori and Pacific deaths on the censuscohorts with the numbers predicted by the numerator-denominator bias adjustmentratios 31
4.2.1 Sole ethnicity ................................................................................................ 334.2.2 Prioritised ethnicity....................................................................................... 38
4.3 Correcting for linkage bias by socioeconomic status ....................................... 414.4 Correcting for linkage bias – Summary ............................................................ 45
Chapter 5 : Limitations of the weighting and conclusions.......................................... 46REFERENCES................................................................................................................ 47APPENDIX...................................................................................................................... 48
5.1 SAS code for stratification of mortality records ............................................... 825.1.1 1981-1984 Weighting strata.......................................................................... 825.1.2 1986-1989 Weighting strata.......................................................................... 855.1.3 1991-1994 Weighting strata.......................................................................... 885.1.4 1996-1996 Weighting Strata ......................................................................... 92

Weighting for linkage bias, 81, 86, 91 and 96
Fawcett et al, 2002 2
LIST OF TABLES
Table 1: 1981-1984 Number of deaths and percentage of mortality records linked to acensus record by various socioeconomic and demographic variables...................... 11
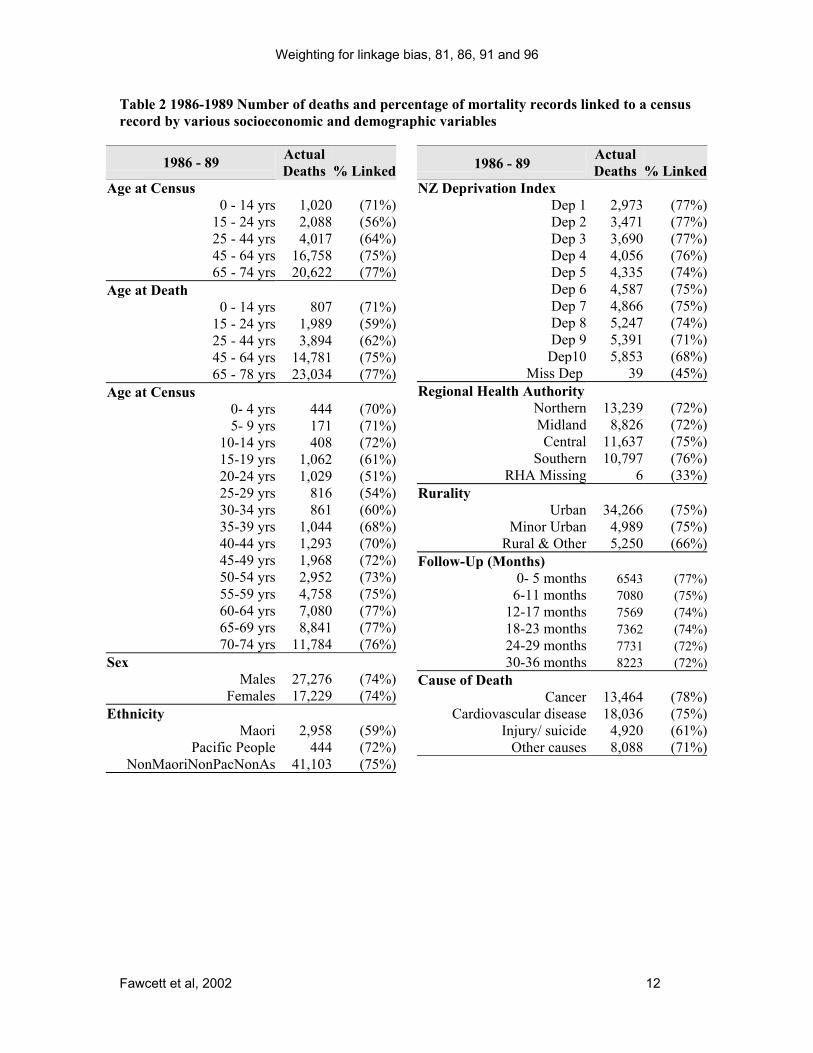
Table 2 1986-1989 Number of deaths and percentage of mortality records linked to acensus record by various socioeconomic and demographic variables...................... 12
Table 3 1991-1994 Number of deaths and percentage of mortality records linked to acensus record by various socioeconomic and demographic variables...................... 13
Table 4 1996-1999 Number of deaths and percentage of mortality records linked to acensus record by various socioeconomic and demographic variables...................... 14
Table 5 1981-1984 Number of deaths and percentage linked by strata of Age-at-Census,sex and Ethnicity....................................................................................................... 15
Table 6: 1986-1989 Number of deaths and percentage linked by strata of Age-at-Census,sex and Ethnicity....................................................................................................... 16
Table 7: 1991-1994 Number of deaths and percentage linked by strata of Age-at-Census,sex and Ethnicity....................................................................................................... 17
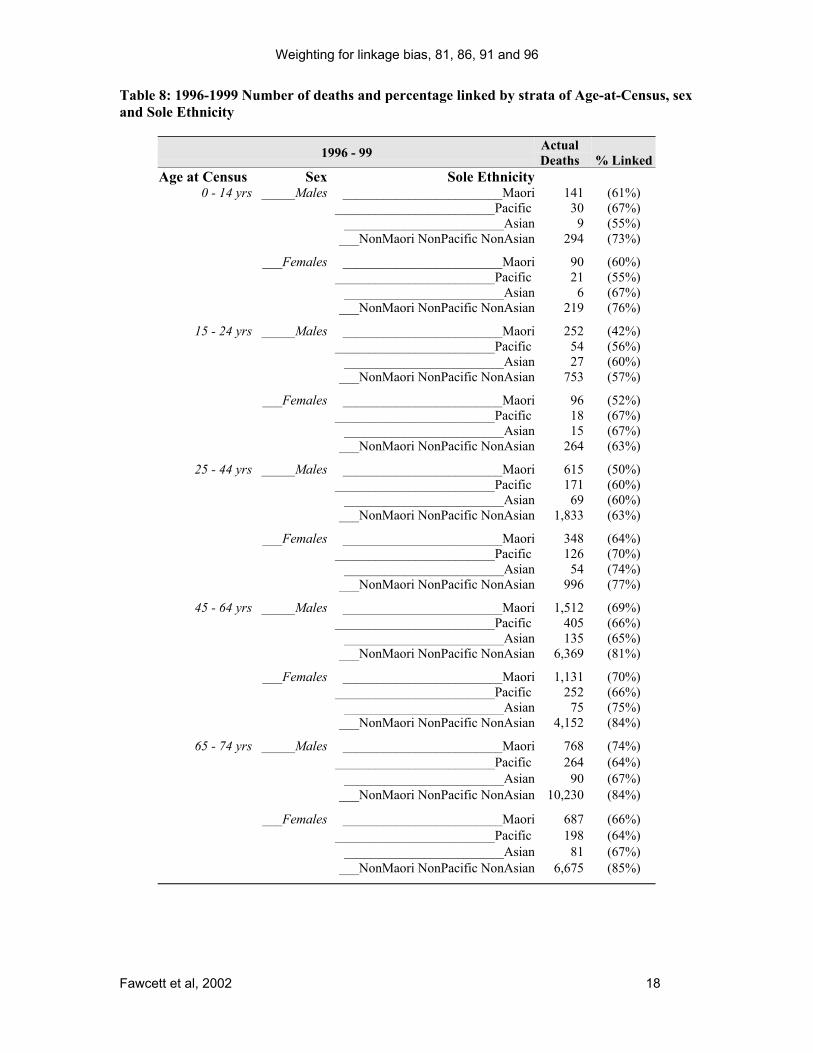
Table 8: 1996-1999 Number of deaths and percentage linked by strata of Age-at-Census,sex and Sole Ethnicity............................................................................................... 18
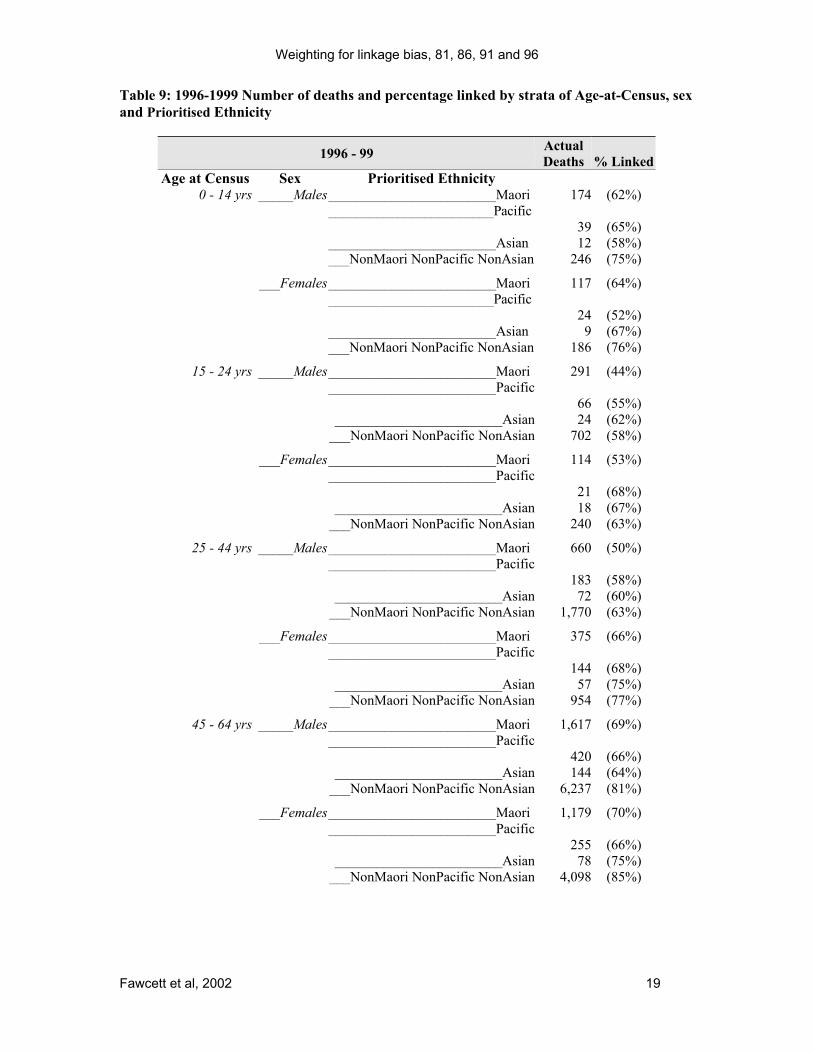
Table 9: 1996-1999 Number of deaths and percentage linked by strata of Age-at-Census,sex and Prioritised Ethnicity ....................................................................................... 19
Table 10 1981-1984 Weighted numbers of linked deaths and actual deaths on Bias data-set by age and sex ..................................................................................................... 26
Table 11 1986-1989 Weighted numbers of linked deaths and actual deaths on Bias data-set by age and sex ..................................................................................................... 26
Table 12 1991-1994 Weighted numbers of linked deaths and actual deaths on Bias data-set by age and sex ..................................................................................................... 27
Table 13 1996-1999 Weighted numbers of linked deaths and actual deaths on Bias data-set by age and sex ..................................................................................................... 27
Table 14 Mean weighting of unlinked census cohort members by sex, age and prioritisedethnicity. 1981 Census Cohort. ................................................................................. 30
Table 15 Comparison of number of weighted deaths on cohort data-set and number ofweighted deaths on the HPL data-set - 1981-1984 - by Age at Death Sex andEthnicity.................................................................................................................... 33
Table 16 Comparison of number of weighted deaths on cohort data-set and number ofweighted deaths on the HPL data-set - 1986-1989 - by Age at Death Sex and SoleEthnicity.................................................................................................................... 34
Table 17 Comparison of number of weighted deaths on cohort data-set and number ofweighted deaths on the HPL data-set - 1991-1994 - by Age at Death Sex andEthnicity.................................................................................................................... 36
Table 18 Comparison of number of weighted deaths on cohort data-set and number ofweighted deaths on the HPL data-set 1996-1999 – by Age at Death Sex and SoleEthnicity.................................................................................................................... 37
Table 19 Comparison of number of weighted deaths on cohort data-set and number ofweighted deaths on the HPL data-set 1986-1989 – by Age at Death Sex andPrioritized Ethnicity .................................................................................................. 38

Weighting for linkage bias, 81, 86, 91 and 96
Fawcett et al, 2002 3
Table 20 Comparison of number of weighed deaths on cohort data-set and number ofweighted deaths on the HPL data-set 1991-1994 – by Age at Death, Sex andPrioritized Ethnicity .................................................................................................. 39
Table 21 Comparison of number of weighed deaths on cohort data-set and number ofweighted deaths on the HPL data-set 1996-1999 – by Age at Death, Sex andPrioritized Ethnicity .................................................................................................. 40
Table 22 Ethnicity Scaled Weight and Post-Hoc Adjustment for RR of linkage. ............ 43Table 23 1981-1984. Number of deaths and percentage of mortality records linked to a
census record by Detailed Cause of Death Categories ............................................. 48Table 24 1986-1989. Number of deaths and percentage of mortality records linked to a
census record by Detailed Cause of Death Categories ............................................. 48Table 25 1991-1994. Number of deaths and percentage of mortality records linked to a
census record by Detailed Cause of Death Categories ............................................. 49Table 26 1996-1999. Number of deaths and percentage of mortality records linked to a
census record by Detailed Cause of Death Categories ............................................. 49Table 27 1981-1984. Number of deaths and percentage of mortality records linked to a
census record by Territorial Local Authority............................................................ 50Table 28 1986-1989. Number of deaths and percentage of mortality records linked to a
census record by Territorial Local Authority............................................................ 51Table 29 1991-1994. Number of deaths and percentage of mortality records linked to a
census record by Territorial Local Authority............................................................ 52Table 30 1996-1999 . Number of deaths and percentage of mortality records linked to a
census record by Territorial Local Authority............................................................ 53Table 31 1981-1984 Number of deaths and percentage linked by strata of Age-at-Death,
sex and ethnicity ....................................................................................................... 54Table 32 1986-1989 Number of deaths and percentage linked by strata of Age-at-Death,
sex and ethnicity ....................................................................................................... 55Table 33 1991-1994 Number of deaths and percentage linked by strata of Age-at-Death,
sex and ethnicity ....................................................................................................... 56Table 34 1996-1999 Number of deaths and percentage linked by strata of Age-at-Death,
sex and Sole Ethnicity............................................................................................... 57Table 35 1996-1999 Number of deaths and percentage linked by strata of Age-at-Death,
sex and prioritized ethnicity...................................................................................... 59Table 36 Final Strata used for calculation weights for linkage bias – 1991-94................ 61Table 37: 1981-1984 Linked and total deaths compared to weighted numbers of linked
deaths by various sociodemographic variables......................................................... 64Table 38: 1986-1989 Linked and total deaths compared to weighted numbers of linked
deaths by various sociodemographic variables......................................................... 68Table 39 1991-1994 Linked and total deaths compared to weighted numbers of linked
deaths by various sociodemographic variables......................................................... 72Table 40 1996-1999 Linked and total deaths compared to weighted numbers of linked
deaths by various sociodemographic variables......................................................... 76Table 41 Odds Ratios for All Cause Mortality by Deciles of NZDep91, ages 25-64 yrs.
Comparison of unweighted and weighted ORs using the four different weights,1991-1994 . ............................................................................................................... 80

Weighting for linkage bias, 81, 86, 91 and 96
Fawcett et al, 2002 4
Table 42 Odds Ratios for Four Causes Mortality by Quintiles of NZDep91, ages 25-64yrs. Comparison of unweighted and weighted ORs using the four different weights................................................................................................................................... 81

Weighting for linkage bias, 81, 86, 91 and 96
Fawcett et al, 2002 5
Statistic New Zealand’s Security Statement
The New Zealand Census-Mortality Study was initiated by Dr Tony Blakely and his co-
researchers from the Wellington School of Medicine, University of Otago. It was approved
by the Government Statistician as a Data Laboratory project under the Microdata Access
Protocols.
Requirements of the Statistics Act
Under the Statistics Act 1975 the Government Statistician has legal authority to collect and
hold information about people, households and businesses, as well as the responsibility of
protecting individual information and limits to the use to which such information can be put.
The obligations of the Statistics Act 1975 on data collected under the Act are summarised
below.
1. Information collected under the Statistics Act 1975 can be used only for statistical
purposes.
2. No information contained in any individual schedule is to be separately published or
disclosed to any person who is not an employee of Statistics New Zealand, except as
permitted by sections 21(3B), 37A, 37B and 37C of the Act.
3. This project was carried out under section 21(3B). Under Section 21(3B) the
Government Statistician requires an independent contractor under contract to Statistics New
Zealand, and any employee of the contractor, to make a statutory declaration of secrecy
similar to that required of Statistics New Zealand employees where they will have access to
information collected under the Act. For the purposes of implementing the confidentiality
provisions of the Act, such contractors are deemed to be employees of Statistics New
Zealand.

Weighting for linkage bias, 81, 86, 91 and 96
Fawcett et al, 2002 6
4. Statistical information published by Statistics New Zealand, and its contracted
researchers, shall be arranged in such a manner as to prevent any individual information from
being identifiable by any person (other than the person who supplied the information), unless
the person owning the information has consented to the publication in such manner, or the
publication of information in that manner could not reasonably have been foreseen.
5. The Government Statistician is to make office rules to prevent the unauthorised
disclosure of individual information in published statistics.
6. Information provided under the Act is privileged. Except for a prosecution under the
Act, no information that is provided under the Act can be disclosed or used in any
proceedings. Furthermore no person who has completed a statutory declaration of secrecy
under section 21 can be compelled in any proceedings to give oral testimony regarding
individual information or produce a document with respect to any information obtained in the
course of administering the Act, except as provided for in the Act.
Census data
The Population Census is the most important stocktake of the population that is carried out.
The statistics that are produced provide a regular picture of society. Results are used widely
in making decisions affecting every neighbourhood. They are used in planning essential local
services, and they also help to monitor social programmes ranging from housing to health.
Traditionally census data is published by Statistics New Zealand in aggregated tables and
graphs for use throughout schools, business and homes. Recently Statistics New Zealand has
sought to increase the benefits that can obtained from its data by providing access to approved
researchers to carry out research projects. Microdata access is provided, at the discretion of
the Government Statistician, to allow authoritative statistical research of benefit to the public
of New Zealand.

Weighting for linkage bias, 81, 86, 91 and 96
Fawcett et al, 2002 7
This project used anonymous census data and mortality data which were integrated using a
probabilistic linking methodology to create a single data-set that allows the researchers to
undertake a statistical study of the association of mortality and socio-economic factors. This
is the first time that the census has been linked to an administrative data-set for purposes apart
from improving the quality of Statistics New Zealand surveys. The project has been closely
monitored to ensure it complies with Statistics New Zealand's strict confidentiality
requirements.
Further information
For further information about confidentiality matters in regard to this study please contact
either:
Chief Analyst, Analytical Support Division, or
Project Manager, Data Laboratory
Statistics New Zealand
PO Box 2922
Wellington
Telephone: +64-4-931 4600
Facsimile: +64-4-931 4610

Weighting for linkage bias, 81, 86, 91 and 96
Fawcett et al, 2002 8
Chapter 1: IntroductionThis technical report describes the calculation of weighting factors to adjust for linkagebias in the New Zealand Census-Mortality Study (NZCMS). The NZCMS usedanonymous and probabilistic record linkage of census records with mortality records tocreate cohort studies of the entire New Zealand population. Each of four censuses (1981,1986, 1991 and 1996) is followed-up for three years for mortality. The census populationis restricted to 0-74 year olds at census night. Linkage bias (to be described in more detailsubsequently) occurs when the probability of a mortality record being linked back to acensus record varies by factors of interest (e.g. age, ethnicity, socio-economic position).
The methods for linking the census and mortality records are described in detailelsewhere (Blakely et al. 1999; Blakely 2001; Hill et al. 2002). The record linkageprocess was successful in linking approximately 75% of the eligible mortality recordsfrom three years after each census back to a census record. Incomplete linkage betweencensus and mortality files means that the vital status of some members of the censuscohort is misclassified as not dead when in reality they have died. Furthermore when themortality and census records were stratified by demographic characteristics (age, sex andethnicity), geographical distribution (rural/urban and Regional Health Authority),socioeconomic measures (NZ Deprivation Index) and time following census, theproportion of mortality records linked varied by strata (i.e. linkage bias). Consequentlymeasures of association between socioeconomic factors and mortality in the cohortanalyses using NZCMS data may be biased, as the linkage bias manifests as ‘differentialmisclassification bias of the mortality outcome’.
In order to compensate for linkage bias the records in each of the four cohort data-setshave been weighted. The weighting adjusts for misclassification of the mortalityoutcome in subsequent cohort analyses. The method used to calculate the weightingfactors is described in this document.
Previous extensive analyses of the 1991 census record linkage project demonstratedlinkage bias by (Blakely et al. 1999):
• Age: mortality records for youths (15-24 year olds) followed by young adults (25-44year olds) were the least likely to be linked to a census record
• Rurality: mortality records for rural decedents were less likely to be linked, almostcertainly a consequence of poorer quality meshblock data
• Ethnicity: mortality records for Maori and Pacific decedents were less likely to belinked than non-Maori non-Pacific
• Small area socio-economic deprivation: mortality records for decedents from moredeprived small areas were less likely to be linked than those from less deprived areas,although the amount of this bias was modest (5-10%) within strata of age by sex byethnic group (Blakely et al. 2000).

Weighting for linkage bias, 81, 86, 91 and 96
Fawcett et al, 2002 9
There was little linkage bias by sex, except among 25-44 year olds where males were lesslikely to be linked than females. There was also a definite trend for decreasing recordlinkage success with increasing time between census night and death in the 1991 censusrecord linkage project (Blakely et al. 1999). 79.3% of mortality records for deaths in thefirst six months after 1991 census were linked to a census record compared to 72.8% ofdeath in the last six months of the three-year follow-up. (As no detailed time-seriesanalyses within the three-year follow-up period was planned, we have not includedfollow-up period as a variable for calculating weights in this report).
Analyses of the 1991 cohort applied a post-hoc weighting to adjust for linkage bias in theodds ratio estimates for all cohort analyses (Blakely 2001). This involved adjusting theodds ratios (OR) associated with socioeconomic position by the risk ratio for linkage.(The odds ratio in the cohort analyses is a close approximation of the relative risk ofmortality due to death being a rare outcome. However, we directly calculated risk ratiosfor the linkage, as linkage was a very common outcome, meaning the odds ratios did notapproximate the risk ratio.) For example if the OR in cohort analyses for all causemortality was 1.5 for high compared to low deprivation areas, and the risk ratio (RR) forlinkage for all cause mortality for high compared to low deprivation was 0.91, then thelinkage adjusted odds ratio for low to high deprivation would be 1.5 / 0.91 = 1.65. Suchadjustment could only be done using socioeconomic variables available on the mortalitydata-set – that is occupational class and area based measures such as the NZ deprivationindex.
The weights described in this report avoid the need for post-hoc weighting to adjust for
linkage bias. Rather, using weighted analyses of NZCMS cohort data will mean that:
• absolute rates of mortality by strata of demographic and socio-economic factors
should be little affected by linkage bias
• both rate ratios and rate differences of mortality by demographic and socio-economic
factors should be little affected by linkage bias.

Weighting for linkage bias, 81, 86, 91 and 96
Fawcett et al, 2002 10
Chapter 2: Linkage by socialand demographic variables
The overall percentage of deaths linked for each cohort was 71% for 1981-84, 74% for1986-89, 77% for 1991-94, and 78% for 1996-99 (Hill et al. 2002).
The total number of deaths and proportion of mortality records linked by Sex, Age,Ethnicity, NZ Deprivation Index, Rurality, Regional Health Authority, Broad Cause ofDeath Categories and time lapsed after census for each of the four mortality data-sets areshown in Table 1 to Table 4. The total number of deaths and proportion of mortalityrecords linked by Territorial Local Authority and by detailed cause of death categoriesare given in Table 23 to Table 30 (pages 46-51) in the Appendix.
Table 5 to Table 9 give the proportion linked by combined strata of sex by age byethnicity. For 1996-1999 three tables are given using strata based on sole, prioritised andsole or multiple prioritised ethnicity. Equivalent tables for strata based on age at death(the above tables use age on census night) are included in the appendices Table 31 toTable 35.
These tables all show a lower rate of linkage for:
Maori, Pacific Island and Asian (1996 only) ethnic groups;
young adults aged 15-24 years;
death due to accidental injury and suicide;
people living in rural areas at the time of death;
people living in the Northern and Mid-Central Regional Health Authority areas;
for people living in areas with higher New Zealand Deprivation Index scores (i.e.living in more deprived small areas); and
increasing time lapsed since the census.
Much of the difference in linkage by geographical variables and New ZealandDeprivation Index was due to differences in population distribution by age, sex andethnicity. This finding is consistent with results reported for the 1991 census mortalitycohort (Blakely et al. 1999; Blakely et al. 2000; Blakely 2001). Rurality was however animportant independent risk factor for linkage (results not shown).

Weighting for linkage bias, 81, 86, 91 and 96
Fawcett et al, 2002 11
Table 1: 1981-1984 Number of deaths and percentage of mortality records linked to acensus record by various socioeconomic and demographic variables
1981 – 84 ActualDeaths % Linked
Age at Census0 - 14 yrs 1,092 (66%)
15 - 24 yrs 1,875 (52%)25 - 44 yrs 3,777 (62%)45 - 64 yrs 17,244 (72%)65 - 74 yrs 20,709 (73%)
Age at Death0 - 14 yrs 888 (68%)
15 - 24 yrs 1,878 (54%)25 - 44 yrs 3,528 (61%)45 - 64 yrs 15,459 (72%)65 - 78 yrs 22,950 (73%)
Age at Census 0- 4 yrs 492 (67%)5- 9 yrs 216 (64%)
10-14 yrs 387 (67%)15-19 yrs 1,029 (56%)20-24 yrs 849 (49%)25-29 yrs 684 (52%)30-34 yrs 813 (63%)35-39 yrs 912 (64%)40-44 yrs 1,368 (66%)45-49 yrs 1,989 (70%)50-54 yrs 3,252 (71%)55-59 yrs 5,232 (73%)60-64 yrs 6,774 (73%)65-69 yrs 9,603 (74%)70-74 yrs 11,103 (73%)
SexMales 27,570 (71%)
Females 17,130 (71%)Ethnicity
Maori 3,108 (53%)Pacific People 354 (59%)
NonMaori NonPacific 41,238 (73%)
1981 - 84 ActualDeaths % Linked
NZ Deprivation IndexDep 1 2,988 (77%)Dep 2 3,489 (71%)Dep 3 3,705 (72%)Dep 4 4,038 (72%)Dep 5 4,452 (71%)Dep 6 4,695 (72%)Dep 7 4,641 (71%)Dep 8 5,376 (70%)Dep 9 5,523 (71%)
Dep10 5,766 (68%)Miss Dep 30 (60%)
Regional Health AuthorityNorthern 12,819 (69%)Midland 8,844 (68%)Central 11,826 (73%)
Southern 11,208 (74%)RHA Missing 6 (60%)
RuralityUrban 34,275 (73%)
Minor Urban 4,956 (73%)Rural & Other 5,472 (57%)
Follow-Up (Months)0- 5 months 6,681 (74%)
6-11 months 6,900 (73%)12-17 months 7,566 (72%)18-23 months 7,314 (71%)24-29 months 8,103 (70%)30-36 months 8,139 (68%)
Cause of DeathCancer 12,732 (74%)
Cardiovascular disease 19,701 (73%)Injury/ suicide 4,332 (60%)
Other causes 7,935 (67%)
Weighting for linkage bias, 81, 86, 91 and 96
Fawcett et al, 2002 12
Table 2 1986-1989 Number of deaths and percentage of mortality records linked to a censusrecord by various socioeconomic and demographic variables
1986 - 89 ActualDeaths % Linked
Age at Census0 - 14 yrs 1,020 (71%)
15 - 24 yrs 2,088 (56%)25 - 44 yrs 4,017 (64%)45 - 64 yrs 16,758 (75%)65 - 74 yrs 20,622 (77%)
Age at Death0 - 14 yrs 807 (71%)
15 - 24 yrs 1,989 (59%)25 - 44 yrs 3,894 (62%)45 - 64 yrs 14,781 (75%)65 - 78 yrs 23,034 (77%)
Age at Census 0- 4 yrs 444 (70%)5- 9 yrs 171 (71%)
10-14 yrs 408 (72%)15-19 yrs 1,062 (61%)20-24 yrs 1,029 (51%)25-29 yrs 816 (54%)30-34 yrs 861 (60%)35-39 yrs 1,044 (68%)40-44 yrs 1,293 (70%)45-49 yrs 1,968 (72%)50-54 yrs 2,952 (73%)55-59 yrs 4,758 (75%)60-64 yrs 7,080 (77%)65-69 yrs 8,841 (77%)70-74 yrs 11,784 (76%)
SexMales 27,276 (74%)
Females 17,229 (74%)Ethnicity
Maori 2,958 (59%)Pacific People 444 (72%)
NonMaoriNonPacNonAs 41,103 (75%)
1986 - 89 ActualDeaths % Linked
NZ Deprivation Index Dep 1 2,973 (77%)Dep 2 3,471 (77%)Dep 3 3,690 (77%)Dep 4 4,056 (76%)Dep 5 4,335 (74%)Dep 6 4,587 (75%)Dep 7 4,866 (75%)Dep 8 5,247 (74%)Dep 9 5,391 (71%)
Dep10 5,853 (68%)Miss Dep 39 (45%)
Regional Health AuthorityNorthern 13,239 (72%)Midland 8,826 (72%)Central 11,637 (75%)
Southern 10,797 (76%)RHA Missing 6 (33%)
RuralityUrban 34,266 (75%)
Minor Urban 4,989 (75%)Rural & Other 5,250 (66%)
Follow-Up (Months)0- 5 months 6543 (77%)
6-11 months 7080 (75%)12-17 months 7569 (74%)18-23 months 7362 (74%)24-29 months 7731 (72%)30-36 months 8223 (72%)
Cause of DeathCancer 13,464 (78%)
Cardiovascular disease 18,036 (75%)Injury/ suicide 4,920 (61%)
Other causes 8,088 (71%)

Weighting for linkage bias, 81, 86, 91 and 96
Fawcett et al, 2002 13
Table 3 1991-1994 Number of deaths and percentage of mortality records linked to a censusrecord by various socioeconomic and demographic variables
1991 - 94 ActualDeaths % Linked
Age at Census0 - 14 yrs 831 (69%)
15 - 24 yrs 1,767 (54%)25 - 44 yrs 4,209 (65%)45 - 64 yrs 14,919 (78%)65 - 74 yrs 19,584 (81%)
Age at Death0 - 14 yrs 696 (69%)
15 - 24 yrs 1,695 (56%)25 - 44 yrs 3,939 (63%)45 - 64 yrs 13,218 (77%)65 - 78 yrs 21,762 (80%)
Age at Census 0- 4 yrs 387 (68%)5- 9 yrs 165 (72%)
10-14 yrs 282 (68%)15-19 yrs 903 (58%)20-24 yrs 864 (49%)25-29 yrs 804 (52%)30-34 yrs 861 (60%)35-39 yrs 1,083 (69%)40-44 yrs 1,461 (73%)45-49 yrs 1,881 (75%)50-54 yrs 2,787 (75%)55-59 yrs 3,924 (78%)60-64 yrs 6,327 (79%)65-69 yrs 8,889 (81%)70-74 yrs 10,698 (80%)
SexMales 25,224 (76%)
Females 16,089 (78%)Ethnicity
Maori 3,471 (62%)Pacific People 657 (57%)
NonMaoriNonPac 37,182 (78%)
1991 - 94 ActualDeaths % Linked
NZ Deprivation IndexDep 1 3,069 (82%)Dep 2 3,291 (79%)Dep 3 3,606 (80%)Dep 4 3,723 (78%)Dep 5 3,978 (78%)Dep 6 4,041 (78%)Dep 7 4,542 (76%)Dep 8 4,623 (76%)Dep 9 4,995 (75%)
Dep10 5,355 (70%)Miss Dep 84 (49%)
Regional Health AuthorityNorthern 12,375 (73%)Midland 8,766 (75%)Central 10,494 (79%)
Southern 9,618 (80%)Missing RHA 54 (33%)
RuralityUrban 31,122 (78%)
Minor Urban 4,977 (79%)Rural & Other 5,211 (68%)
Follow-Up (Months)0- 5 months 6060 (79%)
6-11 months 6495 (79%)12-17 months 7020 (78%)18-23 months 6867 (77%)24-29 months 7191 (74%)30-36 months 7674 (73%)
Cause of DeathCancer 13,959 (81%)
Cardiovascular disease 15,450 (78%)Injury/ suicide 4,377 (61%)
Other causes 7,524 (74%)

Weighting for linkage bias, 81, 86, 91 and 96
Fawcett et al, 2002 14
Table 4 1996-1999 Number of deaths and percentage of mortality records linked to a censusrecord by various socioeconomic and demographic variables
1996 - 99 ActualDeaths % Linked
Age at Census0 - 14 yrs 810 (69%)
15 - 24 yrs 1,482 (56%)25 - 44 yrs 4,209 (65%)45 - 64 yrs 14,031 (79%)65 - 74 yrs 18,996 (83%)
Age at Death0 - 14 yrs 645 (72%)
15 - 24 yrs 1,413 (57%)25 - 44 yrs 3,975 (63%)45 - 64 yrs 12,663 (78%)65 - 78 yrs 20,826 (83%)
Age at Census 0- 4 yrs 351 (71%)5- 9 yrs 141 (77%)
10-14 yrs 318 (64%)15-19 yrs 744 (59%)20-24 yrs 738 (52%)25-29 yrs 777 (52%)30-34 yrs 930 (61%)35-39 yrs 1,137 (69%)40-44 yrs 1,362 (71%)45-49 yrs 2,103 (76%)50-54 yrs 2,703 (77%)55-59 yrs 3,873 (79%)60-64 yrs 5,346 (81%)65-69 yrs 8,238 (83%)70-74 yrs 10,758 (83%)
SexMales 24,021 (77%)
Females 15,504 (80%)Sole Ethnicity
Maori 5,646 (65%)Pacific People 1,539 (64%)
Asian 561 (67%)NonMaori NonPacificNonAsian 31,782 (81%)
Prioritised EthnicityMaori 6,105 (65%)
Pacific People 1,638 (64%)Asian 597 (67%)
NonMaori NonPacificNonAsian 31,185 (82%)
1996 - 99 ActualDeaths % Linked
Sole & Multiple-Prioritised EthnicitySole Maori 5,643 (65%)
Multiple Maori 462 (66%)Sole Pacific 1,539 (64%)
Multiple Pacific 96 (63%)Sole Asian 561 (67%)
Multiple Asian 33 (71%)NonMaori
NonPacificNonAsian 31,185 (82%)NZ Deprivation Index
Dep 1 2,829 (81%)Dep 2 3,117 (82%)Dep 3 3,237 (80%)Dep 4 3,543 (81%)Dep 5 3,678 (81%)Dep 6 3,930 (79%)Dep 7 4,236 (78%)Dep 8 4,671 (78%)Dep 9 4,884 (76%)
Dep10 5,256 (72%)Miss Dep 147 (52%)
Regional Health AuthorityNorthern 12,045 (75%)Midland 8,586 (76%)Central 9,903 (79%)
Southern 8,877 (83%)missing RHA 114 (48%)
RuralityUrban 29,622 (79%)
Minor Urban 5,031 (79%)Rural & Other 4,872 (73%)
Follow-Up (Months)0- 5 months 6,105 (81%)
6-11 months 6,270 (80%)12-17 months 6,537 (78%)18-23 months 6,630 (78%)24-29 months 6,738 (77%)30-36 months 7,242 (76%)
Cause of DeathCancer 14,499 (82%)
Cardiovascular Diseases 12,888 (80%)Injury / Suicide 4,200 (61%)
Other Causes 7,938 (78%)

Weighting for linkage bias, 81, 86, 91 and 96
Fawcett et al, 2002 15
Table 5 1981-1984 Number of deaths and percentage linked by strata of Age-at-Census, sexand Ethnicity
1981 – 84 ActualDeaths
%Linked
Age at Census Sex Ethnicity_______________Maori 78 (63%)________Pacific People 15 (80%)
_____Males
__NonMaori NonPacific 570 (66%)
_______________Maori 54 (71%)________Pacific People 12 (71%)
0 - 14 yrs
___Females
__NonMaori NonPacific 360 (66%)
_______________Maori 162 (50%)________Pacific People 27 (35%)
_____Males
__NonMaori NonPacific 1,200 (53%)
_______________Maori 72 (47%)________Pacific People 15 (73%)
15 - 24 yrs
___Females
__NonMaori NonPacific 396 (52%)
_______________Maori 330 (51%)________Pacific People 48 (52%)
_____Males
__NonMaori NonPacific 1,950 (63%)
_______________Maori 231 (58%)________Pacific People 30 (57%)
25 - 44 yrs
___Females
__NonMaori NonPacific 1,194 (67%)
_______________Maori 816 (53%)________Pacific People 87 (63%)
_____Males
__NonMaori NonPacific 9,978 (74%)
_______________Maori 603 (58%)________Pacific People 45 (63%)
45 - 64 yrs
___Females
__NonMaori NonPacific 5,712 (75%)
_______________Maori 435 (48%)________Pacific People 48 (59%)
_____Males
__NonMaori NonPacific 11,826 (76%)
_______________Maori 324 (48%)________Pacific People 27 (54%)
65 - 74 yrs
___Females
__NonMaori NonPacific 8,049 (73%)

Weighting for linkage bias, 81, 86, 91 and 96
Fawcett et al, 2002 16
Table 6: 1986-1989 Number of deaths and percentage linked by strata of Age-at-Census, sexand Ethnicity
1986 – 89 ActualDeaths % Linked
Age at Census Sex Ethnicity_______________Maori 72 (71%)________Pacific People 18 (77%)
_____Males
__NonMaori NonPacific 525 (70%)
_______________Maori 45 (61%)________Pacific People 18 (75%)
0 - 14 yrs
___Females
__NonMaori NonPacific 345 (73%)
_______________Maori 162 (50%)________Pacific People 21 (50%)
_____Males
__NonMaori NonPacific 1,386 (58%)
_______________Maori 66 (45%)________Pacific People 15 (73%)
15 - 24 yrs
___Females
__NonMaori NonPacific 438 (53%)
_______________Maori 294 (51%)________Pacific People 72 (70%)
_____Males
__NonMaori NonPacific 2,196 (63%)
_______________Maori 171 (60%)________Pacific People 39 (76%)
25 - 44 yrs
___Females
__NonMaori NonPacific 1,245 (69%)
_______________Maori 807 (63%)________Pacific People 108 (74%)
_____Males
__NonMaori NonPacific 9,588 (76%)
_______________Maori 621 (64%)________Pacific People 54 (85%)
45 - 64 yrs
___Females
__NonMaori NonPacific 5,580 (77%)
_______________Maori 393 (58%)________Pacific People 63 (66%)
_____Males
__NonMaori NonPacific 11,577 (78%)
_______________Maori 324 (56%)________Pacific People 45 (66%)
65 - 74 yrs
___Females
__NonMaori NonPacific 8,226 (76%)

Weighting for linkage bias, 81, 86, 91 and 96
Fawcett et al, 2002 17
Table 7: 1991-1994 Number of deaths and percentage linked by strata of Age-at-Census, sexand Ethnicity
1991 – 94 ActualDeaths % Linked
Age at Census Sex Ethnicity_______________Maori 57 (59%)________Pacific People 30 (63%)
_____Males
__NonMaori NonPacific 411 (70%)
_______________Maori 39 (63%)________Pacific People 15 (73%)
0 - 14 yrs
___Females
__NonMaori NonPacific 279 (70%)
_______________Maori 162 (50%)________Pacific People 30 (33%)
_____Males
__NonMaori NonPacific 1,143 (53%)
_______________Maori 45 (59%)________Pacific People 15 (73%)
15 - 24 yrs
___Females
__NonMaori NonPacific 369 (58%)
_______________Maori 366 (52%)________Pacific People 75 (47%)
_____Males
__NonMaori NonPacific 2,229 (63%)
_______________Maori 216 (62%)________Pacific People 45 (51%)
25 - 44 yrs
___Females
__NonMaori NonPacific 1,278 (74%)
_______________Maori 957 (63%)________Pacific People 171 (66%)
_____Males
__NonMaori NonPacific 8,034 (79%)
_______________Maori 759 (70%)________Pacific People 102 (56%)
45 - 64 yrs
___Females
__NonMaori NonPacific 4,899 (81%)
_______________Maori 495 (60%)________Pacific People 108 (52%)
_____Males
__NonMaori NonPacific 10,953 (83%)
_______________Maori 378 (60%)________Pacific People 66 (63%)
65 – 74 yrs
___Females
__NonMaori NonPacific 7,587 (81%)
Weighting for linkage bias, 81, 86, 91 and 96
Fawcett et al, 2002 18
Table 8: 1996-1999 Number of deaths and percentage linked by strata of Age-at-Census, sexand Sole Ethnicity
1996 - 99 ActualDeaths % Linked
Age at Census Sex Sole Ethnicity0 - 14 yrs _____Males ________________________Maori 141 (61%)
________________________Pacific 30 (67%)________________________Asian 9 (55%)
___NonMaori NonPacific NonAsian 294 (73%)
________________________Maori 90 (60%)________________________Pacific 21 (55%)
________________________Asian 6 (67%)___NonMaori NonPacific NonAsian 219 (76%)
___Females
________________________Maori 252 (42%)________________________Pacific 54 (56%)
________________________Asian 27 (60%)___NonMaori NonPacific NonAsian 753 (57%)
_____Males
________________________Maori 96 (52%)________________________Pacific 18 (67%)
________________________Asian 15 (67%)___NonMaori NonPacific NonAsian 264 (63%)
15 - 24 yrs
___Females
________________________Maori 615 (50%)________________________Pacific 171 (60%)
________________________Asian 69 (60%)___NonMaori NonPacific NonAsian 1,833 (63%)
_____Males
________________________Maori 348 (64%)________________________Pacific 126 (70%)
________________________Asian 54 (74%)___NonMaori NonPacific NonAsian 996 (77%)
25 - 44 yrs
___Females
________________________Maori 1,512 (69%)________________________Pacific 405 (66%)
________________________Asian 135 (65%)___NonMaori NonPacific NonAsian 6,369 (81%)
_____Males
________________________Maori 1,131 (70%)________________________Pacific 252 (66%)
________________________Asian 75 (75%)___NonMaori NonPacific NonAsian 4,152 (84%)
45 - 64 yrs
___Females
________________________Maori 768 (74%)________________________Pacific 264 (64%)
________________________Asian 90 (67%)___NonMaori NonPacific NonAsian 10,230 (84%)
_____Males
________________________Maori 687 (66%)________________________Pacific 198 (64%)
________________________Asian 81 (67%)___NonMaori NonPacific NonAsian 6,675 (85%)
65 - 74 yrs
___Females
Weighting for linkage bias, 81, 86, 91 and 96
Fawcett et al, 2002 19
Table 9: 1996-1999 Number of deaths and percentage linked by strata of Age-at-Census, sexand Prioritised Ethnicity
1996 - 99 ActualDeaths % Linked
Age at Census Sex Prioritised Ethnicity0 - 14 yrs _____Males________________________Maori 174 (62%)
________________________Pacific 39 (65%)
________________________Asian 12 (58%)___NonMaori NonPacific NonAsian 246 (75%)
________________________Maori 117 (64%)________________________Pacific
24 (52%)________________________Asian 9 (67%)___NonMaori NonPacific NonAsian 186 (76%)
___Females
________________________Maori 291 (44%)________________________Pacific
66 (55%)________________________Asian 24 (62%)
___NonMaori NonPacific NonAsian 702 (58%)
_____Males
________________________Maori 114 (53%)________________________Pacific
21 (68%)________________________Asian 18 (67%)
___NonMaori NonPacific NonAsian 240 (63%)
15 - 24 yrs
___Females
________________________Maori 660 (50%)________________________Pacific
183 (58%)________________________Asian 72 (60%)
___NonMaori NonPacific NonAsian 1,770 (63%)
_____Males
________________________Maori 375 (66%)________________________Pacific
144 (68%)________________________Asian 57 (75%)
___NonMaori NonPacific NonAsian 954 (77%)
25 - 44 yrs
___Females
________________________Maori 1,617 (69%)________________________Pacific
420 (66%)________________________Asian 144 (64%)
___NonMaori NonPacific NonAsian 6,237 (81%)
_____Males
________________________Maori 1,179 (70%)________________________Pacific
255 (66%)________________________Asian 78 (75%)
___NonMaori NonPacific NonAsian 4,098 (85%)
45 - 64 yrs
___Females

Weighting for linkage bias, 81, 86, 91 and 96
Fawcett et al, 2002 20
1996 - 99 ActualDeaths % Linked
________________________Maori 840 (73%)________________________Pacific
279 (64%)________________________Asian 96 (66%)
___NonMaori NonPacific NonAsian 10,143 (85%)
_____Males
________________________Maori 738 (66%)________________________Pacific
204 (65%)________________________Asian 84 (69%)
___NonMaori NonPacific NonAsian 6,612 (85%)
65 - 74 yrs
___Females
Weighting for linkage bias, 81, 86, 91 and 96
Fawcett et al, 2002 21
Chapter 3: Methods
3.1 Summary
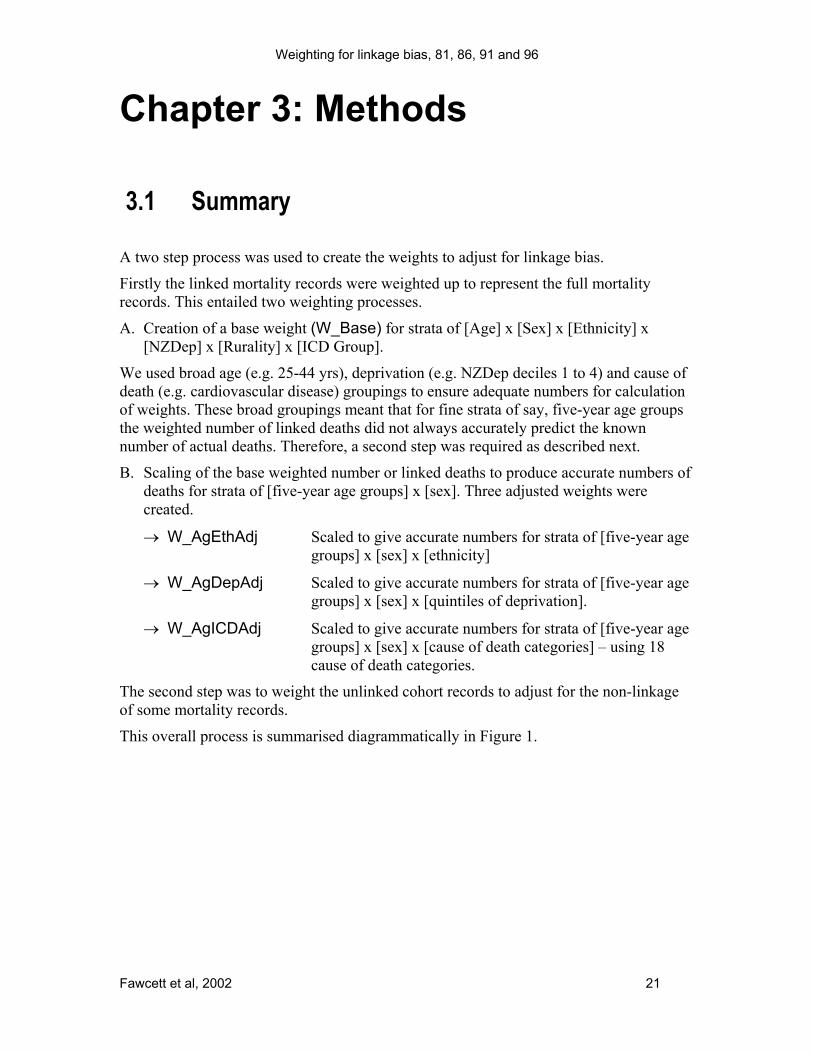
A two step process was used to create the weights to adjust for linkage bias.
Firstly the linked mortality records were weighted up to represent the full mortalityrecords. This entailed two weighting processes.
A. Creation of a base weight (W_Base) for strata of [Age] x [Sex] x [Ethnicity] x[NZDep] x [Rurality] x [ICD Group].
We used broad age (e.g. 25-44 yrs), deprivation (e.g. NZDep deciles 1 to 4) and cause ofdeath (e.g. cardiovascular disease) groupings to ensure adequate numbers for calculationof weights. These broad groupings meant that for fine strata of say, five-year age groupsthe weighted number of linked deaths did not always accurately predict the knownnumber of actual deaths. Therefore, a second step was required as described next.
B. Scaling of the base weighted number or linked deaths to produce accurate numbers ofdeaths for strata of [five-year age groups] x [sex]. Three adjusted weights werecreated.
→ W_AgEthAdj Scaled to give accurate numbers for strata of [five-year age groups] x [sex] x [ethnicity]
→ W_AgDepAdj Scaled to give accurate numbers for strata of [five-year age groups] x [sex] x [quintiles of deprivation].
→ W_AgICDAdj Scaled to give accurate numbers for strata of [five-year age groups] x [sex] x [cause of death categories] – using 18 cause of death categories.
The second step was to weight the unlinked cohort records to adjust for the non-linkageof some mortality records.
This overall process is summarised diagrammatically in Figure 1.

Weighting for linkage bias, 81, 86, 91 and 96
Fawcett et al, 2002 22
Figure 1 Diagrammatic summary of linkage weighting process
L inkage be tw een census and m ortality records
T ransfer of w eights from m ortality data-set to cohort da ta-set
W 1W 1
������������������������������������������������������������������������� �����������������������������������������������������������������������
A llm ortalityR ecords
������������������������������������������������� �����������������������������������������������
L in kedm ortalityrecords
������������������������������������������������� ������������������������ �����������������������������������������������
W eightedlink edcoh ort
records
������������������������������������������������������������������������������������������������������������������������� ������������������������������������������������������������ �����������������������������������������������������������������������������������������������������������������������
W eightedU nlinked
coh ortrecords
M ortality D ataset C ohort D ataset
L
W 1
������������������������������������������������������������������������������������������������������������������������������������������������
W eightedlink ed
m ortalityrecords
������������������������������������������������������������������������������������������������������������������������������������������������������������������������������������������������������������������������������������������������������������������������������������������������������������������������������������������������������������������������������������������������������������������������
U nlinkedcoh ort
records
������������������������������������������������������������������������������������������������
L in kedC oh ortrecords
������������������������������������������������������������������������������������������������������������������������
W eightedlink edcoh ort
records
�����������������������������������������������������������������������������������������������������������������������������������������������������������������������������������������������������������������������������������������������������������������������������������������������������������������������������������������������
U nlinkedcoh ort
records
L = L inkage C ensus cohortW 1= W eighting o f linked m ortality reco rdsW 2= W eighting o f un linked cohort reco rds

Weighting for linkage bias, 81, 86, 91 and 96
Fawcett et al, 2002 23
3.2 Derivation of the linkage weighting values
The incomplete linkage process means that, when considering all the mortality recordsfor the three years after each census, the number of mortality records linked to a censusrecord in any sociodemographic strata is a proportion of the total number of deaths in thatstrata. However by multiplying the number of linked mortality records in each strata by aweighting factor (WL
i) we can estimate the number of deaths in that strata had all therecords been successfully linked.
Hence (1) NDi = WL
i. NL
i and thus
(2) WLi = ND
i/ NLi
Where NDi is the total number of death records in mortality data-based strata i and NL
i isthe number of death records in strata i linked to a census record.
For example if 126 of 200 mortality records for Maori men aged 25-44 were linked to acensus record then applying a weight of 200/126 = 1.587 to all linked mortality recordsfor Maori men aged 25-44 years will weight up the linked deaths to approximate theknown actual number of deaths. That is 1.587 x 126 = 200.
For each of the four cohorts the associated total mortality data-set was stratifiedaccording to ethnic group, sex, age on census night, New Zealand Deprivation Index andRurality of residence. These strata are all based on information contained within themortality data-set, which was derived originally from the Death Registration form. Thevalue of WL
i was then calculated for each strata.
The weights are calculated from the data-set of eligible mortality records, which includesa field indicating whether the mortality record was successfully linked to a census record.This data-set is called the Bias data-set. The calculated weights were then transferred tothe Cohort data-set (which includes all eligible census records) by linkage betweenindividual ID numbers in the Bias and Cohort data-sets. Statistics New Zealand staffcarried out the transfer of weights. Further details about the structure of the data-sets isgiven is the technical report describing the linkage process and construction of the data-sets (Hill et al. 2002).
3.2.1 Stratification of the data by demographic variables
To correctly weight each linked record on the census-mortality data-sets requiresapplying weights that vary by demographic strata. The strata that we used for the initialweighting were:
• sex
• age group (5 groups according to age at census night; 0-14, 15-29, 30-44, 45-64 and65-74 years)
• ethnic group (3 groups for the 1981,1986 and 1991 mortality records only one ethnicgroup was available. For the 1996 bias data-set up to three ethnic groups wererecorded. Prioritised ethnicity was used for the stratification).

Weighting for linkage bias, 81, 86, 91 and 96
Fawcett et al, 2002 24
• NZDep groupings (5 groups; deciles 1-4, 5-6, 7-8, 9-10 and missing).
• Rurality (rural, urban).
Stratification by socio-demographic variables without reference to cause of death wouldproduce weighted counts of linked deaths that were different to the known numbers ofdeaths by cause. In analyses of the association between socioeconomic variables andspecific mortality outcomes the effect of this would be similar to the effect of a biasedmisclassification of outcome. It was therefore desirable to include cause of deathcategories in the stratification regime. Eighteen groupings of cause of death were used.
The age and NZ Deprivation groupings are based on previous experience with linkagebias (Blakely 2001) and numerator-denominator bias adjustment weights (Blakely et al.2002a; Blakely et al. 2002b) that suggest we could not stratify any more thinly (e.g.NZDep deciles 1-4 had to be pooled given few Maori and Pacific people in the leastdeprived small areas).
Potentially this stratification regime could result in 5760 separate strata (7200 for the1996 census cohort): (18 [Cause of death] × 4 [ethnicity] × 5 [Age] × 2 [Sex] × 5[Deprivation] × 2 [Rural]). In practice not all cause of death categories were relevant toall age groups. To avoid weights of zero (no deaths in strata) or undefined weights (nolinked mortality records in strata) it was necessary to group strata to obtain a minimumstrata size. Decisions about how to group the data were made after examination of thenumbers and proportion linked in each stratum. Ethnic groups and the broad age groupswere never combined and sex groups were combined only when absolutely necessary toensure cells of adequate size. The decision as to whether to combine strata by cause ofdeath, deprivation index or rurality was based on the examination of the numbers andlinkage rates within the ethnic and age specific cells. In practice stratification by ruralitycould only be done for major causes of death among the older age groups.
The stratification of the 1991 Bias data-set is illustrated in tabular form in the appendix(Table 36, page 57). Similar stratification regimes were used for all four censuses. TheSAS codes used to regroup each bias data-set are given in the Appendix (page 76). Aftercombining strata there were 651, 674, 665, and 862 strata for the 1981, 1986, 1991 and1996 Bias data-sets respectively.
A Linkage Weight (W_Base) was calculated for each of the strata using the formulaWL
i = ND/ NL
i (Chapter 3, page 22) The success of the initial weighting was investigatedby comparing the weighted number of linked deaths and the known number of actualdeaths, by strata age groups (broad groupings and five year age groupings, sex, ethnicity,RHA, rurality, cause of death (18 small Groups and four broad groups) and TLA. Theweighted numbers were found to be very accurate for the broad groupings of variablesbut less so for the detailed groupings. The difference between weighted linked deaths andactual deaths was of particular concern with regard to five-year age groups and detailedcause of death groups (as described above). In order to produce weights that ensuredweighted numbers of linked deaths were the same as the known number of actual deaths asecondary adjustment to the original weightings was done.
Three adjustment factors were calculated each using strata of 5-year age groupings by sexand one other variables – ethnicity or deprivation index or cause of death. Linkageweights were calculated for each strata and an adjusted weighting was created bymultiplying the original weighting by the second weighting. Hence for each linked

Weighting for linkage bias, 81, 86, 91 and 96
Fawcett et al, 2002 25
mortality record the adjusted weighting W_AgEthAdj was calculated by multiplyingW_Base by a second weight based on strata of age, sex and ethnicity. Similarly, theadjusted weighting W_AgDepAdj was calculated by multiplying W_Base by a secondweight based on strata of age, sex and NZ deprivation index; and the adjusted weightingW_AgICDAdj was calculated by multiplying W_Base by as second weight based onstrata of age, sex and detailed cause of death groupings.
Hence W_AgEthAdj = NA i /NW
i
Where NA i = The total number of deaths in strata i
And NW = The weighted number of linked deaths in strata i
= NLI x W_BaseI
Where NL I = The number of linked deaths in strata i
The weighted numbers of linked deaths and known number of actual deaths were thencompared for each of the four weights. Table 10 to Table 13 shows the weightednumbers of linked deaths produced using each of the four weights as well as the actualand linked deaths by strata of age and sex.
Table 37 to Table 40 (pages 60 to 72) in the appendix give the weighted and actualnumber of deaths by ethnicity, Regional Health Authority, rurality, New ZealandDeprivation Index and Territorial Local Authority.
The weighted number of linked deaths varied slightly dependant on the type of weightingused. The agreement between weighted numbers of linked deaths and actual totalnumbers of deaths was high for strata of age, sex and ethnicity and cause of death butnone of the weights produce consistently good agreement between weighted linkeddeaths and actual deaths for the geographical variables (RHA and TLA). The choice ofweighting used in any cohort will depend on the analyses being done. Any future analysesof geographical variables would need to create a new adjusted weighting using strata ofderived from the regions of interest.

Weighting for linkage bias, 81, 86, 91 and 96
Fawcett et al, 2002 26
Table 10 1981-1984 Weighted numbers of linked deaths and actual deaths on Bias data-setby age and sex
1981 – 84 LinkedDeaths11
ActualDeaths1
W_BaseAdjustedDeaths2
W_AgEthAdjAdjustedDeaths2
W_AgDepAdjAdjustedDeaths2
W_AgICDAdjAdjustedDeaths2
Sex Age at Census0 - 14 yrs 435 663 663 663 663 660
15 - 24 yrs 732 1,389 1,389 1,389 1,388 1,38725 - 44 yrs 1,413 2,325 2,325 2,325 2,324 2,32245 - 64 yrs 7,848 10,881 10,881 10,881 10,881 10,881
Males
65 - 74 yrs 9,165 12,306 12,307 12,306 12,306 12,3040 - 14 yrs 288 429 429 429 429 422
15 - 24 yrs 252 486 486 486 485 48225 - 44 yrs 945 1,449 1,449 1,449 1,448 1,44445 - 64 yrs 4,638 6,360 6,360 6,360 6,360 6,359
Females
65 - 74 yrs 6,027 8,400 8,399 8,400 8,400 8,400
Table 11 1986-1989 Weighted numbers of linked deaths and actual deaths on Bias data-setby age and sex
1986-89 LinkedDeaths1
ActualDeaths1
W_BaseAdjustedDeaths2
W_AgEthAdjAdjustedDeaths2
W_AgDepAdjAdjustedDeaths2
W_AgICDAdjAdjustedDeaths2
Sex Age at Census0 - 14 yrs 435 615 615 615 613 615
15 - 24 yrs 897 1,569 1,569 1,569 1,568 1,56925 - 44 yrs 1,584 2,562 2,562 2,562 2,562 2,55745 - 64 yrs 7,836 10,503 10,503 10,503 10,503 10,503
Males
65 - 74 yrs 9,330 12,030 12,030 12,030 12,030 12,0300 - 14 yrs 291 405 405 405 405 403
15 - 24 yrs 273 519 519 519 519 51325 - 44 yrs 987 1,455 1,455 1,455 1,455 1,44945 - 64 yrs 4,755 6,255 6,255 6,255 6,251 6,255
Females
65 - 74 yrs 6,447 8,595 8,595 8,595 8,590 8,595
1 Random rounded to base three according to Statistics New Zealand Protocol1 Calculated as the ratio of the weighted linked deaths to the actual deaths multiplied by the randomrounded number of actual deaths.

Weighting for linkage bias, 81, 86, 91 and 96
Fawcett et al, 2002 27
Table 12 1991-1994 Weighted numbers of linked deaths and actual deaths on Bias data-setby age and sex
1991 – 94 LinkedDeaths1
ActualDeaths1
W_BaseAdjustedDeaths2
W_AgEthAdjAdjustedDeaths2
W_AgDepAdjAdjustedDeaths2
W_AgICDAdjAdjustedDeaths2
Sex Age at Census0 – 14 yrs 342 498 498 498 496 497
15 – 24 yrs 696 1,335 1,335 1,335 1,335 1,33025 – 44 yrs 1,635 2,670 2,670 2,670 2,669 2,65945 – 64 yrs 7,032 9,162 9,162 9,162 9,162 9,162
Males
65 – 74 yrs 9,393 11,559 11,559 11,559 11,559 11,5590 – 14 yrs 231 333 333 333 333 330
15 – 24 yrs 255 429 429 429 429 42825 – 44 yrs 1,101 1,536 1,536 1,532 1,534 1,53645 – 64 yrs 4,551 5,760 5,760 5,760 5,759 5,760
Females
65 – 74 yrs 6,399 8,031 8,031 8,031 8,028 8,030
Table 13 1996-1999 Weighted numbers of linked deaths and actual deaths on Bias data-setby age and sex
1996 – 99 LinkedDeaths1
ActualDeaths1
W_BaseAdjustedDeaths2
W_AgEthAdjAdjustedDeaths2
W_AgDepAdjAdjustedDeaths2
W_AgICDAdjAdjustedDeaths2
Sex Age at Census0 - 14 yrs 324 474 474 474 472 472
15 - 24 yrs 585 1,086 1,086 1,086 1,086 1,08525 - 44 yrs 1,599 2,685 2,685 2,685 2,683 2,68245 - 64 yrs 6,537 8,421 8,421 8,421 8,421 8,421
Males
65 - 74 yrs 9,426 11,355 11,355 11,355 11,355 11,3550 - 14 yrs 234 336 336 335 335 335
15 - 24 yrs 237 396 396 396 396 39125 - 44 yrs 1,122 1,524 1,524 1,522 1,524 1,52245 - 64 yrs 4,515 5,607 5,607 5,607 5,607 5,605
Females
65 - 74 yrs 6,306 7,641 7,641 7,641 7,641 7,641
Weighting for linkage bias, 81, 86, 91 and 96
Fawcett et al, 2002 28
3.3 Weighting of non-linked census records
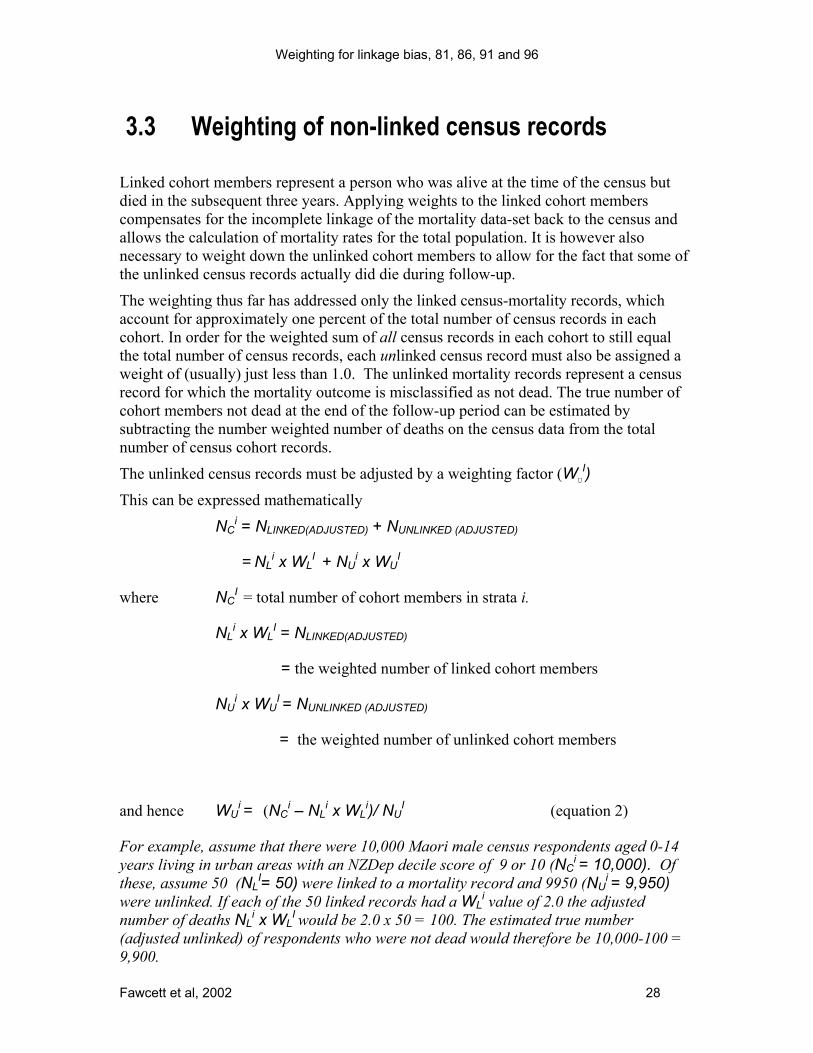
Linked cohort members represent a person who was alive at the time of the census butdied in the subsequent three years. Applying weights to the linked cohort memberscompensates for the incomplete linkage of the mortality data-set back to the census andallows the calculation of mortality rates for the total population. It is however alsonecessary to weight down the unlinked cohort members to allow for the fact that some ofthe unlinked census records actually did die during follow-up.
The weighting thus far has addressed only the linked census-mortality records, whichaccount for approximately one percent of the total number of census records in eachcohort. In order for the weighted sum of all census records in each cohort to still equalthe total number of census records, each unlinked census record must also be assigned aweight of (usually) just less than 1.0. The unlinked mortality records represent a censusrecord for which the mortality outcome is misclassified as not dead. The true number ofcohort members not dead at the end of the follow-up period can be estimated bysubtracting the number weighted number of deaths on the census data from the totalnumber of census cohort records.
The unlinked census records must be adjusted by a weighting factor (WU
I) This can be expressed mathematically
NCi = NLINKED(ADJUSTED) + NUNLINKED (ADJUSTED)
= NLi x WL
I + NUi x WU
I
where NCI = total number of cohort members in strata i.
NLi x WL
I = NLINKED(ADJUSTED)
= the weighted number of linked cohort members
NUi x WU
I = NUNLINKED (ADJUSTED)
= the weighted number of unlinked cohort members
and hence WUi = (NC
i – NLi x WL
i)/ NUI (equation 2)
For example, assume that there were 10,000 Maori male census respondents aged 0-14years living in urban areas with an NZDep decile score of 9 or 10 (NC
i = 10,000). Ofthese, assume 50 (NL
I= 50) were linked to a mortality record and 9950 (NUi = 9,950)
were unlinked. If each of the 50 linked records had a WLi value of 2.0 the adjusted
number of deaths NLi x WL
I would be 2.0 x 50 = 100. The estimated true number(adjusted unlinked) of respondents who were not dead would therefore be 10,000-100 =9,900.

Weighting for linkage bias, 81, 86, 91 and 96
Fawcett et al, 2002 29
Using equation 2 to calculate the weighting for the unlinked census cohort recordsWU
i = (10,000 – 2.0 x 50 )/9950
= 0.994975
and the number of adjusted number of unlinked cohort members is thus
0.994975 x 9950 = 9900.
The cohort weights were calculated for strata of 5-year age groups, sex, ethnicity,Deprivation index and rurality. No stratification by rurality was done for Pacific andAsian (1996 only) ethnic groups. The ethnic groupings were based on prioritised ethnicityfurther subdivided into those with one or multiple ethnicities stated on their censusrecord. For the 1981 census cohort three ethnic strata were used – Maori, Pacific andnonMaori nonPacific.
It was necessary to create a separate weight for each of the four linkage weights. Anyother linkage weights produced in the future for specific analyses will also requireseparate weighting of the unlinked cohort records. By way of illustration Table 14 givesthe mean weighting of unlinked census cohort records by broad age bands, sex andprioritised ethnicity for the 1996 census cohort.

Weighting for linkage bias, 81, 86, 91 and 96
Fawcett et al, 2002 30
Table 14 Mean weighting of unlinked census cohort members by sex, age and prioritisedethnicity. 1981 Census Cohort.
Mean weighting Sex AgeAtCensus Ethnicity W_Bφ W_Eγ W_Dη W_Cι Males 0-14 yrs Maori 0.9994 0.9994 0.9994 0.9994
People 0.9994 0.9994 0.9994 0.9994nonMaori nonPacfic 0.9995 0.9995 0.9995 0.9995
15-24 yrs Maori 0.9968 0.9969 0.9969 0.9967Pacific 0.9981 0.9974 0.9982 0.9983
nonMaori nonPacfic 0.9979 0.9979 0.9979 0.9979
25-44 yrs Maori 0.9951 0.9950 0.9951 0.9952Pacific 0.9975 0.9976 0.9975 0.9973
nonMaori nonPacfic 0.9982 0.9982 0.9982 0.9982
45-64 yrs Maori 0.9733 0.9733 0.9734 0.9737Pacific 0.9876 0.9876 0.9876 0.9869
nonMaori nonPacfic 0.9902 0.9902 0.9902 0.9902
65-74 yrs Maori 0.9086 0.9084 0.9087 0.9093Pacific 0.9454 0.9459 0.9450 0.9460
nonMaori nonPacfic 0.9633 0.9633 0.9633 0.9633
Females 0-14 yrs Maori 0.9996 0.9996 0.9995 0.9996Pacific 0.9996 0.9996 0.9996 0.9997
nonMaori nonPacfic 0.9997 0.9997 0.9997 0.9997
15-24 yrs Maori 0.9988 0.9987 0.9988 0.9988Pacific 0.9989 0.9991 0.9989 0.9987
nonMaori nonPacfic 0.9993 0.9993 0.9993 0.9993
25-44 yrs Maori 0.9973 0.9972 0.9972 0.9975People 0.9984 0.9983 0.9982 0.9983
nonMaori nonPacfic 0.9990 0.9990 0.9990 0.9990
45-64 yrs Maori 0.9833 0.9833 0.9833 0.9836Pacific 0.9914 0.9913 0.9914 0.9916
nonMaori nonPacfic 0.9947 0.9947 0.9947 0.9947
65-74 yrs Maori 0.9324 0.9321 0.9333 0.9341Pacific 0.9674 0.9676 0.9679 0.9678
nonMaori nonPacfic 0.9783 0.9783 0.9783 0.9783
φ W_B = weighted using weight W_Baseγ W_E = weighted using weight W_AgEthAdjη W_D = weighted using weight W_ AgDepAdjι W_C = weighted using weight W_ AgICDAdj

Weighting for linkage bias, 81, 86, 91 and 96
Fawcett et al, 2002 31
Chapter 4: Validation ofweighting
4.1 Correcting for linkage bias by sex and age
Assuming that age and sex are recorded accurately on both mortality and census data,then we have no reason to believe that the weights are not accurate for sex and agespecific analyses of the cohort data.
4.2 Comparison of weighted number of Maori andPacific deaths on the census cohorts with thenumbers predicted by the numerator-denominatorbias adjustment ratios
Unlike sex and age, it is not reasonable to assume that ethnicity is recorded accuratelyand comparably on both mortality and census data.(Ajwani et al. 2002; Blakely andAtkinson 2001; Blakely et al. 2002a; Blakely et al. 2002b) As part of the NZCMSprogramme of work the recording of ethnicity on mortality and on census records werecompared for those mortality records that were linked to a census record. A subset oflinked records with high levels of agreement on date of birth date of death and area ofresidence (meshblock or census area unit) were used for this work. The data-set is calledthe Highly Probable Links (HPL) data-set. This subset was weighted up to the totalmortality data-set using strata based on age at death, sex, ethnicity, NZ Deprivationindex, Regional Health Authority and rurality of residence at death. These analyses aredescribed in detail in Ajwani et al (Ajwani et al. 2002).
One check on the validity of the weighting ratios produced by the linkage weightingdescribed in this report is to compare the weighted number of cohort deaths (by age-at-death, sex and ethnicity) with the weighted number of census deaths in the subset ofhighly probable links used to compare census and mortality recording of ethnicity.
Table 15 to Table 18 compare the weighted number of deaths on the cohort data-set withthe weighted number of deaths on the HPL data-set by strata of age at death, sex andCensus Sole Ethnicity. Table 19 to Table 21 gives similar information by strata of age atdeath, sex and Census Prioritised Ethnicity. The percentage difference between the twoweights is shown in each table with strata with greater than two percent difference, andan absolute difference of greater than six, between the weighted numbers indicated with ahash. Note that the percentage difference in the tables have been calculated using therandom rounded numbers and so may be inaccurate for strata with small numbers. Forexample for Pacific females aged 15-24 years at death the random rounded weighted

Weighting for linkage bias, 81, 86, 91 and 96
Fawcett et al, 2002 32
numbers of 21 from the cohort data-set and 18 from the HPL data-set could be from 19-23 and 16-20 respectively with the true percentage difference between the numbersranging from –0.05% to +30.00%. When only strata with weighted numbers of more than200 are considered the degree of agreement between the weighted numbers is high.Furthermore there is no consistent pattern by strata for under or over weighting of thecohort compared to HPL data-set.
Therefore, and importantly, we conclude that the linkage bias weights have reasonableaccuracy for estimating the number of deaths by ethnic group when the census-basedethnicity coding is used. This is despite the linkage bias weights being (necessarily)calculated using mortality data ethnicity.

Weighting for linkage bias, 81, 86, 91 and 96
Fawcett et al, 2002 33
4.2.1 Sole ethnicity
Table 15 Comparison of number of weighted deaths on cohort data-set and number ofweighted deaths on the HPL data-set - 1981-1984 - by Age at Death Sex and Ethnicity
Age At Death EthnicityLinkedcohortrecords
Weightednumber of
deaths -Cohort
data-set2
WeightedNumber of
deaths -HPL data-
set
%Difference
Males0-14 years Maori 84 132 126 5%
Pacific 27 36 36 0%
nonMaori nonPacific 243 372 360 3% #
15-24 years Maori 144 264 279 6% #
Pacific 18 45 36 20% #
nonMaori nonPacific 576 1,053 1,053 0%25-44 years Maori 219 420 414 1%
Pacific 36 63 63 0%
nonMaori nonPacific 1,035 1,683 1,734 3% #
45-64 years Maori 657 1,128 1,098 3% #
Pacific 93 141 129 9% #
nonMaori nonPacific 6,297 8,556 8,550 0%65-77 years Maori 360 657 651 1%
Pacific 60 93 90 3%nonMaori nonPacific 9,744 12,930 12,954 0%
Female0-14 years Maori 66 96 93 3%
Pacific 15 24 18 25%nonMaori nonPacific 168 255 252 1%
15-24 years Maori 63 123 117 5%Pacific 21 27 27 0%
nonMaori nonPacific 186 351 360 3% #
25-44 years Maori 171 288 270 6% #
2 Calculated using the Weight W_AgEthAdj

Weighting for linkage bias, 81, 86, 91 and 96
Fawcett et al, 2002 34
Pacific 33 54 48 11%nonMaori nonPacific 642 984 993 1%
45-64 years Maori 453 735 732 0%
Pacific 63 93 84 10% #
nonMaori nonPacific 3,621 4,857 4,869 0%
65-77 years Maori 306 543 531 2% #
Pacific 42 66 54 18% #
nonMaori nonPacific 6,294 8,631 8,673 1%
Table 16 Comparison of number of weighted deaths on cohort data-set and number ofweighted deaths on the HPL data-set - 1986-1989 - by Age at Death Sex and Sole Ethnicity
Age At Death Sole EthnicityLinkedcohortrecords
Weightednumber of
deaths -Cohort
data-set3
WeightedNumber of
deaths -HPL data-
set
%Difference
Males0-14 years Maori 54 84 84 0%
Pacific 27 42 45 7%nonMaori nonPacific 198 276 279 1%
15-24 years Maori 111 222 222 0%Pacific 24 48 51 6%
nonMaori nonPacific 546 999 984 2%25-44 years Maori 270 504 489 3%
Pacific 60 114 111 3%nonMaori nonPacific 1206 1947 1968 1%
45-64 years Maori 795 1200 1185 1%Pacific 201 279 282 1%
nonMaori nonPacific 5151 6588 6588 0%65-77 years Maori 477 717 720 0%
Pacific 114 180 183 2%nonMaori nonPacific 9870 12006 12033 0%
Female0-14 years Maori 33 54 51 6%
Pacific 18 24 24 0% nonMaori nonPacific 186 252 249 1%
15-24 years Maori 51 102 102 0%
3 Calculated using the Weight W_AgEthAdj

Weighting for linkage bias, 81, 86, 91 and 96
Fawcett et al, 2002 35
Pacific 15 21 18 14% nonMaori nonPacific 219 390 387 1%
25-44 years Maori 150 243 246 1% Pacific 45 63 54 14% #
nonMaori nonPacific 696 1041 1068 3% 45-64 years Maori 513 774 753 3%
Pacific 102 126 117 7% #nonMaori nonPacific 3570 4632 4638 0%
65-77 years Maori 288 471 468 1% Pacific 57 81 66 19% #
nonMaori nonPacific 6816 8967 8982 0%

Weighting for linkage bias, 81, 86, 91 and 96
Fawcett et al, 2002 36
Table 17 Comparison of number of weighted deaths on cohort data-set and number ofweighted deaths on the HPL data-set - 1991-1994 - by Age at Death Sex and Ethnicity
Age At Death Sole EthnicityLinkedcohortrecords
Weightednumber of
deaths -Cohort
data-set4
WeightedNumber of
deaths -HPL data-
set
%Difference
Males0-14 years Maori 54 84 84 0%
Pacific 27 39 45 15%nonMaori nonPacific 198 279 279 0%
15-24 years Maori 111 219 222 1% Pacific 24 51 51 0%
nonMaori nonPacific 549 1,002 984 2% 25-44 years Maori 273 501 489 2% #
Pacific 60 114 111 3%nonMaori nonPacific 1,209 1,962 1,968 0%
45-64 years Maori 795 1,194 1,185 1% Pacific 198 282 282 0%
nonMaori nonPacific 5,151 6,597 6,588 0% 65-77 years Maori 474 726 720 1%
Pacific 117 183 183 0% nonMaori nonPacific 9,870 11,994 12,033 0%
Female0-14 years Maori 42 60 63 5%
Pacific 18 21 21 0% nonMaori nonPacific 141 204 201 2%
15-24 years Maori 48 78 75 4%Pacific 9 12 15 25%
nonMaori nonPacific 207 342 339 1% 25-44 years Maori 168 258 261 1%
Pacific 54 84 93 11% #nonMaori nonPacific 744 1,026 1,017 1%
45-64 years Maori 675 936 930 1% Pacific 93 144 144 0%
nonMaori nonPacific 3,297 4,077 4,095 0% 65-77 years Maori 354 534 540 1%
Pacific 108 156 150 4%nonMaori nonPacific 6,567 8,130 8,139 0%
4 Calculated using the Weight W_AgEthAdj

Weighting for linkage bias, 81, 86, 91 and 96
Fawcett et al, 2002 37
Table 18 Comparison of number of weighted deaths on cohort data-set and number ofweighted deaths on the HPL data-set 1996-1999 – by Age at Death Sex and Sole Ethnicity
Age AtDeath Sole Ethnicity
Linkedcohortrecords
Weightednumber of
deaths -Cohort
data-set5
WeightedNumber of
deaths -HPL data-
set
%difference
Males0-14 years Maori 66 105 93 13% #
Pacific 12 15 15 0%
Asian 6 12 9 33%nonMaori nonPacific nonAsian 183 252 249 1%
15-24 years Maori 78 174 171 2%
Pacific 30 54 54 0%
Asian 15 24 24 0%
nonMaori nonPacific nonAsian 432 762 774 2%
25-44 years Maori 240 468 492 5% #
Pacific 84 150 144 4%Asian 36 60 60 0%
nonMaori nonPacific nonAsian 1,134 1,878 1,878 0%
45-64 years Maori 891 1,311 1,299 1%
Pacific 243 363 354 3% #
Asian 90 138 135 2%nonMaori nonPacific nonAsian 4,581 5,751 5,781 1%
65-77years Maori 585 792 780 2%
Pacific 168 261 270 3% #
Asian 66 99 102 3%nonMaori nonPacific nonAsian 9,513 11,322 11,337 0%
Females0-14 years Maori 39 57 60 5%
Pacific 12 18 18 0%
Asian 6 6 9 33%nonMaori nonPacific nonAsian 141 192 189 2%
15-24 years Maori 48 84 72 17%Pacific 15 21 15 40%Asian 9 15 15 0%
nonMaori nonPacific nonAsian 186 297 285 4% #
25-44 years Maori 159 249 234 6% #
Pacific 69 102 105 3%Asian 33 42 48 13%
nonMaori nonPacific nonAsian 756 1,011 1,014 0%
45-64 years Maori 624 894 879 2%
Pacific 141 210 210 0%
Asian 63 87 84 4%nonMaori nonPacific nonAsian 3,267 3,918 3,924 0%
65-77years Maori 495 726 726 0%
Pacific 141 213 198 7% #
Asian 57 84 78 8%nonMaori nonPacific nonAsian 6,183 7,317 7,338 0%
5 Calculated using the Weight W_AgEthAdj

Weighting for linkage bias, 81, 86, 91 and 96
Fawcett et al, 2002 38
4.2.2 Prioritised ethnicity
Table 19 Comparison of number of weighted deaths on cohort data-set and number ofweighted deaths on the HPL data-set 1986-1989 – by Age at Death Sex and PrioritizedEthnicity
Age At Death Prioritised EthnicityLinkedcohortrecords
Weightednumber of
deaths -Cohort
data-set6
WeightedNumber of
deaths -HPL data-
set
% difference
Males0-14 years Maori 93 135 138 2%
Pacific 24 36 39 8%NonMaori nonPacific 219 309 312 1%
15-24 years Maori 171 315 306 3% #Pacific 36 72 63 13% #
NonMaori nonPacific 669 1,098 1,110 1% 25-44 years Maori 261 477 477 0%
Pacific 93 138 132 4%NonMaori nonPacific 1,161 1,890 1,923 2%
45-64 years Maori 762 1,161 1,152 1% Pacific 174 240 219 9% #
NonMaori nonPacific 5,931 7,887 7,902 0% 65-77 years Maori 402 627 618 1%
Pacific 96 132 126 5%NonMaori nonPacific 9,975 12,747 12,777 0%
Females0-14 years Maori 57 84 81 4%
Pacific 18 24 24 0% NonMaori nonPacific 165 219 219 0%
15-24 years Maori 63 126 132 5%Pacific 18 27 21 22%
nonMaori nonPacific 207 360 354 2% 25-44 years Maori 174 282 291 3% #
Pacific 51 72 66 8%nonMaori nonPacific 663 990 1,011 2%
45-64 years Maori 579 861 846 2% Pacific 105 135 123 9% #
nonMaori nonPacific 3,501 4,542 4,536 0% 65-77 years Maori 339 540 549 2%
Pacific 63 87 81 7%nonMaori nonPacific 6,759 8,892 8,892 0%
6 Calculated using the Weight W_AgEthAdj
Weighting for linkage bias, 81, 86, 91 and 96
Fawcett et al, 2002 39
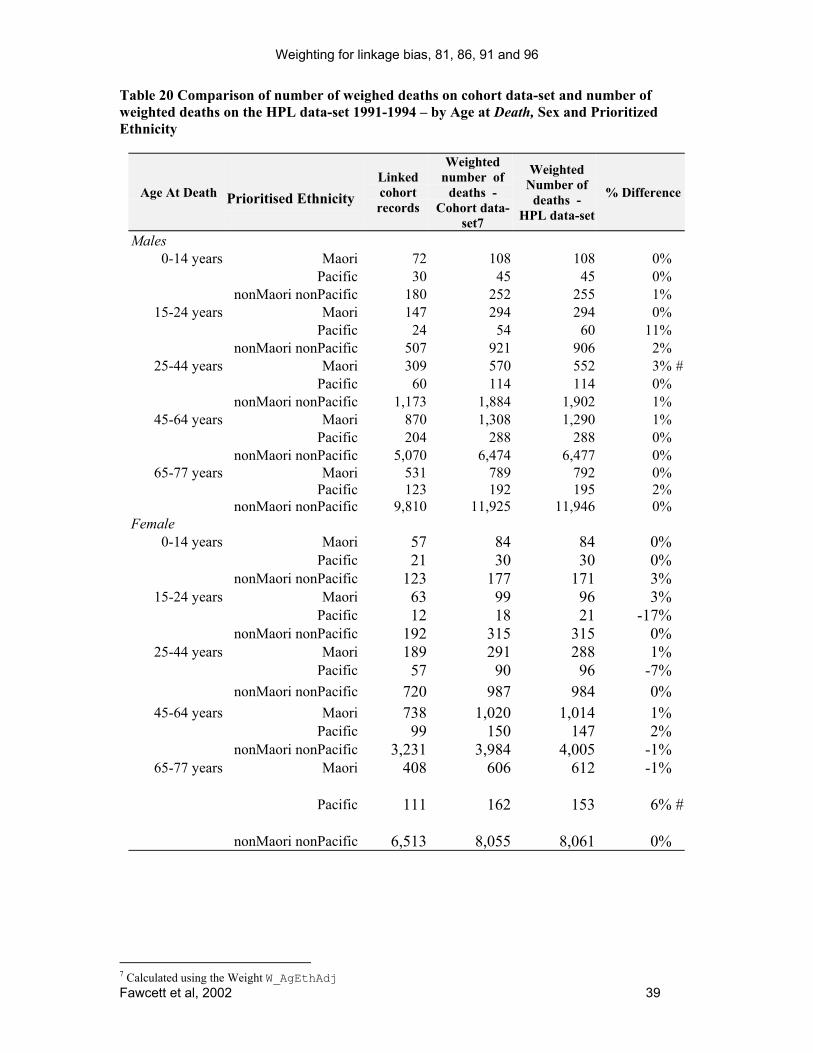
Table 20 Comparison of number of weighed deaths on cohort data-set and number ofweighted deaths on the HPL data-set 1991-1994 – by Age at Death, Sex and PrioritizedEthnicity
Age At Death Prioritised EthnicityLinkedcohortrecords
Weightednumber of
deaths -Cohort data-
set7
WeightedNumber of
deaths -HPL data-set
% Difference
Males0-14 years Maori 72 108 108 0%
Pacific 30 45 45 0%nonMaori nonPacific 180 252 255 1%
15-24 years Maori 147 294 294 0%Pacific 24 54 60 11%
nonMaori nonPacific 507 921 906 2%25-44 years Maori 309 570 552 3% #
Pacific 60 114 114 0%nonMaori nonPacific 1,173 1,884 1,902 1%
45-64 years Maori 870 1,308 1,290 1%Pacific 204 288 288 0%
nonMaori nonPacific 5,070 6,474 6,477 0%65-77 years Maori 531 789 792 0%
Pacific 123 192 195 2%nonMaori nonPacific 9,810 11,925 11,946 0%
Female0-14 years Maori 57 84 84 0%
Pacific 21 30 30 0% nonMaori nonPacific 123 177 171 3%
15-24 years Maori 63 99 96 3% Pacific 12 18 21 -17%
nonMaori nonPacific 192 315 315 0% 25-44 years Maori 189 291 288 1%
Pacific 57 90 96 -7% nonMaori nonPacific 720 987 984 0%
45-64 years Maori 738 1,020 1,014 1% Pacific 99 150 147 2%
nonMaori nonPacific 3,231 3,984 4,005 -1% 65-77 years Maori 408 606 612 -1%
Pacific 111 162 153 6% #
nonMaori nonPacific 6,513 8,055 8,061 0%
7 Calculated using the Weight W_AgEthAdj

Weighting for linkage bias, 81, 86, 91 and 96
Fawcett et al, 2002 40
Table 21 Comparison of number of weighed deaths on cohort data-set and number ofweighted deaths on the HPL data-set 1996-1999 – by Age at Death, Sex and PrioritizedEthnicity
Age AtDeath Prioritised Ethnicity
Linkedcohortrecords
Weightednumber of
deaths -Cohort data-
set8
WeightedNumber of
deaths -HPL data-
set
% difference
Males0-14 years Maori 99 150 147 2%
Pacific 21 33 30 10%Asian 6 12 12 0%
nonMaori nonPacific nonAsian 141 183 183 0%15-24 years Maori 150 318 315 1%
Pacific 45 78 84 7%Asian 18 27 24 2%
nonMaori nonPacific nonAsian 348 594 600 1%25-44 years Maori 357 696 717 3% #
Pacific 105 183 177 3%Asian 36 57 60 5%
nonMaori nonPacific nonAsian 996 1,617 1,623 0%45-64 years Maori 1,104 1,608 1,599 1%
Pacific 267 399 393 2%Asian 96 147 147 0%
nonMaori nonPacific nonAsian 4,338 5,409 5,430 0%65-77years Maori 810 1,089 1,080 1%
Pacific 186 288 303 5% #
Asian 72 108 108 0%nonMaori nonPacific nonAsian 9,261 10,986 10,995 0%
Females0-14 years Maori 72 105 108 3%
Pacific 12 24 24 0%Asian 6 6 9 33%
NonMaori nonPacific nonAsian 105 135 138 2%15-24 years Maori 78 141 126 12% #
Pacific 18 21 18 17%Asian 15 24 21 14%
NonMaori nonPacific nonAsian 150 228 222 3%25-44 years Maori 252 384 375 2%
Pacific 84 126 135 7% #
Asian 36 45 51 12%NonMaori nonPacific nonAsian 642 843 840 0%
45-64 years Maori 798 1,134 1,125 1%Pacific 156 237 237 0%Asian 66 87 87 0%
NonMaori nonPacific nonAsian 3,075 3,651 3,648 0%65-77years Maori 642 924 927 0%
Pacific 159 240 225 7% #
Asian 63 90 87 30%NonMaori nonPacific nonAsian 6,012 7,086 7,101 0%
8 Calculated using the Weight W_AgEthAdj

Weighting for linkage bias, 81, 86, 91 and 96
Fawcett et al, 2002 41
4.3 Correcting for linkage bias by socioeconomicstatus
Blakely corrected for linkage bias in his odds ratios for mortality by occupational classand by NZ deprivation index by dividing the odds ratio (OR) for mortality by thecorresponding Relative Risk (RR) for linkage (Blakely 2001). For example if the oddsratio for all cause mortality for occupational class one compared to occupational classfour was 0.8 and the RR linkage for occupational class one compared to occupationalclass four was 1.2 then the linkage bias adjusted odds ratio was 0.8 / 1.2 = 0.67.
For the 1991 census cohort only it is possible to compare the results of this post-hocmethod for adjusting for linkage bias with the outcomes of weighted logistic regressionusing the linkage weights. Blakely’s original analyses were repeated for occupationalclass and NZ Deprivation (1991). Firstly Figure 2 shows the effect of the use of theEthnicity scaled weight (W_AgEthadj) compared to using a post hoc adjustment by riskof linkage for odds of mortality by decile of NZDep91. The Odds Ratios produced by thethree different weightings described in this report were very similar. These are given inthe appendix (Table 41, page 76).
When cause specific mortality was considered there was a tendency for the ORs producedfrom the weighted regression to be slightly less than those produced by the post-hocadjustment for NZDep91 quintile five, except for female cancer deaths where theWeighted OR was substantially higher than that produced by the ad-hoc adjustment -1.48 compared to 1.30 (Table 22). That said, the two weighting methods (Blakely’s post-hoc, and the linkage bias weights described in this report) give similar results overall thatare often moderately different from the unweighted analyses.
Although the weighted regression for mortality by NZDep91 produced similaradjustments to the post-hoc adjustment for linkage bias, when mortality by NZSEI91Occupational Class is considered there was a substantial difference between the adjustedOdds Ratios produced by the two methods (Figure 3). The difference is particularlynotable at younger ages. There are a number of reasons why the two methods are likely tohave produced different results.
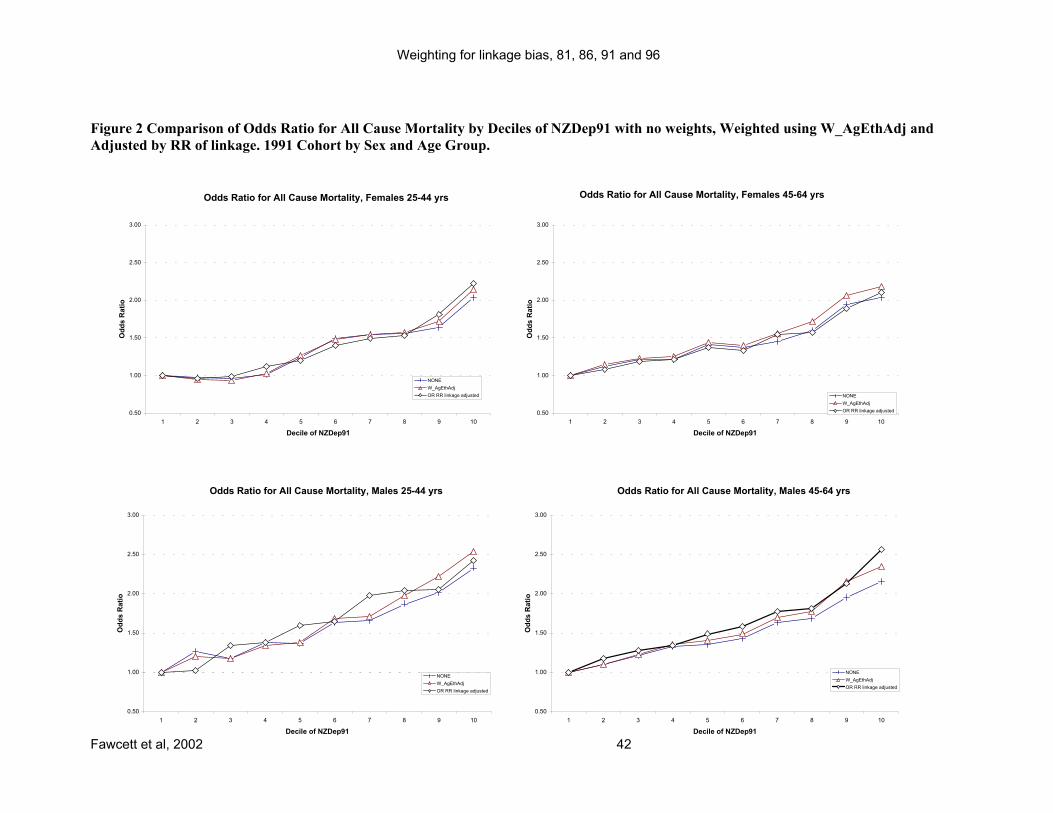
Weighting for linkage bias, 81, 86, 91 and 96
Fawcett et al, 2002 42
Figure 2 Comparison of Odds Ratio for All Cause Mortality by Deciles of NZDep91 with no weights, Weighted using W_AgEthAdj andAdjusted by RR of linkage. 1991 Cohort by Sex and Age Group.
Odds Ratio for All Cause Mortality, Females 25-44 yrs
0.50
1.00
1.50
2.00
2.50
3.00
1 2 3 4 5 6 7 8 9 10
Decile of NZDep91
Odd
s R
atio
NONEW_AgEthAdjOR RR linkage adjusted
Odds Ratio for All Cause Mortality, Females 45-64 yrs
0.50
1.00
1.50
2.00
2.50
3.00
1 2 3 4 5 6 7 8 9 10
Decile of NZDep91
Odd
s R
atio
NONEW_AgEthAdjOR RR linkage adjusted
Odds Ratio for All Cause Mortality, Males 45-64 yrs
0.50
1.00
1.50
2.00
2.50
3.00
1 2 3 4 5 6 7 8 9 10
Decile of NZDep91
Odd
s R
atio
NONEW_AgEthAdjOR RR linkage adjusted
Odds Ratio for All Cause Mortality, Males 25-44 yrs
0.50
1.00
1.50
2.00
2.50
3.00
1 2 3 4 5 6 7 8 9 10
Decile of NZDep91
Odd
s R
atio
NONEW_AgEthAdjOR RR linkage adjusted
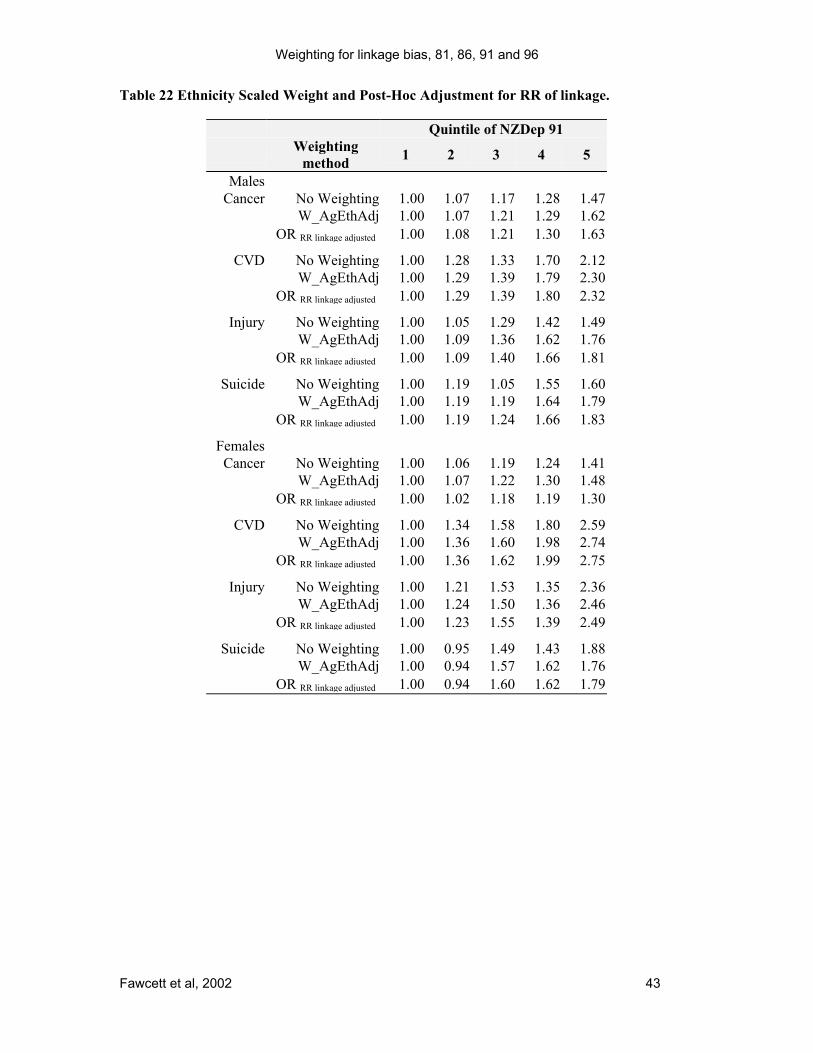
Weighting for linkage bias, 81, 86, 91 and 96
Fawcett et al, 2002 43
Table 22 Ethnicity Scaled Weight and Post-Hoc Adjustment for RR of linkage.
Quintile of NZDep 91Weighting
method 1 2 3 4 5
MalesCancer No Weighting 1.00 1.07 1.17 1.28 1.47
W_AgEthAdj 1.00 1.07 1.21 1.29 1.62OR RR linkage adjusted 1.00 1.08 1.21 1.30 1.63
CVD No Weighting 1.00 1.28 1.33 1.70 2.12W_AgEthAdj 1.00 1.29 1.39 1.79 2.30
OR RR linkage adjusted 1.00 1.29 1.39 1.80 2.32
Injury No Weighting 1.00 1.05 1.29 1.42 1.49W_AgEthAdj 1.00 1.09 1.36 1.62 1.76
OR RR linkage adjusted 1.00 1.09 1.40 1.66 1.81
Suicide No Weighting 1.00 1.19 1.05 1.55 1.60W_AgEthAdj 1.00 1.19 1.19 1.64 1.79
OR RR linkage adjusted 1.00 1.19 1.24 1.66 1.83
FemalesCancer No Weighting 1.00 1.06 1.19 1.24 1.41
W_AgEthAdj 1.00 1.07 1.22 1.30 1.48OR RR linkage adjusted 1.00 1.02 1.18 1.19 1.30
CVD No Weighting 1.00 1.34 1.58 1.80 2.59W_AgEthAdj 1.00 1.36 1.60 1.98 2.74
OR RR linkage adjusted 1.00 1.36 1.62 1.99 2.75
Injury No Weighting 1.00 1.21 1.53 1.35 2.36W_AgEthAdj 1.00 1.24 1.50 1.36 2.46
OR RR linkage adjusted 1.00 1.23 1.55 1.39 2.49
Suicide No Weighting 1.00 0.95 1.49 1.43 1.88W_AgEthAdj 1.00 0.94 1.57 1.62 1.76
OR RR linkage adjusted 1.00 0.94 1.60 1.62 1.79

Weighting for linkage bias, 81, 86, 91 and 96
Fawcett et al, 2002 44
Figure 3 Comparison of Odds Ratio from Weighted Regression with Post-Hoc Adjustmentfor Linkage Bias for Mortality by NZSEI Occupational Class
Bias arising from differences in the recording of occupation between the census and deathcertificate is likely to have substantially affected the relative risk of linkage used to adjustthe odds of mortality by occupational class for the post-hoc weighting. Prior analyses byDr Blakely (Blakely 2001) found that only 33% of linked mortality records had the sameoccupational class on the linked census record (males aged 25-64 at death for the period1992-1994). For NZSEI Class Six only 24 % of mortality records had the sameoccupational class on the linked census record. There was thus evidence of substantialbias in the recording of the occupational class variable that makes the post-hoc weightingfor linkage bias for occupational class mortality gradients tenuous. For example,Blakely’s adjustment of the census occupational class mortality relative risk for Class Sixcompared to Class One was based on a correction factor calculated from mortality datawere only 24% of the death in Class Six had the same class on census data.
������������������������������������������������������������������
������������������������������������������������������������������
�������������������������������������������������������
�������������������������������������������������������
������������������������������������������������������������������
������������������������������������������������������������������
������������������������������������������������������������������������
������������������������������������������������������������
������������������������������������������������������������������������������
������������������������������������������������������������������
������������������������������������������������������������������
�������������������������������������������������������
��������������������������������������������������
������������������������������������������������������������
������������������������������������������������������������������������
������������������������������������������������������������������������������
�����������������������������������������������������������������
������������������������������������������������������������������������������
������������������������������������������������������������������������
������������������������������������������������������������������������
����������������������������������������������������������������������
�����������������������������������������������������������������
������������������������������������������������������������������������������
������������������������������������������������������������������������������
���������������������������������������������������������������������������
��������������������������������������������������������������������������������
������������������������������������������������������������������������������������������������������
������������������������������������������������������������������������������������������������
������������������������������������������������������������������������������������������������
��������������������������������������������������������������������������������
������������������������������������������������������������������������������������������
������������������������������������������������������������������������������������������
������������������������������������������������������������������������������������������������������������������������
���������������������������������������������������������������������������
���������������������������������������������������������������������������
������������������������������������������������������������������������������������������������������
ORs for All Cause Mortality by SEI91 Occupational Class, Males, 1992-94
0.00
0.25
0.50
0.75
1.00
1.25
1.50
1.75
2.00
males,25-44 yrsNo Weight
males,25-44 yrsW_AgEthAdj
males,25-44 yrsOR RR Linkage adjusted
males,45-64 yrsNo Weight
males,45-64 yrsW_AgEthAdj
males,45-64 yrsOR RR Linkage adjusted
Weight
Odd
s R
atio
���NZSEI Class 1���NZSEI Class 2
������NZSEI Class 3���
NZSEI Class 4���NZSEI Class 5���NZSEI Class 6
Weighting for linkage bias, 81, 86, 91 and 96
Fawcett et al, 2002 45
4.4 Correcting for linkage bias – Summary
The linkage bias weights described in this Report work well for adjustments by sex, ageand ethnicity.
Regarding socio-economic position, it is important to first note that residual linkage biasby socio-economic position after allowing for demographic factors was small. Comparingthe weightings with the use of a post-hoc adjustment for linkage bias suggests the weightsperform similarly to these post-hoc weights for analyses of mortality by NZDep.However the weighted regression produced substantially different adjustments for linkagebias by occupational class, when compared to the post-hoc weighting. This is likely to bedue to bias introduced to the previous post-hoc method of Blakely due to the differentrecording of occupation on the mortality and census records. In summary, we believeusing the weights for cohort analyses of socio-economic mortality gradients will besuperior to unweighted analyses.
Weighting for linkage bias, 81, 86, 91 and 96
Fawcett et al, 2002 46
Chapter 5: Limitations of theweighting and conclusions
The weightings described here produce relatively stable adjustments for linkage bias.However the performance of the weights at a sub-national level has not been investigated.Calculations of expected and actual deaths by Territorial Local Authority and Urban Area(Table 37 to Table 40) show the weights do not necessarily produce good predictions forsub-national geographical areas. The performance of the weights to adjust for linkage willtherefore need to be checked and an area based scaling of the Base weight may berequired for these analyses.
The use of linkage weights will enable adjustment for linkage bias and the calculation ofstratum specific mortality rates for a full range of socio-economic variable – not justsmall area deprivation. However these weightings may under-adjust for linkage bias byindividual level socio-economic variables, because of the imperfect correlation betweenthe area based NZDep used in calculating the weights and individual level socio-economic variables, such as income and education . Nevertheless, the weightings providegood adjustments for linkage bias by age, sex and ethnicity, which account for most ofthe linkage bias.

Weighting for linkage bias, 81, 86, 91 and 96
Fawcett et al, 2002 47
REFERENCES
Ajwani S, Blakely T, Robson R, Atkinson J, Fawcett JM, & Kiro C (2002). Unlockingthe Numerator-Denominator Bias for the 1980s and 1990s. NZCMS TechnicalReport No. 4. Wellington: Department of Public Health, Wellington School ofMedicine and Health Sciences.
Blakely T, & Atkinson J (2001). Unlocking the Numerator-Denominator Bias, 1991-94Deaths. NZCMS Technical Report No. 2. Wellington: Department of PublicHealth, Wellington School of Medicine, University of Otago.
Blakely T, Kiro C, & Woodward A (2002a). Unlocking the numerator-denominator bias.II: Adjustments to mortality rates by ethnicity and deprivation during 1991-94.The New Zealand Census-Mortality Study. N Z Med J, 115, 43-8.
Blakely T, Robson B, Atkinson J, Sporle A, & Kiro C (2002b). Unlocking the numerator-denominator bias. I: Adjustments ratios by ethnicity for 1991-94 mortality data.The New Zealand Census-Mortality Study. N Z Med J, 115, 39-43.
Blakely T, Salmond C, & Woodward A (1999). Anonymous record linkage of 1991census records and 1991-94 mortality records: The New Zealand Census-Mortality Study, (Also at http://www.wnmeds.ac.nz/nzcms-info.html). Wellington:Department of Public health, Wellington School of Medicine, University ofOtago.
Blakely T, Woodward A, & Salmond C (2000). Anonymous linkage of New Zealandmortality and Census data. Aust N Z J Public Health, 24, 92-5.
Blakely TA (2001). Socio-economic factors and mortality among 25-64 year olds: TheNew Zealand Census-Mortality Study. Unpublished PhD, University of Otago.
Hill S, Atkinson J, & Blakely TA (2002). Anonymous record linkage of census andmortality records: 1981, 1986, 1991, 1996 Census Cohorts. NZCMS TechnicalReport No. 3. (Also at http://www.wnmeds.ac.nz/nzcms-info.html). Wellington:Department of Public Health, Wellington School of Medicine and HealthSciences, University of Otago.

Weighting for linkage bias, 81, 86, 91 and 96
Fawcett et al, 2002 48
APPENDIX
Table 23 1981-1984. Number of deathsand percentage of mortality recordslinked to a census record by DetailedCause of Death Categories
1981 – 84Cause of Death – detailed
ActualDeaths
%Linked
Communicable Diseases 468 (62%)Colorectal Cancer 1,983 (76%)Lung/Bronchus Cancer 2,838 (74%)Breast Cancer 1,224 (76%)Prostate Cancer 477 (75%)Other Cancer 6,216 (74%)Diabetes 714 (64%)IHD 13,254 (75%)Other Heart Disease 1,821 (69%)Cerebrovascular Disease 3,621 (69%)Other Cardiovascular Disease 1,008 (75%)Pnuemonia/Influenza 819 (59%)COPD 1,866 (72%)Asthma 597 (68%)Other Respiratory 213 (69%)Congenital 210 (74%)Perinatal 9 (44%)SIDS 66 (68%)RTC 1,926 (59%)Suicide 1,002 (59%)Violent 120 (48%)Unintentional Injury otherthan RTC 1,284 (61%)Other Causes 2,976 (67%)
Table 24 1986-1989. Number of deathsand percentage of mortality recordslinked to a census record by DetailedCause of Death Categories
1981 - 84Cause of Death - detailed
ActualDeaths 2.8
Communicable Diseases 432 (66%)Colorectal Cancer 2,076 (81%)Lung/Bronchus Cancer 2,982 (76%)Breast Cancer 1,341 (79%)Prostate Cancer 558 (81%)Other Cancer 6,501 (78%)Diabetes 774 (71%)IHD 12,294 (77%)Other Heart Disease 1,674 (70%)Cerebrovascular Disease 3,006 (72%)Other Cardiovascular Disease 1,059 (75%)Pnuemonia/Influenza 789 (67%)COPD 1,881 (76%)Asthma 537 (73%)Other Respiratory 237 (68%)Congenital 240 (73%)Perinatal 18 (61%)SIDS 45 (83%)RTC 2,187 (61%)Suicide 1,392 (61%)Violent 183 (51%)Unintentional Injury other thanRTC 1,158 (63%)Other Causes 3,132 (71%)
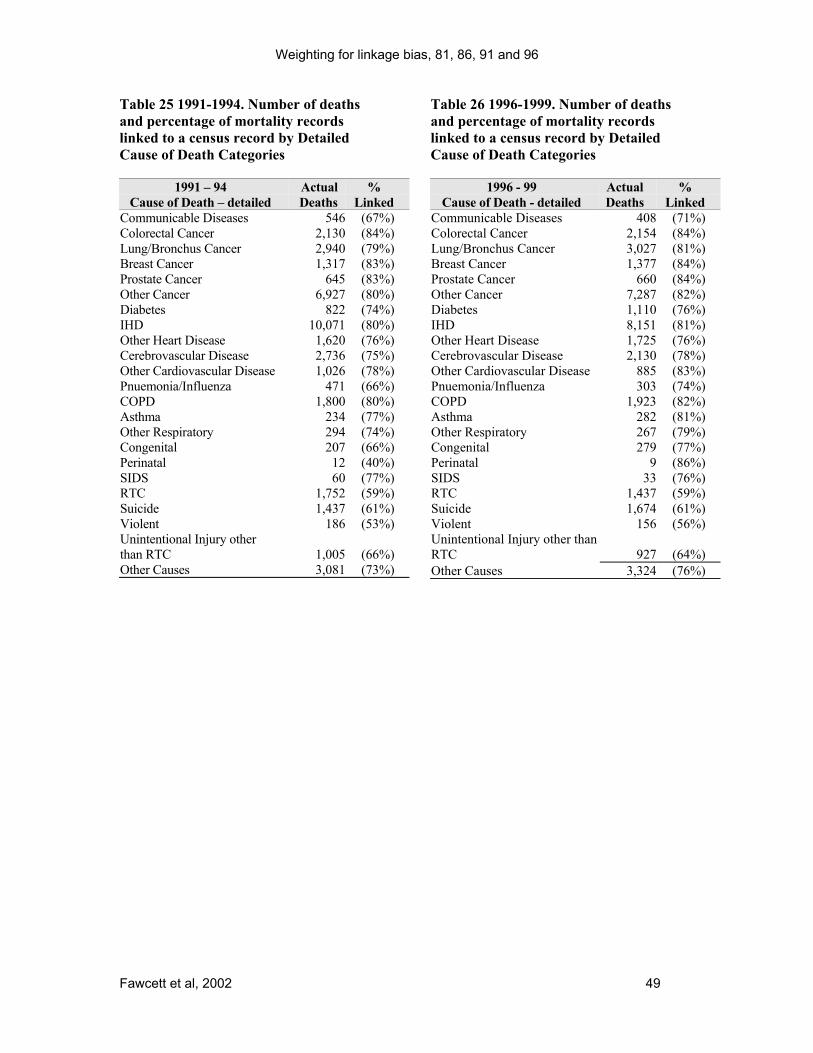
Weighting for linkage bias, 81, 86, 91 and 96
Fawcett et al, 2002 49
Table 25 1991-1994. Number of deathsand percentage of mortality recordslinked to a census record by DetailedCause of Death Categories
1991 – 94Cause of Death – detailed
ActualDeaths
%Linked
Communicable Diseases 546 (67%)Colorectal Cancer 2,130 (84%)Lung/Bronchus Cancer 2,940 (79%)Breast Cancer 1,317 (83%)Prostate Cancer 645 (83%)Other Cancer 6,927 (80%)Diabetes 822 (74%)IHD 10,071 (80%)Other Heart Disease 1,620 (76%)Cerebrovascular Disease 2,736 (75%)Other Cardiovascular Disease 1,026 (78%)Pnuemonia/Influenza 471 (66%)COPD 1,800 (80%)Asthma 234 (77%)Other Respiratory 294 (74%)Congenital 207 (66%)Perinatal 12 (40%)SIDS 60 (77%)RTC 1,752 (59%)Suicide 1,437 (61%)Violent 186 (53%)Unintentional Injury otherthan RTC 1,005 (66%)Other Causes 3,081 (73%)
Table 26 1996-1999. Number of deathsand percentage of mortality recordslinked to a census record by DetailedCause of Death Categories
1996 - 99Cause of Death - detailed
ActualDeaths
%Linked
Communicable Diseases 408 (71%)Colorectal Cancer 2,154 (84%)Lung/Bronchus Cancer 3,027 (81%)Breast Cancer 1,377 (84%)Prostate Cancer 660 (84%)Other Cancer 7,287 (82%)Diabetes 1,110 (76%)IHD 8,151 (81%)Other Heart Disease 1,725 (76%)Cerebrovascular Disease 2,130 (78%)Other Cardiovascular Disease 885 (83%)Pnuemonia/Influenza 303 (74%)COPD 1,923 (82%)Asthma 282 (81%)Other Respiratory 267 (79%)Congenital 279 (77%)Perinatal 9 (86%)SIDS 33 (76%)RTC 1,437 (59%)Suicide 1,674 (61%)Violent 156 (56%)Unintentional Injury other thanRTC 927 (64%)Other Causes 3,324 (76%)
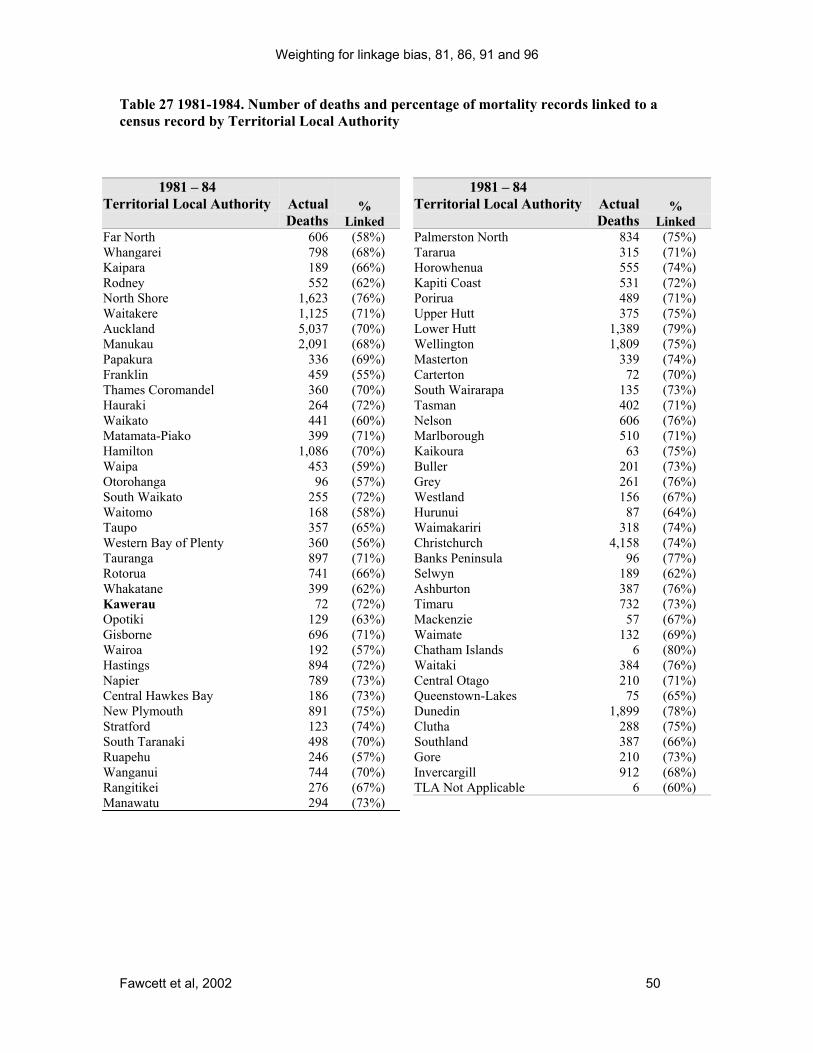
Weighting for linkage bias, 81, 86, 91 and 96
Fawcett et al, 2002 50
Table 27 1981-1984. Number of deaths and percentage of mortality records linked to acensus record by Territorial Local Authority
1981 – 84Territorial Local Authority Actual
Deaths%
LinkedFar North 606 (58%)Whangarei 798 (68%)Kaipara 189 (66%)Rodney 552 (62%)North Shore 1,623 (76%)Waitakere 1,125 (71%)Auckland 5,037 (70%)Manukau 2,091 (68%)Papakura 336 (69%)Franklin 459 (55%)Thames Coromandel 360 (70%)Hauraki 264 (72%)Waikato 441 (60%)Matamata-Piako 399 (71%)Hamilton 1,086 (70%)Waipa 453 (59%)Otorohanga 96 (57%)South Waikato 255 (72%)Waitomo 168 (58%)Taupo 357 (65%)Western Bay of Plenty 360 (56%)Tauranga 897 (71%)Rotorua 741 (66%)Whakatane 399 (62%)Kawerau 72 (72%)Opotiki 129 (63%)Gisborne 696 (71%)Wairoa 192 (57%)Hastings 894 (72%)Napier 789 (73%)Central Hawkes Bay 186 (73%)New Plymouth 891 (75%)Stratford 123 (74%)South Taranaki 498 (70%)Ruapehu 246 (57%)Wanganui 744 (70%)Rangitikei 276 (67%)Manawatu 294 (73%)
1981 – 84Territorial Local Authority Actual
Deaths%
LinkedPalmerston North 834 (75%)Tararua 315 (71%)Horowhenua 555 (74%)Kapiti Coast 531 (72%)Porirua 489 (71%)Upper Hutt 375 (75%)Lower Hutt 1,389 (79%)Wellington 1,809 (75%)Masterton 339 (74%)Carterton 72 (70%)South Wairarapa 135 (73%)Tasman 402 (71%)Nelson 606 (76%)Marlborough 510 (71%)Kaikoura 63 (75%)Buller 201 (73%)Grey 261 (76%)Westland 156 (67%)Hurunui 87 (64%)Waimakariri 318 (74%)Christchurch 4,158 (74%)Banks Peninsula 96 (77%)Selwyn 189 (62%)Ashburton 387 (76%)Timaru 732 (73%)Mackenzie 57 (67%)Waimate 132 (69%)Chatham Islands 6 (80%)Waitaki 384 (76%)Central Otago 210 (71%)Queenstown-Lakes 75 (65%)Dunedin 1,899 (78%)Clutha 288 (75%)Southland 387 (66%)Gore 210 (73%)Invercargill 912 (68%)TLA Not Applicable 6 (60%)
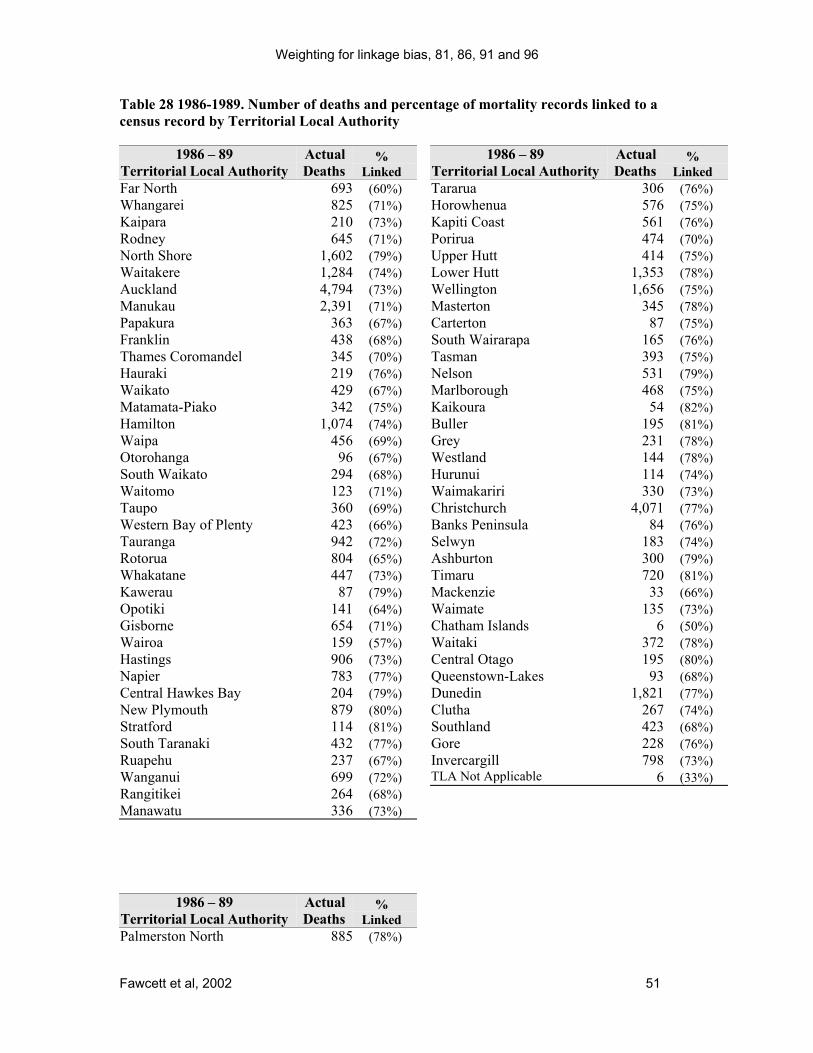
Weighting for linkage bias, 81, 86, 91 and 96
Fawcett et al, 2002 51
Table 28 1986-1989. Number of deaths and percentage of mortality records linked to acensus record by Territorial Local Authority
1986 – 89Territorial Local Authority
ActualDeaths
%Linked
Far North 693 (60%)Whangarei 825 (71%)Kaipara 210 (73%)Rodney 645 (71%)North Shore 1,602 (79%)Waitakere 1,284 (74%)Auckland 4,794 (73%)Manukau 2,391 (71%)Papakura 363 (67%)Franklin 438 (68%)Thames Coromandel 345 (70%)Hauraki 219 (76%)Waikato 429 (67%)Matamata-Piako 342 (75%)Hamilton 1,074 (74%)Waipa 456 (69%)Otorohanga 96 (67%)South Waikato 294 (68%)Waitomo 123 (71%)Taupo 360 (69%)Western Bay of Plenty 423 (66%)Tauranga 942 (72%)Rotorua 804 (65%)Whakatane 447 (73%)Kawerau 87 (79%)Opotiki 141 (64%)Gisborne 654 (71%)Wairoa 159 (57%)Hastings 906 (73%)Napier 783 (77%)Central Hawkes Bay 204 (79%)New Plymouth 879 (80%)Stratford 114 (81%)South Taranaki 432 (77%)Ruapehu 237 (67%)Wanganui 699 (72%)Rangitikei 264 (68%)Manawatu 336 (73%)
1986 – 89Territorial Local Authority
ActualDeaths
%Linked
Palmerston North 885 (78%)
1986 – 89Territorial Local Authority
ActualDeaths
%Linked
Tararua 306 (76%)Horowhenua 576 (75%)Kapiti Coast 561 (76%)Porirua 474 (70%)Upper Hutt 414 (75%)Lower Hutt 1,353 (78%)Wellington 1,656 (75%)Masterton 345 (78%)Carterton 87 (75%)South Wairarapa 165 (76%)Tasman 393 (75%)Nelson 531 (79%)Marlborough 468 (75%)Kaikoura 54 (82%)Buller 195 (81%)Grey 231 (78%)Westland 144 (78%)Hurunui 114 (74%)Waimakariri 330 (73%)Christchurch 4,071 (77%)Banks Peninsula 84 (76%)Selwyn 183 (74%)Ashburton 300 (79%)Timaru 720 (81%)Mackenzie 33 (66%)Waimate 135 (73%)Chatham Islands 6 (50%)Waitaki 372 (78%)Central Otago 195 (80%)Queenstown-Lakes 93 (68%)Dunedin 1,821 (77%)Clutha 267 (74%)Southland 423 (68%)Gore 228 (76%)Invercargill 798 (73%)TLA Not Applicable 6 (33%)

Weighting for linkage bias, 81, 86, 91 and 96
Fawcett et al, 2002 52
Table 29 1991-1994. Number of deaths and percentage of mortality records linked to acensus record by Territorial Local Authority
1991 – 94Territorial Local Authority
ActualDeaths
%Linked
Far North 714 (64%)Whangarei 822 (74%)Kaipara 222 (72%)Rodney 714 (76%)North Shore 1,497 (81%)Waitakere 1,335 (75%)Auckland 3,819 (73%)Manukau 2,394 (71%)Papakura 408 (70%)Franklin 450 (70%)Thames Coromandel 402 (76%)Hauraki 252 (75%)Waikato 417 (73%)Matamata-Piako 354 (78%)Hamilton 1,005 (77%)Waipa 402 (72%)Otorohanga 93 (65%)South Waikato 318 (75%)Waitomo 123 (76%)Taupo 378 (74%)Western Bay of Plenty 378 (74%)Tauranga 996 (78%)Rotorua 771 (74%)Whakatane 450 (68%)Kawerau 90 (75%)Opotiki 129 (58%)Gisborne 648 (69%)Wairoa 195 (74%)Hastings 828 (76%)Napier 714 (81%)Central Hawkes Bay 165 (83%)New Plymouth 894 (81%)Stratford 111 (80%)South Taranaki 414 (76%)Ruapehu 192 (65%)Wanganui 672 (76%)Rangitikei 234 (79%)Manawatu 297 (75%)
1991 – 94Territorial Local Authority
ActualDeaths
%Linked
Palmerston North 753 (78%)Tararua 246 (85%)Horowhenua 555 (76%)Kapiti Coast 579 (82%)Porirua 486 (74%)Upper Hutt 414 (83%)Lower Hutt 1,107 (82%)Wellington 1,392 (80%)Masterton 288 (82%)Carterton 90 (87%)South Wairarapa 141 (83%)Tasman 396 (79%)Nelson 474 (79%)Marlborough 411 (80%)Kaikoura 54 (82%)Buller 198 (78%)Grey 186 (83%)Westland 114 (78%)Hurunui 114 (81%)Waimakariri 363 (75%)Christchurch 3,747 (81%)Banks Peninsula 87 (75%)Selwyn 159 (69%)Ashburton 300 (82%)Timaru 633 (83%)Mackenzie 48 (82%)Waimate 111 (87%)Chatham Islands 12 (83%)Waitaki 342 (77%)Central Otago 198 (87%)Queenstown-Lakes 72 (78%)Dunedin 1,356 (81%)Clutha 228 (80%)Southland 357 (72%)Gore 171 (83%)Invercargill 765 (76%)TLA Not Applicable 54 (33%)

Weighting for linkage bias, 81, 86, 91 and 96
Fawcett et al, 2002 53
Table 30 1996-1999 . Number of deaths and percentage of mortality records linked to acensus record by Territorial Local Authority
1996 – 99Territorial Local Authority
ActualDeaths
%Linked
Far North 828 (70%)Whangarei 867 (75%)Kaipara 240 (74%)Rodney 771 (78%)North Shore 1,374 (80%)Waitakere 1,431 (79%)Auckland 3,291 (74%)Manukau 2,394 (74%)Papakura 375 (68%)Franklin 474 (76%)Thames Coromandel 372 (82%)Hauraki 225 (80%)Waikato 456 (73%)Matamata-Piako 333 (79%)Hamilton 1,023 (77%)Waipa 450 (72%)Otorohanga 96 (64%)South Waikato 285 (75%)Waitomo 135 (71%)Taupo 375 (77%)Western Bay of Plenty 414 (73%)Tauranga 984 (77%)Rotorua 825 (75%)Whakatane 432 (70%)Kawerau 120 (83%)Opotiki 168 (69%)Gisborne 678 (76%)Wairoa 153 (72%)Hastings 789 (76%)Napier 696 (78%)Central Hawkes Bay 132 (86%)New Plymouth 669 (83%)Stratford 93 (81%)South Taranaki 312 (79%)Ruapehu 204 (72%)Wanganui 654 (74%)Rangitikei 216 (73%)Manawatu 243 (75%)Palmerston North 705 (80%)Tararua 216 (80%)Horowhenua 525 (83%)Kapiti Coast 567 (83%)Porirua 504 (75%)Upper Hutt 432 (82%)
1996 – 99Territorial Local Authority
ActualDeaths
%Linked
Lower Hutt 993 (81%)Wellington 1,221 (81%)Masterton 288 (82%)Carterton 84 (81%)South Wairarapa 117 (78%)Tasman 405 (78%)Nelson 432 (81%)Marlborough 465 (80%)Kaikoura 51 (75%)Buller 153 (82%)Grey 174 (79%)Westland 120 (82%)Hurunui 108 (79%)Waimakariri 339 (81%)Christchurch 3,300 (84%)Banks Peninsula 66 (85%)Selwyn 144 (74%)Ashburton 321 (86%)Timaru 600 (85%)Mackenzie 36 (87%)Waimate 96 (87%)Chatham Islands 12 (55%)Waitaki 318 (80%)Central Otago 192 (87%)Queenstown-Lakes 114 (83%)Dunedin 1,317 (83%)Clutha 189 (86%)Southland 324 (83%)Gore 186 (81%)Invercargill 714 (84%)TLA Not Applicable 111 (48%)

Weighting for linkage bias, 81, 86, 91 and 96
Fawcett et al, 2002 54
Table 31 1981-1984 Number of deaths and percentage linked by strata of Age-at-Death, sexand ethnicity
1981 – 84 ActualDeaths % Linked
Age at Death Sex Ethnicity
_______________Maori 63 (65%)________Pacific People 12 (83%)
_____Males
__NonMaori NonPacific 447 (68%)
_______________Maori 48 (73%)________Pacific People 15 (69%)
0 – 14 yrs
___Females
__NonMaori NonPacific 303 (67%)
_______________Maori 156 (50%)________Pacific People 30 (40%)
_____Males
__NonMaori NonPacific 1,188 (55%)
_______________Maori 78 (49%)________Pacific People 15 (75%)
15 – 24 yrs
___Females
__NonMaori NonPacific 411 (53%)
_______________Maori 291 (50%)________Pacific People 42 (51%)
_____Males
__NonMaori NonPacific 1,875 (60%)
_______________Maori 201 (61%)________Pacific People 24 (58%)
25 – 44 yrs
___Females
__NonMaori NonPacific 1,092 (65%)
_______________Maori 822 (54%)________Pacific People 81 (61%)
_____Males
__NonMaori NonPacific 8,871 (74%)
_______________Maori 579 (58%)________Pacific People 45 (61%)
45 – 64 yrs
___Females
__NonMaori NonPacific 5,058 (75%)
_______________Maori 489 (48%)________Pacific People 57 (60%)
_____Males
__NonMaori NonPacific 13,143 (75%)
_______________Maori 381 (49%)________Pacific People 30 (57%)
65 – 78 yrs
___Females
__NonMaori NonPacific 8,850 (73%)

Weighting for linkage bias, 81, 86, 91 and 96
Fawcett et al, 2002 55
Table 32 1986-1989 Number of deaths and percentage linked by strata of Age-at-Death, sexand ethnicity
1986 – 89 ActualDeaths
%Linked
Age at Death Sex Ethnicity_______________Maori 60 (68%)________Pacific People 15 (77%)
_____Males
__NonMaori NonPacific 405 (70%)
_______________Maori 33 (64%)________Pacific People 18 (75%)
0 – 14 yrs
___Females
__NonMaori NonPacific 276 (74%)
_______________Maori 147 (53%)________Pacific People 18 (50%)
_____Males
__NonMaori NonPacific 1,314 (60%)
_______________Maori 66 (46%)________Pacific People 15 (79%)
15 – 24 yrs
___Females
__NonMaori NonPacific 426 (57%)
_______________Maori 288 (51%)________Pacific People 66 (69%)
_____Males
__NonMaori NonPacific 2,175 (61%)
_______________Maori 159 (59%)________Pacific People 33 (73%)
25 – 44 yrs
___Females
__NonMaori NonPacific 1,173 (66%)
_______________Maori 780 (63%)________Pacific People 108 (74%)
_____Males
__NonMaori NonPacific 8,382 (75%)
_______________Maori 582 (64%)________Pacific People 57 (86%)
45 – 64 yrs
___Females
__NonMaori NonPacific 4,869 (77%)
_______________Maori 453 (58%)________Pacific People 69 (67%)
_____Males
__NonMaori NonPacific 12,987 (78%)
_______________Maori 387 (57%)________Pacific People 45 (64%)
65 – 78 yrs
___Females
__NonMaori NonPacific 9,090 (76%)

Weighting for linkage bias, 81, 86, 91 and 96
Fawcett et al, 2002 56
Table 33 1991-1994 Number of deaths and percentage linked by strata of Age-at-Death, sexand ethnicity
1991 – 94 ActualDeaths % Linked
Age at Death Sex Ethnicity_______________Maori 45 (64%)________Pacific People 27 (61%)
_____Males
__NonMaori NonPacific 330 (71%)
_______________Maori 36 (58%)________Pacific People 15 (73%)
0 – 14 yrs
___Females
__NonMaori NonPacific 240 (70%)
_______________Maori 153 (49%)________Pacific People 30 (37%)
_____Males
__NonMaori NonPacific 1,080 (55%)
_______________Maori 42 (67%)________Pacific People 12 (69%)
15 – 24 yrs
___Females
__NonMaori NonPacific 375 (61%)
_______________Maori 357 (52%)________Pacific People 75 (47%)
_____Males
__NonMaori NonPacific 2,142 (62%)
_______________Maori 201 (61%)________Pacific People 36 (53%)
25 – 44 yrs
___Females
__NonMaori NonPacific 1,134 (73%)
_______________Maori 897 (63%)________Pacific People 159 (68%)
_____Males
__NonMaori NonPacific 6,996 (78%)
_______________Maori 720 (70%)________Pacific People 96 (58%)
45 – 64 yrs
___Females
__NonMaori NonPacific 4,353 (81%)
_______________Maori 582 (60%)________Pacific People 126 (51%)
_____Males
__NonMaori NonPacific 12,225 (82%)
_______________Maori 438 (61%)________Pacific People 81 (59%)
65 – 78 yrs
___Females
__NonMaori NonPacific 8,313 (81%)

Weighting for linkage bias, 81, 86, 91 and 96
Fawcett et al, 2002 57
Table 34 1996-1999 Number of deaths and percentage linked by strata of Age-at-Death, sexand Sole Ethnicity
1996 - 99 ActualDeaths % Linked
Age at Death Sex Sole Ethnicity0 - 14 yrs _____Males________________________Maori 111 (66%)
________________________Pacific 21 (71%)
________________________Asian 9 (50%)___NonMaori NonPacific NonAsian 228 (77%)
________________________Maori 78 (61%)________________________Pacific
18 (55%)________________________Asian 6 (100%)___NonMaori NonPacific NonAsian 177 (76%)
___Females
________________________Maori 237 (45%)________________________Pacific
60 (57%)________________________Asian 24 (64%)
___NonMaori NonPacific NonAsian 699 (58%)
_____Males
________________________Maori 90 (51%)________________________Pacific
15 (80%)________________________Asian 15 (63%)
___NonMaori NonPacific NonAsian 270 (66%)
15 - 24 yrs
___Females
________________________Maori 600 (47%)________________________Pacific
150 (60%)________________________Asian 60 (56%)
___NonMaori NonPacific NonAsian 1,770 (62%)
_____Males
________________________Maori 327 (64%)________________________Pacific
114 (67%)________________________Asian 48 (70%)
___NonMaori NonPacific NonAsian 909 (76%)
25 - 44 yrs
___Females
________________________Maori 1,425 (68%)________________________Pacific
381 (66%)________________________Asian 132 (67%)
___NonMaori NonPacific NonAsian 5,628 (80%)
_____Males
________________________Maori 1,038 (70%)________________________Pacific
243 (65%)________________________Asian 78 (76%)
___NonMaori NonPacific NonAsian 3,735 (84%)
45 - 64 yrs
___Females

Weighting for linkage bias, 81, 86, 91 and 96
Fawcett et al, 2002 58
1996 - 99 ActualDeaths % Linked
________________________Maori 921 (73%)________________________Pacific
309 (63%)________________________Asian 105 (65%)
___NonMaori NonPacific NonAsian 11,151 (84%)
_____Males
________________________Maori 819 (67%)________________________Pacific
225 (66%)________________________Asian 84 (67%)
___NonMaori NonPacific NonAsian 7,209 (85%)
65 - 77 yrs
___Females
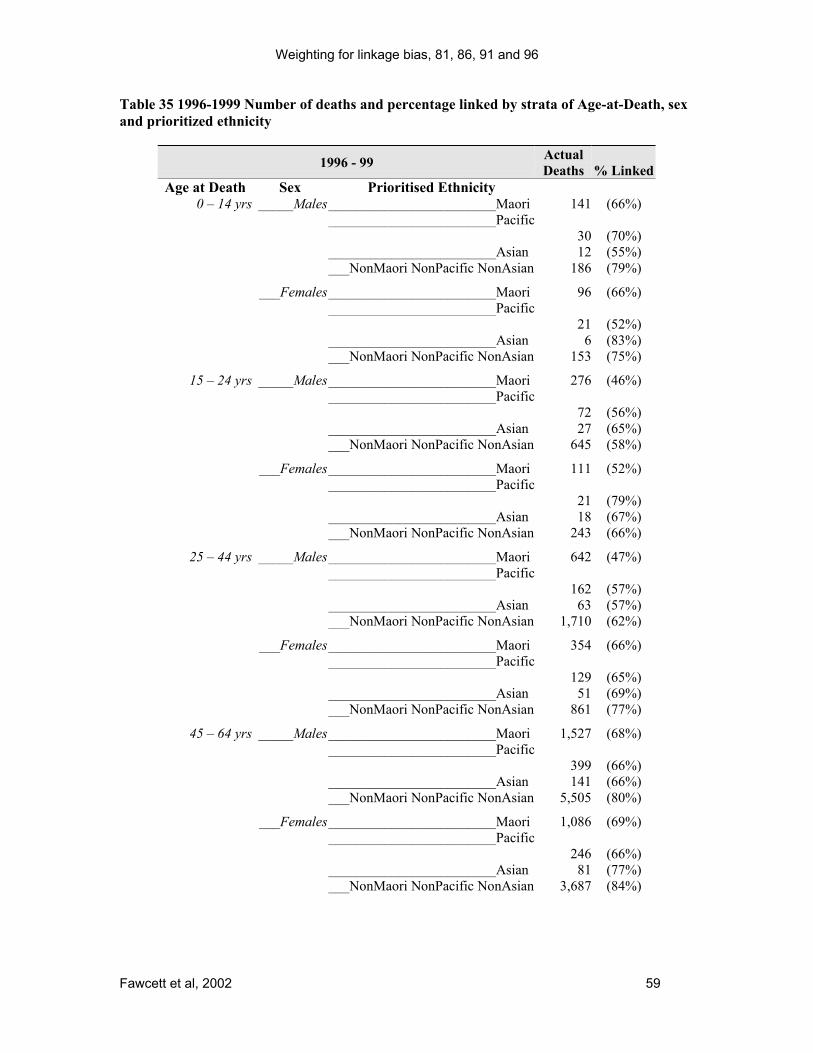
Weighting for linkage bias, 81, 86, 91 and 96
Fawcett et al, 2002 59
Table 35 1996-1999 Number of deaths and percentage linked by strata of Age-at-Death, sexand prioritized ethnicity
1996 - 99 ActualDeaths % Linked
Age at Death Sex Prioritised Ethnicity0 – 14 yrs _____Males________________________Maori 141 (66%)
________________________Pacific 30 (70%)
________________________Asian 12 (55%)___NonMaori NonPacific NonAsian 186 (79%)
________________________Maori 96 (66%)________________________Pacific
21 (52%)________________________Asian 6 (83%)___NonMaori NonPacific NonAsian 153 (75%)
___Females
________________________Maori 276 (46%)________________________Pacific
72 (56%)________________________Asian 27 (65%)___NonMaori NonPacific NonAsian 645 (58%)
_____Males
________________________Maori 111 (52%)________________________Pacific
21 (79%)________________________Asian 18 (67%)___NonMaori NonPacific NonAsian 243 (66%)
15 – 24 yrs
___Females
________________________Maori 642 (47%)________________________Pacific
162 (57%)________________________Asian 63 (57%)___NonMaori NonPacific NonAsian 1,710 (62%)
_____Males
________________________Maori 354 (66%)________________________Pacific
129 (65%)________________________Asian 51 (69%)___NonMaori NonPacific NonAsian 861 (77%)
25 – 44 yrs
___Females
________________________Maori 1,527 (68%)________________________Pacific
399 (66%)________________________Asian 141 (66%)___NonMaori NonPacific NonAsian 5,505 (80%)
_____Males
________________________Maori 1,086 (69%)________________________Pacific
246 (66%)________________________Asian 81 (77%)___NonMaori NonPacific NonAsian 3,687 (84%)
45 – 64 yrs
___Females

Weighting for linkage bias, 81, 86, 91 and 96
Fawcett et al, 2002 60
1996 - 99 ActualDeaths % Linked
________________________Maori 1,002 (73%)________________________Pacific
324 (64%)________________________Asian 111 (65%)___NonMaori NonPacific NonAsian 11,049 (84%)
_____Males
________________________Maori 873 (67%)________________________Pacific
231 (67%)________________________Asian 93 (69%)___NonMaori NonPacific NonAsian 7,146 (85%)
65 – 77 yrs
___Females
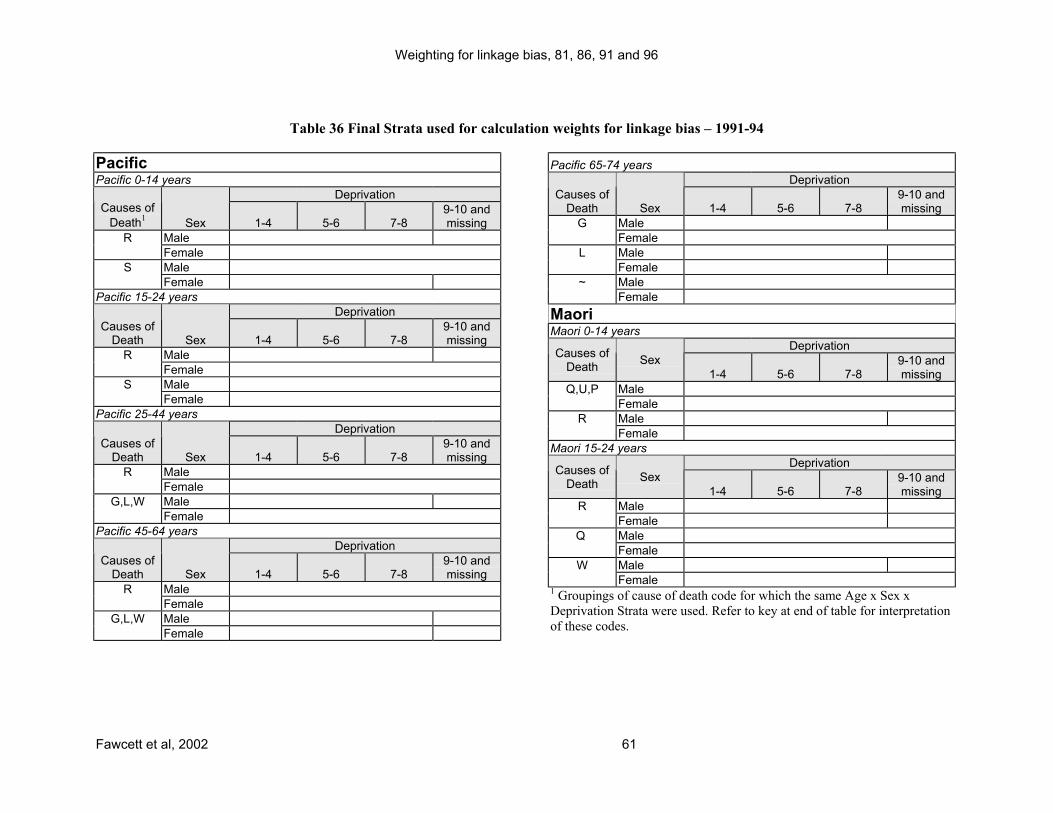
Weighting for linkage bias, 81, 86, 91 and 96
Fawcett et al, 2002 61
Table 36 Final Strata used for calculation weights for linkage bias – 1991-94
PacificPacific 0-14 years
DeprivationCauses of
Death1 Sex 1-4 5-6 7-89-10 andmissing
R MaleFemale
S MaleFemale
Pacific 15-24 yearsDeprivation
Causes ofDeath Sex 1-4 5-6 7-8
9-10 andmissing
R MaleFemale
S MaleFemale
Pacific 25-44 yearsDeprivation
Causes ofDeath Sex 1-4 5-6 7-8
9-10 andmissing
R MaleFemale
G,L,W MaleFemale
Pacific 45-64 yearsDeprivation
Causes ofDeath Sex 1-4 5-6 7-8
9-10 andmissing
R MaleFemale
G,L,W MaleFemale
Pacific 65-74 yearsDeprivation
Causes ofDeath Sex 1-4 5-6 7-8
9-10 andmissing
G MaleFemale
L MaleFemale
~ MaleFemale
Maori Maori 0-14 years
DeprivationCauses ofDeath Sex
1-4 5-6 7-89-10 andmissing
Q,U,P MaleFemale
R MaleFemale
Maori 15-24 yearsDeprivationCauses of
Death Sex1-4 5-6 7-8
9-10 andmissing
R MaleFemale
Q MaleFemale
W MaleFemale
1 Groupings of cause of death code for which the same Age x Sex xDeprivation Strata were used. Refer to key at end of table for interpretationof these codes.

Weighting for linkage bias, 81, 86, 91 and 96
Fawcett et al, 2002 62
Maori 25-44 yearsDeprivation
Causes ofDeath Sex 1-4 5-6 7-8
9-10 andmissing
R FemaleM MaleN Male
G,L,W MaleFemale
Maori 45-64 yearsDeprivation
Causes ofDeath Sex 1-4 5-6 7-8
9-10 andmissing
E,B MaleFemale
H,@,C MaleFemale
A,R,O,K MaleFemale
D,F,I,J MaleFemale
Maori 65-74 yearsDeprivation
Causes ofDeath Sex 1-4 5-6 7-8
9-10 andmissing
G Male Urban Rural Urban RuralFemale Urban Rural Urban Rural
L Male Urban Rural Urban RuralFemale Urban Rural Urban Rural
~ Male Urban Rural Urban RuralFemale Urban Rural Urban Rural
NonMaori NonPacificNonMaori NonPacific 0-14 yrs
DeprivationCauses of
Death Sex 1-4 5-6 7-89-10 andmissing
Q,M,P MaleFemale
N MaleFemale
U MaleFemale
NonMaori NonPacific 15-24 yrsDeprivation
Causes ofDeath Sex 1-4 5-6 7-8
9-10 andmissing
G,%,$,N,U MaleFemale
L MaleFemale
P MaleFemale
NonMaori NonPacific 25-44 yrsDeprivation
Causes ofDeath Sex 1-4 5-6 7-8
9-10 andmissing
B MaleFemaleMale
C,D,F,H,I,J,%,$,P,U Female
E MaleFemale
K MaleFemale

Weighting for linkage bias, 81, 86, 91 and 96
Fawcett et al, 2002 63
NonMaori NonPacific 45-64 yrsDeprivation
Causes ofDeath Sex 1-4 5-6 7-8
9-10 andmissing
C Male Urban Rural Urban Rural Urban Rural Urban RuralFemale
D,H,Z Male Urban Rural Urban Rural Urban Rural Urban RuralFemale Urban Rural Urban Rural Urban Rural Urban Rural
B,F Male Urban Rural Urban Rural Urban Rural Urban RuralFemale Urban Rural Urban Rural Urban RuralMale
E,I,J,K,%,N,Y,A,O Female
$ MaleFemale
P MaleFemale
NonMaori NonPacific 65-74 yrsDeprivation
Causes ofDeath Sex 1-4 5-6 7-8
9-10 andmissing
Male Urban Rural Urban Rural Urban Rural Urban RuralB,C,F,H,J,# Female Urban Rural Urban Rural Urban Rural Urban Rural
D Male Urban Rural Urban Rural Urban Rural Urban RuralFemale Urban Rural Urban Rural Urban RuralMale
E,K,R,Y,A,O FemaleI Male Urban Rural Urban Rural Urban Rural Urban Rural
Female
Note that all the causes of death groupings listed in the cause ofdeath column are stratified separately. The key for these causeof death groupings are as follows.
Key for cause of death categoriesB Colorectal CancerC Lung/Bronchus CancerD Breast CancerE Prostate CancerF Other CancerG All CancerH Ischaemic Heart DiseaseI Other Heart DiseaseJ Cerebrovascular Disease
K Other Cardiovascular DiseaseL Call cardiovascular Disease
M Injury excluding suicideN SuicideP perinatal, SIDS, congenitalQ Cancer and Cardiovascular DiseaseR Injury and suicideS all excluding Injury and suicideT all excluding Injury and suicide, perinatal, congenital & SIDS
Z all excluding Injury and suicide, cancer, cardiovascular, perinatal,congenital, SIDS ,diabetes ,COPD, pneumonia
V all excluding injury, perinatal, congenital & SIDSW all excluding Injury and suicide, cancer, cardiovascular,X All cancers excluding lung, breast and prostateY Pneumonia/influenzaA COPDO Diabetes
U all excluding Injury and suicide, cancer, cardiovascular, perinatal,congenital, SIDS
% Road traffic crashes (RTC)^ All Injury excluding RTC, violent and suicide! Violent+ Injury excluding RTC & violent~ All excluding Cancer and Cardiovascular Disease
# all except injury and suicide ,cancer, cardiovascular, diabetes, COPD andpneumonia
@ all except injury and suicide ,cancer, cardiovascular, diabetes, and COPD$ injury excluding suicide and RTC
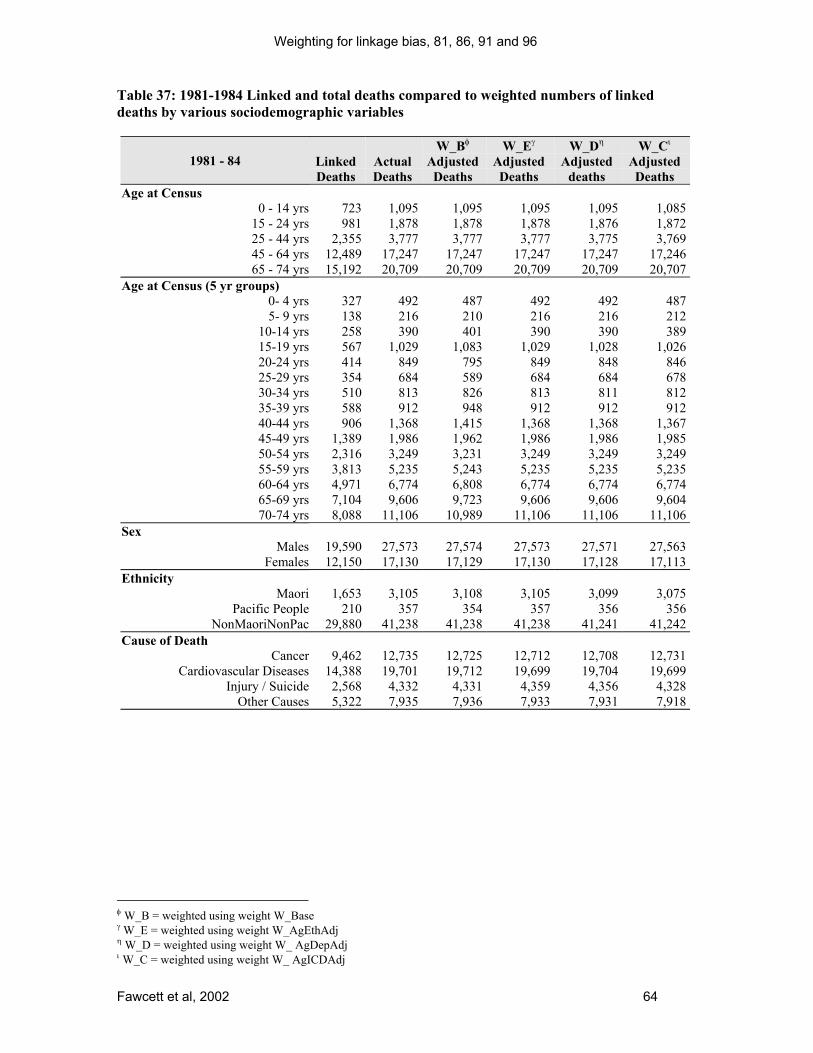
Weighting for linkage bias, 81, 86, 91 and 96
Fawcett et al, 2002 64
Table 37: 1981-1984 Linked and total deaths compared to weighted numbers of linkeddeaths by various sociodemographic variables
1981 - 84 LinkedDeaths
ActualDeaths
W_Bφ
AdjustedDeaths
W_Eγ
AdjustedDeaths
W_Dη
Adjusteddeaths
W_Cι
AdjustedDeaths
Age at Census0 - 14 yrs 723 1,095 1,095 1,095 1,095 1,085
15 - 24 yrs 981 1,878 1,878 1,878 1,876 1,87225 - 44 yrs 2,355 3,777 3,777 3,777 3,775 3,76945 - 64 yrs 12,489 17,247 17,247 17,247 17,247 17,24665 - 74 yrs 15,192 20,709 20,709 20,709 20,709 20,707
Age at Census (5 yr groups)0- 4 yrs 327 492 487 492 492 4875- 9 yrs 138 216 210 216 216 212
10-14 yrs 258 390 401 390 390 38915-19 yrs 567 1,029 1,083 1,029 1,028 1,02620-24 yrs 414 849 795 849 848 84625-29 yrs 354 684 589 684 684 67830-34 yrs 510 813 826 813 811 81235-39 yrs 588 912 948 912 912 91240-44 yrs 906 1,368 1,415 1,368 1,368 1,36745-49 yrs 1,389 1,986 1,962 1,986 1,986 1,98550-54 yrs 2,316 3,249 3,231 3,249 3,249 3,24955-59 yrs 3,813 5,235 5,243 5,235 5,235 5,23560-64 yrs 4,971 6,774 6,808 6,774 6,774 6,77465-69 yrs 7,104 9,606 9,723 9,606 9,606 9,60470-74 yrs 8,088 11,106 10,989 11,106 11,106 11,106
SexMales 19,590 27,573 27,574 27,573 27,571 27,563
Females 12,150 17,130 17,129 17,130 17,128 17,113Ethnicity
Maori 1,653 3,105 3,108 3,105 3,099 3,075Pacific People 210 357 354 357 356 356
NonMaoriNonPac 29,880 41,238 41,238 41,238 41,241 41,242Cause of Death
Cancer 9,462 12,735 12,725 12,712 12,708 12,731Cardiovascular Diseases 14,388 19,701 19,712 19,699 19,704 19,699
Injury / Suicide 2,568 4,332 4,331 4,359 4,356 4,328Other Causes 5,322 7,935 7,936 7,933 7,931 7,918
φ W_B = weighted using weight W_Baseγ W_E = weighted using weight W_AgEthAdjη W_D = weighted using weight W_ AgDepAdjι W_C = weighted using weight W_ AgICDAdj

Weighting for linkage bias, 81, 86, 91 and 96
Fawcett et al, 2002 65
1981 - 84 LinkedDeaths
ActualDeaths
W_Bφ
AdjustedDeaths
W_Eγ
AdjustedDeaths
W_Dη
Adjusteddeaths
W_Cι
AdjustedDeaths
Cause of Death - detailedCommunicable Diseases 291 468 449 446 445 462
Colorectal Cancer 1,503 1,983 1,980 1,975 1,975 1,980Lung/Bronchus Cancer 2,094 2,838 2,830 2,827 2,823 2,838
Breast Cancer 927 1,221 1,223 1,220 1,217 1,220Prostate Cancer 354 474 475 475 475 474
Other Cancer 4,587 6,213 6,211 6,209 6,212 6,213Diabetes 456 714 719 717 718 714
IHD 9,894 13,251 13,237 13,224 13,227 13,250Other Heart Disease 1,260 1,821 1,842 1,844 1,845 1,821
Cerebrovascular Disease 2,481 3,621 3,625 3,624 3,625 3,621Other Cardiovascular Disease 750 1,008 1,008 1,006 1,008 1,007
Pnuemonia/Influenza 480 816 828 830 829 814COPD 1,344 1,863 1,861 1,859 1,857 1,859
Asthma 408 594 620 618 619 593Other Respiratory 150 213 223 223 223 212
Congenital 153 210 225 226 225 210Perinatal 6 9 6 6 7 6
SIDS 45 66 64 65 65 66RTC 1,137 1,926 1,913 1,920 1,925 1,926
Suicide 588 1,005 1,011 1,021 1,019 1,004Violent 57 117 102 107 103 114
Unintentional Injury other thanRTC 789 1,284 1,304 1,311 1,309 1,284
Other Causes 1,989 2,976 2,934 2,936 2,938 2,976NZ Deprivation Index (4 groups) 18 30 29 29 26 30
Dep 1-4 10,296 14,217 14,198 14,195 14,217 14,203Dep 5-6 6,534 9,147 9,126 9,122 9,147 9,125Dep 7-8 7,056 10,020 10,063 10,060 10,020 10,034
Dep 9-10 7,839 11,286 11,284 11,294 11,286 11,283Miss Dep 18 30 29 29 26 30
NZ Deprivation IndexDep 1 2,226 2,988 3,017 3,016 3,021 3,011Dep 2 2,490 3,486 3,430 3,427 3,433 3,424Dep 3 2,676 3,705 3,704 3,700 3,708 3,718Dep 4 2,901 4,038 4,047 4,052 4,055 4,050Dep 5 3,150 4,449 4,401 4,400 4,410 4,410Dep 6 3,384 4,698 4,725 4,722 4,737 4,715Dep 7 3,273 4,644 4,656 4,655 4,635 4,653Dep 8 3,780 5,379 5,409 5,409 5,388 5,383Dep 9 3,897 5,523 5,531 5,536 5,533 5,529Dep10 3,945 5,766 5,757 5,761 5,756 5,758
Miss Dep 18 30 29 29 26 30Rurality
Urban 24,972 34,275 34,586 34,592 34,587 34,566Minor Urban 3,630 4,956 5,105 5,105 5,104 5,103
Rural & Other 3,141 5,472 5,012 5,007 5,008 5,008
φ W_B = weighted using weight W_Baseγ W_E = weighted using weight W_AgEthAdjη W_D = weighted using weight W_ AgDepAdjι W_C = weighted using weight W_ AgICDAdj

Weighting for linkage bias, 81, 86, 91 and 96
Fawcett et al, 2002 66
1981 - 84 LinkedDeaths
ActualDeaths
W_Bφ
AdjustedDeaths
W_Eγ
AdjustedDeaths
W_Dη
Adjusteddeaths
W_Cι
AdjustedDeaths
Regional Health AuthorityNorthern 8,826 12,819 12,416 12,415 12,413 12,398Midland 5,991 8,847 8,716 8,718 8,711 8,718Central 8,679 11,826 12,143 12,142 12,145 12,119
Southern 8,241 11,208 11,425 11,426 11,429 11,439Missing RHA 6 6 5 5 4 5
Territorial Local AuthorityFar North 348 606 557 555 555 554
Whangarei 546 798 794 792 791 786Kaipara 126 189 189 189 189 186Rodney 339 549 482 480 481 480
North Shore 1,236 1,623 1,683 1,680 1,681 1,684Waitakere 798 1,128 1,121 1,121 1,119 1,120Auckland 3,522 5,034 4,855 4,861 4,862 4,853Manukau 1,425 2,091 2,038 2,035 2,036 2,031Papakura 234 336 324 325 324 328Franklin 252 459 368 370 369 370
Thames Coromandel 255 360 363 363 363 363Hauraki 189 264 274 273 274 273Waikato 261 438 393 392 391 393
Matamata-Piako 282 399 414 413 414 415Hamilton 759 1,086 1,072 1,073 1,072 1,073
Waipa 270 453 380 382 381 380Otorohanga 54 93 83 83 83 83
South Waikato 183 255 272 273 270 272Waitomo 99 165 148 148 146 147
Taupo 234 360 354 356 355 353Western Bay of Plenty 201 360 302 302 301 304
Tauranga 636 897 878 877 876 876Rotorua 489 741 730 730 730 725
Whakatane 249 399 380 378 380 380Kawerau 51 72 80 81 80 80
Opotiki 81 129 140 141 141 141Gisborne 495 696 750 752 750 748
Wairoa 108 192 169 171 170 171Hastings 642 891 910 911 911 907
Napier 579 789 797 797 797 797Central Hawkes Bay 135 186 195 194 194 195
New Plymouth 669 888 931 932 931 936Stratford 90 123 129 128 128 130
South Taranaki 351 498 504 503 504 508Ruapehu 141 246 211 212 212 210
Wanganui 519 744 727 728 727 726Rangitikei 183 279 271 272 271 270Manawatu 216 294 315 315 315 311
Palmerston North 630 834 862 863 863 860Tararua 228 315 330 329 329 329
φ W_B = weighted using weight W_Baseγ W_E = weighted using weight W_AgEthAdjη W_D = weighted using weight W_ AgDepAdjι W_C = weighted using weight W_ AgICDAdj

Weighting for linkage bias, 81, 86, 91 and 96
Fawcett et al, 2002 67
1981 - 84 LinkedDeaths
ActualDeaths
W_Bφ
AdjustedDeaths
W_Eγ
AdjustedDeaths
W_Dη
Adjusteddeaths
W_Cι
AdjustedDeaths
Horowhenua 405 555 583 582 582 581Kapiti Coast 384 534 523 522 522 522
Porirua 345 489 502 501 502 503Upper Hutt 285 378 393 393 393 393Lower Hutt 1,101 1,389 1,512 1,511 1,513 1,512Wellington 1,365 1,809 1,868 1,866 1,868 1,858Masterton 252 339 352 351 351 351Carterton 51 75 76 76 76 76
South Wairarapa 99 135 140 140 141 140Tasman 288 405 411 411 411 413Nelson 459 606 628 628 630 627
Marlborough 366 513 509 509 509 508Kaikoura 48 63 67 67 66 66
Buller 147 201 209 209 208 208Grey 198 261 279 279 279 277
Westland 102 156 157 156 156 156Hurunui 54 87 81 81 81 83
Waimakariri 234 318 330 331 332 329Christchurch 3,081 4,158 4,196 4,199 4,197 4,211
Banks Peninsula 75 96 104 105 105 103Selwyn 120 192 177 177 176 178
Ashburton 297 390 422 421 421 422Timaru 534 735 738 737 739 735
Mackenzie 39 60 61 61 62 60Waimate 90 132 128 128 129 128
Chatham Islands 6 6 8 8 7 8Waitaki 288 384 406 405 405 405
Central Otago 150 210 212 213 213 216Queenstown-Lakes 51 78 71 70 70 71
Dunedin 1,485 1,896 2,025 2,025 2,026 2,032Clutha 216 291 324 323 324 324
Southland 255 387 379 380 381 380Gore 153 210 211 212 212 209
Invercargill 621 912 856 856 855 853TLA Not Applicable 6 6 5 5 4 5

Weighting for linkage bias, 81, 86, 91 and 96
Fawcett et al, 2002 68
Table 38: 1986-1989 Linked and total deaths compared to weighted numbers of linkeddeaths by various sociodemographic variables
1986 - 89 LinkedDeaths
ActualDeaths
W_Bφ
AdjustedDeaths
W_Eγ
AdjustedDeaths
W_Dη
Adjusteddeaths
W_Cι
AdjustedDeaths
Age at Census0 - 14 yrs 726 1,020 1,020 1,020 1,018 1,018
15 - 24 yrs 1,170 2,091 2,091 2,091 2,090 2,08525 - 44 yrs 2,574 4,014 4,014 4,014 4,014 4,00345 - 64 yrs 12,591 16,758 16,758 16,758 16,754 16,75865 - 74 yrs 15,774 20,625 20,625 20,625 20,620 20,625
Age at Census (5 yr groups)0- 4 yrs 309 441 428 441 441 4405- 9 yrs 120 171 172 171 171 171
10-14 yrs 294 405 417 405 403 40415-19 yrs 648 1,062 1,144 1,062 1,062 1,05920-24 yrs 525 1,029 947 1,029 1,028 1,02625-29 yrs 444 816 737 816 816 81330-34 yrs 513 861 825 861 861 85635-39 yrs 717 1,044 1,096 1,044 1,044 1,04140-44 yrs 903 1,293 1,357 1,293 1,293 1,29345-49 yrs 1,419 1,968 1,923 1,968 1,968 1,96850-54 yrs 2,160 2,952 2,887 2,952 2,952 2,95255-59 yrs 3,546 4,758 4,709 4,758 4,755 4,75860-64 yrs 5,469 7,080 7,239 7,080 7,079 7,08065-69 yrs 6,816 8,841 8,924 8,841 8,840 8,84170-74 yrs 8,958 11,784 11,701 11,784 11,780 11,784
SexMales 20,082 27,279 27,279 27,279 27,276 27,274
Females 12,756 17,229 17,229 17,229 17,220 17,215Ethnicity
Maori 1,755 2,955 2,955 2,955 2,961 2,960Pacific People 318 447 447 447 450 448
NonMaoriNonPacNonAs 30,762 41,106 41,106 41,106 41,085 41,082Cause of Death
Cancer 10,494 13,464 13,464 13,439 13,440 13,461Cardiovascular 13,572 18,033 18,032 18,012 18,012 18,032
Injury and Suicide 2,994 4,920 4,919 4,955 4,946 4,920Other 5,775 8,088 8,090 8,099 8,096 8,073
φ W_B = weighted using weight W_Baseγ W_E = weighted using weight W_AgEthAdjη W_D = weighted using weight W_ AgDepAdjι W_C = weighted using weight W_ AgICDAdj

Weighting for linkage bias, 81, 86, 91 and 96
Fawcett et al, 2002 69
1986 – 89 LinkedDeaths
ActualDeaths
W_Bφ
AdjustedDeaths
W_Eγ
AdjustedDeaths
W_Dη
Adjusteddeaths
W_Cι
AdjustedDeaths
Cause of Death – detailedCommunicable Diseases 288 432 411 413 413 430
Colorectal Cancer 1,677 2,076 2,076 2,075 2,074 2,076Lung/Bronchus Cancer 2,256 2,982 2,995 2,985 2,986 2,980
Breast Cancer 1,056 1,341 1,343 1,340 1,339 1,341Prostate Cancer 453 558 556 554 554 557
Other Cancer 5,052 6,501 6,488 6,479 6,481 6,501Diabetes 549 774 779 779 780 772
IHD 9,438 12,294 12,309 12,291 12,291 12,294Other Heart Disease 1,170 1,674 1,667 1,667 1,666 1,674
Cerebrovascular Disease 2,175 3,009 2,999 2,999 3,000 3,009Other Cardiovascular Disease 789 1,062 1,063 1,061 1,061 1,061
Pnuemonia/Influenza 525 789 780 781 783 785COPD 1,428 1,878 1,890 1,886 1,886 1,877
Asthma 393 537 570 572 569 537Other Respiratory 162 237 229 228 229 232
Congenital 177 240 239 241 241 240Perinatal 9 18 14 14 14 17
SIDS 36 45 49 51 52 45RTC 1,332 2,187 2,205 2,213 2,212 2,187
Suicide 840 1,392 1,397 1,417 1,410 1,392Violent 93 180 162 167 163 180
Unintentional Injury other thanRTC 729 1,158 1,151 1,155 1,157 1,158
Other Causes 2,208 3,129 3,120 3,125 3,121 3,129NZ Deprivation Index (4 groups)
Dep 1-4 10,857 14,193 14,186 14,173 14,193 14,172Dep 5-6 6,627 8,919 8,926 8,929 8,919 8,930Dep 7-8 7,497 10,113 10,107 10,111 10,113 10,108
Dep 9-10 7,839 11,244 11,259 11,265 11,244 11,251Miss Dep 15 39 29 29 27 29
NZ Deprivation IndexDep 1 2,298 2,973 2,968 2,966 2,968 2,961Dep 2 2,667 3,471 3,489 3,486 3,494 3,482Dep 3 2,826 3,690 3,693 3,690 3,691 3,695Dep 4 3,069 4,056 4,033 4,029 4,037 4,031Dep 5 3,198 4,335 4,312 4,313 4,311 4,311Dep 6 3,432 4,584 4,613 4,616 4,608 4,619Dep 7 3,642 4,866 4,896 4,898 4,902 4,895Dep 8 3,855 5,244 5,208 5,210 5,208 5,210Dep 9 3,852 5,394 5,484 5,485 5,471 5,482Dep10 3,984 5,853 5,778 5,783 5,776 5,771
Miss Dep 15 39 29 29 27 29Rurality
Urban 25,635 34,266 34,343 34,342 34,331 34,334Minor Urban 3,747 4,989 5,135 5,135 5,135 5,133
Rural & Other 3,456 5,250 5,027 5,028 5,027 5,020
φ W_B = weighted using weight W_Baseγ W_E = weighted using weight W_AgEthAdjη W_D = weighted using weight W_ AgDepAdjι W_C = weighted using weight W_ AgICDAdj

Weighting for linkage bias, 81, 86, 91 and 96
Fawcett et al, 2002 70
1986 – 89 LinkedDeaths
ActualDeaths
W_Bφ
AdjustedDeaths
W_Eγ
AdjustedDeaths
W_Dη
Adjusteddeaths
W_Cι
AdjustedDeaths
Regional Health AuthorityNorthern 9,537 13,242 12,893 12,895 12,895 12,908Midland 6,318 8,826 8,777 8,776 8,770 8,777Central 8,739 11,637 11,824 11,821 11,817 11,810
Southern 8,238 10,800 11,013 11,015 11,013 10,992Missing RHA 6 6 3 3 3 3
Territorial Local AuthorityFar North 417 693 616 614 617 616
Whangarei 585 825 814 814 815 810Kaipara 153 210 215 215 214 213Rodney 453 645 611 609 607 608
North Shore 1,266 1,602 1,637 1,638 1,639 1,638Waitakere 945 1,284 1,269 1,270 1,266 1,272Auckland 3,492 4,794 4,663 4,668 4,666 4,675Manukau 1,689 2,388 2,326 2,327 2,327 2,331Papakura 243 363 331 331 331 335Franklin 294 435 409 408 409 408
Thames Coromandel 243 345 331 331 332 335Hauraki 165 216 229 229 229 227Waikato 288 429 407 409 406 409
Matamata-Piako 258 345 353 352 351 352Hamilton 792 1,074 1,071 1,067 1,068 1,072
Waipa 315 456 433 433 434 436Otorohanga 63 96 94 94 95 95
South Waikato 198 294 291 293 291 290Waitomo 87 123 128 128 129 127
Taupo 249 360 362 361 361 362Western Bay of Plenty 279 423 388 388 387 388
Tauranga 675 939 901 899 900 902Rotorua 516 801 731 731 729 731
Whakatane 327 447 462 464 464 461Kawerau 66 84 96 96 97 96
Opotiki 90 141 138 138 138 138Gisborne 462 657 660 660 659 658
Wairoa 90 156 133 134 134 134Hastings 663 906 910 911 908 909
Napier 606 783 813 812 810 812Central Hawkes Bay 162 204 229 232 232 234
New Plymouth 702 879 945 946 943 948Stratford 93 114 124 123 123 123
South Taranaki 333 432 464 463 464 460Ruapehu 159 237 231 232 231 231
Wanganui 504 702 682 682 682 680Rangitikei 180 264 250 251 252 249Manawatu 246 336 338 338 337 337
Palmerston North 687 885 920 920 920 922Tararua 231 306 315 314 313 314
Horowhenua 432 579 601 602 602 599 φ W_B = weighted using weight W_Baseγ W_E = weighted using weight W_AgEthAdjη W_D = weighted using weight W_ AgDepAdjι W_C = weighted using weight W_ AgICDAdj

Weighting for linkage bias, 81, 86, 91 and 96
Fawcett et al, 2002 71
1986 – 89 LinkedDeaths
ActualDeaths
W_Bφ
AdjustedDeaths
W_Eγ
AdjustedDeaths
W_Dη
Adjusteddeaths
W_Cι
AdjustedDeaths
Kapiti Coast 423 561 562 561 559 559Porirua 333 474 472 471 474 467
Upper Hutt 312 414 418 417 417 414Lower Hutt 1,059 1,353 1,428 1,424 1,425 1,432Wellington 1,239 1,656 1,642 1,644 1,644 1,642Masterton 267 348 365 365 366 362Carterton 66 87 91 90 89 90
South Wairarapa 126 165 174 173 173 173Tasman 297 393 398 397 397 398Nelson 420 534 555 555 556 555
Marlborough 351 468 468 469 468 467Kaikoura 45 54 59 59 59 59
Buller 156 195 223 223 223 222Grey 180 231 244 244 245 243
Westland 111 144 152 153 153 153Hurunui 87 114 119 119 119 118
Waimakariri 240 330 325 324 325 324Christchurch 3,129 4,068 4,131 4,132 4,130 4,133
Banks Peninsula 63 81 83 84 84 84Selwyn 135 183 184 184 184 185
Ashburton 234 297 311 312 313 312Timaru 588 720 773 772 772 769
Mackenzie 21 36 35 35 35 35Waimate 99 135 135 135 134 136
Chatham Islands 6 6 6 6 5 6Waitaki 294 375 396 396 397 396
Central Otago 156 195 214 214 214 212Queenstown-Lakes 63 96 88 88 88 87
Dunedin 1,395 1,818 1,852 1,850 1,847 1,840Clutha 198 267 273 272 274 271
Southland 288 423 400 400 398 398Gore 171 228 231 233 232 232
Invercargill 582 798 773 774 775 770Missing TLA 6 6 3 3 3 3

Weighting for linkage bias, 81, 86, 91 and 96
Fawcett et al, 2002 72
Table 39 1991-1994 Linked and total deaths compared to weighted numbers of linkeddeaths by various sociodemographic variables
1991 - 94 LinkedDeaths
ActualDeaths
W_Bφ
AdjustedDeaths
W_Eγ
AdjustedDeaths
W_Dη
Adjusteddeaths
W_Cι
AdjustedDeaths
Age at Census0 - 14 yrs 573 831 831 831 829 827
15 - 24 yrs 951 1,764 1,764 1,764 1,764 1,75825 - 44 yrs 2,736 4,209 4,209 4,205 4,206 4,19845 - 64 yrs 11,583 14,919 14,919 14,919 14,918 14,91965 - 74 yrs 15,792 19,587 19,587 19,587 19,584 19,586
Age at Census (5 yr groups)0- 4 yrs 264 384 380 384 383 3835- 9 yrs 120 162 166 162 161 161
10-14 yrs 192 282 282 282 282 28015-19 yrs 525 900 974 900 900 89820-24 yrs 423 864 790 864 864 86025-29 yrs 417 804 675 804 804 79730-34 yrs 519 861 812 857 859 85935-39 yrs 744 1,080 1,149 1,080 1,079 1,08040-44 yrs 1,062 1,461 1,569 1,461 1,461 1,45945-49 yrs 1,413 1,881 1,845 1,881 1,881 1,88150-54 yrs 2,103 2,787 2,717 2,787 2,787 2,78755-59 yrs 3,045 3,927 3,940 3,927 3,926 3,92760-64 yrs 5,025 6,327 6,420 6,327 6,327 6,32765-69 yrs 7,200 8,889 8,947 8,889 8,886 8,88870-74 yrs 8,589 10,698 10,640 10,698 10,698 10,698
SexMales 19,101 25,221 25,221 25,221 25,218 25,204
Females 12,534 16,086 16,086 16,082 16,080 16,081Ethnicity
Maori 2,148 3,474 3,474 3,474 3,474 3,481Pacific People 378 657 657 653 654 653
NonMaoriNonPac 29,112 37,182 37,182 37,182 37,176 37,157Cause of Death
Cancer 11,301 13,959 13,954 13,926 13,932 13,954Cardiovascular Diseases 12,111 15,447 15,444 15,409 15,411 15,443
Injury / Suicide 2,667 4,377 4,380 4,442 4,435 4,376Other Causes 5,553 7,524 7,529 7,526 7,519 7,512
φ W_B = weighted using weight W_Baseγ W_E = weighted using weight W_AgEthAdjη W_D = weighted using weight W_ AgDepAdjι W_C = weighted using weight W_ AgICDAdj

Weighting for linkage bias, 81, 86, 91 and 96
Fawcett et al, 2002 73
1991 - 94 LinkedDeaths
ActualDeaths
W_Bφ
AdjustedDeaths
W_Eγ
AdjustedDeaths
W_Dη
Adjusteddeaths
W_Cι
AdjustedDeaths
Cause of Death - detailedCommunicable Diseases 369 546 541 540 540 546
Colorectal Cancer 1,797 2,130 2,135 2,131 2,132 2,126Lung/Bronchus Cancer 2,322 2,943 2,942 2,939 2,937 2,943
Breast Cancer 1,086 1,317 1,318 1,310 1,314 1,316Prostate Cancer 537 645 640 638 638 645
Other Cancer 5,559 6,930 6,925 6,913 6,917 6,930Diabetes 609 822 839 835 835 819
IHD 8,043 10,068 10,072 10,053 10,054 10,066Other Heart Disease 1,230 1,620 1,635 1,631 1,629 1,620
Cerebrovascular Disease 2,046 2,736 2,723 2,714 2,716 2,735Other Cardiovascular Disease 792 1,026 1,018 1,014 1,015 1,025
Pnuemonia/Influenza 312 474 477 478 477 474COPD 1,443 1,800 1,794 1,792 1,789 1,798
Asthma 180 234 253 254 252 229Other Respiratory 216 294 299 301 299 292
Congenital 135 207 201 202 203 207Perinatal 6 9 6 5 6 9
SIDS 45 60 65 65 65 60RTC 1,041 1,749 1,748 1,763 1,766 1,749
Suicide 870 1,434 1,452 1,484 1,481 1,434Violent 99 186 155 159 159 185
Unintentional Injury other thanRTC 663 1,005 1,023 1,033 1,027 1,005
Other Causes 2,241 3,078 3,055 3,054 3,053 3,078NZ Deprivation Index (4 groups)
Dep 1-4 10,890 13,689 13,664 13,655 13,689 13,652Dep 5-6 6,255 8,019 8,025 8,023 8,019 8,013Dep 7-8 6,951 9,165 9,183 9,187 9,165 9,187
Dep 9-10 7,497 10,350 10,374 10,375 10,350 10,370Miss Dep 42 87 64 65 78 65
NZ Deprivation IndexDep 1 2,505 3,069 3,099 3,100 3,106 3,098Dep 2 2,610 3,291 3,274 3,271 3,280 3,271Dep 3 2,871 3,606 3,615 3,612 3,620 3,607Dep 4 2,901 3,723 3,675 3,673 3,683 3,676Dep 5 3,102 3,978 3,988 3,983 3,984 3,983Dep 6 3,153 4,041 4,038 4,040 4,035 4,030Dep 7 3,429 4,545 4,518 4,518 4,507 4,518Dep 8 3,519 4,623 4,668 4,672 4,661 4,672Dep 9 3,753 4,995 5,134 5,135 5,127 5,140Dep10 3,747 5,355 5,239 5,240 5,223 5,230
Miss Dep 42 87 64 65 78 65Rurality
Urban 24,159 31,122 31,176 31,175 31,164 31,165Minor Urban 3,921 4,977 5,124 5,122 5,117 5,124
Rural & Other 3,555 5,211 5,009 5,008 5,020 4,999 φ W_B = weighted using weight W_Baseγ W_E = weighted using weight W_AgEthAdjη W_D = weighted using weight W_ AgDepAdjι W_C = weighted using weight W_ AgICDAdj

Weighting for linkage bias, 81, 86, 91 and 96
Fawcett et al, 2002 74
1991 - 94 LinkedDeaths
ActualDeaths
W_Bφ
AdjustedDeaths
W_Eγ
AdjustedDeaths
W_Dη
Adjusteddeaths
W_Cι
AdjustedDeaths
Regional Health AuthorityNorthern 9,078 12,378 11,932 11,936 11,929 11,930Midland 6,561 8,766 8,750 8,749 8,747 8,738Central 8,283 10,494 10,743 10,742 10,743 10,735
Southern 7,695 9,618 9,859 9,853 9,850 9,858Missing RHA 18 57 28 28 33 28
Territorial Local AuthorityFar North 459 714 656 656 656 655
Whangarei 603 819 806 808 804 806Kaipara 159 222 220 220 219 221Rodney 540 711 690 688 691 687
North Shore 1,218 1,497 1,521 1,520 1,522 1,520Waitakere 999 1,335 1,292 1,296 1,294 1,292Auckland 2,790 3,819 3,645 3,643 3,646 3,645Manukau 1,704 2,394 2,294 2,297 2,292 2,294Papakura 285 408 373 371 371 372Franklin 312 450 427 427 427 431
Thames Coromandel 306 405 400 400 400 400Hauraki 186 249 250 252 251 251Waikato 303 414 417 417 416 416
Matamata-Piako 273 354 365 365 365 363Hamilton 780 1,005 1,015 1,015 1,017 1,015
Waipa 288 402 376 377 378 377Otorohanga 60 90 82 82 82 81
South Waikato 237 318 328 327 325 325Waitomo 93 123 130 129 130 128
Taupo 279 375 377 377 378 378Western Bay of Plenty 279 381 375 374 375 372
Tauranga 774 996 990 991 991 988Rotorua 573 771 782 782 780 779
Whakatane 306 450 428 428 427 428Kawerau 66 93 103 101 102 103
Opotiki 75 132 109 108 108 109Gisborne 447 648 615 616 614 618
Wairoa 147 198 209 209 209 209Hastings 633 828 834 832 832 832
Napier 576 714 739 738 736 737Central Hawkes Bay 138 165 185 185 186 185
New Plymouth 720 894 926 927 928 927Stratford 90 114 120 120 121 120
South Taranaki 315 411 420 419 421 418Ruapehu 126 192 180 180 178 180
Wanganui 510 672 660 662 660 663Rangitikei 186 234 244 243 244 244Manawatu 225 297 299 298 299 299
φ W_B = weighted using weight W_Baseγ W_E = weighted using weight W_AgEthAdjη W_D = weighted using weight W_ AgDepAdjι W_C = weighted using weight W_ AgICDAdj

Weighting for linkage bias, 81, 86, 91 and 96
Fawcett et al, 2002 75
1991 - 94 LinkedDeaths
ActualDeaths
W_Bφ
AdjustedDeaths
W_Eγ
AdjustedDeaths
W_Dη
Adjusteddeaths
W_Cι
AdjustedDeaths
Palmerston North 585 756 754 755 755 754Tararua 207 243 272 272 273 272
Horowhenua 420 555 544 544 543 538Kapiti Coast 474 579 589 588 587 591
Porirua 357 486 487 486 486 485Upper Hutt 345 414 441 440 441 442Lower Hutt 906 1,107 1,173 1,174 1,173 1,174Wellington 1,110 1,395 1,407 1,410 1,413 1,410Masterton 234 288 310 310 309 309Carterton 78 90 101 101 100 99
South Wairarapa 117 141 156 156 156 155Tasman 312 396 400 400 401 399Nelson 372 474 474 476 476 477
Marlborough 327 408 424 421 421 420Kaikoura 45 54 57 57 57 56
Buller 153 195 203 204 203 202Grey 156 186 201 201 199 200
Westland 90 117 120 120 120 121Hurunui 93 114 127 128 127 128
Waimakariri 273 360 346 347 347 345Christchurch 3,039 3,747 3,858 3,854 3,852 3,856
Banks Peninsula 66 87 90 90 91 89Selwyn 111 159 145 144 145 143
Ashburton 246 300 316 316 316 314Timaru 528 633 668 667 667 668
Mackenzie 39 48 53 53 53 52Waimate 96 108 120 119 119 119
Chatham Islands 9 12 16 16 19 17Waitaki 264 342 333 333 333 332
Central Otago 171 198 223 223 223 226Queenstown-Lakes 57 72 72 72 72 72
Dunedin 1,104 1,356 1,408 1,409 1,405 1,411Clutha 183 231 239 239 239 242
Southland 258 357 343 343 345 342Gore 141 174 178 178 178 178
Invercargill 579 765 740 737 737 742TLA not applicable 18 57 28 28 33 28

Weighting for linkage bias, 81, 86, 91 and 96
Fawcett et al, 2002 76
Table 40 1996-1999 Linked and total deaths compared to weighted numbers of linkeddeaths by various sociodemographic variables
1996 - 99 LinkedDeaths
ActualDeaths
W_Bφ
AdjustedDeaths
W_Eγ
AdjustedDeaths
W_Dη
Adjusteddeaths
W_Cι
AdjustedDeaths
Age at Census0 - 14 yrs 561 810 810 809 807 807
15 - 24 yrs 822 1,482 1,482 1,482 1,482 1,47625 - 44 yrs 2,721 4,209 4,209 4,207 4,207 4,20445 - 64 yrs 11,052 14,031 14,031 14,031 14,031 14,02965 - 74 yrs 15,732 18,993 18,993 18,993 18,993 18,993
Age at Census (5 yr groups)0- 4 yrs 249 348 357 347 347 3475- 9 yrs 108 141 154 141 140 141
10-14 yrs 204 318 296 318 317 31615-19 yrs 438 741 790 741 741 73920-24 yrs 387 738 689 738 738 73425-29 yrs 402 780 667 778 780 77830-34 yrs 567 930 899 930 928 93035-39 yrs 786 1,137 1,209 1,137 1,137 1,13640-44 yrs 966 1,365 1,437 1,365 1,365 1,36345-49 yrs 1,593 2,100 2,051 2,100 2,100 2,09950-54 yrs 2,079 2,703 2,658 2,703 2,703 2,70355-59 yrs 3,042 3,876 3,857 3,876 3,876 3,87560-64 yrs 4,335 5,346 5,459 5,346 5,346 5,34665-69 yrs 6,837 8,238 8,315 8,238 8,238 8,23870-74 yrs 8,895 10,758 10,681 10,758 10,758 10,758
SexMales 18,471 24,021 24,021 24,021 24,017 24,015
Females 12,414 15,504 15,504 15,501 15,503 15,494Sole Ethnicity
Maori 3,675 5,643 5,616 5,618 5,616 5,595Pacific People 990 1,539 1,540 1,540 1,544 1,536
Asian 375 561 558 556 555 557NonMaori NonPacific NonAsian 25,851 31,782 31,811 31,809 31,805 31,820
Prioritised EthnicityMaori 3,981 6,108 6,108 6,108 6,103 6,085
Pacific People 1,053 1,635 1,635 1,635 1,640 1,632Asian 396 597 597 594 595 594
NonMaori NonPacific NonAsian 25,458 31,188 31,188 31,188 31,185 31,200Cause of Death
Cancer 11,910 14,499 14,499 14,478 14,472 14,496Cardiovascular Diseases 10,275 12,888 12,881 12,857 12,860 12,887
Injury / Suicide 2,544 4,200 4,200 4,252 4,256 4,197Other Causes 6,162 7,938 7,945 7,935 7,932 7,929
φ W_B = weighted using weight W_Baseγ W_E = weighted using weight W_AgEthAdjη W_D = weighted using weight W_ AgDepAdjι W_C = weighted using weight W_ AgICDAdj

Weighting for linkage bias, 81, 86, 91 and 96
Fawcett et al, 2002 77
1996 - 99 LinkedDeaths
ActualDeaths
W_Bφ
AdjustedDeaths
W_Eγ
AdjustedDeaths
W_Dη
Adjusteddeaths
W_Cι
AdjustedDeaths
Cause of Death – detailedCommunicable Diseases 291 408 386 386 385 408
Colorectal Cancer 1,800 2,154 2,151 2,148 2,146 2,153Lung/Bronchus Cancer 2,448 3,027 3,025 3,015 3,015 3,026
Breast Cancer 1,152 1,374 1,380 1,378 1,375 1,374Prostate Cancer 552 660 659 658 657 659
Other Cancer 5,955 7,284 7,284 7,278 7,278 7,284Diabetes 846 1,110 1,120 1,118 1,121 1,109
IHD 6,573 8,151 8,162 8,139 8,138 8,150Other Heart Disease 1,314 1,722 1,732 1,735 1,734 1,722
Cerebrovascular Disease 1,656 2,130 2,107 2,105 2,107 2,130Other Cardiovascular Disease 732 885 880 879 880 885
Pnuemonia/Influenza 222 303 300 299 299 297COPD 1,575 1,920 1,921 1,918 1,918 1,920
Asthma 231 285 308 307 307 284Other Respiratory 210 267 275 275 274 266
Congenital 216 276 282 283 281 276Perinatal 6 6 9 8 9 6
SIDS 24 33 33 32 32 33RTC 843 1,440 1,409 1,419 1,419 1,440
Suicide 1,017 1,674 1,696 1,728 1,729 1,674Violent 90 159 152 155 156 156
Unintentional Injury other thanRTC 597 927 943 949 953 927
Other Causes 2,538 3,324 3,304 3,303 3,300 3,324NZ Deprivation Index (4 groups)
Dep 1-4 10,317 12,723 12,728 12,728 12,723 12,723Dep 5-6 6,060 7,611 7,602 7,603 7,611 7,598Dep 7-8 6,954 8,907 8,935 8,929 8,907 8,938
Dep 9-10 7,482 10,137 10,154 10,155 10,137 10,142Miss Dep 75 147 106 107 142 108
NZ Deprivation IndexDep 1 2,289 2,829 2,788 2,789 2,787 2,790Dep 2 2,553 3,114 3,131 3,134 3,133 3,127Dep 3 2,601 3,234 3,229 3,229 3,228 3,238Dep 4 2,874 3,546 3,580 3,577 3,575 3,568Dep 5 2,961 3,678 3,706 3,702 3,711 3,706Dep 6 3,096 3,930 3,893 3,898 3,897 3,889Dep 7 3,309 4,236 4,218 4,221 4,210 4,220Dep 8 3,645 4,674 4,721 4,711 4,700 4,721Dep 9 3,696 4,884 4,893 4,901 4,889 4,897Dep10 3,786 5,256 5,264 5,257 5,251 5,247
Miss Dep 75 147 106 107 142 108
φ W_B = weighted using weight W_Baseγ W_E = weighted using weight W_AgEthAdjη W_D = weighted using weight W_ AgDepAdjι W_C = weighted using weight W_ AgICDAdj

Weighting for linkage bias, 81, 86, 91 and 96
Fawcett et al, 2002 78
1996 - 99 LinkedDeaths
ActualDeaths
W_Bφ
AdjustedDeaths
W_Eγ
AdjustedDeaths
W_Dη
Adjusteddeaths
W_Cι
AdjustedDeaths
RuralityUrban 23,346 29,622 29,640 29,647 29,623 29,640
Minor Urban 3,984 5,031 5,101 5,094 5,091 5,096Rural & Other 3,558 4,872 4,784 4,781 4,806 4,774
Regional Health AuthorityNorthern 9,060 12,045 11,777 11,775 11,776 11,774Midland 6,546 8,586 8,560 8,553 8,533 8,541Central 7,839 9,903 9,945 9,953 9,944 9,954
Southern 7,392 8,880 9,169 9,166 9,161 9,164Missing RHA 54 114 77 78 108 79
Territorial Local AuthorityFar North 576 825 801 798 799 800
Whangarei 648 867 846 847 845 847Kaipara 177 240 230 230 229 230Rodney 603 774 749 748 748 746
North Shore 1,095 1,374 1,345 1,345 1,346 1,345Waitakere 1,122 1,431 1,452 1,449 1,452 1,450Auckland 2,445 3,291 3,165 3,160 3,165 3,162Manukau 1,776 2,394 2,383 2,390 2,387 2,385Papakura 255 375 335 337 336 336Franklin 360 477 474 474 472 475
Thames Coromandel 306 372 381 380 379 379Hauraki 180 225 233 232 232 234Waikato 330 453 436 436 436 433
Matamata-Piako 264 333 339 337 337 337Hamilton 789 1,023 1,008 1,005 1,002 1,005
Waipa 321 450 409 410 410 412Otorohanga 60 96 86 86 86 86
South Waikato 213 285 295 293 295 294Waitomo 99 138 139 137 137 137
Taupo 285 372 385 388 388 386Western Bay of Plenty 303 414 394 396 396 395
Tauranga 762 987 954 955 950 952Rotorua 618 822 831 834 829 832
Whakatane 306 432 420 418 416 419Kawerau 99 120 135 135 136 134
Opotiki 117 171 159 160 160 160Gisborne 516 678 713 710 708 707
Wairoa 111 153 150 151 151 152Hastings 597 789 785 789 788 785
Napier 543 696 679 680 680 676Central Hawkes Bay 114 132 146 147 147 147
New Plymouth 558 669 692 690 688 688Stratford 75 93 98 98 97 97
South Taranaki 246 312 317 316 315 316Ruapehu 147 204 199 199 198 200
φ W_B = weighted using weight W_Baseγ W_E = weighted using weight W_AgEthAdjη W_D = weighted using weight W_ AgDepAdjι W_C = weighted using weight W_ AgICDAdj

Weighting for linkage bias, 81, 86, 91 and 96
Fawcett et al, 2002 79
1996 - 99 LinkedDeaths
ActualDeaths
W_Bφ
AdjustedDeaths
W_Eγ
AdjustedDeaths
W_Dη
Adjusteddeaths
W_Cι
AdjustedDeaths
Wanganui 486 654 619 620 620 620Rangitikei 159 219 210 211 210 212Manawatu 183 246 240 239 239 240
Palmerston North 567 708 708 708 707 707Tararua 174 216 227 227 226 225
Horowhenua 435 525 548 548 548 551Kapiti Coast 465 564 573 573 572 573
Porirua 375 504 499 497 499 497Upper Hutt 354 432 439 439 440 438Lower Hutt 807 993 1,024 1,025 1,024 1,024Wellington 987 1,221 1,256 1,260 1,256 1,266Masterton 237 288 299 298 298 298Carterton 69 84 88 87 87 86
South Wairarapa 93 117 116 117 117 117Tasman 312 405 392 392 392 392Nelson 351 432 424 423 423 426
Marlborough 369 462 458 458 457 460Kaikoura 39 51 47 47 46 47
Buller 126 153 161 162 161 162Grey 138 171 172 174 173 173
Westland 99 120 125 125 125 127Hurunui 84 108 113 114 113 115
Waimakariri 276 342 343 343 343 342Christchurch 2,763 3,300 3,420 3,417 3,418 3,418
Banks Peninsula 57 66 69 69 70 68Selwyn 105 144 139 138 139 138
Ashburton 273 321 334 334 333 333Timaru 510 603 628 627 626 625
Mackenzie 33 39 43 43 43 43Waimate 84 96 104 103 103 104
Chatham Islands 6 12 9 9 11 9Waitaki 252 318 314 314 314 313
Central Otago 168 192 203 203 203 201Queenstown-Lakes 96 114 119 119 119 118
Dunedin 1,098 1,317 1,353 1,353 1,353 1,358Clutha 162 189 204 204 205 205
Southland 267 324 339 338 337 338Gore 153 189 191 191 191 191
Invercargill 600 717 745 743 742 742TLA Not Applicable 54 114 77 78 108 79

Weighting for linkage bias, 81, 86, 91 and 96
Fawcett et al, 2002 80
Table 41 Odds Ratios for All Cause Mortality by Deciles of NZDep91, ages 25-64 yrs.Comparison of unweighted and weighted ORs using the four different weights, 1991-1994 .
WeightNZDep Decile No Weight W_Base W_AgEthAdj W_AgDepAdj W_AgICDAdj
Females 25-44 yrsDep 1 1 1 1 1 1Dep 2 0.97 (0.72-1.31) 0.95 (0.74-1.23) 0.94 (0.73-1.22) 0.94 (0.73-1.22) 0.93 (0.72-1.21)Dep 3 0.96 (0.71-1.30) 0.96 (0.74-1.24) 0.93 (0.72-1.21) 0.95 (0.74-1.23) 0.92 (0.71-1.20)Dep 4 1.02 (0.75-1.37) 1.04 (0.80-1.34) 1.03 (0.79-1.33) 1.02 (0.79-1.32) 1.01 (0.79-1.31)Dep 5 1.24 (0.93-1.65) 1.28 (1.00-1.64) 1.26 (0.98-1.61) 1.20 (0.93-1.53) 1.25 (0.97-1.59)Dep 6 1.49 (1.13-1.97) 1.51 (1.19-1.91) 1.48 (1.17-1.88) 1.41 (1.11-1.79) 1.43 (1.13-1.82)Dep 7 1.55 (1.18-2.04) 1.58 (1.25-2.01) 1.55 (1.22-1.96) 1.51 (1.20-1.92) 1.54 (1.22-1.95)Dep 8 1.56 (1.19-2.05) 1.59 (1.26-2.02) 1.57 (1.24-1.99) 1.54 (1.22-1.94) 1.53 (1.21-1.94)Dep 9 1.63 (1.24-2.15) 1.74 (1.38-2.19) 1.72 (1.36-2.17) 1.68 (1.33-2.11) 1.72 (1.36-2.16)Dep10 2.04 (1.56-2.66) 2.20 (1.75-2.76) 2.15 (1.71-2.69) 2.11 (1.69-2.65) 2.10 (1.68-2.63)
Females 45-64 yrDep 1 1 1 1 1 1Dep 2 1.13 (0.98-1.30) 1.15 (1.01-1.31) 1.15 (1.01-1.31) 1.15 (1.01-1.31) 1.15 (1.00-1.31)Dep 3 1.21 (1.05-1.39) 1.23 (1.08-1.40) 1.23 (1.08-1.40) 1.23 (1.08-1.40) 1.24 (1.08-1.41)Dep 4 1.22 (1.05-1.41) 1.25 (1.10-1.43) 1.25 (1.10-1.42) 1.25 (1.10-1.43) 1.25 (1.10-1.43)Dep 5 1.41 (1.22-1.62) 1.44 (1.27-1.64) 1.44 (1.27-1.64) 1.44 (1.27-1.64) 1.44 (1.27-1.63)Dep 6 1.38 (1.20-1.59) 1.40 (1.23-1.59) 1.40 (1.23-1.59) 1.40 (1.23-1.59) 1.40 (1.23-1.60)Dep 7 1.45 (1.26-1.67) 1.55 (1.37-1.76) 1.55 (1.37-1.76) 1.55 (1.36-1.75) 1.55 (1.37-1.76)Dep 8 1.60 (1.39-1.84) 1.72 (1.52-1.95) 1.71 (1.51-1.94) 1.71 (1.51-1.94) 1.72 (1.52-1.95)Dep 9 1.94 (1.70-2.22) 2.06 (1.83-2.33) 2.06 (1.83-2.33) 2.06 (1.83-2.32) 2.07 (1.83-2.33)Dep10 2.03 (1.77-2.33) 2.17 (1.92-2.46) 2.19 (1.94-2.47) 2.17 (1.92-2.45) 2.18 (1.93-2.46)
Males 25-44 yrsDep 1 1 1 1 1 1Dep 2 1.26 (0.98-1.61) 1.24 (1.01-1.51) 1.21 (0.99-1.48) 1.21 (0.99-1.48) 1.20 (0.98-1.46)Dep 3 1.18 (0.91-1.51) 1.18 (0.96-1.45) 1.17 (0.95-1.44) 1.17 (0.95-1.43) 1.15 (0.93-1.41)Dep 4 1.38 (1.08-1.77) 1.36 (1.11-1.65) 1.35 (1.10-1.64) 1.34 (1.10-1.63) 1.34 (1.10-1.63)Dep 5 1.36 (1.07-1.75) 1.41 (1.15-1.71) 1.37 (1.13-1.68) 1.35 (1.11-1.65) 1.40 (1.15-1.71)Dep 6 1.63 (1.29-2.07) 1.70 (1.40-2.05) 1.69 (1.39-2.04) 1.64 (1.35-1.98) 1.67 (1.38-2.02)Dep 7 1.66 (1.31-2.11) 1.75 (1.45-2.12) 1.71 (1.42-2.07) 1.69 (1.40-2.05) 1.73 (1.43-2.09)Dep 8 1.87 (1.48-2.36) 1.97 (1.64-2.38) 1.97 (1.64-2.38) 1.95 (1.62-2.35) 1.98 (1.64-2.39)Dep 9 2.02 (1.60-2.55) 2.29 (1.91-2.75) 2.22 (1.85-2.67) 2.17 (1.80-2.60) 2.19 (1.82-2.64)Dep10 2.33 (1.84-2.94) 2.57 (2.14-3.09) 2.53 (2.10-3.05) 2.44 (2.03-2.94) 2.47 (2.05-2.97)
Males 45-64 yrsDep 1 1 1 1 1 1Dep 2 1.10 (0.98-1.24) 1.11 (1.00-1.23) 1.10 (0.99-1.23) 1.10 (0.99-1.23) 1.10 (0.99-1.23)Dep 3 1.21 (1.08-1.36) 1.22 (1.10-1.36) 1.22 (1.10-1.36) 1.22 (1.10-1.35) 1.23 (1.10-1.36)Dep 4 1.33 (1.18-1.49) 1.35 (1.22-1.50) 1.35 (1.22-1.50) 1.35 (1.22-1.50) 1.36 (1.22-1.50)Dep 5 1.35 (1.21-1.52) 1.41 (1.27-1.56) 1.41 (1.27-1.56) 1.42 (1.28-1.57) 1.41 (1.27-1.56)Dep 6 1.43 (1.28-1.60) 1.49 (1.34-1.64) 1.49 (1.34-1.65) 1.49 (1.35-1.65) 1.49 (1.34-1.65)Dep 7 1.64 (1.47-1.83) 1.70 (1.54-1.88) 1.70 (1.54-1.88) 1.70 (1.53-1.87) 1.70 (1.54-1.88)Dep 8 1.68 (1.51-1.88) 1.77 (1.60-1.95) 1.77 (1.60-1.95) 1.76 (1.59-1.94) 1.77 (1.61-1.96)Dep 9 1.95 (1.75-2.18) 2.16 (1.96-2.37) 2.16 (1.96-2.37) 2.15 (1.96-2.37) 2.17 (1.97-2.38)Dep10 2.16 (1.94-2.41) 2.35 (2.14-2.60) 2.35 (2.13-2.59) 2.34 (2.13-2.58) 2.36 (2.14-2.60)

Weighting for linkage bias, 81, 86, 91 and 96
Fawcett et al, 2002 81
Table 42 Odds Ratios for Four Causes Mortality by Quintiles of NZDep91, ages 25-64 yrs.Comparison of unweighted and weighted ORs using the four different weights
WeightingCause ofDeath
Quintile ofDeprivation No Weight W_Base W_AgEthAdj W_AgDepAdj W_AgICdAdj
FemalesCancer Quintile 1 1 1 1 1 1
Quintile 2 1.06 (0.94-1.20) 1.07 (0.96-1.20) 1.07 (0.96-1.19) 1.07 (0.96-1.19) 1.08 (0.97-1.20)Quintile 3 1.19 (1.06-1.34) 1.22 (1.10-1.36) 1.22 (1.10-1.36) 1.21 (1.09-1.34) 1.23 (1.10-1.36)Quintile 4 1.24 (1.10-1.40) 1.30 (1.17-1.45) 1.30 (1.17-1.45) 1.29 (1.16-1.43) 1.31 (1.18-1.46)Quintile 5 1.41 (1.25-1.59) 1.48 (1.33-1.65) 1.48 (1.33-1.65) 1.47 (1.32-1.63) 1.48 (1.33-1.65)
CVD Quintile 1 1 1 1 1 1Quintile 2 1.34 (1.10-1.64) 1.36 (1.14-1.63) 1.36 (1.13-1.63) 1.36 (1.14-1.63) 1.37 (1.14-1.64)Quintile 3 1.58 (1.30-1.93) 1.62 (1.36-1.93) 1.62 (1.36-1.93) 1.60 (1.34-1.90) 1.61 (1.35-1.92)Quintile 4 1.80 (1.49-2.18) 1.99 (1.68-2.36) 1.99 (1.68-2.36) 1.98 (1.67-2.34) 1.99 (1.68-2.36)Quintile 5 2.59 (2.15-3.11) 2.75 (2.33-3.24) 2.75 (2.33-3.25) 2.74 (2.32-3.23) 2.74 (2.33-3.23)
Injury Quintile 1 1 1 1 1 1Quintile 2 1.21 (0.74-1.98) 1.23 (0.81-1.88) 1.23 (0.81-1.87) 1.24 (0.82-1.87) 1.19 (0.78-1.80)Quintile 3 1.53 (0.95-2.46) 1.56 (1.04-2.34) 1.55 (1.04-2.31) 1.50 (1.00-2.24) 1.42 (0.95-2.14)Quintile 4 1.35 (0.83-2.20) 1.41 (0.93-2.14) 1.39 (0.92-2.10) 1.36 (0.90-2.06) 1.33 (0.88-2.01)Quintile 5 2.36 (1.50-3.73) 2.52 (1.72-3.71) 2.49 (1.70-3.65) 2.46 (1.68-3.60) 2.38 (1.62-3.50)
Suicide Quintile 1 1 1 1 1 1Quintile 2 0.95 (0.54-1.68) 0.96 (0.59-1.55) 0.94 (0.58-1.52) 0.94 (0.58-1.52) 1.00 (0.62-1.62)Quintile 3 1.49 (0.88-2.50) 1.62 (1.04-2.50) 1.60 (1.04-2.47) 1.57 (1.01-2.42) 1.66 (1.07-2.58)Quintile 4 1.43 (0.83-2.46) 1.64 (1.05-2.57) 1.62 (1.04-2.52) 1.62 (1.05-2.52) 1.64 (1.05-2.57)Quintile 5 1.88 (1.10-3.23) 1.86 (1.18-2.95) 1.79 (1.13-2.83) 1.76 (1.12-2.79) 1.88 (1.19-2.99)
MalesCancer Quintile 1 1 1 1 1 1
Quintile 2 1.07 (0.95-1.20) 1.08 (0.97-1.19) 1.08 (0.97-1.20) 1.07 (0.97-1.20) 1.08 (0.97-1.20)Quintile 3 1.17 (1.04-1.31) 1.20 (1.08-1.33) 1.21 (1.09-1.34) 1.21 (1.09-1.35) 1.20 (1.08-1.33)
Quintile 4 1.28 (1.14-1.44) 1.29 (1.16-1.43) 1.30 (1.17-1.44) 1.29 (1.16-1.43) 1.29 (1.16-1.44)Quintile 5 1.47 (1.31-1.66) 1.62 (1.46-1.80) 1.63 (1.47-1.81) 1.62 (1.46-1.80) 1.63 (1.47-1.80)
CVD Quintile 1 1 1 1 1 1Quintile 2 1.28 (1.14-1.44) 1.29 (1.16-1.43) 1.29 (1.16-1.44) 1.29 (1.16-1.43) 1.29 (1.16-1.44)Quintile 3 1.33 (1.18-1.50) 1.39 (1.25-1.55) 1.39 (1.25-1.55) 1.39 (1.25-1.55) 1.40 (1.26-1.56)Quintile 4 1.70 (1.52-1.90) 1.81 (1.63-2.00) 1.80 (1.63-1.99) 1.79 (1.62-1.98) 1.81 (1.64-2.00)Quintile 5 2.12 (1.89-2.37) 2.32 (2.10-2.57) 2.32 (2.10-2.57) 2.30 (2.08-2.54) 2.32 (2.10-2.57)
Injury Quintile 1 1 1 1 1 1Quintile 2 1.05 (0.80-1.38) 1.08 (0.86-1.35) 1.09 (0.88-1.36) 1.09 (0.88-1.36) 1.12 (0.90-1.41)Quintile 3 1.29 (0.99-1.68) 1.40 (1.13-1.73) 1.40 (1.13-1.73) 1.36 (1.10-1.68) 1.42 (1.15-1.76)Quintile 4 1.42 (1.10-1.85) 1.63 (1.32-2.00) 1.66 (1.35-2.03) 1.62 (1.32-1.99) 1.65 (1.34-2.04)Quintile 5 1.49 (1.14-1.95) 1.80 (1.46-2.22) 1.81 (1.47-2.23) 1.76 (1.43-2.17) 1.79 (1.44-2.21)
Suicide Quintile 1 1 1 1 1 1Quintile 2 1.19 (0.87-1.61) 1.20 (0.93-1.55) 1.19 (0.93-1.53) 1.19 (0.93-1.52) 1.18 (0.91-1.52)Quintile 3 1.05 (0.76-1.45) 1.24 (0.96-1.61) 1.24 (0.96-1.59) 1.19 (0.93-1.53) 1.23 (0.95-1.59)Quintile 4 1.55 (1.15-2.10) 1.70 (1.33-2.17) 1.66 (1.31-2.11) 1.64 (1.29-2.08) 1.69 (1.33-2.16)Quintile 5 1.60 (1.16-2.19) 1.88 (1.46-2.42) 1.83 (1.43-2.35) 1.79 (1.40-2.30) 1.86 (1.44-2.39)

Weighting for linkage bias, 81, 86, 91 and 96
Fawcett et al, 2002 82
5.1 SAS code for stratification of mortality records
5.1.1 1981-1984 Weighting strata
data JFbias812;set JFB812;length B_D B_E B_A B_S B_U B_C $1;/* groupings for cause of death*/if AgeAtCensus lt 4 then B_C=CauseDeath;if ageatCensus GE 4 then B_C=Cod16Gp;/* groupings for ethnicity*/B_E=put(M_Ethnic,fiL_E.);/* RHA groups*/B_S=put(sex_nmds, fiL_S.);/* rurality*/B_U=put(Rural2, fiL_U.);/*Age*/B_A=put(AgLB,fiL_A.);/*Dep*/B_D=put(NZDepfour, fiL_D.);/* RHA groups*/B_R=put(RHA2, fiL_R.);CatLink='A:'||B_A||'/S:'||B_S||'/C:'||B_C||'/D:'||B_D||'/U:'||B_U;ECATLink=CatLink||'/E:'||B_E;CodCat='C:'||icd_gp||'/A:'||B_A||'/S:'||B_S||'/E:'||B_E;SexbyAG5Gp=Ag5Gp||B_S||B_E;SEXbyAG5GpbyDep=Ag5Gp||B_S||B_D;SEXbyAG5GpbyCOD=Ag5Gp||B_S||icd_Gp;run;
set JFBias812;/* regroupings by age. 0-14 yrs*/if B_A eq 'C' then do;
if B_D eq 'Z' then B_D = 'E';
IF B_E eq 'P' then do;B_U = 'A';B_R = 'A';if B_C in ('M','N') then B_C = 'R';else B_C = 'S';B_D = 'A';end;
IF B_E eq 'M' then do;B_R = 'A';B_U = 'A';if B_C in ('G','L')then B_C = 'Q';if B_C in ('M','N')then B_C = 'R';if B_C in ('P','U')then B_C = 'W';if B_D in ('B','C','D')then B_D = 'H';if B_C eq 'Q' then B_D = 'A';end;
if B_E eq 'R' then do;B_R = 'A';B_U = 'A';

Weighting for linkage bias, 81, 86, 91 and 96
Fawcett et al, 2002 83
if B_C in ('G','L') then B_C = 'Q';if B_C in ('M','N')then B_C = 'R';end;
end;/*15-24 yrs*/if B_A='H' then do;
if B_D eq 'Z' then B_D = 'E';B_R = 'A';B_U = 'A';
If B_E in ('P','M') then B_E = 'B';
if B_E eq 'B' then do;if B_C in ('G','L') then B_C = 'Q';if B_C in ('P','U') then B_C = 'W';if B_C in ('M','N') then B_C = 'R';if B_D in ('B','C','D')and B_C in ('Q','W') then B_D = 'H';if B_D in ('B','C')and B_C eq 'R' then B_D = 'G';end;
if B_E eq 'R' then do;if B_C in ('P','U') then B_C = 'W';if B_C in ('G','L') then B_C = 'Q';if B_D in ('B','C') and B_C eq 'L' then B_D = 'G'; If B_C eq 'M' then B_C=put(icd_gp,$F16dth.);if B_C eq '!' then B_D = 'A';if B_C eq 'N' and B_S eq 'F' then do;
if B_D in ('B','C') then B_D = 'G';else B_D = 'K';end;
if B_C eq '%' and B_S eq 'M' then B_U=put(Rural2, fiL_U.);end;
end;
/* 25-44 yrs*/
if B_A='R' then do;if B_D eq 'Z' then B_D = 'E';B_R = 'A';B_U = 'A';If B_C in ('P','U') then B_C = 'W';
if B_E in ('P','M') then B_E = 'B';
if B_E eq 'B' then do;if B_C eq'M' then B_C=put(icd_Gp,$F16dth.);if B_C in ('!','^') then B_C = '$';if B_C in ('%','$')then do;
if B_D in ('B','C','D') and B_S eq 'M' then B_D = 'H';if B_S eq 'F' then B_D = 'A';end;
if B_D in ('B','C','D') and B_C eq 'N' then B_D = 'H';end;
if B_E eq 'R' then do;if B_C in ('G','L','M','N') then B_C=put(icd_Gp,$F16dth.);if B_C in ('!','^') then B_C = '$';if B_C in ('K','C') then do;
if B_D in ('D','E') then B_D = 'K';else B_D = 'G';end;
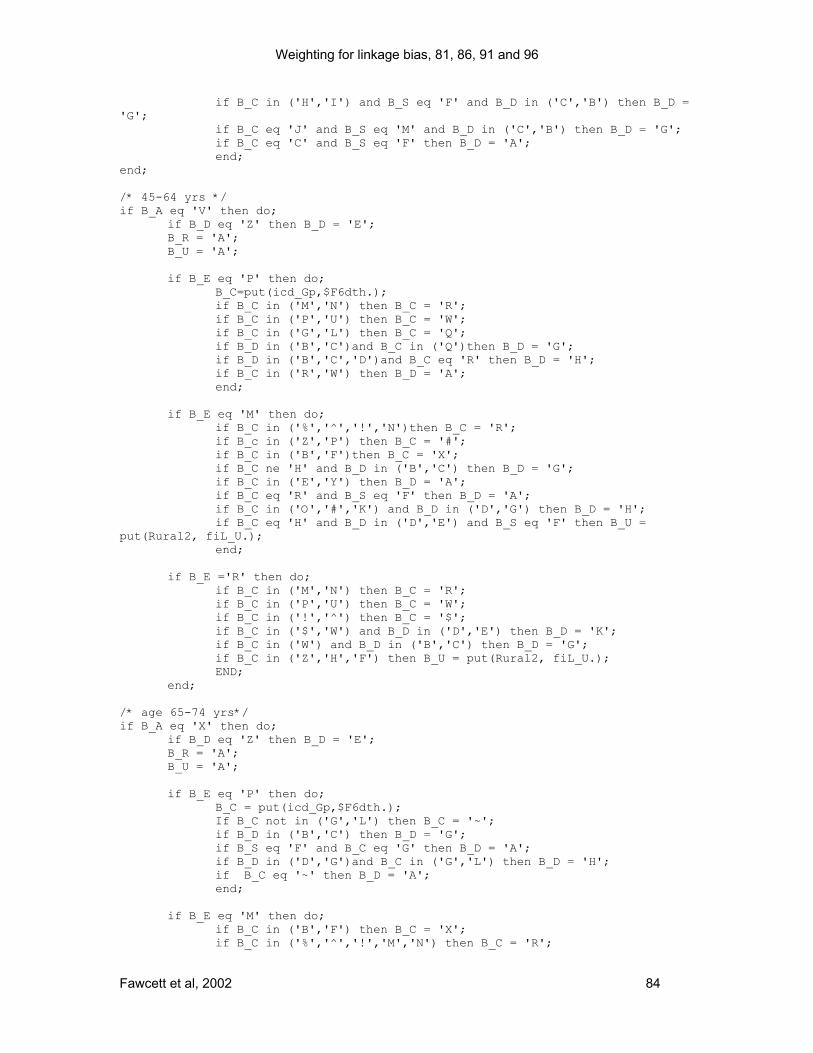
Weighting for linkage bias, 81, 86, 91 and 96
Fawcett et al, 2002 84
if B_C in ('H','I') and B_S eq 'F' and B_D in ('C','B') then B_D ='G';
if B_C eq 'J' and B_S eq 'M' and B_D in ('C','B') then B_D = 'G';if B_C eq 'C' and B_S eq 'F' then B_D = 'A';end;
end;
/* 45-64 yrs */if B_A eq 'V' then do;
if B_D eq 'Z' then B_D = 'E';B_R = 'A';B_U = 'A';
if B_E eq 'P' then do;B_C=put(icd_Gp,$F6dth.);if B_C in ('M','N') then B_C = 'R';if B_C in ('P','U') then B_C = 'W';if B_C in ('G','L') then B_C = 'Q';if B_D in ('B','C')and B_C in ('Q')then B_D = 'G';if B_D in ('B','C','D')and B_C eq 'R' then B_D = 'H';if B_C in ('R','W') then B_D = 'A';end;
if B_E eq 'M' then do;if B_C in ('%','^','!','N')then B_C = 'R';if B_c in ('Z','P') then B_C = '#';if B_C in ('B','F')then B_C = 'X';if B_C ne 'H' and B_D in ('B','C') then B_D = 'G';if B_C in ('E','Y') then B_D = 'A';if B_C eq 'R' and B_S eq 'F' then B_D = 'A';if B_C in ('O','#','K') and B_D in ('D','G') then B_D = 'H';if B_C eq 'H' and B_D in ('D','E') and B_S eq 'F' then B_U =
put(Rural2, fiL_U.);end;
if B_E ='R' then do;if B_C in ('M','N') then B_C = 'R';if B_C in ('P','U') then B_C = 'W';if B_C in ('!','^') then B_C = '$';if B_C in ('$','W') and B_D in ('D','E') then B_D = 'K';if B_C in ('W') and B_D in ('B','C') then B_D = 'G';if B_C in ('Z','H','F') then B_U = put(Rural2, fiL_U.);END;
end;
/* age 65-74 yrs*/if B_A eq 'X' then do;
if B_D eq 'Z' then B_D = 'E';B_R = 'A';B_U = 'A';
if B_E eq 'P' then do;B_C = put(icd_Gp,$F6dth.);If B_C not in ('G','L') then B_C = '~';if B_D in ('B','C') then B_D = 'G'; if B_S eq 'F' and B_C eq 'G' then B_D = 'A';if B_D in ('D','G')and B_C in ('G','L') then B_D = 'H'; if B_C eq '~' then B_D = 'A'; end;
if B_E eq 'M' then do;if B_C in ('B','F') then B_C = 'X';if B_C in ('%','^','!','M','N') then B_C = 'R';

Weighting for linkage bias, 81, 86, 91 and 96
Fawcett et al, 2002 85
if B_C in ('Z','P') then B_C = '#';if B_D in ('B','C') then B_D = 'G';if B_C in ('A','C','I','J','K','O','X') and B_D in ('G','D') then
B_D = 'H';if B_C in ('R','Y','D','E','K') then B_D = 'A';if B_C eq 'R' then B_S = 'A';if B_C eq 'O' and B_S eq 'F' then B_D = 'A';end;
if B_E ='R' then do;if B_C in ('%','^','!','M','N') then B_C = 'R';if B_C in ('P','U') then B_C = 'W';if B_C eq 'W' then B_D = 'A';if B_C in ('A','B','C','D','F','H','I','J','Z') then B_U=put(Rural2, fiL_U.);if B_C in ('I','C') and B_S eq 'F' then B_U = 'A';END;
end;
5.1.2 1986-1989 Weighting strata
data JFbias862;set JFB862;length B_D B_E B_A B_S B_U B_C B_R$1;/* groupings for cause of death*/if AgeAtCensus lt 4 then B_C=put(icd_Gp,$F6dth.);if ageatCensus GE 4 then B_C=put(icd_gp,$F16dth.);/* groupings for ethnicity*/B_E=put(Eth_NMDS_A,fiL_E.);/* sex groups*/B_S=put(sex_nmds, fiL_S.);/* rurality*/B_U=put(Rural2, fiL_U.);/*Age*/B_A=put(AgLB,fiL_A.);/*Dep*/B_D=put(NZDepfour, fiL_D.);/* RHA groups*/B_R=put(RHA2, fiL_R.);CatLink='A:'||B_A||'/S:'||B_S||'/C:'||B_C||'/D:'||B_D||'/U:'||B_U;ECATLink=CatLink||'/E:'||B_E;CodCat='C:'||icd_gp||'/A:'||B_A||'/S:'||B_S||'/E:'||B_E;SexbyAG5Gp=Ag5Gp||B_S||B_E;SEXbyAG5GpbyDep=Ag5Gp||B_S||B_D;run;
data JFBias86regrouped2;set JFBias862;/* regroupings by age. 0-14 yrs*/if B_A eq 'C' then do;
if B_D eq 'Z' then B_D = 'E';if B_E eq 'P' then do;
if B_C in ('M','N') then B_C = 'R';else B_C = 'S';B_U = 'A';B_R = 'A';if B_D in ('B','C','D')then B_D = 'H';if B_C eq 'R' and B_S eq 'F' then B_D = 'A';end;
IF B_E eq 'M' then do;
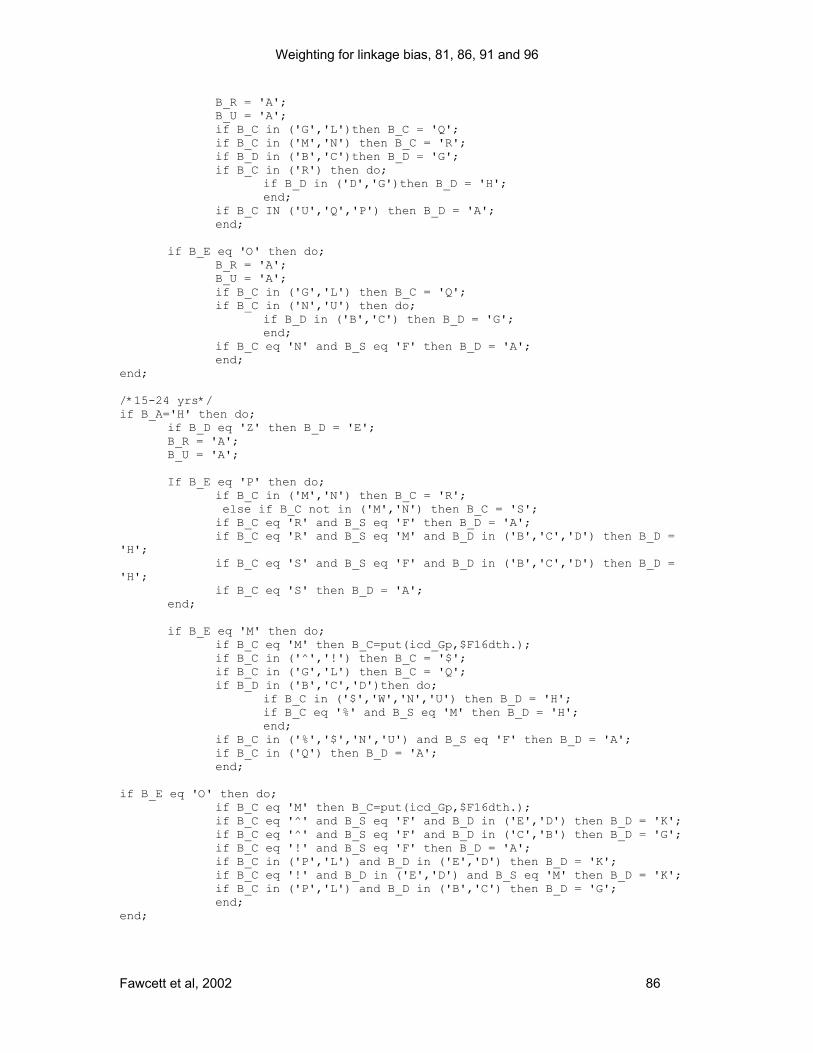
Weighting for linkage bias, 81, 86, 91 and 96
Fawcett et al, 2002 86
B_R = 'A';B_U = 'A';if B_C in ('G','L')then B_C = 'Q';if B_C in ('M','N') then B_C = 'R';if B_D in ('B','C')then B_D = 'G';if B_C in ('R') then do;
if B_D in ('D','G')then B_D = 'H';end;
if B_C IN ('U','Q','P') then B_D = 'A';end;
if B_E eq 'O' then do;B_R = 'A';B_U = 'A';if B_C in ('G','L') then B_C = 'Q';if B_C in ('N','U') then do;
if B_D in ('B','C') then B_D = 'G';end;
if B_C eq 'N' and B_S eq 'F' then B_D = 'A';end;
end;
/*15-24 yrs*/if B_A='H' then do;
if B_D eq 'Z' then B_D = 'E';B_R = 'A';B_U = 'A';
If B_E eq 'P' then do;if B_C in ('M','N') then B_C = 'R'; else if B_C not in ('M','N') then B_C = 'S'; if B_C eq 'R' and B_S eq 'F' then B_D = 'A';if B_C eq 'R' and B_S eq 'M' and B_D in ('B','C','D') then B_D =
'H'; if B_C eq 'S' and B_S eq 'F' and B_D in ('B','C','D') then B_D ='H';
if B_C eq 'S' then B_D = 'A';end;
if B_E eq 'M' then do;if B_C eq 'M' then B_C=put(icd_Gp,$F16dth.);if B_C in ('^','!') then B_C = '$';if B_C in ('G','L') then B_C = 'Q';if B_D in ('B','C','D')then do;
if B_C in ('$','W','N','U') then B_D = 'H';if B_C eq '%' and B_S eq 'M' then B_D = 'H';end;
if B_C in ('%','$','N','U') and B_S eq 'F' then B_D = 'A';if B_C in ('Q') then B_D = 'A';end;
if B_E eq 'O' then do;if B_C eq 'M' then B_C=put(icd_Gp,$F16dth.);if B_C eq '^' and B_S eq 'F' and B_D in ('E','D') then B_D = 'K';if B_C eq '^' and B_S eq 'F' and B_D in ('C','B') then B_D = 'G';if B_C eq '!' and B_S eq 'F' then B_D = 'A';if B_C in ('P','L') and B_D in ('E','D') then B_D = 'K';if B_C eq '!' and B_D in ('E','D') and B_S eq 'M' then B_D = 'K';if B_C in ('P','L') and B_D in ('B','C') then B_D = 'G';end;
end;

Weighting for linkage bias, 81, 86, 91 and 96
Fawcett et al, 2002 87
/* 25-44 yrs*/
if B_A='R' then do;if B_D eq 'Z' then B_D = 'E';B_R = 'A';B_U = 'A';If B_C in ('P','U') then B_C = 'W';
if B_E eq 'P' then do;B_U = 'A';if B_C in ('M','N') then B_C = 'R';if B_D in ('B','C','D') then B_D = 'H';if B_C ne 'G' and B_S eq 'F' then B_D = 'A';end;
if B_E eq 'M' then do;if B_C in ('M','N') and B_S eq 'F' then B_C = 'R';if B_C in ('W','R','G','L') and B_D in ('B','C') then B_D = 'G';if B_C eq 'G' and B_D in ('G','D') and B_S eq 'M' then B_D = 'H';if B_C eq 'N' then B_D = 'A';end;
if B_E eq 'O' then do;if B_C in ('G','L','M','N') then B_C=put(icd_Gp,$F16dth.);if B_C in ('!','^') then B_C = '$';if B_C in ('K','C') then do;
if B_D in ('D','E') then B_D = 'K';else B_D = 'G';end;
if B_C in ('H','I') and B_S eq 'F' then do;if B_D in ('C','B') then B_D = 'G';end;
if B_C eq 'E' then B_C = 'F';end;
end;
/* 45-64 yrs */if B_A eq 'V' then do;
if B_D eq 'Z' then B_D = 'E';B_R = 'A';B_U = 'A';
if B_E eq 'P' then do;B_C=put(icd_Gp,$F6dth.);if B_C in ('M','N') then B_C = 'R';if B_C in ('P','U') then B_C = 'W';if B_D in ('B','C','D')and B_C in ('L','R','G','W')then B_D = 'H';if B_C eq 'R' then B_D = 'A';end;
if B_E eq 'M' then do;if B_C in ('%','^','!','N')then B_C = 'R';if B_c in ('Z','P','Y') then B_C = '@';if B_C ne 'H' and B_D in ('B','C') then B_D = 'G';if B_C in ('E','Y') then B_D = 'A';if B_C in ('A','R','O','K') and B_D in ('D','G') then B_D = 'H';if B_C eq 'B' then B_D = 'A';end;
if B_E ='O' then do;if B_C in ('M','N') then B_C = 'R';if B_C in ('P','U') then B_C = 'W';if B_C in ('!','^') then B_C = '$';

Weighting for linkage bias, 81, 86, 91 and 96
Fawcett et al, 2002 88
if B_C in ('$','W') and B_D in ('D','E') then B_D = 'K';if B_C in ('W') and B_D in ('B','C') then B_D = 'G';if B_C in ('Z','H','F','D','C','B') then B_U = put(Rural2,
fiL_U.);if B_C in ('B','F') and B_D eq 'E' and B_S eq 'F' then B_U = 'A' ;if B_C eq 'C' and B_S eq 'F' then B_U = 'A' ;END;
end;
/* age 65-74 yrs*/if B_A eq 'X' then do;
if B_D eq 'Z' then B_D = 'E';B_R = 'A';B_U = 'A';
if B_E eq 'P' then do;B_C = put(icd_Gp,$F6dth.);If B_C not in ('G','L') then B_C = '~';if B_C eq 'G' and B_S eq 'F' then B_D = 'A';if B_D in ('B','C','D') then B_D = 'H'; if B_C eq '~' then B_D = 'A';end;
if B_E eq 'M' then do;B_C = put(icd_Gp,$F6dth.);If B_C not in ('G','L') then B_C = '~';if B_C eq 'G' and B_D in ('B','C') then B_D = 'G';end;
if B_E ='O' then do;if B_C in ('%','^','!','M','N') then B_C = 'R';if B_C in ('P','U') then B_C = 'W';if B_C eq 'W' and B_D in ('B','C') then B_D = 'G';if B_C eq 'W' and B_D in ('E','D') then B_D = 'K';if B_C in ('A','B','C','D','F','H','I','J','Z') then
B_U=put(Rural2, fiL_U.);if B_C eq 'I' and B_S eq 'F' then B_U = 'A';if B_C eq 'A' and B_S eq 'F' and B_D eq 'E' then B_U = 'A';END;
end;
GpCatLink='A:'||B_A||'/S:'||B_S||'/C:'||B_C||'/D:'||B_D||'/U:'||B_U;
GpECATLink='A:'||B_A||'/E:'||B_E||'/C:'||B_C||'/U:'||B_U||'/D:'||B_D||'/S:'||B_S;GpCodCat='/C:'||B_C||'/A:'||B_A||'/S:'||B_S;/*format B_E $fvL_E7.
B_S $fvL_S5.B_A $fvL_A5.B_U $fvL_U5.B_R $fvL_R5.B_C $fvL_C.icd_gp $3.;*/
run;
5.1.3 1991-1994 Weighting strata
data JFbias912;set JFB912;

Weighting for linkage bias, 81, 86, 91 and 96
Fawcett et al, 2002 89
length B_D B_E B_A B_S B_U B_C B_R$1;/* groupings for cause of death*/if AgeAtCensus lt 4 then B_C=put(icd_Gp,$F6dth.);if ageatCensus GE 4 then B_C=put(icd_gp,$F16dth.);/* groupings for ethnicity*/B_E=put(Eth_NMDS_A,fiL_E.);/* sex groups*/B_S=put(sex_nmds, fiL_S.);/* rurality*/B_U=put(Rural2, fiL_U.);/*Age*/B_A=put(AgLB,fiL_A.);/*Dep*/B_D=put(NZDepfour, fiL_D.);/* RHA groups*/B_R=put(RHA2, fiL_R.);CatLink='A:'||B_A||'/S:'||B_S||'/C:'||B_C||'/D:'||B_D||'/U:'||B_U;ECATLink=CatLink||'/E:'||B_E;CodCat='C:'||icd_gp||'/A:'||B_A||'/S:'||B_S||'/E:'||B_E;SexbyAG5Gp=Ag5Gp||B_S||B_E;SEXbyAG5GpbyDep=Ag5Gp||B_S||B_D;run;
data JFBias91regrouped2;set JFBias912;/* regroupings by age. 0-14 yrs*/if B_A eq 'C' then do;
if B_D eq 'Z' then B_D = 'E';if B_E eq 'P' then do;
if B_C in ('M','N') then B_C = 'R';else B_C = 'S';B_U = 'A';B_R = 'A';if B_D in ('B','C','D')then B_D = 'H';if B_C eq 'R' and B_S eq 'F' then B_D = 'A';if B_C eq 'S' and B_S eq 'M' then B_D = 'A';end;
IF B_E eq 'M' then do;B_R = 'A';B_U = 'A';if B_C in ('G','L')then B_C = 'Q';if B_C in ('M','N') then B_C = 'R';if B_D in ('B','C')then B_D = 'G';if B_C in ('R') then do;
if B_D in ('D','G')then B_D = 'H';end;
if B_C IN ('U','Q','P') then B_D = 'A';if B_C eq 'R' and B_S eq 'F' then B_D = 'A';end;
if B_E eq 'R' then do;B_R = 'A';B_U = 'A';if B_C in ('G','L') then B_C = 'Q';if B_C in ('N','U') then do;
if B_D in ('B','C','D') then B_D = 'H';end;
if B_C eq 'N' and B_S eq 'F' then B_D = 'A';end;
end;
/*15-24 yrs*/if B_A='H' then do;
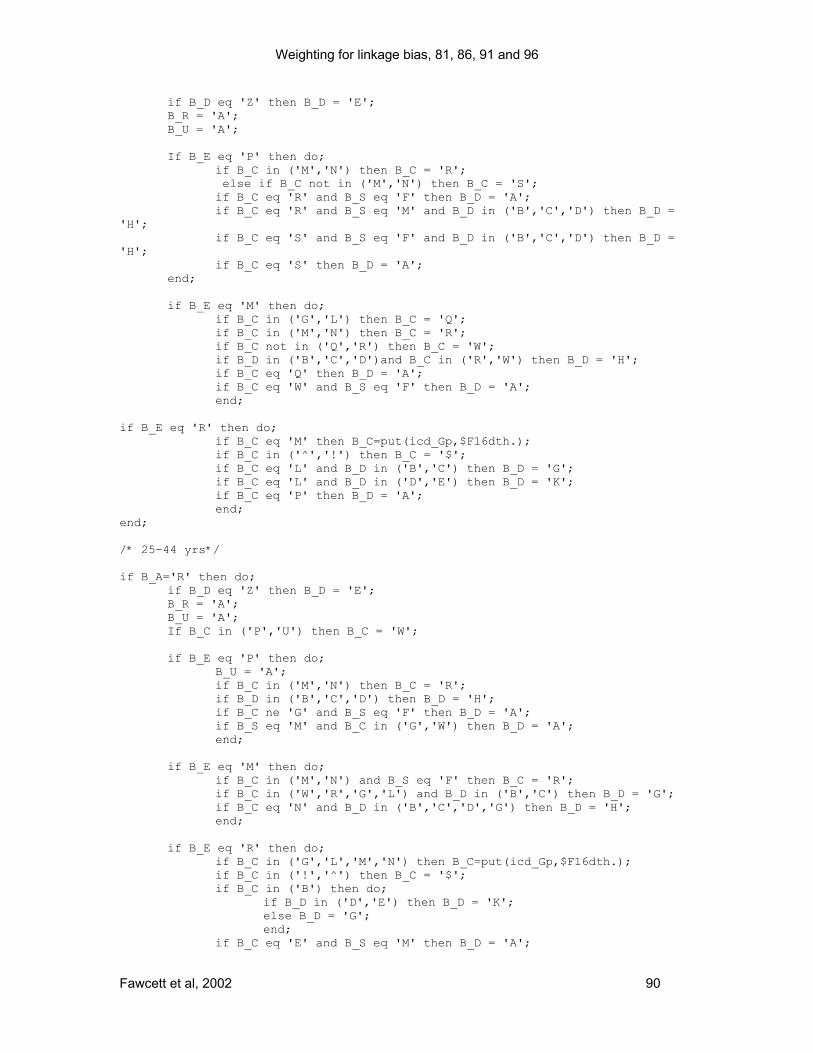
Weighting for linkage bias, 81, 86, 91 and 96
Fawcett et al, 2002 90
if B_D eq 'Z' then B_D = 'E';B_R = 'A';B_U = 'A';
If B_E eq 'P' then do;if B_C in ('M','N') then B_C = 'R'; else if B_C not in ('M','N') then B_C = 'S'; if B_C eq 'R' and B_S eq 'F' then B_D = 'A';if B_C eq 'R' and B_S eq 'M' and B_D in ('B','C','D') then B_D =
'H'; if B_C eq 'S' and B_S eq 'F' and B_D in ('B','C','D') then B_D ='H';
if B_C eq 'S' then B_D = 'A';end;
if B_E eq 'M' then do;if B_C in ('G','L') then B_C = 'Q';if B_C in ('M','N') then B_C = 'R'; if B_C not in ('Q','R') then B_C = 'W';if B_D in ('B','C','D')and B_C in ('R','W') then B_D = 'H';if B_C eq 'Q' then B_D = 'A';if B_C eq 'W' and B_S eq 'F' then B_D = 'A';end;
if B_E eq 'R' then do;if B_C eq 'M' then B_C=put(icd_Gp,$F16dth.);if B_C in ('^','!') then B_C = '$';if B_C eq 'L' and B_D in ('B','C') then B_D = 'G';if B_C eq 'L' and B_D in ('D','E') then B_D = 'K';if B_C eq 'P' then B_D = 'A';end;
end;
/* 25-44 yrs*/
if B_A='R' then do;if B_D eq 'Z' then B_D = 'E';B_R = 'A';B_U = 'A';If B_C in ('P','U') then B_C = 'W';
if B_E eq 'P' then do;B_U = 'A';if B_C in ('M','N') then B_C = 'R';if B_D in ('B','C','D') then B_D = 'H';if B_C ne 'G' and B_S eq 'F' then B_D = 'A';if B_S eq 'M' and B_C in ('G','W') then B_D = 'A'; end;
if B_E eq 'M' then do;if B_C in ('M','N') and B_S eq 'F' then B_C = 'R';if B_C in ('W','R','G','L') and B_D in ('B','C') then B_D = 'G';if B_C eq 'N' and B_D in ('B','C','D','G') then B_D = 'H';end;
if B_E eq 'R' then do;if B_C in ('G','L','M','N') then B_C=put(icd_Gp,$F16dth.);if B_C in ('!','^') then B_C = '$';if B_C in ('B') then do;
if B_D in ('D','E') then B_D = 'K';else B_D = 'G';end;
if B_C eq 'E' and B_S eq 'M' then B_D = 'A';

Weighting for linkage bias, 81, 86, 91 and 96
Fawcett et al, 2002 91
if B_C eq 'K' then B_D = 'A';end;
end;
/* 45-64 yrs */if B_A eq 'V' then do;
if B_D eq 'Z' then B_D = 'E';B_R = 'A';B_U = 'A';
if B_E eq 'P' then do;B_C=put(icd_Gp,$F6dth.);if B_C in ('M','N') then B_C = 'R';if B_C in ('P','U') then B_C = 'W';if B_D in ('B','C','D')and B_C in ('L','R','G','W')then B_D = 'H';if B_C eq 'R' then B_D = 'A';end;
if B_E eq 'M' then do;if B_C in ('%','^','!','N')then B_C = 'R';if B_c in ('Z','P','Y') then B_C = '@';if B_C not in ('H','@','C') and B_D in ('B','C') then B_D = 'G';if B_C in ('Y','B') then B_D = 'A';if B_C in ('A','R','O','K') and B_D in ('D','G') then B_D = 'H';end;
if B_E ='R' then do;if B_C in ('!','^') then B_C = '$';if B_C in ('$','P') and B_D in ('D','E') then B_D = 'K';if B_C eq 'P' and B_D in ('B','C') then B_D = 'G';if B_C in ('H','F','D','C','B','Z') then B_U = put(Rural2,
fiL_U.);if B_C in ('B','F') and B_D eq 'E' and B_S eq 'F' then B_U = 'A' ;if B_C eq 'C' and B_S eq 'F' then B_U = 'A' ;END;
end;
/* age 65-74 yrs*/if B_A eq 'X' then do;
if B_D eq 'Z' then B_D = 'E';B_R = 'A';B_U = 'A';
if B_E eq 'P' then do;B_C = put(icd_Gp,$F6dth.);If B_C not in ('G','L') then B_C = '~';if B_C eq 'G' and B_S eq 'F' then B_D = 'A';if B_D in ('B','C','D') then B_D = 'H'; if B_C eq '~' then B_D = 'A';end;
if B_E eq 'M' then do;B_C = put(icd_Gp,$F6dth.);If B_C not in ('G','L') then B_C = '~';if B_C eq 'G' and B_D in ('B','C') then B_D = 'G';if B_C in ('G','L') and B_D in ('D','E')then B_U=put(Rural2,
fiL_U.);end;
if B_E ='R' then do;if B_C in ('%','^','!','M','N') then B_C = 'R';if B_C in ('P','Z') then B_C = '#';

Weighting for linkage bias, 81, 86, 91 and 96
Fawcett et al, 2002 92
if B_C in ('B','C','D','F','H','I','J','#') then B_U=put(Rural2,fiL_U.);
if B_C eq 'I' and B_S eq 'F' then B_U = 'A';if B_C eq 'D' and B_S eq 'F' and B_D eq 'E' then B_U = 'A';END;
end;
GpCatLink='A:'||B_A||'/S:'||B_S||'/C:'||B_C||'/D:'||B_D||'/U:'||B_U;
GpECATLink='A:'||B_A||'/E:'||B_E||'/C:'||B_C||'/U:'||B_U||'/D:'||B_D||'/S:'||B_S;GpCodCat='/C:'||B_C||'/A:'||B_A||'/S:'||B_S;/*format B_E $fvL_E7.
B_S $fvL_S5.B_A $fvL_A5.B_U $fvL_U5.B_R $fvL_R5.B_C $fvL_C.icd_gp $3.;*/
run;
5.1.4 1996-1996 Weighting Strata
data JFbias962;set JFB962;length B_D B_E B_A B_S B_U B_C B_R$1;/* groupings for cause of death*/if AgeAtCensus lt 4 then B_C=put(icd_Gp,$F6dth.);if ageatCensus GE 4 then B_C=put(icd_gp,$F16dth.);/* groupings for ethnicity*/B_E=put(EthnmdsPr,fiL_E.);/* if B_E eq 'O' then B_E='R'; note this is done purely to avoid having rewrite this programme which is based on the 1996 programme. A new formatis used to ensure correct labelling*//* sex groups*/B_S=put(sex_nmds, fiL_S.);/* rurality*/B_U=put(Rural2, fiL_U.);/*Age*/B_A=put(AgLB,fiL_A.);/*Dep*/B_D=put(NZDepfour, fiL_D.);/* RHA groups*/B_R=put(RHA2, fiL_R.);CatLink='A:'||B_A||'/S:'||B_S||'/C:'||B_C||'/D:'||B_D||'/U:'||B_U;ECATLink=CatLink||'/E:'||B_E;CodCat='C:'||icd_gp||'/A:'||B_A||'/S:'||B_S||'/E:'||B_E;SexbyAG5Gp=Ag5Gp||B_S||B_E;SEXbyAG5GpbyDep=Ag5Gp||B_S||B_D;SEXbyAG5GpbyCOD=Ag5Gp||B_S||icd_Gp;run;
data JFBias96regrouped2;set JFBias962;/* regroupings by age. 0-14 yrs*/if B_A eq 'C' then do;
if B_D eq 'Z' then B_D = 'E';if B_E in ('A','P') then do;
if B_C in ('M','N') then B_C = 'R';

Weighting for linkage bias, 81, 86, 91 and 96
Fawcett et al, 2002 93
else B_C = 'S';end;
IF B_E eq 'A' then do;B_U = 'A';B_R = 'A';B_D = 'A';end;
IF B_E eq 'P' then do;B_U = 'A';B_R = 'A';if B_D in ('B','C','D')then B_D = 'H';end;
IF B_E eq 'M' then do;B_R = 'A';B_U = 'A';if B_C in ('G','L')then B_C = 'Q';if B_D in ('B','C')then B_D = 'G';if B_C in ('P','N') then do;
if B_S = 'M' and B_D in ('D','G')then B_D = 'H';if B_S = 'F' then B_D = 'A';end;
if B_C eq 'Q' and B_D in ('D','E') then B_D = 'K';end;
if B_E eq 'O' then do;B_R = 'A';B_U = 'A';if B_C in ('G','L') then B_C = 'Q';if B_C in ('N','U') then do;
if B_D in ('B','C') then B_D = 'G';if B_D in ('D','E') then B_D = 'K';end;
if B_C eq 'Q' and B_D in ('D','E') then B_D = 'K';end;
end;
/*15-24 yrs*/if B_A='H' then do;
if B_D eq 'Z' then B_D = 'E';B_R = 'A';B_U = 'A';
if B_E eq 'A' then do;if B_C in ('M','N') then B_C = 'R'; if B_C ne 'R' then B_C = 'S';if B_D in ('B','C') then B_D ='G';if B_D in ('D','E') then B_D ='K';end;
If B_E eq 'P' then do;if B_C in ('M','N') then B_C = 'R'; else if B_C not in ('M','N') then B_C = 'S'; if B_S eq 'F' then do;
if B_D in ('B','C','D') then B_D = 'H';end;
end;
if B_E eq 'M' then do;if B_C eq 'M' then B_C=put(icd_Gp,$F16dth.);if B_C in ('^','!') then B_C = '$';if B_C in ('G','L') then B_C = 'Q';if B_C in ('P','U') then B_C = 'W';if B_D in ('B','C','D')then do;
if B_C in ('$','W') then B_D = 'H';

Weighting for linkage bias, 81, 86, 91 and 96
Fawcett et al, 2002 94
if B_C eq '%' and B_S eq 'F' then B_D = 'H';end;
if B_D in ('B','C')and B_C in ('N','Q') then B_D = 'G';end;
if B_E eq 'O' then do;if B_C in ('P','U') then B_C = 'W';if B_D in ('B','C')and B_C eq 'L' and B_S eq 'M' then B_D = 'G';if B_C in ('M') and B_S eq 'M' then B_U=put(Rural2, fiL_U.);;end;
end;
/* 25-44 yrs*/
if B_A='R' then do;if B_D eq 'Z' then B_D = 'E';B_R = 'A';B_U = 'A';If B_C in ('P','U') then B_C = 'W';
if B_E Eq 'A' then do;if B_C in ('M','N') then B_C = 'R';else B_C = 'S';if B_D in ('B','C') then B_D ='G';if B_D in ('D','E') then B_D ='K';end;
if B_E eq 'P' then do;B_U = 'A';if B_C in ('M','N') then B_C = 'R';if B_D in ('B','C','D') then B_D = 'H';end;
if B_E eq 'M' then do;if B_D in ('B','C') then do;
if B_C eq 'N' then B_D = 'G';if B_C eq 'M' and B_S eq 'F' then B_D = 'G';end;
if B_D eq 'E' and B_C not in ('N') then B_U=put(Rural2, fiL_U.);end;
if B_E eq 'O' then do;if B_C in ('G','L','M','N') then B_C=put(icd_Gp,$F16dth.);if B_C in ('!','^') then B_C = '$';if B_C in ('K','C') then do;
if B_D in ('D','E') then B_D = 'K';else B_D = 'G';end;
if B_C in ('H','I') and B_S eq 'F' then do;if B_D in ('C','B') then B_D = 'G';end;
end;end;
/* 45-64 yrs */if B_A eq 'V' then do;
if B_D eq 'Z' then B_D = 'E';B_R = 'A';B_U = 'A';
if B_E eq 'A' then do;B_C=put(icd_Gp,$F6dth.);if B_C in ('P','U') then B_C = 'W';

Weighting for linkage bias, 81, 86, 91 and 96
Fawcett et al, 2002 95
if B_C in ('M','N') then B_C = 'R';if B_D in ('B','C') then B_D = 'G';if B_D in ('D','E') then B_D = 'K'; if B_C eq 'R' and B_S eq 'F' then B_D = 'A';if B_C eq 'L' and B_S eq 'F' then B_D = 'A';end;
if B_E eq 'P' then do;B_C=put(icd_Gp,$F6dth.);if B_C in ('M','N') then B_C = 'R';if B_C in ('P','U') then B_C = 'W';if B_D in ('B','C')and B_C in ('L','G')then B_D = 'G';if B_D in ('B','C','D')and B_C in ('R')then B_D = 'H';if B_C eq 'R' and B_S eq 'F' then B_D = 'A';end;
if B_E eq 'M' then do;if B_C in ('%','^','!','N')then B_C = 'R';if B_c in ('Z','P') then B_C = '#';if B_C ne 'H' and B_D in ('B','C') then B_D = 'G';if B_C in ('E','Y') then B_D = 'A';if B_C eq 'K' and B_D in ('D','G') then B_D = 'H';if B_C eq 'H' and B_D in ('D','E') then B_U = put(Rural2, fiL_U.);end;
if B_E ='O' then do;if B_C in ('M','N') then B_C = 'R';if B_C in ('P','U') then B_C = 'W';if B_C in ('!','^') then B_C = '$';if B_C eq '$' and B_D in ('D','E') then B_D = 'K';if B_C in ('Z','H','F','D','C','B') then B_U = put(Rural2,
fiL_U.);END;
end;
/* age 65-74 yrs*/if B_A eq 'X' then do;
if B_D eq 'Z' then B_D = 'E';B_R = 'A';B_U = 'A';
if B_E eq 'A' then do;B_C=put(icd_Gp,$F6dth.);If B_C not in ('G','L') then B_C = '~';if B_D in ('B','C') then B_D = 'G';if B_D in ('D','E') then B_D = 'K';end;
if B_E eq 'P' then do;B_C = put(icd_Gp,$F6dth.);If B_C not in ('G','L') then B_C = '~';if B_D in ('B','C') then B_D = 'G'; end;
if B_E eq 'M' then do;if B_C in ('B','F') then B_C = 'X';if B_C in ('%','^','!','M','N') then B_C = 'R';if B_c in ('Z','P') then B_C = '#';if B_C in ('D','E','J','K') and B_D in ('B','C','D') then B_D =
'H';if B_C in ('I','O') and B_D in ('B','C') then B_D = 'G';if B_C in ('R','Y') then B_D = 'A';end;

Weighting for linkage bias, 81, 86, 91 and 96
Fawcett et al, 2002 96
if B_E ='O' then do;if B_C in ('%','^','!','M','N') then B_C = 'R';if B_C in ('P','U') then B_C = 'W';if B_C eq 'W' and B_D in ('B','C') then B_D = 'G';else if B_C eq 'W' then B_D = 'K';if B_C in ('A','B','C','D','F','H','I','J','Z') then
B_U=put(Rural2, fiL_U.);END;
end;
GpCatLink='A:'||B_A||'/S:'||B_S||'/C:'||B_C||'/D:'||B_D||'/U:'||B_U;
GpECATLink='A:'||B_A||'/E:'||B_E||'/C:'||B_C||'/U:'||B_U||'/D:'||B_D||'/S:'||B_S;GpCodCat='/C:'||B_C||'/A:'||B_A||'/S:'||B_S;format B_E $fL_2BE7.
B_S $fvL_S5.B_A $fvL_A5.B_U $fvL_U5.B_R $fvL_R5.B_C $fvL_C.icd_gp $3.;
run;
Related Documents