WORLD RESOURCES INSTITUTE WASHINGTON , DC EMILY MATTHEWS CHRISTOF AMANN STEFAN BRINGEZU MARINA FISCHER-KOWALSKI WALTER HÜTTLER RENÉ KLEIJN YUICHI MORIGUCHI CHRISTIAN OTTKE ERIC RODENBURG DON ROGICH HEINZ SCHANDL HELMUT SCHÜTZ ESTER VAN DER VOET HELGA WEISZ THE WEIGHT OF NATIONS MATERIAL OUTFLOWS FROM INDUSTRIAL ECONOMIES

Welcome message from author
This document is posted to help you gain knowledge. Please leave a comment to let me know what you think about it! Share it to your friends and learn new things together.
Transcript

W O R L D R E S O U R C E S I N S T I T U T E
W A S H I N G T O N , D C
E M I L Y M A T T H E W S
C H R I S T O F A M A N NS T E F A N B R I N G E Z UM A R I N A F I S C H E R - K O W A L S K IW A L T E R H Ü T T L E RR E N É K L E I J NY U I C H I M O R I G U C H IC H R I S T I A N O T T K EE R I C R O D E N B U R GD O N R O G I C H H E I N Z S C H A N D LH E L M U T S C H Ü T ZE S T E R V A N D E R V O E TH E L G A W E I S Z
T H E W E I G H T O F N A T I O N SM A T E R I A L O U T F L O W S F R O M
I N D U S T R I A L E C O N O M I E S

C A R O L L Y N E H U T T E RE D I T O R
H Y A C I N T H B I L L I N G SP R O D U C T I O N M A N A G E R
N A T I O N A L O C E A N I C A N D A T M O S P H E R I C A D M I N I S T R A T I O N /D E P A R T M E N T O F C O M M E R C EC O V E R P H O T O
Each World Resources Institute report represents a timely, scholarly treat-
ment of a subject of public concern. WRI takes responsibility for choosing
the study topics and guaranteeing its authors and researchers freedom of
inquiry. It also solicits and responds to the guidance of advisory panels and
expert reviewers. Unless otherwise stated, however, all the interpretation and
findings set forth in WRI publications are those of the authors.
Copyright © 2000 World Resources Institute. All rights reserved.
ISBN 1-56973-439-9
Library of Congress Catalog Card No. 00-107192
Printed in the United States of America on chlorine-free paper with
recycled content of 50%, 20% of which is post-consumer.

WRI: THE WEIGHT OF NATIONS
iii
Preface ...................................................V
Acknowledgments ...............................IX
Key Findings ....................................XI
1. Introduction.........................................1
2. Approach and Methodology ............4
2.1 The Material Cycle
2.2 Accounting for Output Flows
2.3 What’s In and What’s Out
2.4 Characterizing Material Flows
2.5 Data Access and Quality
2.6 The Importance of Physical Accounts in
Understanding Material Flows
3. Study Findings ..............................13
3.1 Total Domestic Output (TDO)
3.2 Domestic Processed Output (DPO)
3.3 Sector Indicators: Who Generates the
Biggest Output Flows?
3.4 Gateway Indicators: Where Do Material
Outflows Go?
3.5 Dissipative Flows
3.6 Net Additions to Stock (NAS)
4. Policy Applications ..........................32
5. Next Steps.........................................38
Notes .....................................................42
Annex 1. Data Summary: NationalComparisons ....................................44
Annex 2. Country Reports ................48
Austria
Germany
Japan
The Netherlands
United States
For Further Information .................125
C O N T E N T S

WRI: THE WEIGHT OF NATIONS
v
This report, The Weight of Nations:Material Outflows from IndustrialEconomies, is the second product of a
remarkable collaboration between the WorldResources Institute and research partners inEurope and Japan. Our task has been to doc-ument the materials that flow through indus-trial economies and develop sets of nationalphysical accounts that can be used alongsidenational monetary accounts. In addition, wehave developed indicators of material flowsthat complement such economic indicatorsas gross domestic product (GDP).
Standard economic indicators—those thatdescribe the financial flows in an economy—provide incomplete information on the envi-ronmental consequences or implications ofeconomic activity. There is an urgent needfor new information tools and new metrics if we are to monitor progress toward thedevelopment of more ecoefficient economiesand long-term sustainability. Indicatorsshould measure the physical dimensions ofnational economies, not just their financialdimensions.
By its very nature, economic growth posesa fundamental challenge to sustainable devel-opment. As long as continued growth in eco-nomic output implies continued growth in
material inputs to and waste outputs fromthe economy, there is little hope of limitingthe impacts of human activity on the naturalenvironment.
Over the next 50 years, while the world’spopulation is forecast to increase by 50 per-cent, global economic activity is expected toincrease roughly fivefold. Conventionaldemand studies suggest that global energyconsumption is likely to rise nearly threefoldand manufacturing activity at least threefold,driven largely by industrialization and infra-structure growth in developing regions.Global throughput of material is also likely totriple, according to conventional projections.These projections indicate that some mea-sure of “decoupling” is probable: that is, theworld economy is expected to grow fasterthan the rate of resource use. However, a 300percent rise in energy and material use stillrepresents a substantial increase. Unless eco-nomic growth can be dramatically decoupledfrom resource use and waste generation, envi-ronmental pressures will increase rapidly.
How will we know whether the necessarydegree of decoupling is occurring? How canwe design policies to promote decouplingand gauge their effectiveness, sector bysector? Such questions illustrate the case for
P R E F A C E
WRI: THE WEIGHT OF NATIONS
vi
comprehensive measures of material flows.Good indicators will make it much easier forus to measure physical flows accurately andcompare them to economic flows.
In 1997, our first report, Resource Flows:The Material Basis of Industrial Economies,documented material inputs to industrialeconomies and showed that the total materialrequirement of major OECD countries(Germany, Japan, the Netherlands, and theUnited States) is currently between 45 and80 metric tons per capita annually. Exceptfor the relatively modest quantities of materi-als recycled or added each year to stock inuse (largely in the form of infrastructure anddurable goods), physical inputs are quicklyreturned to the environment as pollution orwaste, with potential for environmental harm.
This new report completes the materialcycle by documenting and analyzing thematerial output flows for the four originalstudy countries, plus Austria. These coun-tries differ in terms of their size, climate,resource endowment, economic structure,and lifestyles. Yet, patterns of material out-puts from their economies to the environ-ment have much in common.
Outputs of some of the materials known tobe hazardous to human health or damagingto the environment have been regulated andsuccessfully reduced or stabilized. Examplesinclude sulfur emissions to air and releasesof some heavy metals, chlorine, and phos-phorus. We have found, however, that manyhazardous or potentially hazardous materialflows are increasing, especially when theyoccur during material extraction (for exam-ple, mining) or during product use and disposal, rather than at the processing andmanufacturing stages. For example, our
estimates indicate that flows of fuel-relatedcontaminants to the U.S. environmentincreased by about 25 percent between 1975and 1996.
This report shows conclusively that theatmosphere is by far the biggest dumpingground for the wastes of industrialeconomies. Output flows are dominated bythe extraction and use of fossil energyresources: when bulky flows like water, soilerosion and earth moving are excluded, carbon dioxide accounts, on average, for 80 percent by weight of material outflows in thefive study countries. There are positivetrends. Quantities of solid wastes sent tolandfills have stabilized or declined, in somecases by 30 percent or more. Reductions havebeen achieved thanks to increased recyclingefforts and greater use of incineration as adisposal option. This latter practice, however,has resulted in waste outputs being divertedfrom land to air, contributing further toatmospheric pollution.
To what extent are industrial economiesbreaking the link between economic growthand material throughput? The evidence fordecoupling is either strong or weak, depend-ing on the measure used. Despite strong eco-nomic growth over the period 1975–1996,resource inputs and waste outputs rose relatively little on a per capita basis and felldramatically when measured against units ofeconomic output. Given declining real pricesfor most resource commodities, and contin-ued subsidies for resource extraction and usein most OECD countries, the extent of decoupling may be regarded as remarkableand possibly symptomatic of profound under-lying structural changes in the nature ofindustrial economies.

WRI: THE WEIGHT OF NATIONS
vii
However, even as decoupling between eco-nomic growth and resource throughputoccurred on a per capita and per unit GDPbasis, it is important to understand that over-all resource use and waste flows into theenvironment continued to grow. Between1975 and 1996, total quantities of conven-tional wastes, emissions, and discharges inthe five study countries increased by between16 percent and 29 percent. Despite the rapidrise of e-commerce and the shift over severaldecades from heavy industries toward knowledge-based and service industries, wefound no evidence of an absolute reductionin resource throughput in any of the coun-tries studied.
Given the likelihood of common economicaspirations in developing and industrializedcountries, developing countries can beexpected, over time, to attain roughly thesame physical basis—the same level of percapita material throughput—as will then befound in economically advanced countries.Only if the level of materials intensity towhich industrialized and developing coun-tries eventually converge is substantiallybelow that found in the industrialized coun-tries today can there be hope of mitigatingglobal environmental problems, such as cli-mate change. It is, therefore, clear thatefforts at genuine dematerialization have astrong claim on the policy agenda. There is aparticular need for accelerated technologytransfer from industrialized countries so thatdeveloping countries can “leapfrog” olderpolluting and inefficient technologies.
The findings presented in this report showthat, although increasing wealth, technologi-cal advances, and economic restructuring inindustrialized countries have contributed tosignificant decoupling between rates of
economic growth and material throughput,they have not achieved any overall reductionin resource use or waste volumes. Targetedpolicies will be needed to accelerate the trendtoward dematerialization and to encouragesubstitution of benign materials for thosethat are environmentally harmful.
We would like to acknowledge the supportof the United States EnvironmentalProtection Agency in making possible WRI’scontribution to this joint research effort andthe publication of this report. We alsoacknowledge the financial support of theSwedish International Development Cooper-ation Agency; the Statistical Office of theEuropean Communities (EUROSTAT); theNetherlands Ministry of Housing, SpatialPlanning and the Environment; the Environ-ment Agency of Japan through the GlobalEnvironment Research Fund; the AustrianFederal Ministry for Agriculture, Forestry,Environment and Water Management; andthe Austrian Federal Ministry for Transport,Innovation and Technology.
JONATHAN LASH
President/World Resources Institute, U.S.A.
ERNST ULRICH VON WEIZSÄCKER
President/Wuppertal Institute, Germany
GEN OHI
Director-General/National Institute for Environmental
Studies, Japan
ROLAND FISCHER
Director/Institute for Interdisciplinary Studies of Austrian
Universities, Austria
HELIAS A. UDO DE HAES
Scientific Director/Centre of Environmental Science,
Leiden University, The Netherlands

WRI: THE WEIGHT OF NATIONS
ix
We wish to acknowledge the manyindividuals who have generouslygiven their time to help us develop
the databases that underpin this report. Theyinclude staff at the United States GeologicalSurvey; the Federal Environmental Agency ofGermany, Berlin; the Central Bureau ofStatistics of the Netherlands; the Environ-ment Agency of Japan; and the AustrianFederal Environmental Agency.
The authors wish to thank numerous col-leagues who provided helpful comments andinformation during the course of this study.They include Alan Brewster, John Ehrenfeld,Thomas Graedel, Grecia Matos, RobertSocolow, Anton Steurer, Iddo Wernick and,from within WRI, Duncan Austin, KevinBaumert, Allen Hammond, Fran Irwin, TonyJanetos, Jim MacKenzie, Janet Ranganathan,and Dan Tunstall.
Special thanks are due to WRI’s publica-tions editor Carollyne Hutter, and toHyacinth Billings and Maggie Powell fortheir management of the production process.
As before, our work has benefitted immea-surably from that of other researchers, andprevious work on materials flow accounting.Materials flow balances for national economieswere developed independently at the begin-ning of the 1990s in Austria,1, 2 Germany,3
and Japan.4 The approach was also applied tothe United States, notably in the work ofAyres,5 Rogich,6 and Wernick.7 In Europe,materials flow accounts have already beenintroduced to official statistics of EuropeanFree Trade Area (EFTA) countries and somemember states of the European Union.8
Adopting new approaches for environmentalstatistics, the German Federal StatisticalOffice prepared a national materials flow bal-ance in 1995.9 The Statistical Office of theEuropean Union has affirmed the importanceof materials flow analysis (MFA) and sup-ports the further use and development ofMFA within the framework of integratedenvironmental and economic accounting, andas a basis for the derivation of indicators forsustainability.10 Most recently, the EuropeanEnvironment Agency (EEA) produced anindicator report with headline indicators,most of which correspond to the main inputand output categories of a national materialsflow balance.
A C K N O W L E D G M E N T S

WRI: THE WEIGHT OF NATIONS
xi
K E Y F I N D I N G S
Industrial economies are becoming moreefficient in their use of materials, but wastegeneration continues to increase.
Despite strong economic growth in allcountries studied, resource inputs and wasteoutputs between 1975 and 1996 rose rela-tively little, on a per capita basis, and fell dramatically when measured against units of economic output.
Even as decoupling between economicgrowth and resource throughput occurred on a per capita and per unit GDP basis, how-ever, overall resource use and waste flowsinto the environment continued to grow. Wefound no evidence of an absolute reductionin resource throughput.
One half to three quarters of annual resourceinputs to industrial economies are returnedto the environment as wastes within a year.
Material outputs to the environment fromeconomic activity in the five study countriesrange from 11 metric tons per person peryear in Japan to 25 metric tons per personper year in the United States.
When “hidden flows” are included—flowswhich do not enter the economy, such as soilerosion, mining overburden, and earth movedduring construction—total annual materialoutputs to the environment range from 21metric tons per person in Japan to 86 metrictons per person in the United States.
Outputs of some hazardous materials havebeen regulated and successfully reduced orstabilized but outputs of many potentiallyharmful materials continue to increase.
Examples of successes include the reduc-tion or stabilization of emissions to air ofsulfur compounds and lead from gasoline,phosphorus in detergents, and some heavymetals. Quantities of municipal solid wastessent to landfills have also stabilized ordeclined in all countries studied.
Many other hazardous, or potentially haz-ardous, material flows are poorly controlledbecause they occur at the extraction phase orthe use and disposal phases of the materialcycle, which are outside the traditional areaof regulatory scrutiny. Our estimates indicatethat many potentially hazardous flows in theUnited States increased by 25 to 100 percentbetween 1975 and 1996.

WRI: THE WEIGHT OF NATIONS
xii
The extraction and use of fossil energyresources dominate output flows in all industrial countries.
Modern industrial economies are carbon-based economies. Fossil energy consumptionis still rising. Carbon dioxide accounts, onaverage, for more than 80 percent by weightof material outflows from economic activityin the five study countries. The atmosphereis by far the biggest dumping ground forindustrial wastes.
Physical accounts are urgently needed,because our knowledge of resource use andwaste outputs is surprisingly limited.
Neither traditional monetary accounts norenvironmental statistics are an adequatebasis for tracking resource flows into and outof the economy. They record only a part ofresource inputs, lose sight of some materialsin the course of processing, and entirely missmajor flows of materials that do not enter theeconomy at all, such as soil erosion from cul-tivated fields.
On the output side, monetary accounts andenvironmental statistics record few materialflows that are not subject to regulation orclassified as wastes requiring treatment. Nordo they differentiate among the many materi-als that are aggregated in products.

WRI: THE WEIGHT OF NATIONS
1
In the emerging discipline of industrialecology, researchers view moderneconomies, metaphorically, as living
organisms. Industrial economies “ingest”raw materials, which are “metabolized” toproduce goods and services, and they“excrete” wastes in the form of discardedmaterials and pollution. In 1997, our reportResource Flows: The Material Basis of IndustrialEconomies documented for the first time the total material requirement (TMR) of four industrial economies—Germany, Japan,the Netherlands, and the United States.11
We showed that national resource require-ments include both direct inputs of com-modities to the economy and “hidden” flowsof materials, which are associated with making those commodities available for eco-nomic use but do not themselves enter theeconomy. Examples of hidden flows are rockand earth moved during construction andsoil erosion from cultivated fields. In calcu-lating the TMR, we included all foreign hidden flows of materials associated withimported commodities. Total resourcerequirements for each study country wereshown to be 45 metric tons of material perperson annually in Japan, and more than 80metric tons per person annually in the otherthree study countries.
The 1997 study of the input side of indus-trial economies provoked much interest inthe policy, academic, and nongovernmentalorganization (NGO) communities. It demon-strated that physical accounts provide anintegrated framework for analyzing flows ofmaterials from the natural environment intothe human economic system, in terms oftheir size, their composition, and their rela-tion to economic growth over time. Today,there is evidence of a growing internationalmomentum to develop physical accounts thatcan be used in parallel with traditional mone-tary accounting systems. Our report hashelped to stimulate similar research effortsin other countries, including Australia,Brazil, Egypt, Finland, Italy, Malaysia,Poland, Sweden, and the European Union asa whole. A number of European Union coun-tries have established long-term national tar-gets for material and energy efficiency,together with indicators for measuringprogress, which is likely to stimulate demandfor the collection of materials flow statistics.At the time of writing, the OECD WorkingGroup on the State of the Environment islikely to establish a forum for collaborativeefforts on the development and implementa-tion of materials flow models. This forumwill provide a focal point for discussions,
1
I N T R O D U C T I O N
1

WRI: THE WEIGHT OF NATIONS
2
seminars, and workshops, where interestedcountries and organizations can exchangeinformation and possibly develop collabora-tive efforts towards harmonized models.
This report builds on, and complements,our earlier work by presenting the outputside of industrial economies. It documentsthe materials that flow from the human econ-omy back into the environment at every stageof economic activity, from commodity extrac-tion or harvest, through processing and man-ufacturing, product use, and final disposal.In addition, the report documents materialsthat do not rapidly exit the economy, butwhich accumulate as stock in the form ofdurable goods, buildings, and other infra-structure. Hidden flows are again reportedbecause, in system terms, they represent asimultaneous input and output.
The scope of this new study has beenexpanded from the first report and nowincludes Austria in addition to Germany,Japan, the Netherlands, and the UnitedStates. Based on the physical accounts devel-oped for each country, we have developed anumber of new indicators and measures that(i) summarize national trends in outputs ofmaterial to the environment between 1975and 1996, (ii) show how material outputflows have changed in relation to populationsize and economic activity, and (iii) comparethe level of material output flows from differ-ent economic sectors (such as industry,transport, and households) and into differentenvironmental media (air, land, and water).
Our first report raised two important ques-tions, one concerning methodology and oneconcerning policy-relevance, that must beaddressed directly.
1. Indicators of materials flow are createdby summing the weights of many differentmaterials. We recognize that a few very largeflows, such as rock and earth (from miningand construction) and carbon dioxide fromfossil fuel combustion, dominate these indi-cators. Very small flows, such as syntheticorganic chemicals or heavy metals, hardlyshow up. We stress that summing differentmaterials is not intended to imply parityamong them. Indicators, such as total mate-rial requirement (TMR), or total domesticoutput (TDO), are presented simply as physi-cal descriptors of the economic system, justas economic indicators like gross domesticproduct (GDP) are monetary descriptors ofthe economic system. With this in mind, wehave attempted to create “value-neutral”physical accounts that include all materials,regardless of their economic importance orenvironmental impact. Nevertheless, somesubjectivity is unavoidable; we chose toexclude freshwater flows, for example, pri-marily on the grounds that they are so largethey would overwhelm the other data.
2. Highly aggregated indicators of materi-als flow should not be interpreted as directindicators of environmental impact. A ton ofiron ore is not equivalent to a ton of mer-cury. Big flows are not automatically bad,and small flows are not automatically better.However, we believe that indicators are use-ful measures of potential environmentalimpact. All resource use involves environ-mental impacts of some kind at every stageof the material cycle from extraction or har-vesting to final disposal. Unless technologiesare changed dramatically, increases inresource throughput imply increases in envi-ronmental impacts. Therefore, indicators ofmaterials flow that tell us whether overall

WRI: THE WEIGHT OF NATIONS
3
resource throughput is rising or falling, andwhether national economies are becomingmore or less efficient in their use ofresources, are valuable starting points foranalysis. Indicators help to determine strat-egy. We recognize that it is at the level of subaccounts—the examination of specific mate-rial flows, and categories of like flows—thatmaterials flow analysis will have most rele-vance to detailed policy-making.
This report takes some steps toward examining the links between material flowsand their environmental impacts. In additionto documenting quantities of material out-puts, we develop a system of flow characteri-zation that allows flows to be disaggregatedaccording to their medium of entry into theenvironment (flows to air, land, and water),and by their mode of use. We focus on dissipative flows, where nonrecoverable dis-persion into the environment is an inherentquality of product function, as is the casewith pesticide sprays. We document a
number of small but high impact flows,such as those of heavy metals and other hazardous substances. Finally, we develop adetailed, pilot characterization scheme formaterial output flows in the United States.This scheme enables us to identify flowsaccording to their physical and chemicalcharacteristics, as well as their medium ofentry into the environment, and their resi-dence time in the economy; details are provided in the U.S. country report. (See Annex 2.)
Subsequent sections of the report set outthe approach and methodology for our study,present the main findings, and provide practical illustrations of how documentationof physical outputs to the environment candirectly assist in policy formulation. A sum-mary of the data underlying the indicatorspresented in this report can be found inAnnex 1. More detailed descriptions of material output flows in each of the studycountries are provided in Annex 2.

WRI: THE WEIGHT OF NATIONS
4
Our first report, which documentedtotal resource requirements in fourindustrial economies, established a
number of goals for any subsequent report.These goals were to
• provide a more complete accounting system and develop aggregate indicatorsfor the output side of material flows;
• compare total material requirements(including imports) with total material out-puts (including exports) to allow creationof national flow accounts;
• focus on the roles of economic sectors inthe material cycle;
• separate domestic and foreign flows, toavoid double counting as the number ofcountries developing physical accountsgrows; and
• develop a materials flow characterizationscheme to distinguish better the qualityand potential environmental impact offlows.
Our present methodology provides a con-ceptual model of the complete material cyclein the industrial economy. It documents thequantity and composition of physical outputsto the environment generated by five indus-trial economies, and develops indicators thatrelate the size of material output flows topopulation and economic growth over time.Information is also provided on the environ-mental media to which material flows arereleased, and on the share of outputs gener-ated by different economic sectors.
2 . 1 THE MATERIAL CYCLE
Figure 1 is a schematic representation ofmaterial flows through the modern industrialeconomy. The left-hand side of the chartindicates the flows documented in our 1997report—the input side of the economy. Theright-hand side of the chart covers the flowsdocumented in the present report—the out-put side of the economy. We also documentmaterials that are retained in the economy inthe form of infrastructure and long-liveddurable goods (stocks).
A P P R O A C H A N D M E T H O D O L O G Y
2
WRI: THE WEIGHT OF NATIONS
5
Austrian Federal Ministry forTMR
ForeignHidden Flows
Imports Exports
DomesticExtraction
Stocks
Air and Water
WaterVapor
DomesticHidden Flows
DomesticHidden Flows
DomesticProcessedOutput (DPO) (to Air, Land, and Water)
Domestic Environment
Economic Processing
DMI TDO
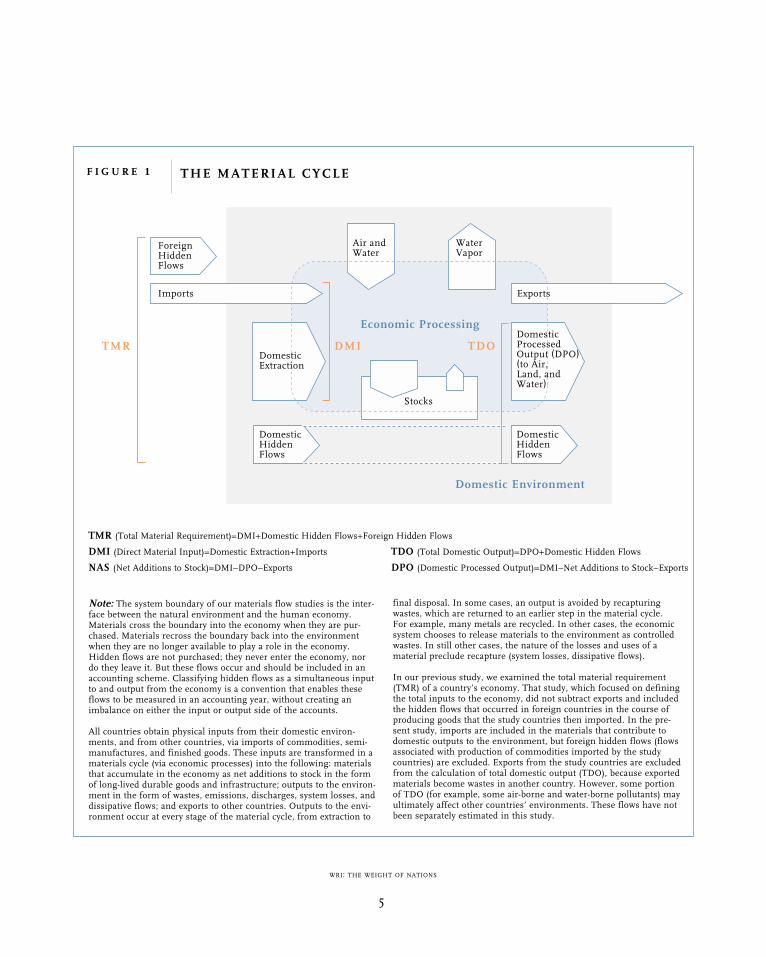
F I G U R E 1 THE MATERIAL CYCLE
Note: The system boundary of our materials flow studies is the inter-face between the natural environment and the human economy.Materials cross the boundary into the economy when they are pur-chased. Materials recross the boundary back into the environmentwhen they are no longer available to play a role in the economy.Hidden flows are not purchased; they never enter the economy, nordo they leave it. But these flows occur and should be included in anaccounting scheme. Classifying hidden flows as a simultaneous inputto and output from the economy is a convention that enables theseflows to be measured in an accounting year, without creating animbalance on either the input or output side of the accounts.
All countries obtain physical inputs from their domestic environ-ments, and from other countries, via imports of commodities, semi-manufactures, and finished goods. These inputs are transformed in amaterials cycle (via economic processes) into the following: materialsthat accumulate in the economy as net additions to stock in the formof long-lived durable goods and infrastructure; outputs to the environ-ment in the form of wastes, emissions, discharges, system losses, anddissipative flows; and exports to other countries. Outputs to the envi-ronment occur at every stage of the material cycle, from extraction to
final disposal. In some cases, an output is avoided by recapturingwastes, which are returned to an earlier step in the material cycle. For example, many metals are recycled. In other cases, the economic system chooses to release materials to the environment as controlledwastes. In still other cases, the nature of the losses and uses of amaterial preclude recapture (system losses, dissipative flows).
In our previous study, we examined the total material requirement(TMR) of a country’s economy. That study, which focused on definingthe total inputs to the economy, did not subtract exports and includedthe hidden flows that occurred in foreign countries in the course ofproducing goods that the study countries then imported. In the pre-sent study, imports are included in the materials that contribute todomestic outputs to the environment, but foreign hidden flows (flowsassociated with production of commodities imported by the studycountries) are excluded. Exports from the study countries are excludedfrom the calculation of total domestic output (TDO), because exportedmaterials become wastes in another country. However, some portionof TDO (for example, some air-borne and water-borne pollutants) mayultimately affect other countries’ environments. These flows have notbeen separately estimated in this study.
TMR (Total Material Requirement)=DMI+Domestic Hidden Flows+Foreign Hidden Flows
DMI (Direct Material Input)=Domestic Extraction+Imports TDO (Total Domestic Output)=DPO+Domestic Hidden Flows
NAS (Net Additions to Stock)=DMI–DPO–Exports DPO (Domestic Processed Output)=DMI–Net Additions to Stock–Exports

WRI: THE WEIGHT OF NATIONS
6
2 .2 ACCOUNTING FOROUTPUT FLOWS
By analyzing the output side of the materialcycle, we can learn a number of things aboutthe potential environmental burden of mate-rial outflows.
Industrial economies are ultimately once-through systems. One critical variable is thetotal quantity of materials flowing out of theeconomy in a year. We call the annual mate-rial outflows from a domestic economy to theenvironment the “domestic processed out-put” (DPO). This report shows that DPO ineach of the study countries ranges from 11metric tons per person in Japan to more than25 metric tons per person in the UnitedStates. The flows that constitute DPO corre-spond roughly to conventionally describedwastes, emissions, and discharges in officialstatistics, although our data are more com-plete. When domestic hidden flows are addedto DPO, the summed annual outputs arecalled the “total domestic output” (TDO).TDO ranges from 21 metric tons per personin Japan to 86 metric tons per person in theUnited States.
A second critical variable is the averageretention time of materials in the economy,which is increased by such practices as recy-cling and reuse. Our study indicates thatbetween one half and three quarters of directmaterial inputs pass through the economiesof the study countries and out into the envi-
ronment within a year. The material that isretained in the economy for a longer period,in the form of durable goods and physicalinfrastructure, is called the “net addition tostock” (NAS). All stock materials eventuallybecome waste outflows, too.
A third critical variable is the destinationof output flows within the environment. Wedisaggregate material outflows according totheir first point of entry to the environment,which we call the “environmental gateway.”Our study shows that there has been a steadyincrease in the share of outflows to theatmosphere and a corresponding decrease inthe share of flows going to land and water. Itshould be noted that, while this study disag-gregates these material flows according tothe medium by which they enter the environ-ment, it documents flows only up to this firstpoint of entry. It does not track secondarydeposition, such as nitrogen flows from fer-tilized land to water, or sulfur flows from airto land.
Material output flows can be analyzed fur-ther, according to their source (the economicsector directly responsible for the output) ortheir mode of dispersal (we focus here ondissipative flows, in which material dispersalinto the environment is an unavoidable ornecessary consequence of product use). Box 1presents summary definitions of the indica-tors developed for this study and the variousways in which we disaggregate the physicalaccounts.

WRI: THE WEIGHT OF NATIONS
7
Domestic Processed Output (DPO): the total
weight of materials, extracted from the domestic
environment and imported from other countries,
which have been used in the domestic economy, then
flow to the domestic environment. These flows
occur at the processing, manufacturing, use, and
final disposal stages of the economic production-
consumption chain. Exported materials are exclud-
ed because their wastes occur in other countries.
Included in DPO are emissions to air from com-
mercial energy combustion (including bunker
fuels) and other industrial processes, industrial
and household wastes deposited in landfills, mater-
ial loads in wastewater, materials dispersed into
the environment as a result of product use (see
dissipative flows below), and emissions from incin-
eration plants. Recycled material flows in the econ-
omy (e.g., metals, paper, and glass) are subtracted
from DPO. Note that an uncertain fraction of some
dissipative use flows (manure, fertilizer) is recy-
cled by plant growth, but no attempt has been
made to estimate this fraction and subtract it
from DPO.
Domestic Hidden Flows (DHF): the total weight
of materials moved or mobilized in the domestic
environment in the course of providing commodi-
ties for economic use, which do not themselves enter
the economy. Hidden flows occur at the harvesting
or extraction stage of the material cycle. They com-
prise two components: ancillary flows (for exam-
ple, plant and forest biomass that is removed from
the land along with logs and grain, but is later sep-
arated from the desired material before further
processing), and excavated and/or disturbed mate-
rial flows (for example, overburden that must be
removed to permit access to an ore body, and soil
erosion that results from agriculture). For purposes
of aggregation, both categories have been com-
bined into the single category of domestic hidden
flows, although their environmental impacts may
be different. Hidden flows were also accounted for
as part of the total material requirement (TMR) of
industrial economies. For the purposes of physical
accounting—in system terminology—hidden flows
represent a simultaneous input and output.
Total Domestic Output (TDO): the sum of
domestic processed output and domestic hidden
flows. This indicator represents the total quantity
of material outputs to the domestic environment
caused directly or indirectly by human economic
activity.
Gateway Flows: the share of DPO, or TDO, which
exits the economy by each of three environmental
gateways, namely, air, land, and water. Gateways
are the first point of entry of a material flow into
the environment; this study does not account for
secondary deposition. Both domestic processed
output and total domestic output can be disaggre-
gated to show the quantity, and major constituents,
of material flows to air, land, and water; gateway
flows are a means of differentiating material flows
in order to provide more information about their
potential environmental impacts.
Sector Flows: the share of DPO, or TDO, which
can directly be attributed to the activities of indi-
vidual economic sectors. This report documents
outputs from the industry (manufacturing and
mining), agriculture, energy supply (utilities), con-
struction, transport, and household sectors in each
of the study countries. Outputs from combustion
B O X 1 DEFINITIONS OF INDICATORS AND OUTPUT FLOWS

WRI: THE WEIGHT OF NATIONS
8
2 .3 WHAT’S IN AND WHAT’S OUT
This report seeks to present comprehensivephysical accounts for the five study countries,but we had to make some essentially subjec-tive decisions about system boundaries.
Water flows are excluded from this study,with some exceptions noted below, for a
number of reasons. Water flows are so largethat they would completely dominate allother material flows and would obscure themeaning and, thus, the usefulness of theindicators. Secondly, while the extraction ofwater from aquifers, groundwater reserves,rivers, and lakes may create environmentalproblems at the local or regional level, prob-lems depend largely on the availability ofwater, which varies considerably among
processes, including energy use, have been attrib-
uted to different economic sectors, including utili-
ties, based on the location of direct output flows.
Hidden flows associated with all forms of mining
(including coal mining) have been attributed to the
industry sector. Both domestic processed output
and total domestic output can be disaggregated to
show the quantity of material output generated by
each sector.
Dissipative Flows: the quantity (weight) of materi-
als dispersed into the environment as a deliberate,
or unavoidable (with current technology), conse-
quence of product use. These flows comprise two
components: dissipative uses (for example, ferti-
lizers and manure spread on fields, and salt spread
on roads) and dissipative losses (for example, rub-
ber worn away from car tires, particles worn from
friction products, such as brakes and clutches,
and solvents used in paints or other coatings).
Dissipative uses can be part of an ultimate
throughput flow, e.g., mineral fertilizer, or part
of recycling, e.g., manure, compost, and sewage
applied on fields for nutrient recycling.
Net Additions to Stock (NAS): The quantity
(weight) of new construction materials used in
buildings and other infrastructure, and materials
incorporated into new durable goods, such as cars,
industrial machinery, and household appliances.
New materials are added to the economy’s stock
each year (gross additions) and old materials are
removed from stock as buildings are demolished
and durable goods discarded. These decommis-
sioned materials, if not recycled, are accounted for
in DPO. The balance is the net addition to stock.
For all study countries other than the United
States, NAS is calculated indirectly as the balanc-
ing item between the annual flow of materials that
enter the economy (direct material input), plus air
inputs (e.g., for oxidization processes), minus
domestic processed output, water vapor, and
exports. In the case of the United States, net addi-
tions to stock are calculated directly as gross
additions to stock, minus the material outputs of
decommissioned building materials (as construc-
tion and demolition wastes ), disposed durable
goods, and materials recycled.
B O X 1 (CONTINUED)

WRI: THE WEIGHT OF NATIONS
9
regions. National level data on mass flows ofwater are not particularly useful. A set ofphysical accounts developed at the regionalor sectoral level, particularly if supplementedwith geographic information systems analy-sis, should include data on water flows.Thirdly, current data are inadequate to trackthe role of water flows as the transport medi-um for pollutants in some of the study coun-tries. Contaminants in water flows have beenrecorded where possible, but data are lesscomplete than those for air pollutants.
Water is included in this study only whereit is present as an embedded component ofmaterials (for example, fuels) and where it ispart of the fresh weight of certain outputs(for example, municipal wastes, where it isdifficult to exclude it with any accuracy).Agricultural grains, feedstuffs, wood prod-ucts, sewage, and manure, however, areaccounted for at a standardized low watercontent weight. Water vapor, a major outflowfrom fossil fuel combustion, and human andlivestock respiration, is documented in thecountry reports (see Annex 2),12 but is notincluded in our indicators.
Oxygen is drawn from the atmosphere dur-ing fossil fuel combustion and other indus-trial chemical reactions; it accounts for at least20 percent by weight of material inputs toindustrial economies. Oxygen was accountedfor in our 1997 study as part of the materialsbalance calculated for Germany and theNetherlands, but it was not included in theindicators of input to industrial economies(TMR and DMI). In this study, we take a dif-ferent approach. In the course of industrialprocesses, oxygen binds to other elements,such as carbon, nitrogen, sulfur, and hydro-gen, and is emitted back to the atmospherein the form of combustion and processing
waste products. These waste products includecarbon dioxide, oxides of nitrogen, sulfurdioxide, and water vapor, among others.Oxygen in itself is an almost constant addi-tive on the input and the output sides of thematerial balance. However, in binding toother elements, it becomes a constituent ofimportant environmental pollutants. Wehave, therefore, chosen to include oxygen inemissions from industrial processes in ouroutput indicators.
In addition to its role in industrial pro-cesses, oxygen is also inhaled during humanand livestock respiration and exhaled as carbondioxide and water vapor. For informationvalue, respiration emissions have been calcu-lated and are presented in the comprehensivematerials flow balance for Germany (see p. 37),and in the country reports for Austria,Germany, Japan, and the Netherlands.However, respiration-related emissions arenot included in the indicators presented inthe main report. Emissions from human andanimal respiration are assumed to be approx-imately balanced by plant photosynthesis.
2 .4 CHARACTERIZINGMATERIAL FLOWS
This report does not attempt to show the rel-ative environmental impacts of materialflows by using a weighting or scoring system.With a few exceptions, material flows cannotbe assigned values indicating that they aregood or bad. Impacts depend on a material’sform and a material’s fate, that is, where itends up. Nitrogen absorbed in agriculturalplant tissue is good, nitrogen dissolved ingroundwater may be bad. Asbestos bound inconcrete is harmless, asbestos in humanlungs is harmful. Material flows follow

WRI: THE WEIGHT OF NATIONS
10
complex paths, and one weighting value can-not adequately capture the full picture. Moreimportantly, it is not the purpose of account-ing systems to prejudge complicated issuesby providing answers: rather, they shouldprovide information that enables people toask the right questions.
To this end, we have identified materialoutputs according to various characteristics,to permit their disaggregation into the cate-gories outlined above: outflows to air, land,and water; outflows exiting the economywithin one year of entry; outflows remainingin the economy for more than one year; anddissipative outflows. These categories permita number of policy-relevant questions: Whichmaterials flow to land, to water, and to air,and in what quantities? Which materials aredissipated into the environment with no orlimited possibility of recovery? How muchmaterial is potentially recoverable and recy-clable? How much toxic and hazardous mater-ial flows to the environment each year?13 Andhow are these outputs changing over time?
These are basic questions. It is our hopethat researchers using these data willimprove on them, for example, by developingsophisticated weighting schemes applicableto single material pathways or conductingenvironmental and social cost-benefit analy-ses on the impacts of specific flows. We havetaken a first step in this direction by develop-ing a more detailed pilot characterizationscheme for the U.S. materials database. Thisscheme assigns values to the 460 materialflows documented, based on a range of phys-ical and chemical characteristics, as well astheir residence time in the economy andtheir mode of entry to the environment. (SeeU.S. country report.) These values do not cor-relate with any degree of environmental
impact. Their purpose is to enable users toidentify and search for quantities of materi-als of specific interest. (An example might bea database search to identify material outputsbetween 1975 and 1996 that are: unprocessedbut chemically active, resident in the econo-my for less than two years, and disperseddirectly on land in solid, partially solid, orliquid form.)
2 .5 DATA ACCESS ANDQUALITY
The national physical accounts databases onwhich this report is based, along withdetailed technical notes and sources, can beaccessed on the Internet via the home pagesof our institutions (see p. 125). The indicatorspresented in this report were developedusing data obtained from national statisticson wastes and emissions, and estimatesbased on use information. The reliability ofthe data and the methods used varied bycountry and material. In some cases, mod-eled estimates supplemented missing orincomplete data. The comprehensive natureof national statistics on emissions and wastesfor countries other than the United Statesand Japan made them the source for themajority of these countries’ data. For theUnited States, data on outputs were derivedfrom statistics on production, net imports,and recycling, coupled with disaggregatedinformation on how commodities were used.Consistent data sources and methods wereused for the entire 1975–96 time frame.While some data were available on hiddenflows, for the most part hidden flow quanti-ties were estimated on the basis of nationalaverage statistics, engineering practice, and the scale of the activity producing thehidden flow.

WRI: THE WEIGHT OF NATIONS
11
Our experience with using official statisticsas the basis for compiling national physicalaccounts leads us to the following conclu-sions:
• In the European countries studied, goodquality data are available on waste.However, in all the countries studied, wehad to supplement official statistics to pro-vide complete time series from 1975 to1996 on waste disposal in controlled land-fills. The Netherlands appears to have themost comprehensive data. In Austria andGermany, official sources provided thebasis for study estimates. In Germany,future waste statistics will probably providemore complete information for nationalmaterial flow accounts. In the UnitedStates, official governmental statistics areinsufficient and in most cases served onlyindirectly as a basis for study estimates. InJapan, official sources provide good time-series data for municipal wastes disposal,but data on industrial wastes are of inade-quate quality.
• Emissions to air are adequately docu-mented in official statistics for CO2, SO2,and NO2 in all the study countries. Exceptin Germany, emissions of CFCs andhalons were not represented in officialdata. The current study extends officialreports by including bunker fuel emissionsin national data.
• Emissions of substances to water are smallin quantity, relative to other emissions.Nevertheless, accounting for emissions towater appears to be underdeveloped giventhe range of substances discharged. Also,information on the temporal trend indicat-ing possible developments of nonpointsource releases and the effectiveness of
sewage treatment is lacking in study coun-tries other than the Netherlands.
• Among dissipative material outflows, thoserepresenting recycling flows, such asmanure, compost, and sewage sludgesspread on agricultural land, are well docu-mented in official statistics. Among thethroughput flows, mineral fertilizers andpesticides are also recorded in official sta-tistics. Minor flows, such as the use of gritmaterials on roads, are insufficiently docu-mented, except in the United States.Materials used for other purposes wereconsidered only in the country studies ofGermany and the United States.Dissipative losses were accounted for byAustria, Germany, and the United States.
• Until recently, hidden flows have beenignored in official data. There is nowincreasing recognition of their importance.Overburden from mining has been includedin waste statistics in Germany since 1993;the Austrian Environmental Policy Plan(1995) mentions hidden flows but does notprovide data, which are only now beingprepared. The Japanese EnvironmentalYear Book of 1998 also records hiddenflows. No mention is yet made of hiddenflows in official data sources in either theNetherlands or the United States. Amonghidden domestic flows, we could quantifysoil excavation for all five countries in thisstudy. Generally, official statistics providedthe basis for our estimates. We were ableto account for most mining wastes directlyfrom official statistics in all countriesexcept the United States, where we had to make estimates. Dredging wastes areadequately reported in Germany, theNetherlands, and the United States.Although soil erosion from cultivated land

WRI: THE WEIGHT OF NATIONS
12
represents a major environmental concern,we were obliged to estimate quantities formost countries. The United States was theexception, where the Department ofAgriculture provides official estimates ofsoil erosion. Data for soil erosion anddredging wastes were not available, or esti-mated, for Austria.
2 .6 THE IMPORTANCE OFPHYSICAL ACCOUNTS IN UNDERSTANDINGMATERIAL FLOWS
Physical accounts are commonly used to trackinputs and outputs in the mining sector, inmany industries at the sector and firm level,and even in households (for example, unitsof energy consumption). Physical accountingis the norm in plant operations. However, at the national level, physical accounts areeither absent or are compiled only for a limited number of natural resources, usingmethodologies that are not comparableacross sectors or among countries.
Traditional monetary accounts are not anadequate basis for tracking material flows.They record only a part of resource inputs,lose sight of some materials in the course ofprocessing (for example, in the UnitedStates, lead “disappears” in monetary termswhen it is incorporated into glass products),and miss many hidden flows entirely.14
Monetary accounts record few material out-put flows that are not subject to regulation orclassified as wastes requiring treatment; nor do they differentiate among the myriadmaterials that are aggregated in products.Although attempts to attach monetary valuesto output flows (pricing externalities) are useful, these methodologies remain subjec-tive and controversial. They clearly are rele-vant for prioritizing clean-up and remedia-tion efforts relating to specific flows, but areof less value in characterizing mass flows.
Current environmental statistics and moni-toring policies do not capture the whole pic-ture of material flows either. Environmentalpolicy tends to focus on specific materialsknown to be harmful to the environment orhuman health at specific stages of their lifecycle. Regulations and economic instrumentsseek to prevent or mitigate certain impacts,but they rarely take sufficient account ofupstream or downstream effects. Comprehen-sive, integrated physical accounts, coveringthe entire material cycle, permit the formula-tion of environmental and economic policybased on the big picture. Such an approachallows us to pinpoint where flows of a harm-ful material are concentrated, where theyoriginate, and where they end up. It alsohelps to identify which activities or productsare primarily responsible for these flows andto devise interventions which stand the bestchance of being environmentally effectiveand economically efficient.

WRI: THE WEIGHT OF NATIONS
13
This chapter presents an overview ofmaterial outflows in the five studycountries. It documents current levels
of material outflows, analyzes the composi-tion of these flows, reviews 21-year trends inthe indicators TDO, DPO, and NAS, anddraws comparisons among the five studycountries through the use of per capita data.The study findings provide policy-relevantinformation about the links between economicgrowth and population growth, economicstructure, quantities and types of materialoutputs, and the fate of materials in the econ-omy or the environment. The findings alsohelp to explain how and why patterns of mate-rial outputs are changing over time. For easeof comparison, summary tables of the datadiscussed in the following pages are presentedin Annex 1. Annex 2 provides more detailedanalyses of material flows in each country.
3 . 1 TOTAL DOMESTIC OUTPUT(TDO)
Total domestic output (TDO) is the aggregatemeasure of domestic processed output (mate-rial outflows from the economy) plus domestichidden flows (which do not enter the eco-nomy). It represents the total quantity ofmaterial outputs and material displacement
within national borders and is the best proxyindicator of overall potential output-relatedenvironmental impacts in each country.
TDO varies widely among the study coun-tries: 23 billion metric tons in the UnitedStates; 3.5 billion metric tons in Germany;2.6 billion metric tons in Japan; 381 millionmetric tons in the Netherlands; and 171 mil-lion metric tons in Austria. These differencesare due in large part to disparities in the sizeof domestic hidden flows, which are domi-nated by mining overburden (in those coun-tries with a significant mining sector), earthmoved during construction, and soil erosionfrom cultivated fields. The size of nationalhidden flows is, therefore, closely linked tothe presence or absence of a mining sector,the country’s geographic scale (which deter-mines the size of infrastructure and relatedearth moving), and the scale and type of agriculture (which influences soil erosion).Uniquely, dredging wastes—the bulk ofwhich are landfilled or deposited in openwaters—are the largest hidden flow in theNetherlands.
The relative dependence of an economy onimports also significantly affects the size oftotal domestic output. For example, theUnited States and Germany produce many of
S T U D Y F I N D I N G S
3

WRI: THE WEIGHT OF NATIONS
14
their own mineral resources, and hiddenflows associated with domestic mining activi-ties (such as overburden and waste ore) areincluded in the TDO of these countries.Austria, Japan, and the Netherlands, by con-trast, import most of their mineral require-ments, and mining flows occurring in theexporting countries (foreign hidden flows)are not included in TDO reported for thesethree study countries.15
Material output flows are not closely corre-lated with the size of a national economy, butthere is a relationship between the two.Figure 2 compares TDO in the study coun-tries on a per capita basis. Table 1 providesinformation on the absolute and relative sizesof each country’s economy, total domesticoutput, and domestic processed output. Therelationship between size of economy andsize of outflows is noticeably closer betweenGDP and DPO. The United States is excep-tional, generating larger material flows thanmight be expected from the size of its eco-nomy, even when hidden flows are excluded.
TRENDS IN TOTAL DOMESTICOUTPUT (TDO)
In most study countries, TDO did not changesubstantially between 1975 and 1996. Totaloutputs fell by 5 percent in Austria, and roseby less than 3 percent in the Netherlands andthe United States. For Germany, data beforereunification of the country in 1990 refer tothe Federal Republic of Germany only. Afterreunification, there was a significant declinein TDO. (See Figure 3.) Only Japan experi-enced an increase in TDO of 19 percent; themost significant difference from other coun-tries being an atypical increase of 18 percentin hidden flows. Domestic hidden flows inJapan are caused primarily by large, publiclyfunded construction programs.
The otherwise relatively stable pattern inTDO is attributable primarily to nationalreductions in domestic hidden flows, offsetto a greater or lesser extent by increases inflows of domestic processed output from theeconomy. The United States substantiallyreduced its rates of soil erosion after imple-
Austria 235.3 1.0 100.8 1.0 171.3 1.0
Netherlands 410.5 1.7 281.3 2.8 381.1 2.2
Germany 2,446.6 10.4 1,074.7 10.7 3,492.2 20.4
Japan 5,338.9 22.7 1,406.5 14.0 2,632.1 15.4
United States 7,390.6 31.4 6,773.8 67.0 23,261.0 135.8
TABLE 1 THE RELATION BETWEEN MONETARY ANDMATERIAL OUTPUT FLOWS, 1996
Country GDP DPO TDO
Billion $US Ratio RatioMillion
Metric Tons RatioMillion
Metric Tons
Note: GDP for all countries is expressed in 1996 U.S. dollars, based on data provided in World Bank Development Indicators, 1999(Washington D.C.: World Bank, 1999).

WRI: THE WEIGHT OF NATIONS
15
0
10
20
30
40
50
60
70
80
90
100
F I G U R E 2 TOTAL DOMESTIC OUTPUT (TDO) , 1996
Austria Germany Japan Netherlands United States
Hidden Flows
DPO
Metr
ic T
on
s P
er
Cap
ita
50
100
150
200
250
1975 1980 1985 1990 1995
F I G U R E 3 TRENDS IN TDO, 1975–1996 ( INDEX)
Ind
ex
(19
75=
100
)
Austria
Germany
Japan
Netherlands
United States

WRI: THE WEIGHT OF NATIONS
16
Economic activity transforms materials into differ-
ent physical and chemical forms or mobilizes them
in ways that may be hazardous to human health,
toxic in the environment, or disruptive of biogeo-
chemical cycles. Useful carbon enters the economy
as coal, gas, or oil, is burned, and exits as climate-
changing carbon dioxide. Zinc or mercury are safe
enough until they are mined and dispersed into
air, soil, or water. Nitrogen, the most abundant gas
in the atmosphere, is fixed by a variety of human
actions and transformed into nitrogen gases that
contribute to global warming, acid rain, and deple-
tion of the ozone layer, and into nutrients that, in
excess quantities, stimulate eutrophication and
algal blooms and contaminate drinking water. The
scale of modern industrial activity, even today,
when four fifths of the world is still relatively non-
industrialized, is great enough to have changed
significantly the natural global cycles of carbon
and nitrogen. The atmospheric concentration of
carbon dioxide has risen from 280 parts per mil-
lion (ppm) in preindustrial times to 367 ppm
today.16 The rate of nitrogen fixation, thanks to fer-
tilizer manufacture and fossil fuel combustion, is
now double the preindustrial rate.17
Domestic Hidden Flows, which never enter the
economy as traded commodities, represent the dis-
placement of materials from their original position
in the environment to another. Some degradation
or landscape alteration is often involved, as when
earth is excavated during construction. Hidden
flows may also involve physical or chemical trans-
formation. Topsoil, excavated and displaced, loses
much of its structure and natural fertility; soil
eroded from cultivated fields is of little further use
once transformed into sediment in rivers.18
Hazardous chemicals, such as selenium, may be
leached from overburden when rock and earth are
newly exposed to air, and sulphide rocks can con-
tribute to acid mine drainage.
B O X 2 MATERIAL OUTFLOWS AND ENVIRONMENTAL DEGRADATION
menting the Conservation Reserve Program,although this trend was countered by anincrease in the amount of overburden andgangue from mining activity. Austria andGermany achieved dramatic reductions inquantities of overburden as lignite miningwas scaled back, which more than offset
increases in construction-related earth mov-ing. In the Netherlands, lower rates of soilerosion and a steep fall in the quantities ofearth moved during construction, possiblybecause of completion of the national roadnetwork, reduced hidden flows by more than25 percent.

WRI: THE WEIGHT OF NATIONS
17
3 .2 DOMESTIC PROCESSEDOUTPUT (DPO)
Domestic processed output (DPO) comprisessolid wastes, and liquid and gaseous emis-sions and discharges; these flows are par-tially captured in official national statistics,though many individual flows are missed.The DPO indicator is more directly compara-ble across the study countries, because it cap-tures the economic activities common to alland excludes the highly variable hiddenflows. On a per capita basis, the quantities ofdomestic processed output generated in eachcountry vary at most by a factor of just overtwo. (See Figure 2.)
Trends in DPO: Growth andDecoupling
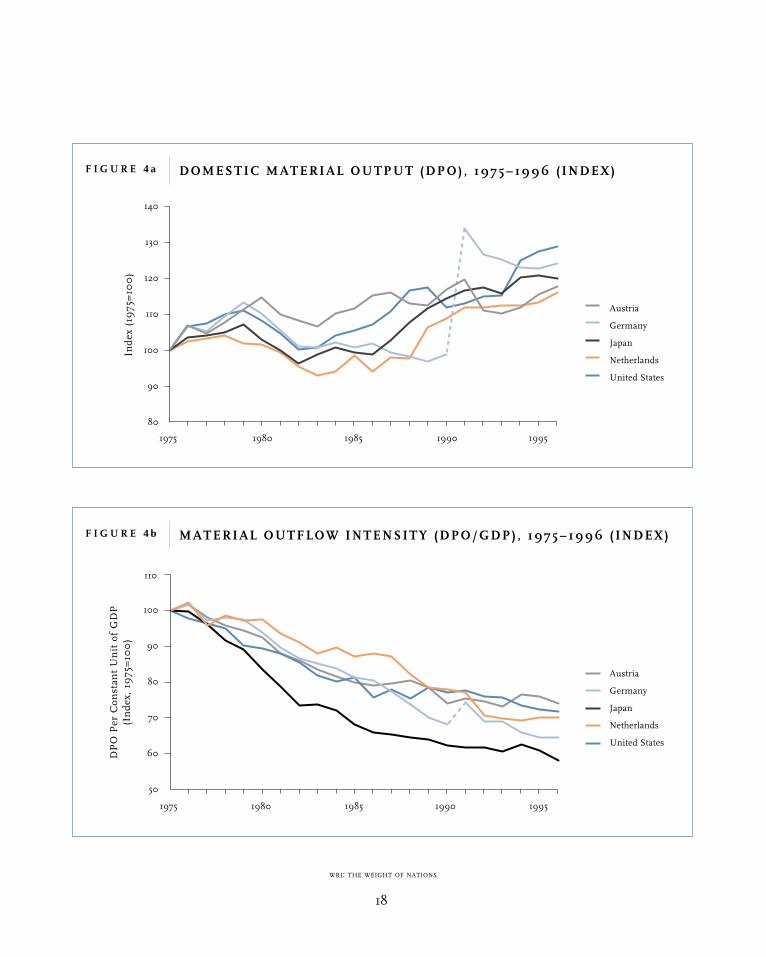
In marked contrast to the relative stability ofTDO, domestic processed output in four ofthe five countries has risen by between 16percent and 28 percent since 1975. (SeeFigure 4a.) The exception is Germany, whereDPO rose slightly and fell again between1975 and reunification in 1990, and has fallen from its new higher level since then.This atypical pattern was largely because offuel-switching away from high-carbon energysources, which reduced emissions of carbondioxide. The shift to lower-carbon oil and gasoccurred earlier in the other study countries;therefore, their gains in carbon efficiency areless pronounced during the study period.
Economic growth in all study countrieswas strong over the same 21-year period.GDP grew by between 62 percent in theNetherlands and 106 percent in Japan. At
first glance, therefore, we see considerabledecoupling between economic growth andgeneration of material outflows. (See Figure 4b.)The materials outflow intensity (DPO/GDP)of all five countries has fallen impressivelysince 1975, although the trend appears to haveslowed in recent years. Decoupling is partlythe result of successful attempts to reducewaste volumes, especially landfilled wastes,and to increase recycling. (See section 3.4.)Decoupling appears to owe more to efficiencyimprovements and the ongoing shift awayfrom traditional energy- and material-intensiveindustries toward knowledge-intensive in-dustries, and the financial and other servicesectors. As one example, the share of Japan’sGDP contributed by the manufacturing sector fell from 30 to 24 percent between1975 and 1996, while the share of the servicessector rose from 52 to 60 percent.19 Shiftswithin sectors, from heavy industries to hightechnology industries, for example, are stillmore pronounced.
In spite of the trend toward decouplingbetween economic growth and material out-put, progress is less evident at the more tan-gible level of material outputs per person.Figure 4c displays erratic and contrastingtrends, reflecting cycles of economic reces-sion and prosperity and changing populationstructures. At the end of the 21-year period,however, per capita domestic processed out-put had declined slightly in only one country,Germany, and had increased in all the others.This means that the average citizen in thestudy countries generates slightly more wasteoutputs today than he or she did in 1975.
WRI: THE WEIGHT OF NATIONS
18
80
90
100
110
120
130
140
1975 1980 1985 1990 1995
F I G U R E 4 a DOMESTIC MATERIAL OUTPUT (DPO) , 1975–1996 ( INDEX)
Ind
ex
(19
75=
100
)
Austria
Germany
Japan
Netherlands
United States
50
60
70
80
90
100
110
1975 1980 1985 1990 1995
F I G U R E 4 b MATERIAL OUTFLOW INTENSITY (DPO/GDP) , 1975–1996 ( INDEX)
DP
O P
er
Co
nst
an
t U
nit
of
GD
P
(In
dex,
19
75=
100
)
Austria
Germany
Japan
Netherlands
United States

WRI: THE WEIGHT OF NATIONS
19
Table 2 presents the absolute values behindthese 21-year trends: increases in DPO andGDP, decoupling between DPO and economicgrowth, and less pronounced decouplingbetween DPO and population growth.
These findings indicate that technologicalprogress and restructuring toward service-based economies in the study countries havesubstantially weakened the link between eco-nomic growth and resource throughput. Thedevelopment of new patterns of economicgrowth, such as e-commerce, may weakenthe link further. However, actual dematerial-ization has not been achieved. We see herethat, despite decoupling between growthrates in GDP and material throughput, quan-tities of wastes and emissions generated bythe study countries have increased in
absolute terms over the 21-year study period.On a per capita basis, some countriesachieved modest decoupling during the1980s, only to lose their gains in the moreprosperous 1990s. (Stronger decoupling inGermany is explained largely by the unusualand temporary circumstance of declining carbon dioxide emissions).
Part of the explanation for the continuedincrease in overall waste quantities lies in thefact that traditional industries, despite theirdeclining relative economic importance, arenot necessarily declining in terms of theirphysical operations. In addition, eveneconomies with sophisticated high technol-ogy sectors continue to use older generation,inefficient technologies where they representlow-cost options. For example, the United
1980 19901975 1985 1995
80
90
100
110
120
F I G U R E 4 c MATERIAL OUTFLOW INTENSITY (DPO PER CAPITA) , 1975–1996(INDEX)
Ind
ex
(19
75=
100
)
Austria
Germany
Japan
Netherlands
United States

WRI: THE WEIGHT OF NATIONS
20
States still makes use of old, coal-fired powerstations, and poorly insulated houses remainthe norm in the construction sector. Finally,cultural factors and consumption choiceshave helped to offset the real efficiency gainsthat have been made in industry. Consumerlifestyles have changed over the past quarter-century and affluence, for the most part,
has encouraged more material acquisition, more mobility, and a preference for conve-nience and product disposability. In theabsence of further policy incentives, struc-tural economic change and technological efficiency gains alone appear unlikely tobring about a real reduction in resource use and waste outputs.
Austria 1975 7.6 85.7 1,441.0 0.059 11.3
1996 8.1 100.8 2,415.0 0.042 12.5
% change +6 +18 +68 –29 +10
Germany1
1975 61.8 865.3 1,838.5 0.47 14.0
1996 81.8 1,074.7 3,541.5 0.30 13.1
% change +32 +24 +93 –36 –6
Japan 1975 111.9 1,173.0 244.3 4.80 10.5
1996 125.9 1,406.5 504.4 2.78 11.2
% change +13 +20 +106 –42 +7
Netherlands 1975 13.6 242.6 413.0 0.59 17.8
1996 15.5 281.3 667.6 0.42 18.1
% change +14 +16 +62 –29 +2
United States 1975 220.2 5,258.7 4,253.9 1.24 23.9
1996 269.4 6,773.8 7,390.6 0.92 25.1
% change +23 +28 +74 –26 +5
TABLE 2 COMPARISON OF TRENDS IN ECONOMIC AND POPULATION GROWTH, AND DOMESTIC PROCESSED OUTPUT (DPO) , 1975–1996
Country Population
(millions)
DPO
(million metric tons)
GDP
(own currencySee notes)
DPO/GDP
(metric tons permillion constantmonetary units,own currency)
DPO/Capita
(metric tons percapita)
Notes:
1 All data for Germany are affected by reunification in 1990, which increased the population of the country by 26 percent, GDP by 24 percent, and
DPO by 35 percent.
GDP expressed in billion constant 1996 Austrian Schillings (Austria), billion constant 1996 Deutsch Marks (Germany), billion constant 1996 Yen
(Japan), billion constant 1996 Guilders (Netherlands), and billion constant 1996 U.S. Dollars (United States).
U.S. GDP is based on World Bank data.20
WRI: THE WEIGHT OF NATIONS
21
Trends in DPO: Composition
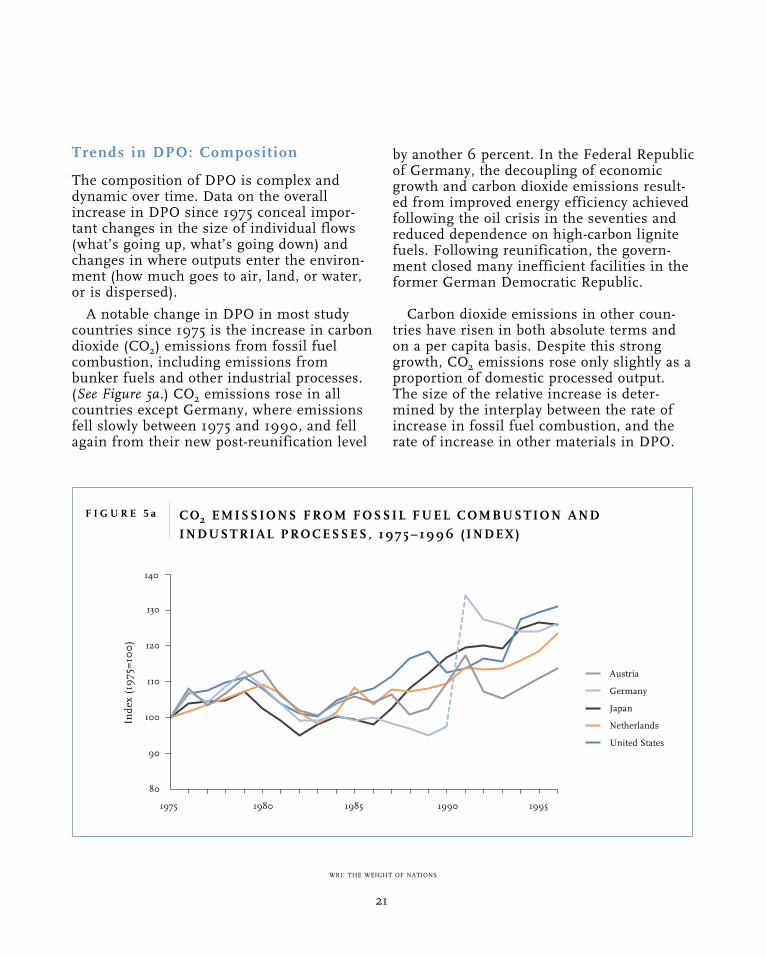
The composition of DPO is complex anddynamic over time. Data on the overallincrease in DPO since 1975 conceal impor-tant changes in the size of individual flows(what’s going up, what’s going down) andchanges in where outputs enter the environ-ment (how much goes to air, land, or water,or is dispersed).
A notable change in DPO in most studycountries since 1975 is the increase in carbondioxide (CO2) emissions from fossil fuelcombustion, including emissions frombunker fuels and other industrial processes.(See Figure 5a.) CO2 emissions rose in allcountries except Germany, where emissionsfell slowly between 1975 and 1990, and fellagain from their new post-reunification level
by another 6 percent. In the Federal Republicof Germany, the decoupling of economicgrowth and carbon dioxide emissions result-ed from improved energy efficiency achievedfollowing the oil crisis in the seventies andreduced dependence on high-carbon lignitefuels. Following reunification, the govern-ment closed many inefficient facilities in theformer German Democratic Republic.
Carbon dioxide emissions in other coun-tries have risen in both absolute terms andon a per capita basis. Despite this stronggrowth, CO2 emissions rose only slightly as aproportion of domestic processed output.The size of the relative increase is deter-mined by the interplay between the rate ofincrease in fossil fuel combustion, and therate of increase in other materials in DPO.
80
90
100
110
120
130
140
1975 1980 1985 1990 1995
F I G U R E 5 a CO2 EMISSIONS FROM FOSSIL FUEL COMBUSTION AND
INDUSTRIAL PROCESSES, 1975–1996 ( INDEX)
Ind
ex
(19
75=
100
)
Austria
Germany
Japan
Netherlands
United States

WRI: THE WEIGHT OF NATIONS
22
0
10
20
30
40
50
60
70
80
90
100
F I G U R E 5 b CO2 FROM FOSSIL FUEL COMBUSTION AND OTHER INDUSTRIAL
PROCESSES AS A PERCENTAGE OF DPO, 1975 AND 1996
Austria Germany Japan Netherlands United States
1975
1996
Perc
en
t
Thus Japan, which experienced steady growthin DPO as a whole, but faster growth in energy consumption, saw the share of CO2 inDPO rise by 4 percent. In the United States,energy consumption rose more rapidly thanin Japan, but DPO grew more rapidly, too,and the net result was that the share of CO2in DPO barely changed. The point of thesecalculations is to highlight the fact that,despite improvements in energy efficiencyand increased waste generation in otherareas, fossil fuels have maintained their dom-inance in the material outflows of industrialeconomies. In the study countries, carbondioxide from fossil fuel combustion and
industrial processes accounted for, on aver-age, 81 percent by weight of their entiredomestic processed output in 1996, just onepercent higher than in 1975. (See Figure 5b.)
In strong contrast to carbon dioxide emis-sions, all countries have experienced absolutedeclines in sulfur emissions to air, whilecombustion-related nitrogen emissions havebroadly stabilized. These changes wereforced by mandatory emission reductionsand targets established in OECD countries,and aided by technological changes and market forces, which encouraged the switchto lower-sulfur fuels.
Notes: These data do not include CO2 from biomass combustion, which is assumed here to be carbon-neutral. Austria has imple-
mented policies to encourage the use of biomass energy since the 1970s. If CO2 emissions from biomass combustion were included,
the share of CO2 in Austrian DPO (1996) would be 15 percent higher than shown here.

WRI: THE WEIGHT OF NATIONS
23
The quantities of municipal and industrialwastes going to controlled landfill sites havedeclined significantly in most study coun-tries, following the introduction of recyclingtargets for certain categories of municipalwastes, sometimes combined with landfilltaxes. Since 1975, landfilling has declined by34 percent in the Netherlands and by 31 percent in Austria. Dissipative flows showvarying trends, generally reflecting the pres-ence or absence of strong government inter-vention. For example, quantities of manurespread on fields and pesticide use fell in the Netherlands, as part of the government’seffort to reduce nitrogen pollution and dispersion of hazardous materials from agriculture. Quantities of sewage sludgehave risen in all countries, in line with pop-ulation growth.
The more detailed nature of the U.S. data-base on material outflows permits examina-tion of finer categories of material. For exam-ple, it appears that waste outputs of syntheticorganic chemicals in plastics in the UnitedStates have more than doubled since 1975, ashave outputs of waste medical chemicals.Annex 2 provides more detailed informationon the composition of DPO in each of thestudy countries.
3 . 3 SECTOR INDICATORS:WHO GENERATES THEBIGGEST OUTPUT FLOWS?
In Germany and the United States, the min-ing sector (mineral fuels and metals) and the manufacturing sector dominate total
It is important to recognize the extent to which
energy-related flows dominate physical accounts.
Our 1997 report showed that fossil fuels and their
associated hidden flows accounted for approxi-
mately 40 percent of total material requirement
(TMR) in Germany, the Netherlands, and the
United States in 1994, and a little less than 30
percent in Japan, thanks to relatively low per capita
energy consumption in that country. (These data
exclude the weight of oxygen drawn from the
atmosphere during combustion.) On the output
side, flows associated with energy use are equally
dominant, and they appear more dominant in this
report, because of our decision to include the
weight of oxygen in combustion products, such
as carbon dioxide. For example, coal mining wastes
and fossil fuel combustion emissions together
account for about 50 percent of total domestic out-
put in the United States. If hidden flows are
excluded, the picture is even more dramatic.
Emissions from all fuel combustion account for
between approximately 80 and 90 percent of
domestic processed output in the study countries.
Modern industrial economies, no matter how high-
tech, are carbon-based economies, and their pre-
dominant activity is burning material. Processing
materials into products requires energy; improve-
ments in materials efficiency therefore bring
improvements in energy efficiency as well.
B O X 3 A NOTE ON ENERGY AND MATERIAL FLOWS IN NATIONALPHYSICAL ACCOUNTS

WRI: THE WEIGHT OF NATIONS
24
domestic output. In countries without signif-icant mining activity, the agriculture, con-struction, and manufacturing sectors gener-ate the largest material flows. When hiddenflows are excluded from consideration, theenergy supply, manufacturing, transport, andhousehold sectors all emerge as majorsources of direct output flows to the environ-ment. (In this study, we attribute overburdenfrom coal mining to the mining and manu-facturing sector, not the energy supply sec-tor, which is defined as power plants and dis-tribution systems.) The Netherlands is anexception, where the agriculture sector is thesingle largest contributor to DPO: animalmanure flows in 1996 (dry weight) weremore than four times greater than all land-filled wastes. It is also worth noting thatmost transport-related DPO takes the form ofemissions from private vehicles, whicharguably could be assigned to households.
The national analyses presented here arenot exactly comparable, because of method-ological differences imposed by the organiza-tion of national statistics; data comparison is,therefore, limited to the coarse picture. (See Figure 6.) More detailed analysis of thephysical accounts for each country revealsthat, in all cases, economic sectors are inter-connected by upstream and downstreamproduct chains, and the question of who isdirectly “responsible” for output flowsbecomes almost irrelevant. The role of energy consumption is central, given thedominance of carbon dioxide emissions inDPO across virtually all sectors. Improvedenergy efficiency and faster progress towarda low-carbon fuel mix would dramaticallyreduce direct emissions to air from combus-tion. Such changes would also reduce otheroutflows associated with energy supply anddistribution—coal mining wastes, toxic and
hazardous outputs from oil refining andpower generation, and fuel losses and spillsthat occur during energy transportation.
3 .4 GATEWAY INDICATORS:WHERE DO MATERIALOUTFLOWS GO?
In this study, we have disaggregated TDOand DPO by mode of first release—the firstgateway by which materials enter the envi-ronment. Gateway indicators provide usefulinformation given that many countries stillorganize environmental policy according toenvironmental media (air, water, and land)and track emissions or ambient quality ineach medium separately. Poorly designedwaste management policies can simply trans-fer wastes from one medium to another; forexample, costly recycling requirements mayencourage incineration. Comprehensivephysical accounts track total outputs of eachmaterial, regardless of where it is depositedor whether or not it is regulated. Thus, theyalso provide a powerful tool to improve policies restricted to certain media.
Hidden flows remain largely on land,although an unknown fraction of earth fromconstruction activities and eroded soil fromcultivated fields enters river systems as sedi-ment, and more than half of dredging wastesin the Netherlands is simply relocated withinharbors or in deeper waters. The fate ofmaterials constituting DPO is more complex.The share of outputs going to differentgateways is influenced over time by changesin national economic structures, industries’choice of fuels and materials, consumerlifestyles and individual behavior, and policydecisions.

WRI: THE WEIGHT OF NATIONS
25
The study shows some shift between 1975and 1996, from disposal on land to disposalin the atmosphere. As already discussed,increased fossil fuel combustion is the prin-cipal driver behind rising emissions to air;the shift has been dictated mostly by choicesmade on the input side of the economy. Atthe same time, some countries have reducedthe amount of solid waste being disposed ofon land. Regulation and public informationcampaigns have resulted in increased recy-cling rates for such materials as paper, glassand metals, and, more recently, for organic
wastes. In Japan and Austria, the amount ofwaste going to controlled landfills has fallenin absolute and per capita terms since the1980s, and in Germany and the Netherlandssince 1990. In Germany, government andindustry initiatives on packaging recyclingand composting biowastes reduced theweight of household wastes by 30 percentbetween 1990 and 1993. Quantities of land-filled municipal wastes declined in theUnited States after 1987, following the widespread introduction of recycling andcomposting schemes. No trends could be
0
5
10
15
20
25
30
35
40
45
F I G U R E 6 CONTRIBUTION OF ECONOMIC SECTORS TO TDO, 1996
Austria Germany Japan Netherlands United States
Agriculture
Construction
Energy Supply
Industry (inc. mining)
Households
Transport
Other
Metr
ic T
on
s P
er
Cap
ita
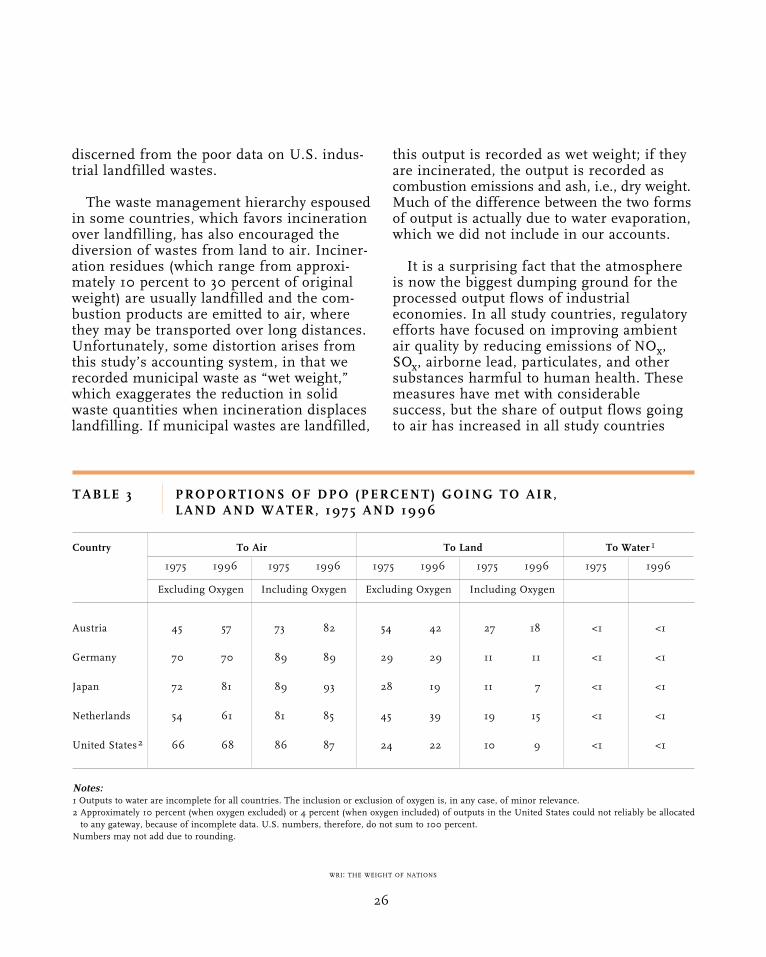
WRI: THE WEIGHT OF NATIONS
26
discerned from the poor data on U.S. indus-trial landfilled wastes.
The waste management hierarchy espousedin some countries, which favors incinerationover landfilling, has also encouraged thediversion of wastes from land to air. Inciner-ation residues (which range from approxi-mately 10 percent to 30 percent of originalweight) are usually landfilled and the com-bustion products are emitted to air, wherethey may be transported over long distances.Unfortunately, some distortion arises fromthis study’s accounting system, in that werecorded municipal waste as “wet weight,”which exaggerates the reduction in solidwaste quantities when incineration displaceslandfilling. If municipal wastes are landfilled,
this output is recorded as wet weight; if theyare incinerated, the output is recorded ascombustion emissions and ash, i.e., dry weight.Much of the difference between the two formsof output is actually due to water evaporation,which we did not include in our accounts.
It is a surprising fact that the atmosphereis now the biggest dumping ground for theprocessed output flows of industrialeconomies. In all study countries, regulatoryefforts have focused on improving ambientair quality by reducing emissions of NOx,SOx, airborne lead, particulates, and othersubstances harmful to human health. Thesemeasures have met with considerable success, but the share of output flows goingto air has increased in all study countries
Austria 45 57 73 82 54 42 27 18 <1 <1
Germany 70 70 89 89 29 29 11 11 <1 <1
Japan 72 81 89 93 28 19 11 7 <1 <1
Netherlands 54 61 81 85 45 39 19 15 <1 <1
United States2 66 68 86 87 24 22 10 9 <1 <1
TABLE 3 PROPORTIONS OF DPO (PERCENT) GOING TO AIR, LAND AND WATER, 1975 AND 1996
Country To Air To Land To Water 1
Excluding Oxygen
1975 1996
Including Oxygen
1975 1996
Excluding Oxygen
1975 1996
Including Oxygen
1975 1996 1975 1996
Notes:1 Outputs to water are incomplete for all countries. The inclusion or exclusion of oxygen is, in any case, of minor relevance.
2 Approximately 10 percent (when oxygen excluded) or 4 percent (when oxygen included) of outputs in the United States could not reliably be allocated
to any gateway, because of incomplete data. U.S. numbers, therefore, do not sum to 100 percent.
Numbers may not add due to rounding.

WRI: THE WEIGHT OF NATIONS
27
except Germany where, because of reduceddependence on lignite and hard coal andimproved energy efficiency, carbon dioxideemissions have fallen.
Table 3 illustrates how the proportions ofdomestic processed output going to air, land,and water changed over the 21-year studyperiod. The table presents the data in twoforms: exclusive and inclusive of the weightof oxygen in emission compounds, such ascarbon dioxide, oxides of nitrogen, andoxides of sulfur. It can be seen that the deci-sion to exclude or include oxygen makes asubstantial difference to the proportions ofoutflows to each environmental medium. Aswith economic accounts, the way in whichsystem boundaries are drawn can stronglyinfluence both data sets and the indicatorsthey support.
These results also reveal, on the one hand,the inadequacy of available data on outputflows to water in some countries, notably theUnited States, and, on the other hand, theeffects of our methodological decision toexclude freshwater flows from the study.Emissions to water, for the most part, consistof wastewater and have not been estimated.The contaminant loading of these waterflows is minor in quantity, but may haveimportant environmental impacts. Mass flowanalysis is not best suited to track these cont-aminants. Despite these problems, materialflows do not simply stop, and a policy-rele-vant physical accounting system shouldattempt to capture at least some of the mostenvironmentally significant cycles in theirentirety. For this reason, a number ofresearchers have undertaken more detailedsubstance flow studies for such pollutants asnitrogen, sulfur, and some heavy metals,which include their transport in water.21
3 . 5 DISSIPATIVE FLOWS
Some materials are deliberately dissipatedinto the environment because dispersal is aninherent quality of product use or quality andcannot be avoided. Dissipative flows maytake the form of dissipative uses or dissipativelosses. Obvious examples of dissipative useflows are inorganic fertilizers, manure, com-post, and sewage sludge that are spread onfields, partly to enrich soil, and partly (in the case of manure and sewage) as a disposal option. These flows are beneficial in appropriate quantities, and the use ofmanure, sewage and compost represents anecessary cycling of nutrients, but seriousproblems arise where dispersal loads exceedthe absorptive capacity of the receiving envi-ronment.22
Available national level data do not supportthe accurate documentation of nutrients thatare recycled through plant uptake or thosethat are lost into the environment throughleaching and run-off. Also, the systemboundaries that we chose for this studyexclude the material exchanges involved insoil chemistry. However, nutrient losses tothe environment are known to be large.Excessive nitrate levels in drinking water arenow a widespread water quality problem inEurope and North America, and dispersiveuses of nitrogen in agriculture are the lead-ing source of contamination. Nutrient run-offalso threatens estuaries and coastal areasworldwide.
Some other dissipative use flows are smallerin quantity but of comparable potentialharm. They do not represent an intentionalrecycling loop. Pesticides and herbicides aresprayed over fields, but enter soil, water, andthe air. Bio-accumulative agrichemicals are

WRI: THE WEIGHT OF NATIONS
28
more controlled than in the past, but theiruse has not been eliminated. Salt, which hasbeen linked to harmful impacts on wildlife,is still widely used as a de-icing agent onroads. Table 4 illustrates the significant dif-ferences in rates of some dissipative flowsamong the study countries.
Dissipative loss flows comprise numerousmaterials that are shed from products intothe environment as an inevitable conse-quence of use or ageing. Examples of suchdissipative losses include rubber worn fromvehicle tires, asbestos (or substitute compos-ites) from brake blocks and linings, paintflakes from buildings, and bitumen fromroad surfaces.
Governments do not officially record manyof these flows. This study is the first attemptto estimate some of the less obvious, butpotentially harmful, dissipative flows in five
countries. (See, for example, the German andU.S. country report data tables.) It is importantto know the quantities and nature of materi-als involved because once materials havebeen dispersed into the environment, if theyare not captured and recycled by biologicalprocesses (such as plant growth), there is lit-tle opportunity for human action to recaptureand recycle them. If dissipated materials aresuspected of causing environmental orhuman health impacts, the only option is toreduce or substitute them with materials thatare believed to be less harmful when dis-persed into the environment.
3 .6 NET ADDITIONS TO STOCK(NAS)
Physical accounts make it possible to trackhow much new material is added each year toa country’s physical stock—the national
Inorganic Fertilizer 114 113 17 65 86
Spread Manure 454 334 105 2,282 298
Pesticides 3 0.4 0.5 0.7 ..
Salt, Sand, and Gravel 134 26 .. .. 60
Sewage Sludge 11 13 .. 4 ..
TABLE 4 SELECTED DISSIPATIVE USE FLOWS, 1996 (KILOGRAMMES PER CAPITA)
Austria Germany Japan Netherlands United States
Notes:Salt, sand, and gravel includes all grit materials spread on roads to improve tire traction. The Austrian data are high because of heavy use of grit mate-
rials on mountain roads in winter. Austrian data for inorganic fertilizer and pesticides are recorded as total weight, not active ingredients. Manure and
sewage sludge are accounted in dry weight. Fuller accounts for dissipative use and dissipative loss flows are provided in the country reports.
.. Not estimated

WRI: THE WEIGHT OF NATIONS
29
0
5
10
15
20
25
30
F I G U R E 7 NET ADDITIONS TO STOCK, AND DOMESTIC PROCESSED OUTPUT, 1996
Austria Germany Japan Netherlands United States
NAS
DPO
Metr
ic T
on
s P
er
Cap
ita
material store represented by long-liveddurable goods and physical infrastructure(roads, railways, airports, industrial plants,and residential, commercial, and publicbuildings). Each year, a small percentage ofstock is decommissioned, as buildings aredemolished, and durable goods discarded.These materials are subtracted from grossannual additions to stock to determine netadditions.
The material flows added to stock eachyear are of comparable magnitude to DPO in
three of the study countries—Austria,Germany and Japan—and they are aroundone-third to one-half of the size in theUnited States and the Netherlands. (SeeFigure 7.) In per capita terms, Austria andGermany add the greatest amount of materialto stock each year, at 11.5 metric tons per person, and the United States appears to add the least, at just under 8 metric tons perperson. This is a surprising finding, giventhe size of the country, its penchant for“building big,” and its reputedly high levelsof material consumption.

WRI: THE WEIGHT OF NATIONS
30
Two insights emerge from the data. One isthat construction materials are overwhelm-ingly the largest constituent of net additions tostock. This has been deduced approximatelyby comparing quantities of constructionmaterials required in each country (recordedas 1994 inputs in our earlier study) withNAS as calculated in this study. It appearsthat durable goods, such as cars, electronicgoods, and household appliances, accountfor, at most, about one to two metric tons percapita of material added to stock each year.The decision whether or not to recycle con-struction materials emerges as important,given the huge quantities of materialinvolved. Construction and demolition wastesgenerated when buildings are erected ordemolished are recycled to a limited extent inall study countries, but data are not adequateto determine the quantities. (Constructionand demolition wastes sent to landfill arerecorded as part of DPO.) Recycling of mate-rials in durable goods—notably metals fromvehicles and large appliances—and materialreuse as part of product maintenance and re-engineering are accounted for indirectly, inthat these practices increase the residencetime of materials in the economy. The mate-rials are, at least temporarily, part of stock,not part of the waste stream.
The second insight is that the study coun-tries, which are all mature industrialeconomies with their road, rail, and housinginfrastructure relatively complete, do not yetshow any sign of significantly reducing thequantities of new construction materialrequired each year. Annual material enlarge-ments of stock have remained remarkablyconstant over the past 25 years, rising broadly in line with population growth in theUnited States and at a somewhat lower ratein the other study countries. The continued
physical growth of mature economies goesbeyond maintenance. It is due to increaseddemand for transport infrastructure. It isalso significantly influenced by demand fornew housing associated with changing demo-graphic structures and affluence. For exam-ple, the number of households is increasingfaster than population growth, as more peo-ple live alone or in smaller family groupings.In the United States, increasing affluencehas encouraged a taste for very large, low-density residences. If this trend continues,many millions of tons of minerals will con-tinue to be dug from the land for the foresee-able future. The most damaging aspect ofthis trend will be an ongoing loss of produc-tive land, degradation of scenic beauty, fragmentation and disturbance of habitats,and increased pressure on biodiversity.
A variety of economic, technological, topo-graphic, and cultural factors affects flows ofconstruction materials. When tracked overtime, net additions to stock closely follow theeconomic cycle. Booms, recessions, andmajor building programs show up clearly inconstruction material flows. Transportationis a major element in national construction;the long distances in the United States neces-sitate a huge highway system, while moun-tainous terrain in Japan and Austria meansthat road building involves many bridges,tunnels, and embankments.23 National build-ing standards and traditions also appear toinfluence flows to stock significantly, althoughit is difficult to interpret the data. The rela-tively high NAS figures seen in parts ofEurope might reflect a preference for build-ing in stone and brick, rather than using thelighter wood-frame construction techniquesstill favored in much of the United States.Higher or lower levels of public investmentin infrastructure maintenance will affect the
WRI: THE WEIGHT OF NATIONS
31
quantity of annual flows to stock. In the caseof Germany, it is interesting that heavy con-struction activities induced high per capitaNAS even before reunification. Modernizationof buildings and infrastructure, along withsettlement expansion after reunification, hasfostered the high rate of physical growth.
An important lesson is that as materialstocks grow, so do the potential future waste
volumes. Equally, so does the potential“mine” of materials for reuse. Europeancountries have recently taken steps toencourage recycling of construction anddemolition wastes. A forthcoming study bythe U.S. Geological Survey aims to stimulatesimilar action by demonstrating the quanti-ties of material that will be required as thecountry’s infrastructure is largely replacedover the next 50 years.

WRI: THE WEIGHT OF NATIONS
32
The environmental, social, and economicconsequences of material outflows havebecome readily apparent over recent
decades. Most industrialized countries havetaken effective action to control a limitednumber of the more hazardous or objection-able outflows. OECD countries are alsoengaged in a program to test chemical mate-rials produced in large volumes for toxicity.However, it is the contention of this studythat the total quantities of outflows remain amystery to most regulators and to the eco-nomic actors who produce them. For exam-ple, comprehensive data on discharges tosurface water do not exist in any of the studycountries. Definitional difficulties (and defin-ition changes) applied to toxic and hazardouswastes preclude the development of reliabletime-series data. Until the physical outflowsof industrial economies are more accuratelydocumented and assessed, it will be difficultto identify and prioritize remedial actions ordesign appropriate future policies.
The creation of indicators of material flowsthrough industrial economies allows us tovisualize those economies as physical as wellas financial entities. Material flows into aneconomy in physical terms (metric tons) area measure of that economy’s dependence onresource extraction and potential associated
environmental impacts. Material flows out ofan economy are a measure of the effectiveloss of useful materials. Together withdomestic hidden flows, they are an indicativemeasure of that economy’s burden on theplanet’s assimilative capacity.
Like many macroindicators, aggregatedmaterial flows combine many different kindsof material in order to demonstrate theabsolute and relative magnitudes of economicactivity in terms of mass. The indicators are descriptors of a physical system, just asGDP, trade balances, and other economicindicators are descriptors of an economic system. Physical measures better approximatepotential environmental burden than do the monetary indicators used by traditionaleconomists. But just as GDP doesn’t tell thewhole story of the monetary economy, so theindicators we recommend do not tell thewhole story of the physical economy. As ineconomic analyses, subaccounts, specialanalysis, and relevant weighting must beused to answer specific questions of economyand environment interactions, and to comeup with specific management plans or policyinterventions.
If the promise of the greening of nationalaccounts is ever to be fulfilled, environ-
P O L I C Y A P P L I C A T I O N S
4

WRI: THE WEIGHT OF NATIONS
33
mental economists must have these physicalaccounts—parallel to monetary accounts—toprovide a basis for valuation and to calculatea green GDP. Given difficulties with valuingthese physical accounts, however, it is likelythat the indicators of the physical dimensionof the economy, which we are recommend-ing, will stand separate from monetary indi-cators for some time to come. We stress thatboth sets are necessary, along with those forlabor and prices, to fully understand an econ-omy and develop soundly based policy.
This section presents examples of howphysical accounts and indicators at various
levels of aggregation can be used in environ-mental policy-making.
Physical accounts can be used to track spe-cific flows of concern over time and at everystage of the production-consumption chain.
Where time series are available, it is possibleto analyze trends in the use of specific mate-rials or categories of material, which are ofconcern either because of their impacts onhuman health or the environment or becauseof their economic or strategic interest. It isalso possible to discern the influence of regu-lation, where controls have successfully
0
50
100
150
200
250
300
350
400
450
500
1975 1980 1985 1990 1995
F I G U R E 8 POTENTIALLY HAZARDOUS OUTPUT FLOWS IN THE UNITEDSTATES, 1975–1996
Mil
lio
n M
etr
ic T
on
s
Other
Chlorine
Heavy Metals
Asbestos
Salt
Synthetic OrganicChemicals
Fuel-RelatedContaminants
Note: Fuel-related contaminants include gangue (waste ore) from coal mining operations; fuel spills at the extraction, distribution,
and use stages; methane leakage; and coal fly ash. Carbon dioxide is not included.

WRI: THE WEIGHT OF NATIONS
34
influenced material output flows in one oranother application (for example, the use oflead in gasoline and mercury in batteries hasdeclined), or where lack of regulation hasallowed other outputs to grow (for example,lead uses in electrical products). Systematicaccounting for such categories can highlightwhole classes of materials currently outsidethe scope of environmental regulation. Forexample, in the United States, hazardouswaste policy focuses on listed substances andreleases to specific media. It does not covermost emissions from resource extraction,product use, or post-use disposal of products.Regulations are focused on the processingstage, but over half of toxic materials areembedded in products, where they may ormay not receive appropriate treatment at thedisposal stage. Figure 8 shows that when theentire material cycle is considered, outputflows that are potentially toxic or hazardousin the environment have risen by nearly 30percent in the United States since 1975. Thisincrease appears to be primarily due to grow-ing use of synthetic organics and increasedoutputs of the numerous contaminants asso-ciated with fossil fuels. This suggests theneed for policy measures that focus more onresource extraction and the initial design andmaterial components of products, in order toreduce the problems of managing hazardoussubstances later, when they enter the envi-ronment during use or disposal.
Detailed physical accounts can be developedand applied at the sector level.
This study provides preliminary data on therelative contributions of different economicsectors to national output flows in the fivestudy countries. Sector level data are of inter-est to policy-makers concerned with energyand material efficiency and with waste pre-
vention, both economy-wide, and in a sector-specific context. They are also relevant tocompanies interested in benchmarking theirenvironmental performance against theindustry sector as a whole or in comparingtheir sector’s performance with that of othercountries. Dupont, for example, has intro-duced a new measure that tracks resourcethroughput per unit of shareholder value asone of its performance indicators. Eco-effi-ciency is increasingly regarded as a key driver for corporate innovation and competi-tiveness. Physical accounts of inputs and out-puts at the sector level, and their relation toeconomic performance, provide the basis formonitoring eco-efficiency. Figure 9 presentsan illustrative case study. It records theresults of a study that documented how theAustrian chemical sector improved its perfor-mance in the late 1980s and early 1990s.24
Faced with rising resource costs, stricterwaste disposal regulations, and increasingeconomic pressure from international com-petitors, the industry increased its economicoutput and reduced its waste outflows atfaster rates than the economy as a whole.
At the national level, the indicators DPO and TDO, and their relationship to GDP, represent measures of the physical activity,and the energy and materials efficiency of an economy.
Definitions of sustainable developmentremain elusive. But we believe that decou-pling economic growth and resourcethroughput is an essential objective inachieving long-term sustainability. Whentracked over time, the physical indicators pre-sented in our earlier resource flows reportand in this study provide a means of trackingprogress toward greater efficiency of resourceuse, and reduced waste intensity. Our reports

WRI: THE WEIGHT OF NATIONS
35
F I G U R E 9 DECOUPLING IN THE AUSTRIAN CHEMICAL SECTOR, 1982–1993
50
60
70
80
90
100
110
120
130
140
150
1983 1986 1989 1992
Mil
lio
n M
etr
ic T
on
s
GDP Share: Chemical Industry
GDP: AustrianEconomy
DPO AustrianEconomy
DPO ChemicalIndustry, tons
DPO Austria/GDP(kg/1000 ATS)
DPO ChemicalIndustry (kg/1000 ATS)
have shown that in all five countries mate-rials efficiency has improved in recentdecades, relative to economic growth, butthat resource use and overall waste quantitieshave remained approximately steady on a percapita basis and have continued to grow inabsolute terms. This is a finding of criticalimportance to economic and environmentaldecision-making in the years ahead. We havelearned that efficiency gains brought by tech-nology and new management practices havebeen offset by the scale of economic growthand consumer choices that favor energy- andmaterial-intensive lifestyles.
The indicators also allow comparisons ofeco-efficiency across countries, at both thenational and sector levels. (See Figure 10.)This study shows the high energy and mate-rial intensity of the United States comparedwith other study countries, especially Japan.However, national economic structures vary,and interpretation of indicators requires care.For example, a national decline in U.S. goldmining would reduce hidden flows and“improve” apparent efficiency, but would notrepresent a contribution to global sustainabil-ity if equal quantities of gold continued to beimported from other countries.

WRI: THE WEIGHT OF NATIONS
36
National physical accounts make it possibleto organize flow data in an integrated frame-work, in order to see the big picture.
As an example, Figure 11 presents a samplematerial balance for Germany. The input sidedocuments imported materials, materialsharvested or extracted from the domesticeconomy, and inputs of oxygen required forfossil fuel combustion and human and ani-mal respiration. Materials retained in theeconomy are shown as net additions to stock.On the output side, the figure shows export-ed materials, outflows to land, air, and water.Domestic hidden flows are accounted for onboth sides of the system; because they do notenter the economy they are represented as asimultaneous input to, and output from the
economic system. Such comprehensiveframeworks show the composition of thematerial basis of an economy, its dependenceon imports, the size of its infrastructure, andthe quantities of material deposited into theenvironment. These frameworks allow set-ting of priorities based on knowledge of thewhole system, as well as supporting indica-tors which track progress at the nationallevel. German policy-makers have been influ-enced by the availability of material flow datafor some years. The German FederalStatistical Office prepared a national materialflow balance in 1995 and, partly as a result,Germany became one of the first countries toestablish national targets for improving theefficiency of materials use.
0
200
400
600
800
1000
1200
1400
F I G U R E 1 0 DPO PER CONSTANT UNIT OF GDP (U.S . DOLLARS) 1975 AND 1996
Austria Germany Japan Netherlands United States
1975
1996
Metr
ic T
on
s/M
illi
on
$U
S
Note: National currencies expressed in U.S. dollars, based on data provided in World Development Indicators, 1999(Washington, D.C.: World Bank).
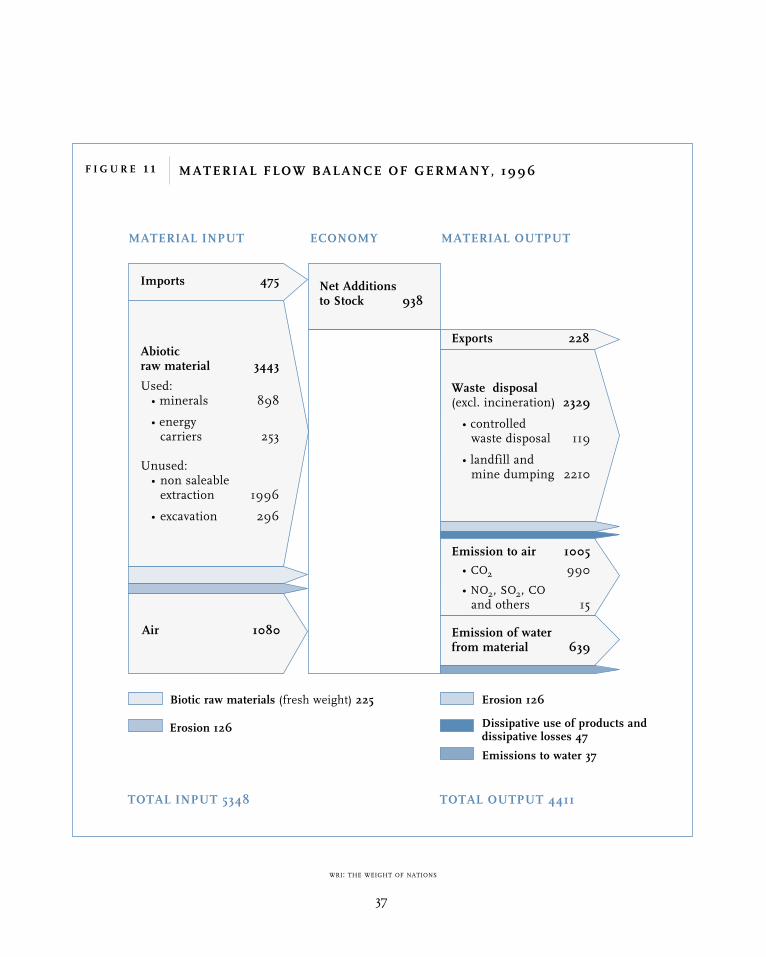
WRI: THE WEIGHT OF NATIONS
37
F I G U R E 1 1 MATERIAL FLOW BALANCE OF GERMANY, 1996
MATERIAL INPUT ECONOMY MATERIAL OUTPUT
TOTAL INPUT 5348 TOTAL OUTPUT 4411
Imports 475
Abiotic raw material 3443
Used:• minerals 898
• energy carriers 253
Unused:• non saleable
extraction 1996
• excavation 296
Waste disposal(excl. incineration) 2329
• controlled waste disposal 119
• landfill and mine dumping 2210
Emission to air 1005
• CO2 990
• NO2, SO2, CO
and others 15
Emission of water from material 639
Net Additions to Stock 938
Exports 228
Air 1080
Biotic raw materials (fresh weight) 225 Erosion 126
Dissipative use of products anddissipative losses 47
Emissions to water 37
Erosion 126

WRI: THE WEIGHT OF NATIONS
38
The goal of materials flow analysis is todevelop new thinking, new metrics,and new management tools, which will
facilitate the transition to more efficient andless environmentally harmful patterns ofmaterial use in industrialized and developingeconomies. The study findings and discus-sions with officials in the five study countrieslead us to propose future activities that couldenhance the usefulness of physical accountsand materials flow analysis in policy develop-ment and industrial decision-making.
Physical Accounts in DevelopingCountries
Published studies of material flows currentlyexist only for industrialized countries.Quantities and intensity of materials use arelikely to vary substantially in developingcountries, which employ different technolo-gies and are still building their infrastruc-ture. Greater understanding of material flowsin these countries could help to answer ques-tions critical to cost-effective and environ-mentally sound development policies. Whatand where are the key harmful flows? Howefficiently are materials used? What are thehidden flows associated with producingmaterials for export? These questions are
especially relevant in many developing countries because of their dependence onresource-intensive industries and the acceler-ating rates of resource use associated withhigh economic growth. OECD countries arecurrently developing some of the conceptsand methodologies of materials flow analysis,but implementation of new patterns of mate-rials use in highly industrialized countriescould be slowed by “lock in” to existing infrastructure and established consumerbehavior patterns. Faster application shouldbe possible in developing economies, whereopportunities to “leapfrog” Western tech-nologies exist.
Weighting Material Flows
This report takes a step toward linking mate-rial flows to potential environmental impactsby characterizing flows according to theirmedium of entry, or mode of dispersion, intothe environment. In the case of the U.S.dataset, we further characterize materialflows according to a more detailed set ofparameters, including physical and chemicalproperties of individual flows. However, thedevelopment of physical accounts for aneconomy provides the basis for far moredetailed analysis than we have attempted.
N E X T S T E P S
5
WRI: THE WEIGHT OF NATIONS
39
Physical accounts do not in themselves provide information on environmentalimpacts. But they do provide the means foranswering specific questions—if the accountscan be weighted appropriately. For example,if the individual flows in a set of physicalaccounts are weighted by relative toxicity,then assessments as to the relative toxicity of different sectoral activities could be calcu-lated. If weighted by price, then the financialattributes of material flows in the system ofnational accounts could be calculated. Ifweighted by ozone-depleting potential, theseflows would be relevant to understanding thecauses of ozone layer depletion. Indeed, auniverse of questions could be addressed ifappropriate weighting schemes were applied.A crucial next step in refining physicalaccounting systems will be the developmentof such weighting schemes in order todemonstrate that specific material cycles canbe linked to specific environmental impacts.
Improvement and Harmonization ofPhysical Accounting Methodology
This study made every effort to harmonizeaccounting methodologies used in the fivestudy countries. The OECD is in the processof establishing a forum which will serve asan information clearing-house for countriesinterested in developing physical accountsand learning from each other’s experience.However, further effort and continued collab-oration will be required if governments andbusiness are to adopt physical accounting asa practical management tool. Official statis-tics are still inadequate in many respects, as noted in section 2.5 of this report.Researchers in the field have more to do inestablishing physical accounting practicesand standardizing methods of data analysis,
in order to develop a system of national physical accounts comparable to the intern-ationally recognized System of NationalAccounts used in monetary accounting. Suchnational physical accounts will be increasinglynecessary in tracking material flows acrossnational borders and identifying the potentialenvironmental impacts of growing world trade.
Integration of Materials Flow Data inNational and Corporate Indicator Sets
Materials flow data have been used as thebasis for resource efficiency indicators in anumber of recent official reports, includingSustainable Development in the United States:an Experimental Set of Indicators (U.S. Inter-agency Working Group on SustainableDevelopment, December 1998), and Qualityof Life Counts: Indicators for a Strategy forSustainable Development for the UnitedKingdom (Department of the Environment,Transport and the Regions, United Kingdom,1999). The OECD is currently consultingexperts on how to expand its existing envi-ronmental indicator framework to make itmore reflective of the wider objectives of sustainable development.
Industries in many countries are alsodeveloping performance measures and indi-cators to track their progress toward environ-mental or sustainable development goals.The indicators presented in this report andthose developed in our previous report areintended to stimulate the widespread adop-tion of physical accounting methods, andappropriate indicators in government andbusiness operations. The hope is that theseactors will “institutionalize” materials flowaccounting and track eco-efficiency as part of good practice.
WRI: THE WEIGHT OF NATIONS
40
Materials Flow Analysis at theSector Level
Materials flow analysis is a powerful tool forunderstanding the role of economic sectors inresource use, waste generation, pollution, andlandscape alteration. This study has disaggre-gated national output flows by major economicsectors. A next step is to further disaggregatespecific material flows by sector, in order tounderstand patterns of resource consumption,efficiency of resource use, and generation ofspecific pollutants at the sector level. In Chap-ter 4, we presented the results of a study ofmass flows in the chemical sector in Austria(see p. 34). The World Resources Institute iscurrently undertaking a more detailed studyof input and output flows in the agricultureand forestry sectors of the United States.
At the global level, future studies couldquantify environmentally and socially rele-vant material inputs and outputs associatedwith the production of specific products. Asone example, analysis of the global agricul-ture sector could address questions that arefundamental to the long-term sustainabilityof food production systems: Where are someresource inputs high, relative to the economicor nutritional value of agricultural commodityoutputs? Does modern agriculture disruptthe natural temporal and spatial patterns ofnutrient cycling? Such an application of thetechniques of materials flow accounting toagriculture could help determine the long-term productivity constraints to sustainableglobal food production.
Materials Flow Analysis at Different Scales
To date, most analyses of material flows havefocused at the national level. Physical
accounts developed at the regional or locallevel would allow more detailed analysis offlow sources, arrival pathways, sinks, anddirectional movement through actual envi-ronments. Geographic Information Systems(GIS) and material flow analysis could becombined to produce a visual representationof specific material flow patterns known tobe adversely impacting the environment. As one example, analysis could focus on thesize and spatial distribution of flows gener-ated by mining and ore processing activities,which are major sources of hazardous flows.Studies at the scale of the administrative unitor of natural boundaries, such as watersheds,would allow decision-makers to monitorflows into and out of their area, to under-stand what is locally generated and what isimported from other regions. To help trans-late science into the policy and public arenas,researchers could identify the spatial sourcesand sinks of flows of environmental concernand develop visually powerful maps of mate-rial flows and environmental impacts.
Developing Scenarios of Material Flows
Scenario development is widely used in gov-ernment and business to compare plausiblefutures under different assumptions aboutresource availability and prices or to estimateenvironmental quality given higher or loweremissions of specific pollutants. Decision-makers could apply scenario techniques tocompare the economic and environmentalimplications of alternative future materialflow patterns at national or internationallevel. They might examine likely flows of spe-cific commodities under different assump-tions regarding economic growth rates, tech-nologies, and recycling rates. Or they mightcompare alternative substitutions among
WRI: THE WEIGHT OF NATIONS
41
materials that could, for example, achievegreater input efficiency (lower resource useper unit of economic output) or greater out-put efficiency (lower emissions to environ-ment per unit of economic output). Scenarioscould be used to improve industry’s under-standing of the environmental implicationsof choices regarding material use (for exam-ple, use of virgin versus recycled supplies).Scenarios could also help to influence policyreforms favoring material cycles that useresources efficiently and keep toxics out ofthe environment.
Conclusions
This report demonstrates that material out-flows to the environment are still a cause forconcern. Some toxic and hazardous flows
have been controlled but many others havenot. Numerous flows remain undocumentedand outside the purview of environmentalagencies. Fossil fuel combustion is the domi-nant activity of modern industrial economiesand is the single largest contributor to mate-rial outflows to the air and on land. Most ofthese flows are hazardous to human healthor the environment. Technological advancesand economic restructuring have contributedto significant decoupling between rates ofeconomic growth and material throughputbut they have not achieved any overall reduc-tion in resource use or waste volumes.Policies will therefore be needed to acceleratethe trend toward dematerialization and toencourage substitution of benign materialsfor those that are environmentally harmful.
WRI: THE WEIGHT OF NATIONS
42
1. A. Steurer, 1992. Stoffstrombilanz Östereich1988. Schriftenreihe Soziale Ökologie, Band 26.Institut für Interdisziplinäre Forschung undFortbildung der Universitäten Innsbruck(Vienna): Klagenfurt und Wien.
2. M. Fischer-Kowalski and H. Haberl, Metabolismand Colonisation. Modes of Production and thePhysical Exchange Between Societies andNature. Schriftenreihe Soziale Ökologie, Band26. Institut für Interdisziplinäre Forschung undFortbildung der Universitäten Innsbruck(Vienna): Klagenfurt und Wien, 1993.
3. S. Bringezu, 1993. “Towards Increasing Re-source Productivity: How to Measure the TotalMaterial Consumption of Regional or NationalEconomies” Fres. Env. Bull. 2: 437–442.
H. Schütz and S. Bringezu, 1993. “MajorMaterial Flows in Germany.” Fres. Env. Bull.2:443–448.
4. Japanese Environmental Agency, Quality of theEnvironment in Japan 1992 (Tokyo, 1992).
5. Robert A. Ayres and Leslie W. Ayres, 1998.Accounting for Resources, 1: Economy-wide applications of mass-balance principles to materialsand waste. (Cheltenham, UK and Northampton,Mass.: Edward Elgar).
6. D.G. Rogich et al., “Trends in Material Use:Implications for Sustainable Development.”Paper presented at the conference on Sustain-able Development: Energy and Mineral Resources in the Circum-Pacific Region and the Environmental Impact of their Utilization,Bangkok, March 9–12, 1992.
D.G. Rogich, “Technological Changes, NewMaterials, and their Impact on the Demand forMinerals.” Paper presented at the InternationalConvention on Marketing of Minerals,Bangalore, India, February 14–16, 1991.
7. I.K. Wernick et al., 1996. “Materialization andDematerialization: Measures and Trends.”Daedalus: The Liberation of the Environment125(3): 171–198.
8. EUROSTAT, 1997. Materials Flow Accounting:Experience of Statistical Offices in Europe.Directorate B: Economic Statistics andEconomic and Monetary Convergence(Luxembourg: European Commission).
9. Federal Statistical Office of Germany(Statistisches Bundesamt), 1995. IntegratedEnvironmental and Economic Accounting—Material and Energy Flow Accounts. Fachserie 19,Reihe 5. Wiesbaden.
10. EUROSTAT, 1999. Pilot Studies on NAMEAs forAir Emissions with a Comparison at EuropeanLevel. (Luxembourg: European Commission).
11. A. Adriaanse, S. Bringezu, A. Hammond, Y.Moriguchi, E. Rodenburg, D. Rogich, and H.Schütz, 1997. Resource Flows: The Material Basisof Industrial Economies. (Washington, DC: WorldResources Institute).
12. Water vapor from human and animal respira-tion has not been calculated for the UnitedStates.
13. Chemically toxic and biologically active materi-als that are hazardous in the environment maybe aggregated in the U.S. material flow data-base. Other study countries also compiled dataon toxic and hazardous material flows.However, no international comparisons havebeen made, nor do we present an indicator oftoxic flows. Meaningful comparisons are notpossible because of differing national defini-tions of “toxic” and “hazardous” materials.
14. Some hidden flows are captured indirectly bymonetary accounts, in that the costs of manag-ing them are included in GDP. Dredging,
N O T E S

WRI: THE WEIGHT OF NATIONS
43
highway construction, and landscape reclama-tion following mining are examples of activitiesthat involve economic transactions. Indeed,these flow management costs have formed thestarting point for some of our estimates of flowquantities. The point is that the total quantitiesof material involved cannot readily be deter-mined from an examination of national finan-cial accounts.
15. This methodology differs from that used in our1997 report, in which hidden flows associatedwith imported resources were included in thecalculation of total material requirement. Suchan approach would have led to double-countingamong countries linked by trade.
16. C.D. Keeling and T.P. Whorf, 1998. AtmosphericCO2 Concentrations (ppmv) Derived From In SituAir Samples Collected at Mauna Loa Observatory,Hawaii. (San Diego, California: Scripps Instituteof Oceanography); A. Neftel et al., 1994. HistoricalCO2 Record from the Siple Station Ice Core. (Bern,Switzerland: Physics Institute, University of Bern).Online at:http://cdiac.esd.ornl. gov/trends/co2/con-tents.htm
17. Peter M. Vitousek et al., 1997. “HumanAlteration of the Global Nitrogen Cycle: Causesand Consequences.” Issues in Ecology, No. 1:February.
18. An exception should be made for river sedimentthat is deposited on cultivated land downstreamduring floods, an important element in main-taining fertility in some parts of the world.
19. World Bank, 1999. World Development Indicators1999. (Washington D.C.: World Bank).
20. The United States has recently revised the manner in which GDP is calculated to includesoftware investment (Larry Moran, U.S. Bureau of Economic Affairs, private communication,March 24, 2000). U.S. Department of Commerce data show U.S. GDP rising by 93percent between 1975 and 1996 (constant 1996dollars). These new figures would substantiallyincrease the decoupling observed between U.S.economic growth and material throughput. Thisreport uses World Bank data, since its calcula-tion of GDP offers greater comparability withthe other study countries. U.S. Department of
Commerce data are available online at:http://www.bea.doc.gov/bea/dn/gdplev.htmAccessed March 23, 2000.
21. See, for example, J. Maag, C. Lassen, and E.Hansen, Substance Flow Analysis for Mercury(Copenhagen: Danish EPA, EnvironmentalProject no. 344, 1996); C. Lassen, E. Hansen, T.Kaas and J. Larsen, Aluminium-Substance FlowAnalysis and Loss Reduction Feasibility Study(Copenhagen: Danish EPA, EnvironmentalProject no. 484, 1999); L. Hoffmann, SubstanceFlow Analysis for Phthalates (Copenhagen:Danish EPA, Environmental Project no. 320);Central Bureau of Statistics, Department of theNatural Environment, Mineralen in de landbouw,1970–1990 (CBS publications C-67 / 1970–1990); E. van der Voet, J.B. Guinée and H.A.Udo de Haes, eds., Heavy Metals: a ProblemSolved? Methods and Models to Evaluate PolicyStrategies for Heavy Metals. (Dordrecht, Boston,London: Kluwer Academic Publishers, seriesEnvironment and Policy vol. 22, 2000); B.Bergbäck, S. Anderberg and U. Lohm, 1992,“Lead Load: Historical Pattern of Lead Use inSweden” Ambio 21:159–165; W. M. Stigliani,P.R. Jaffe, and S. Anderberg, 1993, “Heavymetal pollution in the Rhine Basin.”Environmental Science and Technology 27: 786–793; P. Brunner and T. Lahner, MaterialsAccounting as a Tool for Decision Making inEnvironmental Policy (MAc TEmPo) (ECProgramme Environment and Climate ENV4-CT96–0230, Final Report, 1998).
22. Though not a dissipative flow as defined here,the same principle applies to anthropogenic car-bon dioxide emissions, which are partially cap-tured and recycled by plant biomass and theoceans.
23. Because of limited data availability, road con-struction flows are not always adequately re-flected in this report.
24. H. Schandl and H. Zangerl-Weisz, 1997.Materialbilanz Chemie. Methodik sektoralerMaterialbilanzen. [A Material Balance for theChemical Industry. Methods for SectoralMaterial Flow Accounting]. (Vienna: IFF SocialEcology Papers No. 47).

WRI: THE WEIGHT OF NATIONS
44
The following tables present the indica-tors that have been used as the basis ofanalysis throughout this report. They
are drawn from the more detailed datasetspresented in the country annexes. It shouldbe noted that these indicators exclude theweight of water vapor from fossil fuel combustion and other industrial processes,and exclude the weight of water vapor and
carbon dioxide from human and animal res-piration. Information on these emissions canbe found in the country datasets. For the pur-poses of comparison, however, the indicatorsare presented here in two forms: inclusiveand exclusive of the weight of oxygen inemissions from fossil fuel combustion andother industrial processes.
A N N E X 1DATA SUMMARY: NATIONAL COMPARISONS
Indicators Including Weight of Oxygen
Domestic Processed Output (DPO) 100,818 1,074,725 1,406,548 281,261 6,773,843
Domestic Hidden Flows (DHF) 70,530 2,417,427 1,225,538 99,862 16,487,220
Total Domestic Output (TDO) 171,348 3,492,153 2,632,086 381,122 23,261,063
Net Additions to Stock (NAS) 92,718 937,623 1,219,305 134,918 2,077,523
DPO by Gateway3
Land 17,748 116,772 92,854 45,076 579,396
Air 82,964 954,495 1,311,982 235,509 5,918,616
Water 106 3,458 1,712 675 7,870
Uncertain n/a n/a n/a n/a 267,961
DPO by Sector4
Agriculture 13,367 52,344 56,357 65,118 231,605
Construction 5,798 33,312 37,120 6,874 109,982
Energy Supply 10,202 484,221 431,265 45,399 2,248,362
Industry530,068 53,899 400,553 57,350 1,814,886
Household 19,373 163,597 92,120 46,953 661,827
SUMMARY INDICATORS, 1996 ( thousand met r i c tons )
Austria1 Germany Japan Netherlands2 United States

WRI: THE WEIGHT OF NATIONS
45
Transport 18,739 207,332 285,359 61,088 1,707,201
Other 3,271 80,021 103,774 19,061 n/a
TDO by Sector4
Agriculture 13,367 177,916 63,712 65,868 4,453,484
Construction 55,027 329,140 1,224,600 105,986 3,725,604
Energy Supply 10,202 484,221 431,265 45,399 2,285,397
Industry551,370 2,049,925 431,256 57,350 10,377,687
Household 19,373 163,597 92,120 46,953 661,854
Transport 18,739 207,332 285,359 61,088 1,757,037
Other 3,271 80,021 103,774 19,061 n/a
..Indicators Excluding Weight of Oxygen
Domestic Processed Output (DPO) 41,910 386,293 496,254 110,482 2,667,736
Domestic Hidden Flows (DHF) 70,530 2,417,427 1,225,538 99,862 16,332,950
Total Domestic Output (TDO) 112,440 2,803,721 1,721,792 210,344 19,000,686
Net Additions to Stock (NAS) 92,718 937,623 1,219,305 134,918 2,077,523
DPO by Gateway3
Land 17,748 116,772 92,854 45,076 579,396
Air 24,056 266,063 401,688 64,731 1,812,509
Water 106 3,458 1,712 675 7,870
Uncertain n/a n/a n/a n/a 267,961
DPO by Sector4
Agriculture 9,466 44,754 30,643 44,643 231,605
Construction 5,365 26,206 25,414 3,006 109,982
Energy Supply 2,860 133,136 119,650 12,404 723,921
Industry5 10,993 35,301 171,294 18,122 652,964
Household 6,544 56,383 35,221 14,038 280,355
Transport 5,510 57,904 77,825 17,093 668,910
Other 1,172 32,608 36,206 5,864 n/a
TDO by Sector4
Agriculture 9,466 170,326 37,998 45,393 4,338,650
Construction 54,594 322,034 1,212,894 102,118 3,686,169
Energy Supply 2,860 133,136 119,650 12,404 732,157
Industry532,294 2,031,328 201,998 18,122 9,235,265
Household 6,544 56,383 35,221 14,038 289,790
Transport 5,510 57,904 77,825 17,093 718,654
Other 1,172 32,608 36,206 5,864 n/a
Notes:1 Austrian TDO data for agriculture do not include soil erosion or dredging waste flows, which were not estimated.
2 Dutch sector data do not sum to DPO and TDO due to use of data from different datasets; they differ by up to 10 percent.
3 Virtually all hidden flows go to land, so only DPO has been disaggregated by gateway; dissipative flows are embedded in flows of DPO to land, air, and water.
4 Energy flows have been attributed to utilities (energy supply) and other economic sectors based on location of emissions.
5 Industry sector data include the mining (including coal mining) and manufacturing sectors.
Numbers may not add due to rounding. n/a: not applicable.
Austria1 Germany Japan Netherlands2 United States

WRI: THE WEIGHT OF NATIONS
46
Indicators Including Weight of Oxygen
Domestic Processed Output (DPO) 12.51 13.14 11.18 19.61 25.14
Domestic Hidden Flows (DHF) 8.75 29.55 9.74 6.45 61.19
Total Domestic Output (TDO) 21.26 42.68 20.91 26.05 86.33
Net Additions to Stock (NAS) 11.50 11.46 9.69 8.31 7.71
DPO by Gateway3
Land 2.20 1.43 0.74 2.90 2.15
Air 10.29 11.67 10.42 16.65 21.97
Water 0.01 0.04 0.01 0.04 0.03
Uncertain n/a n/a n/a n/a 0.99
DPO by Sector4
Agriculture 1.66 0.64 0.45 4.20 0.86
Construction 0.72 0.41 0.29 0.44 0.41
Energy Supply 1.27 5.92 3.43 2.93 8.34
Industry53.73 0.66 3.18 3.70 6.74
Household 2.40 2.00 0.73 3.03 2.46
Transport 2.33 2.53 2.27 3.94 6.34
Other 0.41 0.98 0.82 1.23 n/a
TDO by Sector4
Agriculture 1.66 2.17 0.51 4.25 16.53
Construction 6.83 4.02 9.73 6.84 13.82
Energy Supply 1.27 5.92 3.43 2.93 8.48
Industry56.37 25.05 3.43 3.70 38.52
Household 2.40 2.00 0.73 3.03 2.46
Transport 2.33 2.53 2.27 3.94 6.52
Other 0.41 0.98 0.82 1.23 n/a
Indicators Excluding Weight of Oxygen
Domestic Processed Output (DPO) 5.20 4.72 3.94 7.53 9.90
Domestic Hidden Flows (DHF) 8.75 29.55 9.74 6.45 60.62
Total Domestic Output (TDO) 13.95 34.27 13.68 13.97 70.52
Net Additions to Stock (NAS) 11.50 11.46 9.69 8.31 7.71
DPO by Gateway3
Land 2.20 1.43 0.74 2.90 2.15
Air 2.98 3.25 3.19 4.57 6.73
Water 0.01 0.04 0.01 0.04 0.03
Uncertain n/a n/a n/a n/a 0.99
SUMMARY INDICATORS, 1996 (met r i c tons per cap i t a )
Austria1 Germany Japan Netherlands2 United States

WRI: THE WEIGHT OF NATIONS
47
DPO by Sector4
Agriculture 1.17 0.55 0.24 2.88 0.86
Construction 0.67 0.32 0.20 0.19 0.41
Energy Supply 0.35 1.63 0.95 0.80 2.69
Industry5 1.36 0.43 1.36 1.17 2.42
Household 0.81 0.69 0.28 0.91 1.04
Transport 0.68 0.71 0.62 1.10 2.48
Other 0.15 0.40 0.29 0.38 n/a
TDO by Sector4
Agriculture 1.17 2.08 0.30 2.93 16.10
Construction 6.77 3.94 9.64 6.59 13.68
Energy Supply 0.35 1.63 0.95 0.80 2.72
Industry54.01 24.83 1.60 1.17 34.28
Household 0.81 0.69 0.28 0.91 1.08
Transport 0.68 0.71 0.62 1.10 2.67
Other 0.15 0.40 0.29 0.38 n/a
Notes:1 Austrian TDO data for agriculture do not include soil erosion or dredging waste flows, which were not estimated.
2 Dutch sector data do not sum to DPO and TDO due to use of data from different datasets; they differ by up to 10 percent.
3 Virtually all hidden flows go to land, so only DPO has been disaggregated by gateway; dissipative flows are embedded in flows of DPO to land, air, and water.
4 Energy flows have been attributed to utilities (energy supply) and other economic sectors based on location of emissions.
5 Industry sector data include the mining (including coal mining) and manufacturing sectors.
Numbers may not add due to rounding.
N/a: not applicable.
Austria1 Germany Japan Netherlands2 United States
WRI: THE WEIGHT OF NATIONS
48
Input Flows
[Authors’ note: This section on input flows isincluded, because Austria was not one of theoriginal study countries in the 1997 report,which examined national inputs of material(Adriaanse et al., 1997).]
The direct material input (DMI) to theAustrian economy, encompassing bothdomestic extraction and imports, increasedfrom 136 million metric tons in 1975 to 176million metric tons in 1996. This 29 percentincrease was fueled mostly by a 24 percentrise in domestic extraction of minerals andby an increase in imports, which have morethan doubled since 1975. At the same time,domestic extraction of fossil fuels (mainlylignite) steadily decreased and biomass useremained more or less constant. (See FigureA1.) The DMI increase during this recentperiod was less dramatic than the 1960 to1975 period, when it was more than 50 per-cent. Domestic extraction of minerals andimported materials accounted for most of the
earlier increase. Austria’s period of rapidmaterial growth ended around the beginningof the 1980s.
Composition of Domestic Processed Output
In 1996, domestic processed output (DPO)amounted to 107 million metric tons in abso-lute terms and 13.3 metric tons on a per capitabasis. (See Figure A2.) From 1975 to 1996, do-mestic processed output per capita increasedby 10 percent. While Austria’s population grewby about 6 percent during the study period,DPO increased by 17 percent in absoluteterms. The most significant material flowswithin DPO in 1996 were CO2 emissionsfrom combustion of fossil fuels and industrialprocesses (almost 8 metric tons per capita),CO2 emissions from combustion of biomass(1.9 metric tons per capita), waste deposited incontrolled landfills (1.1 metric tons per capita),CO2 emissions from human and livestockrespiration (0.8 metric tons per capita)1, andorganic manure (0.7 metric tons per capita).
M A T E R I A L F L O W S : A U S T R I AChristof Amann, Marina Fischer-Kowalski, Walter Hüttler, Heinz Schandl, Helga Weisz
A N N E X 2COUNTRY REPORTS

WRI: THE WEIGHT OF NATIONS
49
0
5
10
15
20
1975 1980 1985 1990 1995
F I G U R E A 1 DIRECT MATERIAL INPUT (DMI) , AUSTRIA 1975–1996
Metr
ic T
on
s P
er
Cap
ita
Imports
Domestic Extraction(biomass)
Domestic Extraction(fossils)
Domestic Extraction(minerals)
0
2
4
6
8
10
12
14
16
1975 1980 1985 1990 1995
F I G U R E A 2 COMPOSITION OF DOMESTIC PROCESSED OUTPUT (DPO) ,AUSTRIA 1975–1996
Metr
ic T
on
s P
er
Cap
ita
CO2 (Combustion of Fossil Fuels and Industrial Processes)
CO2 (Combustion of Biomass)
CO2 (Human and Livestock Respiration)
Other Emissions to Air
Waste Deposited
Organic Manure
Other Materials Dispersed on Agricultural Fields
Other Dissipative Uses and Losses
Material Loads in Waste Water

WRI: THE WEIGHT OF NATIONS
50
Overall, Austria has a lower DPO than mostof the countries studied in this report (when CO2 from human and animal respira-tion is excluded. (See Note 1.) This is due primarily to a significantly lower level of CO2 emissions, a consequence of the struc-ture of Austria’s energy supply. Hydropowerproduces about 70 percent of electricity inAustria, and other renewable forms of energy(such as fuelwood) also play an importantrole. More than 20 percent of the nation’sprimary energy supply stems from these twosources. As a result, CO2 emissions fromcombustion are comparatively low withoutAustria resorting to nuclear power.Quantities of dispersed materials such asorganic manure are quite high, because ofthe importance of livestock in the agricul-tural sector.
Domestic Hidden Flows
Domestic hidden flows (DHF), includingoverburden and ancillary flows associatedwith the extraction of fossil fuels, ores, indus-trial minerals, and construction minerals, aswell as soil excavation, amounted to a total of71 million metric tons in 1996, or 8.8 metrictons per capita. (See Figure A3.) Hidden flowsare dominated by soil excavation (4.3 metrictons per capita), overburden from the extrac-tion of construction minerals (1.8 metric tonsper capita), and fossil fuels such as lignite(1.7 metric tons per capita). Mining plays asmall role in Austria compared to countriessuch as Germany. From 1975 to 1996,domestic hidden flows declined by about 25percent, mainly because of the sharpdecrease in lignite extraction. Furthermore,
1975 1980 1985 1990 1995
0
2
4
6
8
10
12
14
F I G U R E A 3 DOMESTIC HIDDEN FLOWS, AUSTRIA 1975–1996
Metr
ic T
on
s P
er
Cap
ita
Overburden/Ancillary Flows(Fossil Fuels, Mainly Lignite)
Overburden/Ancillary Flows(Ores)
Overburden/Ancillary Flows(Industrial Minerals)
Soil Excavation
Overburden/Ancillary Flows(Construction Minerals)

WRI: THE WEIGHT OF NATIONS
51
hidden flows associated with ores werehalved. However, hidden flows associatedwith construction activities increased signifi-cantly from 4.9 to 6.1 metric tons per capita.
Domestic Processed Output by Gateways
Domestic material outflows from economicprocessing (domestic processed output, orDPO) can enter the environment through theair, land, or water gateways. In 1996, morethan 83 percent of DPO consisted of emis-sions to air. Land disposal of waste materials,and materials dispersed on land, accountedfor only 17 percent of DPO. Outputs to waterwere quantitatively negligible. During thelast two decades, there has been a shift fromland outflows to air emissions. DPO to airconsists mainly of CO2, which is closely re-lated to the use of energy sources (fossil fuelsand biomass). In contrast to emissions of airpollutants such as SO2 or NOx, which werereduced significantly by regulatory policies,emissions of CO2 from fossil fuel combus-tion and industrial processes increased by 12percent between 1975 and 1996.
The decrease of DPO to land, by about 23percent from 1975 to 1996, seems to be aresult of intensified waste management policies implemented since the second halfof the 1980s. These policies aimed to empha-size waste incineration over landfill disposal,reduce packaging materials, and encouragerecycling. As a result, industry and commer-cial waste disposal on land decreased by onethird. Dissipative use of mineral fertilizersdeclined by about 20 percent, partly becauseof a special tax, while the use of pesticides(measured in metric tons of the entire product, not active ingredients) increased by50 percent.
DPO to water apparently declined by 73percent from 1975 to 1996, amounting tojust 0.1 percent of total DPO in 1996. Thisdecline was primarily due to a reduction oforganic carbon in wastewater emissions.Nitrogen (N) and phosphorus (P) dischargesalso show decreasing trends. During the lasttwo decades, the capacity of municipalsewage treatment has tripled and the techni-cal standards (N and P elimination) haveimproved significantly. At the same time,regulatory policies have forced particularly“dirty” industries like paper and pulp produc-tion to implement cleaner technologies andimprove wastewater treatment facilities,resulting in considerable decreases in dis-charges to water.
Net Additions to Stock and Material Flows
We believe that, in addition to buildings,infrastructure, and durable goods, humanbeings and livestock must be considered partof the material stocks of a society. Thesematerial stocks require material flows fortheir development, reproduction, and mainte-nance. Humans need food just as livestockneed fodder. They also need buildings, whichrequire energy for heating, and constructionmaterials for periodic renovation. Such mate-rial stocks have accumulated over long peri-ods of time, and now they amount to severalhundred metric tons for each inhabitant.Quantitatively, the most important of thesematerial stocks are buildings and such infra-structure as road networks, railroads, andpipelines. The mass of human beings andlivestock amounts to less than 0.1 percent ofthe total material stocks.
One surprising finding of this study is thatmaterial stocks in all five countries are still
WRI: THE WEIGHT OF NATIONS
52
increasing.2 In 1996, net additions to stock(NAS) amounted to 93 million metric tons(11.5 metric tons per capita) in Austria. Whilethe Austrian population increased by only 6percent over the past two decades, and live-stock by only 4 percent, the mass of build-ings and infrastructure increased by aboutone third. This shows that population growthis not the principal factor in increased mate-rial use. Other trends also point to the contin-uing growth of material stocks: between 1975and 1996, the length of the Austrian publicroad network increased by 10 percent, andthe number of buildings (as well as the floorspace available) increased by more than 40 percent.
From a systemic point of view, there existthe following relationships between materialstocks and flows. The input flow of materialsproduces stocks. If the input flow is largerthan the output flow, material accumulatesin stocks. Sooner or later stocks produce out-put flows such as demolition wastes thathave to be recycled or deposited. In addition,stocks constantly induce material flows foruse and maintenance. These flows comprise,for example, energy for heating buildings,and construction materials for maintainingroads. One can assume that, other thingsbeing equal, the larger the stocks, the largerthe flows required for maintenance. Thisapplies both to material flows and to costs,and it has consequences for material flowmanagement. The continuous growth ofinfrastructure requires an increasing share of resources—both physical and economic—for its maintenance and, as a consequence,narrows the range of choices with regard tomanaging future resource flows.
The following example illustrates thedynamics of stock growth for the Austrian
freeway network in physical and economicterms. Figure A4 shows maximum expendi-tures for new freeways in the mid-1970s.Within a decade, there followed a corre-sponding increase of the length of the free-way network. During the 1970–95 period,expenditures for maintenance of the networkincreased more or less steadily. By the1990s, the expenditures for maintenanceexceeded expenditures for new freeways. Thismeans that, of the limited resources availablefor freeway construction, an increasing por-tion is used for maintenance. This examplealso indicates that certain infrastructurestocks such as freeways seem to have reacheda level of saturation in Austria, although theycontinue to consume a large amount of materials and money for maintenance. Otherstocks, such as buildings, are still increasing,but they may follow the course of the freeway network.
Decoupling Economic Growth andMaterial Flows
Environmental problems are not a directresult of the monetary scale of an economy,but rather of its physical scale. This, in contrast to the growth critique of the 1970s,is the core idea of the “dematerialization”hypothesis, which dominates the sustainabil-ity debate. This hypothesis argues that adecoupling between GDP growth and mate-rial and energy flows is feasible and hasalready taken place in highly industrializedeconomies (Malenbaum, 1978; Jänicke et al.,1989; World Bank, 1992). EnvironmentalKuznets Curves (EKC: for an overview seeEcological Economics, Vol. 25/2, 1998) provide a framework for the analysis of thelinkage between the economy in monetaryterms (economic growth) and the associatedphysical flows (physical growth).

WRI: THE WEIGHT OF NATIONS
53
The EKC approach first was applied to therelationship between income and toxic emis-sions (Selden and Song, 1994) and later toaggregate resource indicators (de Bruyn andOpschoor, 1997). Here, for the first time, wetest the “dematerialization” hypothesis usingaggregate output data. We analyze the rela-tionship between GDP and DPO in an EKCframework.
As Figure A5 illustrates, there is a fairly ran-dom relationship between overall DPO andGDP. Overall DPO does not increase consis-tently with an increase in GDP, nor does it decrease, as the decoupling hypothesiswould suggest. Upon closer inspection, itbecomes obvious that this seemingly
“random” relationship is due to a non-rela-tionship of GDP and CO2 emissions fromfossil fuel combustion and industrialprocesses, whereas DPO to water and locallyhazardous emissions to air are clearly nega-tively related to GDP growth. These resultsmirror the successful implementation of end-of-pipe technologies in Austria. A simi-larly strong decoupling effect can beobserved for DPO to land (see Figure A6),which is the result of policy strategies thatfostered a structural change from depositionof wastes to waste incineration and recycling.This confirms previous studies claiming that decoupling should only be expected for outputs that can be reduced by end-of-pipetechnologies.
1970 1975 1980 1985 1990 1995
0
20
40
60
80
100
0
2
4
6
8
10
F I G U R E A 4 ANNUAL GROWTH OF THE AUSTRIAN FREEWAY NETWORK ANDCORRESPONDING EXPENDITURES, AUSTRIA 1970–1995
Bil
lio
n A
ust
rian
Sch
illi
ng
s (1
98
3 P
rice
s)
Kil
om
ete
rs
Expenditures for New Freeways (Billion 1983 ATS)
Expenditures for Freeway(Billion 1983 ATS)
Annual Increase of AustrianFreeway Network (km)
Trend (annual increase ofAustrian freeway network[km]), modeled as a second order polygon

WRI: THE WEIGHT OF NATIONS
54
10
11
12
13
14
15
14 16 18 20 22 24 6
7
8
9
10
14 16 18 20 22 24
F I G U R E A 5 ECONOMIC PROSPERITY (GDP) IN RELATION TO OVERALL DPO AND CO2 EMISSIONS FROM COMBUSTION OF FOSSIL FUELS
AND INDUSTRIAL PROCESSES, AUSTRIA 1975–1996
GDP ($1,000 Per Capita) GDP ($1,000 Per Capita)
0.2
0.3
0.4
0.5
14 16 18 20 22 24
2
3
4
5
14 16 18 20 22 24
F I G U R E A 6 ECONOMIC PROSPERITY (GDP) IN RELATION TO DPO TO AIR(EXCLUDING CO2 ) AND DPO TO LAND, AUSTRIA 1975–1996
DP
O (
Metr
ic T
on
s P
er
Cap
ita)
CO
2E
mis
sio
ns
(Metr
ic T
on
s P
er
Cap
ita)
DP
O t
o L
and
(M
etr
ic T
on
s P
er
Cap
ita)
DP
O t
o A
ir (
Exc
l. C
O2
)
(Metr
ic T
on
s P
er
Cap
ita)
GDP ($1,000 Per Capita) GDP ($1,000 Per Capita)

WRI: THE WEIGHT OF NATIONS
55
Considering input and output flows of mate-rials from an overall perspective, we can dif-ferentiate among three types of materialflows. Each has a different logic with regardto decoupling and responds to different envi-ronmental policies:
1. Outputs of toxic emissions. These can bereduced by end-of-pipe technologies thatshift the destination of output materialsfrom one gateway to another. This was thefirst group of materials to be addressed byAustrian environmental policy. The policyhas already led to the decoupling of DPO(to water, land, and air with the majorexception of CO2) from GDP growth.
2. CO2 emissions from fossil fuels. These emis-sions are also strongly related to the inputside, but end-of-pipe technologies have notyet been applied to them. CO2 is not toxic,but the sheer volume of emissions is alter-ing the earth’s climate. Decoupling CO2output from GDP growth can probably be achieved only by reducing inputs.Environmental policies have recognizedthis problem, but have yet to implementsuccessful strategies. Since decoupling has not taken place, the EKC shows no correlation.
3. Bulk Input materials. These are construc-tion and other types of materials that areused in large quantities and are trans-formed into outputs after a long time lag.Although usually not toxic, they createenvironmental pressures because of theirhuge quantities, as well as positive feed-back loops that may constrain future devel-opment. The goal for these materials mustbe resource management, but the govern-ment’s environmental policy has not yetrecognized this problem.
Political Responses to Material Flows
Over the past 30 years, Austrian environmen-tal policy has sequentially addressed prob-lems relating to specific environmentalmedia, first concentrating on the quality of surface water, then on cleaner air andreduced emissions, and finally on land-basedwaste deposition (Amann and Fischer-Kowalski, forthcoming). Thus, the smallestmaterial flows, namely material loads inwastewater, caused the first politicalresponse. It is surprising that the largest out-flows did not become a policy focus until the1990s, and even now the reduction of CO2seems to be beyond the capability of environ-mental policy.
The first environmental problem Austriatried to solve—even before the governmentestablished an environmental ministry—wasthe cleanup of lakes and rivers. Materialloads in wastewater were (and still are) negli-gible compared to total DPO, amounting to0.39 million metric tons in 1975 (0.05 metrictons per capita). Nevertheless the obviousimpacts of water pollution negatively affectedtourism, one of the most important economicsectors in Austria. Large investments in sew-erage systems, wastewater treatment plants,and circular wastewater collection systemsaround lakes led to a substantial reduction in discharges of toxic and eutrophying sub-stances into surface water. This policy wasvery expensive, but it has significantlyimproved the water quality of Austria’s lakesand rivers. In 1996, DPO to water amountedto no more than 0.1 million metric tons (0.01metric tons per capita).
In its second phase, Austrian environmen-tal policy during the 1980s focused on airpollution. Acidifying substances like SO2

WRI: THE WEIGHT OF NATIONS
56
were recognized as one of the main causes offorest dieback (Waldsterben). Forest ownersfeared for their trees, and municipal officialsworried about both the effects of acid rain onhistoric buildings and major floods, whichwere expected to follow forest dieback.Through extensive regulations, Austrian policy-makers have made significant stridesin reducing air pollutants. For instance, SO2emissions have been cut by more than 80percent since the early 1980s.
For a long time, officials paid less atten-tion to soil pollution and the problem ofwaste deposition. Dispersed materials suchas sewage sludge, pesticides, and fertilizers,as well as leaking contaminated sites, threat-ened both soil quality and groundwater, themain source of drinking water in Austria. In1990, the government enacted the WasteManagement Act. The Act aimed to preventwaste generation and enforce recycling.Although the amount of waste generated inAustria is still increasing, waste depositionhas generally decreased since the second halfof the 1980s because of recycling activitiesand increased waste incineration.Incineration, however, has contributed to airemissions. In addition to regulatory policies,the government has used economic instru-ments effectively. For example, a tax on fer-tilizers led to a decrease in their use that continued even after the tax was abolished.
In the early 1990s, Austria emerged as apioneer in international climate change policy. It accepted the “Toronto target” thatcalled for a 20 percent reduction of CO2 andother greenhouse gas emissions by 2005(based on 1988 emissions). In 1998, theKyoto Protocol set another goal: a 13 percentreduction by 2012, based on 1990 emissions.However, apart from some government
measures to promote the use of renewableenergy carriers and energy efficiency inbuildings, climate change policy has beenlargely symbolic (Steurer, 1999). There is noindication that Austria will achieve its goals.Emissions of CO2 have increased by 12 per-cent since 1988, with emissions continuingto trend upward in recent years.
How can material flow accounting help usto understand this sequence of environmen-tal policy, and what are the advantages ofsuch an approach in the future? The politicalsystem did not directly respond to the evi-dence of material flows in the first two phases, but to the likely consequences ofongoing environmental changes. Therefore itis necessary to take more factors into consid-eration. The effects of material flows are aresult of their size, as well as the dimensionand the quality of the receiving environment.(See Table A1.) For example, material loads in wastewater are small in quantitative terms,but lakes and rivers are very sensitive becauseof their physical and ecological characteris-tics. Other factors include the visibility ofenvironmental changes and their effects onsociety. If powerful economic interests areadversely affected, the probability of a policyresponse increases. Pressure from the public,the media, or international communities mayalso lead to action.
In its first two phases, Austria’s environ-mental policy focused on individual sub-stances that could be regulated by end-of-pipe technology. The reduction of waste generation or emissions of CO2 requires theapplication of more sophisticated instru-ments and a stronger degree of policy inte-gration. Industrial economies increasinglywill be faced with new types of environ-mental problems characterized by low

WRI: THE WEIGHT OF NATIONS
57
visibility and long delays between socioeco-nomic activities and corresponding environ-mental impacts. Material flow analysis, as an
overall information tool on environmentalpressures, is the most promising instrumentfor future preventive environmental policies.
Gateway water air/domestic land air/global atmosphere
Material flows loads in waste water air pollutants waste and dispersed greenhouse gases
materials (CO2 etc.)
Size of material flow very small small medium large
Affected surface water forests, historic land (soil), global atmosphere,
environmental buildings, groundwater, climate
medium/issue human health human health
Scale of small medium medium large
environmental
medium/issue
Direct visibility of high medium low very low
effects
Economically tourism, forest owners, municipalities, waste agriculture, forestry,
interested construction industry municipalities, management plants tourism
environmental actors end-of-pipe technology
industry
Environmental high medium medium low
expenditure
Political responses regulatory, regulatory, regulatory, mainly symbolic
end-of-pipe end-of-pipe (economic, societal)
TABLE A1 POLITICAL RESPONSES TO MATERIAL FLOWS IN AUSTRIA
Environmental Policy Phase
I II III IV
1970s 1980s 1990s

WRI: THE WEIGHT OF NATIONS
58
Material Output Flows: Austria, 1975-1996All units 1,000 metric tons unless otherwise stated
1975 1976 1977 1978 1979 1980 1981 1982 1983 1984 1985
Summary DataPopulation (thousand capita) 7,579 7,566 7,568 7,562 7,549 7,549 7,555 7,574 7,552 7,553 7,558GDP 1,441 1,507 1,575 1,576 1,651 1,699 1,694 1,712 1,746 1,770 1,845
(constant 1996 billion Austrian schillings)Direct Material Input (DMI) 136,498 142,324 145,439 144,452 152,036 157,335 153,787 151,553 145,380 152,789 152,316Domestic Extraction 109,619 111,622 114,801 112,384 115,946 120,510 117,939 117,306 112,473 115,132 113,078Imports 26,879 30,701 30,638 32,068 36,090 36,825 35,848 34,248 32,906 37,657 39,238Exports 10,428 11,956 11,730 12,819 14,564 15,085 15,317 15,299 16,505 18,198 18,279
Summary Indicators (as presented in main report)DPO (including oxygen) 85,710 91,586 89,694 92,352 95,439 98,373 94,224 92,828 91,415 94,411 95,594DPO (excluding oxygen) 42,504 44,612 44,333 45,115 46,034 47,601 46,113 46,041 45,093 45,958 45,978Domestic hidden flows 94,492 92,832 91,696 88,937 87,176 89,416 91,310 94,554 92,476 91,601 92,557TDO (including oxygen) 180,202 184,417 181,390 181,289 182,615 187,789 185,534 187,383 183,891 186,012 188,151TDO (excluding oxygen) 136,995 137,444 136,029 134,052 133,210 137,017 137,423 140,595 137,569 137,559 138,535Net Additions to Stock 73,411 75,199 79,323 76,234 81,058 84,207 81,787 79,665 73,087 77,497 76,748
Summary Indicators (metric tons per capita)DPO (including oxygen) 11.31 12.10 11.85 12.21 12.64 13.03 12.47 12.26 12.10 12.50 12.65DPO (excluding oxygen) 5.61 5.90 5.86 5.97 6.10 6.31 6.10 6.08 5.97 6.08 6.08Domestic hidden flows 12.47 12.27 12.12 11.76 11.55 11.84 12.09 12.48 12.25 12.13 12.25TDO (including oxygen) 23.78 24.37 23.97 23.97 24.19 24.88 24.56 24.74 24.35 24.63 24.89TDO (excluding oxygen) 18.08 18.17 17.97 17.73 17.65 18.15 18.19 18.56 18.22 18.21 18.33Net Additions to Stock 9.69 9.94 10.48 10.08 10.74 11.15 10.83 10.52 9.68 10.26 10.15
Summary Indicators including additional outputs (not presented in main report)DPO 92,195 98,107 96,260 99,059 102,089 104,891 100,867 99,484 98,137 101,195 102,335
(including carbon dioxide from respiration, excluding water vapor from all combustion & respiration)TDO 186,686 190,938 187,956 187,996 189,265 194,307 192,177 194,038 190,612 192,796 194,891
(including carbon dioxide from respiration, excluding water vapor from all combustion & respiration)
Domestic Extraction 109,619 111,622 114,801 112,384 115,946 120,510 117,939 117,306 112,473 115,132 113,078Fossils 7,220 6,769 6,726 6,694 6,218 5,782 5,487 5,590 5,229 5,070 5,109
Lignite & Hard Coal 3,397 3,215 3,127 3,076 2,741 2,865 3,061 3,297 3,041 2,901 3,081Crude Oil 2,037 1,931 1,787 1,790 1,726 1,475 1,338 1,290 1,269 1,205 1,147Natural Gas 1,786 1,624 1,812 1,828 1,751 1,441 1,088 1,003 919 963 881
Minerals 66,702 69,158 72,064 70,134 73,312 76,416 75,153 71,914 70,942 71,895 69,233Ores & Industrial Minerals (incl. salt) 7,264 7,172 6,763 6,126 6,929 7,506 7,165 7,342 7,550 8,010 7,585Construction Minerals (incl. clay) 59,437 61,986 65,301 64,008 66,383 68,910 67,988 64,572 63,392 63,885 61,649
Biomass 35,697 35,696 36,011 35,556 36,416 38,313 37,300 39,802 36,303 38,166 38,735Agricultural Products 27,739 26,208 27,280 26,931 26,202 28,097 27,482 30,752 26,955 28,495 29,410Wood 7,012 8,590 7,821 7,705 9,315 9,304 8,889 8,102 8,532 8,846 8,492Grazing 946 898 909 920 899 912 929 947 816 825 833
Gateway IndicatorsDPO to Air 68,876 74,131 71,995 74,755 77,716 79,531 75,868 73,974 73,285 76,309 77,784
CO2 from fossil fuel combustion & industrial processes 57,400 62,000 59,200 61,200 63,600 64,730 60,710 58,250 57,410 59,300 60,240
CO2 from biomass combustion 1,902 2,435 2,968 3,500 4,033 4,710 5,020 5,700 5,830 6,760 7,370CO2 from respiration 6,484 6,521 6,566 6,707 6,650 6,517 6,643 6,656 6,721 6,784 6,740
(included in Austrian country report, not included in main report)SO2 314 333 352 372 391 400 349 329 246 218 196NOX 204 209 215 220 225 234 226 224 223 222 225NMVOC 511 513 514 516 518 519 519 517 520 527 526CH4 191 190 189 187 186 178 177 178 181 185 185CO 1,589 1,600 1,612 1,623 1,635 1,691 1,625 1,564 1,529 1,583 1,530N2O 1 2 2 2 2 2 2 2 2 2 2NH3 84 84 84 83 83 80 80 81 82 83 83Dust 72 73 75 76 77 79 76 73 70 64 58Bunker Fuel EmissionsCO2 from bunkers 123 171 219 268 316 390 440 400 470 580 630

WRI: THE WEIGHT OF NATIONS
59
Material Output Flows: Austria, 1975-1996All units 1,000 metric tons unless otherwise stated
1986 1987 1988 1989 1990 1991 1992 1993 1994 1995 1996
Summary Data7,566 7,576 7,596 7,624 7,718 7,796 7,914 7,991 8,030 8,047 8,059 Population (thousand capita)1,888 1,920 1,981 2,065 2,159 2,233 2,263 2,274 2,328 2,368 2,415 GDP
(constant 1996 billion Austrian schillings)151,551 152,704 155,676 161,190 164,838 163,372 166,081 166,259 176,292 174,299 176,084 Direct Material Input (DMI)112,641 113,024 114,702 119,360 121,125 116,960 119,352 120,567 127,075 121,705 120,710 Domestic Extraction
38,910 39,680 40,974 41,829 43,713 46,411 46,730 45,692 49,217 52,594 55,375 Imports18,050 18,718 20,038 20,980 22,259 21,808 22,222 22,638 25,283 28,107 28,742 Exports
Summary Indicators (as presented in main report)98,693 99,564 96,863 96,297 100,189 102,499 95,130 94,564 95,963 98,891 100,818 DPO (including oxygen)46,161 46,029 44,949 43,859 44,676 44,158 40,991 41,022 40,944 41,858 41,910 DPO (excluding oxygen)91,303 89,383 79,584 80,561 85,734 81,215 76,823 75,536 73,981 73,565 70,530 Domestic hidden flows
189,996 188,947 176,447 176,858 185,923 183,713 171,953 170,101 169,944 172,456 171,348 TDO (including oxygen)137,464 135,412 124,533 124,421 130,410 125,372 117,814 116,558 114,925 115,423 112,440 TDO (excluding oxygen)
76,255 76,864 79,801 84,789 85,821 85,132 91,209 90,605 98,035 91,855 92,718 Net Additions to Stock
Summary Indicators (metric tons per capita)13.04 13.14 12.75 12.63 12.98 13.15 12.02 11.83 11.95 12.29 12.51 DPO (including oxygen)
6.10 6.08 5.92 5.75 5.79 5.66 5.18 5.13 5.10 5.20 5.20 DPO (excluding oxygen)12.07 11.80 10.48 10.57 11.11 10.42 9.71 9.45 9.21 9.14 8.75 Domestic hidden flows25.11 24.94 23.23 23.20 24.09 23.57 21.73 21.29 21.16 21.43 21.26 TDO (including oxygen)18.17 17.87 16.39 16.32 16.90 16.08 14.89 14.59 14.31 14.34 13.95 TDO (excluding oxygen)10.08 10.15 10.51 11.12 11.12 10.92 11.53 11.34 12.21 11.42 11.50 Net Additions to Stock
Summary Indicators including additional outputs (not presented in main report)105,377 106,240 103,440 102,910 106,824 109,117 101,642 101,305 102,680 105,617 107,448 DPO
(including carbon dioxide from respiration, excluding water vapor from all combustion & respiration)196,680 195,623 183,025 183,471 192,558 190,331 178,465 176,841 176,661 179,182 177,978 TDO
(including carbon dioxide from respiration, excluding water vapor from all combustion & respiration)
112,641 113,024 114,702 119,360 121,125 116,960 119,352 120,567 127,075 121,705 120,710 Domestic Extraction4,927 4,732 4,262 4,226 4,572 4,368 4,022 3,974 3,498 3,445 3,230 Fossils2,969 2,786 2,129 2,066 2,448 2,081 1,751 1,692 1,372 1,289 1,108 Lignite & Hard Coal1,117 1,063 1,175 1,158 1,149 1,280 1,180 1,155 1,100 1,035 992 Crude Oil
842 884 958 1,002 975 1,007 1,091 1,127 1,026 1,122 1,130 Natural Gas70,612 71,324 72,298 76,711 78,589 79,011 84,870 84,266 89,282 83,365 82,669 Minerals
6,932 6,585 6,039 6,311 6,061 5,305 4,981 4,233 4,511 5,204 4,870 Ores & Industrial Minerals (incl. salt)63,680 64,739 66,259 70,401 72,529 73,707 79,889 80,033 84,771 78,162 77,799 Construction Minerals (incl. clay)37,102 36,967 38,142 38,423 37,963 33,581 30,460 32,327 34,295 34,894 34,811 Biomass27,369 27,504 27,943 27,467 25,676 24,409 20,738 22,601 22,983 23,934 22,969 Agricultural Products
8,861 8,590 9,333 10,097 11,477 8,395 8,947 8,954 10,490 10,085 10,965 Wood872 874 866 859 810 778 775 772 822 875 876 Grazing
Gateway Indicators81,819 83,115 80,681 81,331 85,369 89,179 83,155 82,509 84,486 87,126 89,594 DPO to Air
CO2 from fossil fuel combustion59,360 60,640 57,250 57,970 62,040 66,440 60,530 59,530 61,070 62,430 64,030 & industrial processes12,260 12,350 13,320 13,140 13,380 12,710 12,770 12,980 13,410 14,690 15,540 CO2 from biomass combustion
6,685 6,676 6,577 6,614 6,635 6,618 6,512 6,741 6,717 6,726 6,630 CO2 from respiration(included in Austrian country report, not included in main report)
177 160 115 102 91 83 64 60 56 52 52 SO2
221 217 209 202 200 205 196 183 191 178 171 NOX
539 542 545 534 516 488 462 450 439 435 426 NMVOC187 184 184 176 171 161 160 164 167 168 167 CH4
1,624 1,577 1,528 1,462 1,288 1,269 1,188 1,161 1,133 1,016 1,024 CO3 3 3 3 3 4 4 4 4 4 4 N2O
83 82 81 79 76 73 75 76 78 78 77 NH3
51 45 40 39 39 38 35 32 30 27 24 DustBunker Fuel Emissions
630 640 830 1,010 930 1,090 1,160 1,130 1,190 1,320 1,450 CO2 from bunkers

WRI: THE WEIGHT OF NATIONS
60
Material Output Flows: Austria, 1975-1996All units 1,000 metric tons unless otherwise stated
1975 1976 1977 1978 1979 1980 1981 1982 1983 1984 1985
DPO to Land 22,932 23,591 23,881 23,922 23,992 24,979 24,642 25,177 24,544 24,602 24,292Waste disposal to controlled landfills 12,493 12,645 12,797 12,949 13,101 13,256 13,411 13,566 13,143 12,775 12,422Dissipative losses from roads & tyres 219 234 246 268 281 281 265 273 272 248 261Dissipative uses (agriculture) 9,373 9,864 9,988 9,853 9,755 10,442 9,993 10,324 10,398 10,730 10,600
Mineral fertilizer (total weight) 1,134 1,196 1,468 1,305 1,321 1,487 1,433 1,268 1,151 1,143 1,312Organic manure 7,398 7,825 7,651 7,688 7,566 8,079 7,669 8,157 8,331 8,678 8,369
(excrements, straw, ...)Pesticides (total weight) 17 17 19 18 20 18 19 18 23 25 27Other 825 826 850 841 847 858 872 882 893 884 892
(sewage sludge, seeds, compost, ...)Dissipative uses 846 848 850 852 854 1,000 972 1,014 732 849 1,009
(thawing & grit materials)
DPO to Water 387 385 383 382 381 380 357 333 308 283 259Organic carbon in waste water 314 312 311 310 309 309 286 263 240 217 194Nitrogen in waste water 35 35 35 36 36 36 36 36 35 35 34Phosphorus in waste water 7 7 7 7 7 7 7 7 7 7 7AOX in waste water 30 30 30 29 29 28 28 27 26 25 24
Additional Inputs 80,778 86,827 84,691 88,130 91,030 90,936 88,102 86,211 85,969 89,482 90,807(not presented in main report)Oxygen in combustion 62,249 67,939 65,940 68,614 71,731 72,300 68,738 66,950 66,703 69,844 71,604Oxygen in respiration 5,671 5,703 5,740 5,864 5,815 5,696 5,804 5,816 5,876 5,934 5,896Water 12,452 12,718 12,534 13,167 12,953 12,436 13,063 12,947 12,883 13,192 12,860Nitrogen 406 467 477 485 531 504 498 498 507 512 446
(for the production of ammonia)
Additional Outputs 23,182 25,564 24,650 25,588 26,738 26,063 25,200 24,708 25,029 26,437 27,180(not presented in main report)Water vapor from combustion
of fossil fuels & biomass 23,182 25,564 24,650 25,588 26,738 26,063 25,200 24,708 25,029 26,437 27,180Water vapor from respiration 18,060 18,325 18,166 18,881 18,617 18,025 18,718 18,608 18,591 18,944 18,582
Domestic Hidden Flows 94,492 92,832 91,696 88,937 87,176 89,416 91,310 94,554 92,476 91,601 92,557Excavated soil 25,312 25,732 26,154 26,577 27,002 27,428 27,856 28,286 28,717 29,150 29,584Overburden/Ancillary flows 42,641 40,342 39,212 38,589 34,486 35,791 38,039 40,857 37,734 36,005 38,131
(fossil fuels)Overburden/Ancillary flows 14,396 14,052 13,020 10,815 12,342 12,370 11,715 12,641 13,394 13,717 12,617
(ores & industrial minerals)Overburden/Ancillary flows 12,142 12,705 13,311 12,955 13,346 13,826 13,700 12,770 12,630 12,729 12,224
(construction minerals)

WRI: THE WEIGHT OF NATIONS
61
Material Output Flows: Austria, 1975-1996All units 1,000 metric tons unless otherwise stated
1986 1987 1988 1989 1990 1991 1992 1993 1994 1995 1996
23,329 22,926 22,588 21,426 21,318 19,818 18,369 18,682 18,082 18,382 17,748 DPO to Land12,082 11,760 11,343 10,939 10,396 9,919 9,441 8,958 8,739 8,612 8,582 Waste disposal to controlled landfills
270 250 286 297 321 365 384 400 452 431 456 Dissipative losses from roads & tyres10,044 10,079 10,194 9,876 9,942 8,734 7,909 8,003 8,146 8,161 7,632 Dissipative uses (agriculture)
1,030 1,281 1,056 1,088 1,067 994 919 995 860 938 915 Mineral fertilizer (total weight)8,086 7,908 8,249 7,918 8,019 6,872 6,103 6,105 6,374 6,281 5,805 Organic manure
(excrements, straw, ...)22 25 25 25 25 26 22 20 24 49 27 Pesticides (total weight)
905 865 863 845 831 842 866 884 887 894 884 Other (sewage sludge, seeds, compost, ...)
933 837 765 315 659 799 635 1,320 746 1,177 1,078 Dissipative uses (thawing & grit materials)
229 200 171 153 136 120 118 114 112 109 106 DPO to Water166 137 109 95 80 65 63 62 61 60 58 Organic carbon in waste water
34 33 34 32 32 31 33 31 30 29 29 Nitrogen in waste water7 7 7 6 6 6 6 5 5 5 5 Phosphorus in waste water
23 22 22 20 19 18 17 16 15 14 14 AOX in waste water
93,938 95,728 93,144 95,661 99,709 103,972 98,488 99,574 101,454 104,926 108,141 Additional Inputs(not presented in main report)
75,057 76,625 74,465 77,031 81,240 85,707 80,414 80,656 82,648 85,842 89,315 Oxygen in combustion5,847 5,837 5,752 5,781 5,804 5,785 5,690 5,897 5,877 5,885 5,801 Oxygen in respiration
12,659 12,854 12,509 12,416 12,277 12,079 12,020 12,625 12,555 12,800 12,616 Water375 411 419 432 389 401 364 396 375 399 409 Nitrogen
(for the production of ammonia)
27,458 28,081 27,418 30,121 31,697 33,546 31,862 32,811 33,349 34,982 36,888 Additional Outputs(not presented in main report)Water vapor from combustion
27,458 28,081 27,418 30,121 31,697 33,546 31,862 32,811 33,349 34,982 36,888 of fossil fuels & biomass18,349 18,530 18,122 18,050 17,947 17,740 17,635 18,474 18,399 18,665 18,429 Water vapor from respiration
91,303 89,383 79,584 80,561 85,734 81,215 76,823 75,536 73,981 73,565 70,530 Domestic Hidden Flows30,020 30,458 30,897 31,338 31,780 32,224 32,669 33,116 33,565 34,015 34,467 Excavated soil36,751 34,501 26,641 25,866 30,483 26,128 22,075 21,345 17,399 16,372 14,181 Overburden/Ancillary flows
(fossil fuels)11,970 11,681 9,120 9,556 9,149 8,301 6,551 5,665 6,590 8,229 7,121 Overburden/Ancillary flows
(ores & industrial minerals)12,562 12,744 12,927 13,801 14,322 14,563 15,528 15,410 16,427 14,949 14,762 Overburden/Ancillary flows
(construction minerals)

WRI: THE WEIGHT OF NATIONS
62
Data Sources and Methodology:Technical Notes
General Notes on Quality of Data
Austrian official statistics do not providecomprehensive data on material outflowsfrom economic activities and the quality ofdata varies widely, depending on the materialcategory and the period of time. Data on hidden flows are not available at all. Exceptfor some specific flows reported in officialstatistics, most data in this report derivefrom our own calculations. Nevertheless, thedataset provides a good overview for materialtrends between 1975 and 1996.
Domestic Processed Output to Air
Official data on emissions to air (includinginternational bunkers according to Inter-governmental Panel on Climate Change[IPCC] format) are available for CO2, SO2,NOx, NMVOC, CH4, CO, N2O, and NH3 from1980 to 1996 in time series (Ritter andAhamer, 1999; Ritter and Raberger, 1999).CH4 from agriculture (excluding enteric fer-mentation) and forestry, waste treatment and landfills, and N2O from agriculture andforestry were subtracted to avoid double-counting. Time series from 1975 to 1979were completed using trend estimations.
To balance inputs and outputs, we alsoestimated emissions of water vapor and CO2from respiration. Water vapor emissionsfrom water and H-content in energy carrierswere calculated using data from energy sta-tistics (OESTAT) and factors according toSchütz (1999, personal communication). CO2 and water vapor emissions from humanand livestock metabolism were calculatedusing factors from Moll (1996) and Schütz(1999, personal communication).
Domestic Processed Output to Land
Reliable official data on the total amount ofwaste produced by households and similarinstitutions are available for 1989 to 1996(BMUJF, 1992, 1995, 1998). For 1972, 1979,1983, and 1987, the Austrian FederalInstitute on Public Health conducted surveyson waste from households (OEBIG, 1974,1981, 1985, 1989). We calculated a completetime series by using several assumptions andfilling remaining data gaps by interpolation.A 1980s survey by the Austrian FederalChamber of Commerce (Bundeskammer fürgewerbliche Wirtschaft, 1991) was a majorsource for our estimates of the percentage ofdeposited waste that industry and commerceproduces. The agricultural statistics (OES-TAT) represent the most important sourcefor dissipative flows (such as mineral fertil-izer and organic manure).
Domestic Processed Output to Water
DPO to water includes emissions of organiccarbon, nitrogen, phosphorus, and AOX from municipal sewage treatment plants,direct (dispersed) emissions from house-holds, and emissions from industry. Forthese three categories, consistent data areavailable for 1991 and 1995 (BMLF, 1990 ff.;BMLF Wasserwirtschaftskataster, 1985, 1991,1995, 1999). We calculated data for the otheryears by using statistics on households con-nected to municipal wastewater collectionsystems, as well as information on the capac-ity and the efficiency of the sewage treatment plants. Data for direct emissions from house-holds were calculated and cross-checked with the results of a specific survey aboutnutrient flows in the Danube basin (Kroiss et al., 1998).
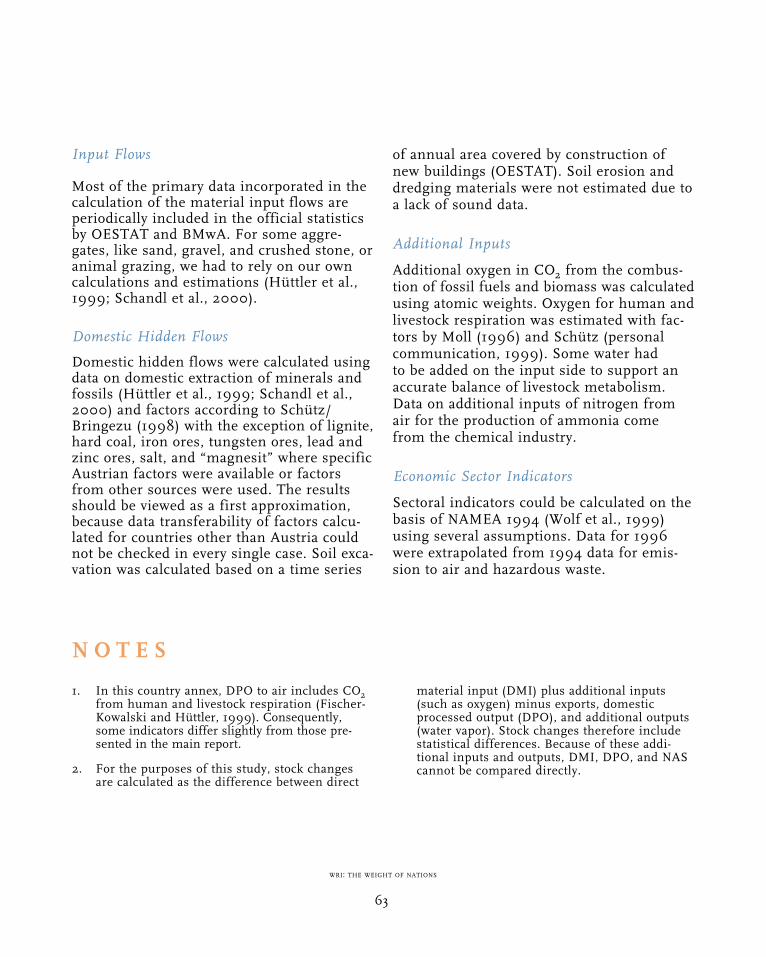
WRI: THE WEIGHT OF NATIONS
63
Input Flows
Most of the primary data incorporated in thecalculation of the material input flows areperiodically included in the official statisticsby OESTAT and BMwA. For some aggre-gates, like sand, gravel, and crushed stone, oranimal grazing, we had to rely on our owncalculations and estimations (Hüttler et al.,1999; Schandl et al., 2000).
Domestic Hidden Flows
Domestic hidden flows were calculated usingdata on domestic extraction of minerals andfossils (Hüttler et al., 1999; Schandl et al.,2000) and factors according to Schütz/Bringezu (1998) with the exception of lignite,hard coal, iron ores, tungsten ores, lead andzinc ores, salt, and “magnesit” where specificAustrian factors were available or factorsfrom other sources were used. The resultsshould be viewed as a first approximation,because data transferability of factors calcu-lated for countries other than Austria couldnot be checked in every single case. Soil exca-vation was calculated based on a time series
of annual area covered by construction ofnew buildings (OESTAT). Soil erosion anddredging materials were not estimated due toa lack of sound data.
Additional Inputs
Additional oxygen in CO2 from the combus-tion of fossil fuels and biomass was calculatedusing atomic weights. Oxygen for human andlivestock respiration was estimated with fac-tors by Moll (1996) and Schütz (personalcommunication, 1999). Some water had to be added on the input side to support anaccurate balance of livestock metabolism.Data on additional inputs of nitrogen fromair for the production of ammonia comefrom the chemical industry.
Economic Sector Indicators
Sectoral indicators could be calculated on thebasis of NAMEA 1994 (Wolf et al., 1999)using several assumptions. Data for 1996were extrapolated from 1994 data for emis-sion to air and hazardous waste.
1. In this country annex, DPO to air includes CO2from human and livestock respiration (Fischer-Kowalski and Hüttler, 1999). Consequently,some indicators differ slightly from those pre-sented in the main report.
2. For the purposes of this study, stock changesare calculated as the difference between direct
material input (DMI) plus additional inputs(such as oxygen) minus exports, domesticprocessed output (DPO), and additional outputs(water vapor). Stock changes therefore includestatistical differences. Because of these addi-tional inputs and outputs, DMI, DPO, and NAScannot be compared directly.
N O T E S

WRI: THE WEIGHT OF NATIONS
64
Adriaanse, A. et al., 1997. Resource Flows: TheMaterial Basis of Industrial Economies. WashingtonD.C.: World Resources Institute.
Amann, C., and M. Fischer-Kowalski. Forthcoming.In National Environmental Policies: A ComparativeAnalysis of Capacity Building. Vol. 2. M. Jänickeand H. Weidner, eds. Berlin/Heidelberg/NewYork: Springer.
BMLF (Federal Ministry for Agriculture andForestry), ed. 1990, 1993, 1996.Gewässerschutzbericht. Vienna: BMLF.
BMLF (Federal Ministry for Agriculture andForestry)-Wasserwirtschaftskataster, ed. 1985,1991, 1995, 1999, Kommunale Kläranlagen inÖsterreich. Vienna: BMLF.
BMUJF (Federal Ministry for the Environment,Youth, and Family), ed. 1992, 1995, 1998.Bundes-Abfallwirtschaftsplan.Bundesabfallwirtschaftsbericht. Vienna. BMUJF.
BMUJF (Federal Ministry for the Environment,Youth, and Family), ed. 1998. Umweltsituation inÖsterreich. Umweltkontrollbericht desBundesministers für Umwelt, Jugend undFamilie an den Nationalrat. Vienna: BMUJF.
BMwA (Federal Ministry for Economic Affairs), ed.Österreichisches Montanhandbuch, several vol-umes. Vienna/: Horn: Ferdinand Berger & Söhne.Vienna: Horn.
Bundeskammer für gewerbliche Wirtschaft, ed.1991. Abfallerhebung Industrie. Vienna:Bundeskammer für gewerbliche Wirtschaft.
De Bruyn, S.M., and J.B. Opschoor. 1997. “Develop-ments in the throughput income relationship:theoretical and empirical observations”. EcologicalEconomics, No. 20, issue not available: 255-268.
Fischer-Kowalski, M., and W. Hüttler. 1999.“Society’s Metabolism. The Intellectual History ofMaterial Flow Analysis, Part II, 1970–1998.”Journal of Industrial Ecology 2(4): 107-137.
Gerhold, S. 1996. “ProblemorientierteUmweltindikatoren. Weiterentwicklung undAktualisierung.” Statistische Nachrichten, Vol. 51,Issue 12 (June 1996): 950-963.
Hüttler, W., H. Schandl, and H. Weisz. 1999. “Are Industrial Economies on the Path ofDematerialization? Material Flow Accounts forAustria 1960–1996: Indicators and InternationalComparison.” Proceedings to the 3rd ConAccountConference, Amsterdam, Nov. 21.
Jänicke, M., H. Mönch, T. Ranneberg, and U.E.Simonis. 1989. “Structural Change and Environ-mental Impact. Empirical Evidence on Thirty-OneCountries in East and West.” EnvironmentalMonitoring and Assessment (12)2: 99-114.
Kisser, M., and U. Kirschten. 1995. “Reduction ofWaste Water Emissions in the Austrian Pulp andPaper Industry,” in Successful Environmental Policy.M. Jänicke and H. Weidner, eds. Berlin: Sigma.
Kroiss, H., M. Zessner, K. Deutsch, N. Kreuzinger,and W. Schaar. 1998: Nährstoffbilanzen fürDonauanrainerstaaten–Erhebung für Österreich.Vienna: Institut für Wassergüte undAbfallwirtschaft der TU Wien.
Malenbaum, W. 1978. World Demand for RawMaterials in 1985 and 2000. New York: McGraw Hill.
Moll, S. 1996. Ernährungsbilanzen privater Haushalteund deren Verknüpfung mit physischen Input-Output-Tabellen. Studie im Auftrag des StatistischenBundesamtes Wiesbaden. Unpublished.
OESTAT (Austrian Central Statistical Office), ed.1995. Statistisches Jahrbuch für die Republik Österre-ich. XLVI. Jahrgang, Neue Folge 1995. Vienna:OESTAT-OEBIG (Österreichisches Bundesinstitutfür Gesundheitswesen), ed. 1974, 1981, 1985,1989. Abfallerhebungen in Gemeinden. Vienna:OEBIG.
Ritter, M., and G. Ahamer. 1999. Luftschadstoff-Trends in Österreich 1980–1997. UBA Berichte BE-146. Vienna: UBA.
Ritter, M., and B. Raberger. 1999: TreibhausgasEmissionen in Österreich 1980–1997. UBA BerichteIB-601. Vienna: UBA.
Schandl, H., H. Weisz, and B. Petrovic. 2000:“Materialfluss für Österreich 1960 bis 1997.”Statistische Nachrichten 54 (2).
R E F E R E N C E S

WRI: THE WEIGHT OF NATIONS
65
Schütz, H., and S. Bringezu. 1998. “Economy-wideMaterial Flow Accounting (MFA).” TechnicalDocumentation presented at the MFA-Workshop,Wiesbaden, Germany, June 2–5.
Selden, T.M., and D. Song. 1994. “EnvironmentalQuality and Development: Is there a KuznetCurve for Air Pollution?” Journal of EnvironmentalEconomics and Environmental Management Vol. 27,issue not available: 147-162.
Steurer, R. 1999. “Klimaschutzpolitik in Österreich.Bilanz der 1990er Jahre und Ausblick.” SWS-Rundschau, March 1999, Vol. 39, Issue 2: 624-39.
Wolf, M. E., J. Hanauer, and G. Ahamer. 1998:“Eine NAMEA der Luftschadstoffe Österreichs1994.” Statistische Nachrichten. Vol 53, Issue 1, Jan. 1, 1998: 56-67.
World Bank, 1992. World Development Report 1992.Development and the Environment. New York andOxford: Oxford University Press.
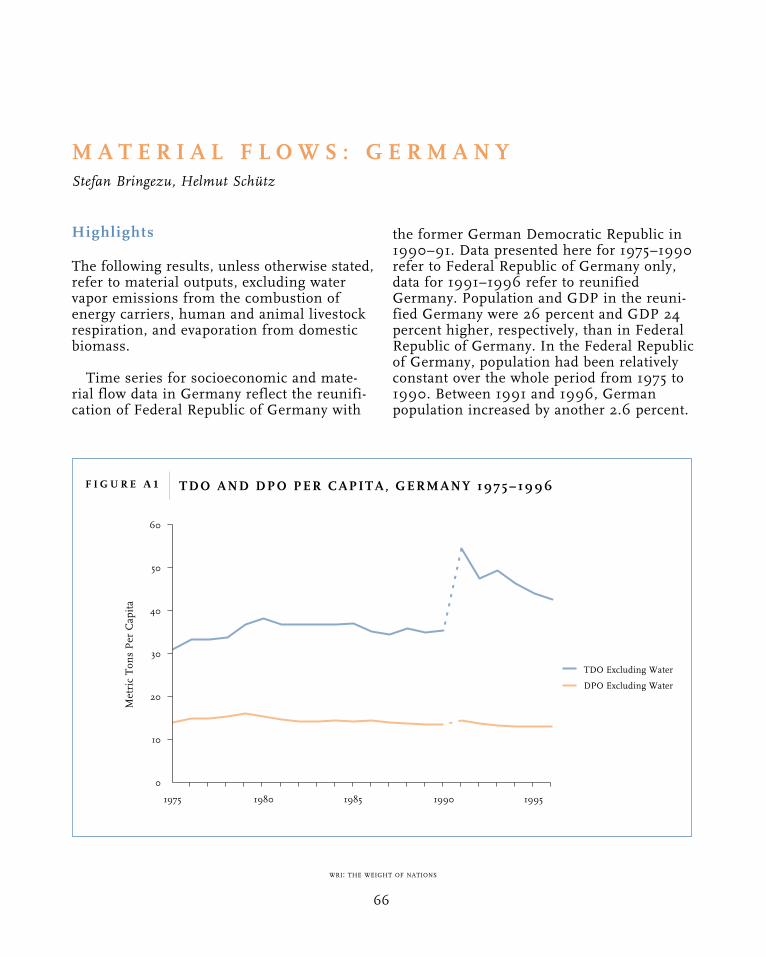
WRI: THE WEIGHT OF NATIONS
66
Highlights
The following results, unless otherwise stated,refer to material outputs, excluding watervapor emissions from the combustion ofenergy carriers, human and animal livestockrespiration, and evaporation from domesticbiomass.
Time series for socioeconomic and mate-rial flow data in Germany reflect the reunifi-cation of Federal Republic of Germany with
the former German Democratic Republic in1990–91. Data presented here for 1975–1990refer to Federal Republic of Germany only,data for 1991–1996 refer to reunifiedGermany. Population and GDP in the reuni-fied Germany were 26 percent and GDP 24percent higher, respectively, than in FederalRepublic of Germany. In the Federal Republicof Germany, population had been relatively constant over the whole period from 1975 to1990. Between 1991 and 1996, German population increased by another 2.6 percent.
M A T E R I A L F L O W S : G E R M A N Y Stefan Bringezu, Helmut Schütz
0
10
20
30
40
50
60
1975 1980 1985 1990 1995
F I G U R E A 1 TDO AND DPO PER CAPITA, GERMANY 1975–1996
TDO Excluding Water
DPO Excluding Water
Metr
ic T
on
s P
er
Cap
ita

WRI: THE WEIGHT OF NATIONS
67
Domestic processed output (DPO) wasalmost constantly high in both the FederalRepublic of Germany and reunited Germanywith values around 15 metric tons per capita.(See Figure A1.) In contrast, total domesticoutput (TDO) increased significantly withreunification, rising to 54 metric tons percapita, compared to about 30 to 40 metrictons per capita in Federal Republic ofGermany. This was due to the inclusion inthe accounts of overburden from lignitemines in the eastern part of the country,some of which have been closed in recentyears. However, lignite mining is still ongo-ing in Germany. Mining has been at the cen-ter of regional political debate because some
villages have had to be abandoned to makeway for mining excavation. Most of thehidden flows from mining are included inofficial German waste statistics.
During 1975–96, both DPO and TDO rosemore slowly than economic growth. Thus, wecan record a decoupling between physicalthroughput and economic performance. (See Figure A2.)
Despite the different levels of TDO inFederal Republic of Germany and reunitedGermany, their composition, in terms of themain material constituents, was similar forboth periods. Landfill and mine dumping,
TDO Excluding Water
DPO Excluding Water
0.0
0.2
0.4
0.6
0.8
1.0
1.2
1.4
1.6
1.8
1975 1980 1985 1990 1995
F I G U R E A 2 TDO AND DPO PER CONSTANT UNIT OF GDP, GERMANY 1975–1996
Kg
Per
Deu
tsch
Mar
k

WRI: THE WEIGHT OF NATIONS
68
CO2 emissions to air, and excavation of soilfor construction of infrastructure dominatedoutputs to the environment. (See Figure A3.)However, quantities of outputs from landfilland mine dumping accounted for a signifi-cantly higher proportion of TDO in reunitedGermany.
With respect to environmental gateways,about 90 percent of DPO is emitted to theatmosphere. Dissipative outflows make uparound 3 to 4 percent of DPO to air, theremainder being almost exclusively DPO toland. DPO to water is negligible in terms offlow volumes.
CO2 dominates DPO to air throughout thestudy period, while such pollutants as SO2and NO2, although important with respect totheir environmental impacts, contribute littleto the overall volume. (See Table A1.)
Mining wastes (mainly from open-pit lignite mining) and soil excavation for con-struction, to a much lesser extent in thereunited Germany, dominate domestic hid-den flows, which account for a high propor-tion of TDO in Germany. (See Figure A4.) Soilerosion and dredging excavation contribute a significantly lower share to domestic hidden flows.
0
10
20
30
40
50
60
1975 1980 1985 1990 1995
F I G U R E A 3 COMPOSITION OF TDO, GERMANY 1975–1996
Others
CO2
Landfill Waste
Excavation
Landfill and MineDumping
Erosion
Metr
ic T
on
s P
er
Cap
ita

WRI: THE WEIGHT OF NATIONS
69
Million Metric TonsCO2 741 726 995 938
Other emissions to air 26 17 24 16
TOTAL 767 743 1019 954
Metric Tons Per CapitaCO2 12.0 11.5 12.5 11.5
Other emissions to air 0.4 0.3 0.3 0.2
TOTAL 12.4 11.8 12.8 11.7
TABLE A1 CO2 AND OTHER EMISSIONS TO AIR, EXCLUDING WATER VAPOR,GERMANY 1975–1996
Federal Republic of Germany Reunified Germany
1975 1990 1991 1996
0
500
1000
1500
2000
2500
3000
3500
1975 1980 1985 1990 1995
F I G U R E A 4 COMPOSITION OF DOMESTIC HIDDEN FLOWS, GERMANY 1975–1996
Erosion
Mining Wastes*
Dredge Excavation
to Water (North Sea)
Soil Excavation*
Soil Excavation
*outputs not deposited on controlled landfills
Mil
lio
n M
etr
ic T
on
s

WRI: THE WEIGHT OF NATIONS
70
0
50
100
150
200
250
300
1975 1980 1985 1990 1995
F I G U R E A 5 SELECTED MATERIAL OUTPUT FLOWS ( INDEX) , GERMANY 1995–1996
Controlled Waste Disposal (Landfills Only,Excluding Hidden Flows)
CO2 From Fossil Fuels
SO2
NOx as NO2
CFCs and Halons
Mining Wastes NotDeposited on ControlledLandfills
0
100
200
300
400
500
600
700
1975 1980 1985 1990 1995
F I G U R E A 6 MATERIAL OUTPUT FLOWS TO AGRICULTURAL FIELDS ( INDEX) ,GERMANY 1995–1996
Compost
Erosion
Sewage Sludges
Farmyard Manure
Pesticides
Seeds
Mineral Fertilizers
Ind
ex
(19
75=
100
)In
dex
(19
75=
100
)

WRI: THE WEIGHT OF NATIONS
71
For selected material flows, we recorded someinteresting temporal trends. (See Figure A5.)Mining wastes for landfills (not disposed ofin controlled waste disposal sites) increasedimmediately after reunification and then de-creased until 1996. This was due to thephase-out of lignite mining facilities in theeastern part of Germany. The decline of CFCsand halons is particularly obvious. As withSO2 emissions, these are examples of mate-rial outputs declining because of effective pol-icy regulations. Nevertheless, the overall in-crease in DPO and TDO indicates that theseregulations did not reduce total output flows.
Among dissipative uses of products onagricultural fields, compost shows a signifi-cant increase over the study period. (SeeFigure A6.) The application of sewage sludgealso reached a higher level in the reunitedGermany in the 1990s compared to the levelin the Federal Republic of Germany. Theincrease in the use of compost and sewagesludge should be interpreted as positive
trends, indicating a higher recycling of nutri-ents via agriculture. These materials can besubstituted for mineral fertilizer to a certainextent, thus contributing to reduced resourcerequirement.
Net additions to stock in the German economy exhibit an interesting trend. (SeeFigure A7.) After a period of heavy construc-tion activities in Federal Republic ofGermany from 1975 to 1980, net additions ofmaterial were lower between 1981 and 1987,then increased again in 1988 to 1990, butdid not reach the high levels of the 1970s.After reunification, renovation and construc-tion of new homes in the eastern part ofGermany led to another increase. On a percapita basis, material additions to stock inthe reunited Germany range from about 10to 13 metric tons per capita. No continuouslydeclining trend can be detected, which indicates that pressure on the environmentassociated with the physical growth of thetechnosphere is still increasing.
0
200
400
600
800
1000
1200
1400
1600
1975 1980 1985 1990 1995
0
2
4
6
8
10
12
14
16
F I G U R E A 7 NET ADDITIONS TO STOCK, GERMANY 1975–1996
Additions to Stock (Million Tons)
Additions to Stock (Tons Per Capita)
Mil
lio
n M
etr
ic T
on
s
Metr
ic T
on
s P
er
Cap
ita
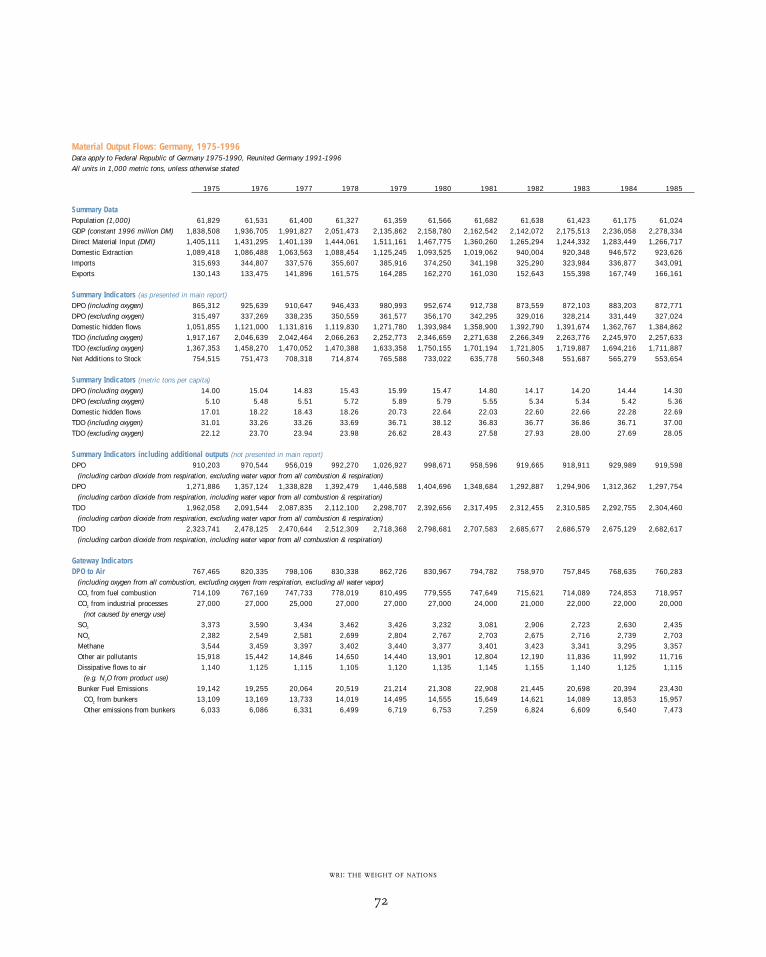
WRI: THE WEIGHT OF NATIONS
72
Material Output Flows: Germany, 1975-1996Data apply to Federal Republic of Germany 1975-1990, Reunited Germany 1991-1996All units in 1,000 metric tons, unless otherwise stated
1975 1976 1977 1978 1979 1980 1981 1982 1983 1984 1985
Summary DataPopulation (1,000) 61,829 61,531 61,400 61,327 61,359 61,566 61,682 61,638 61,423 61,175 61,024GDP (constant 1996 million DM) 1,838,508 1,936,705 1,991,827 2,051,473 2,135,862 2,158,780 2,162,542 2,142,072 2,175,513 2,236,058 2,278,334Direct Material Input (DMI) 1,405,111 1,431,295 1,401,139 1,444,061 1,511,161 1,467,775 1,360,260 1,265,294 1,244,332 1,283,449 1,266,717Domestic Extraction 1,089,418 1,086,488 1,063,563 1,088,454 1,125,245 1,093,525 1,019,062 940,004 920,348 946,572 923,626Imports 315,693 344,807 337,576 355,607 385,916 374,250 341,198 325,290 323,984 336,877 343,091Exports 130,143 133,475 141,896 161,575 164,285 162,270 161,030 152,643 155,398 167,749 166,161
Summary Indicators (as presented in main report)DPO (including oxygen) 865,312 925,639 910,647 946,433 980,993 952,674 912,738 873,559 872,103 883,203 872,771DPO (excluding oxygen) 315,497 337,269 338,235 350,559 361,577 356,170 342,295 329,016 328,214 331,449 327,024Domestic hidden flows 1,051,855 1,121,000 1,131,816 1,119,830 1,271,780 1,393,984 1,358,900 1,392,790 1,391,674 1,362,767 1,384,862TDO (including oxygen) 1,917,167 2,046,639 2,042,464 2,066,263 2,252,773 2,346,659 2,271,638 2,266,349 2,263,776 2,245,970 2,257,633TDO (excluding oxygen) 1,367,353 1,458,270 1,470,052 1,470,388 1,633,358 1,750,155 1,701,194 1,721,805 1,719,887 1,694,216 1,711,887Net Additions to Stock 754,515 751,473 708,318 714,874 765,588 733,022 635,778 560,348 551,687 565,279 553,654
Summary Indicators (metric tons per capita)DPO (including oxygen) 14.00 15.04 14.83 15.43 15.99 15.47 14.80 14.17 14.20 14.44 14.30DPO (excluding oxygen) 5.10 5.48 5.51 5.72 5.89 5.79 5.55 5.34 5.34 5.42 5.36Domestic hidden flows 17.01 18.22 18.43 18.26 20.73 22.64 22.03 22.60 22.66 22.28 22.69TDO (including oxygen) 31.01 33.26 33.26 33.69 36.71 38.12 36.83 36.77 36.86 36.71 37.00TDO (excluding oxygen) 22.12 23.70 23.94 23.98 26.62 28.43 27.58 27.93 28.00 27.69 28.05
Summary Indicators including additional outputs (not presented in main report)DPO 910,203 970,544 956,019 992,270 1,026,927 998,671 958,596 919,665 918,911 929,989 919,598
(including carbon dioxide from respiration, excluding water vapor from all combustion & respiration)DPO 1,271,886 1,357,124 1,338,828 1,392,479 1,446,588 1,404,696 1,348,684 1,292,887 1,294,906 1,312,362 1,297,754
(including carbon dioxide from respiration, including water vapor from all combustion & respiration)TDO 1,962,058 2,091,544 2,087,835 2,112,100 2,298,707 2,392,656 2,317,495 2,312,455 2,310,585 2,292,755 2,304,460
(including carbon dioxide from respiration, excluding water vapor from all combustion & respiration)TDO 2,323,741 2,478,125 2,470,644 2,512,309 2,718,368 2,798,681 2,707,583 2,685,677 2,686,579 2,675,129 2,682,617
(including carbon dioxide from respiration, including water vapor from all combustion & respiration)
Gateway IndicatorsDPO to Air 767,465 820,335 798,106 830,338 862,726 830,967 794,782 758,970 757,845 768,635 760,283
(including oxygen from all combustion, excluding oxygen from respiration, excluding all water vapor)CO2 from fuel combustion 714,109 767,169 747,733 778,019 810,495 779,555 747,649 715,621 714,089 724,853 718,957CO2 from industrial processes 27,000 27,000 25,000 27,000 27,000 27,000 24,000 21,000 22,000 22,000 20,000
(not caused by energy use)SO2 3,373 3,590 3,434 3,462 3,426 3,232 3,081 2,906 2,723 2,630 2,435NOX 2,382 2,549 2,581 2,699 2,804 2,767 2,703 2,675 2,716 2,739 2,703Methane 3,544 3,459 3,397 3,402 3,440 3,377 3,401 3,423 3,341 3,295 3,357Other air pollutants 15,918 15,442 14,846 14,650 14,440 13,901 12,804 12,190 11,836 11,992 11,716Dissipative flows to air 1,140 1,125 1,115 1,105 1,120 1,135 1,145 1,155 1,140 1,125 1,115
(e.g. N2O from product use)Bunker Fuel Emissions 19,142 19,255 20,064 20,519 21,214 21,308 22,908 21,445 20,698 20,394 23,430
CO2 from bunkers 13,109 13,169 13,733 14,019 14,495 14,555 15,649 14,621 14,089 13,853 15,957Other emissions from bunkers 6,033 6,086 6,331 6,499 6,719 6,753 7,259 6,824 6,609 6,540 7,473

WRI: THE WEIGHT OF NATIONS
73
Material Output Flows: Germany, 1975-1996Data apply to Federal Republic of Germany 1975-1990, Reunited Germany 1991-1996
All units in 1,000 metric tons, unless otherwise stated
1986 1987 1988 1989 1990 1991 1992 1993 1994 1995 1996
Summary Data61,066 61,077 61,450 62,063 63,254 79,753 80,275 80,975 81,338 81,539 81,818 Population (1,000)
2,329,057 2,362,185 2,449,948 2,533,450 2,662,376 3,308,569 3,381,382 3,341,381 3,432,165 3,494,311 3,541,500 GDP (constant 1996 million DM)1,280,236 1,254,586 1,314,048 1,368,323 1,401,844 1,811,969 1,874,605 1,826,343 1,958,542 1,858,517 1,850,907 Direct Material Input (DMI)
935057 916,056 963,401 1,013,641 1,027,408 1,378,829 1,418,865 1,403,263 1,495,392 1,394,927 1,375,917 Domestic Extraction345179 338,530 350,647 354,682 374,436 433,140 455,740 423,080 463,150 463,590 474,990 Imports162027 165,835 175,025 189,174 189,279 201,608 205,868 191,016 212,579 214,276 227,830 Exports
Summary Indicators (as presented in main report)882,354 860,111 851,244 837,191 855,945 1,156,977 1,096,415 1,083,442 1,065,581 1,062,121 1,074,725 DPO (including oxygen)329,833 319,003 318,098 315,532 321,836 423,830 400,990 394,347 386,522 383,461 386,293 DPO (excluding oxygen)
1,266,497 1,249,247 1,355,366 1,332,262 1,388,710 3,182,489 2,714,115 2,919,439 2,704,373 2,524,891 2,417,427 Domestic hidden flows2,148,851 2,109,358 2,206,610 2,169,453 2,244,655 4,339,466 3,810,529 4,002,881 3,769,954 3,587,012 3,492,153 TDO (including oxygen)1,596,330 1,568,251 1,673,464 1,647,794 1,710,546 3,606,320 3,115,104 3,313,786 3,090,895 2,908,351 2,803,721 TDO (excluding oxygen)
574,006 565,020 612,025 652,915 683,930 837,026 943,010 919,493 1,060,177 965,381 937,623 Net Additions to Stock
Summary Indicators (metric tons per capita)14.45 14.08 13.85 13.49 13.53 14.51 13.66 13.38 13.10 13.03 13.14 DPO (including oxygen)
5.40 5.22 5.18 5.08 5.09 5.31 5.00 4.87 4.75 4.70 4.72 DPO (excluding oxygen)20.74 20.45 22.06 21.47 21.95 39.90 33.81 36.05 33.25 30.97 29.55 Domestic hidden flows35.19 34.54 35.91 34.96 35.49 54.41 47.47 49.43 46.35 43.99 42.68 TDO (including oxygen)26.14 25.68 27.23 26.55 27.04 45.22 38.81 40.92 38.00 35.67 34.27 TDO (excluding oxygen)
Summary Indicators including additional outputs (not presented in main report)928,652 905,663 896,456 882,432 899,345 1,210,046 1,148,230 1,134,999 1,117,195 1,113,605 1,126,189 DPO
(including carbon dioxide from respiration, excluding water vapor from all combustion & respiration)1,304,663 1,280,885 1,270,175 1,255,470 1,281,970 1,788,629 1,693,190 1,676,918 1,650,083 1,651,828 1,677,799 DPO
(including carbon dioxide from respiration, including water vapor from all combustion & respiration)2,195,149 2,154,910 2,251,822 2,214,694 2,288,055 4,392,536 3,862,345 4,054,438 3,821,569 3,638,496 3,543,617 TDO
(including carbon dioxide from respiration, excluding water vapor from all combustion & respiration)2,571,160 2,530,132 2,625,541 2,587,732 2,670,680 4,971,118 4,407,305 4,596,357 4,354,457 4,176,718 4,095,226 TDO
(including carbon dioxide from respiration, including water vapor from all combustion & respiration)
Gateway Indicators769,493 753,396 741,932 725,844 742,655 1019,495 966,402 956,852 942,433 941,465 954,495 DPO to Air
(including oxygen from all combustion, excluding oxygen from respiration, excluding all water vapor)728,337 714,271 703,203 686,065 704,154 970,099 919,818 912,100 897,100 898,100 913,066 CO2 from fuel combustion
20,000 19,000 20,000 22,000 21,500 25,000 25,000 25,000 27,000 26,000 25,000 CO2 from industrial processes(not caused by energy use)
2,320 1,973 1,271 990 929 4,049 3,344 2,993 2,518 2,153 1,595 SO2
2,744 2,603 2,462 2,310 2,140 2,707 2,475 2,312 2,181 2,107 2,083 NOX
3,322 3,189 3,078 3,072 2,945 3,294 3,195 3,026 2,885 2,847 2,754 Methane11,675 11,280 10,864 10,352 9,952 13,206 11,474 10,325 9,653 9,202 8,982 Other air pollutants
1,095 1,080 1,055 1,055 1,035 1,140 1,096 1,096 1,096 1,056 1,016 Dissipative flows to air(e.g. N2O from product use)
28,294 25,410 23,942 23,821 23,769 26,848 25,878 28,940 29,196 29,212 28,327 Bunker Fuel Emissions19,337 17,271 16,203 16,065 16,054 18,099 17,818 20,100 20,100 20,100 19,066 CO2 from bunkers
8,956 8,140 7,739 7,756 7,715 8,749 8,060 8,840 9,096 9,112 9,261 Other emissions from bunkers

WRI: THE WEIGHT OF NATIONS
74
Material Output Flows: Germany, 1975-1996Data apply to Federal Republic of Germany 1975-1990, Reunited Germany 1991-1996All units in 1,000 metric tons, unless otherwise stated
1975 1976 1977 1978 1979 1980 1981 1982 1983 1984 1985
DPO to Land 95,123 102,593 109,836 113,393 115,563 118,995 115,238 111,874 111,552 111,873 109,799Municipal landfill 10,147 10,098 10,077 10,283 10,506 10,761 10,068 9,349 9,371 9,389 9,429Industrial landfill 50,713 57,828 64,802 67,394 70,587 73,326 70,531 68,057 67,815 66,841 64,120Landfilled sewage sludge 1,864 1,864 1,864 1,926 1,989 2,052 2,198 2,345 2,591 2,838 3,065
Dissipative flows to landFertilizers 7,899 8,051 8,420 8,781 8,574 8,894 8,732 8,571 8,472 8,325 8,706Pesticides 25 26 28 30 31 33 31 29 31 33 30Animal manure spread on fields 19,555 19,608 19,645 19,669 18,476 18,217 18,274 18,532 17,740 18,842 18,801Sewage sludge spread on fields 612 610 608 606 566 563 561 558 555 537 528Grit materials 1,660 1,660 1,447 1,660 1,660 1,932 1,660 1,243 1,660 1,660 1,660Others 2,649 2,848 2,946 3,043 3,174 3,218 3,184 3,190 3,316 3,409 3,459
DPO to Water 2,724 2,711 2,705 2,702 2,704 2,712 2,717 2,715 2,706 2,696 2,689N 316 315 314 314 314 315 315 315 314 313 313P 35 35 35 35 35 35 35 35 35 35 35Others 2,372 2,361 2,356 2,353 2,354 2,362 2,367 2,365 2,357 2,347 2,341
Additional Inputs (not presented in main report)Oxygen in combustion 782,282 837,439 822,418 859,797 896,626 859,530 818,203 779,852 781,629 795,098 789,383Oxygen in respiration 32,648 32,658 32,997 33,336 33,407 33,452 33,351 33,532 34,042 34,026 34,056
Additional Outputs (not presented in main report)Water vapor from fossil combustion 331,239 356,206 352,312 369,574 388,986 375,276 359,357 342,420 345,011 351,459 347,266Water vapor from respiration 30,444 30,374 30,497 30,635 30,676 30,748 30,731 30,803 30,984 30,915 30,891CO2 from respiration 44,891 44,905 45,371 45,837 45,934 45,997 45,858 46,106 46,808 46,785 46,826
Domestic Hidden FlowsExcavated soil 143,802 147,634 153,307 158,935 170,044 167,526 153,307 149,955 149,780 149,660 137,429Dredging wastes 33,794 33,794 33,794 33,794 33,794 33,794 33,794 33,794 33,794 33,794 33,794Soil erosion 70,454 71,282 73,101 74,183 74,306 75,255 76,374 77,781 78,446 79,940 81,532Mining overburden 803,807 868,291 871,615 852,918 993,637 1,117,409 1,095,426 1,131,260 1,129,654 1,099,373 1,132,107

WRI: THE WEIGHT OF NATIONS
75
Material Output Flows: Germany, 1975-1996Data apply to Federal Republic of Germany 1975-1990, Reunited Germany 1991-1996
All units in 1,000 metric tons, unless otherwise stated
1986 1987 1988 1989 1990 1991 1992 1993 1994 1995 1996
110,170 104,023 106,604 108,614 110,507 133,997 126,534 123,111 119,682 117,210 116,772 DPO to Land9,500 9,565 9,949 10,376 10,910 13,985 13,008 12,043 12,097 12,127 12,168 Municipal landfill
63,934 57,729 59,469 61,165 62,755 69,657 65,313 64,101 59,319 56,588 55,890 Industrial landfill3,293 3,521 3,435 3,349 3,263 6,158 4,407 2,657 2,657 2,657 2,657 Landfilled sewage sludge
Dissipative flows to land8,997 8,723 8,875 8,439 7,864 8,314 8,224 8,327 9,187 9,186 9,261 Fertilizers
33 36 37 35 33 37 33 29 30 35 35 Pesticides18,638 18,570 18,656 18,759 18,731 27,047 26,753 27,088 27,318 27,375 27,361 Animal manure spread on fields
515 501 634 767 900 983 994 1,028 1,037 1,039 1,038 Sewage sludge spread on fields1,660 1,660 1,660 1,660 1,660 2,110 2,110 2,110 2,110 2,110 2,110 Grit materials3,600 3,718 3,890 4,065 4,391 5,706 5,691 5,729 5,927 6,093 6,251 Others
2,691 2,692 2,707 2,734 2,784 3,485 3,478 3,478 3,466 3,447 3,458 DPO to Water313 313 314 317 321 381 360 338 317 295 296 N
35 35 35 36 36 44 39 34 28 23 23 P2,343 2,343 2,358 2,381 2,427 3,060 3,080 3,107 3,121 3,129 3,139 Others
Additional Inputs (not presented in main report)799,655 791,173 781,249 767,475 789,318 1,061,705 1,014,175 1,016,769 1,006,013 1,018,161 1,042,593 Oxygen in combustion
33,672 33,129 32,881 32,903 31,564 38,596 37,684 37,496 37,538 37,443 37,428 Oxygen in respiration
Additional Outputs (not presented in main report)345,287 344,745 343,262 342,418 352,325 540,932 507,599 504,470 495,329 500,657 513,981 Water vapor from fossil combustion
30,725 30,477 30,457 30,619 30,300 37,651 37,361 37,449 37,559 37,566 37,628 Water vapor from respiration46,299 45,552 45,212 45,241 43,400 53,070 51,815 51,557 51,615 51,484 51,464 CO2 from respiration
Domestic Hidden Flows145,950 137,429 151,859 161,754 170,000 266,439 259,506 266,439 308,822 271,575 262,035 Excavated soil
33,794 33,794 33,794 33,794 33,794 33,794 33,794 33,794 33,794 33,794 33,794 Dredging wastes81,892 82,118 81,940 82,192 82,098 128,704 120,964 122,954 122,586 123,926 125,572 Soil erosion
1,004,862 995,906 1,087,773 1,054,522 1,102,818 2,753,552 2,299,851 2,496,252 2,239,172 2,095,596 1,996,027 Mining overburden

WRI: THE WEIGHT OF NATIONS
76
Technical Notes and Sources
In general, outputs from the German econo-my comprise outputs to the domestic envi-ronment and outputs of materials to foreigncountries as exports. The difference betweenmaterial inputs, as accounted for in our ear-lier study (Adriaanse et al., 1997), and mate-rial outputs accounted for here represents thenet amount of additional materials stockedwithin the technosphere.
Time series were established for Germanybased on the period 1975 to 1990 (the terri-tory of the former Federal Republic ofGermany), then on the period 1991 to 1996(the territory of the reunited Germany).Material outputs of the German economy tothe environment comprise the followingmain groups:
(1) waste disposal in controlled landfills,(2) dissipative uses and dissipative losses,(3) emissions to air, (4) emissions to water, (5) domestic hidden flows. Outputs 1 to 4 constitute the DPO. TDOcomprises DPO plus hidden flows (No. 5).
Net additions to stocks were calculated bysubtracting DPO and exports from directmaterial inputs to the German economy.
Please note that domestic material outputswere counted here at the system boundarybetween technosphere (economy) and envi-ronment, which was functionally defined:within the technosphere, humans control thequantity, quality, and locality of materials.Outside the technosphere, this is not thecase. In spatial terms, the system boundary isat the end-of-pipe for industrial processesand at the surface of soil for agricultural and
forestry processes. For example, the totalamount of nitrogen in mineral fertilizersapplied to agricultural land was countedunder DPO, but the subsequent emissions of nitrogen oxides from these fertilizers werenot counted under DPO (double-counting).These emissions were, however, still kept inthe data base and might be used in furtherstudies, for example, on qualitative aspects of DPO.
Three major data source types were differ-entiated: governmental statistics, non-govern-mental statistics, and specific studies.Because of limited space, detailed technicalnotes on data sources and formulae used incalculating outputs can be viewed at thehomepage of the Wuppertal Institute(http://www.wupperinst.org/Projekte).
Waste Disposal in Controlled Landfills(Excluding Incineration)
This group comprises wastes disposed of incontrolled landfills owned by industry or hos-pitals, as well as in public landfills and com-mercial landfills (the latter being used mainlyby industry). To account for the contributionto DPO (to land), domestic hidden flows thatare included in official waste data were sub-tracted and counted under the group ofdomestic hidden flows. This refers to soilexcavation and mining wastes.
The basis for German data on waste dis-posal is official waste statistics published by FSOG (Federal Statistical Office Germany)in two volumes: waste disposal by industryand hospitals, and municipal waste disposal.In this study, the amount of waste disposedof in controlled landfills was estimated intime series based on official statistics andother sources.

WRI: THE WEIGHT OF NATIONS
77
Dissipative Use of Products and Dissipative Losses
These material outputs refer in general todissipative uses of products on agriculturalfields, on roads, and for other purposes, andto dissipative losses by erosion of infrastruc-ture, abrasion of car tires, and leakages.
Data are provided by German agriculturalstatistics, the Federal Environmental Agency(FEA), and waste statistics of FSOG. Theywere supplemented by our own estimates.
Emissions to Air
Emissions to air were accounted for in thefollowing major categories:
CO2 total (from combustion of energy car-riers, nonenergy sources, and from respira-tion; SO2; NOx as NO2; VOC (NMVOCexcluding emissions from use of solvents,and CH4, excluding CH4 from landfilledwastes); CO; dust; N2O, excluding N fromagriculture and wastes, and N2O from use ofproducts; NH3 excluding emissions from fer-tilizer use; CFCs and halons; H2O from com-bustion and respiration; and emissions ofwater from materials.
Except for CO2 from respiration, watervapor from combustion and respiration, andwater emissions from materials, all the datafor categories listed above are available fromFEA, starting in 1970. Respiration outputs inthe form of carbon dioxide and water vapor
were first estimated in the context of studiesfor the physical input-output table for theFederal Republic of Germany 1990 by FSOand Wuppertal Institute. The data for FederalRepublic of Germany 1990 were used hereand data for the remaining years were estimated on a per capita basis. Emissions toair also include those from internationaltransport, that is, from bunker fuels.
Emissions to Water
Statistical information for emissions of mate-rials to water were available for nitrogen andphosphorus from households and industry.
Domestic Hidden Flows
These material outputs were described inAdriaanse et al., 1997.
Exports
Official foreign trade statistics of FSO provide the data from which we subtractedthe water content whose counterpart on theinput side is the domestic water input andnot the water content of other materials.
Sectoral Disaggregation of Material Outputs
The basic principle behind this attribution to activities was in line with the procedureused for the physical input-output table—PIOT—for Federal Republic of Germany1990 by FSO.

WRI: THE WEIGHT OF NATIONS
78
Highlights
Domestic processed output in Japan grew 20percent during the period 1975–1996, whilethe country’s population grew by 12.4 per-cent. Total domestic output in Japan alsogrew about 20 percent during this period,because of an increase in both DPO anddomestic hidden flows. (See Figure A1.) Thegrowth in DPO and TDO occurred mainlyafter the late 1980s. Before then, DPO wasalmost constant and TDO decreased slightly.
On a per capita basis, there was a down-ward trend in TDO from the late 1970s to the mid–1980s; DPO per capita also decreased
slightly in this period. Growth in DPO percapita and TDO per capita were particularlyevident in the late 1980s, when the countryexperienced the so-called “bubble-economy.”(See Figure A2.) The absolute level of DPOper capita in Japan is about 4 metric tonswithout oxygen and 11 metric tons with oxy-gen. These values are relatively small amongthe countries studied.
When DPO is calculated excluding oxygen,the data show a smaller increase than whenDPO is calculated including oxygen. (SeeFigure A3.) In 1990–1996, the former wasalmost constant, whereas the latter wasincreasing. This is because CO2 emissions
M A T E R I A L F L O W S : J A P A N Yuichi Moriguchi
0.0
0.5
1.0
1.5
2.0
2.5
3.0
1975 1980 1985 1990 1995
F I G U R E A 1 TOTAL DOMESTIC OUTPUT, JAPAN 1975–1996
Hidden Flows
DPO (Including OxygenExcluding Water Vapor)
Bil
lio
n M
etr
ic T
on
s

WRI: THE WEIGHT OF NATIONS
79
0
5
10
15
20
25
1975 1980 1985 1990 1995
F I G U R E A 2 TDO, DPO, AND NAS PER CAPITA, JAPAN 1975–1996
TDO Per Capita (Including OxygenExcluding Water Vapor)
DPO Per Capita (Including OxygenExcluding Water Vapor)
NAS Per Capita (DMI+Add. Inputs–Exports–DPO–Add. Outputs)
0.8
1.0
1.2
1.4
1.6
1975 1980 1985 1990 1995
F I G U R E A 3 TRENDS IN MATERIAL FLOW INDICATORS (INDEX), JAPAN 1975–1996
NAS (DMI=Add. Inputs–Exports–DPO–Add.Outputs)
Direct Material Input(DMI)
DPO (Including OxygenExcluding Water Vapor)
TDO (Including OxygenExcluding Water Vapor)
DPO (Excluding OxygenExcluding Water Vapor)
Metr
ic T
on
s P
er
Cap
ita
Ind
ex
( 19
75=
100
)
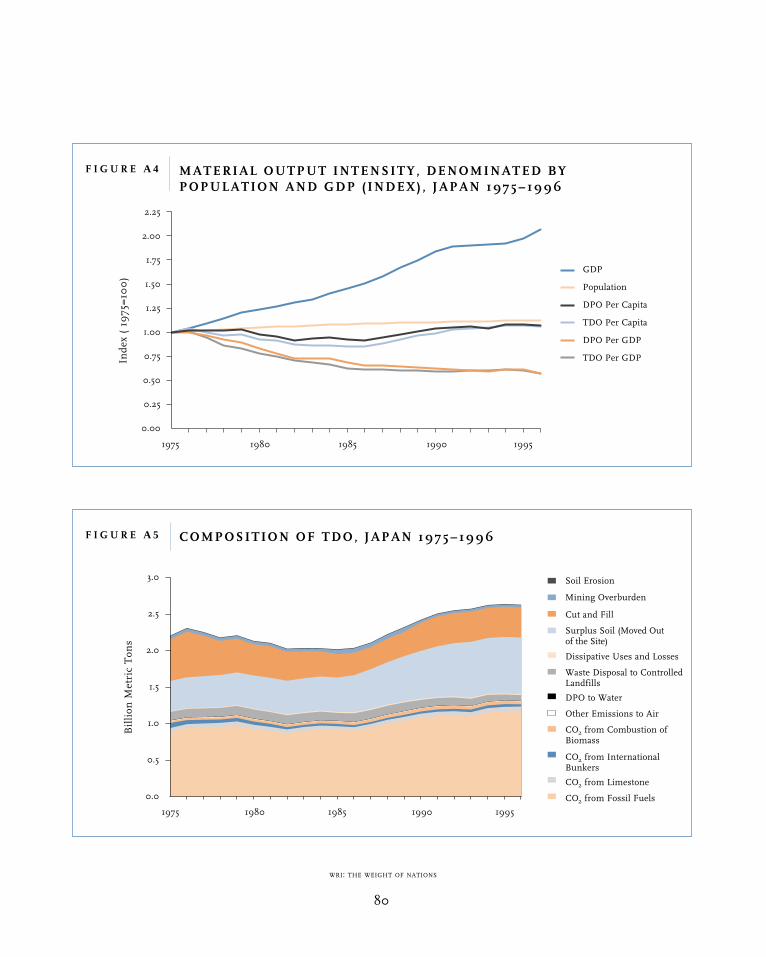
WRI: THE WEIGHT OF NATIONS
80
1975 1980 1985 1990 1995
0.00
0.25
0.50
0.75
1.00
1.25
1.50
1.75
2.00
2.25
F I G U R E A 4 MATERIAL OUTPUT INTENSITY, DENOMINATED BYPOPULATION AND GDP ( INDEX) , JAPAN 1975–1996
GDP
Population
DPO Per Capita
TDO Per Capita
DPO Per GDP
TDO Per GDP
0.0
0.5
1.0
1.5
2.0
2.5
3.0
1975 1980 1985 1990 1995
F I G U R E A 5 COMPOSITION OF TDO, JAPAN 1975–1996
Soil Erosion
Mining Overburden
Cut and Fill
Surplus Soil (Moved Out of the Site)
Dissipative Uses and Losses
Waste Disposal to ControlledLandfills
DPO to Water
Other Emissions to Air
CO2 from Combustion of Biomass
CO2 from InternationalBunkers
CO2 from Limestone
CO2 from Fossil Fuels
Ind
ex
( 19
75=
100
)B
illi
on
Metr
ic T
on
s

WRI: THE WEIGHT OF NATIONS
81
from fossil fuel combustion, which dominateDPO increased, whereas some other outputs,such as final disposal of solid wastes to land,decreased. In the same period, the directmaterial input (DMI) of Japan was actuallydecreasing, mainly because of reduced con-struction activity following the collapse of thebubble-economy. Net additions to stock(NAS), mainly reflected fluctuations in con-struction activity. A steep increase in NASoccurred in the late 1980s, the period of thebubble-economy. NAS and DMI show paral-lel fluctuations. This is because constructionmaterials that are dominant elements of DMIwent almost exclusively to stock.
Figure A4 shows that material outputintensity, that is, DPO or TDO per constantunit of GDP, and DPO or TDO per capita,declined until 1990 because of larger growthin the monetary economy than in physicalthroughput (the physical economy). However,since 1990, decoupling between economicgrowth and material throughput has notimproved, because DPO and TDO have con-tinued to increase, while economic growthhas slowed down. This recent trend can beexplained by structural changes in energyconsumption: thanks to relatively cheap oilprices, household energy consumption(including gasoline consumption by privatecars) has increased as a proportion of totalenergy consumption and has contributed tohigher CO2 emissions, but this trend hascontributed little to GDP growth.
As shown in Figure A5, TDO is dominatedby CO2 emissions, particularly from combus-tion of fossil fuels. CO2 emissions wereroughly constant from 1975 to the mid-1980s, then increased from the late 1980s tothe 1990s. A steep increase in CO2 emis-sions, roughly proportional to GDP growth,
took place before 1973, that is, before thefirst oil crisis. These trends are closely re-lated to fluctuations in energy price.
After CO2, waste disposal to controlled land-fill sites is the next major component ofDPO. This is of greater environmental signif-icance than the nominal weight impliesbecause Japan has a shortage of landfill sitesfor waste disposal. Reclaiming coastal areasfor this purpose has sometimes decreasedhabitat for wildlife. The weight of waste dis-posed of in landfill sites is much smallerthan that of waste generated. Waste statisticsreport that 50 million metric tons of munici-pal solid wastes (MSW) and 400 million metric tons of industrial wastes (both ofthem measured as wet weight) were gener-ated in 1995. The difference between theamount generated and the amount sent tolandfill is the amount recycled or reduced byincineration and drying. Three quarters ofMSW is incinerated to reduce waste volumes,but this practice unfortunately generatesundesirable byproducts such as air emis-sions, including dioxins. The amount oflandfilled wastes was almost constant until1990, but is now declining, thanks to wasteminimization and recycling measures.
Dissipative use is another important cate-gory of output flows. Dissipative flows aredominated by applications of animal manureto fields. Japan classes animal excreta asindustrial wastes in waste statistics, but ani-mal excreta used as manure is classed asrecycling. Reduction of final disposal of thisindustrial waste is, thus, offset by dissipativeuse. Fertilizers and pesticides are intensivelyused in Japanese agriculture to enhance productivity and compensate for the limitedarea of available farmland.

WRI: THE WEIGHT OF NATIONS
82
Estimates of output flows to water arerough and incomplete, but they are relativelysmall as far as the quantity of solid materialsis concerned. Nevertheless, wastewater flowsshould be analyzed carefully, because theyare an important issue in Japanese environ-mental policy.
DPO to air accounts for about 90 percentof total DPO. DPO to land is decreasing notonly in terms of its relative share of totalDPO, but also in absolute amounts.
Soils excavated during construction activi-ties dominate domestic hidden flows. Someportion of excavated soil is moved out of theconstruction site, then dumped into landfillsor used for other purposes, while anotherportion remains within the same site (cutand fill). Only “surplus soil,” which meansthe soil excavated then moved out of the con-struction site to landfill or other sites forapplication, is quantified by official surveys.The total quantity of soil excavation by con-struction activities is much greater, becauseexcavation work is usually designed to bal-ance cut and fill, to use excavated soil on site,and minimize the generation of surplus soil.The total size of excavations may be a betterindicator of landscape alteration. However, asan indicator of output flows, we may differ-entiate the surplus soil from the excavatedsoil for on-site application. The former hasgreater environmental significance. For thisreason, these two types of soil are separatelyshown in the data sheet and Figure A5.
Hidden flows associated with mining activities are trivial in quantity, because ofthe limited resources of fossil fuels andmetal ores in Japan. Consequently, the
contribution of domestic hidden flows toTDO is relatively small, compared with moreresource-rich countries. It should be borne inmind that the small size of domestic hiddenflows is counterbalanced by imported hiddenflows associated with imported metals andenergy carriers; this represents the transferof Japan’s environmental burden to its tradepartners, which the study by Adriaanse et al.,1997 emphasized.
When disaggregated by economic activities,different sectors contribute to different typesof output flows. For DPO, the energy supplysector and the manufacturing sector are largecontributors because of their high levels ofCO2 emissions. In the case of TDO, the con-struction sector surpasses these two sectors,because of large amounts of excavated soil.(See Figure A6, Figure A7.)
Net additions of materials to stock (NAS)in the Japanese technosphere have fluctuatedin accordance with patterns of governmentaland private investment. NAS increased sig-nificantly in the late 1980s, then stabilized ata lower level in 1990. Because Japan has ashorter history of industrialization than otherWestern countries, construction work is stillactive and significantly contributes to thecountry’s overall picture of material flows. As much as 60 percent of direct materialinput (DMI) is added to the stock. This figurealso has a close relation with inputs of con-struction materials as well as with soil exca-vation. Increasing quantities of stock implythat demolition wastes will also increase inthe future. Currently, the government isattempting to encourage recycling of demoli-tion wastes.

WRI: THE WEIGHT OF NATIONS
83
0
0.2
0.4
0.6
0.8
1.0
1.2
1.4
1.6
1975 1980 1985 1990 1995
F I G U R E A 6 DPO BY ECONOMIC SECTOR, JAPAN 1975–1996
Other
Transport
Households
Mining, Manufacturing
Energy Supply
Construction/Infrastructure
Agriculture
0
0.5
1.0
1.5
2.0
2.5
3.0
1975 1980 1985 1990 1995
F I G U R E A 7 TDO BY ECONOMIC SECTOR, JAPAN 1975–1996
Other
Transport
Households
Mining, Manufacturing
Energy Supply
Construction/Infrastructure
Agriculture
Bil
lio
n M
etr
ic T
on
s B
illi
on
Metr
ic T
on
s
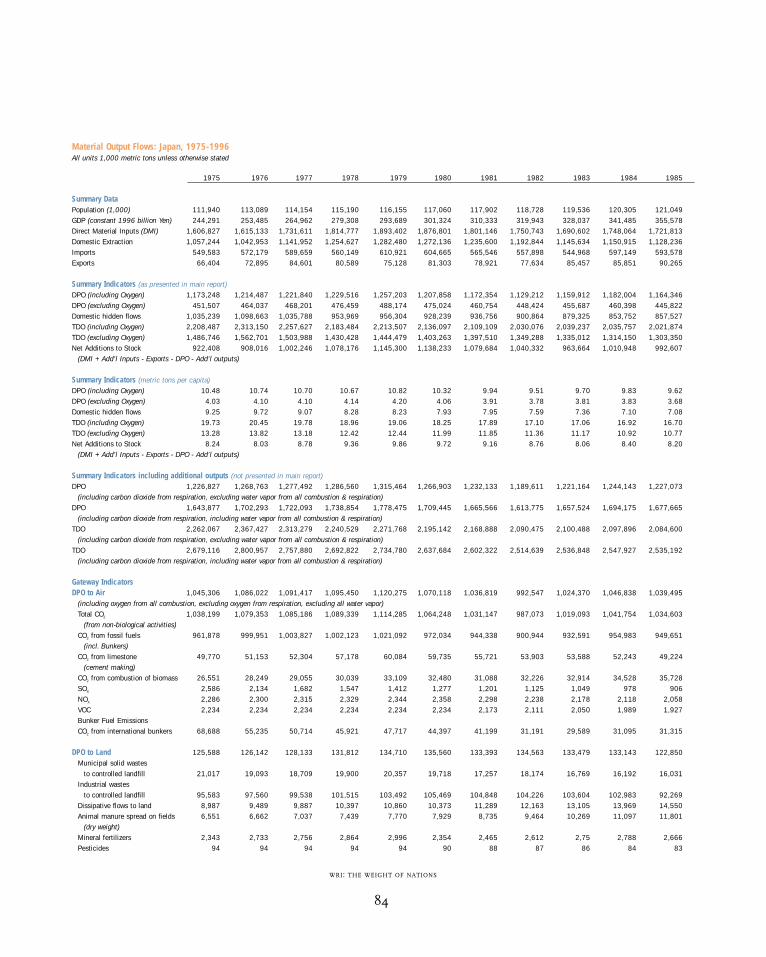
WRI: THE WEIGHT OF NATIONS
84
Material Output Flows: Japan, 1975-1996All units 1,000 metric tons unless otherwise stated
1975 1976 1977 1978 1979 1980 1981 1982 1983 1984 1985
Summary DataPopulation (1,000) 111,940 113,089 114,154 115,190 116,155 117,060 117,902 118,728 119,536 120,305 121,049GDP (constant 1996 billion Yen) 244,291 253,485 264,962 279,308 293,689 301,324 310,333 319,943 328,037 341,485 355,578Direct Material Inputs (DMI) 1,606,827 1,615,133 1,731,611 1,814,777 1,893,402 1,876,801 1,801,146 1,750,743 1,690,602 1,748,064 1,721,813Domestic Extraction 1,057,244 1,042,953 1,141,952 1,254,627 1,282,480 1,272,136 1,235,600 1,192,844 1,145,634 1,150,915 1,128,236Imports 549,583 572,179 589,659 560,149 610,921 604,665 565,546 557,898 544,968 597,149 593,578Exports 66,404 72,895 84,601 80,589 75,128 81,303 78,921 77,634 85,457 85,851 90,265
Summary Indicators (as presented in main report)DPO (including Oxygen) 1,173,248 1,214,487 1,221,840 1,229,516 1,257,203 1,207,858 1,172,354 1,129,212 1,159,912 1,182,004 1,164,346DPO (excluding Oxygen) 451,507 464,037 468,201 476,459 488,174 475,024 460,754 448,424 455,687 460,398 445,822Domestic hidden flows 1,035,239 1,098,663 1,035,788 953,969 956,304 928,239 936,756 900,864 879,325 853,752 857,527TDO (including Oxygen) 2,208,487 2,313,150 2,257,627 2,183,484 2,213,507 2,136,097 2,109,109 2,030,076 2,039,237 2,035,757 2,021,874TDO (excluding Oxygen) 1,486,746 1,562,701 1,503,988 1,430,428 1,444,479 1,403,263 1,397,510 1,349,288 1,335,012 1,314,150 1,303,350Net Additions to Stock 922,408 908,016 1,002,246 1,078,176 1,145,300 1,138,233 1,079,684 1,040,332 963,664 1,010,948 992,607
(DMI + Add’l Inputs - Exports - DPO - Add’l outputs)
Summary Indicators (metric tons per capita)DPO (including Oxygen) 10.48 10.74 10.70 10.67 10.82 10.32 9.94 9.51 9.70 9.83 9.62DPO (excluding Oxygen) 4.03 4.10 4.10 4.14 4.20 4.06 3.91 3.78 3.81 3.83 3.68Domestic hidden flows 9.25 9.72 9.07 8.28 8.23 7.93 7.95 7.59 7.36 7.10 7.08TDO (including Oxygen) 19.73 20.45 19.78 18.96 19.06 18.25 17.89 17.10 17.06 16.92 16.70TDO (excluding Oxygen) 13.28 13.82 13.18 12.42 12.44 11.99 11.85 11.36 11.17 10.92 10.77Net Additions to Stock 8.24 8.03 8.78 9.36 9.86 9.72 9.16 8.76 8.06 8.40 8.20
(DMI + Add’l Inputs - Exports - DPO - Add’l outputs)
Summary Indicators including additional outputs (not presented in main report)DPO 1,226,827 1,268,763 1,277,492 1,286,560 1,315,464 1,266,903 1,232,133 1,189,611 1,221,164 1,244,143 1,227,073
(including carbon dioxide from respiration, excluding water vapor from all combustion & respiration)DPO 1,643,877 1,702,293 1,722,093 1,738,854 1,778,475 1,709,445 1,665,566 1,613,775 1,657,524 1,694,175 1,677,665
(including carbon dioxide from respiration, including water vapor from all combustion & respiration)TDO 2,262,067 2,367,427 2,313,279 2,240,529 2,271,768 2,195,142 2,168,888 2,090,475 2,100,488 2,097,896 2,084,600
(including carbon dioxide from respiration, excluding water vapor from all combustion & respiration)TDO 2,679,116 2,800,957 2,757,880 2,692,822 2,734,780 2,637,684 2,602,322 2,514,639 2,536,848 2,547,927 2,535,192
(including carbon dioxide from respiration, including water vapor from all combustion & respiration)
Gateway IndicatorsDPO to Air 1,045,306 1,086,022 1,091,417 1,095,450 1,120,275 1,070,118 1,036,819 992,547 1,024,370 1,046,838 1,039,495
(including oxygen from all combustion, excluding oxygen from respiration, excluding all water vapor)Total CO2 1,038,199 1,079,353 1,085,186 1,089,339 1,114,285 1,064,248 1,031,147 987,073 1,019,093 1,041,754 1,034,603
(from non-biological activities)CO2 from fossil fuels 961,878 999,951 1,003,827 1,002,123 1,021,092 972,034 944,338 900,944 932,591 954,983 949,651
(incl. Bunkers)CO2 from limestone 49,770 51,153 52,304 57,178 60,084 59,735 55,721 53,903 53,588 52,243 49,224
(cement making)CO2 from combustion of biomass 26,551 28,249 29,055 30,039 33,109 32,480 31,088 32,226 32,914 34,528 35,728SOX 2,586 2,134 1,682 1,547 1,412 1,277 1,201 1,125 1,049 978 906NOX 2,286 2,300 2,315 2,329 2,344 2,358 2,298 2,238 2,178 2,118 2,058VOC 2,234 2,234 2,234 2,234 2,234 2,234 2,173 2,111 2,050 1,989 1,927Bunker Fuel EmissionsCO2 from international bunkers 68,688 55,235 50,714 45,921 47,717 44,397 41,199 31,191 29,589 31,095 31,315
DPO to Land 125,588 126,142 128,133 131,812 134,710 135,560 133,393 134,563 133,479 133,143 122,850Municipal solid wastes
to controlled landfill 21,017 19,093 18,709 19,900 20,357 19,718 17,257 18,174 16,769 16,192 16,031Industrial wastes
to controlled landfill 95,583 97,560 99,538 101,515 103,492 105,469 104,848 104,226 103,604 102,983 92,269Dissipative flows to land 8,987 9,489 9,887 10,397 10,860 10,373 11,289 12,163 13,105 13,969 14,550Animal manure spread on fields 6,551 6,662 7,037 7,439 7,770 7,929 8,735 9,464 10,269 11,097 11,801
(dry weight)Mineral fertilizers 2,343 2,733 2,756 2,864 2,996 2,354 2,465 2,612 2,75 2,788 2,666Pesticides 94 94 94 94 94 90 88 87 86 84 83

WRI: THE WEIGHT OF NATIONS
85
Material Output Flows: Japan, 1975-1996All units 1,000 metric tons unless otherwise stated
1986 1987 1988 1989 1990 1991 1992 1993 1994 1995 1996
Summary Data121,660 122,239 122,745 123,205 123,611 124,043 124,452 124,764 125,034 125,570 125,864 Population (1,000)366,737 384,181 407,133 425,238 448,834 462,070 463,823 466,038 469,056 483,150 504,391 GDP (constant 1996 billion Yen)
1,733,928 1,800,867 1,927,167 2,037,678 2,178,946 2,136,390 1,994,923 1,953,262 1,964,128 1,993,803 2,014,507 Direct Material Inputs (DMI)1,154,166 1,204,430 1,273,743 1,358,063 1,478,469 1,424,593 1,330,753 1,285,835 1,272,303 1,247,113 1,259,685 Domestic Extraction
579,762 596,438 653,424 679,615 700,477 711,797 664,170 667,427 691,825 746,691 754,822 Imports78,125 71,456 66,250 66,562 70,044 69,417 78,008 85,300 90,071 94,708 93,903 Exports
Summary Indicators (as presented in main report)1,159,296 1,205,142 1,262,996 1,308,752 1,342,746 1,369,576 1,376,895 1,358,031 1,411,440 1,415,875 1,406,548 DPO (including Oxygen)
450,608 463,371 482,035 495,894 498,512 509,322 509,271 496,541 507,560 499,566 496,254 DPO (excluding Oxygen)880,985 907,883 966,159 1,016,797 1,083,518 1,143,305 1,179,083 1,218,958 1,216,468 1,225,538 1,225,538 Domestic hidden flows
2,040,282 2,113,025 2,229,155 2,325,549 2,426,264 2,512,881 2,555,979 2,576,989 2,627,908 2,641,413 2,632,086 TDO (including Oxygen)1,331,593 1,371,254 1,448,194 1,512,691 1,582,030 1,652,627 1,688,355 1,715,500 1,724,028 1,725,105 1,721,792 TDO (excluding Oxygen)1,010,751 1,068,144 1,178,999 1,270,782 1,403,571 1,351,889 1,200,056 1,168,324 1,156,832 1,190,357 1,219,305 Net Additions to Stock
(DMI + Add’l Inputs - Exports - DPO - Add’l outputs)
Summary Indicators (metric tons per capita)9.53 9.86 10.29 10.62 10.86 11.04 11.06 10.88 11.29 11.28 11.18 DPO (including Oxygen)3.70 3.79 3.93 4.02 4.03 4.11 4.09 3.98 4.06 3.98 3.94 DPO (excluding Oxygen)7.24 7.43 7.87 8.25 8.77 9.22 9.47 9.77 9.73 9.76 9.74 Domestic hidden flows
16.77 17.29 18.16 18.88 19.63 20.26 20.54 20.65 21.02 21.04 20.91 TDO (including Oxygen)10.95 11.22 11.80 12.28 12.80 13.32 13.57 13.75 13.79 13.74 13.68 TDO (excluding Oxygen)
8.31 8.74 9.61 10.31 11.35 10.90 9.64 9.36 9.25 9.48 9.69 Net Additions to Stock(DMI + Add’l Inputs - Exports - DPO - Add’l outputs)
Summary Indicators including additional outputs (not presented in main report)1,222,694 1,268,843 1,326,952 1,372,888 1,407,058 1,434,020 1,441,744 1,423,016 1,476,101 1,480,059 1,470,366 DPO
(including carbon dioxide from respiration, excluding water vapor from all combustion & respiration)1,673,752 1,735,939 1,811,254 1,874,758 1,926,544 1,961,361 1,975,023 1,948,739 2,025,759 2,034,452 2,020,362 DPO
(including carbon dioxide from respiration, including water vapor from all combustion & respiration)2,103,679 2,176,726 2,293,111 2,389,685 2,490,577 2,577,325 2,620,827 2,641,974 2,692,569 2,705,597 2,695,904 TDO
(including carbon dioxide from respiration, excluding water vapor from all combustion & respiration)2,554,737 2,643,822 2,777,413 2,891,555 3,010,063 3,104,666 3,154,107 3,167,697 3,242,227 3,259,990 3,245,901 TDO
(including carbon dioxide from respiration, including water vapor from all combustion & respiration)
Gateway Indicators1,023,626 1,068,896 1,126,752 1,172,620 1,218,338 1,246,213 1,253,655 1,243,336 1,301,992 1,319,113 1,311,982 DPO to Air
(including oxygen from all combustion, excluding oxygen from respiration, excluding all water vapor)11,018,768 ,063,985 1,121,789 1,167,605 1,213,194 1,241,072 1,248,673 1,238,536 1,297,035 1,314,176 1,307,247 Total CO2
(from non-biological activities)935,010 978,460 1,030,789 1,070,648 1,114,181 1,136,910 1,147,209 1,139,252 1,196,053 1,212,703 1,210,793 CO2 from fossil fuels
(incl. Bunkers)46,893 46,662 50,617 52,614 55,152 61,065 58,431 56,617 56,923 56,960 58,087 CO2 from limestone
(cement making)36,865 38,863 40,383 44,342 43,860 43,096 43,034 42,667 44,060 44,513 38,368 CO2 from combustion of biomass
835 849 862 876 966 976 895 814 847 827 805 SOX
2,089 2,120 2,150 2,181 2,212 2,271 2,222 2,163 2,237 2,237 2,029 NOX
1,935 1,943 1,951 1,958 1,966 1,894 1,865 1,823 1,873 1,873 1,901 VOCBunker Fuel Emissions
27,432 26,496 25,955 27,973 29,986 32,189 32,668 35,839 37,053 36,817 31,587 CO2 from international bunkers
133,691 134,290 134,313 134,226 122,531 121,514 121,419 112,903 107,684 95,021 92,854 DPO to LandMunicipal solid wastes
16,023 16,490 16,900 17,490 16,809 16,379 15,296 14,959 14,142 13,602 13,093 to controlled landfillIndustrial wastes
102,872 102,979 102,680 101,975 91,145 90,601 91,503 83,324 79,207 68,035 66,554 to controlled landfill14,795 14,822 14,733 14,760 14,577 14,534 14,619 14,619 14,335 13,384 13,207 Dissipative flows to land11,994 12,049 12,088 12,083 12,043 12,091 12,159 12,139 11,899 11,115 11,018 Animal manure spread on fields
(dry weight)2,722 2,697 2,575 2,609 2,466 2,377 2,395 2,415 2,371 2,205 2,124 Mineral fertilizers
79 76 70 69 68 66 65 65 65 65 65 Pesticides

WRI: THE WEIGHT OF NATIONS
86
Material Output Flows: Japan, 1975-1996All units 1,000 metric tons unless otherwise stated
1975 1976 1977 1978 1979 1980 1981 1982 1983 1984 1985
DPO to Water 2,355 2,323 2,289 2,254 2,218 2,181 2,142 2,103 2,063 2,023 2,002Organic load (as COD) 1,339 1,316 1,293 1,269 1,244 1,218 1,191 1,165 1,138 1,111 1,093T-N 914 908 902 894 887 878 870 861 852 842 841T-P 102 98 95 91 88 84 81 77 73 70 68
Additional Inputs 1,025,861 1,068,072 1,077,329 1,082,842 1,105,501 1,052,180 1,023,026 980,998 1,016,042 1,042,909 1,038,724(not presented in main report)
Oxygen in combustion 986,894 1,028,598 1,036,855 1,041,355 1,063,129 1,009,239 979,550 937,071 971,496 997,717 993,105Oxygen in respiration 38,967 39,474 40,474 41,487 42,372 42,942 43,475 43,927 44,547 45,192 45,619
Additional Outputs 470,629 487,807 500,253 509,338 521,273 501,587 493,213 484,562 497,611 512,170 513,318(not presented in main report)
Water vapor from fossil combustion 321,384 336,431 341,632 346,737 354,318 335,419 325,369 311,102 324,325 335,666 334,263
Water vapor from biomass combustion 9,051 9,630 9,905 10,241 11,287 11,073 10,598 10,986 11,221 11,771 12,180
Water vapor from respiration 21,919 22,204 22,767 23,336 23,834 24,155 24,455 24,709 25,057 25,420 25,661Water included in DMI
as water contents of food & feed 64,695 65,265 70,297 71,980 73,571 71,897 73,012 77,366 75,757 77,174 78,489CO2 from respiration 53,580 54,276 55,652 57,044 58,262 59,045 59,779 60,399 61,252 62,139 62,726
Domestic Hidden Flows 1,035,239 1,098,663 1,035,788 953,969 956,304 928,239 936,756 900,864 879,325 853,752 857,527Excavated soil
by construction activities 984,388 1,048,942 986,430 906,699 909,487 881,809 890,430 856,652 835,279 810,620 790,518Surplus soil 414,358 422,507 430,655 438,803 446,951 455,100 458,008 460,917 463,826 466,735 469,644
(moved out of the site)Cut & Fill 570,029 626,435 555,776 467,896 462,536 426,710 432,422 395,735 371,453 343,886 320,875
Soil erosion 7,682 7,575 7,438 7,367 7,355 7,384 7,396 7,420 7,444 7,450 7,492Mining overburden 43,169 42,146 41,919 39,903 39,463 39,045 38,929 36,792 36,601 35,682 59,517
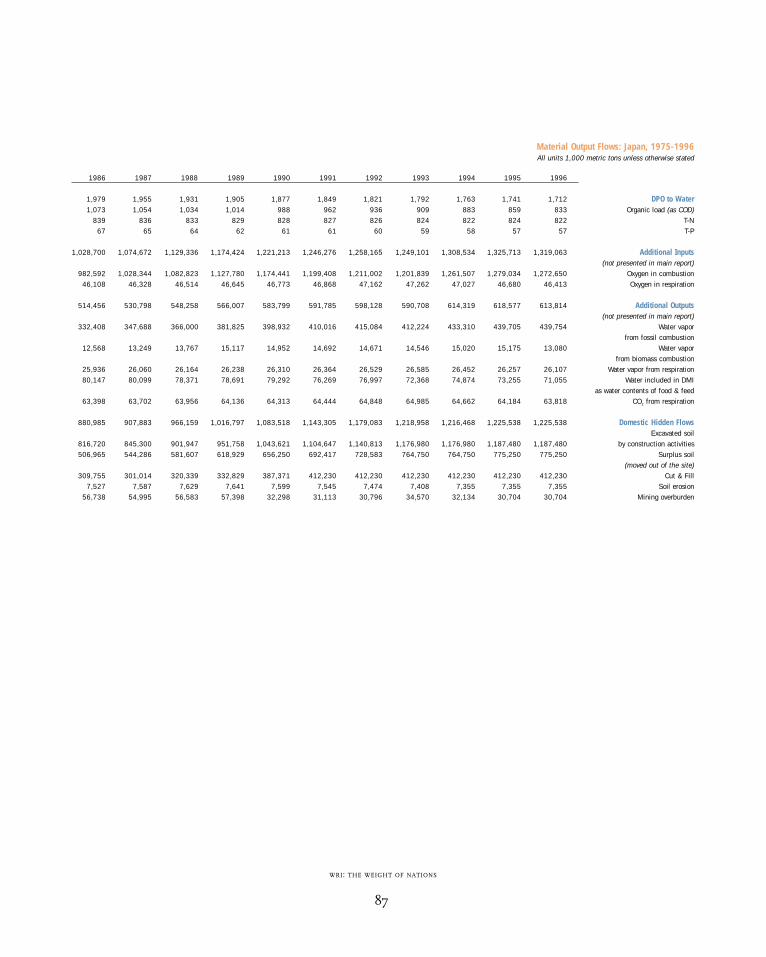
WRI: THE WEIGHT OF NATIONS
87
Material Output Flows: Japan, 1975-1996All units 1,000 metric tons unless otherwise stated
1986 1987 1988 1989 1990 1991 1992 1993 1994 1995 1996
1,979 1,955 1,931 1,905 1,877 1,849 1,821 1,792 1,763 1,741 1,712 DPO to Water1,073 1,054 1,034 1,014 988 962 936 909 883 859 833 Organic load (as COD)
839 836 833 829 828 827 826 824 822 824 822 T-N67 65 64 62 61 61 60 59 58 57 57 T-P
1,028,700 1,074,672 1,129,336 1,174,424 1,221,213 1,246,276 1,258,165 1,249,101 1,308,534 1,325,713 1,319,063 Additional Inputs(not presented in main report)
982,592 1,028,344 1,082,823 1,127,780 1,174,441 1,199,408 1,211,002 1,201,839 1,261,507 1,279,034 1,272,650 Oxygen in combustion46,108 46,328 46,514 46,645 46,773 46,868 47,162 47,262 47,027 46,680 46,413 Oxygen in respiration
514,456 530,798 548,258 566,007 583,799 591,785 598,128 590,708 614,319 618,577 613,814 Additional Outputs(not presented in main report)
332,408 347,688 366,000 381,825 398,932 410,016 415,084 412,224 433,310 439,705 439,754 Water vaporfrom fossil combustion
12,568 13,249 13,767 15,117 14,952 14,692 14,671 14,546 15,020 15,175 13,080 Water vaporfrom biomass combustion
25,936 26,060 26,164 26,238 26,310 26,364 26,529 26,585 26,452 26,257 26,107 Water vapor from respiration80,147 80,099 78,371 78,691 79,292 76,269 76,997 72,368 74,874 73,255 71,055 Water included in DMI
as water contents of food & feed63,398 63,702 63,956 64,136 64,313 64,444 64,848 64,985 64,662 64,184 63,818 CO2 from respiration
880,985 907,883 966,159 1,016,797 1,083,518 1,143,305 1,179,083 1,218,958 1,216,468 1,225,538 1,225,538 Domestic Hidden FlowsExcavated soil
816,720 845,300 901,947 951,758 1,043,621 1,104,647 1,140,813 1,176,980 1,176,980 1,187,480 1,187,480 by construction activities506,965 544,286 581,607 618,929 656,250 692,417 728,583 764,750 764,750 775,250 775,250 Surplus soil
(moved out of the site)309,755 301,014 320,339 332,829 387,371 412,230 412,230 412,230 412,230 412,230 412,230 Cut & Fill
7,527 7,587 7,629 7,641 7,599 7,545 7,474 7,408 7,355 7,355 7,355 Soil erosion56,738 54,995 56,583 57,398 32,298 31,113 30,796 34,570 32,134 30,704 30,704 Mining overburden

WRI: THE WEIGHT OF NATIONS
88
Data Sources and Methodology:Technical Notes
Japanese data were drawn from official statis-tical sources of various ministries and agen-cies as well as from academic literature andpersonal communications with experts.Official sources include Environment Agency(EA), Ministry of Agriculture, Forestry andFisheries (MAFF), Ministry of InternationalTrade and Industry (MITI), Ministry ofHealth and Welfare (MHW), and Ministry ofConstruction (MOC). Most of the Japanesedata are presented on a fiscal year basisrather than calendar year.
DMO to Air
Carbon Dioxide and Water Vapor Emissions,and Oxygen Input
Inventories of CO2 emissions have been offi-cially reported based on the United NationsFramework Convention for Climate Change(UNFCCC) using Intergovernmental Panelon Climate Change (IPCC) guidelines forgreenhouse gas (GHG) emissions andJapanese country-specific methodologies.However, this official inventory is notenough to provide a complete balance ofCO2, oxygen, and water vapor. The officialinventories do not cover CO2 that is not con-tributing to the greenhouse effect, namely,from digestion of food or feed by animals(including human beings). Therefore, emis-sions of CO2, water, and extra inputs of oxy-gen for oxidation of carbon and hydrogenwere newly estimated for this study. Resultswere compared with official inventories toprove that both data sets coincide with eachother within acceptable margins of error (lessthan a few percent). The outline of our esti-mation method is as follows: for fossil fuels,
carbon and hydrogen, contents were assumedby type of fuels; for example, 0.85, 0.12 forcrude oil; 0.865, 0.125 for petroleum prod-ucts; 0.76, 0.055 for coking coal; 0.645, 0.05for fuel coal; 0.75, 0.25 for natural gas. Usingsuch fractions, CO2 and water produced andoxygen taken in by combustion of fuels wereestimated stochiometrically.
Emissions from incinerating fuels used forinternational transport (heavy oil for naviga-tion, and jet fuel for aviation) were includedas a part of the transport sector’s activities.CO2 and water from biofuels (as in the caseof the paper and pulp industry) as well asthose from waste incineration, were estimatedby applying the same procedure and listed inthe dataset separately. CO2 originating fromlimestone for cement and other industrialactivities was estimated by applying the samemethodology as the official inventory, namelyas a product of the carbon fraction of lime-stone and apparent consumption of lime-stone for various activities.
Human respiration was calculated on thebasis of an average CO2 production of 0.3metric tons per capita per year. The respira-tion of livestock was calculated on the basisof the number of cattle, pigs, poultry, andother animals (MAFF) and exhalation factorsfor each animal (Wuppertal Institute, exceptfor cattle data). Factors applied in tons ofCO2 per year were as follows: cattle 1.6, pigs0.327, poultry 0.027, sheep/goats 0.254, andhorses 1.33. Material balances among feedintake, exhalation, and excreta validate theseestimates. For example, as much as one thirdof feed intake by cattle is not digested butvoided as excreta. To cross check, the amountof excreta estimated from feed inputs wascompared with the amount of animal manurein industrial wastes.

WRI: THE WEIGHT OF NATIONS
89
Sulfur Dioxide, Oxides of Nitrogen, and Non-Methane Volatile Organic Compounds
The data for SO2, NOx, and NMVOC to airsince 1990 were drawn from official GHGinventories. Before 1990, emissions of SO2and NOx were reported only in internationalliterature (OECD) or documents coveringonly short time intervals. Emissions ofNMVOC before 1990 were not published;only unofficial estimates are available.Although certain inconsistencies exist amongdata before and after 1990, no correction wasapplied, time-series data were simply quotedfrom multiple data sources. Moreover,although a considerable percentage ofNMVOC originates from dissipative use ofproducts (e.g., solvents and paints), they arenot categorized in the Japanese dataset asdissipative uses, but as outputs to air.
Another problem is that these inventoriescover only emissions from sources on landand from navigation along Japanese coastalareas, even though Japan’s heavy dependenceon resource imports is accompanied by emis-sions from vessels far from Japanese terri-tory. Given that the emission factors of SOxand NO2 per unit fuel consumption forocean-going vessels are high (IPCC), the fig-ures in this report are certainly underesti-mates. SO2 and NOx originating from inter-national bunker oil will have to be added infuture analyses, which will result in signifi-cant changes to the data presented here.
DMO to Land
Waste Disposal to Controlled Landfills
Data on wastes generated, treated, recycled ordisposed at landfill sites were available formunicipal solid wastes and industrial wastes
respectively, from MHW. Industrial wastesare subdivided into 19 types: embers; sludge;waste oil; waste acid; waste alkali; waste plas-tics; waste paper; wood debris; waste fiber;animal and plant residues; waste rubber;metal scrap; glass and ceramic debris; slag;construction scrap wood; livestock excreta;animal corpses; soot and dust; and others.The total amounts of each type of wastesfrom all industries and the total amounts ofall wastes from each type of industries areavailable in time series. However, cross tabu-lation between the waste type and the indus-try type is available only for 1993. The struc-ture of this year was extrapolated to estimateall time series, assuming that the proportionof each industry’s contribution to the genera-tion of a specific type of industrial wastes isconstant for all time series.
DMO to Water
Discharges of organic loads (COD) and nutrients (N, P) have been surveyed only forthe drainage areas of three major closedwaters (Tokyo Bay, Ise Bay, and Seto InlandSea), where an area-wide total pollutant loadcontrol scheme has been applied. Althoughsurveys of nutrients (N, P) were also appliedto basins of major lakes and reservoirs,there is no nationwide survey. Therefore,results from these limited surveys wereextrapolated, assuming that discharges percapita in nonsurveyed areas are the same asthose in surveyed areas. Although populationwithin the above-mentioned three major surveyed areas covers about 53 percent of thenational total, there are considerable differ-ences in land use, industrial structure, anddischarge management between surveyedareas and nonsurveyed areas. Therefore,these results should be considered roughestimates.
WRI: THE WEIGHT OF NATIONS
90
Dissipative Use
Animal Manure
Data on livestock excreta are available from asurvey of industrial wastes, in which genera-tion amounts as well as reuse amounts arereported. The quantities reused can beinferred as manure application, althoughthey are reported on a fresh (wet) weightbasis. On the other hand, amounts of faecesand urine from typical livestock categoriesare estimated both on a dry and wet weightbasis by applying their emission factors peranimal head. The dry to wet ratio calculatedfrom this estimate was combined with theabove statistics on reused amounts to esti-mate manure application in dry weight.
Fertilizers and Pesticides
Time series of used amounts of N, P, and Kfertilizers were taken from the statistics ofMAFF, in which figures are expressed asP2O5, N, and K2O. In addition, used amountsof lime were estimated, using the consump-tion data of lime-containing fertilizers.Limited time series for data pesticides use inJapan are available from internationalsources (OECD). Interpolation was appliedwhen necessary.
Domestic Hidden Flows
All data for hidden flows were taken fromour previous report (Adriaanse et al., 1997)and updated when necessary by applying thesame methodology. MOC officially surveyedonly excavated soils removed from construc-tion sites (surplus soils). The total size of theexcavation was estimated based on variousstudies in the literature including environ-mental impact assessment statements, landdevelopment statistics, excavation volumes
announced for highway construction workcontractors, among others, resulting in veryrough and preliminary estimates. Soil exca-vated and used within the same site (cut andfill) was estimated only for new residentialarea development, by multiplying the factorof soil excavation works per unit area (aver-age of several recent cases) by total area ofnew residential area development.
Contribution of Economic Sectors
DPO was attributed to seven economic activ-ity categories (sectors): construction andinfrastructure; mining and manufacturing;energy supply; households; agriculture;transport, and other. Other generally refersto service industries. Emissions of CO2 to airfrom fuel combustion were attributed byenergy balance tables. CO2 from oil con-sumption for international navigation andaviation was included in the transport sector.CO2 from waste incineration was attributedto other. Because of the limited data avail-ability in time series, all of SO2 and NOxemissions were attributed to the energy sec-tor. VOC emissions were included in themanufacturing sector, although they couldhave been attributed to other sectors, givenmore sophisticated data handling.
Municipal solid wastes were attributed tohouseholds, although they sometimes includewastes from small-sized service industries.Industrial wastes were attributed to the sec-tor corresponding to the type of wastes,using sector versus waste type cross tabula-tion. Such a cross tabulation is available onlyfor a single year (1993); the proportion ofthis year was extrapolated to all time series.
Discharges to water were originally reportedas arising from three source categories:

WRI: THE WEIGHT OF NATIONS
91
municipal, industrial, and others. They wereassumed to correspond respectively to house-holds, industry, and agriculture in this study.Dissipative uses of manure, fertilizers, andpesticides were included in the agriculturesector. In terms of hidden flows for calculat-
ing TDO by sector, soil excavation was attrib-uted to the construction/infrastructure sec-tor, mining overburden was attributed to themining and manufacturing sector, and soilerosion to the agriculture sector.
Adriaanse, A., S. Bringezu, A. Hammond, Y.Moriguchi, E. Rodenburg, D. Rogich, H. Schütz1997. Resource Flows: The Material Basis ofIndustrial Economies. Washington, D.C.: WorldResources Institute.
Agency of Natural Resources and Energy 1998:Energy Balance Table (in Comprehensive EnergyStatistics 1997 edition). Tokyo: Tsuushou-SangyouKenkyuu Sha. Environment Agency 1999. Qualityof the Environment in Japan (1999 Japanese edi-tion). Tokyo: Printing Office of the Ministry ofFinance.
The Government of Japan. 1997. Japan’s SecondNational Communication under the United NationsFramework Convention on Climate Change. Tokyo:The Government of Japan.
IPCC. 1997. Greenhouse Gas Inventory ReferenceManual, Revised 1996 IPCC Guidelines for NationalGreenhouse Gas Inventories, Volume 3. Bracknell:IPCC/WG1/TSU Hadley Centre.
Ministry of Agriculture, Forestry and Fisheries(MAFF): 1999: Pocket Statistics on Agriculture,Forestry and Fisheries. Tokyo: Nourin ToukeiKyoukai.
Ministry of Construction (MOC) 1992: Census for By-Products from Construction Activities in 1990.Tokyo: Ministry of Construction.
Ministry of Health and Welfare (MHW). Annualpublication until 1996: Wastes in Japan. Tokyo:Zenkoku Toshi Seisou Kaigi.
Ministry of International Trade and Industry (MITI),annual publication for 1976–1997: Yearbook ofMining, Non-Ferrous Metals and Products Statistics.Tokyo: Tsuusan Toukei Kyoukai.
Organisation for Economic Cooperation andDevelopment (OECD). 1989, 1995, 1997.Environmental Data Compendium. Paris: OECD.Wuppertal Institute. June 25 and December 7,1999. Personal communication by e-mail.
The author would like to acknowledge the valuable assistance of Mr. Masaya Yoshida in preparing thiscountry report.
R E F E R E N C E S
A C K N O W L E D G M E N T

WRI: THE WEIGHT OF NATIONS
92
Highlights
Figure A1 shows domestic processed output(DPO) and total domestic output (TDO) forthe Netherlands. Figure A2 shows DPO andTDO per capita, and Figure A3 shows DPOand TDO per constant units of GDP. All indi-cators are presented exclusive of water vapor,unless otherwise indicated.
From 1975 to 1996, the changes in bothDPO and TDO were minor. DPO per capitaremained relatively constant, while the Dutchpopulation grew slightly, which is the reasonfor the slight increase in overall DPO. Due to
a reduction in hidden flows, TDO per capitahas decreased slightly, resulting in a roughlyconstant TDO.
Figure A3 shows that the stream of wasteand emissions remained relatively constant,while per capita income grew significantly.Therefore, TDO and DPO per constant unitof GDP decreased steadily between 1975 and1996. Figure A4 specifies the contribution ofvarious output flows to TDO.
It appears that TDO can effectively be char-acterized by a limited number of key outputflows. As is the case in the other countries,
M A T E R I A L F L O W S : T H E N E T H E R L A N D S René Kleijn, Ester van der Voet
1975 1980 1985 1990 1995
0
100
200
300
400
500
600
F I G U R E A 1 DPO AND TDO, NETHERLANDS 1975–1996
TMO
DMO
Mil
lio
n M
etr
ic T
on
s

WRI: THE WEIGHT OF NATIONS
93
1975 1980 1985 1990 1995
0
5
10
15
20
25
30
F I G U R E A 2 DPO AND TDO PER CAPITA, NETHERLANDS 1975–1996
Metr
ic T
on
s P
er
Cap
ita
1975 1980 1985 1990 1995
0.0
0.1
0.2
0.3
0.4
0.5
0.6
0.7
0.8
0.9
1.0
F I G U R E A 3 DPO AND TDO PER CONSTANT UNIT OF GDP, NETHERLANDS 1975–1996
Kg
Per
Du
tch
Gu
ild
er
TMO/Capita
DMO/Capita
TMO/Capita
DMO/Capita

WRI: THE WEIGHT OF NATIONS
94
TDO in the Netherlands is dominated byemissions to air. The largest contributor toTDO is carbon dioxide (CO2). The contribu-tion of CO2 emissions to TDO has increased.This is counterbalanced by a decrease ofother outputs, keeping the total TDO more orless constant. DPO to land, of which themain component is landfill of final waste,has decreased steadily over the years. DPO towater is negligible compared to the other out-flows. Another large flow in the category ofdissipative use is spread manure. This is atypically Dutch problem, associated with theintensive stock breeding practiced in theNetherlands, and this issue is treated later inmore detail. Domestic hidden flows consti-tute roughly one third of total TDO and theyappear to have decreased during the study
period. Reductions in two major flows arelargely responsible for this decrease: dredgedsediments and soil excavation for construc-tion activities. The flow associated withdredging of sediments, which is another typi-cally Dutch problem, will be addressed later.The soil excavation hidden flow dropped significantly from 1975 to 1996. This can beexplained by the level of road building: con-struction of the highway network was still infull progress in 1975, but had slowed signifi-cantly by 1996.
Dredged Sediments
The country’s location in the Rhine andMeuse delta has shaped the Dutch economyas an important transportation center.
0
100
200
300
400
1975 1980 1985 1990 1995
F I G U R E A 4 TOTAL DOMESTIC OUTPUT, NETHERLANDS 1975–1996
Other
Dredged Sediments
Moved Soil for Construction
Manure
Landfilled Waste
Other Air
CO2
Mil
lio
n M
etr
ic T
on
s
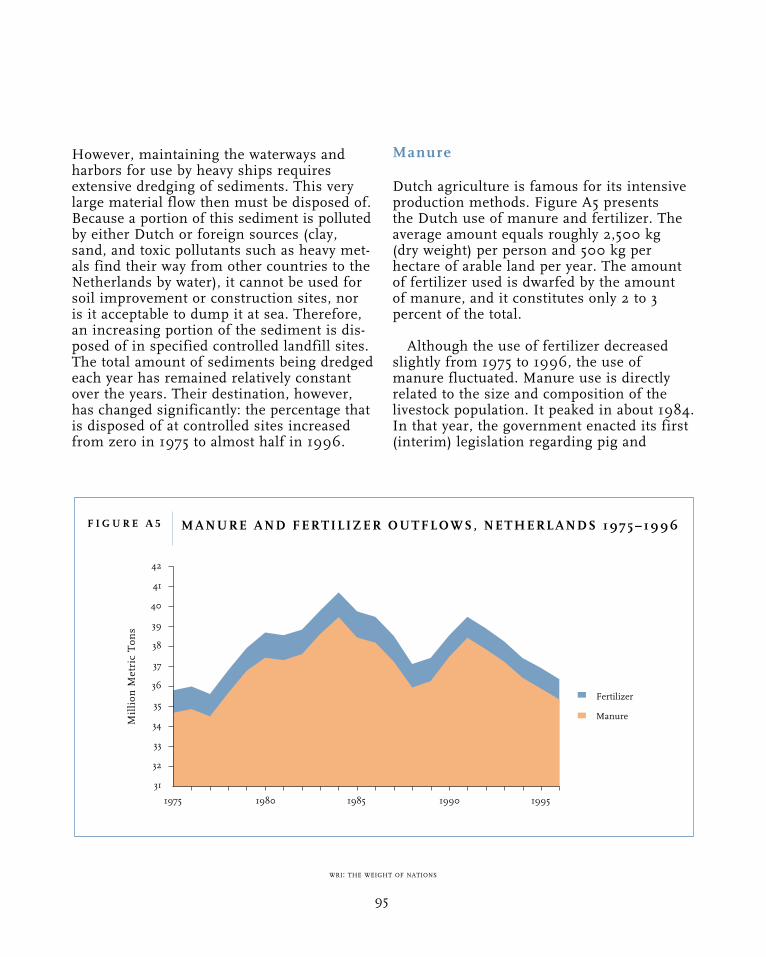
WRI: THE WEIGHT OF NATIONS
95
However, maintaining the waterways andharbors for use by heavy ships requiresextensive dredging of sediments. This verylarge material flow then must be disposed of.Because a portion of this sediment is pollutedby either Dutch or foreign sources (clay,sand, and toxic pollutants such as heavy met-als find their way from other countries to theNetherlands by water), it cannot be used forsoil improvement or construction sites, noris it acceptable to dump it at sea. Therefore,an increasing portion of the sediment is dis-posed of in specified controlled landfill sites.The total amount of sediments being dredgedeach year has remained relatively constantover the years. Their destination, however,has changed significantly: the percentage thatis disposed of at controlled sites increasedfrom zero in 1975 to almost half in 1996.
Manure
Dutch agriculture is famous for its intensiveproduction methods. Figure A5 presents the Dutch use of manure and fertilizer. Theaverage amount equals roughly 2,500 kg (dry weight) per person and 500 kg perhectare of arable land per year. The amountof fertilizer used is dwarfed by the amount of manure, and it constitutes only 2 to 3 percent of the total.
Although the use of fertilizer decreasedslightly from 1975 to 1996, the use ofmanure fluctuated. Manure use is directlyrelated to the size and composition of thelivestock population. It peaked in about 1984.In that year, the government enacted its first(interim) legislation regarding pig and
1975 1980 1985 1990 1995
31
32
33
34
35
36
37
38
39
40
41
42
F I G U R E A 5 MANURE AND FERTILIZER OUTFLOWS, NETHERLANDS 1975–1996
Fertilizer
Manure
Mil
lio
n M
etr
ic T
on
s
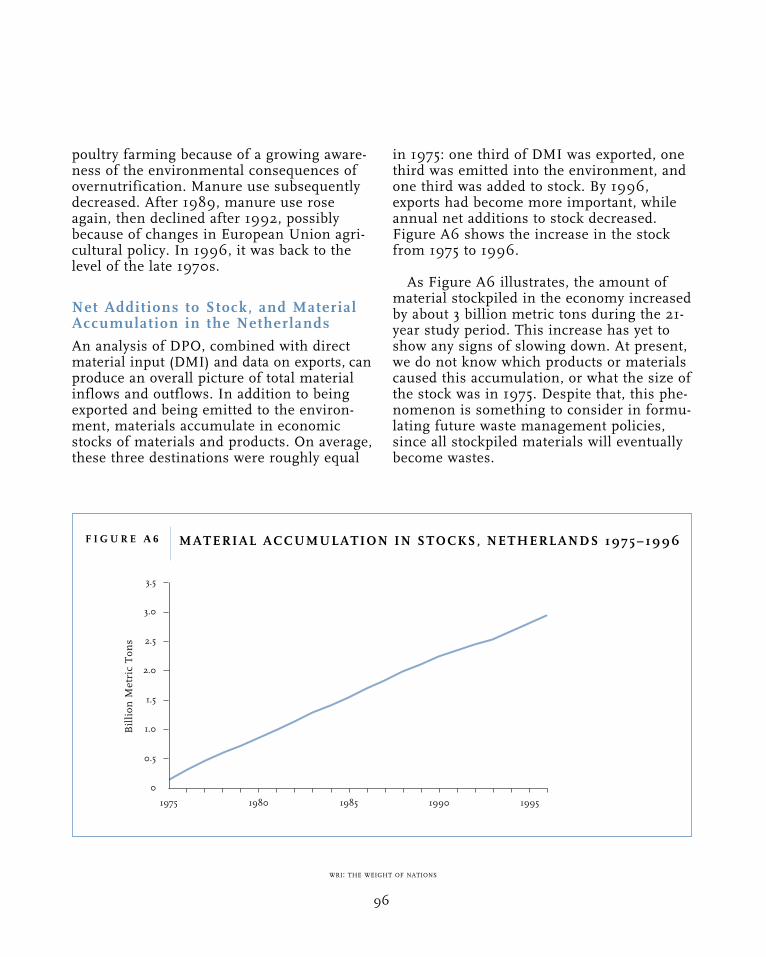
WRI: THE WEIGHT OF NATIONS
96
1975 1980 1985 1990 1995
0
0.5
1.0
1.5
2.0
2.5
3.0
3.5
F I G U R E A 6 MATERIAL ACCUMULATION IN STOCKS, NETHERLANDS 1975–1996
Bil
lio
n M
etr
ic T
on
s
poultry farming because of a growing aware-ness of the environmental consequences ofovernutrification. Manure use subsequentlydecreased. After 1989, manure use roseagain, then declined after 1992, possiblybecause of changes in European Union agri-cultural policy. In 1996, it was back to thelevel of the late 1970s.
Net Additions to Stock, and MaterialAccumulation in the Netherlands
An analysis of DPO, combined with directmaterial input (DMI) and data on exports, canproduce an overall picture of total materialinflows and outflows. In addition to beingexported and being emitted to the environ-ment, materials accumulate in economicstocks of materials and products. On average,these three destinations were roughly equal
in 1975: one third of DMI was exported, onethird was emitted into the environment, andone third was added to stock. By 1996,exports had become more important, whileannual net additions to stock decreased.Figure A6 shows the increase in the stockfrom 1975 to 1996.
As Figure A6 illustrates, the amount ofmaterial stockpiled in the economy increasedby about 3 billion metric tons during the 21-year study period. This increase has yet toshow any signs of slowing down. At present,we do not know which products or materialscaused this accumulation, or what the size ofthe stock was in 1975. Despite that, this phe-nomenon is something to consider in formu-lating future waste management policies,since all stockpiled materials will eventuallybecome wastes.

WRI: THE WEIGHT OF NATIONS
97
The Contribution of Economic Sectors
Table A1 shows the contributions of the sixmain economic sectors to Dutch TDO andDPO. Construction and infrastructure appearto be the odd ones out. Their contribution toTDO is large, but to DPO minor. Comparingthe accounts with and without oxygen, thedifference is much less for this sector thanfor the others; construction and infrastruc-
ture activity appears to be oxygen-extensive.Both phenomena are due to the large buthidden flows (in which oxygen plays only asmall role), which are allocated almost entirely to this activity. With oxygen, the con-tribution of the remaining sectors (apartfrom “others”) is in the same order of magni-tude. Without oxygen, agriculture appears asthe largest contributor to DPO and the sec-ond largest to TDO.
Construction/infrastructure 105,986,018 6,874,200
Manufacturing/Industry 57,350,171 57,350,171
Energy Utilities 45,398,689 45,398,689
Household 46,952,636 46,952,636
Agriculture 65,867,555 65,117,555
Transport 61,087,801 61,087,801
Other 19,060,552 19,060,552
Construction/infrastructure 102,117,948 3,006,130
Manufacturing/Industry 18,122,478 18,122,478
Energy Utilities 12,404,351 12,404,351
Household 14,038,112 14,038,112
Agriculture 45,392,927 44,642,927
Transport 17,093,404 17,093,404
Other 5,864,219 5,864,219
TABLE A1 CONTRIBUTION OF MAJOR ECONOMIC SECTORS TO TDO AND DPOIN THE NETHERLANDS, 1996
Sector TDO (Incl. Oxygen)Metric tons
DPO (Incl. Oxygen)Metric tons
TDO (Exc. Oxygen)Metric tons
DPO (Exc. Oxygen)Metric tons
Notes: These data do not sum to DPO and TDO as presented in the Dutch data table (see page 98) because of use of data from other datasets, DPO
totals differ by up to 10 percent.

WRI: THE WEIGHT OF NATIONS
98
Material Output Flows: The Netherlands, 1975-1996All units in metric tons unless otherwise stated
1975 1976 1977 1978 1979 1980 1981 1982 1983 1984 1985
Summary DataPopulation 13,599,000 13,734,000 13,814,000 13,898,000 13,986,000 14,091,000 14,209,000 14,286,000 14,340,000 14,395,000 14,454,000GDP (constant 1996
thousand Guilders) 412,996,404 432,820,232 442,775,097 453,401,699 463,376,537 468,937,055 466,592,370 460,993,261 468,830,147 484,301,542 499,314,889Direct Material Input 405,146,844 404,619,658 404,092,472 403,565,286 403,038,100 402,510,914 397,881,022 397,353,836 396,826,650 396,299,464 395,772,278
(DMI)DMI 521,653,000 550,459,000 559,214,000
(Adriaanse et al, 1997)Domestic Extraction 197,021,789 199,724,857 190,417,857Imports 197,381,055 161,305,820 187,932,687 186,157,731 198,917,055 192,364,757 175,532,589 174,896,932 178,172,043 185,815,165 195,362,821Exports 138,005,129 120,172,078 138,507,258 147,668,642 158,937,263 152,800,676 146,272,778 137,274,571 145,644,317 148,567,223 153,366,251
Summary Indicators (as presented in main report)DPO (including oxygen) 242,553,233 248,124,689 250,429,355 252,481,452 246,858,430 246,311,538 240,710,505 231,610,546 225,297,832 228,352,275 238,731,789DPO (excluding oxygen) 104,105,673 106,248,827 107,034,205 108,879,460 108,538,010 108,619,470 106,363,720 103,435,734 101,807,205 103,275,678 105,339,832Domestic hidden flows 133,790,000 130,658,600 127,527,200 124,395,800 121,264,400 118,133,000 116,039,000 113,945,000 111,851,000 110,166,091 108,481,182TDO (including oxygen) 376,343,233 378,783,289 377,956,555 376,877,252 368,122,830 364,444,538 356,749,505 345,555,546 337,148,832 338,518,366 347,212,971TDO (excluding oxygen) 237,895,673 236,907,427 234,561,405 233,275,260 229,802,410 226,752,470 222,402,720 217,380,734 213,658,205 213,441,769 213,821,014Net Additions to Stock 152,996,503 167,139,985 147,915,906 136,143,459 124,245,750 130,724,985 135,789,569 147,906,128 140,526,829 135,127,323 127,518,295
Summary Indicators (metric tons per capita)DPO (including oxygen) 17.84 18.07 18.13 18.17 17.65 17.48 16.94 16.21 15.71 15.86 16.52DPO (excluding oxygen) 7.66 7.74 7.75 7.83 7.76 7.71 7.49 7.24 7.10 7.17 7.29Domestic hidden flows 9.84 9.51 9.23 8.95 8.67 8.38 8.17 7.98 7.80 7.65 7.51TDO (including oxygen) 27.67 27.58 27.36 27.12 26.32 25.86 25.11 24.19 23.51 23.52 24.02TDO (excluding oxygen) 17.49 17.25 16.98 16.78 16.43 16.09 15.65 15.22 14.90 14.83 14.79Net Additions to Stock 11.25 12.17 10.71 9.80 8.88 9.28 9.56 10.35 9.80 9.39 8.82
Summary Indicators including additional outputs (not presented in main report)DPO 264,130,776 269,835,261 271,985,269 274,648,228 269,600,284 269,408,916 263,785,950 254,859,685 249,064,829 252,550,118 262,447,316
(including carbon dioxide from respiration, excluding water vapor from all combustion & respiration)DPO 354,486,632 369,364,169 367,701,194 372,511,752 371,453,985 362,700,958 348,880,546 333,496,317 328,699,518 336,513,276 348,378,419
(including carbon dioxide from respiration, including water vapor from all combustion & respiration)TDO 397,920,776 400,493,861 399,512,469 399,044,028 390,864,684 387,541,916 379,824,950 368,804,685 360,915,829 362,716,209 370,928,498
(including carbon dioxide from respiration, excluding water vapor from all combustion & respiration)TDO 488,276,632 500,022,769 495,228,394 496,907,552 492,718,385 480,833,958 464,919,546 447,441,317 440,550,518 446,679,367 456,859,601
(including carbon dioxide from respiration, including water vapor from all combustion & respiration)
Gateway IndicatorsDPO to Air 191,692,277 196,382,145 198,447,121 198,707,482 191,421,276 190,549,724 185,885,453 177,350,682 170,864,746 173,039,243 184,439,190
(including oxygen from all combustion, excluding oxygen from respiration, excluding all water vapor)CO2 from fossil
fuel combustion 187,975,145 192,761,843 194,923,648 195,280,838 188,091,461 187,300,261 182,813,898 174,423,759 168,059,145 170,240,335 181,730,754SO2 402,219 421,713 441,207 460,701 480,195 499,689 473,779 400,985 305,982 273,904 243,059NOX 467,179 488,630 510,081 531,532 552,983 574,434 567,215 553,808 546,589 566,184 569,278NMVOC 612,364 601,395 590,427 579,459 568,491 574,000 545,000 543,250 541,500 542,750 534,000CO 2,173,840 2,040,440 1,907,040 1,773,640 1,640,240 1,506,840 1,393,160 1,349,080 1,343,280 1,349,080 1,300,360Fine particles 61,530 68,124 74,718 81,312 87,906 94,500 92,400 79,800 68,250 66,990 61,740Bunker Fuel EmissionsCO2 from bunkers 38,635,145 40,685,843 40,111,648 37,732,838 27,807,461 24,280,261 23,213,898 22,803,759 20,999,145 18,620,335 19,850,754
DPO to Land 49,067,057 49,995,182 50,281,411 52,119,684 53,829,406 54,200,605 53,310,381 52,791,731 53,011,491 53,937,976 53,032,599Municipal landfill 13,038,925 13,774,982 14,443,739 15,101,900 15,706,998 15,302,826 14,544,915 13,728,275 12,984,841 12,997,466 13,040,855Landfilled sewage sludge 90,000 90,000 90,113 62,467 60,409 61,204 62,000 63,000 61,000 66,000 54,000Dissipative flows to land 35,938,131 36,130,200 35,747,559 36,955,317 38,061,999 38,836,575 38,703,466 39,000,457 39,965,650 40,874,510 39,937,744Fertilizers 1,120,714 1,132,817 1,121,627 1,137,778 1,142,341 1,261,944 1,247,976 1,227,897 1,174,762 1,243,413 1,309,325Pesticides 21,178 21,305 21,431 21,558 21,685 21,812 21,938 22,065 22,192 22,319 23,042Animal manure
spread on fields 34,698,289 34,878,127 34,511,199 35,694,022 36,801,612 37,452,638 37,329,552 37,630,495 38,644,696 39,481,779 38,464,377Sewage sludge
spread on fields 97,950 97,950 93,302 101,958 96,361 100,181 104,000 120,000 124,000 127,000 141,000
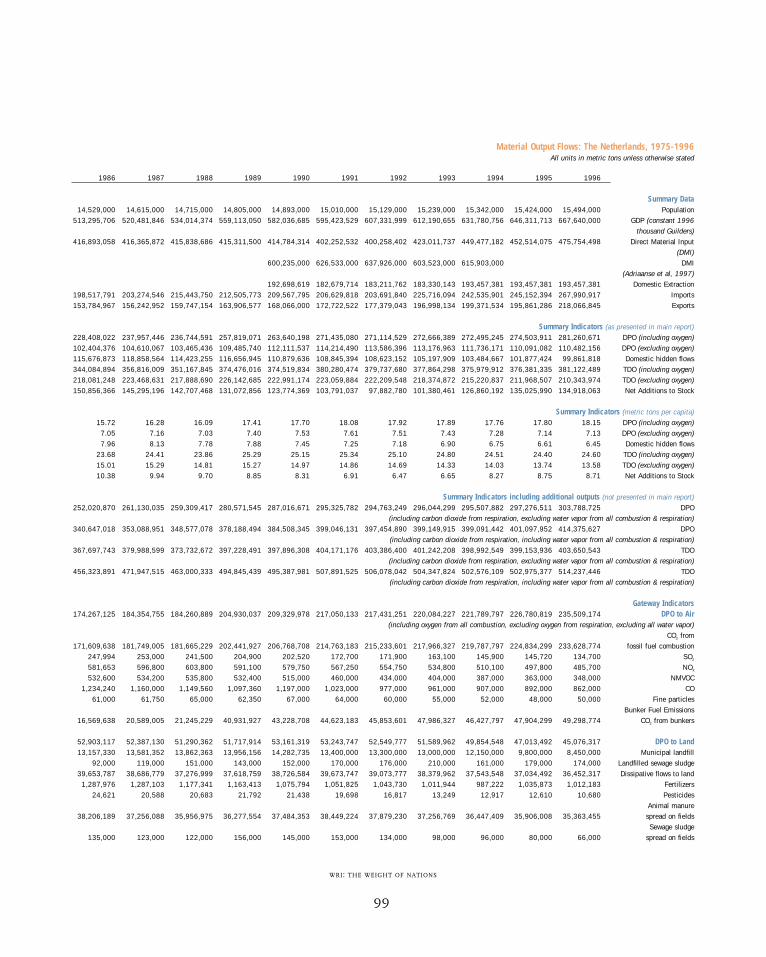
WRI: THE WEIGHT OF NATIONS
99
Material Output Flows: The Netherlands, 1975-1996All units in metric tons unless otherwise stated
1986 1987 1988 1989 1990 1991 1992 1993 1994 1995 1996
Summary Data14,529,000 14,615,000 14,715,000 14,805,000 14,893,000 15,010,000 15,129,000 15,239,000 15,342,000 15,424,000 15,494,000 Population
513,295,706 520,481,846 534,014,374 559,113,050 582,036,685 595,423,529 607,331,999 612,190,655 631,780,756 646,311,713 667,640,000 GDP (constant 1996 thousand Guilders)
416,893,058 416,365,872 415,838,686 415,311,500 414,784,314 402,252,532 400,258,402 423,011,737 449,477,182 452,514,075 475,754,498 Direct Material Input(DMI)
600,235,000 626,533,000 637,926,000 603,523,000 615,903,000 DMI(Adriaanse et al, 1997)
192,698,619 182,679,714 183,211,762 183,330,143 193,457,381 193,457,381 193,457,381 Domestic Extraction198,517,791 203,274,546 215,443,750 212,505,773 209,567,795 206,629,818 203,691,840 225,716,094 242,535,901 245,152,394 267,990,917 Imports153,784,967 156,242,952 159,747,154 163,906,577 168,066,000 172,722,522 177,379,043 196,998,134 199,371,534 195,861,286 218,066,845 Exports
Summary Indicators (as presented in main report)228,408,022 237,957,446 236,744,591 257,819,071 263,640,198 271,435,080 271,114,529 272,666,389 272,495,245 274,503,911 281,260,671 DPO (including oxygen)102,404,376 104,610,067 103,465,436 109,485,740 112,111,537 114,214,490 113,586,396 113,176,963 111,736,171 110,091,082 110,482,156 DPO (excluding oxygen)115,676,873 118,858,564 114,423,255 116,656,945 110,879,636 108,845,394 108,623,152 105,197,909 103,484,667 101,877,424 99,861,818 Domestic hidden flows344,084,894 356,816,009 351,167,845 374,476,016 374,519,834 380,280,474 379,737,680 377,864,298 375,979,912 376,381,335 381,122,489 TDO (including oxygen)218,081,248 223,468,631 217,888,690 226,142,685 222,991,174 223,059,884 222,209,548 218,374,872 215,220,837 211,968,507 210,343,974 TDO (excluding oxygen)150,856,366 145,295,196 142,707,468 131,072,856 123,774,369 103,791,037 97,882,780 101,380,461 126,860,192 135,025,990 134,918,063 Net Additions to Stock
Summary Indicators (metric tons per capita)15.72 16.28 16.09 17.41 17.70 18.08 17.92 17.89 17.76 17.80 18.15 DPO (including oxygen)
7.05 7.16 7.03 7.40 7.53 7.61 7.51 7.43 7.28 7.14 7.13 DPO (excluding oxygen)7.96 8.13 7.78 7.88 7.45 7.25 7.18 6.90 6.75 6.61 6.45 Domestic hidden flows
23.68 24.41 23.86 25.29 25.15 25.34 25.10 24.80 24.51 24.40 24.60 TDO (including oxygen)15.01 15.29 14.81 15.27 14.97 14.86 14.69 14.33 14.03 13.74 13.58 TDO (excluding oxygen)10.38 9.94 9.70 8.85 8.31 6.91 6.47 6.65 8.27 8.75 8.71 Net Additions to Stock
Summary Indicators including additional outputs (not presented in main report)252,020,870 261,130,035 259,309,417 280,571,545 287,016,671 295,325,782 294,763,249 296,044,299 295,507,882 297,276,511 303,788,725 DPO
(including carbon dioxide from respiration, excluding water vapor from all combustion & respiration)340,647,018 353,088,951 348,577,078 378,188,494 384,508,345 399,046,131 397,454,890 399,149,915 399,091,442 401,097,952 414,375,627 DPO
(including carbon dioxide from respiration, including water vapor from all combustion & respiration)367,697,743 379,988,599 373,732,672 397,228,491 397,896,308 404,171,176 403,386,400 401,242,208 398,992,549 399,153,936 403,650,543 TDO
(including carbon dioxide from respiration, excluding water vapor from all combustion & respiration)456,323,891 471,947,515 463,000,333 494,845,439 495,387,981 507,891,525 506,078,042 504,347,824 502,576,109 502,975,377 514,237,446 TDO
(including carbon dioxide from respiration, including water vapor from all combustion & respiration)
Gateway Indicators174,267,125 184,354,755 184,260,889 204,930,037 209,329,978 217,050,133 217,431,251 220,084,227 221,789,797 226,780,819 235,509,174 DPO to Air
(including oxygen from all combustion, excluding oxygen from respiration, excluding all water vapor)CO2 from
171,609,638 181,749,005 181,665,229 202,441,927 206,768,708 214,763,183 215,233,601 217,966,327 219,787,797 224,834,299 233,628,774 fossil fuel combustion247,994 253,000 241,500 204,900 202,520 172,700 171,900 163,100 145,900 145,720 134,700 SO2
581,653 596,800 603,800 591,100 579,750 567,250 554,750 534,800 510,100 497,800 485,700 NOX
532,600 534,200 535,800 532,400 515,000 460,000 434,000 404,000 387,000 363,000 348,000 NMVOC1,234,240 1,160,000 1,149,560 1,097,360 1,197,000 1,023,000 977,000 961,000 907,000 892,000 862,000 CO
61,000 61,750 65,000 62,350 67,000 64,000 60,000 55,000 52,000 48,000 50,000 Fine particlesBunker Fuel Emissions
16,569,638 20,589,005 21,245,229 40,931,927 43,228,708 44,623,183 45,853,601 47,986,327 46,427,797 47,904,299 49,298,774 CO2 from bunkers
52,903,117 52,387,130 51,290,362 51,717,914 53,161,319 53,243,747 52,549,777 51,589,962 49,854,548 47,013,492 45,076,317 DPO to Land13,157,330 13,581,352 13,862,363 13,956,156 14,282,735 13,400,000 13,300,000 13,000,000 12,150,000 9,800,000 8,450,000 Municipal landfill
92,000 119,000 151,000 143,000 152,000 170,000 176,000 210,000 161,000 179,000 174,000 Landfilled sewage sludge39,653,787 38,686,779 37,276,999 37,618,759 38,726,584 39,673,747 39,073,777 38,379,962 37,543,548 37,034,492 36,452,317 Dissipative flows to land
1,287,976 1,287,103 1,177,341 1,163,413 1,075,794 1,051,825 1,043,730 1,011,944 987,222 1,035,873 1,012,183 Fertilizers24,621 20,588 20,683 21,792 21,438 19,698 16,817 13,249 12,917 12,610 10,680 Pesticides
Animal manure38,206,189 37,256,088 35,956,975 36,277,554 37,484,353 38,449,224 37,879,230 37,256,769 36,447,409 35,906,008 35,363,455 spread on fields
Sewage sludge135,000 123,000 122,000 156,000 145,000 153,000 134,000 98,000 96,000 80,000 66,000 spread on fields
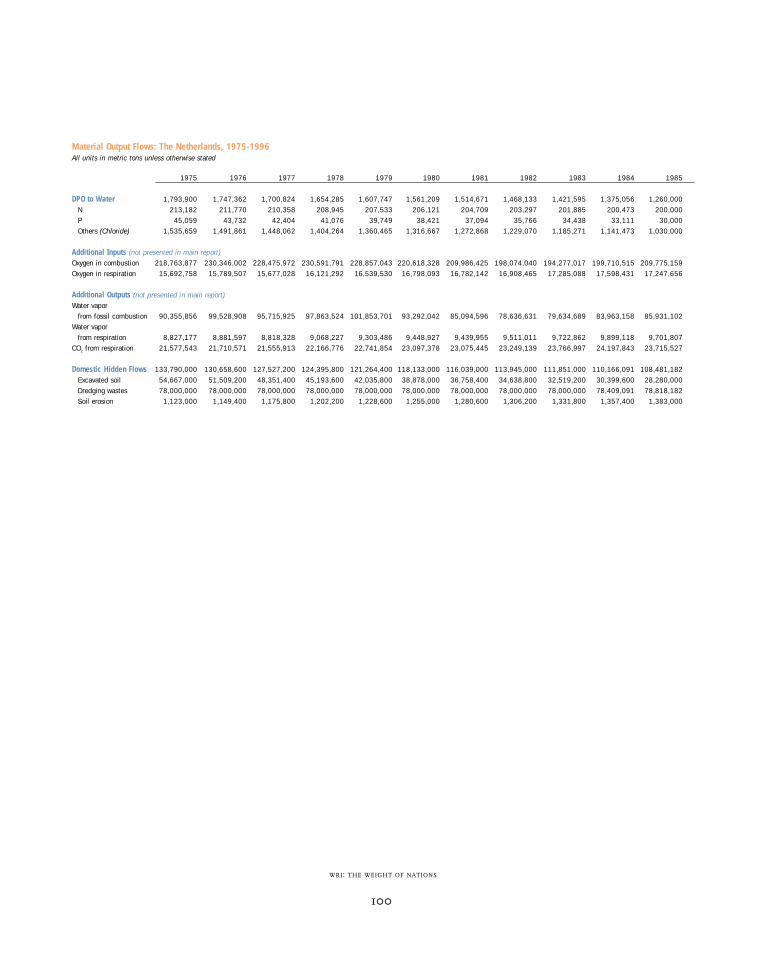
WRI: THE WEIGHT OF NATIONS
100
Material Output Flows: The Netherlands, 1975-1996All units in metric tons unless otherwise stated
1975 1976 1977 1978 1979 1980 1981 1982 1983 1984 1985
DPO to Water 1,793,900 1,747,362 1,700,824 1,654,285 1,607,747 1,561,209 1,514,671 1,468,133 1,421,595 1,375,056 1,260,000N 213,182 211,770 210,358 208,945 207,533 206,121 204,709 203,297 201,885 200,473 200,000P 45,059 43,732 42,404 41,076 39,749 38,421 37,094 35,766 34,438 33,111 30,000Others (Chloride) 1,535,659 1,491,861 1,448,062 1,404,264 1,360,465 1,316,667 1,272,868 1,229,070 1,185,271 1,141,473 1,030,000
Additional Inputs (not presented in main report)Oxygen in combustion 218,763,877 230,346,002 228,475,972 230,591,791 228,857,043 220,618,328 209,986,425 198,074,040 194,277,017 199,710,515 209,775,159Oxygen in respiration 15,692,758 15,789,507 15,677,028 16,121,292 16,539,530 16,798,093 16,782,142 16,908,465 17,285,088 17,598,431 17,247,656
Additional Outputs (not presented in main report)Water vapor
from fossil combustion 90,355,856 99,528,908 95,715,925 97,863,524 101,853,701 93,292,042 85,094,596 78,636,631 79,634,689 83,963,158 85,931,102Water vapor
from respiration 8,827,177 8,881,597 8,818,328 9,068,227 9,303,486 9,448,927 9,439,955 9,511,011 9,722,862 9,899,118 9,701,807CO2 from respiration 21,577,543 21,710,571 21,555,913 22,166,776 22,741,854 23,097,378 23,075,445 23,249,139 23,766,997 24,197,843 23,715,527
Domestic Hidden Flows 133,790,000 130,658,600 127,527,200 124,395,800 121,264,400 118,133,000 116,039,000 113,945,000 111,851,000 110,166,091 108,481,182Excavated soil 54,667,000 51,509,200 48,351,400 45,193,600 42,035,800 38,878,000 36,758,400 34,638,800 32,519,200 30,399,600 28,280,000Dredging wastes 78,000,000 78,000,000 78,000,000 78,000,000 78,000,000 78,000,000 78,000,000 78,000,000 78,000,000 78,409,091 78,818,182Soil erosion 1,123,000 1,149,400 1,175,800 1,202,200 1,228,600 1,255,000 1,280,600 1,306,200 1,331,800 1,357,400 1,383,000

WRI: THE WEIGHT OF NATIONS
101
Material Output Flows: The Netherlands, 1975-1996All units in metric tons unless otherwise stated
1986 1987 1988 1989 1990 1991 1992 1993 1994 1995 1996
1,237,780 1,215,560 1,193,340 1,171,120 1,148,900 1,141,200 1,133,500 992,200 850,900 709,600 675,180 DPO to Water196,400 192,800 189,200 185,600 182,000 202,000 222,000 201,333 180,667 160,000 171,867 N
29,380 28,760 28,140 27,520 26,900 25,700 24,500 21,533 18,567 15,600 14,047 P1,012,000 994,000 976,000 958,000 940,000 913,500 887,000 769,333 651,667 534,000 489,267 Others (Chloride)
Additional Inputs (not presented in main report)204,782,444 215,088,636 212,628,187 235,103,953 238,187,926 249,416,456 248,809,591 251,138,863 252,833,350 256,698,554 269,077,984 Oxygen in combustion
17,172,981 16,852,793 16,410,783 16,547,254 17,001,072 17,375,056 17,199,069 17,002,116 16,736,463 16,561,891 16,384,039 Oxygen in respiration
Additional Outputs (not presented in main report)Water vapor
88,626,148 91,958,916 89,267,661 97,616,949 97,491,674 103,720,349 102,691,641 103,105,617 103,583,560 103,821,441 110,586,903 from fossil combustionWater vapor
9,659,802 9,479,696 9,231,065 9,307,830 9,563,103 9,773,469 9,674,476 9,563,690 9,414,261 9,316,064 9,216,022 from respiration23,612,849 23,172,590 22,564,827 22,752,474 23,376,474 23,890,702 23,648,720 23,377,909 23,012,637 22,772,601 22,528,054 CO2 from respiration
115,676,873 118,858,564 114,423,255 116,656,945 110,879,636 108,845,394 108,623,152 105,197,909 103,484,667 101,877,424 99,861,818 Domestic Hidden Flows35,021,000 37,748,000 32,858,000 34,182,000 27,495,000 27,391,000 28,766,000 27,184,000 27,458,000 27,500,000 27,500,000 Excavated soil79,227,273 79,636,364 80,045,455 80,909,545 81,773,636 79,994,394 78,215,152 76,435,909 74,656,667 72,877,424 70,861,818 Dredging wastes
1,428,600 1,474,200 1,519,800 1,565,400 1,611,000 1,460,000 1,642,000 1,578,000 1,370,000 1,500,000 1,500,000 Soil erosion
WRI: THE WEIGHT OF NATIONS
102
Data Sources and Methodology:Technical Notes
The majority of the Dutch data was obtainedfrom Statistics Netherlands (CBS) and itsonline database Statline. Only in cases inwhich CBS data were not available were othersources used. A description is provided belowof the other data sources used in this study.
Corrections in DMI
DMI data given in Adriaanse et al., 1997have been corrected in this report. InAdriaanse et al., Total Domestic included thecategory “excavation” that according to thedefinition consists of hidden flows; thus,Total Domestic was not equal to DMI.Furthermore, import data for fossil fuels thatwere used in Adriaanse et al. were muchhigher than those recorded in CBSimport/export statistics. The figures thatwere used in Adriaanse et al. were based onthe Statistical Yearbook of CBS, in which fig-ures from the energy balance are given. Themethod of calculating the data in the energybalance changed in 1989. Before that year,the so-called Special Trade System was used,whereas from 1989 onward the GeneralTrade System was used. This means thatbefore 1989, fuels that were not declared atcustoms were not included in the import andexport totals in the energy balance, but theywere included after 1989. This causes theimports and exports of fuels in the energybalance and the Statistical Yearbook toincrease by 50 percent. In the Statistics forInternational trade, “not declared” fuels arenot included for the whole time series. A partof the “not declared” fuels were used forinternational transport. In this study, it wasdecided that emissions from bunker fuelswould be accounted for in the material out-
put of the economy. For mass balance pur-poses, the bunker fuels should thus be addedas an inflow. Not declared bunker fuels weretherefore added to the DMI. Furthermore,the Wuppertal Institute corrected the DMIdata for some minor issues like a dryweight/wet weight problem in the category ofrenewables. The new, corrected figures forDMI can be found in the dataset.
Exports
Export figures were taken from the trade sta-tistics (CBS). They were available from 1975to 1988 and from 1992 to 1996. Data for themissing years were interpolated. For 1975 to1977, a correction was made for the export ofnatural gas, which was not correctly includedat that time in the export statistics. For thoseyears, figures were used from the energy sta-tistics (CBS).
DPO to Air
Carbon Dioxide, Sulfur Dioxide, and Oxides of Nitrogen
Emissions of CO2, SO2, and NOx to air weretaken from NAMEA (CBS) for 1987 to 1997.Data for 1975, and 1979 to 1987 were takenfrom Statline (CBS). In Statline, emissionsfor industrial (noncombustion) sources werenot available for 1975 to 1989. Missing datawere extrapolated on the basis of the knowndata from the sources above. Emissions ofCO2 from the incineration of fuels used forinternational transport (oil for shipping andkerosene for aviation) are included in theCO2 emission account. These emissions arenot included in the NAMEA or Statline emis-sion figures. They were calculated on thebasis of CBS data on the use of fossil fuelscombined with their carbon content.
WRI: THE WEIGHT OF NATIONS
103
Human respiration was calculated on thebasis of an average daily CO2 production of0.9 kg per capita (Harte, 1988). Livestockrespiration was calculated on the basis of thenumber of cattle, pigs, poultry, and otherfarm animals (CBS) and exhalation factorsbased on the average weight of the animals(Handboek Rundveehouderij), the amount ofdry weight manure produced by the animals(Wuppertal Institute), and human respira-tion. The resulting factors in kg CO2/daywere: cattle, 8.0; pigs for meat, 0.67; pigs forbreeding, 0.98; poultry for eggs, 0.04; poul-try for meat, 0.03; sheep and goats, 0.65; andhorses, 6.0.
Water
Carbon-based fuels are converted into CO2and H2O in combustion processes. Emissionof water generated during combustion of car-bon-based fuels was calculated on the basisof the use of fossil fuels (Statline) and emis-sion factors for the different fuels. Factorswere based on hydrogen content and thewater content of the fuel (CBS). Resultingfactors in kg H2O per kg CO2 were: coal andcoal products, 0.55; oil and oil products,0.98; and natural gas, 1.69.
Non-Methane Volatile Organic Compounds,Carbon Monoxide, and Fine Particles
Emissions of NMVOC, CO, and fine particlesare available from Statline (CBS) for thewhole period except 1976 to 1979 and exclud-ing industrial (non-combustion) sourcesfrom 1975 to 1989. For NMVOC, emissionsfrom industrial sources were filled in withdata from RIVM (Nationale Milieuver-kenningen) and the Ministry of Housing,Spatial Planning, and the Environment (KWS2000). CO2 emissions from industrial
sources were extrapolated with the help ofdata from the Emission Registration. For fineparticles, emissions from industrial sourceswere extrapolated from the Statline data.Missing data were extrapolated on the basisof known data from the sources above.
DPO to Land
Final Waste Disposal (Landfill Only)
The amount of waste disposed of in landfillsites is available from the AOO for 1991 to1997. The total amount of household wastewas available from Statline (CBS) for theentire 1975–96 period. Data on waste fromprivate companies and public institutionswas available from Waste Statistics (CBS) for1984 to 1996 in one-year intervals. The frac-tion of these two types of waste that waslandfilled is known for 1981 to 1996 in one-year intervals (CBS Waste Statistics). Allother data were extrapolated from the above.
Landfilled Sewage Sludge
Amounts of dry weight sewage sludge andthe types of use, treatment, and disposalwere taken from CBS for 1981 to 1996. Inwet weight, additional data were available for1977 to 1979 (CBS). For those years, dryweight data were calculated from the wetweight data. Data for 1975, 1976, and 1980were extrapolated from the available data.
DPO to Water
Data for emissions of nitrogen, phosphorus,and chlorine to water were available for theyears 1985, 1990, 1992, and 1995 (Statline,CBS). All other data were extrapolated.Emissions of other substances were found tobe negligible on a mass basis. There is a
WRI: THE WEIGHT OF NATIONS
104
double count in this data with the dissipativeuse of fertilizer and manure.
Dissipative Use
Manure (Dry Weight)
Data for the amount of manure produced inthe Netherlands were calculated on the basisof time series data for the number of animals(CBS) multiplied by factors for the produc-tion of manure per animal (WuppertalInstitute). Some additional data for broilers,horses, goats, and sheep were calculated onthe basis of the amounts of P2O5 produced bythese animals. The factors used in kg dryweight manure per day were: dairy cows, 5.95;calves, 0.85; fattening pigs, 0.50; breedingsows, 0.73; laying hens, 0.03; broilers, 0.023;sheep and goats, 0.48; and horses, 4.5.
Fertilizer
Time series of used amounts of P2O5, N, andK2O were taken from Statline. These datawere combined with fractions of P2O5, N, andK2O in typical artificial fertilizers: P2O5, 0.35;N, 0.24; and K2O, 0.45.
Sewage Sludge
See DPO to land.
Pesticides
Data for the use of different categories ofpesticides were known from Nefyto, theDutch organization for pesticide merchants(published in: de Snoo and de Jong, 2000)for 1986 to 1996. Governmental policy plans(IMP-M, 1986, and MJP-G, 1991) providedadditional data for 1976, 1984, and 1985. Allother data were extrapolated.
Hidden Flows
Surplus Soil
The data for surplus soil were taken fromAdriaanse et al., 1997. These data were avail-able in five-year intervals only from 1975 to1990. Missing years were extrapolated exceptfor 1986 to 1989, which were taken from theoriginal dataset (van Heijningen et al., 1997).
Erosion
The data for erosion were taken fromAdriaanse et al., 1997. These data were avail-able for five-year intervals only from 1975 to1990. Missing years were extrapolated.
Dredged Sediments (Fresh Weight)
Incidental data only are available for theamount of dredging material in theNetherlands. Data were available for 1988 to1990 (Ministry of Transport Public Worksand Water Management, 1989 and 1990) and1996 (Absil and Bakker, 1999). Anecdotalevidence suggests that dredging before 1988was relatively stable and that landfillingoccurred only from 1984 onward. All otherdata were extrapolated from the above.
Sectoral Data for the 1996 Balance
The data for DPO to air allocated among economic sectors were taken mainly fromNAMEA (CBS). Human and livestock respira-tion and water emissions were calculated as described above. There is a discrepancybetween the 1996 balance and the timeseries because the allocation among eco-nomic sectors could not be determined for a number of substances: NMVOC, CO, andfine particles. Waste disposal was calculated
WRI: THE WEIGHT OF NATIONS
105
on the basis of NAMEA (CBS) data. In thesector, “Others,” environmental services wereexcluded. The data on landfilled waste usedin the 1996 balance are not exactly the sameas in the time series. Because the data for the1996 balance had to be allocated among eco-nomic sectors, a different data source(NAMEA) than in the time series was used(see above). For DPO to water, N and P emis-sions were distributed among the differentsectors on the basis of the N and P balancesof CBS (Fong, 1997a; Fong, 1997b).However, there is a discrepancy here with thetime series data. On the basis of the N and Pbalance for 1995, it is clear which part of theN and P emissions to water is leaching fromagricultural soils. To include this emission
would cause a double count with the dissipa-tive use of fertilizers and manure. Therefore,this N and P emission should be excluded,which is done in the 1996 balance. However,data on leaching are not known for the yearsbefore 1995; therefore, the double count isstill present in the time series data. Chlorinewas attributed entirely to manufacturing/industry. Manure, fertilizer, and pesticideswere attributed to agriculture, and sewagesludge was equally divided between house-holds and manufacturing/industry.Regarding dissipative flows, dredging andsurplus soil were attributed to construction/infrastructure, and erosion was equally divided between construction/infrastructureand agriculture.
Absil, L.L.M., and T. Bakker. 1999. InventarisatieWaterbodems aanbod en bestemming van bagger-specie 1999–2010 (Inventory Sediments, Supplyand Destination of Dredging Sediments1999–2010). AKWA/RIZA, Ministry of TransportPublic Works and Water Management, Lelystad.
Adriaanse, A., S. Bringezu, A. Hammond, Y.Moriguchi, E. Rodenburg, D. Rogich, and H.Schütz. 1997. Resource Flows: The Material Basis ofIndustrial Economies. Washington, D.C.: WorldResources Institute.
AOO (Afval Overleg Orgaan). 1998. Afvalverwerkingin Nederland, Gegevens 1997 (Waste Treatment inthe Netherlands, 1997 Data). WerkgroepAfvalregistratie. Report nr. AOO 98-05, Utrecht.
CBS (Central Bureau of Statistics) Energy Statistics.Database made available by StatisticsNetherlands, Voorburg, the Netherlands.
CBS NAMEA. NAMEA database made available byStatistics Netherlands, Voorburg, theNetherlands, version of April 15, 1999.
CBS Statline. Online database of StatisticsNetherlands: online at http://www.cbs.nl/en/stat-line. Accessed August 1999.
CBS Trade Statistics. Combination of data madeavailable by Statistics Netherlands, Heerlen, theNetherlands, April 1999.
CBS Waste Statistics. Combination of data madeavailable by Statistics Netherlands, Voorburg, theNetherlands, May 1999.
de Snoo G.R, and F.M.W. de Jong, eds. 2000.Bestrijdingsmiddelen & milieu (Pesticides and theEnvironment). van Arkel publishers, Utrecht, theNetherlands.
Emission Registration. 1992. Industriële emissies inNederland Basisjaar 1988 (Industrial Emissions inthe Netherlands, base year 1988). Publikatiereeksemissieregistratie Nr. 5.
Fong, N. 1997a. Fosfor in Nederland 1995(Phosphorus in the Netherlands, 1995).Kwartaalberichten Milieu, 97/4, Central Bureauof Statistics, Voorburg.
R E F E R E N C E S

WRI: THE WEIGHT OF NATIONS
106
Fong, N. 1997b. Stikstof in Nederland 1995 (Nitrogenin the Netherlands, 1995). KwartaalberichtenMilieu, 97/3, Central Bureau of Statistics,Voorburg.
Handboek voor de Rundveehouderij (Manual for cattle breeding). 1988. Proefstation voor deRundveehouderij Schapenhouderij enPaardenfokkerij, piunipu (anonymous).
Harte, J. 1988. Consider a Spherical Cow. A Course inEnvironmental Problem Solving. Mill Valley,California: University Science Books.
IMP-M. 1986. Indicatief Meerjaren ProgrammaMilieubeheer 1987–1991 (Indicative ProgramEnvironmental Management 1987–1991). LowerHouse of the Dutch Parliament, 19707 nrs. 1–2.The Hague.
KWS 2000. 1994. Strategie 1992–2000. Ministry ofHousing, Spatial Planning and Environment, TheHague.
Materiaalstromen in de Nederlandse Economie(Material Flows in the Dutch Economy). 1997.Van Heijningen Energie-en Milieuadvies B.V.,Techno Invent B.V. and Solid Chemical Solutions,Punthorst, the Netherlands (anonymous).
Ministry of Transport, Public Works and WaterManagement. 1989. Derde Nota Waterhuishouding,Water Voor Nu en Later (Third Bill WaterManagement, Water For Now and For theFuture). Lower House of the Dutch Parliament,21250 nrs 1-2. The Hague.
Ministry of Transport, Public Works and WaterManagement. 1990. Waterbodems, Water Voor Nuen Later (Sediments, Water for Now and for theFuture). DBW/RIZA nota nr. 90.038. The Hague.
MJP-G. 1991. Meerjarenprogramma Gewasbescherming(Multi-Year Program Pesticides). Lower House ofthe Dutch Parliament, 21 677 nrs 3-4, The Hague.
RIVM. 1988. Zorgen Voor Morgen. NationaleMilieuverkenning 1985–2010 (Concern forTomorrow, National Environmental Exploration).Samsom H.D. Tjeenk Willink publishers, Alphenaan den Rijn.
Wuppertal. 1999. Personal communications.

WRI: THE WEIGHT OF NATIONS
107
Overview
The United States is a huge country geo-graphically, and the largest economy in theworld. It is so rich in productive land andmineral resources that it can extract or har-vest within its national borders over 90 percent (by weight) of the raw materials itrequires each year. Only a small fraction ofthese materials is exported. The balanceremains in the economy in the form of build-ings, other infrastructure, and durable goods(2 billion metric tons) or is deposited into theenvironment (over 23 billion metric tons).1
The immense input and output flows gener-ated by the U.S. economy are dominated byenergy-related materials: hidden flows associ-ated with coal mining, and emissions of CO2from fossil fuel combustion, account for over50 percent of total domestic output (TDO).Hidden flows in the form of overburdenfrom mining of other minerals, soil erosioncaused by agriculture, and earth-moving forconstruction make up another 24 percent of TDO.
Quantities of hidden flows fell only slightlyin two decades, from 17.2 billion to 16.3billion metric tons. This small changeoccurred despite the dramatic shift, in valueterms, in the U.S. economy toward high tech-nology and service industries, which are rela-tively nonintensive energy and materialusers. Wastes from coal and metal miningactually increased from 1975 to 1996, asoperations expanded and ore qualitiesdeclined. Soil erosion has declined with theremoval of marginal land from cultivation,
but it still accounts for nearly 3.5 billion metric tons per year.
In contrast, domestic processed output(DPO)—flows from the economy comprisingconventional wastes, emissions, discharges,and system losses—rose substantially, from5.3 billion metric tons in 1975 to 6.8 billionmetric tons in 1996. These flows are domi-nated by CO2 emissions, which account for82 percent of total DPO. Fossil fuel combus-tion rose by about one third from 1975 to1996, encouraged by low oil prices and drivenin part by resurgent demand for electricitywith the growth of information technologies,and electrical and electronic products in thehome. Oil consumption for transportationgrew substantially over the 21-year period:efforts to improve vehicle fuel efficiencystalled as energy prices fell, and consumerpreferences began to shift toward large,heavy sport utility vehicles that consumeapproximately twice as much fuel per mile as the average car.
The other major flows in domesticprocessed output comprise nutrients andbiosolids from the agriculture sector, whichpass through the food processing sector tofinal disposal as manure (from livestock) andsewage (from humans). From 1975 to 1996,nutrient and other flows from the agriculturesector remained roughly constant. Manurequantities fell slightly as the livestock baseshifted from cows to poultry, though outputsbecame more concentrated with intensifica-tion of the livestock sector. Quantities ofsewage increased in line with population
M A T E R I A L F L O W S : U N I T E D S T A T E S Emily Matthews, Christian Ottke, Eric Rodenburg, Don Rogich

WRI: THE WEIGHT OF NATIONS
108
growth. The data indicate that fertilizer usehas saturated at the national level. Regionaldifferences in fertilizer application rates arehigh, and a regional flow analysis would berequired in order to determine nutrient flowrates. A high but uncertain proportion of fertilizer nutrient is not absorbed by growingplants and passes directly into the environment.
The main constituents of hidden flows anddomestic processed output are shown inFigure A1. Hidden flows comprise overbur-den, earth moving, soil erosion, and dredgedmaterials; domestic processed output com-prises CO2, SOx, NOx, agriculture, forestry,human waste, and other outputs.
On a per capita basis, as well as an absolutebasis, material flows in the United States arethe highest of the five study countries. FigureA2 shows the principal material flows gener-ated per capita, and the quantity of materialadded to physical stock in the form of infra-structure and durable goods.
During the study period, the net effect ofmarginally decreased domestic hidden flowsand sharply increased domestic processedoutput has been a small increase in totaldomestic output flows of less than 1 billiontons (3 percent). During this same period,the U.S. economy grew by 74 percent, andthe population by 23 percent. These trends
1975 1980 1985 1990 1995
0
5,000
10,000
15,000
20,000
25,000
F I G U R E A 1 COMPOSITION OF TOTAL DOMESTIC OUTPUT, UNITED STATES 1975–1996
Other
Agriculture, Forestry andHuman Waste
CO2 , SOx and NOx
Dredged Material
Soil Erosion
Earth Moving
Other Mining Overburden
Coal Mining Overburden
Mil
lio
n M
etr
ic T
on
s

WRI: THE WEIGHT OF NATIONS
109
represent a substantial decoupling of outputflows from economic and population growth(Figure A3). However, decoupling is muchless pronounced when hidden flows are ex-cluded. Conventional wastes, emissions, anddischarges rose by 28 percent since 1975 (5 percent on a per capita basis), the largestincrease of all the study countries. (See Figure A4.)
Surprisingly, the amount of material goingto stock (infrastructure and durable goods)each year has increased since 1975, though
the trend has fluctuated with economicgrowth and recession. The great nationalinfrastructure projects—the railroad network,interstate highway system, and industrial andhousing base—were mostly completed by the1970s, and it might be expected that quanti-ties of material going to stock annually wouldhave decreased since then. Domestic hiddenflows associated with stock flows—principallyearth moving—have indeed declined as aresult of reduced highway construction (seedata table). However, most of this decline hasbeen offset by construction of new and
0
5
10
15
20
25
F I G U R E A 2 PRINCIPAL MATERIAL FLOWS GENERATED PER CAPITA, UNITED STATES 1996
Metr
ic T
on
s P
er
Cap
ita
Overburden and Waste fromCoal Mining
Overburden and Waste fromOther Mining
Carbon Dioxide Emissions from Fossil Fuel Combustion
Soil Erosion
Earth Moving for Construction
Other Wastes and Emissions
Buildings, Other Infrastructureand Durable Goods

WRI: THE WEIGHT OF NATIONS
110
1975 1980 1985 1990 1995
0
20
40
60
80
100
120
F I G U R E A 3 DECOUPLING BETWEEN TDO, POPULATION, AND GDP, UNITED STATES 1975–1996
TDO
TDO/Capita
TDO/GDP
Ind
ex
(19
75=
100
)
1975 1980 1985 1990 1995
0
20
40
60
80
100
120
140
F I G U R E A 4 DECOUPLING BETWEEN DPO, POPULATION, AND GDP, UNITED STATES 1975–1996
DPO
DPO/Capita
DPO/GDP
Ind
ex
(19
75=
100
)

WRI: THE WEIGHT OF NATIONS
111
bigger housing, as well as ongoing infra-structure maintenance. Extensive urbansprawl uses more space than high-densityhousing; further study would be required todetermine whether it also uses more mate-rial. Figure A5 shows that the material weight
of durable goods added to the economy eachyear increased by more than 40 percent from1975 to 1996, though durable goods stillaccounted for only about 7 percent of totalmaterials added to stock each year.
Mil
lio
n M
etr
ic T
on
s
0
500
1,000
1,500
2,000
2,500
1975 1980 1985 1990 1995
F I G U R E A 5 ANNUAL NET ADDITIONS OF MATERIAL TO STOCK, UNITED STATES 1975–1996
Durable Goods
Construction
Materials
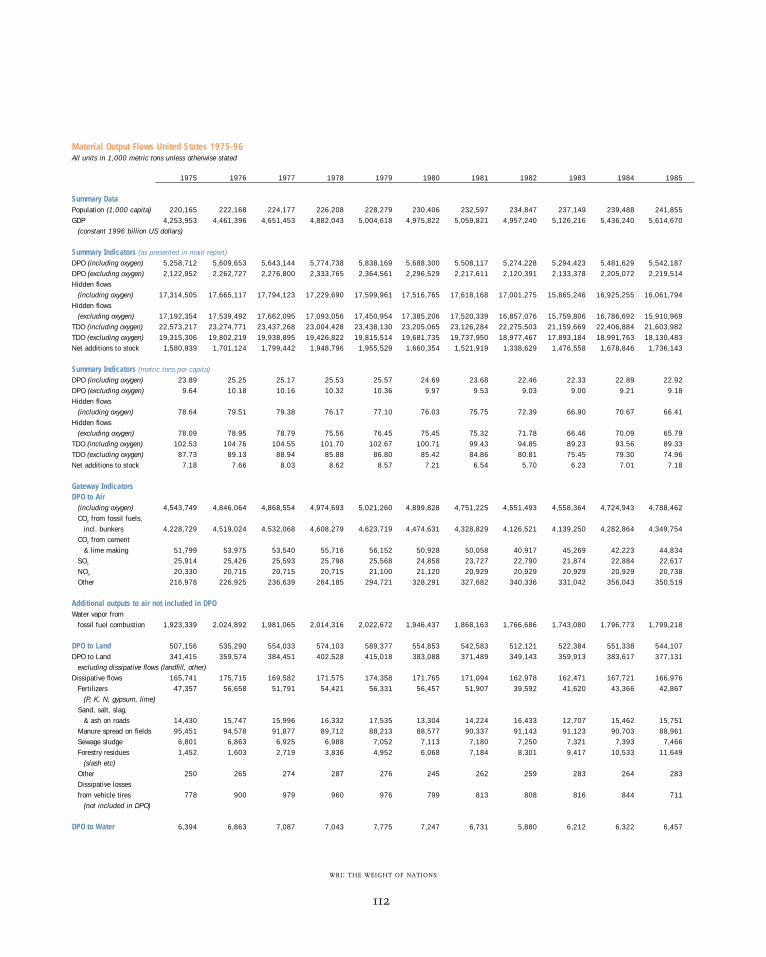
WRI: THE WEIGHT OF NATIONS
112
Material Output Flows United States 1975-96All units in 1,000 metric tons unless otherwise stated
1975 1976 1977 1978 1979 1980 1981 1982 1983 1984 1985
Summary DataPopulation (1,000 capita) 220,165 222,168 224,177 226,208 228,279 230,406 232,597 234,847 237,149 239,488 241,855GDP 4,253,953 4,461,396 4,651,453 4,882,043 5,004,618 4,975,822 5,059,821 4,957,240 5,126,216 5,436,240 5,614,670
(constant 1996 billion US dollars)
Summary Indicators (as presented in main report)DPO (including oxygen) 5,258,712 5,609,653 5,643,144 5,774,738 5,838,169 5,688,300 5,508,117 5,274,228 5,294,423 5,481,629 5,542,187DPO (excluding oxygen) 2,122,952 2,262,727 2,276,800 2,333,765 2,364,561 2,296,529 2,217,611 2,120,391 2,133,378 2,205,072 2,219,514Hidden flows
(including oxygen) 17,314,505 17,665,117 17,794,123 17,229,690 17,599,961 17,516,765 17,618,168 17,001,275 15,865,246 16,925,255 16,061,794Hidden flows
(excluding oxygen) 17,192,354 17,539,492 17,662,095 17,093,056 17,450,954 17,385,206 17,520,339 16,857,076 15,759,806 16,786,692 15,910,969TDO (including oxygen) 22,573,217 23,274,771 23,437,268 23,004,428 23,438,130 23,205,065 23,126,284 22,275,503 21,159,669 22,406,884 21,603,982TDO (excluding oxygen) 19,315,306 19,802,219 19,938,895 19,426,822 19,815,514 19,681,735 19,737,950 18,977,467 17,893,184 18,991,763 18,130,483Net additions to stock 1,580,939 1,701,124 1,799,442 1,948,796 1,955,529 1,660,354 1,521,919 1,338,629 1,476,558 1,678,846 1,736,143
Summary Indicators (metric tons per capita)DPO (including oxygen) 23.89 25.25 25.17 25.53 25.57 24.69 23.68 22.46 22.33 22.89 22.92DPO (excluding oxygen) 9.64 10.18 10.16 10.32 10.36 9.97 9.53 9.03 9.00 9.21 9.18Hidden flows
(including oxygen) 78.64 79.51 79.38 76.17 77.10 76.03 75.75 72.39 66.90 70.67 66.41Hidden flows
(excluding oxygen) 78.09 78.95 78.79 75.56 76.45 75.45 75.32 71.78 66.46 70.09 65.79TDO (including oxygen) 102.53 104.76 104.55 101.70 102.67 100.71 99.43 94.85 89.23 93.56 89.33TDO (excluding oxygen) 87.73 89.13 88.94 85.88 86.80 85.42 84.86 80.81 75.45 79.30 74.96Net additions to stock 7.18 7.66 8.03 8.62 8.57 7.21 6.54 5.70 6.23 7.01 7.18
Gateway IndicatorsDPO to Air
(including oxygen) 4,543,749 4,846,064 4,868,554 4,974,693 5,021,260 4,899,828 4,751,225 4,551,493 4,558,364 4,724,943 4,788,462CO2 from fossil fuels,
incl. bunkers 4,228,729 4,519,024 4,532,068 4,608,279 4,623,719 4,474,631 4,328,829 4,126,521 4,139,250 4,282,864 4,349,754CO2 from cement
& lime making 51,799 53,975 53,540 55,716 56,152 50,928 50,058 40,917 45,269 42,223 44,834SO2 25,914 25,426 25,593 25,798 25,568 24,858 23,727 22,790 21,874 22,884 22,617NOX 20,330 20,715 20,715 20,715 21,100 21,120 20,929 20,929 20,929 20,929 20,738Other 216,978 226,925 236,639 264,185 294,721 328,291 327,682 340,336 331,042 356,043 350,519
Additional outputs to air not included in DPOWater vapor from
fossil fuel combustion 1,923,339 2,024,892 1,981,065 2,014,316 2,022,672 1,946,437 1,868,163 1,766,686 1,743,080 1,796,773 1,799,218
DPO to Land 507,156 535,290 554,033 574,103 589,377 554,853 542,583 512,121 522,384 551,338 544,107DPO to Land 341,415 359,574 384,451 402,528 415,018 383,088 371,489 349,143 359,913 383,617 377,131
excluding dissipative flows (landfill, other)Dissipative flows 165,741 175,715 169,582 171,575 174,358 171,765 171,094 162,978 162,471 167,721 166,976
Fertilizers 47,357 56,658 51,791 54,421 56,331 56,457 51,907 39,592 41,620 43,366 42,867(P, K, N, gypsum, lime)
Sand, salt, slag, & ash on roads 14,430 15,747 15,996 16,332 17,535 13,304 14,224 16,433 12,707 15,462 15,751
Manure spread on fields 95,451 94,578 91,877 89,712 88,213 88,577 90,337 91,143 91,123 90,703 88,961Sewage sludge 6,801 6,863 6,925 6,988 7,052 7,113 7,180 7,250 7,321 7,393 7,466Forestry residues 1,452 1,603 2,719 3,836 4,952 6,068 7,184 8,301 9,417 10,533 11,649
(slash etc)Other 250 265 274 287 276 245 262 259 283 264 283Dissipative losses from vehicle tires 778 900 979 960 976 799 813 808 816 844 711
(not included in DPO)
DPO to Water 6,394 6,863 7,087 7,043 7,775 7,247 6,731 5,880 6,212 6,322 6,457
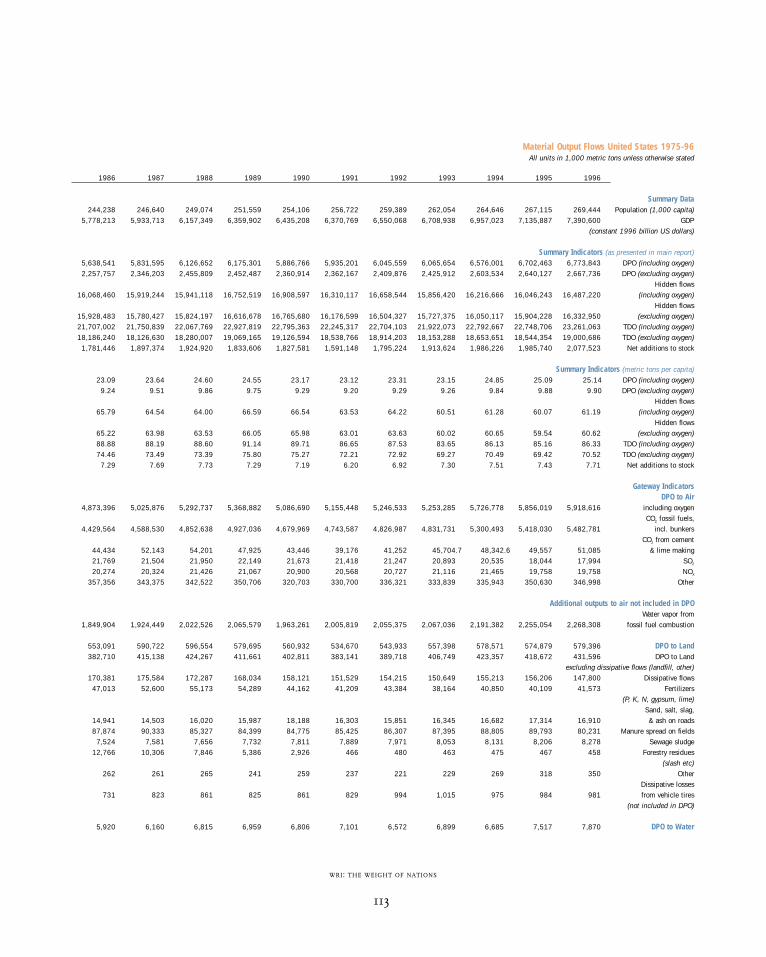
WRI: THE WEIGHT OF NATIONS
113
Material Output Flows United States 1975-96All units in 1,000 metric tons unless otherwise stated
1986 1987 1988 1989 1990 1991 1992 1993 1994 1995 1996
Summary Data244,238 246,640 249,074 251,559 254,106 256,722 259,389 262,054 264,646 267,115 269,444 Population (1,000 capita)
5,778,213 5,933,713 6,157,349 6,359,902 6,435,208 6,370,769 6,550,068 6,708,938 6,957,023 7,135,887 7,390,600 GDP(constant 1996 billion US dollars)
Summary Indicators (as presented in main report)5,638,541 5,831,595 6,126,652 6,175,301 5,886,766 5,935,201 6,045,559 6,065,654 6,576,001 6,702,463 6,773,843 DPO (including oxygen)2,257,757 2,346,203 2,455,809 2,452,487 2,360,914 2,362,167 2,409,876 2,425,912 2,603,534 2,640,127 2,667,736 DPO (excluding oxygen)
Hidden flows16,068,460 15,919,244 15,941,118 16,752,519 16,908,597 16,310,117 16,658,544 15,856,420 16,216,666 16,046,243 16,487,220 (including oxygen)
Hidden flows15,928,483 15,780,427 15,824,197 16,616,678 16,765,680 16,176,599 16,504,327 15,727,375 16,050,117 15,904,228 16,332,950 (excluding oxygen)21,707,002 21,750,839 22,067,769 22,927,819 22,795,363 22,245,317 22,704,103 21,922,073 22,792,667 22,748,706 23,261,063 TDO (including oxygen)18,186,240 18,126,630 18,280,007 19,069,165 19,126,594 18,538,766 18,914,203 18,153,288 18,653,651 18,544,354 19,000,686 TDO (excluding oxygen)
1,781,446 1,897,374 1,924,920 1,833,606 1,827,581 1,591,148 1,795,224 1,913,624 1,986,226 1,985,740 2,077,523 Net additions to stock
Summary Indicators (metric tons per capita)23.09 23.64 24.60 24.55 23.17 23.12 23.31 23.15 24.85 25.09 25.14 DPO (including oxygen)
9.24 9.51 9.86 9.75 9.29 9.20 9.29 9.26 9.84 9.88 9.90 DPO (excluding oxygen)Hidden flows
65.79 64.54 64.00 66.59 66.54 63.53 64.22 60.51 61.28 60.07 61.19 (including oxygen)Hidden flows
65.22 63.98 63.53 66.05 65.98 63.01 63.63 60.02 60.65 59.54 60.62 (excluding oxygen)88.88 88.19 88.60 91.14 89.71 86.65 87.53 83.65 86.13 85.16 86.33 TDO (including oxygen)74.46 73.49 73.39 75.80 75.27 72.21 72.92 69.27 70.49 69.42 70.52 TDO (excluding oxygen)
7.29 7.69 7.73 7.29 7.19 6.20 6.92 7.30 7.51 7.43 7.71 Net additions to stock
Gateway IndicatorsDPO to Air
4,873,396 5,025,876 5,292,737 5,368,882 5,086,690 5,155,448 5,246,533 5,253,285 5,726,778 5,856,019 5,918,616 including oxygenCO2 fossil fuels,
4,429,564 4,588,530 4,852,638 4,927,036 4,679,969 4,743,587 4,826,987 4,831,731 5,300,493 5,418,030 5,482,781 incl. bunkersCO2 from cement
44,434 52,143 54,201 47,925 43,446 39,176 41,252 45,704.7 48,342.6 49,557 51,085 & lime making21,769 21,504 21,950 22,149 21,673 21,418 21,247 20,893 20,535 18,044 17,994 SO2
20,274 20,324 21,426 21,067 20,900 20,568 20,727 21,116 21,465 19,758 19,758 NOX
357,356 343,375 342,522 350,706 320,703 330,700 336,321 333,839 335,943 350,630 346,998 Other
Additional outputs to air not included in DPOWater vapor from
1,849,904 1,924,449 2,022,526 2,065,579 1,963,261 2,005,819 2,055,375 2,067,036 2,191,382 2,255,054 2,268,308 fossil fuel combustion
553,091 590,722 596,554 579,695 560,932 534,670 543,933 557,398 578,571 574,879 579,396 DPO to Land382,710 415,138 424,267 411,661 402,811 383,141 389,718 406,749 423,357 418,672 431,596 DPO to Land
excluding dissipative flows (landfill, other)170,381 175,584 172,287 168,034 158,121 151,529 154,215 150,649 155,213 156,206 147,800 Dissipative flows
47,013 52,600 55,173 54,289 44,162 41,209 43,384 38,164 40,850 40,109 41,573 Fertilizers(P, K, N, gypsum, lime)
Sand, salt, slag,14,941 14,503 16,020 15,987 18,188 16,303 15,851 16,345 16,682 17,314 16,910 & ash on roads87,874 90,333 85,327 84,399 84,775 85,425 86,307 87,395 88,805 89,793 80,231 Manure spread on fields
7,524 7,581 7,656 7,732 7,811 7,889 7,971 8,053 8,131 8,206 8,278 Sewage sludge12,766 10,306 7,846 5,386 2,926 466 480 463 475 467 458 Forestry residues
(slash etc)262 261 265 241 259 237 221 229 269 318 350 Other
Dissipative losses731 823 861 825 861 829 994 1,015 975 984 981 from vehicle tires
(not included in DPO)
5,920 6,160 6,815 6,959 6,806 7,101 6,572 6,899 6,685 7,517 7,870 DPO to Water

WRI: THE WEIGHT OF NATIONS
114
Material Output Flows United States 1975-96All units in 1000 metric tons unless otherwise stated
1975 1976 1977 1978 1979 1980 1981 1982 1983 1984 1985
DPO to Uncertain Gateways201,414 221,437 213,469 218,899 219,758 226,372 207,578 204,735 207,462 199,027 203,161
Hidden Flows(excluding oxygen) 17,192,354 17,539,492 17,662,095 17,093,056 17,450,954 17,385,206 17,520,339 16,857,076 15,759,806 16,786,692 15,910,969Minerals, mining overburden & waste 1,394,271 1,442,879 1,310,446 1,475,475 1,567,057 1,416,361 1,521,250 1,027,724 1,121,400 1,195,798 1,216,504Coal, mining overburden
& waste 5,043,965 5,268,554 5,847,632 5,729,793 5,683,300 5,926,558 5,989,966 5,856,084 5,171,570 5,853,806 5,402,715Earth moving for
infrastructure creation 3,960,248 4,110,773 3,805,110 3,241,419 3,533,743 3,488,840 3,616,521 3,448,536 3,385,289 3,569,824 3,322,865Dredging 559,625 517,000 511,500 489,500 490,875 511,500 596,750 477,125 497,750 578,875 519,750Soil erosion 5,525,300 5,472,562 5,420,327 5,368,591 5,317,348 5,266,595 5,216,326 5,166,536 4,952,406 4,747,151 4,550,402Other 708,944 727,725 767,080 788,278 858,631 775,353 579,526 881,071 631,391 841,239 898,734
Selected Material Flows of Environmental ConcernArsenic DPO 15.0 9.6 10.5 10.4 11.6 8.0 10.0 8.4 6.1 7.8 6.1Arsenic NAS 1.7 3.2 5.3 5.3 6.1 6.8 12.1 10.1 10.1 12.9 13.5Cadmium DPO 1.5 2.3 1.6 1.9 2.4 1.7 2.1 2.1 1.8 1.9 2.1Cadmium NAS 2.0 3.7 2.7 3.2 3.2 2.3 2.8 2.0 1.8 1.8 2.0Lead DPO 414 368 310 276 336 295 234 201 158 146 135Lead NAS 235.6 265.1 289.2 318.6 234.1 138.6 250.9 315.4 332.8 240.6 329.2Mercury DPO 0.9 1.1 1.0 1.2 1.3 1.2 1.3 1.0 0.9 1.4 1.1Mercury NAS, later yrs. represent
stock withdrawals 0.6 1.1 1.0 0.8 0.8 0.6 0.7 0.5 0.4 0.3 0.4Synthetic chemicals,
medical DPO 0.95 1.07 1.09 1.22 1.42 1.11 1.11 1.03 1.06 1.27 1.02Synthetic chemicals,
plastic in DPO 7,755 8,949 9,915 10,987 10,994 11,000 11,609 11,238 12,348 13,092 13,682Synthetic chemicals NAS 22,722 25,626 29,156 31,295 32,763 32,043 32,569 31,694 33,432 34,529 34,207
Note: Substances DPO are direct outputs to the environment in the year indicated. Substances NAS are additions to stock in the year indicated, which will become outputs to the environment in future years.

WRI: THE WEIGHT OF NATIONS
115
Material Output Flows United States 1975-96All units in 1,000 metric tons unless otherwise stated
1986 1987 1988 1989 1990 1991 1992 1993 1994 1995 1996
DPO to Uncertain Gateways206,134 208,838 230,545 219,765 232,338 237,981 248,520 248,072 263,967 264,049 267,961
Hidden Flows15,928,483 15,780,427 15,824,197 16,616,678 16,765,680 16,176,599 16,504,327 15,727,375 16,050,117 15,904,228 16,332,950 (excluding oxygen)
Minerals, mining1,173,242 1,304,011 1,721,256 1,988,734 2,235,625 2,299,747 2,365,599 2,316,250 2,393,716 2,463,852 2,478,403 overburden & waste
Coal, mining overburden5,592,395 5,664,322 5,863,572 5,947,665 6,029,096 5,756,733 5,763,316 5,673,111 5,910,457 5,878,950 6,006,355 & waste
Earth moving for3,432,597 3,220,877 2,913,839 3,317,126 3,318,473 3,087,425 3,329,361 2,966,729 2,853,623 2,894,809 3,105,838 infrastructure creation
536,250 458,150 496,238 562,238 478,500 515,625 438,763 473,000 517,963 448,388 458,700 Dredging4,361,808 4,338,900 4,172,384 4,012,258 3,858,278 3,710,207 3,684,173 3,542,784 3,406,820 3,406,820 3,448,536 Soil erosion
832,192 794,168 656,909 788,657 845,708 806,862 923,115 755,502 967,538 811,409 876,834 Other
Selected Material Flows of Environmental Concern5.9 6.1 6.6 6.1 5.7 5.9 4.0 3.7 3.9 2.4 2.5 Arsenic DPO
15.7 16.4 17.9 17.0 15.7 16.5 19.5 17.4 17.5 20.8 20.5 Arsenic NAS2.5 2.5 2.2 2.7 2.4 2.8 3.1 2.8 1.1 0.8 1.8 Cadmium DPO2.4 2.2 2.0 1.9 1.7 1.2 0.8 0.7 0.2 0.2 0.5 Cadmium NAS
106 90 112 107 133 167 174 188 149 238 128 Lead DPO248.8 254.2 286.2 294.0 296.7 235.7 241.1 319.6 470.3 382.3 469.1 Lead NAS
0.9 0.8 0.8 0.6 0.4 0.2 0.3 0.2 0.2 0.2 0.1 Mercury DPOMercury NAS, later yrs. represent
0.5 0.4 0.6 0.5 0.2 0.2 0.2 0.0 -0.1 -0.2 -0.2 stock withdrawalsSynthetic chemicals,
1.20 1.18 1.17 1.30 1.44 1.84 1.49 1.49 1.68 1.68 1.68 medical DPOSynthetic chemicals,
15,311 15,481 17,338 15,212 16,569 16,801 16,532 16,870 16,720 16,713 16,706 plastic in DPO36,690 38,123 42,363 42,929 44,525 42,720 48,064 51,087 48,415 48,408 48,401 Synthetic chemicals NAS
Note: Substances DPO are direct outputs to the environment in the year indicated. Substances NAS are additions to stock in the year indicated, which will become outputs to the environment in future years.
WRI: THE WEIGHT OF NATIONS
116
The U.S. material flows documented for thisstudy account for about 95 percent of totalmaterial outputs to the environment in theUnited States. Imports of finished goods andsemimanufactured products were two specificflows considered in our 1997 report whichare not listed in the U.S. data sheet. In thisstudy, imported semi-manufactured productsare included as imports in the individualcommodity flows. We considered finishedgoods on a partial basis only for several rea-sons: (1) their overall contribution to the totalweight of all flows in the United States issmall, (2) exports, which offset the importsof finished goods, also are not considered,and (3) the development of an accurate pic-ture is extremely complex. Only outputs thatoccur within the continental boundary of theUnited States have been counted.
The methodology used to compile the U.S.dataset differs somewhat from that used inthe other study countries. Unlike manyEuropean countries, U.S. official data inmany cases do not provide reliable data inaggregated form for such factors as, forexample, total quantities of industrial wastegoing to landfills. Outputs within the UnitedStates have therefore been estimated by con-sidering the domestic production of a partic-ular commodity, adding the imports andrecycled quantities, and subtracting theexports. This is termed the apparent use ofthe commodity. However, where a portion ofa commodity is extracted or produced in theUnited States, and then exported, the ancil-lary (hidden) flows associated with the extrac-tion/production function are included, sincethey occur in this country.
The overall output flows from the indus-trial economy of the United States were, for the most part, derived from data on the
inputs and apparent use for each discretematerial flow stream. The datasheet presentedhere is a highly aggregated version of the current U.S. material flow database, which may be accessed on the Internet at http://www.wri.org/wri/materials/. Thecomplete database lists some 460 individualflows, documenting their output quantities atthe extraction, processing, manufacturing,apparent use, and post-use stages of thematerial cycle. Where it was deemed useful,some primary material flow categories havebeen subdivided. This is the case for salt, forexample, where the use of salt per se is docu-mented, but the flows of chlorine and causticsoda derived from salt have been broken outas separate flows. In order to track flows in acoherent manner, linkages between flows arenoted, and individual quantities can be com-bined to provide a complete picture. As anexample, the carbon or CO2 emitted duringthe production of cement or lime can becombined with the carbon from the combus-tion of fossil fuel.
Characterizing Material Flows: A Pilot Scheme
Every flow in the U.S. material flow databaseis characterized in three ways, based on itsmode of first release to the environment (M),its quality, as determined by physical andchemical characteristics (Q), and its velocitythrough the economy (V). The MQV schemeis detailed in Box A1. These characteristicsare fully searchable in the U.S. materialsflow database; as an example, researchers cansort for and track total quantities ofunprocessed but chemically active flows (Q3),which are resident in the economy less thantwo years (V1) and which are disperseddirectly on land in solid, partially solid, orliquid form (M3).
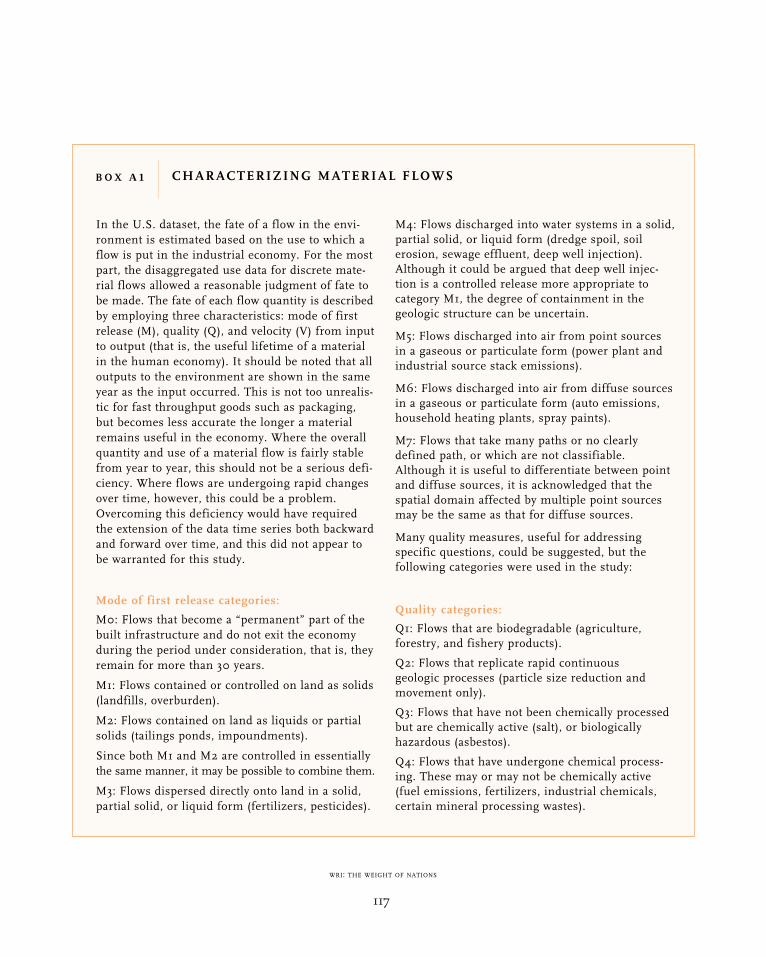
WRI: THE WEIGHT OF NATIONS
117
In the U.S. dataset, the fate of a flow in the envi-
ronment is estimated based on the use to which a
flow is put in the industrial economy. For the most
part, the disaggregated use data for discrete mate-
rial flows allowed a reasonable judgment of fate to
be made. The fate of each flow quantity is described
by employing three characteristics: mode of first
release (M), quality (Q), and velocity (V) from input
to output (that is, the useful lifetime of a material
in the human economy). It should be noted that all
outputs to the environment are shown in the same
year as the input occurred. This is not too unrealis-
tic for fast throughput goods such as packaging,
but becomes less accurate the longer a material
remains useful in the economy. Where the overall
quantity and use of a material flow is fairly stable
from year to year, this should not be a serious defi-
ciency. Where flows are undergoing rapid changes
over time, however, this could be a problem.
Overcoming this deficiency would have required
the extension of the data time series both backward
and forward over time, and this did not appear to
be warranted for this study.
Mode of first release categories:
M0: Flows that become a “permanent” part of the
built infrastructure and do not exit the economy
during the period under consideration, that is, they
remain for more than 30 years.
M1: Flows contained or controlled on land as solids
(landfills, overburden).
M2: Flows contained on land as liquids or partial
solids (tailings ponds, impoundments).
Since both M1 and M2 are controlled in essentially
the same manner, it may be possible to combine them.
M3: Flows dispersed directly onto land in a solid,
partial solid, or liquid form (fertilizers, pesticides).
M4: Flows discharged into water systems in a solid,
partial solid, or liquid form (dredge spoil, soil
erosion, sewage effluent, deep well injection).
Although it could be argued that deep well injec-
tion is a controlled release more appropriate to
category M1, the degree of containment in the
geologic structure can be uncertain.
M5: Flows discharged into air from point sources
in a gaseous or particulate form (power plant and
industrial source stack emissions).
M6: Flows discharged into air from diffuse sources
in a gaseous or particulate form (auto emissions,
household heating plants, spray paints).
M7: Flows that take many paths or no clearly
defined path, or which are not classifiable.
Although it is useful to differentiate between point
and diffuse sources, it is acknowledged that the
spatial domain affected by multiple point sources
may be the same as that for diffuse sources.
Many quality measures, useful for addressing
specific questions, could be suggested, but the
following categories were used in the study:
Quality categories:
Q1: Flows that are biodegradable (agriculture,
forestry, and fishery products).
Q2: Flows that replicate rapid continuous
geologic processes (particle size reduction and
movement only).
Q3: Flows that have not been chemically processed
but are chemically active (salt), or biologically
hazardous (asbestos).
Q4: Flows that have undergone chemical process-
ing. These may or may not be chemically active
(fuel emissions, fertilizers, industrial chemicals,
certain mineral processing wastes).
B O X A 1 CHARACTERIZING MATERIAL FLOWS

WRI: THE WEIGHT OF NATIONS
118
Q5: Flows that are heavy metals, synthetic and
persistent chemical compounds, or radioactive.
Velocity categories:
V1: Flows that exit the economy within two years
of entry (food, fertilizer, packaging, petroleum used
as fuel).
V2: Flows that exit the economy in 3 to 30 years
(durable consumer goods, automobiles). It would
be useful if V2 could be further divided into 3–10
and 10–30 year categories, but it is not clear that
the available data permit this distinction to be made.
V3: Flows that stay in the economy for more than
30 years and are additions to the stock of built
infrastructure (highways, buildings).
Flows retained in stock (V3) are not considered to
be outputs. Also, the quantity of material recycled
is subtracted from individual output flows as
appropriate.
B O X A 1 (CONTINUED)
1975 1980 1985 1990 1995
0
100
200
300
400
500
600
700
F I G U R E A 6 LEAD OUTPUTS TO THE U.S . ENVIRONMENT, 1975–1996
Other
Oxides and Chemicals
Transportation
Gasoline Additives
AmmunitionTh
ou
san
d M
etr
ic T
on
s
Note: The “other” category is dominated by lead in electrical products, notably computer monitors. The “transportation” category is
dominated by lead acid vehicle batteries. The spike in 1994 is an accurate reflection of U.S. Geological Survey data but appears to be
a statistical anomaly. “Ammunition” is civilian use.

WRI: THE WEIGHT OF NATIONS
119
Use of this characterization scheme allowedthe aggregation of all toxic and potentiallyhazardous flows to the environment (Q3 andQ5) that were presented in Figure 8 of thisreport (p. 33). At a finer level of detail, flowscan be broken down by stage in the materialcycle (processing, use, disposal) and by dif-ferent product applications and different enduses. Numerous examples could be presentedhere, illustrating how material use, in bothquantity and application, has changed overtime. Figures A6 and A7 present data for just two substances: lead and arsenic. Thedata show that, while some applications havedeclined, others have increased, with
different implications for environmentalquality and human health. Dispersive use oflead in gasoline, the application most imme-diately harmful to human health, hasdeclined due to regulatory controls, but leadoutputs from other uses such as post-useelectrical goods has increased. Arsenic is little used today in agricultural applications,but its use as a wood preservative (currentlyunregulated) has risen nearly 25-fold. Arsenicin treated wood is believed to pose a threat tosoil and water quality when wood productssuch as fences and flooring are chipped orburned at the end of their useful life.
1975 1980 1985 1990 1995
0
5
10
15
20
25
F I G U R E A 7 POTENTIAL ARSENIC OUTPUTS TO THE U.S . ENVIRONMENT,1975–1996
Other
Glass
Wood Preservatives
Coal Fly Ash
Agricultural Chemicals
Th
ou
san
d M
etr
ic T
on
s
Note: Data for arsenic in wood preservatives corresponds to apparent use; we have not accounted for the time lag between use and
disposal. This arsenic is currently a net addition to stock (see U.S. datasheet, Arsenic NAS). It will become an output to the environment
at the end of the wood’s useful life, typically 15–30 years.

WRI: THE WEIGHT OF NATIONS
120
Commodity Flow: Arsenic(1,000 metric tons)
INPUTS M Q V 1975 1976 1977 1978 1979 1980 1981 1982 1983 1984 1985
Domestic Production 2.18 4.40 4.06 1.28 4.11 3.40 2.74 3.58 2.81 6.80 2.20Imports 12.50 4.80 7.90 11.60 11.50 9.10 17.30 14.70 11.00 14.20 16.90Recycling
estimated @80% of alloy from lead acid batteries 0.32 0.80 1.04 1.12 0.36 0.32 0.48 0.38 0.34 0.42 0.43Exports 0.00 0.00 0.00 0.00 0.97 1.51 0.52 2.66 0.15 0.08 0.16Apparent Use 15.00 10.00 13.00 14.00 15.00 12.40 20.00 16.00 14.00 17.30 18.10
OUTPUTS
Extraction PhaseHidden Domestic Overburden Arsenic extracted as a byproduct with nonferrous ores (copper and lead), overburden counted with those ores
Processing PhaseHidden Domestic Gangue Gangue counted with nonferrous oresassume 40%
domestic production (arsenic units) 2 5 1 0.87 1.76 1.62 0.51 1.64 1.36 1.10 1.43 1.13 2.72 0.88(Based on information in USBM IC 9382, 1994, The Materials flow of Arsenic in the US)
Manufacturing PhaseProcess lossesAssume 0.1% of consumption IC 9382 7 5 1 0.02 0.01 0.01 0.01 0.02 0.01 0.02 0.02 0.01 0.02 0.02
Use PhaseDirect dissipationagricultural chemicals 3 5 1 13.40 7.00 8.00 9.00 9.00 5.70 8.00 6.00 4.00 3.98 4.16
Post Use PhasePost use disposalwood preservatives 7 5 2 0.80 2.00 3.00 4.00 5.00 5.40 9.00 8.00 7.00 11.76 12.31glass 1 5 2 0.80 0.80 1.04 1.00 0.75 0.60 1.00 0.80 0.70 0.69 0.72alloys 1 5 2 0.08 0.20 0.26 0.28 0.09 0.08 0.12 0.10 0.08 0.10 0.11other 7 5 2 0.00 0.20 0.96 0.00 0.25 0.70 2.00 1.20 2.30 0.35 0.36
Recycling PhaseProcess losses assume 1% 0.004 0.010 0.013 0.014 0.005 0.004 0.006 0.005 0.004 0.005
Total Outputs 15.97 11.98 14.91 14.82 16.75 13.86 21.24 17.55 15.23 19.63 18.57
Additions to Stock
Links to Other Flows Arsenic losses in gangue report to copper mining and processing sites
Useswood preservatives 0.8 2.00 3.00 4.00 5.00 5.4 9.00 8.00 7.00 11.764 12.31agricultural chemicals 13.4 7.00 8.00 9.00 9.00 5.7 8.00 6.00 4.00 3.979 4.16glass 0.8 0.8 1.04 1.00 0.75 0.6 1.00 0.80 0.70 0.692 0.72alloys 0.4 1.00 1.30 1.40 0.45 0.4 0.6 0.48 0.42 0.519 0.54other 0.00 0.20 0.96 0.00 0.25 0.70 2.00 1.20 2.30 0.346 0.36Assume only alloy uses recycle in amounts shown above 0.20 0.96 0.00

WRI: THE WEIGHT OF NATIONS
121
Commodity Flow: Arsenic(1,000 metric tons)
1986 1987 1988 1989 1990 1991 1992 1993 1994 1995 1996
0.00 0.00 0.00 0.00 0.00 0.00 0.00 0.00 0.00 0.00 0.00 Domestic Production26.00 26.80 30.00 29.20 27.07 28.52 31.48 28.27 28.21 29.99 29.27 Imports
Recycling0.51 0.00 0.38 0.36 0.33 0.35 1.53 1.36 1.38 0.36 0.35 estimated @80% of alloy from lead acid batteries0.22 0.17 0.40 0.13 0.15 0.23 0.09 0.36 0.08 0.43 0.02 Exports
21.10 21.80 23.70 22.30 20.50 21.60 23.90 21.30 21.50 22.30 22.00 Apparent Use
OUTPUTS
Extraction Phase
Processing Phase
assume 40%0.00 0.00 0.00 0.00 0.00 0.00 0.00 0.00 0.00 0.00 0.00 domestic production (arsenic units)
(Based on information in USBM IC 9382, 1994, The Materials flow of Arsenic in the US)
Manufacturing PhaseProcess losses
0.02 0.02 0.02 0.02 0.02 0.02 0.02 0.02 0.02 0.02 0.02
Use PhaseDirect dissipation
4.85 5.01 5.45 4.91 4.51 4.75 2.87 2.56 2.58 1.12 1.10 agricultural chemicals
Post Use PhasePost use disposal
14.35 15.04 16.35 15.61 14.35 15.12 17.69 15.76 15.91 20.07 19.80 wood preservatives0.84 0.87 0.95 0.89 0.82 0.86 0.96 0.85 0.86 0.45 0.44 glass0.13 0.00 0.09 0.09 0.08 0.09 0.38 0.34 0.34 0.09 0.09 alloys0.42 0.44 0.47 0.45 0.41 0.43 0.48 0.43 0.43 0.22 0.22 other
Recycling Phase0.005 0.006 0.000 0.005 0.004 0.004 0.004 0.019 0.017 0.017 0.004 Process losses
20.62 21.39 23.35 21.97 20.20 21.28 22.41 19.98 20.16 21.97 21.67 Total Outputs
Additions to Stock
Links to Other Flows
Uses14.348 15.042 16.353 15.61 14.35 15.12 17.686 15.762 15.91 20.07 19.8 wood preservatives
4.853 5.014 5.451 4.906 4.51 4.752 2.868 2.556 2.58 1.115 1.1 agricultural chemicals0.844 0.872 0.948 0.892 0.82 0.864 0.956 0.852 0.86 0.446 0.44 glass0.633 0.0034 0.474 0.446 0.41 0.432 1.912 1.704 1.72 0.446 0.44 alloys0.422 0.436 0.474 0.446 0.41 0.432 0.478 0.426 0.43 0.223 0.22 Assume only alloy uses recycle in amounts shown above

WRI: THE WEIGHT OF NATIONS
122
Notes on Data Sources and Quality
The data used in this study were obtainedfrom a variety of sources and are not of uni-form quality. Some data come directly fromannual published figures, others are basedon technical judgments and estimates of rela-tionships. Detailed technical notes on datasources and formulae used in calculating out-puts may be found at the WRI Web addressnoted above.
Population and GDP
Population data are from the United NationsPopulation Division, Annual Populations 1950–2050, (The 1998 Revision). GDP is from the World Bank, World DevelopmentIndicators 1999.
Fossil Fuels
Coal combustion products: Waste from coalcombustion, including fly ash, bottom ash,slag, and flue gas desulfuration materialshave gradually gained value as raw materialfor other products. Originally compiled by anindustry association (American Coal AshAssociation), coal combustion products arenow also tracked by the U.S. GeologicalSurvey (USGS) as a mineral commodity. Datawere obtained from the Association and theUSGS. Missing data were interpolated. Theproduction of fly ash, bottom ash, slag, andflue gas desulfuration materials was esti-mated from coal consumption data.
Carbon dioxide emissions were derived fromdata supplied by the Carbon DioxideInformation and Analysis Center at the U.S.Department of Energy’s Oak Ridge NationalLaboratory.
Liquid and gas fossil fuel data were derivedfrom the U.S. Energy InformationAdministration’s report Annual Review ofEnergy 1996. Petroleum was converted tomass units on the basis of .135 metric tonsper barrel.
Processing waste from the production and pro-cessing of petroleum was estimated at 11.7 per-cent of domestic production. Toxic wastesfrom petroleum production were extractedfrom the U.S. Environmental ProtectionAgency (EPA) Toxic Release Inventory. Theproduction of nonfuel petrochemicals waseither counted as feed stocks for other prod-ucts or as end uses in themselves that wouldbe disposed of as waste or dissipated in use.
Natural gas was converted from cubic feetto metric tons on the basis of the weight ofmethane at standard temperature and pres-sure (653 grams per cubic meter). Hiddenflows from gas production were estimated at10 percent of production. Missing data onlosses from gas use for years prior to 1985were estimated on the basis of the 1985 ratioof losses to production.
Basic coal production data were derivedfrom the publications of the EnergyInformation Administration. Overburden, asa hidden flow, was estimated separately forsurface and underground mines. For under-ground mining, hidden flows were estimatedat 10 percent of coal mined (based on theGerman experience). For surface mining,estimation of hidden flows was more compli-cated. Based on the one extant publicationthat compares four western mines (averageoverburden ration 4.8:1) to one eastern sur-face mine (overburden ratio 26.9:1), thecountry was divided into two zones, west(including midwestern) and east, and these

WRI: THE WEIGHT OF NATIONS
123
ratios were applied to production in eachzone for each year using data found in theAnnual Energy Review 1996. Gangue was setat 5 percent of production as representing areasonable average figure for all forms ofcoal. Methane emissions from coal werereported based on the 1985 ratio of methaneto production.
Coal wastes and the chemical makeup of those wastes were derived from estimates ofash content (from Environmental ImpactAssessment [EIA] publications) as well asfrom general coal chemistry data (includingtrace elements) found in the Handbook ofCoal Chemistry, 1985.
Minerals and Metals
General References: MCS: Mineral CommoditySummaries, an annual report published bythe U.S. Bureau of Mines (USBM), now partof the USGS. MIS: Mineral Industry Surveysare commodity specific reports publishedannually or periodically by the USGS.Statistical Compendium: A USBM SpecialPublication published December 1993.Personal communication: Verbal informationor estimates were obtained from USGS com-modity specialists. The help of these special-ists facilitated the data gathering, and isgreatly appreciated.
Domestic production, import, export, recy-cling, and apparent use: These data are fromUSBM annual reports and the StatisticalCompendium of the USBM. Apparent usewas calculated from these data by consider-ing old (post-consumer) scrap only.
Overburden and gangue: For the most part,these are estimates based on the technicaljudgment of commodity specialists at the
USGS. The estimates of ore grade and over-burden were assumed to be constant for theentire time period. Exceptions to this wereiron ore, copper, and gold, where some timeseries data were available for average gradeand overburden, and for commodities wheremajor changes in mining practice or locationoccurred.
Process losses: These are entirely based ontechnical judgments, mainly by USGS com-modity experts.
Commodity uses data: These were obtainedmainly from the USGS annual mineral com-modity summaries, supplemented with information from the USBM StatisticalCompendium. A good deal of the commodityuse data is quite fine-grained and continu-ous, but much is spotty, discontinuous, andnot very detailed. Since these data are usedas a proxy for the fate of the material flow,their improvement would enhance the qualityof the entire database.
Recycling: Recycled flows were deductedfrom commodity use data based on selecteduses that are known to be recycled, or on apro rata basis. Where possible, these flowswere compared with EPA recycling data as acheck on accuracy.
Infrastructure
Highway earth moving: These data are derivedfrom detailed annual highway expendituredata by use of cost-estimating relationships.They represent reasonable order-of-magni-tude estimates of the amounts of materialhandled. A major deficiency is that there isno way to distinguish first movement fromsubsequent rehandling.
WRI: THE WEIGHT OF NATIONS
124
Private and public construction earth moving:These are derived from expenditure data inthe annual Economic Report to the President.Construction cost-estimating relationshipswere used to convert these expenditures toearth moving quantities. The quality of thesedata is similar to that for highways.
Dredging: These are annual cubic yardagequantities reported by the U.S. Army Corpsof Engineers. An average density was used toconvert to metric tons. Although the quantitydata are good, the ultimate disposition onland or water is speculative.
Agriculture
Most agricultural data were obtained fromAgricultural Statistics, published annually bythe U.S. Department of Agriculture. Someinformation was also obtained from the Foodand Agriculture Organization of the UnitedNations (FAO). A mass-balance approach, in which the products of a process are sub-tracted from the inputs to the process, wasused to arrive at outputs from processes forwhich there are no measured waste statistics.Other outputs not measured were arrived atusing multiplication factors, such as amountof manure per cow.
Soil erosion: Erosion rates were derivedfrom the U.S. Natural Resource Inventory,which is the five-year physical survey of thenon-federal land resources in the UnitedStates. Erosion estimates of federal lands,which amount to 21 percent of the total landarea, are explicitly excluded. This is net ero-sion from wind and water. Intermediate yearswere estimated by interpolation and out yearsby extrapolation from known rates of change.
Forestry
Data on production and products wereobtained from FAO and the U.S. Departmentof Agriculture Forest Service (USFS).Logging and mill residue data and their usesare from the Forest Inventory and Analysisgroup of the USFS. The breakdown of forestproducts into uses is based on FAO data.
Synthetic Organic Chemicals and Medical Chemicals
Data were taken from the production dataproduced by the U.S. International TradeCommission and published in its annualSynthetic Organic Chemicals. The last year theInternational Trade Commission collecteddata was 1996, but it ceased to aggregatedata in the manner reported here in 1994.Data for 1995 and 1996 are estimated here asidentical to that of 1994. Data collectionceased due to congressional mandate. Exceptfor medical chemicals and plastics, wastefrom end-use synthetic organic chemicalswas estimated at production. Recycling datawere used to estimate wastes from the pro-duction of plastics.
Waste from medical chemicals production,often in sludges and liquid waste carryingbiologically active ingredients, was estimatedto make up 1 percent of production. Wastefrom the use of medical chemicals—eitherthrough the excretion of biologically activeingredients or their biologically activemetabolites, or through their disposal at endof use—was estimated at 50 percent of pro-duction, the intermediate value in an esti-mated range of 30 to 90 percent.

WRI: THE WEIGHT OF NATIONS
125
1. Please note that the total domestic output (TDO)recorded from the U.S. economy (23 billiontons), plus net additions to stock (2 billion tons)do not tally with the 22 billion tons of totalmaterial requirement (TMR) documented in the1997 report: Resource Flows: the Material Basisof Industrial Economies. The input and outputdata cannot be directly compared in this way.This is due to a number of differences in theaccounting methodology used for each study.
An important factor is the earlier report’s inclu-sion of foreign hidden flows associated withimports in TMR, whereas this report is con-cerned only with domestic hidden flows.Another key factor is that the earlier reportexcludes atmospheric oxygen from direct mater-ial inputs to the economy, whereas the presentstudy includes oxygen (in carbon dioxide, oxidesof nitrogen, etc.) as part of waste outputs fromthe economy.
N O T E
Centre of Environmental Science (CML), Leiden UniversityVan Steenisgebouw, Einsteinweg 2, 2300 RA, Leiden, The Netherlandshttp://www.leidenuniv.nl/interfac/cml/ssp/
Institute for Interdisciplinary Studies of Austrian Universities (IFF) Department of Social Ecology, Schottenfeldgasse 29, A-1070 Vienna, Austriahttp://www.univie.ac.at/iffsocec
National Institute for Environmental Studies (NIES)16–2 Onogawa Tsukuba, Ibaraki 305–0053, Japanhttp://www.nies.go.jp/index.html
World Resources Institute (WRI)10 G Street N.E. Suite 800, Washington D.C. 20002, U.S.A.http://www.wri.org/wri/materials/
Wuppertal Institute (WI)Postfach 100480, Doppersberg 19, D-42103, Wuppertal, Germanyhttp://www.wupperinst.org
F O R F U R T H E R I N F O R M A T I O N

WRI: THE WEIGHT OF NATIONS
WRI’s Board of DirectorsWilliam D. Ruckelshaus, ChairmanJulia Marton-Lefèvre, Vice ChairManuel ArangoFrances G. BeineckeBert BolinRobert N. Burt David T. BuzzelliDeb CallahanMichael R. DelandSylvia A. EarleAlice F. EmersonJosé María Figueres Shinji FukukawaDavid GergenJohn H. GibbonsPaul GormanWilliam M. Haney, IIIDenis HayesCynthia R. HelmsSamuel C. JohnsonCalestous JumaYolanda KakabadseAditi KapoorJonathan LashJeffrey T. LeedsJane LubchencoMahmood MamdaniWilliam F. MartinMatthew Nimetz Ronald L. Olson Yi QianPeter H. RavenFlorence T. RobinsonJose SarukhanStephan SchmidheinyBruce SmartScott M. Spangler James Gustave SpethRalph TaylorAlvaro Umaña QuesadaPieter WinsemiusWren Wirth
Jonathan LashPresidentMatthew ArnoldSenior Vice President and Chief Operating OfficerAnthony JanetosSenior Vice President and Chief Program OfficerMarjorie BeaneVice President for Administration and Chief Financial OfficerLucy Byrd DorickVice President for DevelopmentKenton R. MillerVice President for International Development and ConservationDonna W. WiseVice President for Communications
The World Resources Institute (WRI) is an
independent center for policy research and
technical assistance on global environmental and
development issues. WRI’s mission is to move
human society to live in ways that protect Earth’s
environment and its capacity to provide for the
needs and aspirations of current and future
generations.
Because people are inspired by ideas, empowered
by knowledge, and moved to change by greater
understanding, the Institute provides—and helps
other institutions provide—objective information
and practical proposals for policy and institutional
change that will foster environmentally sound,
socially equitable development. WRI’s particular
concerns are with globally significant environ-
mental problems and their interaction with eco-
nomic development and social equity at all levels.
The Institute’s current areas of work include
economics, forests, biodiversity, climate change,
energy, sustainable agriculture, resource and
environmental information, trade, technology,
national strategies for environmental and resource
management, and business liaison.
In all of its policy research and work with
institutions, WRI tries to build bridges between
ideas and action, meshing the insights of scientific
research, economic and institutional analyses, and
practical experience with the need for open and
participatory decision-making.
WORLD RESOURCES INSTITUTE
10 G Street, N.E.
Washington, D.C. 20002, USA
http://www.wri.org/wri
World Resources Institute
Related Documents