0 AS OF SEPTEMBER 30 2020

Welcome message from author
This document is posted to help you gain knowledge. Please leave a comment to let me know what you think about it! Share it to your friends and learn new things together.
Transcript

0
A S O F S E P T E M B E R 3 0 2020

MONTHLY REPORT ON PANTAWID PAMILYA IMPLEMENTATION 1
Pantawid Pamilya
Monthly Implementation
Status Report
September 30, 2020 Contact Information: Planning, Monitoring and Evaluation Division Pantawid Pamilyang Pilipino Program 3rd Floor, Malasakit Building, DSWD Central Office IBP Road, Batasan Hills, Quezon City, Metro Manila 1126 Philippines Telephone Number: (632) 8-9623424 Voip: 88867 Email: [email protected] Last revised: October 16, 2020
MONTHLY REPORT ON PANTAWID PAMILYA IMPLEMENTATION 2
Contents
Executive Summary .................................................................................................................... 6
I. Geographic Coverage .................................................................................................... 8
II. Household Coverage ..................................................................................................... 8
III. Household Profile ....................................................................................................... 12
A. Grantees......................................................................................................... 12
B. Household Head............................................................................................. 14
C. Children .......................................................................................................... 14
D. Elderly Member ............................................................................................. 18
E. Indigenous People (IP) Households ............................................................... 21
F. Households with Persons with Disability (PWDs) .......................................... 24
G. Solo Parents ................................................................................................... 24
H. Pregnant Members ........................................................................................ 27
I. Households Engaged in Farming, Fishing, and/or Forestry ........................... 27
IV. Grants Released .......................................................................................................... 29
V. Systems and Updates .................................................................................................. 29
A. Beneficiary Updates System (BUS) ................................................................ 29
B. Compliance Verification System (CVS)........................................................... 30
C. Grievance Redress System (GRS) ................................................................... 32
VI. Human Resource ......................................................................................................... 34
VII. Other Accomplishments/Updates .............................................................................. 34
A. Partnership and Collaboration with National Government Agencies ........... 34
B. Other Accomplishments/Updates ................................................................. 35
MONTHLY REPORT ON PANTAWID PAMILYA IMPLEMENTATION 3
List of Tables
Table 1. Geographic Coverage of Pantawid Pamilya ................................................................. 8
Table 2. Cumulative Data of Registered 4Ps Households .......................................................... 8
Table 3. Regional Breakdown of the Number of Target and Actual Number of 4Ps
Beneficiaries .................................................................................................................. 9
Table 4. Regional Breakdown of the 4Ps Households ............................................................. 11
Table 5. Regional Breakdown of the Number of Grantees by Mode of Payment ................... 13
Table 6. Regional Breakdown of the Number of 4Ps Children by Age Group ......................... 15
Table 7. Regional Breakdown of the Number of 4Ps Children by Grade Level Group ............ 16
Table 8. Regional Breakdown of the Number of 4Ps Children in Regular Curriculum and
ADM/ALS ..................................................................................................................... 17
Table 9. Age Group and Sex of 4Ps Children by Grade Level Group ........................................ 18
Table 10. Age Group and Sex of Elderly Members by Region ................................................. 19
Table 11. Regional Breakdown of the Number of IP Households and Household Members .. 21
Table 12. Top Five Ethnolinguistic Groups with the Most Number of IP Households ............. 23
Table 13. Regional Breakdown of Solo Parent Household Members by Sex ........................... 26
Table 14. Regional Breakdown of Pregnant Members ............................................................ 27
Table 15. Distribution of Cash Grants Per Payment Mode ...................................................... 29
Table 16. Total Number of Updates by Region ........................................................................ 30
Table 17. Total Number of Updates by Typology .................................................................... 30
Table 18. Number of Monitored Children by Program Conditions ......................................... 31
Table 19. Compliance Rate of 4Ps Beneficiaries by Program Conditions ................................ 31
Table 20. Comparison of Present and Previous Compliance Rates ......................................... 31
Table 21. Regional Breakdown of the Number of Complaints ................................................ 32
Table 22. Total Number of Complaints Received by Category ................................................ 32
Table 23. Total Number of Delisted Households Based on the Existing Policies ..................... 33
Table 24. Total Number of Deactivated Households (Pending for Validation) ....................... 33
Table 25. Number of Approved Positions and Actual Program Personnel .............................. 34
Table 26. Regional Breakdown of Target and Accomplishment for SAP for 1st Tranche ......... 35
Table 27. Regional Breakdown of Target and Accomplishment for SAP for 2nd Tranche . Error!
Bookmark not defined.

MONTHLY REPORT ON PANTAWID PAMILYA IMPLEMENTATION 4
List of Figures
Figure 1. Regional Distribution of Active 4Ps Households ....................................................... 10
Figure 2. Percent Distribution of Active 4Ps Households by Region ....................................... 11
Figure 3. Percentage of Male and Female Grantees in the Program ...................................... 12
Figure 4. Percentage of Male and Female Grantees within Each Regions .............................. 13
Figure 5. Percentage of Grantees by Mode of Payment.......................................................... 13
Figure 6. Percentage of Male and Female Household Head by Region ................................... 14
Figure 7. Percentage of Boys and Girls (Children) within Each Region ................................... 16
Figure 8. Percent Distribution of Households Beneficiaries with Elderly Member by Region 18
Figure 9. Regional Distribution of Elderly among 4Ps Active ................................................... 20
Figure 10. Regional Distribution of 4Ps IP Households ............................................................ 22
Figure 11. Proportion of IP Household in the Program by Region........................................... 23
Figure 12. Type of Disabilities Among Pantawid Pamilya Households with PWDs ................. 24
Figure 13. Percent Distribution of Household Beneficiaries with Solo Parents by Region ...... 24
Figure 14. Regional Distribution of 4Ps Households with Solo Parents ................................... 25
Figure 15. Percentage of 4Ps Households Engaged in Farming, Fishing, and/or Forestry ...... 28
Figure 16. Per-Island Distribution of Grievances ..................................................................... 32

MONTHLY REPORT ON PANTAWID PAMILYA IMPLEMENTATION 5
Appendix
Appendix 1. Number of Active Pantawid Pamilya Beneficiary Households By Region, Province, City/Municipality, and Set ........................................................................... 37
MONTHLY REPORT ON PANTAWID PAMILYA IMPLEMENTATION 6
Executive Summary The Pantawid Pamilyang Pilipino Program (4Ps) is the pioneer conditional cash transfer program implemented in 2008 by the national government with the Department of Social Welfare and Development (DSWD) as the lead implementing agency. On April 17, 2020, 4Ps became a regular program of the national government thru the passage of Republic Act 11310 or “An Act Institutionalizing the Pantawid Pamilyang Pilipino Program”, or shortly “4Ps Act”. The law positions 4Ps as both a human capital development program and as the national poverty reduction strategy of the national government thru convergence with other pro-poor programs and services. As of September 30, 2020, the program covers a total of 4,303,731 active household beneficiaries across 41,676 barangays in the entire country. This figure shows a 1,925 decrease from last month’s count of active households. The figure nevertheless represents 97.8% of the target 4,400,000 target households based the General Appropriations Act for fiscal year 2020. 4Ps provides cash grants to qualified household beneficiaries based on their compliance with specific conditions linked to school participation, nutrition and health services availment, and family development. However, compliance monitoring is temporarily suspended since 2020 Period 1 (February-March) in support to Proclamation No. 922, which declared a State of Public Health Emergency throughout the Philippines due to the Corona Virus Disease (Covid 19) pandemic. Thus, all monitored beneficiaries are relieved temporarily of their responsibility to comply with the conditionalities of the program. As of September 2020, a total ₱48,940,490,600.00 have been paid to 4Ps households. Of this amount, 18.7% are education grants, 45.0% are health grants, and 36.3% are rice subsidies. Rice subsidies are additional cash transfers provided on top of the 4Ps education and health grants since year 2017 coming from the President’s State of the Nation Address in 2016. Cash grants are delivered to 4Ps households through either cash cards or over-the-counter payments. As of reporting period, 88.9% receive their grants through cash cards, and the remaining 11.1% are through over-the-counter (OTC) payments, most of which are from BARMM where there is an ongoing data clean up. 4Ps is continuously improving its payment modalities with a shift towards digital payments, especially during the pandemic period when close person-to-person transactions, such as OTC payouts, are discouraged. DSWD is also presently implementing a Social Amelioration Program (SAP) that provides emergency subsidies to about 18 million low-income households affected by the progressive lockdown due to the pandemic. The subsidy ranges from 5,000 to 8,000 pesos, depending on their region of origin, based on the regional minimum wage differentials, for two tranches, from April to August 2020. All 4Ps households are automatically covered by the SAP. As of reporting period, DSWD successfully paid 4,287,445 4Ps households for first tranche and 1,387,130 for the second tranche. 4Ps manages three major systems: Beneficiary Updates System (BUS), Compliance Verification System (CVS), and Grievance Redress System (GRS). BUS contains recent information on and updates to the status of household beneficiaries which serve as basis for monitoring compliance to program conditions. A total of 666,832 updates have been encoded and approved in September 2020. Most of these updates are related to household beneficiaries’ requests to update their children’s education information (84.7%) and basic information in the BUS (4.4%).

MONTHLY REPORT ON PANTAWID PAMILYA IMPLEMENTATION 7
Meanwhile, CVS monitors and processes data on compliance of household beneficiaries to the conditions set by the program, which, in turn, becomes the basis for provision of cash grants. However, due to ‘force majeure’ declaration, the beneficiaries are relieved temporarily of their responsibility to comply with the conditions to enable them to receive grants to mitigate the risks and impacts of pandemic. Lastly, GRS keeps a record of the complaints received by the program through various modes such as calls, grievance forms, social networking sites, and electronic mail. A total of 99,398 complaints have been recorded as of reporting period. Most of these complaints have already been resolved (89.1%) and are related to issues on SAP (35.3%) and on cash card (28.1%). GRS also shows the total number of delisted and deactivated households. This month, 78,241 household beneficiaries have been delisted because of validation results showing that they are not qualified to receive program benefits. Another 637,667 household beneficiaries have been deactivated, and 35.3% of them are still waiting for the results of the ongoing validation.

MONTHLY REPORT ON PANTAWID PAMILYA IMPLEMENTATION 8
I. Geographic Coverage
Pantawid Pamilyang Pilipino Program, or 4Ps was first implemented in 2008 as the Philippines’ version of conditional cash transfer program covering 160 cities and municipalities in 28 provinces in the 17 regions of the country. With the increase in budget allocated to the program is it expansion in terms of geographical areas covered. As of September 30, 2020, the program is covering 41,676 barangays in all 146 cities and 1,482 municipalities across 80 provinces nationwide as shown in Table 1.
Table 1. Geographic Coverage of Pantawid Pamilya
GEOGRAPHIC AREA
NATIONWIDE COUNT
TARGET AREAS
ACTUAL AREAS
COVERAGE (%)
REGION 17 17 17 100.0
PROVINCE 81 801 80 100.0
CITY 146 146 146 100.0
MUNICIPALITY 1,488 1,4822 1,482 100.0
BARANGAY 42,046 42,016 41,676 99.2
II. Household Coverage
The household beneficiaries of the program are being sourced from the Listahanan, or Listahan ng mga Sambahayang Nangangailan (List of Households “in Need”). Listahanan serves as the national household targeting system (NHTS) for poverty reduction programs in the Philippines. In order to be eligible for 4Ps, the household should be among those identified by Listahanan as poor and with a pregnant household member and/or with children 0-18 years old. Since its inception, 4Ps has already served 5,084,835 poor households nationwide (see Table 2). As of September 30, 2020, 4Ps is still serving 4,303,731 active household beneficiaries. Others have already exited primarily due to no longer having a household eligible for the program.
Table 2. Cumulative Data of Registered 4Ps Households
HOUSEHOLD CLASSIFICATION TOTAL
Total No. of Registered HHs 5,084,835
Still Eligible to Receive Grants 4,303,731
Still Eligible to Receive Grants But On-Hold Pending Data Updates or Resolution of Grievances 225,108
No Longer Eligible to Receive Grants 555,996
Fraud 10,397 Waived 39,255 Duplicate 30,921 No More Eligible Members 434,253 Income above poverty threshold 31,474 Other Reasons 9,696
The figure represents 97.8% of the 4,400,000 target households as provided for in the Philippine Development Plan (PDP) 2017 to 2022 and stipulated in the General Appropriations Act FY 2020. The program also covers specific marginalized groups
1The Province of Batanes is not covered by program because of its high Human Development Index and Zero Poverty Incidence (PSA-NSCB, 2009). 2The island municipality of Kalayaan, Palawan is not covered because there are only 12 households (PSA-NSO, 2007).

MONTHLY REPORT ON PANTAWID PAMILYA IMPLEMENTATION 9
such as itinerant IPs, homeless street families, IPs in geographically isolated and disadvantaged areas, and families in need of special protection due to natural and man-made calamities.
Table 3 presents the regional breakdown of the number of this year’s target and actual beneficiaries as of September 30, 2020. At the national level, 97.8% of the target number of 4Ps beneficiaries has already been reached. At the regional level, the highest percentages of the actual against the target number of 4Ps beneficiaries are in BARMM and Region I with more than 100.0% of their targets. This is followed by Regions CARAGA (99.8%), and II and VI (99.1%); the lowest percentages are from Regions XI (96.0%), CAR (93.7%) and IX (92.5%).
Table 3. Regional Breakdown of the Number of Target and Actual Number of 4Ps Beneficiaries
The current number of active 4Ps household beneficiaries shows a decrease of 1,925 household beneficiaries from the update in August 2020. Such decrease is primarily due to being no longer eligible to Pantawid Pamilya, wherein the households’ last child/ren being monitored has/have already reached 19 years old or graduated from high school. Moeover, the table above shows that most of the beneficiaries are from Luzon with 1,769,800 or 41.1% of the total households nationwide. This is followed by Mindanao with 1,646,677 or 38.3% of the total households nationwide. Visayas, on the other hand, only has 887,254 household beneficiaries or 20.6% of the nationwide total. Figure 1 illustrates the magnitude of actual beneficiaries by region as reflected in Table 3.
Island / Region
Target vs. Actual
Target Actual Difference Percentage
(%) NCR 227,341 221,196 6,145 97.3% CAR 63,894 59,855 4,039 93.7% I 204,742 206,050 (1,308) 100.6% II 106,212 105,306 906 99.1% III 297,237 294,141 3,096 99.0% IV-A CALABARZON 325,640 318,381 7,259 97.8% MIMAROPA 200,534 194,342 6,192 96.9% V 378,232 370,529 7,703 98.0% Luzon 1,803,832 1,769,800 34,032 98.1% VI 325,411 322,433 2,978 99.1% VII 294,186 284,897 9,289 96.8% VIII 286,839 279,924 6,915 97.6% Visayas 906,436 887,254 19,182 97.9% IX 323,074 298,717 24,357 92.5% X 272,074 266,279 5,795 97.9% XI 267,976 257,178 10,798 96.0% XII 255,357 247,837 7,520 97.1% Caraga 189,279 188,862 417 99.8% BARMM 381,972 387,804 (5,832) 101.5% Mindanao 1,689,732 1,646,677 43,055 97.5% Grand Total 4,400,000 4,303,731 96,269 97.8%

MONTHLY REPORT ON PANTAWID PAMILYA IMPLEMENTATION 10
Figure 1. Regional Distribution of Active 4Ps Households

MONTHLY REPORT ON PANTAWID PAMILYA IMPLEMENTATION 11
Figure 2 and Table 4 show the distribution (number and percentage) of active household beneficiaries by region. It can be noted that BARMM has the highest number of active beneficiaries at 387,804 households, accounting for 9.0% of the total number of active household beneficiaries nationwide.
Table 4. Regional Breakdown of the 4Ps Households
Island / Region SETS 1 - 9 HSF IP-GIDA Itinerant IP FNSP Grand Total
NCR 218,250 2,936 2 3 5 221,196 CAR 57,625 - 2,212 - 18 59,855 I 203,640 - 2,410 - - 206,050 II 99,737 - 5,568 - 1 105,306 III 289,879 69 4,180 - 13 294,141 IV-A CALABARZON 317,310 14 823 220 14 318,381 MIMAROPA 179,842 - 14,492 3 5 194,342 V 365,452 - 5,046 - 31 370,529 Luzon 1,731,735 3,019 34,733 226 87 1,769,800 VI 319,334 - 3,077 - 22 322,433 VII 271,002 480 2,525 - 10,890 284,897 VIII 266,324 2 114 - 13,484 279,924 Visayas 856,660 482 5,716 - 24,396 887,254 IX 273,920 10 22,855 126 1,806 298,717 X 248,983 171 17,026 - 99 266,279 XI 229,136 1 28,028 1 12 257,178 XII 227,802 - 20,007 - 28 247,837 Caraga 172,758 246 15,851 - 7 188,862 BARMM 356,509 - 31,285 - 10 387,804 Mindanao 1,509,108 428 135,052 127 1,962 1,646,677 Grand Total 4,097,503 3,929 175,501 353 26,445 4,303,731
Percentage (%) 95.2% 0.1% 4.1% 0.0% 0.6% 100.0%
Figure 2. Percent Distribution of Active 4Ps Households by Region
0.0
1.0
2.0
3.0
4.0
5.0
6.0
7.0
8.0
9.0
10.0
5.1
1.4
4.8
2.4
6.8
7.4
4.5
8.6
7.5
6.6
6.5
6.9
6.2
6.0
5.8
4.4
9.0
Pe
rce
nta
ge o
f H
ou
seh
old
s
(Mindanao)(Visayas)(Luzon)
Region

MONTHLY REPORT ON PANTAWID PAMILYA IMPLEMENTATION 12
Also included in the Top 5 regions with highest number of active 4Ps households are Region V, with 370,529 (8.6%) households; Region VI, with 322,433 (7.5%) households; Region IV-A CALABARZON, with 318,381 (7.4%) households; and Region IX, with 298,717 (6.9%) households. On the other hand, CAR has the least number of active 4Ps household beneficiaries, with 59,855 households only or 1.4% of the total active households nationwide. The region is followed by Region II with 105,306 (2.4%) households; Caraga with 188,862 (4.4%) households; MIMAROPA Region with 194,342 (4.5%) households; and Region I, with 206,050 (4.8%) households. Looking at marginalized groups, majority of the beneficiaries are Indigenous Peoples in Geographically Isolated and Disadvantaged Areas (IP-GIDA) with 175,501 households accounting for 4.1% of the total number of active 4Ps household beneficiaries nationwide. The IPs in GIDA are mostly coming from Mindanao, particularly in BARMM with 31,285 household; Regions XI with 28,028 households; and Region IX with 22,855 households. Families in Need of Special Protection (FNSP) accounts for 0.6% or 26,445 household beneficiaries of the total household beneficiaries nationwide. Majority of the FNSPs are coming from Region VIII with 13,484 households, and Region VII with 10,890 households. Most of Homeless Street Families (HSF) come from NCR with 2,936 households, accounting for only 0.1% or 3,929 households of the total 4Ps household beneficiaries nationwide. Only 353 households are classified as Itinerant Indigenous Peoples (Itinerant IPs), which covers less than 0.1% of the total households in the country.
III. Household Profile A. Grantees
Grantee refers to the household member authorized to withdraw or receive the grants from the program. Figure 3 shows the percentage of male and female grantees. The program currently has more female grantees than males grantees. There are 3,694,065 female grantees or 85.8% and 609,666 male grantees or 14.2% of the total active household beneficiaries nationwide. Based on regional data in Figure 4, NCR has the highest percentages of female grantees at 90.3% while CAR has the lowest at 77.4%. As such, these two regions also have the lowest and highest percentage of male grantees at 9.7% and 22.6%, respectively.
85.8% 14.2%
Figure 3. Percentage of Male and Female
Grantees in the Program

MONTHLY REPORT ON PANTAWID PAMILYA IMPLEMENTATION 13
Figure 4. Percentage of Male and Female Grantees within Each Regions
Figure 5 shows the national distribution of grantees according to their mode of payment (MOP). Of the 4,303,731 active households, 3,823,927 (88.9%) households receive their grants via cash card; the remaining 479,804 (11.1%) households avail over- the- counter payments.
Table 5 presents the regional breakdown of the above figures. It can be observed that the percentages of cash card holders per region vary. However, majority (16 out of the 17 regions) has a higher percentage of cash card holders than those claiming grants over the counter.
.
Table 5. Regional Breakdown of the Number of Grantees by Mode of Payment
Island / Region
Mode of Payment Total % Cash Card
Cash Card OTC NCR 213,554 7,642 221,196 96.5% CAR 59,623 232 59,855 99.6% I 204,949 1,101 206,050 99.5% II 103,694 1,612 105,306 98.5% III 287,880 6,261 294,141 97.9% IV-A CALABARZON 317,025 1,356 318,381 99.6% MIMAROPA 185,718 8,624 194,342 95.6% V 352,302 18,227 370,529 95.1% Luzon 1,724,745 45,055 1,769,800 97.5% VI 313,577 8,856 322,433 97.3% VII 283,305 1,592 284,897 99.4% VIII 252,871 27,053 279,924 90.3% Visayas 849,753 37,501 887,254 95.8% IX 295,154 3,563 298,717 98.8% X 246,106 20,173 266,279 92.4% XI 254,105 3,073 257,178 98.8% XII 240,398 7,439 247,837 97.0% CRG 186,954 1,908 188,862 99.0% BARMM 26,712 361,092 387,804 6.9% Mindanao 1,249,429 397,248 1,646,677 75.9% Grand Total 3,823,927 479,804 4,303,731 88.9% Percentage (%) 88.9% 11.1% 100.0%
Card 88.9%
OTC 11.1%
Figure 5. Percentage of Grantees by
Mode of Payment
0.0
10.0
20.0
30.0
40.0
50.0
60.0
70.0
80.0
90.0
100.0
90
.3
77
.4 83
.2
80
.9
87
.6
87
.4
84
.9 88
.1
85
.9 88
.1
85
.3
81
.0
87
.7
81
.4 87
.6
83
.3 87
.2
9.7
22
.6
16
.8 19
.1
12
.4
12
.6 15
.1
11
.9 14
.1
11
.9 14
.7 19
.0
12
.3 18
.6
12
.4 16
.7
12
.8
Pe
rce
nta
ge o
f H
ou
seh
old
s
Region Female Male(Visayas) (Mindanao)(Luzon)

MONTHLY REPORT ON PANTAWID PAMILYA IMPLEMENTATION 14
Of these 16 regions, Region CAR has almost saturated the use of cash card as MOP to all its beneficiaries, covering 99.6% of its household beneficiaries. This is followed by IV-A CALABARZON (99.6%), Region I (99.5%), Region VII (99.4%), and CARAGA (99.0%).
B. Household Head
The head of the household is an adult person, male of female, who is responsible for the organization and care of the household, who is regarded as such by the members of the household3. Majority of the 4Ps households are male-headed (89.8%). Figure 6 shows the percentage of male and female household heads by region. Among the 17 regions, Region BARMM has the highest percentage of female-headed households (14.7%). Following this are NCR (13.0%), Region XII (12.4%), Region IX (12.2%), and Region VII (11.7%).
Figure 6. Percentage of Male and Female Household Head by Region
C. Children
Table 6 presents the number of Pantawid Pamilya children4 by region and age group. Overall, Pantawid Pamilya is covering 7,629,415 eligible children 0 to 18 years old5 nationwide. Most of these eligible children come from Region V accounting for 725,394 children or 9.5% of the total number of eligible children nationwide. Included in the Top 5 regions with the highest number of eligible children are BARMM with 655,101 children (8.6%); Region VI with 617,711 children (8.1%); Region IV-A CALABARZON with 604,615 children (7.9%); and Region VII with 534,619 children (7.0%).
3Source: 2010 Census of Population and Housing (CPH) & 2015 Population Census (POPCEN) 4The term “children” is operationally defined as household members who are sons/daughters/grandsons/granddaughters of the household heads. 5 The age of children reflected in the profile is computed as the difference between the birthday of the children and date of the latest reporting database (30 September 2020).
0.0
10.0
20.0
30.0
40.0
50.0
60.0
70.0
80.0
90.0
100.0
13
.0
9.2
10
.5
9.9
9.8
8.5
6.2
8.2
8.8
11
.7
9.0
12
.2
9.8
6.7
12
.4
10
.6
14
.7
87
.0
90
.8
89
.5
90
.1
90
.2
91
.5
93
.8
91
.8
91
.2
88
.3
91
.0
87
.8
90
.2
93
.3
87
.6
89
.4
85
.3
Pe
rce
nta
ge o
f H
ou
seh
old
s
Region Female Male
(Visayas) (Mindanao)(Luzon)

MONTHLY REPORT ON PANTAWID PAMILYA IMPLEMENTATION 15
Regions CAR, II, and Caraga are the bottom 3 regions in terms of child coverage. CAR has 106,106 children (1.4%); Region II has 191,407 children (2.5%); and Caraga has 320,157 children (4.2%).
Table 6. Regional Breakdown of the Number of 4Ps Children by Age Group
Island / Region
Age Group (Years Old)
Total Percentage
(%)
0 to 2 3 to 5 6 to 14 15 to 18 NCR 2,525 8,820 209,781 179,263 400,389 5.2% CAR 1,388 4,579 49,437 50,702 106,106 1.4% I 4,808 16,715 196,612 160,358 378,493 5.0% II 1,789 6,958 99,057 83,603 191,407 2.5% III 2,696 11,309 279,116 235,635 528,756 6.9% IV-A CALABARZON 5,005 19,327 312,673 267,610 604,615 7.9% MIMAROPA 4,977 18,305 172,066 154,608 349,956 4.6% V 5,295 18,245 360,610 341,244 725,394 9.5% Luzon 28,483 104,258 1,679,352 1,473,023 3,285,116 43.1% VI 6,047 20,239 312,630 278,795 617,711 8.1% VII 3,510 17,628 274,540 238,941 534,619 7.0% VIII 3,128 13,622 245,401 236,187 498,338 6.5% Visayas 12,685 51,489 832,571 753,923 1,650,668 21.6% IX 4,485 16,991 255,390 209,316 486,182 6.4% X 1,633 8,420 213,240 213,822 437,115 5.7% XI 1,820 9,741 208,606 179,741 399,908 5.2% XII 989 5,238 192,692 196,249 395,168 5.2% CARAGA 3,682 13,104 162,151 141,220 320,157 4.2% BARMM 498 1,966 296,621 356,016 655,101 8.6% Mindanao 13,107 55,460 1,328,700 1,296,364 2,693,631 35.3%
Grand Total 54,275 211,207 3,840,623 3,523,310 7,629,415 100.0%
Percentage (%) 0.7% 2.8% 50.3% 46.2% 100.0%
In terms of age brackets, majority of them are 6 to 14 years old, accounting for 3,840,623 or 50.3% of the total number of eligible children nationwide. This is followed by those in the 15 to 18-year-old age group with 3,523,310 children (46.2%). There are only a few children that fall under the 0 to 2 year-old and the 3 to 5-year-old age brackets. The 3 to 5-year-old age group only has 211,207 (2.8%) and the remaining 54,275 children are within the 0 to 2-year-old age bracket accounting for only for 0.7% of the total number of eligible children.

MONTHLY REPORT ON PANTAWID PAMILYA IMPLEMENTATION 16
Figure 7 shows the percentage of boys and girls (children) within each region. Region I has the highest proportion of boys (52.1%) while BARMM has the lowest (50.1%).
Table 7. Regional Breakdown of the Number of 4Ps Children by Grade Level Group
Island / Region No Grade
Level Reported
Kindergarten Grades 1-6 (Primary Educ)
Grades 7-10 (Junior HS)
Grades 11-12 (Senior HS) Total
Percentage (%)
K 1-5 6 7-9 10 11 12
NCR 30,174 20,695 114,365 35,951 123,752 24,440 37,441 13,571 400,389 5.2%
CAR 5,418 9,635 22,747 4,101 40,398 3,850 15,654 4,303 106,106 1.4%
I 22,313 32,353 96,261 14,938 133,305 13,845 51,744 13,734 378,493 5.0%
II 9,389 15,088 51,946 8,919 70,978 6,753 22,089 6,245 191,407 2.5%
III 30,309 33,694 139,028 35,240 184,611 27,901 58,132 19,841 528,756 6.9%
IV-A CALABARZON 43,897 38,687 163,177 37,683 206,463 27,965 66,660 20,083 604,615 7.9%
MIMAROPA 21,436 33,485 89,211 12,610 125,645 9,159 47,300 11,110 349,956 4.6%
V 48,679 61,081 179,425 33,419 259,697 30,409 91,779 20,905 725,394 9.5%
Luzon 211,615 244,718 856,160 182,861 1,144,849 144,322 390,799 109,792 3,285,116 43.1%
VI 36,572 50,683 160,040 48,592 211,743 42,278 53,917 13,886 617,711 8.1%
VII 34,284 43,912 142,942 23,101 193,959 16,935 65,472 14,014 534,619 7.0%
VIII 23,937 42,959 120,349 16,034 193,181 15,373 70,638 15,867 498,338 6.5%
Visayas 94,793 137,554 423,331 87,727 598,883 74,586 190,027 43,767 1,650,668 21.6%
IX 19,009 38,880 142,934 49,334 159,185 34,153 32,226 10,461 486,182 6.4%
X 11,503 31,203 116,604 42,708 156,647 34,162 32,778 11,510 437,115 5.7%
XI 14,685 29,725 115,760 38,966 136,186 27,482 28,566 8,538 399,908 5.2%
XII 12,703 22,333 111,267 43,087 141,387 23,408 32,017 8,966 395,168 5.2%
CARAGA 14,584 28,969 86,380 13,812 114,392 12,381 40,528 9,111 320,157 4.2%
BARMM 67,286 67,349 197,413 173,877 107,638 29,231 8,202 4,105 655,101 8.6%
Mindanao 139,770 218,459 770,358 361,784 815,435 160,817 174,317 52,691 2,693,631 35.3%
Grand Total 446,178 600,731 2,049,849 632,372 2,559,167 379,725 755,143 206,250 7,629,415 100.0%
Percentage (%) 5.8% 7.9% 26.9% 8.3% 33.5% 5.0% 9.9% 2.7% 100.0%
Figure 7. Percentage of Boys and Girls (Children) within Each Region
40.0
42.0
44.0
46.0
48.0
50.0
52.0
54.0
51
.9
52
.0
52
.1
52
.0
52
.0
51
.9
51
.5 52
.0
51
.9
51
.6
51
.8
51
.4
51
.3
51
.5
51
.2 51
.6
50
.1
48
.1
48
.0
47
.9
48
.0
48
.0
48
.1 48
.5
48
.0
48
.1
48
.4
48
.2 48
.6
48
.7
48
.5
48
.8
48
.4
49
.9
Pe
rce
nta
ge
Region Boys Girls
(Visayas) (Mindanao)(Luzon)

MONTHLY REPORT ON PANTAWID PAMILYA IMPLEMENTATION 17
Table 7 shows the distribution of children by grade level. Almost half of the total number of children monitored by the program is monitoring are in Grades 7 to 10 (Junior High School) accounting for 2,938,892 children (38.5%). This is followed by children in Grades 1 to 6 (Primary Education) accounting for 2,682,221 children or 35.2% of the total number of monitored children. Lastly, 961,393 children are in Grades 11-12 or Senior High School representing 12.6% of the total number of Pantawid Pamilya children nationwide. Further, there are 632,372 children in Grade 6 or 8.3% of the total number of children covered by the program expected to move up to Junior High School. Another 379,725 children in Grade 10 (5.0%) are expected to move up to Senior High School; while 206,250 children in Grade 12 (2.7%) are expected to complete basic education and pursue college degrees.
Table 8. Regional Breakdown of the Number of 4Ps Children in Regular Curriculum and ADM/ALS
Island/ Region
Elementary Junior and Senior HS Total
Regular Curriculum (Grades 1 to 6)
ADM/ALS (Elementary)
Regular Curriculum (Grades 7 to 12)
ADM/ALS (Secondary)
Regular Curriculum (Grades 1 to 12)
ADM/ALS (Elementary and Secondary)
NCR 149,696 620 197,423 1,781 347,119 2,401 CAR 26,542 306 61,981 2,224 88,523 2,530 I 110,560 639 208,111 4,517 318,671 5,156 II 60,117 748 102,479 3,586 162,596 4,334 III 173,587 681 284,797 5,688 458,384 6,369 IV-A CALABARZON 199,780 1,080 316,655 4,516 516,435 5,596 MIMAROPA 100,421 1,400 187,866 5,348 288,287 6,748 V 211,918 926 396,114 6,676 608,032 7,602 Luzon 1,032,621 6,400 1,755,426 34,336 2,788,047 40,736 VI 206,985 1,647 314,021 7,803 521,006 9,450 VII 164,970 1,073 284,938 5,442 449,908 6,515 VIII 135,426 957 289,214 5,845 424,640 6,802 Visayas 507,381 3,677 888,173 19,090 1,395,554 22,767 IX 191,522 746 230,764 5,261 422,286 6,007 X 157,578 1,734 229,398 5,699 386,976 7,433 XI 153,770 956 195,365 5,407 349,135 6,363 XII 153,905 449 204,008 1,770 357,913 2,219 CARAGA 99,535 657 173,045 3,367 272,580 4,024 BARMM 371,239 51 149,131 45 520,370 96 Mindanao 1,127,549 4,593 1,181,711 21,549 2,309,260 26,142
Grand Total 2,667,551 14,670 3,825,310 74,975 6,492,861 89,645
Percentage (%) 40.5% 0.2% 58.1% 1.1% 98.6% 1.4%
Table 8 shows the distribution of children enrolled under the regular curriculum of Elementary (Grades 1-6), Junior and Senior High School (Grades 7-12), and in ADM/ALS. Of the total number of children enrolled in Grades 1-12, 6,492,861 children (98.6%) are under regular curriculum, while the remaining 89,645 children (1.4%) under ADM/ALS. Moreover, of the total number of children 6-14 years old, there are about 14,670 children (0.2%) enrolled in Elementary ADM/ALS. Most of whom are from Regions X, VI, MIMAROPA, IV-A CALABARZON and VII; about 74,975 children (1.1%) are enrolled in secondary ADM/ALS, and most of whom are from Regions VI, V, VIII, X, and III.

MONTHLY REPORT ON PANTAWID PAMILYA IMPLEMENTATION 18
Table 9. Age Group and Sex of 4Ps Children by Grade Level Group
Grade Level
Age Group (Years Old) Sex
Total Percentage
(%)
0 to 2 3 to 5 6 to 14 15 to 18 Girl Boy
Kindergarten - 109,366 470,404 20,961 312,011 288,720 600,731 7.9% Grades 1-6 - - 2,179,541 502,680 1,444,588 1,237,633 2,682,221 35.2% Grades 7-10 - - 954,826 1,984,066 1,526,515 1,412,377 2,938,892 38.5% Grades 11-12 - - - 961,393 412,274 549,119 961,393 12.6% No Grade Level Reported
54,275 101,841 235,852 54,210 240,600 205,578 446,178 5.8%
TOTAL 54,275 211,207 3,840,623 3,523,310 3,935,988 3,693,427 7,629,415 100.0% Percentage (%) 0.7% 2.8% 50.3% 46.2% 51.6% 48.4% 100.0%
Table 9 presents the age group and sex of children by grade level. For children in Kindergarten, 470,404 out of 600,731 (78.3%) children are within the 6 to 14-year-old age group and there is no pronounced sex variance. For Grades 1-6, 2,179,541 out of 2,682,221 (81.3%) children are within the 6 to 14-year-old age group, and majority of them are females at about 53.9%. For Junior High School (Grades 7-10), 1,984,066 out of 2,938,892 (67.5%) children belong to the 15 to 18-year-old age group, with no pronounced sex variance. For Senior High School (Grades 11-12), all 961,393 children are within the 15 to 18-year-old age group and 57.1% are males.
D. Elderly Member
Older people, elderly, or senior citizen is defined as individuals belonging to the age group 60 years and over6. As of September 30, 2020, there are 760,471 households that have at least one (1) elderly member. This represents 15.0% of the total 4,303,731 households. At the regional level, CAR has the highest percentage of households with elderly member/s at 22.1% (13,206 out of 59,855). This is followed by Region VIII (20.9%), Region VI (20.7%), Region I (20.5%), and Region VII (20.2%). Meanwhile, BARMM has the lowest percentage at 13.0% (50,455 out of 387,804).
Figure 8. Percent Distribution of Households Beneficiaries with Elderly Member by Region
6 Philippine Statistcs Authority (PSA)
0.0
5.0
10.0
15.0
20.0
25.0
16
.1
22
.1
20
.5
17
.8
17
.6
16
.6
15
.4
19
.6 20
.7
20
.2
20
.9
17
.5
15
.2 16
.9
15
.1
19
.5
13
.0
Region
Pro
po
rtio
n o
f H
ou
seh
old
s w
ith
Eld
erl
y
(Luzon) (Visayas) (Mindanao)

MONTHLY REPORT ON PANTAWID PAMILYA IMPLEMENTATION 19
Table 10. Age Group and Sex of Elderly Members by Region
Island/Region Age Group (Years Old) Sex
Total Percentage
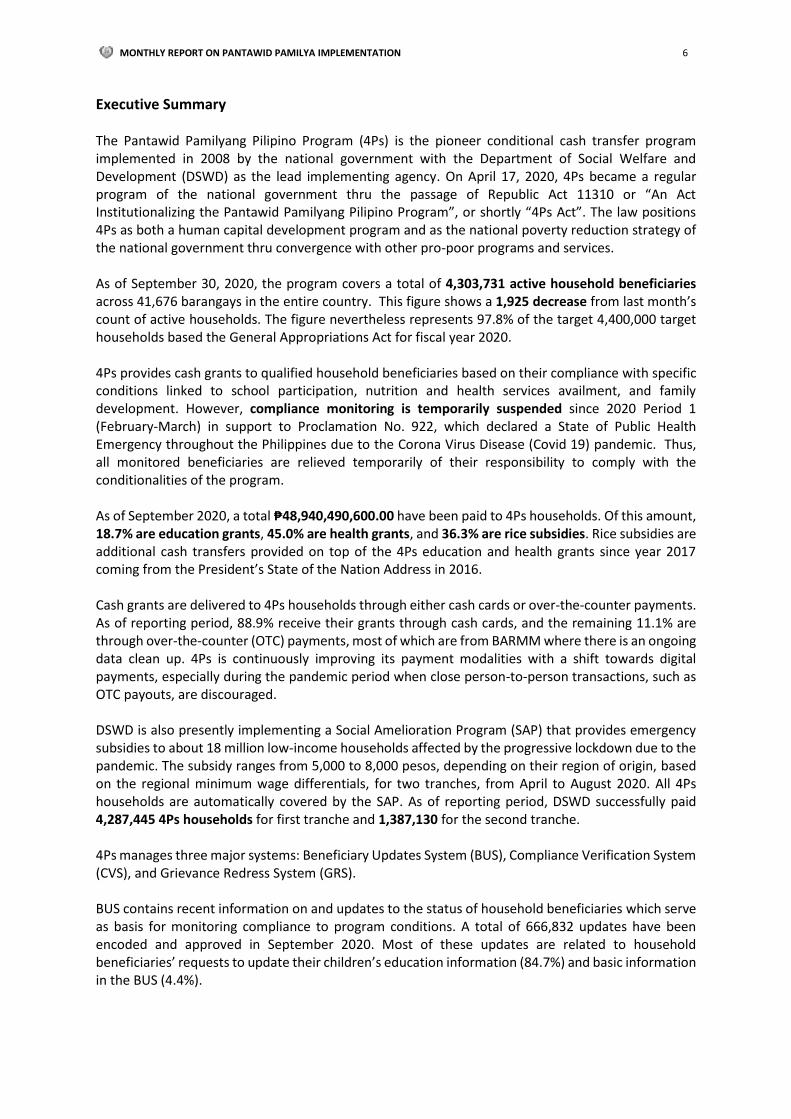
(%) 60 to 69 70 to 79 80 and above Male Female NCR 24,057 9,014 2,497 26,200 9,368 35,568 4.6% CAR 8,780 3,154 1,331 11,443 1,822 13,265 1.7% I 26,617 11,519 4,170 33,660 8,646 42,306 5.5% II 13,358 4,033 1,520 16,236 2,675 18,911 2.5% III 33,461 13,657 4,818 41,917 10,019 51,936 6.8% IV-A CALABARZON 35,676 12,967 4,281 42,335 10,589 52,924 6.9% MIMAROPA 20,894 6,917 2,293 26,050 4,054 30,104 3.9% V 46,717 19,376 6,956 61,082 11,967 73,049 9.5% Luzon 209,560 80,637 27,866 258,923 59,140 318,063 41.4% VI 45,116 15,937 5,834 56,669 10,218 66,887 8.7% VII 37,660 15,624 5,676 47,820 11,140 58,960 7.7% VIII 35,722 16,630 6,571 50,672 8,251 58,923 7.7% Visayas 118,498 48,191 18,081 155,161 29,609 184,770 24% IX 34,236 13,755 5,213 43,774 9,430 53,204 6.9% X 28,214 9,393 3,362 34,829 6,140 40,969 5.3% XI 29,720 11,008 3,624 37,819 6,533 44,352 5.8% XII 25,867 8,852 3,183 32,459 5,443 37,902 4.9% CARAGA 24,222 9,739 3,491 31,861 5,591 37,452 4.9% BARMM 33,889 12,867 4,685 41,171 10,270 51,441 6.7% Mindanao 176,148 65,614 23,558 221,913 43,407 265,320 34.5% Grand Total 504,206 194,442 69,505 635,997 132,156 768,153 100.0% Percentage (%) 65.6% 25.3% 9.0% 82.8% 17.2% 100.0%
As of September 30, 2020, there are 768,153 elderly members among active 4Ps households. Table 10 shows its regional breakdown by age group and sex. Among regions, Region V has the highest percentage of elderly members (9.5%). This is followed by the regions in Visayas – Region VI (8.7%), and Region VII and VIII (7.7%). Also included in the list of top regions with most number of elderly members is Region IX (6.9%). In terms of sex, majority are males (82.8%), while the minority are females (17.2%). Lastly, based on their age, most of them are aged 60 to 69 years old (65.6%). Following this are 70 to 79 years old (25.3%), and the remaining are 80 years old and above (9.0%). Figure 9 illustrates the magnitude of elderly members within active 4Ps households. Old dependency ratio is the ratio of persons in the old “dependent” ages (over 64 years) to persons in the “working” ages (15 to 64 years).[1] As of September 2020, the old dependency ratio is 40 which means that for every 100 persons aged 15 to 64 years, there are about 40 dependents aged 65 years and older.
MONTHLY REPORT ON PANTAWID PAMILYA IMPLEMENTATION 20
Figure 9. Regional Distribution of Elderly among 4Ps Active
MONTHLY REPORT ON PANTAWID PAMILYA IMPLEMENTATION 21
E. Indigenous People (IP) Households
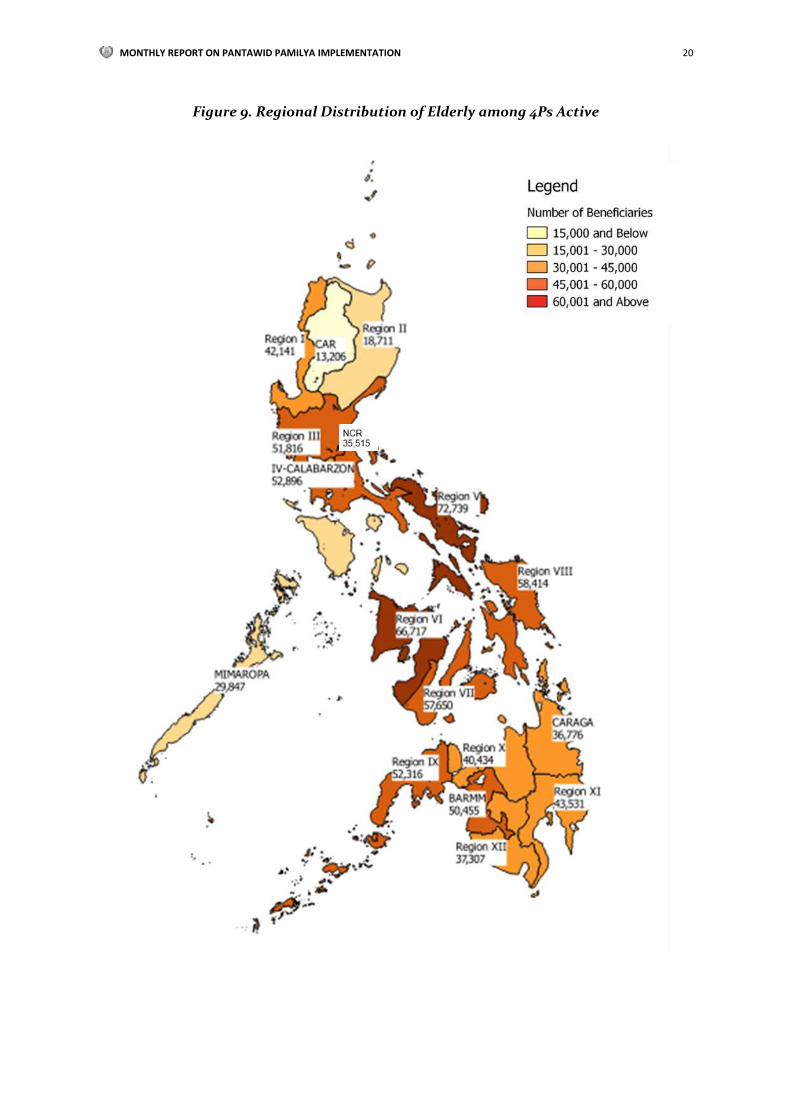
Table 11 presents the regional breakdown of IP households and household members. Out of the 4,303,731 households, 665,575 (15.5%) are Indigenous Peoples, with – 484,588 (72.8%) households coming from Mindanao; 161,765 (24.3%) from Luzon; and 19,222 (2.9%), from Visayas. Moreover, across regions, BARMM has the highest number of IPs households and household members, accounting for 114,280 (17.2%) households and 597,946 (16.8%) household members. This is followed by Region XI with 106,478 households (16.0%) and 546,022 (15.3%) household members; and Region IX with 88,710 households (13.3%) and 445,250 household members (12.5%). Figure 10 illustrates the magnitude of IP households in the country.
Table 11. Regional Breakdown of the Number of IP Households and
Household Members
Island/ Region
No. of IP Households
Percentage (%)
No. IP Household Members
Percentage (%)
NCR 586 0.1% 3,175 0.1% CAR 38,708 5.8% 246,983 6.9% I 13,769 2.1% 78,519 2.2% II 32,497 4.9% 205,622 5.8% III 12,556 1.9% 66,613 1.9% IV-A CALABARZON 2,929 0.4% 15,569 0.4% MIMAROPA 53,550 8.0% 292,545 8.2% V 7,170 1.1% 36,108 1.0% Luzon 161,765 24.3% 945,134 26.5% VI 15,257 2.3% 92,839 2.6% VII 3,690 0.6% 18,075 0.5% VIII 275 0.0% 1,270 0.0% Visayas 19,222 2.9% 112,184 3.1% IX 88,710 13.3% 445,250 12.5% X 55,640 8.4% 287,200 8.1% XI 106,478 16.0% 546,022 15.3% XII 81,500 12.2% 429,586 12.1% CARAGA 37,980 5.7% 198,272 5.6% BARMM 114,280 17.2% 597,946 16.8% Mindanao 484,588 72.8% 2,504,276 70.3%
Grand Total 665,575 100.0% 3,561,594 100.0%

MONTHLY REPORT ON PANTAWID PAMILYA IMPLEMENTATION 22
Figure 10. Regional Distribution of 4Ps IP Households

MONTHLY REPORT ON PANTAWID PAMILYA IMPLEMENTATION 23
Figure 11. Proportion of IP Household in the Program by Region
Based on the percentage of IP households by region as shown in Figure 11 CAR has the highest share, representing 64.7% of its total household beneficiaries. Meanwhile, Region VIII has the lowest share with only 0.1% that are IPs. Figure 10 further illustrates the magnitude of IPs by region.
Table 12 shows the top five ethno-linguistic groups with the most number of IP households in the program. Most of the IP households are Tingguian-Itneg accounting for 53,861 (8.1%) IP household beneficiaries. This is followed by the Subanon (7.6%), Manobo (7.3%), Sama (5.1%), and Maguindanaon (3.9%).
Table 12. Top Five Ethnolinguistic Groups with the Most Number
of IP Households
Ethno-linguistic Group No. of IP HHs Percentage in
Total IP Pantawid HHs (%)
Tingguian-Itneg 53,861 8.1%
Subanon 50,430 7.6%
Manobo 48,542 7.3%
Sama 34,107 5.1%
Maguindanaon 25,750 3.9%
0.0
10.0
20.0
30.0
40.0
50.0
60.0
70.0
0.3
64
.7
6.7
30
.9
4.3
0.9
27
.6
1.9
4.7
1.3
0.1
29
.7
20
.9
41
.4
32
.9
20
.1
29
.5
Region
Pe
rce
nta
ge
(Luzon) (Visayas) (Mindanao)

MONTHLY REPORT ON PANTAWID PAMILYA IMPLEMENTATION 24
Figure 12. Type of Disabilities Among Pantawid Pamilya Households with PWDs
Figure 13. Percent Distribution of Household Beneficiaries with Solo Parents by Region
F. Households with Persons with Disability (PWDs)7
The program is also accounting for the number of households with at least one (1) member classified as person with disability (PWD). Out of the total 4,305,731 Pantawid households, 203,354 (4.7%) households are with PWDs. Figure 12 then presents that most of these have household members with visual impairment at 34,632 cases; followed by those with multiple disabilities at 29,725 cases; and those with orthopedic disabilities at 28,703 cases.
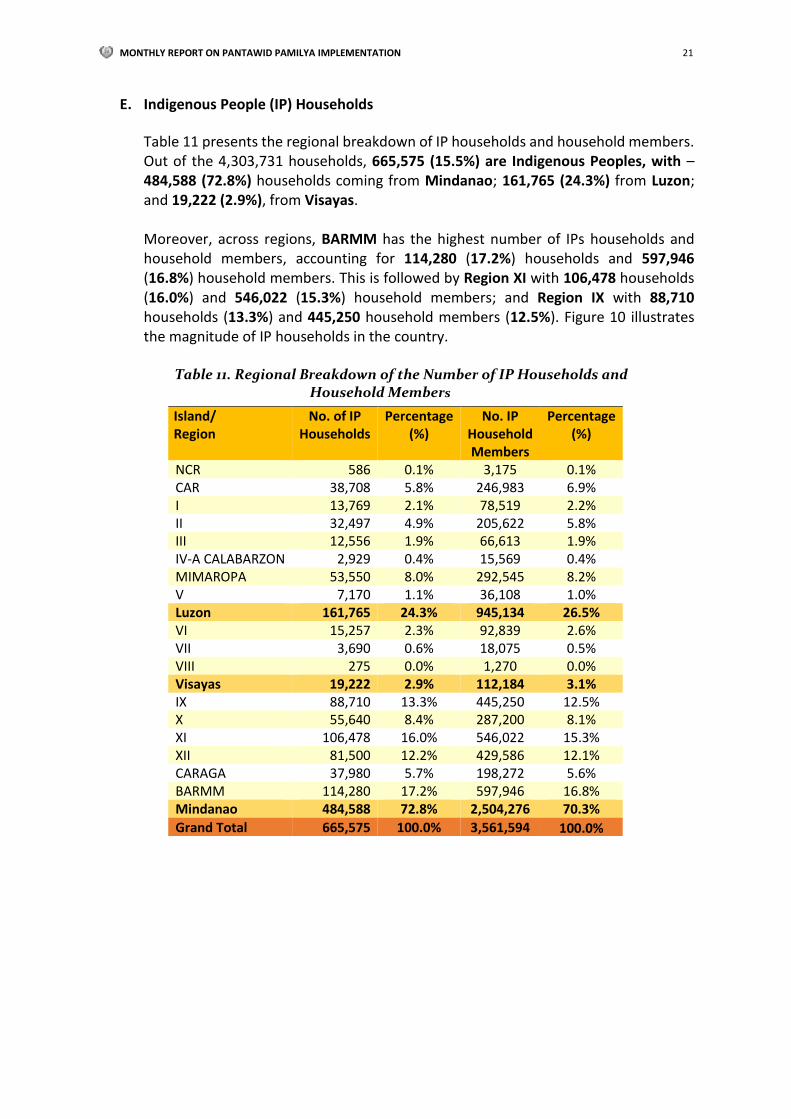
G. Solo Parents Republic Act No. 8972, or the “Solo Parents Welfare Act of 2000” recognizes solo parents as part of the disadvantaged sector in the Philippines. As of August 31, 2020, there are 270,194 solo parents in the program, representing 6.3% of the Pantawid Pamilya households nationwide. At the regional level, NCR has the biggest percentage of solo parents at 11.6% (25,749 out of 221,196 households) as reflected in Figure 13 below. Region X, on the other hand, has the least percentage with only 4.3% or 11,476 out of 266,279 households. Figure 14 illustrates the magnitude of shouseholds with solo parents nationwide.
7Covers Set 2 onwards since the variable on PWD was not included in the Household Assessment Form (HAF) for Set 1 beneficiaries.
1 in every 20 4Ps Households has PWD
1 in every 20 4Ps Households has PWD
0.0
2.0
4.0
6.0
8.0
10.0
12.0 11
.6
5.3
5.2
6.2
8.1
6.3
5.8 6.2
5.4
6.5
5.6 5.7
4.3
5.6
5.5
4.9
7.4
Region
Pro
po
rtio
n o
f H
ou
seh
old
s
(Luzon) (Visayas) Mindanao
MONTHLY REPORT ON PANTAWID PAMILYA IMPLEMENTATION 25
Figure 14. Regional Distribution of 4Ps Households with Solo Parents

MONTHLY REPORT ON PANTAWID PAMILYA IMPLEMENTATION 26
Looking at the individual level, Table 13 shows the regional breakdown of the number of household members that are solo parents disaggregated by sex. Of the total 345,884 solo parent household members, 67.0% or 231,688 are females, while the remaining 33.0% or 114,196 are males. At the regional level, BARMM has the highest percentage of solo parents with 48,963 household members (14.2%). This is followed by NCR (9.6%), Region III (8.6%), Region V (8.4%), and Region IV-A CALABARZON (7.7%).
Table 13. Regional Breakdown of Solo Parent Household Members by Sex
Region Male Female Total Percentage
(%) NCR 8,117 25,016 33,133 9.6% CAR 1,026 2,943 3,969 1.1% I 3,507 8,601 12,108 3.5% II 2,798 5,074 7,872 2.3% III 9,522 20,340 29,862 8.6% IV-A CALABARZON 8,149 18,323 26,472 7.7% MIMAROPA 7,218 9,609 16,827 4.9% V 9,481 19,740 29,221 8.4% Luzon 49,818 109,646 159,464 46.1% VI 5,209 13,592 18,801 5.4% VII 5,113 16,115 21,228 6.1% VIII 5,323 11,661 16,984 4.9% Visayas 15,645 41,368 57,013 16.5% IX 9,440 13,606 23,046 6.7% X 4,243 8,344 12,587 3.6% XI 5,965 10,992 16,957 4.9% XII 6,071 10,460 16,531 4.8% CARAGA 4,048 7,275 11,323 3.3% BARMM 18,966 29,997 48,963 14.2% Mindanao 48,733 80,674 129,407 37.4% Grand Total 114,196 231,688 345,884 100.0% Percentage (%) 33.0% 67.0% 100.0%

MONTHLY REPORT ON PANTAWID PAMILYA IMPLEMENTATION 27
H. Pregnant Members
As of September 30, 2020, there are 19,654 pregnant household members of 4Ps households. Table 14 present its breakdown by region. Majority of the pregnant members are from Mindanao (67.6%) – most of which are from BARMM with 6,197 (31.5%), Region XI with 2,204 (11.2%), and Region X with 1,539 (7.8%). Meanwhile, minority are from Region CAR (1.4%), Region II (1.5%), and Region I and VI (1.7%).
Table 14. Regional Breakdown of Pregnant Members
Island / Region No. of Pregnant
Percentage (%)
NCR 363 1.8% CAR 276 1.4% I 338 1.7% II 290 1.5% III 720 3.7% IV-A CALABARZON 927 4.7% MIMAROPA 1,136 5.8% V 824 4.2% Luzon 4,874 24.8% VI 325 1.7% VII 518 2.6% VIII 652 3.3% Visayas 1,495 7.6% IX 1,120 5.7% X 1,539 7.8% XI 2,204 11.2% XII 1,518 7.7% CARAGA 707 3.6% BARMM 6,197 31.5% Mindanao 13,285 67.6% Grand Total 19,654 100.0%
I. Households Engaged in Farming, Fishing, and/or Forestry Out of the 4,305,731 Pantawid households, about 1,934,763 (45.0%) households have at least one member engaged in farming, fishing, and/or forestry. Of this figure, 890,188 (46.0%) households are from Mindanao as shown in Figure 15. This leaves 636,450 (32.9%) households to Luzon; and 408,125 (21.1%) households to Visayas. Lastly, households not engaged in farming, which comprises the other half of the household population are government and private employees, practicing professionals, technicians and associate professionals, clerks, service and/or shops and market sales workers, trades and related workers, plant and machine operators and assemblers, laborers, and unskilled workers. Figure 15 illustrates the magnitude of households with farmers, fisherfolks and/or foresters in the country.

MONTHLY REPORT ON PANTAWID PAMILYA IMPLEMENTATION 28
Figure 15. Percentage of 4Ps Households Engaged in Farming, Fishing, and/or Forestry

MONTHLY REPORT ON PANTAWID PAMILYA IMPLEMENTATION 29
IV. Grants Released
From June to July 2020 (Period 3 of 2020), the total amount of cash grants released is PhP 11,166,895,450.00 paid to eligible and compliant 4Ps household beneficiaries. Of this amount, PhP 2,910,700.00 is for education grants, PhP 6,202,212,750.00 is for health grants and Php 4,961,772,400.00 is for rice subsidy. In an effort to continuously improve the delivery of grants, the Department, through the Land Bank of the Philippines, is engaging other service providers such as local rural banks, and cooperatives as partner conduits. Table 15 below shows the distribution of cash grants based on available payment modes.
Table 15. Distribution of Cash Grants Per Payment Mode
Payment Mode
Conduit Financial Institution
Education Grant
Health Grant Rice Subsidy Total Amount8 Percentage
(%) Landbank Cash Card
2,884,300.00
5,504,436,000.00
4,403,548,800.00
9,910,869,100.00
88.8
Philippine Veterans Bank Card
8,700.00
89,499,000.00
71,599,200.00
161,106,900.00
1.4
Cash Card Total 2,893,000.00 5,593,935,000.00 4,475,148,000.00 10,071,976,000.00 90.2
2,400.00 474,024,750.00 379,219,800.00 853,246,950.00 7.6
15,300.00 134,253,000.00 107,404,200.00 241,672,500.00 2.2
Over the Counter Total 17,700.00 608,277,750.00 486,624,000.00 1,094,919,450.00 9.8
Grand Total 2,910,700.00 6,202,212,750.00 4,961,772,000.00 11,166,895,450.00 100.0
V. Systems and Updates
A. Beneficiary Updates System (BUS)
The BUS records changes on the status or condition of households. It captures recent information about household members to serve as basis in monitoring the compliance of beneficiaries. Updating is a continuous process to ensure that beneficiaries are availing the maximum health and education grants. In September 2020, a total of 666,832 updates were encoded and approved. The breakdown of the total number of updates per region is shown in Table 16. MIMAROPA has the highest turnout of updates of beneficiaries for the current month with a total of 92,355 updates. Also in the Top 5 regions with the highest number of updates are Regions VII (85,328 updates), X (69,511 updates), I (50,767 updates), and XII (48,946 updates).
8 Total amount released based from Period 6 2018 to Period 5 of 2019 (October to November 2019) compliance monitoring for CY 2019 Obligations

MONTHLY REPORT ON PANTAWID PAMILYA IMPLEMENTATION 30
Table 16. Total Number of Updates by Region
Region No. of
Updates Percentage
(%) NCR 37,317 5.6 CAR 20,610 3.1 I 50,767 7.6 II 33,633 5.0 III 27,906 4.2 IV-A CALABARZON 38,925 5.8 MIMAROPA 92,355 13.8 V 17,419 2.6 Luzon 318,932 47.8 VI 6,251 0.9 VII 85,328 12.8 VIII 13,620 2.0 Visayas 105,199 15.8 IX 31,326 4.7 X 69,511 10.4 XI 9,487 1.4 XII 48,946 7.3 CARAGA 44,286 6.6 BARMM 39,145 5.9 Mindanao 242,701 36.4 Grand Total 666,832 100.0
Of the total number of updates, education information has been filed for updating the most with 564,793 (84.7%) updates followed by update of basic information with 29,378 (4.4%) updates.
Table 17. Total Number of Updates by Typology
Type of Update No. of Updates
Received Percentage
(%)
Education Information 564,793 84.7
Correction of Basic Information 29,378 4.4
Child Selection 26,029 3.9
IP Affiliation 10,286 1.5
Additional household member 15,928 2.4
Change of grantee 7,000 1.0
Change of Address 3,223 0.5
Succeeding Pregnancy 3,186 0.5
Deceased beneficiaries 1,047 0.2
Health Facility 5,229 0.8
Newborn 733 0.1
Grand Total 666,832 100.0
B. Compliance Verification System (CVS)
The CVS monitors the compliance of households with the conditions of the program as basis for the provision of grants. Table 18 on one hand below shows the distribution of monitored children by sex, IP affiliation, age group and program condition. As of P3 (June – July) 2020, there are 357,946 0-5 years old children monitored for health conditions. Among these monitored children, 51.0% are male while 49.0% are female. Moreover, 20.0% are members of IP while 80.0% are non-IP.

MONTHLY REPORT ON PANTAWID PAMILYA IMPLEMENTATION 31
Table 18. Number of Monitored Children by Program Conditions
Program Condition
Monitored Children Total Sex IP and Non-IP Age Group
Male Female IP Non-IP 0-5 6-14 15-18
Health9 182,640 175,306 71,467 286,479 357,946 - - 357,946
Total 182,640 175,306 71,467 286,479 357,946 - - 357,946
Table 19 shows the compliance rate of household by program condition as of P3 (June- July) 2020. It can be observed that there is no monitoring of children for education since these months are vacation period. For Health and FDS, 100.0% compliance of the households is attributed to the suspension of all program conditions in support to the Proclamation No. 922, s.2020 declaring a State of Public Health Emergency throughout the Philippines due to the Corona Virus Disease (Covid 19)"; thus, all monitored beneficiaries are deemed compliant in all conditions.
Table 19. Compliance Rate of 4Ps Beneficiaries by Program Conditions
Table 20 shows the comparison of the present and previous compliance rates of the beneficiaries per program condition. It can be observed that the previous P2 (April- May) 2020 and present P3 (June-July) 2020 compliance rate are all at 100.0% across education, health, and FDS due to the declaration of force majeure.
Table 20. Comparison of Present and Previous Compliance Rates
9Monitored Children Aged 0-5 years old for Health; No compliance monitoring on Education during the months of June and July (Adjusted
start of class due to pandemic) 10 Monitored Children whose facility are still for updating are not deemed compliant 11 Deworming is conducted twice annually for each child ages 6-14 that are enrolled in elementary school
Program Condition Number of Monitored
Compliant Beneficiaries10
% Compliance (Compliant over
Monitored)
EDUCATION (Children 3-18) - - -
HEALTH
Check-up/immunization for Pregnant and Children 0-5 years old
361,646 361,646 100.00
FAMILY DEVELOPMENT SESSION
Attendance to FDS by Parents 4,285,500 4,285,500 100.00
Program Condition
% Compliance (Compliant over Monitored)
Previous Present
EDUCATION (Children 3-18)
Attendance in Day Care Center/Pre- School for Children 3-5 years old - -
Attendance in Primary and Secondary Schools for Children 6-14 years old - -
Attendance in Primary and Secondary Schools for Children 15-18 years old - -
HEALTH
Check-up/immunization for Pregnant and Children 0-5 years old 100.0 100.0
Health (deworming) for Children 6-14 years old in Elementary Level11 - -
FAMILY DEVELOPMENT SESSION
Attendance to FDS by Parents 100.0 100.0
MONTHLY REPORT ON PANTAWID PAMILYA IMPLEMENTATION 32
C. Grievance Redress System (GRS)
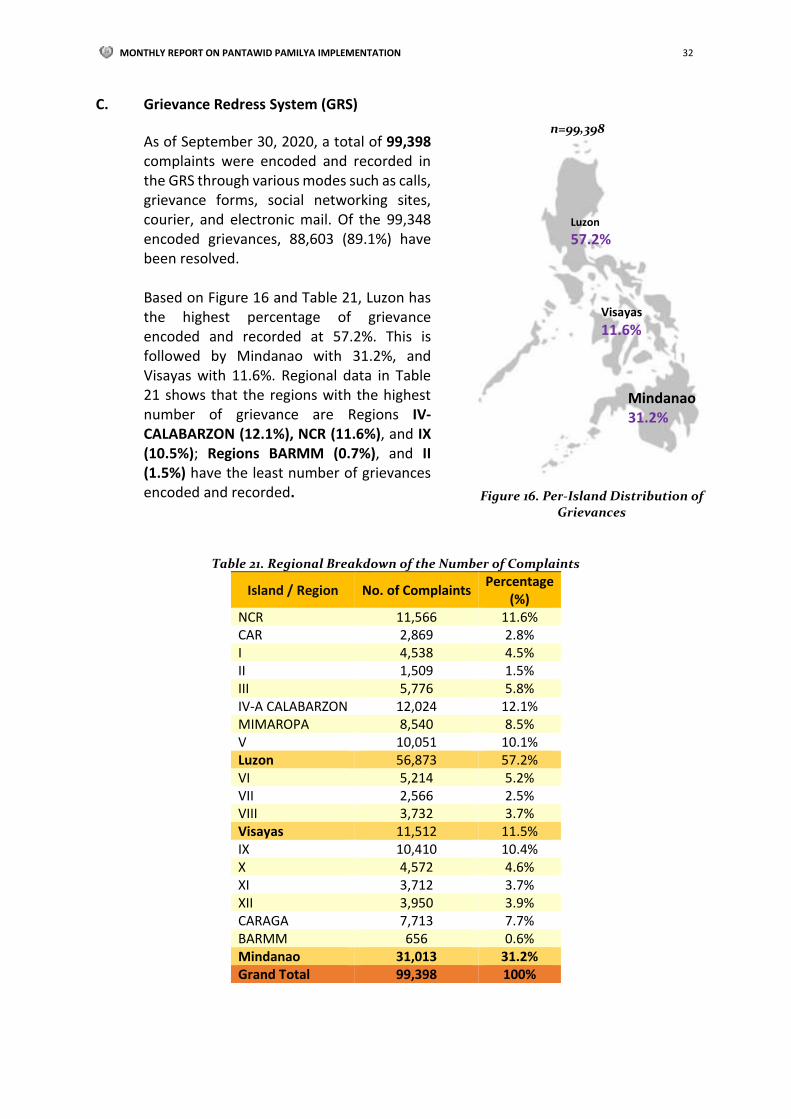
As of September 30, 2020, a total of 99,398 complaints were encoded and recorded in the GRS through various modes such as calls, grievance forms, social networking sites, courier, and electronic mail. Of the 99,348 encoded grievances, 88,603 (89.1%) have been resolved. Based on Figure 16 and Table 21, Luzon has the highest percentage of grievance encoded and recorded at 57.2%. This is followed by Mindanao with 31.2%, and Visayas with 11.6%. Regional data in Table 21 shows that the regions with the highest number of grievance are Regions IV-CALABARZON (12.1%), NCR (11.6%), and IX (10.5%); Regions BARMM (0.7%), and II (1.5%) have the least number of grievances encoded and recorded.
Table 21. Regional Breakdown of the Number of Complaints
Island / Region No. of Complaints Percentage
(%) NCR 11,566 11.6% CAR 2,869 2.8% I 4,538 4.5% II 1,509 1.5% III 5,776 5.8% IV-A CALABARZON 12,024 12.1% MIMAROPA 8,540 8.5% V 10,051 10.1% Luzon 56,873 57.2% VI 5,214 5.2% VII 2,566 2.5% VIII 3,732 3.7% Visayas 11,512 11.5% IX 10,410 10.4% X 4,572 4.6% XI 3,712 3.7% XII 3,950 3.9% CARAGA 7,713 7.7% BARMM 656 0.6% Mindanao 31,013 31.2% Grand Total 99,398 100%
Mindanao 31.2%
Luzon
57.2%
n=99,398
Visayas
11.6%
Mindanao
46.2%
Mindanao
46.2%
Mindanao
46.2%
Mindanao 39.6%
Mindanao
46.2%
Minda
Figure 16. Per-Island Distribution of Grievances
MONTHLY REPORT ON PANTAWID PAMILYA IMPLEMENTATION 33
Table 22. Total Number of Complaints Received by Category
Grievance Category On-
Going Resolved Total
% Resolved
Resolved within the
GRS timeline
% Resolved within GRS
timeline Appeals 444 1,331 1,775 74.99% 1,276 95.87% Cash Card-Related Issues 3,956 23,929 27,885 85.81% 23,585 98.56% Facility Issues 1 0 1 0.00% 0 Grievance On Partner Performance 10 37 47 78.72% 37 100.00% Grievance On Staff Performance 24 54 78 69.23% 53 98.15% Ineligibility 327 1,408 1,735 81.15% 1,164 82.67% Misbehavior Of Beneficiary 1,150 10,171 11,321 89.84% 9,995 98.27% Payment-Related Issues 2,745 16,673 19,418 85.86% 16,645 99.83% Support Services Intervention Issues 1 46 47 97.87% 46 100.00% Gender-related issues 50 498 548 90.88% 493 99.00% SAP issues 2,039 33,008 35,047 94.18% 25,561 77.44% Request for Social Services 1 3 4 75.00% 3 100.00% Others 47 1,445 1,492 96.85% 1,437 99.45% Total 10,795 88,603 99,398 89.14% 80,295 95.77%
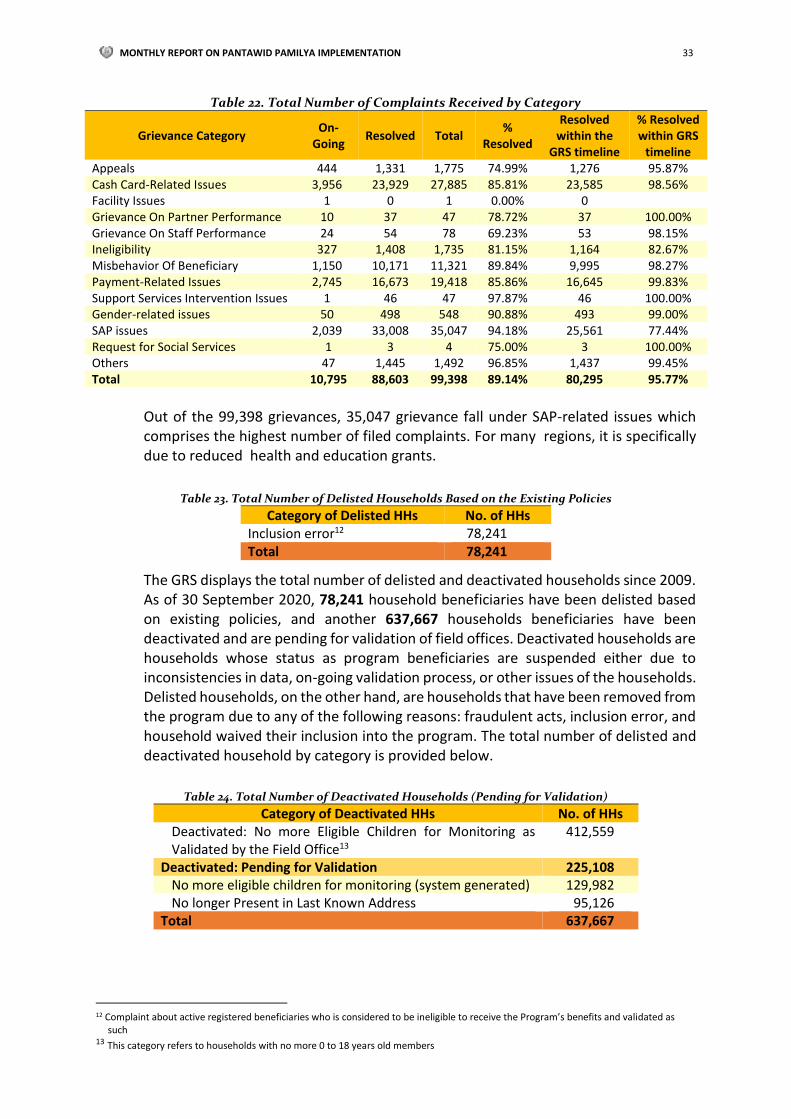
Out of the 99,398 grievances, 35,047 grievance fall under SAP-related issues which comprises the highest number of filed complaints. For many regions, it is specifically due to reduced health and education grants.
Table 23. Total Number of Delisted Households Based on the Existing Policies
Category of Delisted HHs No. of HHs Inclusion error12 78,241 Total 78,241
The GRS displays the total number of delisted and deactivated households since 2009. As of 30 September 2020, 78,241 household beneficiaries have been delisted based on existing policies, and another 637,667 households beneficiaries have been deactivated and are pending for validation of field offices. Deactivated households are households whose status as program beneficiaries are suspended either due to inconsistencies in data, on-going validation process, or other issues of the households. Delisted households, on the other hand, are households that have been removed from the program due to any of the following reasons: fraudulent acts, inclusion error, and household waived their inclusion into the program. The total number of delisted and deactivated household by category is provided below.
Table 24. Total Number of Deactivated Households (Pending for Validation)
Category of Deactivated HHs No. of HHs Deactivated: No more Eligible Children for Monitoring as Validated by the Field Office13
412,559
Deactivated: Pending for Validation 225,108 No more eligible children for monitoring (system generated) 129,982 No longer Present in Last Known Address 95,126
Total 637,667
12 Complaint about active registered beneficiaries who is considered to be ineligible to receive the Program’s benefits and validated as
such 13 This category refers to households with no more 0 to 18 years old members

MONTHLY REPORT ON PANTAWID PAMILYA IMPLEMENTATION 34
VI. Human Resource
A total of 14,051 technical and administrative positions assigned at the National and Regional Offices (including personnel assigned at the covered provinces and cities/municipalities) have been approved for the program. As of September 30 2020, 13,347 personnel have been hired (95.0% of the total number of approved positions). Additionally, 8,783 personnel are hired for contractual position (65.8% of the total number of hired personnel).
Table 25. Number of Approved Positions and Actual Program Personnel
Level Number of Approved
Positions Number of Hired
Personnel Percentage
(%)
Contractual 292 266 91.1
Cost of Service (MOA) 98 67 68.4
SUB-TOTAL 390 333 85.4
Contractual 8,733 8,517 97.5
Cost of Service (MOA) 4,928 4,497 91.3
SUB-TOTAL 13,661 13,014 95.3
GRAND TOTAL 14,051 13,347 95.0
VII. Other Accomplishments/Updates
A. Partnership and Collaboration with National Government Agencies
Partnership with Commission on Higher Education, Department of Labor and Employment and Philippine Association of State Universities and Colleges on the Student Grants in-Aid Program for Poverty Alleviation (SGP-PA) and the Expanded SGP-PA. For Academic Year 2018-2019, there are a total of 6,414 graduates. Out of the total number of graduates, 252 graduated with honors and awards. Out of these, 17 are Magna Cum Laude, and 235 are Cum Laude. Moreover, as of September 2020, there are still 3,532 continuing ESGP-PA grantees for AY 2019-2020.
Partnership with Philippine Health Insurance Corporation (PhilHealth). The Philippine Health Insurance Corporation and Department of Social Welfare and Development formalize its partnership through a Joint Order signed on November 6, 2012. The partnership aims to provide healthcare to poor household identified by the National Household Targeting System (NHTS) and beneficiaries under the Pantawid Pamilyang Pilipino Program. In 2012, all Pantawid Pamilya beneficiaries were enrolled under the sponsorship program for indigent. The program expanded and covered MCCT beneficiaries on 2015. The beneficiaries both MCCT and RCCT were provided MDR and may use their Pantawid Pamilya identification card to avail health care benefits to PhilHealth Accredited hospitals and clinics. The Pantawid Pamilya is endorsing the names of Pantawid beneficiaries to PhilHealth for enrollment in their database every 4th quarter of the year. This includes the beneficiaries whose grants were put on hold but are still eligible to receive grants. As of September 2020, 4Ps has endorsed a total of 4,526,015 households for enrolment to 2020 Indigent Program of PhilHealth. Partnership with Civil Society Organization. Partnership of DSWD with NGOs, CSOs and the private sectors are aimed to strengthen the well-being of qualified beneficiaries. It shall promote participation and involvement in community development. Partnership engagement includes program complementation, service delivery, capacity building, knowledge

MONTHLY REPORT ON PANTAWID PAMILYA IMPLEMENTATION 35
management, and advocacy and sponsorships. As of September 2020, a total of 729 CSO volunteer partners were engaged in Pantawid Pamilya.
B. Other Accomplishments/Updates
Provision of Micro-Enterprise Development through Sustainable Livelihood Program (SLP). As of September 2020, a total of 1,505,602 Pantawid Pamilya beneficiaries were referred to and funded by Micro-Finance Institutions and other formal lending institutions. Employment Facilitation Activities through Sustainable Livelihood Program (SLP). Beneficiaries were provided guaranteed employment by various public and private partners through SLP. As of September 2020, there are 372,987 Pantawid Pamilya household beneficiaries employed under the employment facilitation track. Provision of Cash Grants through Unconditional Cash Transfer (UCT) Program. UCT program provides cash subsidies amounting to Php300 a month or Php3,600 a year for 2020. As of September 2020, 4Ps has endorsed 3,998,312 households for inclusion to 2020 UCT payroll processing. Provision of Social Amelioration Measures by DSWD. The provision of social amelioration measures by the Department to the affected households of the community quarantine due to COVID-19 outbreak targets low-income households including the 4Ps beneficiaries. The emergency subsidy amounts from a minimum of Five Thousand Pesos (Php5,000.00) to a maximum of Eight Thousand Pesos (Php8,000.00) a month for a maximum of two months, taking into consideration the cash transfers and rice subsidies that they will be getting from the 4Ps Program in the computation of emergency subsidy. All target 4.4 million households of 4Ps, including homeless street families indigenous peoples, and families in need of special protection (FNSP), shall be recipients of the emergency subsidy. As of September 30 2020, DSWD successfully paid 4,287,445 4Ps households of Emergency subsidies by Cash Card (3,824,899 households) and Non Cash Card (462,546 households) for 1st tranche. For the 2nd tranche, DSWD successfully paid 1,387,130 4Ps households of Emergency subsidies by Cash Card (1,361,034 households) and Non Cash Card (26,096 households).
Figure 17. Target and Accomplishment for SAP for 1st Tranche and 2nd Tranche

MONTHLY REPORT ON PANTAWID PAMILYA IMPLEMENTATION 36
References: Department of Social Welfare and Development (DSWD). (2011). Pantawid Pamilyang Pilipino
Program: Operations Manual. Quezon City, Philippines: DSWD. Department of Social Welfare and Development (DSWD). Enumerator’s Manual for Household
Targeting System for Poverty Reduction. Quezon City, Philippines: DSWD. Department of Social Welfare and Development (DSWD). Pantawid Pamilya Information
System Database (30 September 2020). Quezon City, Philippines: DSWD. Fernandez, L. & Olfindo R. (2011), “Overview of the Philippines’ Conditional Cash Transfer
Program: The Pantawid Pamilyang Pilipino Program,” Social Protection Policy Note No. 2, May 2011. Quezon City, Philippines: DSWD.
Philippine Statistics Authority – National Statistics Office. (2007). Philippines 2007 Census of
Population and Housing (CPH). Manila, Philippines: Philippine Statistics Authority. Philippine Statistics Authority – National Statistical Coordination Board. (2012). PSA-NSCB
Database. Makati City, Philippines: The PSA-Makati Office. Philippine Statistics Authority – National Statistical Coordination Board. (2014). PSA-NSCB
Database. Makati City, Philippines: The PSA-Makati Office. Philippine Statistics Authority – National Statistical Coordination Board. (2009). 2009 Official
Poverty Statistics of the Philippines. Makati City, Philippines: The PSA-Makati Office. Philippine Statistics Authority – National Statistical Coordination Board. (2015). Negros Island
is Philippines’ Newest Region. PSA-NSCB-PR-2015 (24 June 2015). Makati City, Philippines: The PSA-Makati Office.
MONTHLY REPORT ON PANTAWID PAMILYA COVERAGE 37
Appendix
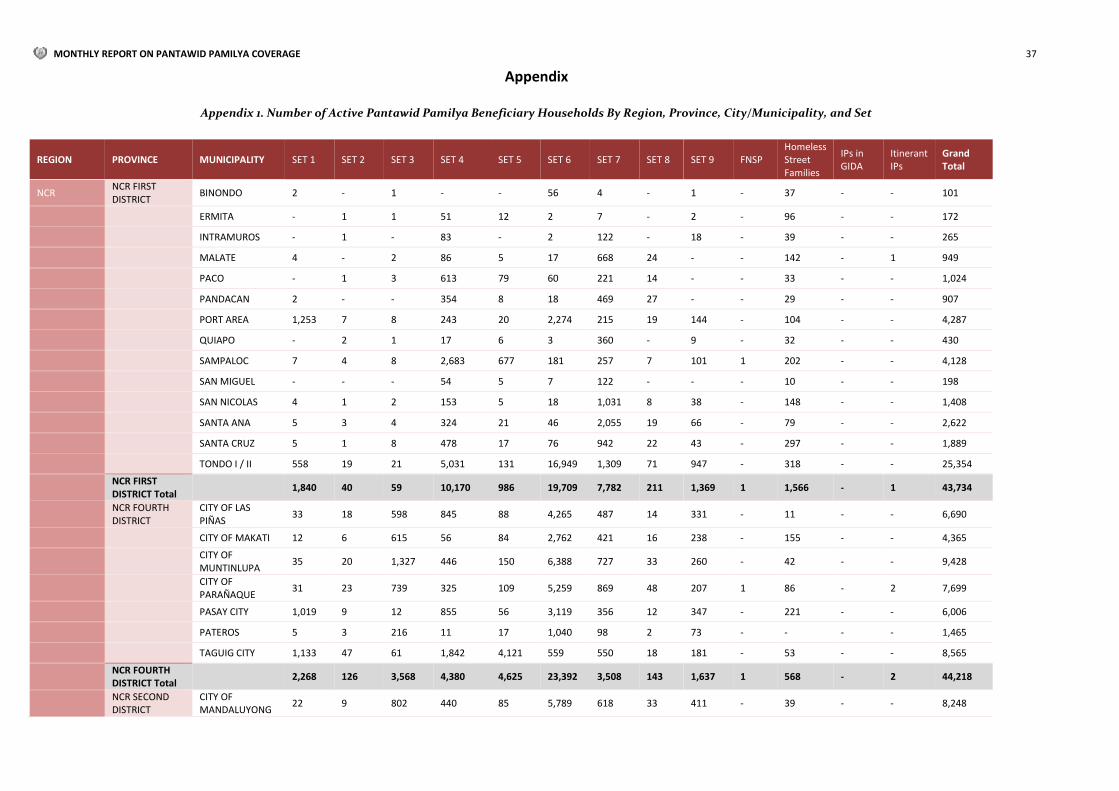
Appendix 1. Number of Active Pantawid Pamilya Beneficiary Households By Region, Province, City/Municipality, and Set
REGION PROVINCE MUNICIPALITY SET 1 SET 2 SET 3 SET 4 SET 5 SET 6 SET 7 SET 8 SET 9 FNSP Homeless Street Families
IPs in GIDA
Itinerant IPs
Grand Total
NCR NCR FIRST DISTRICT
BINONDO 2 - 1 - - 56 4 - 1 - 37 - - 101
ERMITA - 1 1 51 12 2 7 - 2 - 96 - - 172
INTRAMUROS - 1 - 83 - 2 122 - 18 - 39 - - 265
MALATE 4 - 2 86 5 17 668 24 - - 142 - 1 949
PACO - 1 3 613 79 60 221 14 - - 33 - - 1,024
PANDACAN 2 - - 354 8 18 469 27 - - 29 - - 907
PORT AREA 1,253 7 8 243 20 2,274 215 19 144 - 104 - - 4,287
QUIAPO - 2 1 17 6 3 360 - 9 - 32 - - 430
SAMPALOC 7 4 8 2,683 677 181 257 7 101 1 202 - - 4,128
SAN MIGUEL - - - 54 5 7 122 - - - 10 - - 198
SAN NICOLAS 4 1 2 153 5 18 1,031 8 38 - 148 - - 1,408
SANTA ANA 5 3 4 324 21 46 2,055 19 66 - 79 - - 2,622
SANTA CRUZ 5 1 8 478 17 76 942 22 43 - 297 - - 1,889
TONDO I / II 558 19 21 5,031 131 16,949 1,309 71 947 - 318 - - 25,354
NCR FIRST DISTRICT Total
1,840 40 59 10,170 986 19,709 7,782 211 1,369 1 1,566 - 1 43,734
NCR FOURTH DISTRICT
CITY OF LAS PIÑAS
33 18 598 845 88 4,265 487 14 331 - 11 - - 6,690
CITY OF MAKATI 12 6 615 56 84 2,762 421 16 238 - 155 - - 4,365
CITY OF MUNTINLUPA
35 20 1,327 446 150 6,388 727 33 260 - 42 - - 9,428
CITY OF PARAÑAQUE
31 23 739 325 109 5,259 869 48 207 1 86 - 2 7,699
PASAY CITY 1,019 9 12 855 56 3,119 356 12 347 - 221 - - 6,006
PATEROS 5 3 216 11 17 1,040 98 2 73 - - - - 1,465
TAGUIG CITY 1,133 47 61 1,842 4,121 559 550 18 181 - 53 - - 8,565
NCR FOURTH DISTRICT Total
2,268 126 3,568 4,380 4,625 23,392 3,508 143 1,637 1 568 - 2 44,218
NCR SECOND DISTRICT
CITY OF MANDALUYONG
22 9 802 440 85 5,789 618 33 411 - 39 - - 8,248

MONTHLY REPORT ON PANTAWID PAMILYA COVERAGE 38
CITY OF MARIKINA
13 14 745 652 104 4,968 1,174 2 358 1 19 - - 8,050
CITY OF PASIG 1,504 21 30 1,561 112 7,625 499 8 21 1 42 - - 11,424
CITY OF SAN JUAN
2 1 205 16 24 719 58 - 80 - 22 - - 1,127
QUEZON CITY 1,163 116 158 5,875 460 20,416 6,700 312 1,325 1 414 1 - 36,941
NCR SECOND DISTRICT Total
2,704 161 1,940 8,544 785 39,517 9,049 355 2,195 3 536 1 - 65,790
NCR THIRD DISTRICT
CALOOCAN CITY 1,689 85 98 5,541 16,731 2,311 2,527 58 1,296 - 148 1 - 30,485
CITY OF MALABON
45 32 781 2,447 6,556 1,079 1,172 24 620 - 43 - - 12,799
CITY OF NAVOTAS 1,487 19 16 1,795 5,344 719 1,041 25 313 - 70 - - 10,829
CITY OF VALENZUELA
42 41 1,024 1,634 205 7,831 2,380 65 114 - 5 - - 13,341
NCR THIRD DISTRICT Total
3,263 177 1,919 11,417 28,836 11,940 7,120 172 2,343 - 266 1 - 67,454
NCR Total 10,075 504 7,486 34,511 35,232 94,558 27,459 881 7,544 5 2,936 2 3 221,196
CAR ABRA BANGUED (Capital)
12 - 2 7 1,305 56 93 1 21 2 - - - 1,499
BOLINEY 240 - - 2 3 3 10 7 6 - - - - 271
BUCAY 725 1 - 9 12 10 55 2 12 - - - - 826
BUCLOC 94 - - 2 2 3 7 - 1 - - - - 109
DAGUIOMAN 2 - - 95 - - 32 - - 1 - - - 130
DANGLAS 181 - 1 - 4 - 11 - 3 - - - - 200
DOLORES - - - 384 7 5 75 3 7 - - - - 481
LA PAZ 668 - 1 4 7 5 40 1 8 - - - - 734
LACUB 147 - - 2 - 2 16 5 4 - - 128 - 304
LAGANGILANG 4 - - 584 9 11 221 1 12 - - - - 842
LAGAYAN 218 - - 3 3 5 12 4 4 - - - - 249
LANGIDEN 187 - - - 3 - 8 1 1 - - - - 200
LICUAN-BAAY (LICUAN)
195 - - 3 2 1 13 2 9 - - - - 225
LUBA 294 1 1 4 7 3 9 4 1 - - - - 324
MALIBCONG 210 - - 2 3 1 32 1 4 - - - - 253
MANABO 18 - - 9 565 28 41 1 6 - - - - 668
PEÑARRUBIA 1 - - 4 317 7 28 2 3 - - 1 - 363
PIDIGAN 3 - 1 2 546 22 43 1 6 - - - - 624

MONTHLY REPORT ON PANTAWID PAMILYA COVERAGE 39
PILAR 2 - 1 483 6 4 101 - 9 - - - - 606
SALLAPADAN 1 - - 257 7 3 106 2 10 - - - - 386
SAN ISIDRO 216 - - 2 3 1 12 4 6 - - - - 244
SAN JUAN 7 - - 5 494 37 50 1 4 - - - - 598
SAN QUINTIN - - - 2 259 28 9 5 2 - - - - 305
TAYUM 4 - - 6 595 40 72 2 12 - - - - 731
TINEG 2 - - 367 3 2 10 - 3 - - - - 387
TUBO 219 - - - - 3 12 8 3 - - - - 245
VILLAVICIOSA 204 - - 1 1 2 13 1 3 - - - - 225
ABRA Total 3,854 2 7 2,239 4,163 282 1,131 59 160 3 - 129 - 12,029
APAYAO CALANASAN (BAYAG)
509 - - - 3 18 14 3 13 - - - - 560
CONNER 1,307 - 1 11 7 48 103 3 24 - - 1 - 1,505
FLORA 1 - 1 1 953 73 105 8 20 1 - - - 1,163
KABUGAO (Capital)
931 1 1 1 4 68 86 4 20 - - 50 - 1,166
LUNA 8 - - 3 935 56 73 10 5 - - - - 1,090
PUDTOL 8 - 1 - 907 53 67 13 12 - - - - 1,061
SANTA MARCELA 4 - - - 687 24 62 2 7 - - - - 786
APAYAO Total 2,768 1 4 16 3,496 340 510 43 101 1 - 51 - 7,331
BENGUET ATOK - - 1 5 670 32 45 23 7 - - - - 783
BAGUIO CITY 466 3 15 344 120 1,798 90 66 32 1 - - - 2,935
BAKUN - 1 322 220 7 107 13 1 6 - - 208 - 885
BOKOD - - 1 - 492 15 17 5 6 - - - - 536
BUGUIAS 4 5 7 13 1,118 33 54 23 20 - - - - 1,277
ITOGON 14 1 5 13 719 59 45 24 17 1 - - - 898
KABAYAN 2 - 372 205 3 169 57 9 5 - - 1 - 823
KAPANGAN 1 2 373 402 3 110 18 6 8 - - - - 923
KIBUNGAN 3 - 2 686 16 11 65 7 5 - - 566 - 1,361
LA TRINIDAD (Capital)
15 2 10 19 725 33 29 2 7 1 - - - 843
MANKAYAN 17 1 6 3 533 27 26 32 20 - - - - 665
SABLAN - 1 - 2 322 13 26 2 4 - - - - 370
TUBA 5 2 5 7 841 32 48 13 21 - - - - 974

MONTHLY REPORT ON PANTAWID PAMILYA COVERAGE 40
TUBLAY 2 2 3 4 592 24 58 8 3 - - - - 696
BENGUET Total 529 20 1,122 1,923 6,161 2,463 591 221 161 3 - 775 - 13,969
IFUGAO AGUINALDO 2 - 2 1,227 23 15 55 5 18 - - - - 1,347
ALFONSO LISTA (POTIA)
5 - 1 1,275 40 8 56 7 14 1 - - - 1,407
ASIPULO 1 - 368 433 23 51 25 7 13 - - 138 - 1,059
BANAUE - - 1 769 31 7 44 3 17 - - - - 872
HINGYON 1 - 1 6 329 21 24 - 16 - - - - 398
HUNGDUAN - - - 275 7 6 124 3 7 - - - - 422
KIANGAN 1 - 2 625 19 2 78 6 15 - - - - 748
LAGAWE (Capital) - 1 - 6 485 24 23 2 11 1 - - - 553
LAMUT 3 - 1 24 918 72 41 4 17 - - - - 1,080
MAYOYAO - - 1 470 5 1 15 1 10 - - - - 503
TINOC - - 278 416 20 41 88 5 19 - - 202 - 1,069
IFUGAO Total 13 1 655 5,526 1,900 248 573 43 157 2 - 340 - 9,458
KALINGA BALBALAN 3 - - 506 5 128 86 3 6 - - 129 - 866
CITY OF TABUK (Capital)
123 1 5 27 3,595 205 299 12 96 6 - 2 - 4,371
LUBUAGAN 447 - 1 1 5 4 121 8 16 - - - - 603
PASIL 477 - - 2 6 3 97 11 9 - - - - 605
PINUKPUK 4 - 3 1,562 34 323 114 20 43 1 - - - 2,104
RIZAL (LIWAN) 3 - 6 2 628 55 62 71 19 - - - - 846
TANUDAN 353 - - - 23 11 103 8 4 - - 85 - 587
TINGLAYAN 508 - - - 9 1 218 9 19 - - - - 764
KALINGA Total 1,918 1 15 2,100 4,305 730 1,100 142 212 7 - 216 - 10,746
MOUNTAIN PROVINCE
BARLIG 1 - - 141 2 - 46 2 - - - 47 - 239
BAUKO 2 2 4 12 994 16 90 6 28 2 - 2 - 1,158
BESAO 2 - 150 - 42 2 3 2 4 - - - - 205
BONTOC (Capital) 9 - - 2 352 30 18 1 10 - - - - 422
NATONIN 474 - 1 5 2 1 21 2 6 - - 251 - 763
PARACELIS 902 - 1 11 332 38 51 4 50 - - 401 - 1,790
SABANGAN 1 - - 3 261 26 10 1 11 - - - - 313
SADANGA 256 - - 3 120 4 6 2 9 - - - - 400

MONTHLY REPORT ON PANTAWID PAMILYA COVERAGE 41
SAGADA 2 - 1 2 222 17 4 1 2 - - - - 251
TADIAN - 1 1 1 672 42 54 7 3 - - - - 781
MOUNTAIN PROVINCE Total
1,649 3 158 180 2,999 176 303 28 123 2 - 701 - 6,322
CAR Total 10,731 28 1,961 11,984 23,024 4,239 4,208 536 914 18 - 2,212 - 59,855
I ILOCOS NORTE ADAMS - - 1 75 2 6 9 1 6 - - 71 - 171
BACARRA - - 1 - 389 222 34 - 64 - - - - 710
BADOC - - 2 3 1,056 253 148 1 136 - - - - 1,599
BANGUI 1 - 1 - 11 450 20 2 39 - - - - 524
BANNA (ESPIRITU)
- - 4 3 761 20 29 3 76 - - - - 896
BURGOS - - - 2 319 11 30 1 25 - - - - 388
CARASI - - - 40 - 13 3 3 2 - - - - 61
CITY OF BATAC 1 - 345 3 1,116 73 108 3 128 - - - - 1,777
CURRIMAO - - - - 2 343 35 5 29 - - - - 414
DINGRAS - - 3 2 1,378 42 107 3 117 - - - - 1,652
DUMALNEG - - 1 - 56 36 8 6 4 - - - - 111
LAOAG CITY (Capital)
7 - 5 931 643 62 102 2 120 - - - - 1,872
MARCOS 1 - 366 180 7 208 39 3 55 - - - - 859
NUEVA ERA 3 - 326 83 3 22 26 37 21 - - 46 - 567
PAGUDPUD 1 - 2 4 991 36 63 3 73 - - - - 1,173
PAOAY - - - 3 694 32 74 4 66 - - - - 873
PASUQUIN 3 1 3 1 892 37 56 4 70 - - - - 1,067
PIDDIG - 1 - 1 597 30 34 2 83 - - - - 748
PINILI 1 - 332 270 8 145 49 2 54 - - - - 861
SAN NICOLAS - - 3 1 9 606 47 3 53 - - - - 722
SARRAT 1 - 3 3 479 27 18 5 34 - - - - 570
SOLSONA 2 - - 1 568 139 27 4 67 - - - - 808
VINTAR - 1 - 3 795 25 51 2 83 - - - - 960
ILOCOS NORTE Total
21 3 1,398 1,609 10,776 2,838 1,117 99 1,405 - - 117 - 19,383
ILOCOS SUR ALILEM 1 - 315 37 3 62 35 1 14 - - 90 - 558
BANAYOYO - - - 1 248 10 10 1 17 - - 91 - 378

MONTHLY REPORT ON PANTAWID PAMILYA COVERAGE 42
BANTAY 2 - - 1 9 715 33 3 41 - - - - 804
BURGOS 1 - - 1 397 21 27 6 62 - - - - 515
CABUGAO 1 - 368 1 16 1,138 79 7 111 - - - - 1,721
CAOAYAN - - - 1 6 559 33 3 45 - - - - 647
CERVANTES - - 567 326 30 84 120 1 58 - - 202 - 1,388
CITY OF CANDON 2 - 4 7 1,372 41 108 9 102 - - - - 1,645
CITY OF VIGAN (Capital)
- - 3 7 964 47 47 - 105 - - - - 1,173
GALIMUYOD 2 - - 1 322 23 45 2 44 - - 68 - 507
GREGORIO DEL PILAR (CONCEPCION)
- - 1 - 170 7 14 2 4 - - 181 - 379
LIDLIDDA - - 1 2 192 4 17 - 9 - - 95 - 320
MAGSINGAL - - 2 5 1,219 55 133 3 100 - - - - 1,517
NAGBUKEL - - - 253 - 4 45 3 30 - - 69 - 404
NARVACAN 2 - 1 3 9 1,247 107 3 112 - - 2 - 1,486
QUIRINO (ANGKAKI)
- - 299 8 129 8 32 4 20 - - 128 - 628
SALCEDO (BAUGEN)
- - 3 2 408 14 25 2 38 - - 228 - 720
SAN EMILIO 1 - 275 33 14 62 29 - 10 - - 97 - 521
SAN ESTEBAN - - - - 3 226 4 2 17 - - - - 252
SAN ILDEFONSO - - - - 2 144 12 2 10 - - - - 170
SAN JUAN (LAPOG)
- - 1 - 868 18 15 5 53 - - - - 960
SAN VICENTE - - - - 2 285 19 2 34 - - - - 342
SANTA - - - 1 3 317 26 7 34 - - - - 388
SANTA CATALINA - 1 - 1 5 281 11 - 21 - - - - 320
SANTA CRUZ 2 - 2 2 1,277 72 100 12 115 - - - - 1,582
SANTA LUCIA 1 1 - 2 9 1,092 75 6 99 - - - - 1,285
SANTA MARIA 1 - 2 2 10 689 44 3 80 - - 1 - 832
SANTIAGO - - - 1 6 691 54 4 52 - - - - 808
SANTO DOMINGO
- - 2 - 6 734 41 2 45 - - - - 830
SIGAY - - - 132 1 1 22 6 - - - 104 - 266
SINAIT 3 - - 5 8 759 55 3 59 - - - - 892

MONTHLY REPORT ON PANTAWID PAMILYA COVERAGE 43
SUGPON - 207 1 1 4 12 37 1 11 - - 63 - 337
SUYO - - 310 147 6 130 24 2 32 - - 200 - 851
TAGUDIN 1 - - 3 8 1,496 189 1 107 - - - - 1,805
ILOCOS SUR Total
20 209 2,157 986 7,726 11,048 1,667 108 1,691 - - 1,619 - 27,231
LA UNION AGOO 3 - 3 7 2,125 144 102 4 141 - - - - 2,529
ARINGAY 2 1 2 8 1,958 125 203 2 154 - - 117 - 2,572
BACNOTAN 2 2 2 2 9 1,159 62 2 83 - - - - 1,323
BAGULIN - 751 6 3 12 120 52 3 83 - - 139 - 1,169
BALAOAN - - 2 4 11 1,344 92 11 148 - - - - 1,612
BANGAR - 1 1 4 1,580 81 106 3 131 - - - - 1,907
BAUANG - 1 3 6 1,687 97 103 6 156 - - - - 2,059
BURGOS - 2 339 43 8 89 25 2 36 - - - - 544
CABA 1 1 2 4 10 850 74 1 65 - - - - 1,008
CITY OF SAN FERNANDO (Capital)
5 2 4 8 1,809 180 137 14 164 - - 1 - 2,324
LUNA - 1 - 1 1,165 58 30 - 94 - - 1 - 1,350
NAGUILIAN 2 1 3 5 1,288 68 34 11 147 - - - - 1,559
PUGO - 1 2 8 558 45 40 35 45 - - - - 734
ROSARIO 2 1 369 1,594 43 177 146 10 184 - - - - 2,526
SAN GABRIEL 1 1 350 647 16 132 34 9 79 - - 97 - 1,366
SAN JUAN - 1 - 7 15 1,095 102 6 97 - - - - 1,323
SANTO TOMAS 1 - 1 7 8 1,494 140 10 108 - - - - 1,769
SANTOL 2 689 - 4 5 101 27 - 71 - - 113 - 1,012
SUDIPEN 1 4 2 2 653 25 57 6 58 - - - - 808
TUBAO - 1 368 759 16 150 53 5 116 - - - - 1,468
LA UNION Total 22 1,461 1,459 3,123 12,976 7,534 1,619 140 2,160 - - 468 - 30,962
PANGASINAN AGNO 2 - 496 1,105 25 264 170 2 140 - - - - 2,204
AGUILAR 2,024 - 3 7 29 84 304 37 205 - - - - 2,693
ALCALA - - 5 9 17 1,329 52 12 182 - - - - 1,606
ANDA 5 - 325 13 1,632 73 126 11 117 - - - - 2,302
ASINGAN - - 1 7 12 1,287 80 13 179 - - - - 1,579

MONTHLY REPORT ON PANTAWID PAMILYA COVERAGE 44
BALUNGAO 1 - - 1 5 1,034 82 5 112 - - 1 - 1,241
BANI 8 1 352 1,816 17 201 160 12 176 - - - - 2,743
BASISTA 5 - 1 5 21 1,274 302 26 94 - - - - 1,728
BAUTISTA 2 1 3 1 13 1,227 173 4 113 - - - - 1,537
BAYAMBANG 4 1 8 16 5,235 254 543 16 491 - - - - 6,568
BINALONAN - 1 3 3 20 1,252 76 10 107 - - - - 1,472
BINMALEY 2 1 1 13 16 2,389 719 33 215 - - - - 3,389
BOLINAO 3,003 - 8 23 26 343 48 28 574 - - - - 4,053
BUGALLON 8 3 2 10 3,168 125 476 21 257 - - - - 4,070
BURGOS 1 - 359 12 788 21 65 9 71 - - - - 1,326
CALASIAO 2 - 3 5 18 2,789 1,212 26 289 - - - - 4,344
CITY OF ALAMINOS
10 - 6 2,403 687 64 59 35 244 - - - - 3,508
CITY OF URDANETA
9 2 4 6 3,326 193 179 7 349 - - 1 - 4,076
DAGUPAN CITY 6 - 5 2,067 61 64 1,915 19 383 - - - - 4,520
DASOL 3 1 2 3 1,248 45 73 11 107 - - - - 1,493
INFANTA 3 - - 1 1,105 32 39 3 93 - - 76 - 1,352
LABRADOR 3 2 1 4 14 863 64 1 56 - - 37 - 1,045
LAOAC 2 - 1 3 1,250 49 72 - 94 - - - - 1,471
LINGAYEN (Capital)
5 - 5 5 38 3,386 988 50 214 - - - - 4,691
MABINI 1,194 - 2 5 9 130 99 25 157 - - 11 - 1,632
MALASIQUI 3 1 279 28 5,214 225 384 13 574 - - - - 6,721
MANAOAG - 1 1 8 22 2,115 159 9 190 - - - - 2,505
MANGALDAN - 2 1 13 32 2,871 238 7 233 - - - - 3,397
MANGATAREM 6 - 411 11 3,123 85 1,027 17 300 - - - - 4,980
MAPANDAN 1 - - 2 8 1,082 57 6 84 - - - - 1,240
NATIVIDAD - - 1 4 862 26 25 2 82 - - - - 1,002
POZORRUBIO 2 - 1 5 22 1,811 185 10 174 - - - - 2,210
ROSALES 1 1 3 - 14 1,821 146 13 155 - - - - 2,154
SAN CARLOS CITY 12 1 9 24 6,515 388 709 39 847 - - 1 - 8,545
SAN FABIAN 4 - 2 14 3,137 162 160 23 325 - - - - 3,827
SAN JACINTO 2 - 3 6 1,450 46 98 6 147 - - - - 1,758

MONTHLY REPORT ON PANTAWID PAMILYA COVERAGE 45
SAN MANUEL 1 2 3 1 1,706 88 115 6 256 - - 22 - 2,200
SAN NICOLAS 1 - 341 20 1,001 50 25 12 162 - - 53 - 1,665
SAN QUINTIN 1 - 1 5 1,195 83 53 10 115 - - - - 1,463
SANTA BARBARA 1 2 2 5 21 2,534 248 11 205 - - - - 3,029
SANTA MARIA - 1 360 37 14 642 13 6 96 - - 2 - 1,171
SANTO TOMAS - - - 1 2 428 20 3 35 - - - - 489
SISON - 1 3 6 1,303 74 107 17 121 - - - - 1,632
SUAL 4 1 371 25 1,422 60 130 10 159 - - - - 2,182
TAYUG 1 3 3 7 9 1,036 26 6 107 - - - - 1,198
UMINGAN 3 2 5 9 28 2,864 143 16 335 - - 1 - 3,406
URBIZTONDO 1,854 1 4 8 27 302 396 27 392 - - - - 3,011
VILLASIS 4 - 1 6 24 1,698 54 8 250 - - 1 - 2,046
PANGASINAN Total
8,203 32 3,401 7,788 45,931 39,263 12,594 693 10,363 - - 206 - 128,474
I Total 8,266 1,705 8,415 13,506 77,409 60,683 16,997 1,040 15,619 - - 2,410 - 206,050
II CAGAYAN ABULUG - - 3 5 851 38 42 6 63 - - - - 1,008
ALCALA 3 - 8 2 1,031 49 45 6 99 - - - - 1,243
ALLACAPAN 1 1 4 3 762 62 39 14 42 - - - - 928
AMULUNG 1 - 1,287 81 68 148 26 15 98 - - - - 1,724
APARRI 1 - 8 4 1,734 116 95 7 90 - - - - 2,055
BAGGAO - 3 8 8 2,096 102 122 29 150 - - 264 - 2,782
BALLESTEROS - - 2 - 843 63 28 7 63 - - - - 1,006
BUGUEY 1 - 7 3 761 56 81 14 50 - - 1 - 974
CALAYAN - - 600 9 11 383 27 8 75 - - - - 1,113
CAMALANIUGAN - - 1 4 522 30 19 3 24 - - - - 603
CLAVERIA - 1 3 - 436 63 29 16 28 - - - - 576
ENRILE - - 1 12 779 34 30 13 50 - - - - 919
GATTARAN 2 1 2 6 1,204 66 60 18 58 - - 184 - 1,601
GONZAGA 2 1 5 2 909 25 33 6 45 - - 106 - 1,134
IGUIG 2 - 7 6 584 18 7 8 45 - - - - 677
LAL-LO 2 1 2 4 784 54 44 7 58 - - - - 956
LASAM 3 - 1 2 932 42 85 15 48 - - - - 1,128
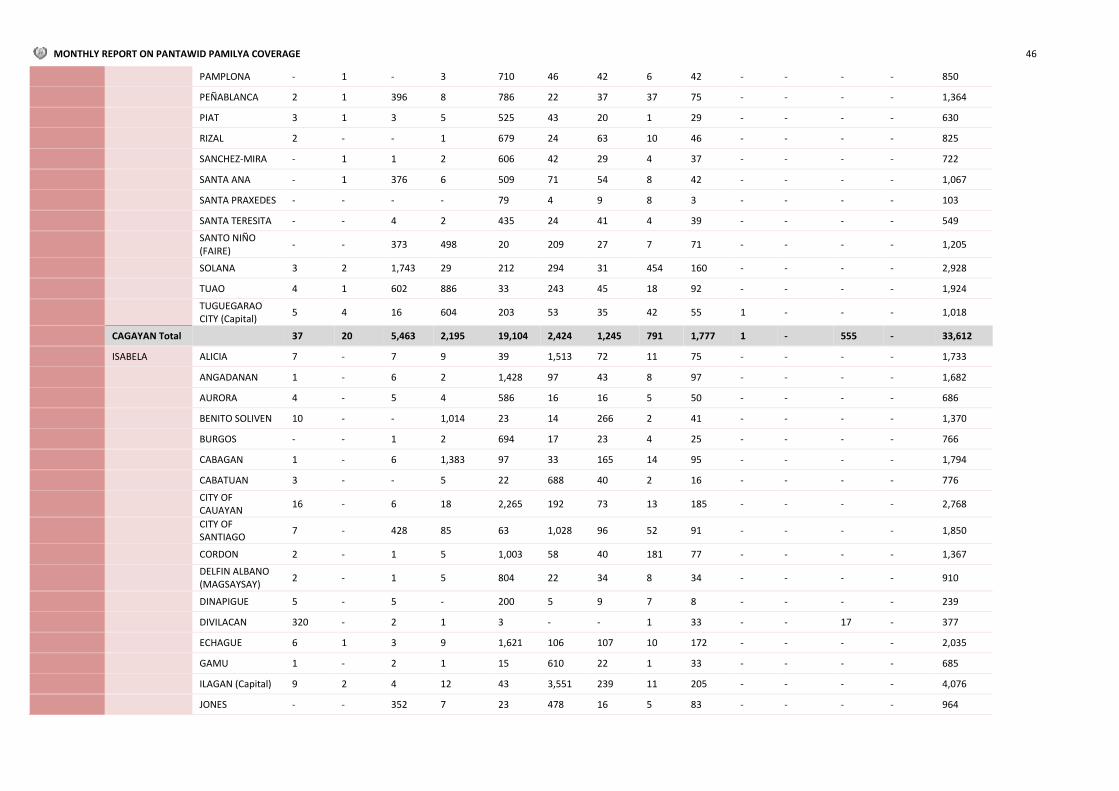
MONTHLY REPORT ON PANTAWID PAMILYA COVERAGE 46
PAMPLONA - 1 - 3 710 46 42 6 42 - - - - 850
PEÑABLANCA 2 1 396 8 786 22 37 37 75 - - - - 1,364
PIAT 3 1 3 5 525 43 20 1 29 - - - - 630
RIZAL 2 - - 1 679 24 63 10 46 - - - - 825
SANCHEZ-MIRA - 1 1 2 606 42 29 4 37 - - - - 722
SANTA ANA - 1 376 6 509 71 54 8 42 - - - - 1,067
SANTA PRAXEDES - - - - 79 4 9 8 3 - - - - 103
SANTA TERESITA - - 4 2 435 24 41 4 39 - - - - 549
SANTO NIÑO (FAIRE)
- - 373 498 20 209 27 7 71 - - - - 1,205
SOLANA 3 2 1,743 29 212 294 31 454 160 - - - - 2,928
TUAO 4 1 602 886 33 243 45 18 92 - - - - 1,924
TUGUEGARAO CITY (Capital)
5 4 16 604 203 53 35 42 55 1 - - - 1,018
CAGAYAN Total 37 20 5,463 2,195 19,104 2,424 1,245 791 1,777 1 - 555 - 33,612
ISABELA ALICIA 7 - 7 9 39 1,513 72 11 75 - - - - 1,733
ANGADANAN 1 - 6 2 1,428 97 43 8 97 - - - - 1,682
AURORA 4 - 5 4 586 16 16 5 50 - - - - 686
BENITO SOLIVEN 10 - - 1,014 23 14 266 2 41 - - - - 1,370
BURGOS - - 1 2 694 17 23 4 25 - - - - 766
CABAGAN 1 - 6 1,383 97 33 165 14 95 - - - - 1,794
CABATUAN 3 - - 5 22 688 40 2 16 - - - - 776
CITY OF CAUAYAN
16 - 6 18 2,265 192 73 13 185 - - - - 2,768
CITY OF SANTIAGO
7 - 428 85 63 1,028 96 52 91 - - - - 1,850
CORDON 2 - 1 5 1,003 58 40 181 77 - - - - 1,367
DELFIN ALBANO (MAGSAYSAY)
2 - 1 5 804 22 34 8 34 - - - - 910
DINAPIGUE 5 - 5 - 200 5 9 7 8 - - - - 239
DIVILACAN 320 - 2 1 3 - - 1 33 - - 17 - 377
ECHAGUE 6 1 3 9 1,621 106 107 10 172 - - - - 2,035
GAMU 1 - 2 1 15 610 22 1 33 - - - - 685
ILAGAN (Capital) 9 2 4 12 43 3,551 239 11 205 - - - - 4,076
JONES - - 352 7 23 478 16 5 83 - - - - 964

MONTHLY REPORT ON PANTAWID PAMILYA COVERAGE 47
LUNA 1 1 - 1 402 30 4 - 33 - - - - 472
MACONACON 7 - - - 220 13 3 1 24 - - - - 268
MALLIG 1 - 2 2 891 27 23 3 55 - - - - 1,004
NAGUILIAN 3 - 2 6 995 47 37 6 66 - - - - 1,162
PALANAN 1,075 - 1 - 8 6 27 5 66 - - 103 - 1,291
QUEZON 3 - 3 1 724 19 21 2 55 - - - - 828
QUIRINO - - - 655 11 5 102 - 20 - - - - 793
RAMON - 1 1 9 1,006 55 40 5 68 - - - - 1,185
REINA MERCEDES 1 1 3 3 559 23 7 15 24 - - - - 636
ROXAS 3 - 1 10 1,249 80 40 3 72 - - - - 1,458
SAN AGUSTIN 1 - - - 429 15 6 7 36 - - - - 494
SAN GUILLERMO 1 - 376 3 610 29 48 15 54 - - - - 1,136
SAN ISIDRO 1 - - 1 13 445 11 76 37 - - - - 584
SAN MANUEL 2 1 1 4 896 31 37 4 37 - - - - 1,013
SAN MARIANO 3,271 - 1 10 20 21 53 2 267 - - 961 - 4,606
SAN MATEO 5 - 2 6 1,088 62 52 16 56 - - - - 1,287
SAN PABLO 1 - 5 4 988 56 44 8 58 - - 214 - 1,378
SANTA MARIA 6 1 1,103 11 97 10 14 8 59 - - - - 1,309
SANTO TOMAS - - 2 3 784 25 8 3 32 - - - - 857
TUMAUINI 2 1 3 11 2,410 68 59 5 137 - - - - 2,696
ISABELA Total 4,778 9 2,335 3,302 22,329 9,495 1,897 519 2,576 - - 1,295 - 48,535
NUEVA VIZCAYA ALFONSO CASTANEDA
- - 3 289 10 5 77 13 13 - - - - 410
AMBAGUIO - - 4 548 12 57 45 2 16 - - - - 684
ARITAO 1 - 7 5 757 54 16 5 13 - - - - 858
BAGABAG - - 3 4 622 50 24 7 32 - - - - 742
BAMBANG 3 - 6 15 941 47 48 5 44 - - - - 1,109
BAYOMBONG (Capital)
2 - 5 11 630 57 28 4 36 - - 504 - 1,277
DIADI 2 - 1 3 633 37 42 3 12 - - 361 - 1,094
DUPAX DEL NORTE
1 - 2 5 573 29 30 7 37 - - - - 684
DUPAX DEL SUR 2 - - 2 534 31 49 1 29 - - - - 648
KASIBU 2 1 7 1,350 45 39 368 2 106 - - 668 - 2,588

MONTHLY REPORT ON PANTAWID PAMILYA COVERAGE 48
KAYAPA - - 522 7 22 706 56 - 48 - - 625 - 1,986
QUEZON 2 2 - 4 547 38 17 5 30 - - - - 645
SANTA FE 3 - 370 1 10 436 54 4 28 - - - - 906
SOLANO 4 - 3 4 697 84 15 7 33 - - - - 847
VILLAVERDE - - - 3 373 24 15 4 28 - - - - 447
NUEVA VIZCAYA Total
22 3 933 2,251 6,406 1,694 884 69 505 - - 2,158 - 14,925
QUIRINO AGLIPAY 1 - 3 5 1,085 45 34 3 79 - - 107 - 1,362
CABARROGUIS (Capital)
3 - 3 11 622 31 12 - 39 - - 524 - 1,245
DIFFUN - 3 7 11 1,751 76 58 5 127 - - 232 - 2,270
MADDELA 2 1 1 9 809 29 44 8 58 - - - - 961
NAGTIPUNAN 3 - 384 5 608 32 18 4 50 - - 697 - 1,801
SAGUDAY 3 - 4 2 500 25 18 4 39 - - - - 595
QUIRINO Total 12 4 402 43 5,375 238 184 24 392 - - 1,560 - 8,234
II Total 4,849 36 9,133 7,791 53,214 13,851 4,210 1,403 5,250 1 - 5,568 - 105,306
III AURORA BALER (Capital) 3 - 9 4 889 61 28 10 37 - - - - 1,041
CASIGURAN 2 - 12 4 1,023 26 84 - 105 - - 87 - 1,343
DILASAG 4 - 471 10 39 207 39 1 50 - - 145 - 966
DINALUNGAN 2 - 2 3 11 452 35 3 49 - - 117 - 674
DINGALAN 3 1 426 50 20 259 16 5 12 - - 91 - 883
DIPACULAO 1 - 3 5 956 41 40 1 52 - - 162 - 1,261
MARIA AURORA 6 - 3 6 1,307 57 65 2 81 - - 172 - 1,699
SAN LUIS 3 - 6 8 961 56 30 - 45 1 - 76 - 1,186
AURORA Total 24 1 932 90 5,206 1,159 337 22 431 1 - 850 - 9,053
BATAAN ABUCAY 3 1 4 3 13 615 146 4 18 - - 29 - 836
BAGAC 6 3 386 16 9 719 116 10 45 - - 12 - 1,322
CITY OF BALANGA (Capital)
4 2 3 14 817 48 291 13 60 - - - - 1,252
DINALUPIHAN 5 3 371 34 24 2,044 394 12 89 - - 23 - 2,999
HERMOSA 2 2 9 9 1,171 75 597 17 50 - - 130 - 2,062
LIMAY 9 19 8 13 17 1,180 90 7 57 - - 33 - 1,433
MARIVELES 14 16 15 39 48 1,253 237 13 37 - - 4 - 1,676
MORONG 3 2 5 6 12 997 193 4 31 - - 41 - 1,294

MONTHLY REPORT ON PANTAWID PAMILYA COVERAGE 49
ORANI - - 5 2 10 1,323 273 8 88 - - 18 - 1,727
ORION 14 4 - 10 7 1,066 362 3 83 - - 10 - 1,559
PILAR - 3 1 9 15 667 180 3 19 - - - - 897
SAMAL 2 - 3 4 10 651 72 10 32 - - 6 - 790
BATAAN Total 62 55 810 159 2,153 10,638 2,951 104 609 - - 306 - 17,847
BULACAN ANGAT - 3 5 12 12 1,156 69 27 75 - - 1 - 1,360
BALAGTAS (BIGAA)
7 1 9 84 19 1,272 213 19 59 - - - - 1,683
BALIUAG 6 - 10 21 27 1,482 94 7 98 - - - - 1,745
BOCAUE 124 7 5 289 51 1,684 205 16 42 - - - - 2,423
BULACAN 4 2 378 13 3 1,060 203 2 50 - - - - 1,715
BUSTOS 4 3 2 21 21 1,352 31 2 35 1 1 1 - 1,474
CALUMPIT 6 2 6 14 17 1,577 547 3 126 - - - - 2,298
CITY OF MALOLOS (Capital)
10 7 11 33 2,254 151 584 3 119 - - - - 3,172
CITY OF MEYCAUAYAN
11 9 11 50 1,824 224 1,004 45 115 - - - - 3,293
CITY OF SAN JOSE DEL MONTE
216 25 644 601 9,294 2,489 892 78 510 - - 19 - 14,768
DOÑA REMEDIOS TRINIDAD
3 2 482 772 27 399 89 - 83 - - 81 - 1,938
GUIGUINTO 10 5 10 27 17 1,151 168 3 43 - - - - 1,434
HAGONOY 1 1 7 14 10 2,207 786 45 164 - 24 - - 3,259
MARILAO 8 8 16 54 73 2,110 163 18 81 1 - - - 2,532
NORZAGARAY 18 6 392 101 100 2,477 330 5 52 - - 65 - 3,546
OBANDO 2 - 1 4 8 476 189 4 42 - - - - 726
PANDI 76 7 392 502 371 1,879 571 20 40 - - - - 3,858
PAOMBONG 1 1 377 5 7 738 140 11 76 - - - - 1,356
PLARIDEL 1 2 3 22 18 1,078 225 9 71 - - - - 1,429
PULILAN 4 3 2 13 19 1,646 169 4 121 - - - - 1,981
SAN ILDEFONSO 10 - 397 16 21 2,168 73 1 177 - - - - 2,863
SAN MIGUEL 4 4 412 27 27 3,760 325 4 326 - - - - 4,889
SAN RAFAEL 13 4 377 16 12 1,513 78 5 130 - - - - 2,148
SANTA MARIA 17 18 337 112 102 3,790 324 36 99 - - 1 - 4,836

MONTHLY REPORT ON PANTAWID PAMILYA COVERAGE 50
BULACAN Total 556 120 4,286 2,823 14,334 37,839 7,472 367 2,734 2 25 168 - 70,726
NUEVA ECIJA ALIAGA 2 2 1 4 10 2,324 519 8 149 - - - - 3,019
BONGABON 5 - 368 7 34 2,035 176 10 104 - - 32 - 2,771
CABANATUAN CITY
18 2 13 27 5,615 247 310 85 285 2 - - - 6,604
CABIAO 2 3 3 7 17 2,108 304 8 172 - - - - 2,624
CARRANGLAN 1,834 - 2 9 13 15 176 7 162 - - 263 - 2,481
CITY OF GAPAN 8 3 5 9 1,459 198 288 1 113 - - - - 2,084
CUYAPO 4 - 370 5 14 2,471 241 4 252 - - - - 3,361
GABALDON (BITULOK & SABANI)
1,586 1 4 3 15 83 82 11 92 - - 50 - 1,927
GENERAL MAMERTO NATIVIDAD
3 - 6 6 9 1,562 152 1 104 1 - - - 1,844
GENERAL TINIO (PAPAYA)
4 2 4 14 1,012 73 223 45 80 1 - 150 - 1,608
GUIMBA 9 - 340 14 33 4,877 331 7 357 2 - - - 5,970
JAEN 1 1 5 5 12 3,354 466 25 283 - - - - 4,152
LAUR 8 - 634 7 1,225 87 62 1 119 - - 26 - 2,169
LICAB 1,322 - 5 2 5 31 292 4 140 - - - - 1,801
LLANERA 4 1 3 1 18 1,398 173 3 103 - - - - 1,704
LUPAO 2 - 353 30 53 1,681 188 2 142 - - 10 - 2,461
NAMPICUAN 2 - 360 4 288 27 88 - 59 - - - - 828
PALAYAN CITY (Capital)
6 - 4 5 1,054 58 44 4 58 - - 140 - 1,373
PANTABANGAN 2 - 343 18 21 848 87 12 85 1 - 34 - 1,451
PEÑARANDA 1 - 2 10 7 573 41 4 33 - - - - 671
QUEZON 3 - 415 4 1,823 57 381 4 203 - - - - 2,890
RIZAL 4 - 1 6 19 1,924 164 13 101 1 - - - 2,233
SAN ANTONIO 2 3 2 5 13 2,639 319 11 218 - - - - 3,212
SAN ISIDRO 3 - 1 4 11 1,129 222 4 98 - - - - 1,472
SAN JOSE CITY 10 2 1 3,065 684 160 263 21 235 1 1 - - 4,443
SAN LEONARDO 2 1 7 8 7 1,575 163 3 115 - - - - 1,881
SANTA ROSA 3 - 6 5 16 1,503 78 - 74 - - - - 1,685
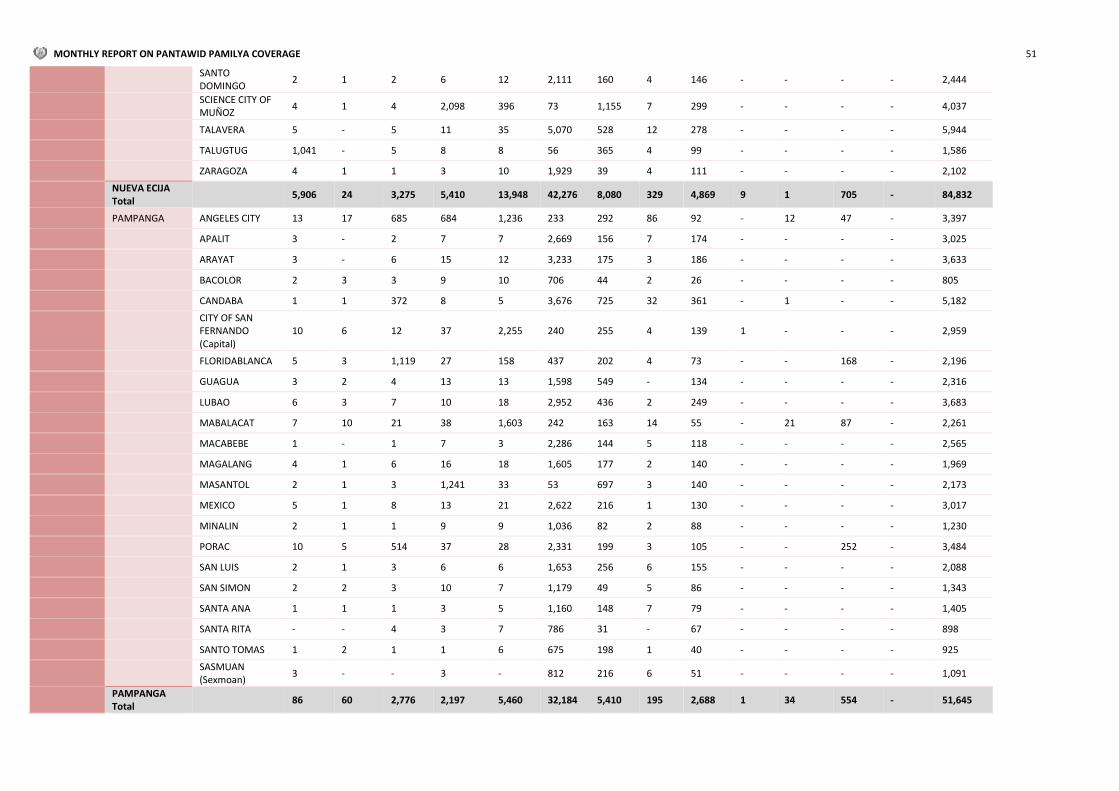
MONTHLY REPORT ON PANTAWID PAMILYA COVERAGE 51
SANTO DOMINGO
2 1 2 6 12 2,111 160 4 146 - - - - 2,444
SCIENCE CITY OF MUÑOZ
4 1 4 2,098 396 73 1,155 7 299 - - - - 4,037
TALAVERA 5 - 5 11 35 5,070 528 12 278 - - - - 5,944
TALUGTUG 1,041 - 5 8 8 56 365 4 99 - - - - 1,586
ZARAGOZA 4 1 1 3 10 1,929 39 4 111 - - - - 2,102
NUEVA ECIJA Total
5,906 24 3,275 5,410 13,948 42,276 8,080 329 4,869 9 1 705 - 84,832
PAMPANGA ANGELES CITY 13 17 685 684 1,236 233 292 86 92 - 12 47 - 3,397
APALIT 3 - 2 7 7 2,669 156 7 174 - - - - 3,025
ARAYAT 3 - 6 15 12 3,233 175 3 186 - - - - 3,633
BACOLOR 2 3 3 9 10 706 44 2 26 - - - - 805
CANDABA 1 1 372 8 5 3,676 725 32 361 - 1 - - 5,182
CITY OF SAN FERNANDO (Capital)
10 6 12 37 2,255 240 255 4 139 1 - - - 2,959
FLORIDABLANCA 5 3 1,119 27 158 437 202 4 73 - - 168 - 2,196
GUAGUA 3 2 4 13 13 1,598 549 - 134 - - - - 2,316
LUBAO 6 3 7 10 18 2,952 436 2 249 - - - - 3,683
MABALACAT 7 10 21 38 1,603 242 163 14 55 - 21 87 - 2,261
MACABEBE 1 - 1 7 3 2,286 144 5 118 - - - - 2,565
MAGALANG 4 1 6 16 18 1,605 177 2 140 - - - - 1,969
MASANTOL 2 1 3 1,241 33 53 697 3 140 - - - - 2,173
MEXICO 5 1 8 13 21 2,622 216 1 130 - - - - 3,017
MINALIN 2 1 1 9 9 1,036 82 2 88 - - - - 1,230
PORAC 10 5 514 37 28 2,331 199 3 105 - - 252 - 3,484
SAN LUIS 2 1 3 6 6 1,653 256 6 155 - - - - 2,088
SAN SIMON 2 2 3 10 7 1,179 49 5 86 - - - - 1,343
SANTA ANA 1 1 1 3 5 1,160 148 7 79 - - - - 1,405
SANTA RITA - - 4 3 7 786 31 - 67 - - - - 898
SANTO TOMAS 1 2 1 1 6 675 198 1 40 - - - - 925
SASMUAN (Sexmoan)
3 - - 3 - 812 216 6 51 - - - - 1,091
PAMPANGA Total
86 60 2,776 2,197 5,460 32,184 5,410 195 2,688 1 34 554 - 51,645
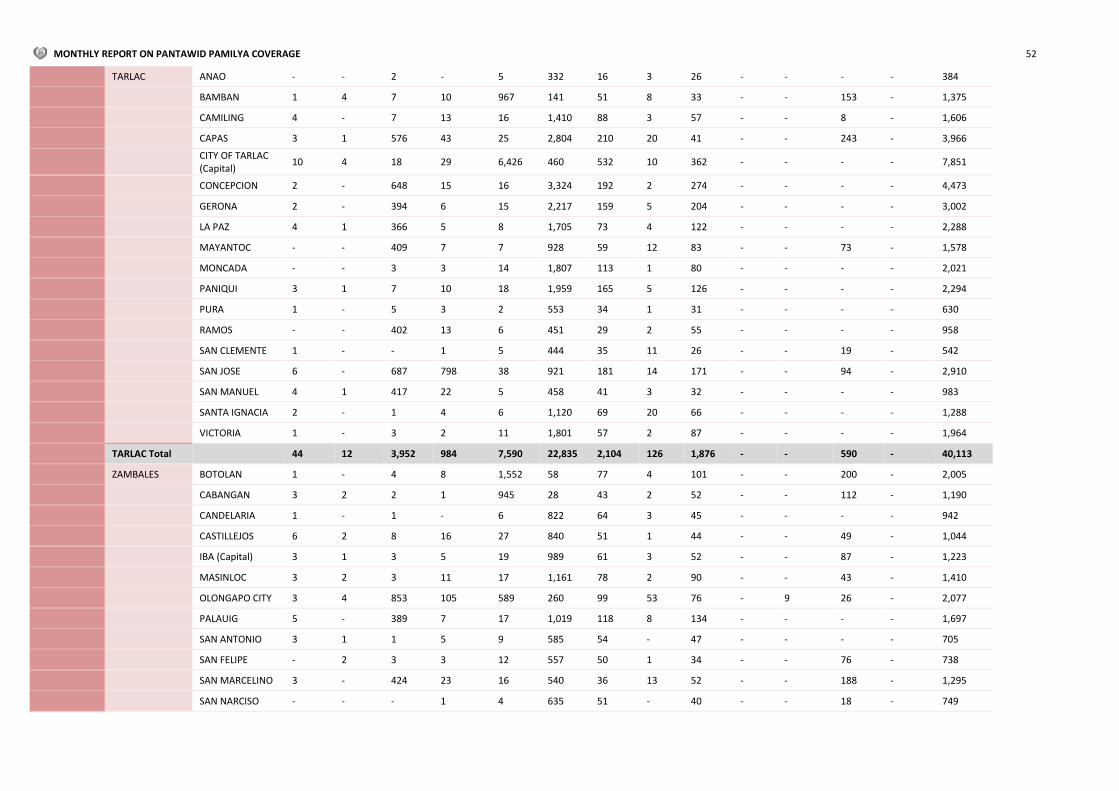
MONTHLY REPORT ON PANTAWID PAMILYA COVERAGE 52
TARLAC ANAO - - 2 - 5 332 16 3 26 - - - - 384
BAMBAN 1 4 7 10 967 141 51 8 33 - - 153 - 1,375
CAMILING 4 - 7 13 16 1,410 88 3 57 - - 8 - 1,606
CAPAS 3 1 576 43 25 2,804 210 20 41 - - 243 - 3,966
CITY OF TARLAC (Capital)
10 4 18 29 6,426 460 532 10 362 - - - - 7,851
CONCEPCION 2 - 648 15 16 3,324 192 2 274 - - - - 4,473
GERONA 2 - 394 6 15 2,217 159 5 204 - - - - 3,002
LA PAZ 4 1 366 5 8 1,705 73 4 122 - - - - 2,288
MAYANTOC - - 409 7 7 928 59 12 83 - - 73 - 1,578
MONCADA - - 3 3 14 1,807 113 1 80 - - - - 2,021
PANIQUI 3 1 7 10 18 1,959 165 5 126 - - - - 2,294
PURA 1 - 5 3 2 553 34 1 31 - - - - 630
RAMOS - - 402 13 6 451 29 2 55 - - - - 958
SAN CLEMENTE 1 - - 1 5 444 35 11 26 - - 19 - 542
SAN JOSE 6 - 687 798 38 921 181 14 171 - - 94 - 2,910
SAN MANUEL 4 1 417 22 5 458 41 3 32 - - - - 983
SANTA IGNACIA 2 - 1 4 6 1,120 69 20 66 - - - - 1,288
VICTORIA 1 - 3 2 11 1,801 57 2 87 - - - - 1,964
TARLAC Total 44 12 3,952 984 7,590 22,835 2,104 126 1,876 - - 590 - 40,113
ZAMBALES BOTOLAN 1 - 4 8 1,552 58 77 4 101 - - 200 - 2,005
CABANGAN 3 2 2 1 945 28 43 2 52 - - 112 - 1,190
CANDELARIA 1 - 1 - 6 822 64 3 45 - - - - 942
CASTILLEJOS 6 2 8 16 27 840 51 1 44 - - 49 - 1,044
IBA (Capital) 3 1 3 5 19 989 61 3 52 - - 87 - 1,223
MASINLOC 3 2 3 11 17 1,161 78 2 90 - - 43 - 1,410
OLONGAPO CITY 3 4 853 105 589 260 99 53 76 - 9 26 - 2,077
PALAUIG 5 - 389 7 17 1,019 118 8 134 - - - - 1,697
SAN ANTONIO 3 1 1 5 9 585 54 - 47 - - - - 705
SAN FELIPE - 2 3 3 12 557 50 1 34 - - 76 - 738
SAN MARCELINO 3 - 424 23 16 540 36 13 52 - - 188 - 1,295
SAN NARCISO - - - 1 4 635 51 - 40 - - 18 - 749

MONTHLY REPORT ON PANTAWID PAMILYA COVERAGE 53
SANTA CRUZ 3 - 2 5 15 1,931 171 1 152 - - 47 - 2,327
SUBIC 15 7 20 28 1,860 124 137 7 164 - - 161 - 2,523
ZAMBALES Total 49 21 1,713 218 5,088 9,549 1,090 98 1,083 - 9 1,007 - 19,925
III Total 6,727 293 17,744 11,881 53,779 156,480 27,444 1,241 14,290 13 69 4,180 - 294,141
IV-A CALABARZON
BATANGAS AGONCILLO 5 - - 8 6 1,320 65 4 62 - - - - 1,470
ALITAGTAG 1 - 2 5 5 864 52 - 73 - - - - 1,002
BALAYAN 8 1 366 76 25 3,306 283 4 181 - 1 - 19 4,270
BALETE 2 - 380 1 811 75 95 2 87 - - - - 1,453
BATANGAS CITY (Capital)
43 9 34 79 4,751 558 521 218 372 - - - 143 6,728
BAUAN 6 - 5 22 8 953 93 4 59 - - - - 1,150
CALACA 7 1 558 1,207 58 1,459 220 3 199 - - - - 3,712
CALATAGAN 6 1 443 1,362 39 900 208 2 214 - - - - 3,175
CITY OF TANAUAN
19 3 16 72 2,117 533 252 3 199 - - - - 3,214
CUENCA 6 - 1 9 10 1,001 35 1 58 - - - - 1,121
IBAAN 7 1 382 18 24 1,022 49 1 51 - - - - 1,555
LAUREL 2 - 394 1,045 22 529 74 6 168 - - - - 2,240
LEMERY 7 2 412 17 35 2,475 467 3 137 - - - - 3,555
LIAN 3 - 407 11 2,101 127 155 3 205 - - - - 3,012
LIPA CITY 47 12 40 150 6,479 713 410 6 417 1 - - - 8,275
LOBO 7 - 638 822 29 506 106 3 157 - - - - 2,268
MABINI 8 - 1 25 13 778 77 2 37 - - - - 941
MALVAR 6 - 4 31 17 1,180 101 1 84 - - - - 1,424
MATAAS NA KAHOY
6 - 2 8 8 818 58 2 49 - - - - 951
NASUGBU 10 3 335 30 4,171 395 496 18 409 - - 1 - 5,868
PADRE GARCIA 3 - 6 21 23 1,162 75 4 37 - - - - 1,331
ROSARIO 17 3 815 2,641 129 885 265 2 340 - - - - 5,097
SAN JOSE 17 3 332 1,060 60 65 241 1 117 1 - - - 1,897
SAN JUAN 7 2 771 2,783 137 1,126 239 6 411 - - - - 5,482
SAN LUIS 5 - 372 5 759 53 67 2 75 - - - - 1,338
SAN NICOLAS - 1 4 7 11 889 90 2 60 - - - - 1,064
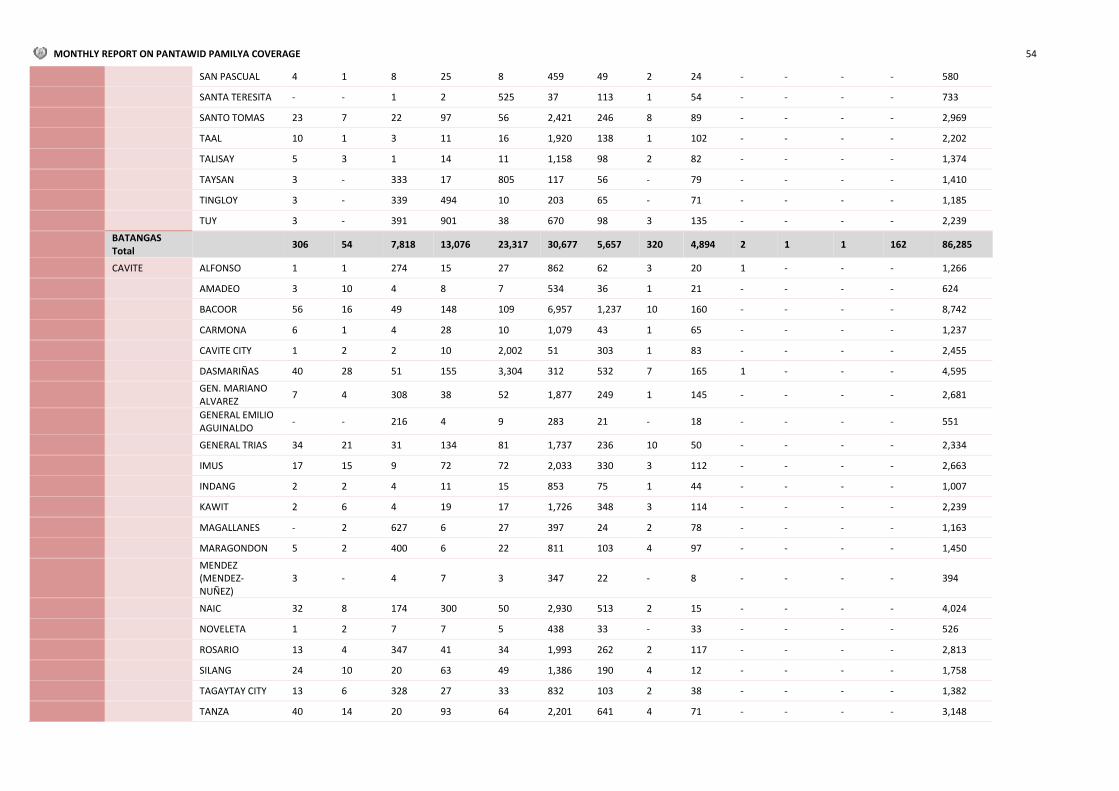
MONTHLY REPORT ON PANTAWID PAMILYA COVERAGE 54
SAN PASCUAL 4 1 8 25 8 459 49 2 24 - - - - 580
SANTA TERESITA - - 1 2 525 37 113 1 54 - - - - 733
SANTO TOMAS 23 7 22 97 56 2,421 246 8 89 - - - - 2,969
TAAL 10 1 3 11 16 1,920 138 1 102 - - - - 2,202
TALISAY 5 3 1 14 11 1,158 98 2 82 - - - - 1,374
TAYSAN 3 - 333 17 805 117 56 - 79 - - - - 1,410
TINGLOY 3 - 339 494 10 203 65 - 71 - - - - 1,185
TUY 3 - 391 901 38 670 98 3 135 - - - - 2,239
BATANGAS Total
306 54 7,818 13,076 23,317 30,677 5,657 320 4,894 2 1 1 162 86,285
CAVITE ALFONSO 1 1 274 15 27 862 62 3 20 1 - - - 1,266
AMADEO 3 10 4 8 7 534 36 1 21 - - - - 624
BACOOR 56 16 49 148 109 6,957 1,237 10 160 - - - - 8,742
CARMONA 6 1 4 28 10 1,079 43 1 65 - - - - 1,237
CAVITE CITY 1 2 2 10 2,002 51 303 1 83 - - - - 2,455
DASMARIÑAS 40 28 51 155 3,304 312 532 7 165 1 - - - 4,595
GEN. MARIANO ALVAREZ
7 4 308 38 52 1,877 249 1 145 - - - - 2,681
GENERAL EMILIO AGUINALDO
- - 216 4 9 283 21 - 18 - - - - 551
GENERAL TRIAS 34 21 31 134 81 1,737 236 10 50 - - - - 2,334
IMUS 17 15 9 72 72 2,033 330 3 112 - - - - 2,663
INDANG 2 2 4 11 15 853 75 1 44 - - - - 1,007
KAWIT 2 6 4 19 17 1,726 348 3 114 - - - - 2,239
MAGALLANES - 2 627 6 27 397 24 2 78 - - - - 1,163
MARAGONDON 5 2 400 6 22 811 103 4 97 - - - - 1,450
MENDEZ (MENDEZ-NUÑEZ)
3 - 4 7 3 347 22 - 8 - - - - 394
NAIC 32 8 174 300 50 2,930 513 2 15 - - - - 4,024
NOVELETA 1 2 7 7 5 438 33 - 33 - - - - 526
ROSARIO 13 4 347 41 34 1,993 262 2 117 - - - - 2,813
SILANG 24 10 20 63 49 1,386 190 4 12 - - - - 1,758
TAGAYTAY CITY 13 6 328 27 33 832 103 2 38 - - - - 1,382
TANZA 40 14 20 93 64 2,201 641 4 71 - - - - 3,148
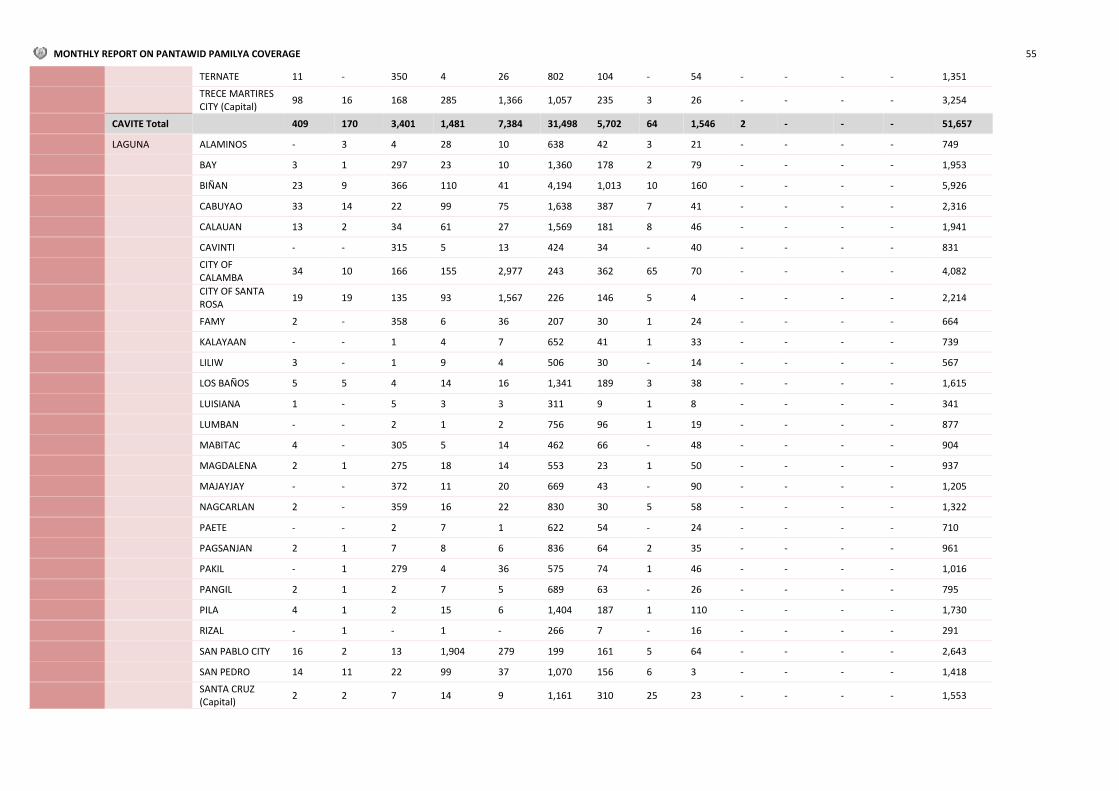
MONTHLY REPORT ON PANTAWID PAMILYA COVERAGE 55
TERNATE 11 - 350 4 26 802 104 - 54 - - - - 1,351
TRECE MARTIRES CITY (Capital)
98 16 168 285 1,366 1,057 235 3 26 - - - - 3,254
CAVITE Total 409 170 3,401 1,481 7,384 31,498 5,702 64 1,546 2 - - - 51,657
LAGUNA ALAMINOS - 3 4 28 10 638 42 3 21 - - - - 749
BAY 3 1 297 23 10 1,360 178 2 79 - - - - 1,953
BIÑAN 23 9 366 110 41 4,194 1,013 10 160 - - - - 5,926
CABUYAO 33 14 22 99 75 1,638 387 7 41 - - - - 2,316
CALAUAN 13 2 34 61 27 1,569 181 8 46 - - - - 1,941
CAVINTI - - 315 5 13 424 34 - 40 - - - - 831
CITY OF CALAMBA
34 10 166 155 2,977 243 362 65 70 - - - - 4,082
CITY OF SANTA ROSA
19 19 135 93 1,567 226 146 5 4 - - - - 2,214
FAMY 2 - 358 6 36 207 30 1 24 - - - - 664
KALAYAAN - - 1 4 7 652 41 1 33 - - - - 739
LILIW 3 - 1 9 4 506 30 - 14 - - - - 567
LOS BAÑOS 5 5 4 14 16 1,341 189 3 38 - - - - 1,615
LUISIANA 1 - 5 3 3 311 9 1 8 - - - - 341
LUMBAN - - 2 1 2 756 96 1 19 - - - - 877
MABITAC 4 - 305 5 14 462 66 - 48 - - - - 904
MAGDALENA 2 1 275 18 14 553 23 1 50 - - - - 937
MAJAYJAY - - 372 11 20 669 43 - 90 - - - - 1,205
NAGCARLAN 2 - 359 16 22 830 30 5 58 - - - - 1,322
PAETE - - 2 7 1 622 54 - 24 - - - - 710
PAGSANJAN 2 1 7 8 6 836 64 2 35 - - - - 961
PAKIL - 1 279 4 36 575 74 1 46 - - - - 1,016
PANGIL 2 1 2 7 5 689 63 - 26 - - - - 795
PILA 4 1 2 15 6 1,404 187 1 110 - - - - 1,730
RIZAL - 1 - 1 - 266 7 - 16 - - - - 291
SAN PABLO CITY 16 2 13 1,904 279 199 161 5 64 - - - - 2,643
SAN PEDRO 14 11 22 99 37 1,070 156 6 3 - - - - 1,418
SANTA CRUZ (Capital)
2 2 7 14 9 1,161 310 25 23 - - - - 1,553
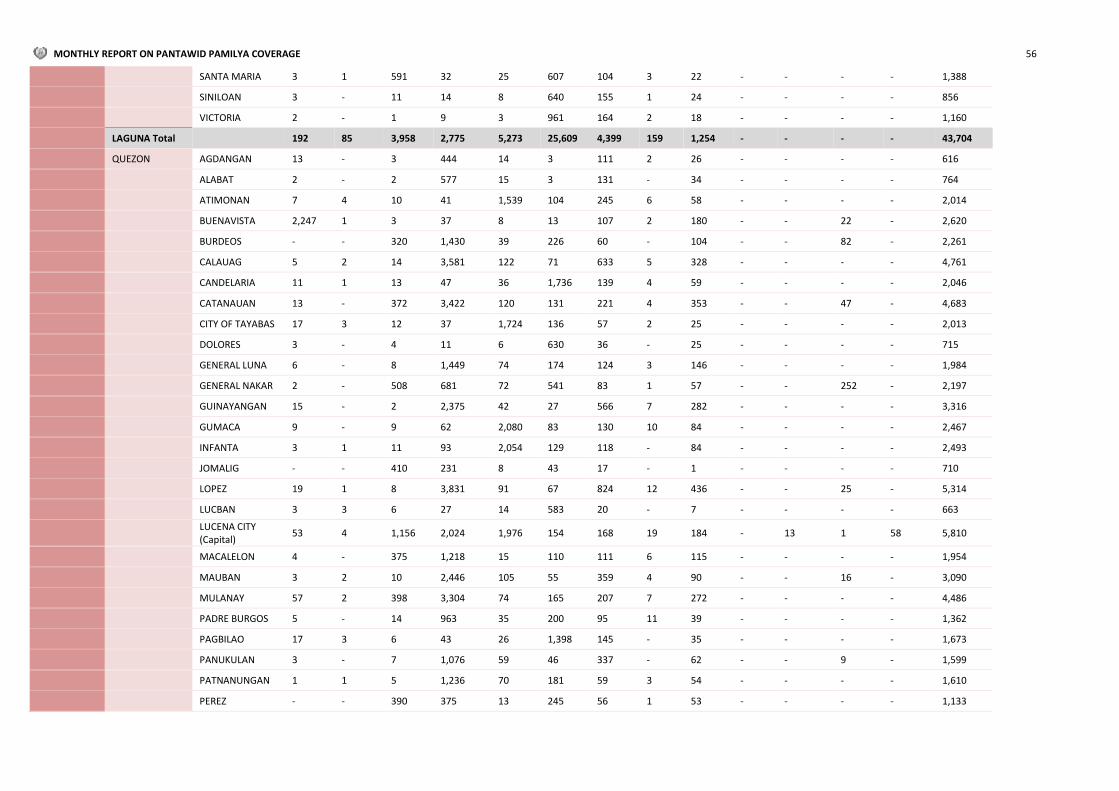
MONTHLY REPORT ON PANTAWID PAMILYA COVERAGE 56
SANTA MARIA 3 1 591 32 25 607 104 3 22 - - - - 1,388
SINILOAN 3 - 11 14 8 640 155 1 24 - - - - 856
VICTORIA 2 - 1 9 3 961 164 2 18 - - - - 1,160
LAGUNA Total 192 85 3,958 2,775 5,273 25,609 4,399 159 1,254 - - - - 43,704
QUEZON AGDANGAN 13 - 3 444 14 3 111 2 26 - - - - 616
ALABAT 2 - 2 577 15 3 131 - 34 - - - - 764
ATIMONAN 7 4 10 41 1,539 104 245 6 58 - - - - 2,014
BUENAVISTA 2,247 1 3 37 8 13 107 2 180 - - 22 - 2,620
BURDEOS - - 320 1,430 39 226 60 - 104 - - 82 - 2,261
CALAUAG 5 2 14 3,581 122 71 633 5 328 - - - - 4,761
CANDELARIA 11 1 13 47 36 1,736 139 4 59 - - - - 2,046
CATANAUAN 13 - 372 3,422 120 131 221 4 353 - - 47 - 4,683
CITY OF TAYABAS 17 3 12 37 1,724 136 57 2 25 - - - - 2,013
DOLORES 3 - 4 11 6 630 36 - 25 - - - - 715
GENERAL LUNA 6 - 8 1,449 74 174 124 3 146 - - - - 1,984
GENERAL NAKAR 2 - 508 681 72 541 83 1 57 - - 252 - 2,197
GUINAYANGAN 15 - 2 2,375 42 27 566 7 282 - - - - 3,316
GUMACA 9 - 9 62 2,080 83 130 10 84 - - - - 2,467
INFANTA 3 1 11 93 2,054 129 118 - 84 - - - - 2,493
JOMALIG - - 410 231 8 43 17 - 1 - - - - 710
LOPEZ 19 1 8 3,831 91 67 824 12 436 - - 25 - 5,314
LUCBAN 3 3 6 27 14 583 20 - 7 - - - - 663
LUCENA CITY (Capital)
53 4 1,156 2,024 1,976 154 168 19 184 - 13 1 58 5,810
MACALELON 4 - 375 1,218 15 110 111 6 115 - - - - 1,954
MAUBAN 3 2 10 2,446 105 55 359 4 90 - - 16 - 3,090
MULANAY 57 2 398 3,304 74 165 207 7 272 - - - - 4,486
PADRE BURGOS 5 - 14 963 35 200 95 11 39 - - - - 1,362
PAGBILAO 17 3 6 43 26 1,398 145 - 35 - - - - 1,673
PANUKULAN 3 - 7 1,076 59 46 337 - 62 - - 9 - 1,599
PATNANUNGAN 1 1 5 1,236 70 181 59 3 54 - - - - 1,610
PEREZ - - 390 375 13 245 56 1 53 - - - - 1,133

MONTHLY REPORT ON PANTAWID PAMILYA COVERAGE 57
PITOGO 6 - 7 1,080 24 7 248 2 95 - - - - 1,469
PLARIDEL 2 - - 312 13 6 126 2 33 - - - - 494
POLILLO 3 1 5 1,403 51 162 81 4 121 - - - - 1,831
QUEZON 1 - 2 827 15 108 52 6 98 - - - - 1,109
REAL 2 1 9 36 1,451 43 74 2 72 - - 41 - 1,731
SAMPALOC - - 1 12 312 12 13 - 11 - - - - 361
SAN ANDRES 2,213 9 6 10 15 23 94 2 195 - - - - 2,567
SAN ANTONIO 5 1 3 1,194 37 20 207 2 58 - - - - 1,527
SAN FRANCISCO (AURORA)
4,199 7 10 24 12 24 154 11 261 1 - - - 4,703
SAN NARCISO 2,789 2 6 23 13 23 135 11 206 - - - - 3,208
SARIAYA 25 2 14 60 3,519 188 169 5 195 - - - - 4,177
TAGKAWAYAN 3 - 8 1,864 38 261 538 - 190 - - - - 2,902
TIAONG 5 1 8 41 2,173 104 107 5 116 - - - - 2,560
UNISAN 11 3 3 1,130 44 175 101 1 84 - - - - 1,552
QUEZON Total 11,782 55 4,158 39,077 18,148 8,410 7,258 162 4,928 1 13 495 58 94,545
RIZAL ANGONO 12 5 7 37 56 1,417 301 4 74 - - - - 1,913
BARAS 48 7 310 95 148 837 119 5 3 - - - - 1,572
BINANGONAN 20 13 23 56 2,627 1,112 758 7 89 - - 1 - 4,706
CAINTA 14 12 13 65 54 981 481 4 34 - - - - 1,658
CARDONA 3 4 3 4 1,409 119 513 5 93 - - - - 2,153
CITY OF ANTIPOLO
87 37 192 336 284 2,665 707 19 29 4 - 172 - 4,532
JALA-JALA 3 - 513 8 24 475 389 - 98 - - - - 1,510
MORONG 10 5 10 79 25 1,165 213 4 4 - - - - 1,515
PILILLA 8 3 14 23 14 1,424 164 16 60 - - - - 1,726
RODRIGUEZ (MONTALBAN)
190 31 237 381 174 3,896 805 16 126 3 - 61 - 5,920
SAN MATEO 28 4 26 86 34 2,995 517 13 89 - - - - 3,792
TANAY 10 4 720 100 63 2,404 657 2 141 - - 93 - 4,194
TAYTAY 40 14 51 109 3,968 354 665 4 207 1 - - - 5,413
TERESA 9 8 5 34 20 1,320 140 1 48 1 - - - 1,586
RIZAL Total 482 147 2,124 1,413 8,900 21,164 6,429 100 1,095 9 - 327 - 42,190
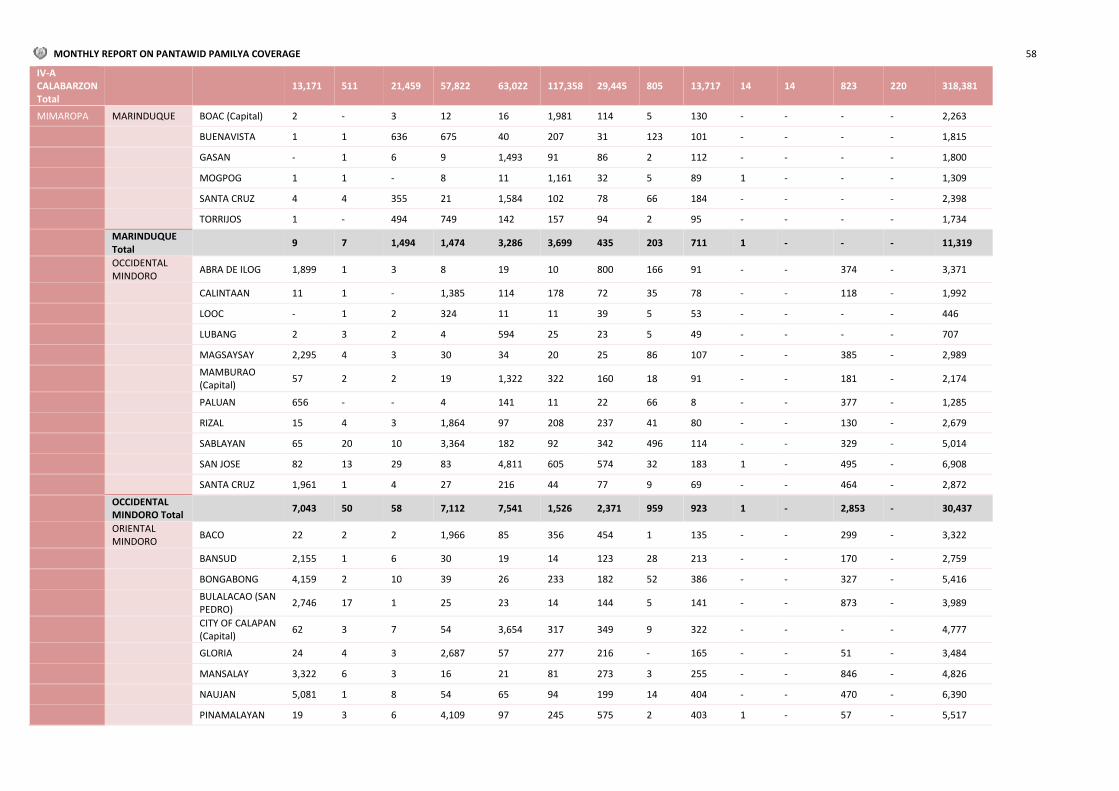
MONTHLY REPORT ON PANTAWID PAMILYA COVERAGE 58
IV-A CALABARZON Total
13,171 511 21,459 57,822 63,022 117,358 29,445 805 13,717 14 14 823 220 318,381
MIMAROPA MARINDUQUE BOAC (Capital) 2 - 3 12 16 1,981 114 5 130 - - - - 2,263
BUENAVISTA 1 1 636 675 40 207 31 123 101 - - - - 1,815
GASAN - 1 6 9 1,493 91 86 2 112 - - - - 1,800
MOGPOG 1 1 - 8 11 1,161 32 5 89 1 - - - 1,309
SANTA CRUZ 4 4 355 21 1,584 102 78 66 184 - - - - 2,398
TORRIJOS 1 - 494 749 142 157 94 2 95 - - - - 1,734
MARINDUQUE Total
9 7 1,494 1,474 3,286 3,699 435 203 711 1 - - - 11,319
OCCIDENTAL MINDORO
ABRA DE ILOG 1,899 1 3 8 19 10 800 166 91 - - 374 - 3,371
CALINTAAN 11 1 - 1,385 114 178 72 35 78 - - 118 - 1,992
LOOC - 1 2 324 11 11 39 5 53 - - - - 446
LUBANG 2 3 2 4 594 25 23 5 49 - - - - 707
MAGSAYSAY 2,295 4 3 30 34 20 25 86 107 - - 385 - 2,989
MAMBURAO (Capital)
57 2 2 19 1,322 322 160 18 91 - - 181 - 2,174
PALUAN 656 - - 4 141 11 22 66 8 - - 377 - 1,285
RIZAL 15 4 3 1,864 97 208 237 41 80 - - 130 - 2,679
SABLAYAN 65 20 10 3,364 182 92 342 496 114 - - 329 - 5,014
SAN JOSE 82 13 29 83 4,811 605 574 32 183 1 - 495 - 6,908
SANTA CRUZ 1,961 1 4 27 216 44 77 9 69 - - 464 - 2,872
OCCIDENTAL MINDORO Total
7,043 50 58 7,112 7,541 1,526 2,371 959 923 1 - 2,853 - 30,437
ORIENTAL MINDORO
BACO 22 2 2 1,966 85 356 454 1 135 - - 299 - 3,322
BANSUD 2,155 1 6 30 19 14 123 28 213 - - 170 - 2,759
BONGABONG 4,159 2 10 39 26 233 182 52 386 - - 327 - 5,416
BULALACAO (SAN PEDRO)
2,746 17 1 25 23 14 144 5 141 - - 873 - 3,989
CITY OF CALAPAN (Capital)
62 3 7 54 3,654 317 349 9 322 - - - - 4,777
GLORIA 24 4 3 2,687 57 277 216 - 165 - - 51 - 3,484
MANSALAY 3,322 6 3 16 21 81 273 3 255 - - 846 - 4,826
NAUJAN 5,081 1 8 54 65 94 199 14 404 - - 470 - 6,390
PINAMALAYAN 19 3 6 4,109 97 245 575 2 403 1 - 57 - 5,517

MONTHLY REPORT ON PANTAWID PAMILYA COVERAGE 59
POLA 1,995 - 5 27 15 10 96 8 247 - - 111 - 2,514
PUERTO GALERA 27 1 3 33 990 100 84 4 49 - - 357 - 1,648
ROXAS 34 4 4 2,970 476 81 269 2 245 1 - 52 - 4,138
SAN TEODORO 14 1 2 836 50 191 81 4 46 1 - 163 - 1,389
SOCORRO 17 - 4 2,012 106 103 311 5 204 - - 124 - 2,886
VICTORIA 38 1 6 31 2,230 205 230 82 199 - - 97 - 3,119
ORIENTAL MINDORO Total
19,715 46 70 14,889 7,914 2,321 3,586 219 3,414 3 - 3,997 - 56,174
PALAWAN ABORLAN 2 27 55 1,857 98 164 94 11 55 - - 7 - 2,370
AGUTAYA 3 698 6 7 3 231 62 4 58 - - 23 - 1,095
ARACELI 2 17 826 13 206 18 162 1 64 - - 3 - 1,312
BALABAC - 2,216 15 83 7 939 165 4 94 - - 330 - 3,853
BATARAZA 4 84 67 3,841 234 339 285 20 180 - - 1,918 - 6,972
BROOKE'S POINT 2 20 40 3,118 282 329 314 19 162 - - 927 - 5,213
BUSUANGA 1 1,191 27 24 11 315 109 2 130 - - - - 1,810
CAGAYANCILLO - - 1 389 11 31 128 1 19 - - - - 580
CORON 19 71 2,187 61 637 95 142 3 147 - - 88 - 3,450
CULION 2 35 19 816 8 235 73 4 67 - - 173 - 1,432
CUYO 1 33 18 789 22 28 197 10 71 - - 27 - 1,196
DUMARAN - 1,608 21 29 18 318 72 2 111 - - 1 - 2,180
EL NIDO (BACUIT) 4 1,980 26 23 24 1,038 106 3 191 - - 4 - 3,399
LINAPACAN - 1,111 9 9 5 330 62 2 74 - - 35 - 1,637
MAGSAYSAY - 6 4 596 12 62 49 8 50 - - 41 - 828
NARRA 9 32 71 2,767 125 734 267 9 168 - - 40 - 4,222
PUERTO PRINCESA CITY (Capital)
14 297 1,196 3,005 1,919 384 429 74 218 - - 215 - 7,751
QUEZON 9 660 2,814 77 198 579 221 16 182 - - 853 - 5,609
RIZAL (MARCOS) 2 43 2,692 65 746 68 277 12 88 - - 1,207 - 5,200
ROXAS 3 102 3,596 63 691 83 237 11 209 - - 28 3 5,026
SAN VICENTE 10 1,674 29 32 23 483 92 7 136 - - 1 - 2,487
SOFRONIO ESPAÑOLA
1 15 1,856 73 447 56 246 5 65 - - 738 - 3,502
TAYTAY 12 5,206 42 45 26 1,286 276 8 322 - - 53 - 7,276

MONTHLY REPORT ON PANTAWID PAMILYA COVERAGE 60
PALAWAN Total 100 17,126 15,617 17,782 5,753 8,145 4,065 236 2,861 - - 6,712 3 78,400
ROMBLON ALCANTARA 1 1 1 663 24 43 139 5 26 - - - - 903
BANTON 2 - - 223 - 24 8 - 11 - - 229 - 497
CAJIDIOCAN 1 1 2 1,097 149 20 136 26 104 - - 158 - 1,694
CALATRAVA 1 - 3 435 7 51 23 1 53 - - - - 574
CONCEPCION 2 - - 182 6 7 6 - 18 - - - - 221
CORCUERA - - 586 3 71 15 32 1 66 - - - - 774
FERROL - - 1 385 17 37 19 4 34 - - - - 497
LOOC 7 4 2 744 50 19 387 7 89 - - - - 1,309
MAGDIWANG 4 1 2 689 44 22 127 12 59 - - 144 - 1,104
ODIONGAN 6 2 9 37 1,207 76 67 13 102 - - - - 1,519
ROMBLON (Capital)
5 1 4 1,392 49 21 216 8 91 - - - - 1,787
SAN AGUSTIN 4 2 805 425 36 30 24 2 119 - - - - 1,447
SAN ANDRES 8 1 1 733 17 125 49 3 79 - - 259 - 1,275
SAN FERNANDO 3 3 - 1,160 34 65 123 4 102 - - 133 - 1,627
SAN JOSE - 627 5 4 1 156 18 2 79 - - - - 892
SANTA FE 3 3 595 446 20 147 44 3 78 - - 7 - 1,346
SANTA MARIA (IMELDA)
2 - 4 420 10 38 26 1 45 - - - - 546
ROMBLON Total 49 646 2,020 9,038 1,742 896 1,444 92 1,155 - - 930 - 18,012
MIMAROPA Total
26,916 17,875 19,259 50,295 26,236 16,587 11,901 1,709 9,064 5 - 14,492 3 194,342
V ALBAY BACACAY 3 - 393 32 13 3,367 130 28 253 - - - - 4,219
CAMALIG 3 4 14 17 2,864 125 907 45 235 - - - - 4,214
CITY OF LIGAO 8 5 860 29 33 4,784 210 197 376 1 - - - 6,503
CITY OF TABACO 4 3 1,175 58 29 5,721 241 14 459 - - 26 - 7,730
DARAGA (LOCSIN) 5 12 770 52 36 3,842 219 20 279 - - - - 5,235
GUINOBATAN 5 5 14 13 3,604 127 1,125 48 328 1 - 12 - 5,282
JOVELLAR - 2 287 8 6 1,258 60 9 146 - - - - 1,776
LEGAZPI CITY (Capital)
10 5 1,233 39 6,110 342 308 71 473 - - - - 8,591
LIBON 2,242 5 8 32 33 2,422 171 33 323 - - - - 5,269
MALILIPOT 2 - 402 21 9 1,702 88 11 142 - - - - 2,377

MONTHLY REPORT ON PANTAWID PAMILYA COVERAGE 61
MALINAO 2 - 405 20 13 1,883 39 111 161 - - - - 2,634
MANITO 1 1 406 10 13 1,124 59 136 97 - - - - 1,847
OAS 3 8 3 19 3,422 161 1,133 40 250 - - - - 5,039
PIO DURAN 7 8 587 13 21 3,183 189 106 289 1 - - - 4,404
POLANGUI 1 - 396 25 21 3,183 109 75 190 - - 387 - 4,387
RAPU-RAPU 1 1 410 8 10 1,748 148 39 167 - - 226 - 2,758
SANTO DOMINGO (LIBOG)
1 - 358 18 12 1,514 103 10 106 - - 2 - 2,124
TIWI 3 2 10 11 2,336 67 70 46 171 - - 191 - 2,907
ALBAY Total 2,301 61 7,731 425 18,585 36,553 5,309 1,039 4,445 3 - 844 - 77,296
CAMARINES NORTE
BASUD 5 1 7 1,774 86 68 424 14 155 1 - 1 - 2,536
CAPALONGA 1 2 370 1,825 32 158 66 13 153 - - 31 - 2,651
DAET (Capital) 4 - 10 61 2,702 194 110 33 128 - - - - 3,242
JOSE PANGANIBAN
1 1 14 2,202 26 66 519 15 76 - - 39 - 2,959
LABO 4 2 10 2,377 41 59 2,114 17 172 2 - 57 - 4,855
MERCEDES 2 - 437 2,691 42 333 155 12 209 1 - - - 3,882
PARACALE 2 - 413 2,201 63 284 73 7 88 - - 21 - 3,152
SAN LORENZO RUIZ (IMELDA)
- - 350 342 15 135 18 11 73 - - - - 944
SAN VICENTE 2 - 2 407 4 4 124 2 22 - - 1 - 568
SANTA ELENA 1 1 374 2,255 51 245 146 5 180 - - 4 - 3,262
TALISAY - 1 3 14 974 33 23 10 61 - - - - 1,119
VINZONS - - 6 2,418 17 83 429 41 179 - - 6 - 3,179
CAMARINES NORTE Total
22 8 1,996 18,567 4,053 1,662 4,201 180 1,496 4 - 160 - 32,349
CAMARINES SUR BAAO 2 - 5 10 2,623 78 24 5 168 - - 12 - 2,927
BALATAN 11 - 1,775 22 164 23 62 8 122 1 - - - 2,188
BATO 5 1 7 2,682 24 32 184 15 138 - - - - 3,088
BOMBON - - 5 668 4 7 48 16 30 - - - - 778
BUHI - 2 6 2,963 59 28 1,027 13 246 - - 555 - 4,899
BULA 3 - 412 2,723 55 347 71 13 177 - - - - 3,801
CABUSAO 2 - 1,083 18 77 14 11 8 58 - - - - 1,271

MONTHLY REPORT ON PANTAWID PAMILYA COVERAGE 62
CALABANGA 1 3 11 4,142 90 57 264 8 167 1 - - - 4,744
CAMALIGAN 1 - 4 800 9 20 137 2 50 - - - - 1,023
CANAMAN - - 2 20 1,401 66 60 32 93 - - - - 1,674
CARAMOAN 1 1 383 2,979 79 264 132 69 245 - - - - 4,153
DEL GALLEGO 2 1 274 1,090 14 108 31 3 77 - - - - 1,600
GAINZA 1 - 3 465 6 2 127 1 29 - - - - 634
GARCHITORENA 2 2 2,008 28 76 122 50 1 104 - - - - 2,393
GOA 3 - 5 2,802 181 125 414 305 151 - - 15 - 4,001
IRIGA CITY 3 1 6 56 3,335 131 90 6 176 - - 291 - 4,095
LAGONOY - 1 5 2,907 66 108 156 13 178 - - - - 3,434
LIBMANAN 4 2 420 5,836 60 455 132 10 376 - - - - 7,295
LUPI 3 - 332 1,651 28 183 63 7 100 - - - - 2,367
MAGARAO - - 2 9 1,143 54 33 57 59 - - - - 1,357
MILAOR - - 4 14 1,487 55 55 7 57 - - - - 1,679
MINALABAC 3 1 372 1,462 25 707 56 37 99 - - - - 2,762
NABUA 3 1 10 26 3,299 175 90 8 177 - - - - 3,789
NAGA CITY 9 2 1,169 2,020 73 1,434 76 32 191 1 - - - 5,007
OCAMPO 1 - 2 2,462 41 33 498 10 127 1 - 851 - 4,026
PAMPLONA 2 - 390 599 20 1,146 31 17 101 - - - - 2,306
PASACAO 6 - 198 2,858 43 192 78 7 166 - - - - 3,548
PILI (Capital) 4 2 12 54 3,301 123 73 19 182 1 - 99 - 3,870
PRESENTACION (PARUBCAN)
- - 396 910 33 312 40 2 59 - - - - 1,752
RAGAY 9 2 388 2,683 69 170 77 29 197 - - - - 3,624
SAGÑAY 1 - 387 1,820 25 203 115 13 131 1 - 520 - 3,216
SAN FERNANDO 2 1 7 1,507 27 19 319 3 80 - - - - 1,965
SAN JOSE 1 - 361 34 1,704 104 61 13 125 - - - - 2,403
SIPOCOT 2 - 8 3,123 28 47 476 3 246 1 - - - 3,934
SIRUMA 3 2 374 907 40 171 23 5 99 - - - - 1,624
TIGAON 1 - 5 2,854 58 54 374 6 171 - - 194 - 3,717
TINAMBAC 2 1 383 3,876 57 183 129 89 195 - - - - 4,915
CAMARINES SUR Total
93 26 11,214 59,080 19,824 7,352 5,687 892 5,147 7 - 2,537 - 111,859

MONTHLY REPORT ON PANTAWID PAMILYA COVERAGE 63
CATANDUANES BAGAMANOC - - 370 259 5 13 23 10 50 - - - - 730
BARAS - - 2 765 21 24 30 4 55 - - - - 901
BATO - - 5 860 48 38 42 1 68 - - 1 - 1,063
CARAMORAN - 2 393 1,756 36 32 51 2 147 - - - - 2,419
GIGMOTO 4 1 4 400 12 65 10 4 30 - - - - 530
PANDAN 2 - 408 947 4 23 20 17 84 - - - - 1,505
PANGANIBAN (PAYO)
- - 2 519 9 12 33 28 37 - - - - 640
SAN ANDRES (CALOLBON)
2 2 4 2,054 82 91 67 29 164 - - - - 2,495
SAN MIGUEL - - 5 762 27 31 16 21 37 - - - - 899
VIGA 1 2 2 1,102 38 19 321 87 75 - - - - 1,647
VIRAC (Capital) 2 1 3 2,368 153 81 60 115 168 - - - - 2,951
CATANDUANES Total
11 8 1,198 11,792 435 429 673 318 915 - - 1 - 15,780
MASBATE AROROY 35 5,269 17 52 19 301 153 19 246 - - - - 6,111
BALENO 11 20 5 1,801 16 232 70 6 108 - - - - 2,269
BALUD 2,493 28 10 23 13 30 90 10 189 - - - - 2,886
BATUAN 1 2 7 1,004 9 59 42 - 72 - - - - 1,196
CATAINGAN 44 8 3,880 87 363 62 224 109 212 - - - - 4,989
CAWAYAN 4,577 38 25 15 11 227 195 9 362 - - - - 5,459
CITY OF MASBATE (Capital)
44 30 34 5,222 48 85 541 17 309 - - 1 - 6,331
CLAVERIA 3,069 8 9 10 6 12 124 2 327 - - - - 3,567
DIMASALANG 14 2 1,856 5 104 23 76 3 106 - - - - 2,189
ESPERANZA 1,363 3 5 12 9 5 42 2 86 1 - - - 1,528
MANDAON 34 2,840 8 21 7 831 107 8 237 - - - - 4,093
MILAGROS 41 4,019 19 39 7 899 166 10 268 - - - - 5,468
MOBO 13 15 2,685 33 301 66 116 9 179 - - - - 3,417
MONREAL 1,833 2 7 15 4 9 85 7 157 - - - - 2,119
PALANAS 17 6 1,924 18 171 15 87 60 190 - - - - 2,488
PIO V. CORPUZ (LIMBUHAN)
30 9 10 1,727 41 95 105 4 126 - - - - 2,147
PLACER 4,259 11 20 12 13 16 161 7 350 - - - - 4,849
SAN FERNANDO 6 4 4 1,444 36 44 77 7 90 - - - - 1,712

MONTHLY REPORT ON PANTAWID PAMILYA COVERAGE 64
SAN JACINTO 8 5 5 1,964 32 25 195 4 152 - - - - 2,390
SAN PASCUAL 3,553 4 7 12 6 32 44 15 206 - - - - 3,879
USON 3,865 17 40 25 12 52 165 3 309 - - - - 4,488
MASBATE Total 25,310 12,340 10,577 13,541 1,228 3,120 2,865 311 4,281 1 - 1 - 73,575
SORSOGON BARCELONA - - 1 1,357 29 8 160 4 153 3 - - - 1,715
BULAN 14 2 10 6,122 119 449 337 31 585 - - - - 7,669
BULUSAN 1 - 2 1,251 15 61 62 16 150 - - 76 - 1,634
CASIGURAN 1 2 7 2,032 25 36 228 5 193 8 - - - 2,537
CASTILLA 2 4 4,015 35 248 60 218 27 276 - - - - 4,885
CITY OF SORSOGON (Capital)
10 3 26 4,284 2,609 451 363 61 566 3 - - - 8,376
DONSOL 5 3,414 15 22 14 725 189 9 385 1 - 565 - 5,344
GUBAT 2 2 3 3,193 40 19 306 5 310 1 - - - 3,881
IROSIN 1 3 11 3,006 29 36 374 25 263 - - 93 - 3,841
JUBAN 4 - 3 2,019 45 190 95 75 146 - - - - 2,577
MAGALLANES 1 - 5 2,876 39 120 197 11 208 - - - - 3,457
MATNOG 3 3 2,562 35 341 46 190 10 284 - - 32 - 3,506
PILAR 6 8 5,259 45 510 65 240 11 396 - - 213 - 6,753
PRIETO DIAZ 2 - 2 1,299 33 66 78 8 111 - - 524 - 2,123
SANTA MAGDALENA
2 - 5 1,110 10 23 122 8 92 - - - - 1,372
SORSOGON Total
54 3,441 11,926 28,686 4,106 2,355 3,159 306 4,118 16 - 1,503 - 59,670
V Total 27,791 15,884 44,642 132,091 48,231 51,471 21,894 3,046 20,402 31 - 5,046 - 370,529
VI AKLAN ALTAVAS 1 - 7 1,121 4 82 98 10 15 - - 5 - 1,343
BALETE 1 6 1,401 27 160 24 100 8 39 - - - - 1,766
BANGA - 2 1 1,263 26 29 91 7 90 - - - - 1,509
BATAN 4 1 3 1,520 31 128 90 5 76 - - - - 1,858
BURUANGA 1 4 767 11 6 30 38 6 1 - - 1 - 865
IBAJAY 2 1 7 2,136 24 29 315 6 129 - - - - 2,649
KALIBO (Capital) - 16 3 26 12 1,997 148 6 72 - - - - 2,280
LEZO 1 - 1 8 495 20 46 5 20 - - - - 596
LIBACAO - 1,902 3 17 2 310 97 13 1 - - 299 - 2,644

MONTHLY REPORT ON PANTAWID PAMILYA COVERAGE 65
MADALAG 1 1,100 4 13 5 120 108 2 26 - - 295 - 1,674
MAKATO 1 5 3 1,247 17 51 248 3 94 - - - - 1,669
MALAY 3 13 11 1,290 15 84 141 3 53 - - 35 - 1,648
MALINAO 2 2 1 1,118 8 50 115 10 52 - - - - 1,358
NABAS - 4 1 1,279 41 112 62 6 72 - - 36 - 1,613
NEW WASHINGTON
- 11 8 1,782 20 52 261 11 36 1 - - - 2,182
NUMANCIA 5 2 3 8 3 909 87 1 35 - - - - 1,053
TANGALAN - 3 - 1,033 10 64 71 8 74 - - - - 1,263
AKLAN Total 22 3,072 2,224 13,899 879 4,091 2,116 110 885 1 - 671 - 27,970
ANTIQUE ANINI-Y 2 1 5 726 11 16 223 4 56 - - - - 1,044
BARBAZA 826 1 - 12 2 79 23 12 85 1 - - - 1,041
BELISON 1 1 - 2 6 397 27 3 32 - - - - 469
BUGASONG 1,473 2 1 7 9 69 65 14 127 - - - - 1,767
CALUYA 10 3 1 1,178 16 74 41 6 54 - - - - 1,383
CULASI 4 4 5 1,785 57 56 213 6 143 - - - - 2,273
HAMTIC 5 4 1 17 2,183 104 148 7 162 - - - - 2,631
LAUA-AN 1,182 2 - 8 5 42 23 8 97 - - - - 1,367
LIBERTAD 4 1 1 632 29 10 110 4 26 - - 15 - 832
PANDAN 1 1 2 12 1,224 40 95 3 114 - - - - 1,492
PATNONGON 10 - 1 1,589 23 47 276 7 144 - - - - 2,097
SAN JOSE (Capital)
9 2 3 22 11 1,487 137 6 78 - - - - 1,755
SAN REMIGIO 2,001 - 5 7 6 11 76 10 178 - - - - 2,294
SEBASTE - - - 769 16 17 84 8 86 - - - - 980
SIBALOM 8 2 5 21 2,614 124 171 11 174 - - 29 - 3,159
TIBIAO 7 - 3 1,151 44 65 118 5 103 - - - - 1,496
TOBIAS FORNIER (DAO)
5 - 1 6 1,028 46 69 6 90 - - 6 - 1,257
VALDERRAMA 1,109 - 1 6 3 42 37 5 104 - - 467 - 1,774
ANTIQUE Total 6,657 24 35 7,950 7,287 2,726 1,936 125 1,853 1 - 517 - 29,111
CAPIZ CUARTERO 1 - 2 1,136 16 23 84 8 82 - - - - 1,352
DAO 3 - 2 1,153 22 51 47 3 93 - - - - 1,374
DUMALAG 1 - 1 819 30 51 119 4 99 - - - - 1,124

MONTHLY REPORT ON PANTAWID PAMILYA COVERAGE 66
DUMARAO 3 - 2 2,111 114 93 124 11 143 - - - - 2,601
IVISAN 1 - 1 1,007 83 52 45 4 86 - - - - 1,279
JAMINDAN 2 4 640 1,350 44 67 77 3 167 - - 130 - 2,484
MA-AYON 2 2 404 2,000 33 50 97 3 203 - - - - 2,794
MAMBUSAO 2 2 2 1,470 51 81 122 1 136 - - - - 1,867
PANAY 3 3 392 1,517 17 68 79 5 168 - - - - 2,252
PANITAN 2 1 2 1,494 41 50 59 2 100 - - - - 1,751
PILAR 1 10 419 2,271 55 54 98 4 230 - - - - 3,142
PONTEVEDRA 2 2 2 1,826 40 80 45 5 150 - - - - 2,152
PRESIDENT ROXAS
1 - 379 1,031 14 30 26 1 96 - - - - 1,578
ROXAS CITY (Capital)
13 9 9 4,279 136 283 183 14 268 - - - - 5,194
SAPI-AN - 2 3 1,503 33 72 90 1 127 - - - - 1,831
SIGMA - 1 3 1,178 50 76 56 2 121 - - - - 1,487
TAPAZ 6 2 348 2,969 76 165 165 5 268 - - 13 - 4,017
CAPIZ Total 43 38 2,611 29,114 855 1,346 1,516 76 2,537 - - 143 - 38,279
GUIMARAS BUENAVISTA 4 2 6 12 19 1,070 92 42 123 - - 5 - 1,375
JORDAN (Capital) 7 3 - 11 1,239 68 118 5 146 - - 4 - 1,601
NUEVA VALENCIA 3 2 4 10 1,594 97 167 11 167 - - 11 - 2,066
SAN LORENZO 1 - 458 1,027 14 68 118 - 186 - - - - 1,872
SIBUNAG 1 1 344 746 18 88 56 - 133 - - - - 1,387
GUIMARAS Total
16 8 812 1,806 2,884 1,391 551 58 755 - - 20 - 8,301
ILOILO AJUY 6 2 411 2,307 29 107 143 4 173 1 - 1 - 3,184
ALIMODIAN 2 1 3 1,033 22 24 379 8 118 - - - - 1,590
ANILAO 1 2 5 1,256 14 30 236 2 85 - - - - 1,631
BADIANGAN 1 - 2 9 775 64 68 8 43 - - - - 970
BALASAN 2 - 13 1,323 21 46 140 11 105 - - - - 1,661
BANATE 1 1 3 1,395 22 65 155 5 114 - - - - 1,761
BAROTAC NUEVO 1 1 4 28 1,741 104 277 123 115 - - - - 2,394
BAROTAC VIEJO 3 - 6 1,940 41 46 272 7 205 - - 13 - 2,533
BATAD 3 1 405 572 11 23 26 7 70 - - - - 1,118
BINGAWAN 3 - 1 591 10 15 51 4 36 - - - - 711

MONTHLY REPORT ON PANTAWID PAMILYA COVERAGE 67
CABATUAN 1 - 3 15 1,324 101 133 14 71 2 - - - 1,664
CALINOG - 11 2 2,185 59 90 379 20 152 - - 156 - 3,054
CARLES 16 13 4,281 65 39 83 154 8 267 - - - - 4,926
CITY OF PASSI 7 3 7 1,189 37 89 1,509 8 191 - - - - 3,040
CONCEPCION 1 2 2,342 164 169 100 139 9 156 - - - - 3,082
DINGLE 1 - 1 18 1,321 82 104 10 91 - - - - 1,628
DUEÑAS 3 - 1 857 30 28 219 2 73 - - 9 - 1,222
DUMANGAS - 1 10 26 1,990 117 171 13 114 - - - - 2,442
ESTANCIA 16 6 97 23 2,226 162 151 10 169 - - - - 2,860
GUIMBAL 3 1 4 18 3 653 46 4 46 - - - - 778
IGBARAS 2 - 329 741 13 77 68 - 88 - - - - 1,318
ILOILO CITY (Capital)
2,258 9 19 4,335 51 3,695 405 98 586 1 - - - 11,457
JANIUAY 3 - 4 1,883 72 133 467 21 136 - - 155 - 2,874
LAMBUNAO 2 - 4 2,840 36 256 458 13 159 - - 61 - 3,829
LEGANES 1 1 1 14 9 547 276 20 30 - - - - 899
LEMERY 1 2 396 1,009 29 79 92 7 81 - - - - 1,696
LEON 1 2 7 1,646 22 28 209 9 179 - - - - 2,103
MAASIN 1 1 347 865 24 57 54 3 74 - - - - 1,426
MIAGAO - 1 - 1,610 21 46 124 2 151 - - - - 1,955
MINA 1 1 3 11 634 33 57 17 33 - - - - 790
NEW LUCENA 2 - - 15 517 39 17 8 32 - - - - 630
OTON 12 2 1 33 12 1,667 283 1 117 - - - - 2,128
PAVIA 2 2 1 23 12 652 78 1 23 - - - - 794
POTOTAN 4 1 2 21 1,888 104 164 28 148 1 - 13 - 2,374
SAN DIONISIO 1 1 424 1,541 32 299 117 15 138 - - - - 2,568
SAN ENRIQUE - - 370 963 27 176 80 1 143 - - 12 - 1,772
SAN JOAQUIN 1 - 374 1,528 34 137 101 2 154 - - - - 2,331
SAN MIGUEL - - 1 11 7 534 66 3 31 - - - - 653
SAN RAFAEL - 1 337 390 15 233 62 12 42 - - - - 1,092
SANTA BARBARA 2 1 4 27 16 1,340 98 4 100 - - - - 1,592
SARA 1 1 10 2,057 23 62 164 6 142 - - - - 2,466
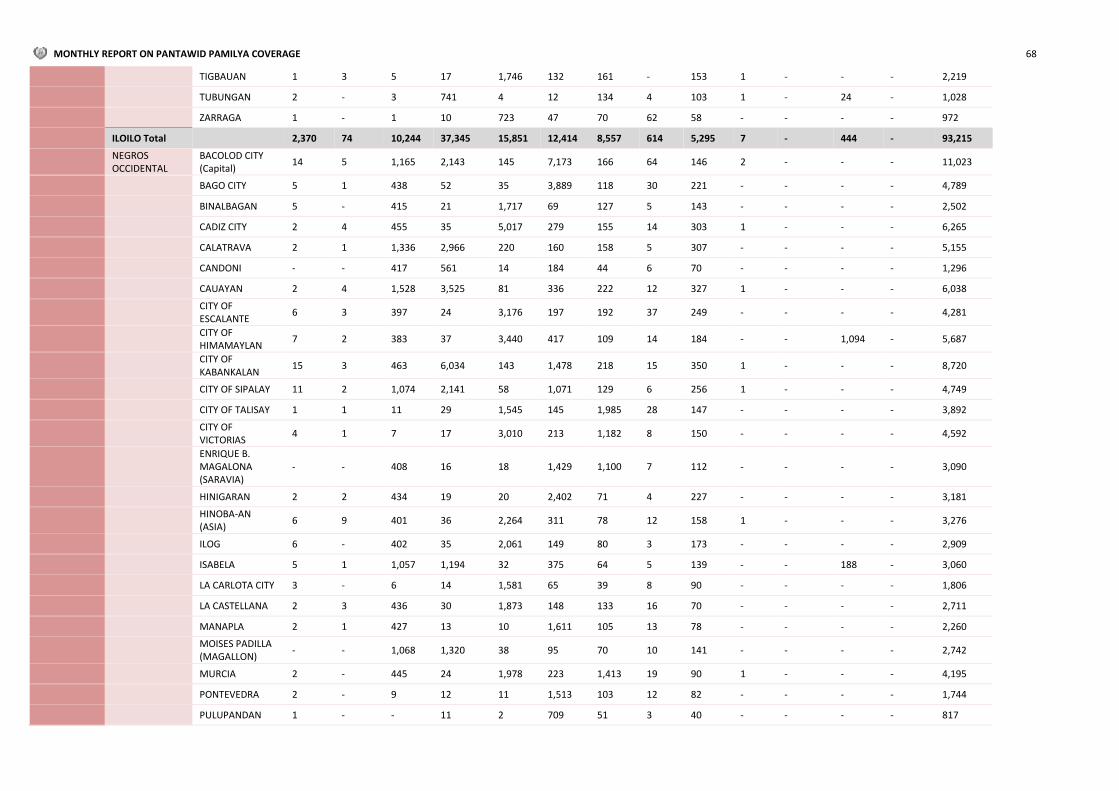
MONTHLY REPORT ON PANTAWID PAMILYA COVERAGE 68
TIGBAUAN 1 3 5 17 1,746 132 161 - 153 1 - - - 2,219
TUBUNGAN 2 - 3 741 4 12 134 4 103 1 - 24 - 1,028
ZARRAGA 1 - 1 10 723 47 70 62 58 - - - - 972
ILOILO Total 2,370 74 10,244 37,345 15,851 12,414 8,557 614 5,295 7 - 444 - 93,215
NEGROS OCCIDENTAL
BACOLOD CITY (Capital)
14 5 1,165 2,143 145 7,173 166 64 146 2 - - - 11,023
BAGO CITY 5 1 438 52 35 3,889 118 30 221 - - - - 4,789
BINALBAGAN 5 - 415 21 1,717 69 127 5 143 - - - - 2,502
CADIZ CITY 2 4 455 35 5,017 279 155 14 303 1 - - - 6,265
CALATRAVA 2 1 1,336 2,966 220 160 158 5 307 - - - - 5,155
CANDONI - - 417 561 14 184 44 6 70 - - - - 1,296
CAUAYAN 2 4 1,528 3,525 81 336 222 12 327 1 - - - 6,038
CITY OF ESCALANTE
6 3 397 24 3,176 197 192 37 249 - - - - 4,281
CITY OF HIMAMAYLAN
7 2 383 37 3,440 417 109 14 184 - - 1,094 - 5,687
CITY OF KABANKALAN
15 3 463 6,034 143 1,478 218 15 350 1 - - - 8,720
CITY OF SIPALAY 11 2 1,074 2,141 58 1,071 129 6 256 1 - - - 4,749
CITY OF TALISAY 1 1 11 29 1,545 145 1,985 28 147 - - - - 3,892
CITY OF VICTORIAS
4 1 7 17 3,010 213 1,182 8 150 - - - - 4,592
ENRIQUE B. MAGALONA (SARAVIA)
- - 408 16 18 1,429 1,100 7 112 - - - - 3,090
HINIGARAN 2 2 434 19 20 2,402 71 4 227 - - - - 3,181
HINOBA-AN (ASIA)
6 9 401 36 2,264 311 78 12 158 1 - - - 3,276
ILOG 6 - 402 35 2,061 149 80 3 173 - - - - 2,909
ISABELA 5 1 1,057 1,194 32 375 64 5 139 - - 188 - 3,060
LA CARLOTA CITY 3 - 6 14 1,581 65 39 8 90 - - - - 1,806
LA CASTELLANA 2 3 436 30 1,873 148 133 16 70 - - - - 2,711
MANAPLA 2 1 427 13 10 1,611 105 13 78 - - - - 2,260
MOISES PADILLA (MAGALLON)
- - 1,068 1,320 38 95 70 10 141 - - - - 2,742
MURCIA 2 - 445 24 1,978 223 1,413 19 90 1 - - - 4,195
PONTEVEDRA 2 - 9 12 11 1,513 103 12 82 - - - - 1,744
PULUPANDAN 1 - - 11 2 709 51 3 40 - - - - 817
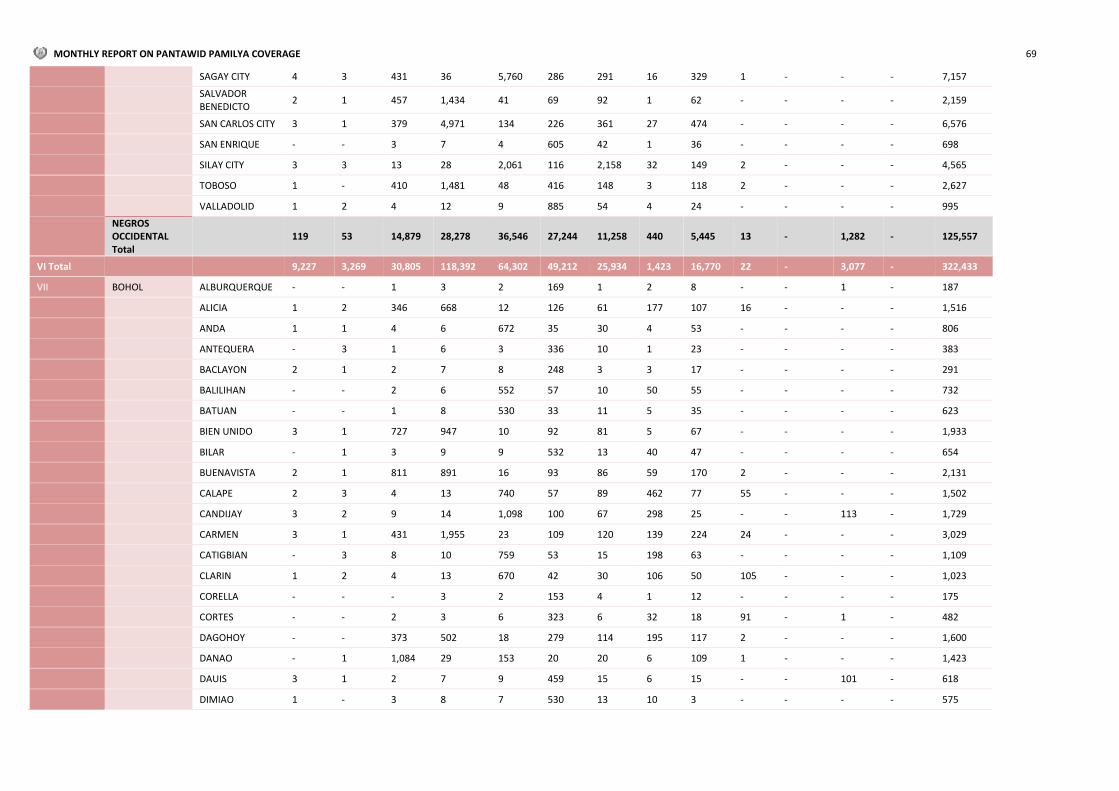
MONTHLY REPORT ON PANTAWID PAMILYA COVERAGE 69
SAGAY CITY 4 3 431 36 5,760 286 291 16 329 1 - - - 7,157
SALVADOR BENEDICTO
2 1 457 1,434 41 69 92 1 62 - - - - 2,159
SAN CARLOS CITY 3 1 379 4,971 134 226 361 27 474 - - - - 6,576
SAN ENRIQUE - - 3 7 4 605 42 1 36 - - - - 698
SILAY CITY 3 3 13 28 2,061 116 2,158 32 149 2 - - - 4,565
TOBOSO 1 - 410 1,481 48 416 148 3 118 2 - - - 2,627
VALLADOLID 1 2 4 12 9 885 54 4 24 - - - - 995
NEGROS OCCIDENTAL Total
119 53 14,879 28,278 36,546 27,244 11,258 440 5,445 13 - 1,282 - 125,557
VI Total 9,227 3,269 30,805 118,392 64,302 49,212 25,934 1,423 16,770 22 - 3,077 - 322,433
VII BOHOL ALBURQUERQUE - - 1 3 2 169 1 2 8 - - 1 - 187
ALICIA 1 2 346 668 12 126 61 177 107 16 - - - 1,516
ANDA 1 1 4 6 672 35 30 4 53 - - - - 806
ANTEQUERA - 3 1 6 3 336 10 1 23 - - - - 383
BACLAYON 2 1 2 7 8 248 3 3 17 - - - - 291
BALILIHAN - - 2 6 552 57 10 50 55 - - - - 732
BATUAN - - 1 8 530 33 11 5 35 - - - - 623
BIEN UNIDO 3 1 727 947 10 92 81 5 67 - - - - 1,933
BILAR - 1 3 9 9 532 13 40 47 - - - - 654
BUENAVISTA 2 1 811 891 16 93 86 59 170 2 - - - 2,131
CALAPE 2 3 4 13 740 57 89 462 77 55 - - - 1,502
CANDIJAY 3 2 9 14 1,098 100 67 298 25 - - 113 - 1,729
CARMEN 3 1 431 1,955 23 109 120 139 224 24 - - - 3,029
CATIGBIAN - 3 8 10 759 53 15 198 63 - - - - 1,109
CLARIN 1 2 4 13 670 42 30 106 50 105 - - - 1,023
CORELLA - - - 3 2 153 4 1 12 - - - - 175
CORTES - - 2 3 6 323 6 32 18 91 - 1 - 482
DAGOHOY - - 373 502 18 279 114 195 117 2 - - - 1,600
DANAO - 1 1,084 29 153 20 20 6 109 1 - - - 1,423
DAUIS 3 1 2 7 9 459 15 6 15 - - 101 - 618
DIMIAO 1 - 3 8 7 530 13 10 3 - - - - 575

MONTHLY REPORT ON PANTAWID PAMILYA COVERAGE 70
DUERO 2 2 4 9 658 53 35 4 37 - - 66 - 870
GARCIA HERNANDEZ
1 - - 10 7 541 31 21 39 - - - - 650
GUINDULMAN 3 - 4 22 1,212 58 52 18 35 - - 78 - 1,482
INABANGA 5 1 375 1,715 16 166 37 6 147 - - - - 2,468
JAGNA 4 1 3 13 14 1,052 45 24 63 - - 1 - 1,220
JETAFE 3 - 489 1,725 14 124 196 89 232 - - - - 2,872
LILA - - 1 5 302 33 2 14 21 - - - - 378
LOAY 1 - 2 6 5 343 21 5 16 - - 24 - 423
LOBOC 1 - - 3 4 315 6 5 35 - - - - 369
LOON 4 2 4 14 862 61 54 140 75 113 - - - 1,329
MABINI 2 - 404 898 15 135 46 216 65 - - - - 1,781
MARIBOJOC 1 2 2 5 9 442 9 19 28 - - - - 517
PANGLAO 3 3 2 19 9 464 17 146 27 1 - - - 691
PILAR 3 1 386 1,177 21 85 55 3 145 - - 60 - 1,936
PRES. CARLOS P. GARCIA (PITOGO)
3 1 711 771 12 135 76 156 178 - - - - 2,043
SAGBAYAN (BORJA)
1 - 6 17 863 80 46 109 63 102 - - - 1,287
SAN ISIDRO - - 1 5 286 21 10 78 36 - - - - 437
SAN MIGUEL 1 - 5 23 1,194 89 69 5 102 2 - - - 1,490
SEVILLA - - 2 8 2 389 6 127 36 - - 1 - 571
SIERRA BULLONES
1 - 6 13 898 62 42 54 65 54 - - - 1,195
SIKATUNA 1 1 1 4 - 122 1 24 13 - - - - 167
TAGBILARAN CITY (Capital)
4 4 14 23 592 59 14 9 31 - - - - 750
TALIBON 3 2 16 36 2,817 147 133 735 251 - - - - 4,140
TRINIDAD 1 3 382 1,281 23 87 107 6 166 1 - - - 2,057
TUBIGON 2 - 6 18 10 1,119 35 68 99 47 - - - 1,404
UBAY 10 6 1,108 3,100 59 370 222 11 296 1 - - - 5,183
VALENCIA - 2 3 14 945 109 21 32 90 - - - - 1,216
BOHOL Total 82 54 7,755 16,042 16,148 10,507 2,187 3,923 3,686 617 - 446 - 61,447
CEBU ALCANTARA 3 1 1 3 735 37 37 2 23 - - - - 842
ALCOY - 1 1 652 11 9 206 9 57 - - - - 946

MONTHLY REPORT ON PANTAWID PAMILYA COVERAGE 71
ALEGRIA 1 1 385 980 16 108 114 52 123 - - - - 1,780
ALOGUINSAN 2 - 3 14 1,159 37 44 5 99 - - 1 - 1,364
ARGAO 4 1 6 14 1,795 390 207 10 166 - 1 - - 2,594
ASTURIAS 5 4 403 1,800 25 180 75 13 144 - - - - 2,649
BADIAN 3 2 400 1,603 21 125 158 9 85 2 1 - - 2,409
BALAMBAN 8 4 8 34 2,315 119 128 603 189 3 - 1 - 3,412
BANTAYAN 9 8 14 4,377 48 105 458 1,408 269 1,430 - - - 8,126
BARILI 11 5 400 2,340 36 547 171 20 177 3 - - - 3,710
BOLJOON 1 3 491 11 7 258 160 13 48 1 - - - 993
BORBON 1 - 407 1,027 20 207 96 327 115 209 - 1 - 2,410
CARMEN - 4 4 19 1,096 81 48 167 69 145 - 1 - 1,634
CATMON 1 - 369 667 7 167 106 39 102 57 - - - 1,515
CEBU CITY (Capital)
2,189 25 49 1,707 101 2,815 270 1,689 398 13 325 3 - 9,584
CITY OF BOGO 10 2 8 27 1,896 148 205 1,366 152 1,271 - - - 5,085
CITY OF CARCAR 7 5 9 51 3,696 166 181 14 232 3 - - - 4,364
CITY OF NAGA 8 8 10 28 2,131 206 191 97 104 1 - - - 2,784
CITY OF TALISAY 16 12 20 57 1,813 105 46 6 59 1 - - - 2,135
COMPOSTELA 4 1 6 20 8 944 93 337 53 1 - - - 1,467
CONSOLACION 9 4 6 47 18 1,116 60 13 27 6 - - - 1,306
CORDOBA 6 5 424 29 8 1,239 49 34 74 1 - - - 1,869
DAANBANTAYAN 7 10 406 3,221 50 267 176 1,576 251 1,549 - - - 7,513
DALAGUETE 7 1 9 17 2,791 267 296 14 180 1 - - - 3,583
DANAO CITY 3 6 13 41 2,002 183 60 11 108 3 - - - 2,430
DUMANJUG 3 4 418 1,512 18 155 432 19 86 1 - - - 2,648
GINATILAN 3 - 401 343 14 64 46 - 43 - - - - 914
LAPU-LAPU CITY (OPON)
31 26 1,115 475 98 3,705 243 287 201 7 12 1 - 6,201
LILOAN 8 6 5 41 22 1,469 85 15 49 4 - 1 - 1,705
MADRIDEJOS 12 1 428 1,435 27 257 65 626 96 453 - - - 3,400
MALABUYOC 1 1 791 265 6 57 309 3 63 - - - - 1,496
MANDAUE CITY 19 9 1,074 138 52 997 102 343 95 11 140 - - 2,980
MEDELLIN 7 4 9 28 2,396 126 125 1,089 139 929 - - - 4,852

MONTHLY REPORT ON PANTAWID PAMILYA COVERAGE 72
MINGLANILLA 9 5 9 21 16 1,362 93 29 52 2 - - - 1,598
MOALBOAL 5 - 6 10 1,113 54 82 5 54 - - - - 1,329
OSLOB 1 2 366 521 14 201 222 5 85 - - - - 1,417
PILAR 1 - 1 5 550 42 15 218 65 207 - - - 1,104
PINAMUNGAHAN 4 1 8 21 2,632 121 105 3 183 3 - - - 3,081
PORO 2 - 361 645 19 110 69 537 81 316 - 1 - 2,141
RONDA 2 1 5 7 672 46 63 5 59 2 - - - 862
SAMBOAN 2 - 375 421 15 140 101 3 58 - - - - 1,115
SAN FERNANDO 7 5 6 25 1,725 123 151 12 71 1 - 2 - 2,128
SAN FRANCISCO 6 1 12 20 2,817 216 111 861 146 685 - - - 4,875
SAN REMIGIO 19 1 433 2,084 19 203 125 888 163 986 - - - 4,921
SANTA FE 2 5 9 21 1,742 52 50 653 68 705 - - - 3,307
SANTANDER 2 - 3 7 615 43 90 4 46 - - - - 810
SIBONGA 4 4 377 20 12 1,947 209 5 166 1 - - - 2,745
SOGOD 3 - 373 876 3 203 67 10 124 1 - - - 1,660
TABOGON 3 3 413 1,399 12 298 82 529 104 619 - - - 3,462
TABUELAN 1 - 398 837 6 118 104 286 92 293 - 1 - 2,136
TOLEDO CITY 16 1 14 51 4,194 292 288 8 254 2 - 1 - 5,121
TUBURAN 6 5 545 2,738 45 133 223 379 252 244 1 - - 4,571
TUDELA 1 - 374 22 34 3 105 83 39 91 - - - 752
CEBU Total 2,495 198 12,181 32,774 40,693 22,363 7,397 14,739 6,238 10,263 480 14 - 149,835
NEGROS ORIENTAL
AMLAN (AYUQUITAN)
4 1 2 7 567 79 153 69 58 - - - - 940
AYUNGON 2,515 - 6 13 6 37 73 3 163 - - - - 2,816
BACONG 13 3 15 13 768 52 55 19 23 - - - - 961
BAIS CITY 12 1 10 2,467 117 77 165 17 137 1 - 238 - 3,242
BASAY 1,286 - 12 12 238 78 104 223 130 2 - 253 - 2,338
BINDOY (PAYABON)
2,664 4 3 6 3 6 43 2 157 - - - - 2,888
CANLAON CITY 6 4 8 1,808 175 65 436 3 179 - - - - 2,684
CITY OF BAYAWAN (TULONG)
17 4 5,118 41 923 214 213 10 361 1 - 880 - 7,782
CITY OF GUIHULNGAN
7 3 16 5,881 123 521 257 5 443 1 - 1 - 7,258
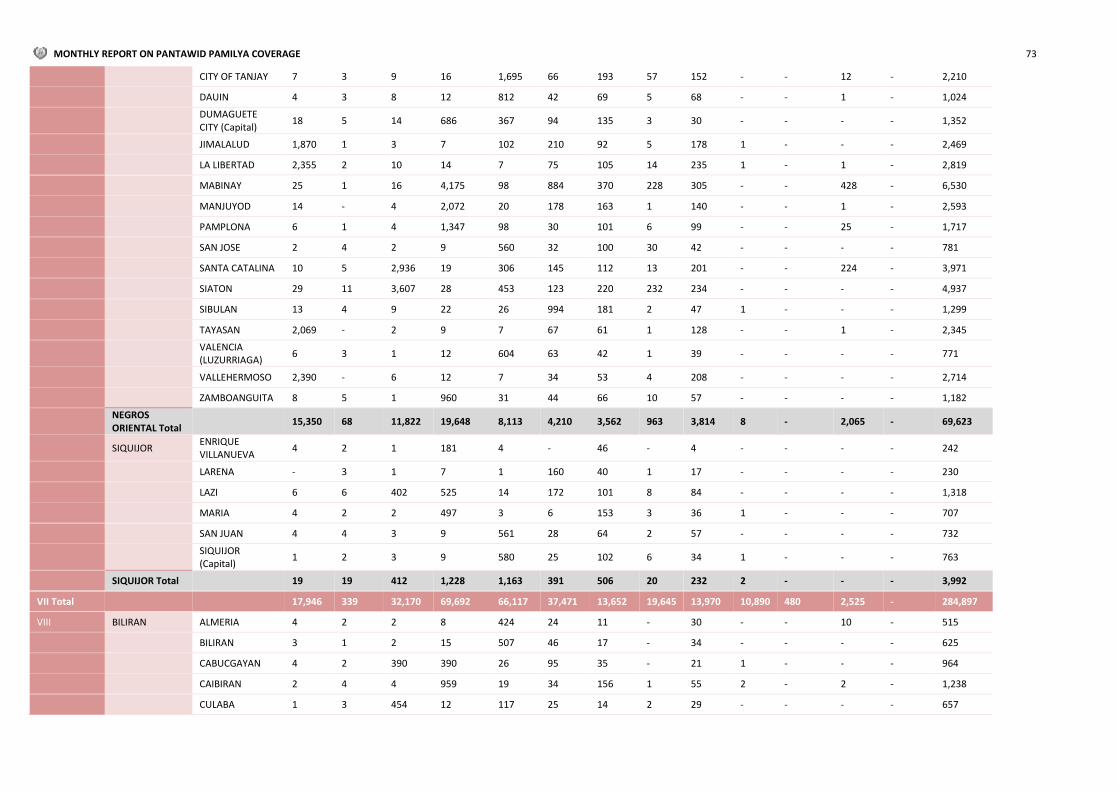
MONTHLY REPORT ON PANTAWID PAMILYA COVERAGE 73
CITY OF TANJAY 7 3 9 16 1,695 66 193 57 152 - - 12 - 2,210
DAUIN 4 3 8 12 812 42 69 5 68 - - 1 - 1,024
DUMAGUETE CITY (Capital)
18 5 14 686 367 94 135 3 30 - - - - 1,352
JIMALALUD 1,870 1 3 7 102 210 92 5 178 1 - - - 2,469
LA LIBERTAD 2,355 2 10 14 7 75 105 14 235 1 - 1 - 2,819
MABINAY 25 1 16 4,175 98 884 370 228 305 - - 428 - 6,530
MANJUYOD 14 - 4 2,072 20 178 163 1 140 - - 1 - 2,593
PAMPLONA 6 1 4 1,347 98 30 101 6 99 - - 25 - 1,717
SAN JOSE 2 4 2 9 560 32 100 30 42 - - - - 781
SANTA CATALINA 10 5 2,936 19 306 145 112 13 201 - - 224 - 3,971
SIATON 29 11 3,607 28 453 123 220 232 234 - - - - 4,937
SIBULAN 13 4 9 22 26 994 181 2 47 1 - - - 1,299
TAYASAN 2,069 - 2 9 7 67 61 1 128 - - 1 - 2,345
VALENCIA (LUZURRIAGA)
6 3 1 12 604 63 42 1 39 - - - - 771
VALLEHERMOSO 2,390 - 6 12 7 34 53 4 208 - - - - 2,714
ZAMBOANGUITA 8 5 1 960 31 44 66 10 57 - - - - 1,182
NEGROS ORIENTAL Total
15,350 68 11,822 19,648 8,113 4,210 3,562 963 3,814 8 - 2,065 - 69,623
SIQUIJOR ENRIQUE VILLANUEVA
4 2 1 181 4 - 46 - 4 - - - - 242
LARENA - 3 1 7 1 160 40 1 17 - - - - 230
LAZI 6 6 402 525 14 172 101 8 84 - - - - 1,318
MARIA 4 2 2 497 3 6 153 3 36 1 - - - 707
SAN JUAN 4 4 3 9 561 28 64 2 57 - - - - 732
SIQUIJOR (Capital)
1 2 3 9 580 25 102 6 34 1 - - - 763
SIQUIJOR Total 19 19 412 1,228 1,163 391 506 20 232 2 - - - 3,992
VII Total 17,946 339 32,170 69,692 66,117 37,471 13,652 19,645 13,970 10,890 480 2,525 - 284,897
VIII BILIRAN ALMERIA 4 2 2 8 424 24 11 - 30 - - 10 - 515
BILIRAN 3 1 2 15 507 46 17 - 34 - - - - 625
CABUCGAYAN 4 2 390 390 26 95 35 - 21 1 - - - 964
CAIBIRAN 2 4 4 959 19 34 156 1 55 2 - 2 - 1,238
CULABA 1 3 454 12 117 25 14 2 29 - - - - 657

MONTHLY REPORT ON PANTAWID PAMILYA COVERAGE 74
KAWAYAN 3 1 1 728 9 24 156 4 57 2 - - - 985
MARIPIPI 1 1 2 1 223 20 8 2 18 1 - - - 277
NAVAL (Capital) 4 7 8 34 1,608 100 93 3 67 2 - - - 1,926
BILIRAN Total 22 21 863 2,147 2,933 368 490 12 311 8 - 12 - 7,187
EASTERN SAMAR
ARTECHE 7 - 359 702 26 137 89 1 94 1 - - - 1,416
BALANGIGA - 2 1 12 735 60 41 6 54 13 - - - 924
BALANGKAYAN - 1 1 5 503 47 49 10 29 63 - - - 708
CAN-AVID 1 1 6 4 1,142 107 143 - 62 2 - - - 1,468
CITY OF BORONGAN (Capital)
5 6 7 15 2,336 160 192 - 170 3 - - - 2,894
DOLORES 2 2 5 15 2,437 172 288 3 167 - - - - 3,091
GENERAL MACARTHUR
1 1 377 478 20 78 81 1 51 - - - - 1,088
GIPORLOS 3 5 2 5 712 68 100 53 51 69 - - - 1,068
GUIUAN 5 7 8 12 21 2,575 153 67 220 116 - - - 3,184
HERNANI - - 425 11 62 12 15 27 27 90 - - - 669
JIPAPAD 9 - 400 202 7 96 47 1 31 - - - - 793
LAWAAN 1 4 2 3 4 640 47 9 64 7 - - - 781
LLORENTE 1 1 349 4 789 72 82 5 99 - - - - 1,402
MASLOG 2 - 365 4 73 8 41 3 17 - - - - 513
MAYDOLONG - 1 1 2 613 54 39 4 68 10 - - - 792
MERCEDES - 3 - 3 4 277 38 5 30 4 - - - 364
ORAS 2 3 9 15 2,165 175 138 5 153 - - - - 2,665
QUINAPONDAN - 4 2 12 788 98 76 10 50 7 - - - 1,047
SALCEDO 2 1 7 14 1,057 106 98 11 113 16 - 1 - 1,426
SAN JULIAN 3 3 1 4 673 42 42 3 58 - - - - 829
SAN POLICARPO 2 - 364 582 17 82 69 2 69 1 - - - 1,188
SULAT - 1 2 5 8 751 76 14 75 1 - - - 933
TAFT - 4 1 7 935 107 106 2 84 - - - - 1,246
EASTERN SAMAR Total
46 50 2,694 2,116 15,127 5,924 2,050 242 1,836 403 - 1 - 30,489
LEYTE ABUYOG 2 5 12 2,671 31 135 463 6 223 3 - - - 3,551
ALANGALANG 2 6 401 2,597 16 323 328 956 135 1,641 - - - 6,405

MONTHLY REPORT ON PANTAWID PAMILYA COVERAGE 75
ALBUERA 2 1 394 1,436 62 311 132 1 133 2 - - - 2,474
BABATNGON 1 7 348 993 17 358 144 5 98 1 - - - 1,972
BARUGO 5 4 3 1,637 39 36 190 3 113 1 - - - 2,031
BATO 2 1 371 1,466 16 277 208 - 176 3 - 29 - 2,549
BURAUEN 1 1 334 1,939 44 97 153 - 133 3 - 6 - 2,711
CALUBIAN 1 3 487 1,297 18 171 355 2 186 - - - - 2,520
CAPOOCAN 5 3 388 1,492 32 251 150 1 152 1 - - - 2,475
CARIGARA 2 4 6 2,509 27 158 414 1 195 6 - - - 3,322
CITY OF BAYBAY 7 4 12 55 3,352 170 247 1 212 3 - - - 4,063
DAGAMI 2 2 390 956 7 613 149 122 123 4 - - - 2,368
DULAG 2 - 397 1,768 17 243 149 989 103 1,047 - - - 4,715
HILONGOS 4 1 13 2,667 29 133 413 1 280 - - - - 3,541
HINDANG 1 1 4 10 864 51 60 8 69 - - - - 1,068
INOPACAN 1 1 2 15 776 63 62 1 54 - - - - 975
ISABEL 5 1 10 19 7 1,123 185 1 57 1 - 24 - 1,433
JARO - 4 4 2,121 16 85 371 10 202 4 - - - 2,817
JAVIER (BUGHO) 2 6 357 1,063 10 37 100 2 125 2 - - - 1,704
JULITA - 1 366 488 7 99 63 107 93 4 - - - 1,228
KANANGA 9 3 355 2,033 54 272 232 4 150 2 - - - 3,114
LA PAZ - 1 361 862 12 74 64 - 64 2 - - - 1,440
LEYTE 1 6 615 1,824 95 240 207 - 183 1 1 - - 3,173
MACARTHUR 2 2 372 788 7 87 73 2 83 2 - - - 1,418
MAHAPLAG 1 2 1 1,619 17 57 217 4 156 - - - - 2,074
MATAG-OB - 2 3 941 25 13 77 - 60 1 - - - 1,122
MATALOM 1 1 366 1,237 21 147 199 - 142 1 - - - 2,115
MAYORGA - - 386 662 6 179 96 33 89 3 - - - 1,454
MERIDA 1 - 1 1,028 9 43 221 1 56 1 - - - 1,361
ORMOC CITY 12 9 1,035 1,765 92 3,440 462 483 331 1,569 1 - - 9,199
PALO 2 10 15 41 2,318 142 112 679 92 1,333 - - - 4,744
PALOMPON 3 - 4 32 1,648 135 222 1 125 - - - - 2,170
PASTRANA - 5 377 806 10 143 71 3 134 1 - - - 1,550

MONTHLY REPORT ON PANTAWID PAMILYA COVERAGE 76
SAN ISIDRO 5 2 466 1,333 71 107 360 1 161 - - - - 2,506
SAN MIGUEL 2 5 370 915 18 99 93 3 90 2 - - - 1,597
SANTA FE - 5 399 816 10 138 135 4 79 2 - - - 1,588
TABANGO 3 3 548 1,252 39 263 343 - 113 - - - - 2,564
TABONTABON 2 2 371 207 11 137 24 17 43 - - - - 814
TACLOBAN CITY (Capital)
6 56 1,068 3,368 169 2,210 387 610 415 5,140 - 6 - 13,435
TANAUAN 3 9 12 30 2,303 131 138 945 129 1,383 - - - 5,083
TOLOSA 1 1 3 13 778 44 44 415 47 706 - - - 2,052
TUNGA - 1 1 7 1 334 15 3 15 - - - - 377
VILLABA 2 4 318 1,660 15 264 314 10 168 3 - - - 2,758
LEYTE Total 103 185 11,746 50,438 13,116 13,433 8,442 5,435 5,787 12,878 2 65 - 121,630
NORTHERN SAMAR
ALLEN 2 2 - 11 1,188 51 79 - 73 - - - - 1,406
BIRI 3 1 - 829 25 19 72 1 58 - - - - 1,008
BOBON 6 2 1 20 1,670 50 176 1 101 - - - - 2,027
CAPUL - - 1 755 11 26 109 - 75 - - - - 977
CATARMAN (Capital)
48 4 3 31 5,137 220 554 84 306 - - - - 6,387
CATUBIG 1,332 1 1 13 7 321 117 - 91 - - - - 1,883
GAMAY 15 2 2 1,744 35 48 120 3 122 - - - - 2,091
LAOANG 31 1 - 4,506 53 42 299 12 214 - - - - 5,158
LAPINIG 560 - 2 8 2 12 71 4 34 - - - - 693
LAS NAVAS 2,341 - 5 12 6 73 180 7 188 1 - 7 - 2,820
LAVEZARES 6 1 3 1,827 54 53 240 - 141 - - - - 2,325
LOPE DE VEGA 722 2 1 3 11 40 57 - 59 - - - - 895
MAPANAS 854 1 1 15 2 3 39 - 90 - - - - 1,005
MONDRAGON 2,237 4 1 8 9 26 120 133 158 - - - - 2,696
PALAPAG 1,999 - 2 14 2 26 92 51 173 - - - - 2,359
PAMBUJAN 1,290 - 1 8 7 58 95 - 113 - - - - 1,572
ROSARIO 4 - - 720 14 13 87 - 42 - - - - 880
SAN ANTONIO - 3 2 6 509 19 32 1 33 - - - - 605
SAN ISIDRO 5 10 7 1,566 43 53 293 - 112 - - - - 2,089
SAN JOSE 4 1 - 1,125 21 16 179 - 49 - - - - 1,395

MONTHLY REPORT ON PANTAWID PAMILYA COVERAGE 77
SAN ROQUE 1,326 2 2 6 6 29 107 - 96 1 - - - 1,575
SAN VICENTE 1 1 3 462 1 39 87 1 46 - - - - 641
SILVINO LOBOS 699 2 - 3 4 215 140 - 72 - - - - 1,135
VICTORIA - 3 1 908 21 7 64 - 64 1 - - - 1,069
NORTHERN SAMAR Total
13,485 43 39 14,600 8,838 1,459 3,409 298 2,510 3 - 7 - 44,691
SAMAR (WESTERN SAMAR)
ALMAGRO 2 436 1 1 4 232 44 7 50 - - - - 777
BASEY 7 2,708 8 18 31 792 214 2 207 122 - 5 - 4,114
CALBAYOG CITY 18 7,153 9 43 24 3,135 521 4 607 1 - - - 11,515
CALBIGA 3 1,183 1 6 2 326 100 - 77 - - - - 1,698
CITY OF CATBALOGAN (Capital)
8 74 1,030 2,375 105 866 269 1 268 1 - - - 4,997
DARAM 8 2,742 12 12 9 782 151 3 208 - - - - 3,927
GANDARA 3 1,823 5 6 5 750 138 6 108 2 - - - 2,846
HINABANGAN 2 722 3 4 12 172 70 - 72 - - - - 1,057
JIABONG - 728 2 11 1 389 41 - 105 - - - - 1,277
MARABUT 4 803 5 9 15 339 50 36 83 53 - 7 - 1,404
MATUGUINAO 2 481 - 1 1 270 57 1 24 - - - - 837
MOTIONG 1 865 4 4 2 252 106 - 55 1 - - - 1,290
PAGSANGHAN 1 513 - 1 2 88 37 - 47 - - - - 689
PARANAS (WRIGHT)
2 1,503 6 10 8 382 53 2 105 - - - - 2,071
PINABACDAO 1 605 3 12 2 680 103 2 90 - - - - 1,498
SAN JORGE - 857 4 4 1 389 103 3 101 - - - - 1,462
SAN JOSE DE BUAN
3 473 5 1 3 192 40 - 23 - - - - 740
SAN SEBASTIAN 1 518 - 2 4 88 25 - 33 - - - - 671
SANTA MARGARITA
- 1,475 - 5 5 343 100 - 128 - - - - 2,056
SANTA RITA - 1,867 4 28 8 969 121 4 180 5 - 1 - 3,187
SANTO NIÑO 4 853 4 3 2 183 73 - 78 - - - - 1,200
TAGAPUL-AN 3 498 - 2 1 100 31 - 53 - - - - 688
TALALORA - 499 - 5 2 154 12 1 17 1 - - - 691

MONTHLY REPORT ON PANTAWID PAMILYA COVERAGE 78
TARANGNAN 1 1,566 7 9 7 408 104 - 136 1 - - - 2,239
VILLAREAL 2 1,755 3 9 9 497 93 - 110 2 - - - 2,480
ZUMARRAGA 2 1,125 2 7 3 276 26 - 63 - - - - 1,504
SAMAR (WESTERN SAMAR) Total
78 33,825 1,118 2,588 268 13,054 2,682 72 3,028 189 - 13 - 56,915
SOUTHERN LEYTE
ANAHAWAN 1 - - 2 5 271 28 1 23 - - - - 331
BONTOC 2 - 355 11 1,121 89 125 6 145 - - - - 1,854
CITY OF MAASIN (Capital)
5 5 6 1,985 207 105 133 - 188 - - 1 - 2,635
HINUNANGAN 1 1 2 6 1,079 64 79 170 102 2 - - - 1,506
HINUNDAYAN 3 2 2 9 359 23 32 1 32 - - - - 463
LIBAGON 3 - 6 11 690 35 36 - 63 - - 1 - 845
LILOAN - 6 6 5 938 65 35 - 88 - - - - 1,143
LIMASAWA 2 - - 2 308 25 20 - 37 - - - - 394
MACROHON 2 2 1 10 847 87 57 - 74 - - - - 1,080
MALITBOG 2 - - 12 823 57 63 2 70 - - - - 1,029
PADRE BURGOS - - 2 4 6 309 13 - 13 - - - - 347
PINTUYAN 1 2 403 6 30 21 25 - 37 1 - 4 - 530
SAINT BERNARD 4 4 607 8 519 37 50 2 91 - - 6 - 1,328
SAN FRANCISCO 2 2 1 10 503 50 37 1 65 - - 4 - 675
SAN JUAN (CABALIAN)
- - 2 2 518 43 32 1 39 - - - - 637
SAN RICARDO 1 2 4 5 497 16 21 - 54 - - - - 600
SILAGO 1 - - 10 458 33 39 1 34 - - - - 576
SOGOD 3 4 9 30 1,747 110 81 3 117 - - - - 2,104
TOMAS OPPUS - 2 393 8 343 36 75 - 78 - - - - 935
SOUTHERN LEYTE Total
33 32 1,799 2,136 10,998 1,476 981 188 1,350 3 - 16 - 19,012
VIII Total 13,767 34,156 18,259 74,025 51,280 35,714 18,054 6,247 14,822 13,484 2 114 - 279,924
IX CITY OF ISABELA CITY OF ISABELA (Capital)
10 14 916 3,161 125 2,275 649 545 106 1 - 852 - 8,654
CITY OF ISABELA Total
10 14 916 3,161 125 2,275 649 545 106 1 - 852 - 8,654
ZAMBOANGA DEL NORTE
BACUNGAN (Leon T. Postigo)
1,297 43 4 975 43 103 153 97 24 1 - 302 - 3,042
BALIGUIAN 815 30 2 903 9 43 55 34 27 - - 1 - 1,919

MONTHLY REPORT ON PANTAWID PAMILYA COVERAGE 79
DAPITAN CITY 37 2,985 5 46 16 2,188 220 271 74 - - 123 - 5,965
DIPOLOG CITY (Capital)
118 3,302 4 102 34 2,342 324 351 79 - - 221 - 6,877
GODOD 1,042 33 1 611 14 73 112 14 9 1 - 412 - 2,322
GUTALAC 2,100 58 7 1,274 43 62 188 205 40 - - 307 - 4,284
JOSE DALMAN (PONOT)
1,603 27 4 844 22 39 110 10 33 1 - 391 - 3,084
KALAWIT 1,286 34 3 846 27 46 119 10 28 - - 591 - 2,990
KATIPUNAN 2,636 36 2 1,116 18 81 194 16 57 - - 722 - 4,878
LA LIBERTAD 12 456 4 10 3 169 40 17 7 - - 20 - 738
LABASON 43 3,077 6 75 14 612 259 92 50 - - 526 - 4,754
LILOY 21 2,483 4 46 8 469 244 119 41 - - 516 - 3,951
MANUKAN 2,123 23 1 1,124 24 87 351 12 27 - - 707 - 4,479
MUTIA 13 677 1 16 2 142 37 47 13 - - 115 - 1,063
PIÑAN (NEW PIÑAN)
14 1,212 3 21 4 338 73 45 18 - - 426 - 2,154
POLANCO 35 2,303 3 45 8 655 213 61 51 1 - 109 - 3,484
PRES. MANUEL A. ROXAS
2,230 16 - 1,242 40 60 177 21 30 - - 237 - 4,053
RIZAL 13 766 4 7 2 189 66 46 12 - - 107 - 1,212
SALUG 43 2,182 1 60 8 562 151 20 37 - - 288 - 3,352
SERGIO OSMEÑA SR.
1,719 49 3 921 22 78 138 214 26 - - 280 - 3,450
SIAYAN 1,873 54 8 1,196 31 397 55 8 27 - - 795 - 4,444
SIBUCO 1,540 19 1 2,945 74 100 149 13 122 - - 27 - 4,990
SIBUTAD 18 962 3 18 4 277 77 72 27 - - 134 - 1,592
SINDANGAN 4,991 65 11 2,675 61 479 387 69 103 1 1 908 - 9,751
SIOCON 36 2,543 6 87 7 774 187 93 56 - - 92 - 3,881
SIRAWAI 21 1,918 1 53 3 679 105 8 22 1 - 764 - 3,575
TAMPILISAN 17 1,543 4 36 9 519 213 61 26 - - 314 - 2,742
ZAMBOANGA DEL NORTE Total
25,696 26,896 96 17,294 550 11,563 4,397 2,026 1,066 6 1 9,435 - 99,026
ZAMBOANGA DEL SUR
AURORA 8 32 14 2,767 53 23 760 10 36 - - 116 - 3,819
BAYOG 6 44 1,980 59 282 81 184 360 28 - - 141 - 3,165
DIMATALING 5 40 10 2,345 51 192 241 38 29 1 - 76 - 3,028

MONTHLY REPORT ON PANTAWID PAMILYA COVERAGE 80
DINAS 9 1,961 5 43 25 834 195 64 35 - - 394 - 3,565
DUMALINAO 4 46 1,951 68 400 64 235 4 28 - - 86 - 2,886
DUMINGAG 20 3,133 7 60 19 612 197 107 86 2 - 8 - 4,251
GUIPOS 3 31 8 1,006 34 26 502 4 24 - - 28 - 1,666
JOSEFINA 3 3 4 647 4 129 61 31 5 1 - 82 - 970
KUMALARANG 3 1,662 15 46 22 549 100 127 13 - - 614 - 3,151
LABANGAN 5 28 8 2,256 65 895 214 67 34 1 - 358 - 3,931
LAKEWOOD 2 1,440 14 14 17 196 93 173 13 1 - 418 - 2,381
LAPUYAN 1 1,989 6 55 18 552 279 119 29 1 - 474 - 3,523
MAHAYAG 6 44 20 2,879 33 271 168 212 63 1 - 30 - 3,727
MARGOSATUBIG 1 55 11 1,803 26 558 190 129 25 - - 606 - 3,404
MIDSALIP 8 2,416 8 43 12 492 221 89 55 1 - 198 - 3,543
MOLAVE 10 29 21 2,627 41 36 457 41 53 - - 162 - 3,477
PAGADIAN CITY (Capital)
26 206 71 245 8,701 567 927 374 68 5 - 598 - 11,788
PITOGO 1 30 4 1,712 51 228 202 7 47 - - 140 - 2,422
RAMON MAGSAYSAY (LIARGO)
10 35 7 1,579 33 388 182 41 33 - - 196 - 2,504
SAN MIGUEL 2 1,212 10 29 18 365 112 115 27 - - 162 - 2,052
SAN PABLO 3 1,730 9 28 25 382 176 65 31 - - 5 - 2,454
SOMINOT (DON MARIANO MARCOS)
5 1,065 5 29 5 171 90 7 33 - - - - 1,410
TABINA 6 1,580 4 48 17 507 132 119 24 - - 72 - 2,509
TAMBULIG 3 29 2,236 52 423 45 184 10 56 - - 18 - 3,056
TIGBAO 1 1,348 7 31 17 254 135 68 20 - - 469 - 2,350
TUKURAN 9 34 13 2,274 51 453 287 174 8 2 - 170 - 3,475
VINCENZO A. SAGUN
2 1,335 6 29 7 291 188 113 10 - - 106 - 2,087
ZAMBOANGA CITY
114 346 961 17,171 1,036 16,687 3,379 4,887 643 1,776 8 2,134 126 49,268
ZAMBOANGA DEL SUR Total
276 21,903 7,415 39,945 11,486 25,848 10,091 7,555 1,556 1,792 8 7,861 126 135,862
ZAMBOANGA SIBUGAY
ALICIA 5 40 19 3,197 44 387 453 46 44 - - 260 - 4,495
BUUG 3 42 23 49 2,467 94 243 125 40 4 - 145 - 3,235

MONTHLY REPORT ON PANTAWID PAMILYA COVERAGE 81
DIPLAHAN 4 19 25 1,864 66 77 130 186 47 - - 106 - 2,524
IMELDA 2 16 20 62 1,458 41 161 11 25 1 - 241 - 2,038
IPIL (Capital) 23 92 24 175 4,860 199 416 106 64 2 - 352 - 6,313
KABASALAN 19 36 15 1,976 65 40 883 102 50 - - 605 - 3,791
MABUHAY 1 1,406 11 22 14 467 114 64 22 - - 194 - 2,315
MALANGAS 7 26 1,744 45 412 88 174 155 36 - - 251 - 2,938
NAGA 3 23 4 2,387 38 371 163 312 23 - - 455 - 3,779
OLUTANGA - 44 1,411 33 362 91 184 22 19 - - 236 - 2,402
PAYAO 5 27 1,791 118 391 179 165 101 46 - - 218 - 3,041
ROSELLER LIM 9 2,413 15 71 61 907 292 148 49 - - 88 - 4,053
SIAY 3 29 24 2,333 60 59 533 79 38 - - 523 - 3,681
TALUSAN - 921 23 24 13 272 59 41 9 - - 212 - 1,574
TITAY 13 51 10 3,096 82 464 260 122 72 - - 546 - 4,716
TUNGAWAN 13 2,598 16 107 20 826 254 112 58 - 1 275 - 4,280
ZAMBOANGA SIBUGAY Total
110 7,783 5,175 15,559 10,413 4,562 4,484 1,732 642 7 1 4,707 - 55,175
IX Total 26,092 56,596 13,602 75,959 22,574 44,248 19,621 11,858 3,370 1,806 10 22,855 126 298,717
X BUKIDNON BAUNGON 7 14 5 1,718 54 153 72 1 195 - - 141 - 2,360
CABANGLASAN 1 2 1,731 54 187 23 40 1 96 13 - 769 - 2,917
CITY OF MALAYBALAY (Capital)
19 23 57 3,800 2,395 88 158 6 707 4 - 1,004 - 8,261
CITY OF VALENCIA
26 17 49 6,264 846 289 122 10 797 1 - 519 - 8,940
DAMULOG 3 3 1,450 56 287 45 18 3 198 - - 214 - 2,277
DANGCAGAN 1 - 5 1,026 27 229 27 3 66 1 - 254 - 1,639
DON CARLOS 4 4 8 2,664 28 49 371 12 264 - - 26 - 3,430
IMPASUG-ONG 3 4 9 2,140 61 224 39 2 154 6 - 1,874 - 4,516
KADINGILAN 6 6 7 1,983 92 196 79 1 272 - - 189 - 2,831
KALILANGAN 1 15 6 1,447 52 22 387 2 193 - - 165 - 2,290
KIBAWE 3 6 12 2,064 58 120 36 1 192 - - 259 - 2,751
KITAOTAO 6 3 2,925 109 764 132 105 - 145 3 - 1,263 - 5,455
LANTAPAN 2 11 4 2,946 95 363 58 3 222 2 - 955 - 4,661
LIBONA 4 6 6 1,567 24 29 130 2 187 1 - 22 - 1,978

MONTHLY REPORT ON PANTAWID PAMILYA COVERAGE 82
MALITBOG - 3 1,319 43 318 36 61 7 126 2 - 516 - 2,431
MANOLO FORTICH
10 13 18 71 2,974 123 89 2 274 1 - 620 - 4,195
MARAMAG 12 21 25 83 2,878 175 98 18 391 1 - 196 - 3,898
PANGANTUCAN 7 21 7 2,679 68 265 30 1 330 3 - 335 - 3,746
QUEZON 4 10 21 4,443 135 169 646 3 517 3 - 470 - 6,421
SAN FERNANDO 3 13 3,289 83 606 108 75 9 480 3 - 596 - 5,265
SUMILAO 2 1 1 1,008 41 194 21 1 99 5 - 507 - 1,880
TALAKAG 7 4,107 12 53 19 541 73 4 935 3 - 723 - 6,477
BUKIDNON Total
131 4,303 10,966 36,301 12,009 3,573 2,735 92 6,840 52 - 11,617 - 88,619
CAMIGUIN CATARMAN 1 - 4 15 771 22 121 2 114 - - - - 1,050
GUINSILIBAN - 1 - 9 422 12 49 2 51 - - - - 546
MAHINOG 1 - 2 670 17 14 137 - 69 - - - - 910
MAMBAJAO (Capital)
2 4 4 19 1,515 46 405 3 143 - - - - 2,141
SAGAY 1 1 468 241 5 325 48 2 67 - - - - 1,158
CAMIGUIN Total 5 6 478 954 2,730 419 760 9 444 - - - - 5,805
LANAO DEL NORTE
BACOLOD 4 4 323 971 24 221 53 8 84 1 - - - 1,693
BALOI 2 3,347 1 10 2 651 62 13 367 - - - - 4,455
BAROY 18 10 331 1,054 7 150 133 1 98 1 - - - 1,803
ILIGAN CITY 50 37 877 6,673 2,396 365 2,595 401 523 1 92 1,272 - 15,282
KAPATAGAN 3,649 28 9 40 16 78 163 9 253 - - - - 4,245
KAUSWAGAN 9 3 321 1,094 28 75 20 59 74 1 - - - 1,684
KOLAMBUGAN 9 5 288 1,378 28 136 59 3 96 - - - - 2,002
LALA 3,785 23 15 50 637 107 274 21 454 1 - - - 5,367
LINAMON 2 1 348 698 11 150 16 94 79 - - - - 1,399
MAGSAYSAY 839 3 1 12 1 38 43 2 60 - - - - 999
MAIGO 6 4 334 636 15 273 40 2 51 - - - - 1,361
MATUNGAO - 1,115 - 11 - 371 71 1 101 - - - - 1,670
MUNAI 1,627 3 2 2 - 98 53 - 303 - - - - 2,088
NUNUNGAN 1,191 - - - 1 78 49 - 93 - - - - 1,412
PANTAO RAGAT - 1,558 1 - - 486 75 5 276 - - - - 2,401
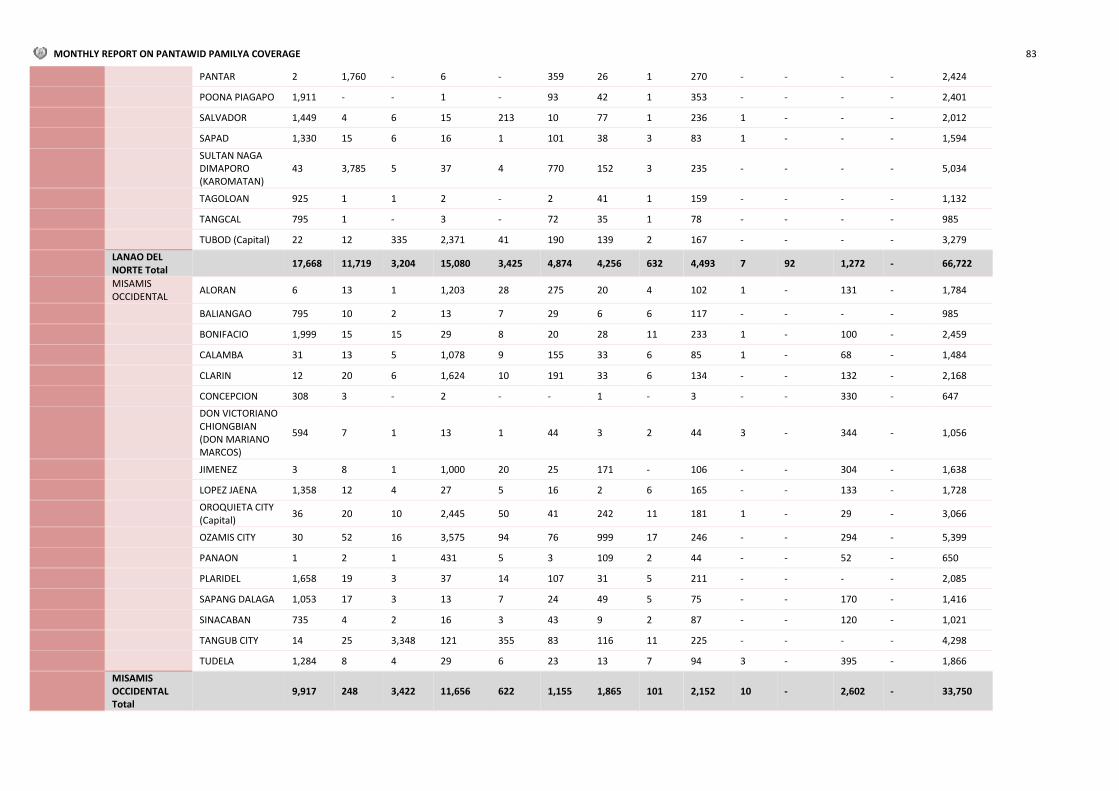
MONTHLY REPORT ON PANTAWID PAMILYA COVERAGE 83
PANTAR 2 1,760 - 6 - 359 26 1 270 - - - - 2,424
POONA PIAGAPO 1,911 - - 1 - 93 42 1 353 - - - - 2,401
SALVADOR 1,449 4 6 15 213 10 77 1 236 1 - - - 2,012
SAPAD 1,330 15 6 16 1 101 38 3 83 1 - - - 1,594
SULTAN NAGA DIMAPORO (KAROMATAN)
43 3,785 5 37 4 770 152 3 235 - - - - 5,034
TAGOLOAN 925 1 1 2 - 2 41 1 159 - - - - 1,132
TANGCAL 795 1 - 3 - 72 35 1 78 - - - - 985
TUBOD (Capital) 22 12 335 2,371 41 190 139 2 167 - - - - 3,279
LANAO DEL NORTE Total
17,668 11,719 3,204 15,080 3,425 4,874 4,256 632 4,493 7 92 1,272 - 66,722
MISAMIS OCCIDENTAL
ALORAN 6 13 1 1,203 28 275 20 4 102 1 - 131 - 1,784
BALIANGAO 795 10 2 13 7 29 6 6 117 - - - - 985
BONIFACIO 1,999 15 15 29 8 20 28 11 233 1 - 100 - 2,459
CALAMBA 31 13 5 1,078 9 155 33 6 85 1 - 68 - 1,484
CLARIN 12 20 6 1,624 10 191 33 6 134 - - 132 - 2,168
CONCEPCION 308 3 - 2 - - 1 - 3 - - 330 - 647
DON VICTORIANO CHIONGBIAN (DON MARIANO MARCOS)
594 7 1 13 1 44 3 2 44 3 - 344 - 1,056
JIMENEZ 3 8 1 1,000 20 25 171 - 106 - - 304 - 1,638
LOPEZ JAENA 1,358 12 4 27 5 16 2 6 165 - - 133 - 1,728
OROQUIETA CITY (Capital)
36 20 10 2,445 50 41 242 11 181 1 - 29 - 3,066
OZAMIS CITY 30 52 16 3,575 94 76 999 17 246 - - 294 - 5,399
PANAON 1 2 1 431 5 3 109 2 44 - - 52 - 650
PLARIDEL 1,658 19 3 37 14 107 31 5 211 - - - - 2,085
SAPANG DALAGA 1,053 17 3 13 7 24 49 5 75 - - 170 - 1,416
SINACABAN 735 4 2 16 3 43 9 2 87 - - 120 - 1,021
TANGUB CITY 14 25 3,348 121 355 83 116 11 225 - - - - 4,298
TUDELA 1,284 8 4 29 6 23 13 7 94 3 - 395 - 1,866
MISAMIS OCCIDENTAL Total
9,917 248 3,422 11,656 622 1,155 1,865 101 2,152 10 - 2,602 - 33,750

MONTHLY REPORT ON PANTAWID PAMILYA COVERAGE 84
MISAMIS ORIENTAL
ALUBIJID 3 2 302 1,446 23 77 137 2 131 - - - - 2,123
BALINGASAG 6 1 14 3,547 142 335 207 1 244 - - 303 - 4,800
BALINGOAN - 3 2 538 8 117 25 - 31 - - - - 724
BINUANGAN - - 1 373 5 8 85 1 54 - - - - 527
CAGAYAN DE ORO CITY (Capital)
1,667 103 559 5,566 3,786 704 3,385 324 612 12 79 31 - 16,828
CITY OF EL SALVADOR
7 6 6 2,024 130 102 385 4 159 1 - - - 2,824
CLAVERIA 5 6 347 2,834 81 183 277 4 195 11 - 625 - 4,568
GINGOOG CITY 20 33 13 7,270 176 335 192 17 437 1 - 476 - 8,970
GITAGUM 1 1 1 746 15 9 223 1 90 - - - - 1,087
INITAO 3 5 7 1,745 18 73 183 1 93 - - - - 2,128
JASAAN 10 10 8 52 1,931 88 149 3 141 - - - - 2,392
KINOGUITAN 2 1 3 790 16 10 148 4 50 - - - - 1,024
LAGONGLONG 2 - 2 1,247 23 124 64 - 83 - - - - 1,545
LAGUINDINGAN - - 3 825 22 4 155 3 54 - - - - 1,066
LIBERTAD 2 3 1 600 8 142 61 - 41 - - - - 858
LUGAIT 1 2 2 774 23 10 158 4 57 - - - - 1,031
MAGSAYSAY (LINUGOS)
7 1,949 3 38 14 204 97 8 165 - - - - 2,485
MANTICAO 5 2 324 945 24 204 94 2 115 - - 54 - 1,769
MEDINA 3 6 5 1,505 66 50 220 1 133 2 - - - 1,991
NAAWAN 2 1 5 949 30 16 266 1 86 1 - - - 1,357
OPOL 24 7 9 75 1,641 106 117 3 120 2 - 46 - 2,150
SALAY 7 2 6 1,453 45 28 305 1 140 - - - - 1,987
SUGBONGCOGON 1 1 2 485 11 6 112 - 32 - - - - 650
TAGOLOAN 5 13 16 66 2,229 107 148 3 77 - - - - 2,664
TALISAYAN 3 3 4 1,399 32 144 80 3 97 - - - - 1,765
VILLANUEVA - 8 8 42 1,830 45 74 5 58 - - - - 2,070
MISAMIS ORIENTAL Total
1,786 2,168 1,653 37,334 12,329 3,231 7,347 396 3,495 30 79 1,535 - 71,383
X Total 29,507 18,444 19,723 101,325 31,115 13,252 16,963 1,230 17,424 99 171 17,026 - 266,279
XI DAVAO DEL NORTE
ASUNCION (SAUG)
9 25 337 2,990 49 190 1,235 26 267 1 - 1,036 - 6,165

MONTHLY REPORT ON PANTAWID PAMILYA COVERAGE 85
BRAULIO E. DUJALI
6 7 350 20 646 31 427 5 62 - - 110 - 1,664
CARMEN 15 14 357 66 2,441 79 1,118 13 161 - - 765 - 5,029
CITY OF PANABO 19 36 339 109 3,651 515 376 18 206 - - 1,888 - 7,157
CITY OF TAGUM (Capital)
44 66 30 3,552 1,564 273 670 24 194 3 - 1,415 - 7,835
ISLAND GARDEN CITY OF SAMAL
23 17 407 4,317 82 257 581 95 324 - - 868 - 6,971
KAPALONG 3 25 390 3,102 82 177 1,466 14 195 - - 782 - 6,236
NEW CORELLA 8 15 366 2,950 65 267 829 13 232 1 - 316 - 5,062
SAN ISIDRO 2 7 5 1,785 50 32 644 4 114 - - 244 - 2,887
SANTO TOMAS 18 16 356 79 68 2,950 580 30 194 - - 848 - 5,139
TALAINGOD 2 1,575 6 21 10 813 253 3 95 - - 488 - 3,266
DAVAO DEL NORTE Total
149 1,803 2,943 18,991 8,708 5,584 8,179 245 2,044 5 - 8,760 - 57,411
DAVAO DEL SUR BANSALAN 2 21 10 19 2,012 58 99 15 150 - 1 2 - 2,389
CITY OF DIGOS (Capital)
12 36 7 83 3,394 191 148 18 126 - - 295 - 4,310
DAVAO CITY 2,759 253 718 10,629 4,039 911 1,220 1,798 656 3 - 9,712 1 32,699
HAGONOY 1 10 6 17 34 2,034 95 9 84 - - - - 2,290
KIBLAWAN 4 6 2,649 18 178 20 221 13 147 - - - - 3,256
MAGSAYSAY 3 5 345 29 2,091 33 203 4 162 - - 364 - 3,239
MALALAG 3 12 4 23 2,132 46 214 13 116 - - - - 2,563
MATANAO 3 8 7 24 2,504 53 162 15 145 - - 210 - 3,131
PADADA 1 5 3 6 6 769 64 6 45 - - - - 905
SANTA CRUZ 12 20 11 56 3,766 146 290 53 153 1 - 1,096 - 5,604
SULOP 1 9 4 1,903 26 29 272 10 119 - - - - 2,373
DAVAO DEL SUR Total
2,801 385 3,764 12,807 20,182 4,290 2,988 1,954 1,903 4 1 11,679 1 62,759
DAVAO OCCIDENTAL
DON MARCELINO 2 3,379 2 11 9 1,191 300 7 97 - - - - 4,998
JOSE ABAD SANTOS (TRINIDAD)
2 5,220 - 9 9 2,402 1,074 23 185 - - - - 8,924
MALITA 6 7,245 8 30 45 2,345 1,145 21 321 1 - 200 - 11,367
SANTA MARIA 2 3,695 4 29 14 1,030 643 6 226 - - - - 5,649
SARANGANI - 1,732 1 2 2 507 249 3 108 - - - - 2,604

MONTHLY REPORT ON PANTAWID PAMILYA COVERAGE 86
DAVAO OCCIDENTAL Total
12 21,271 15 81 79 7,475 3,411 60 937 1 - 200 - 33,542
DAVAO ORIENTAL
CARAGA 2,002 4 2 18 3 42 1,523 5 179 - - 209 - 3,987
BAGANGA 14 1 7 3,319 47 140 1,668 21 190 - - - - 5,407
BANAYBANAY 5 14 2 57 1,652 67 101 23 114 - - - - 2,035
BOSTON 5 3 2 822 11 13 446 4 74 - - - - 1,380
CATEEL 16 8 - 1,691 42 62 1,686 20 200 - - - - 3,725
CITY OF MATI (Capital)
36 39 9 95 5,787 243 1,020 20 389 - - - - 7,638
GOVERNOR GENEROSO
14 12 399 2,564 92 196 134 28 191 - - - - 3,630
LUPON 11 6 7 3,117 71 72 294 6 231 - - - - 3,815
MANAY 2,028 2 3 13 11 3 1,137 6 273 - - - - 3,476
SAN ISIDRO 6 12 361 1,296 42 200 109 18 155 - - - - 2,199
TARRAGONA 8 2,221 - 19 14 343 349 4 135 - - - - 3,093
DAVAO ORIENTAL Total
4,145 2,322 792 13,011 7,772 1,381 8,467 155 2,131 - - 209 - 40,385
DAVAO DE ORO COMPOSTELA 16 17 745 3,180 54 390 2,632 11 253 - - 221 - 7,519
LAAK (SAN VICENTE)
28 4,169 18 84 42 1,513 1,731 90 287 - - 1,154 - 9,116
MABINI (DOÑA ALICIA)
7 8 5 1,821 71 36 1,075 8 6 1 - 824 - 3,862
MACO 8 25 13 84 3,294 469 1,962 13 276 - - 1,363 - 7,507
MARAGUSAN (SAN MARIANO)
14 9 10 2,600 81 104 657 9 186 - - 495 - 4,165
MAWAB 9 9 6 40 1,649 135 679 8 116 - - 317 - 2,968
MONKAYO 19 17 5 62 3,322 238 3,195 91 274 - - 898 - 8,121
MONTEVISTA 7 16 7 2,213 53 38 1,409 8 135 - - 374 - 4,260
NABUNTURAN (Capital)
13 22 3 95 2,909 155 1,597 16 213 - - 361 - 5,384
NEW BATAAN 6 8 13 2,345 53 139 1,210 11 220 1 - 583 - 4,589
PANTUKAN 10 18 11 3,495 97 208 956 17 188 - - 590 - 5,590
DAVAO DE ORO Total
137 4,318 836 16,019 11,625 3,425 17,103 282 2,154 2 - 7,180 - 63,081
XI Total 7,244 30,099 8,350 60,909 48,366 22,155 40,148 2,696 9,169 12 1 28,028 1 257,178
XII COTABATO (NORTH COTABATO)
ALAMADA 4 6 311 2,834 38 258 290 10 171 3 - - - 3,925
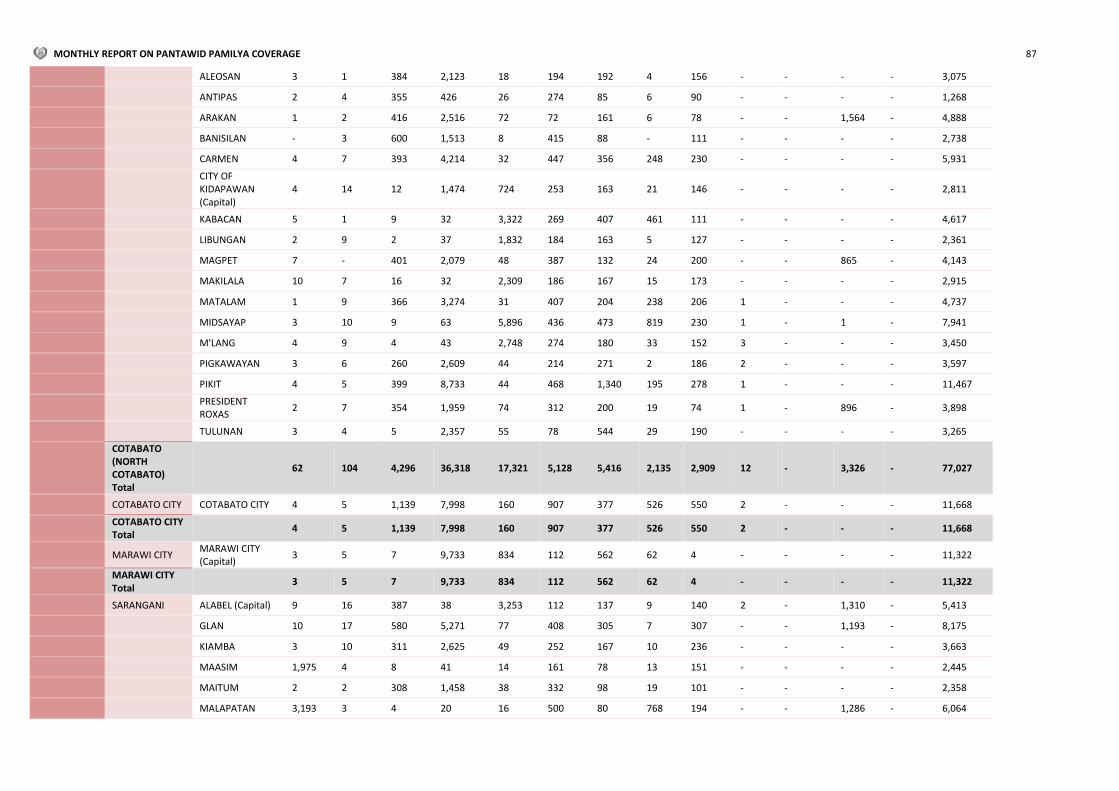
MONTHLY REPORT ON PANTAWID PAMILYA COVERAGE 87
ALEOSAN 3 1 384 2,123 18 194 192 4 156 - - - - 3,075
ANTIPAS 2 4 355 426 26 274 85 6 90 - - - - 1,268
ARAKAN 1 2 416 2,516 72 72 161 6 78 - - 1,564 - 4,888
BANISILAN - 3 600 1,513 8 415 88 - 111 - - - - 2,738
CARMEN 4 7 393 4,214 32 447 356 248 230 - - - - 5,931
CITY OF KIDAPAWAN (Capital)
4 14 12 1,474 724 253 163 21 146 - - - - 2,811
KABACAN 5 1 9 32 3,322 269 407 461 111 - - - - 4,617
LIBUNGAN 2 9 2 37 1,832 184 163 5 127 - - - - 2,361
MAGPET 7 - 401 2,079 48 387 132 24 200 - - 865 - 4,143
MAKILALA 10 7 16 32 2,309 186 167 15 173 - - - - 2,915
MATALAM 1 9 366 3,274 31 407 204 238 206 1 - - - 4,737
MIDSAYAP 3 10 9 63 5,896 436 473 819 230 1 - 1 - 7,941
M'LANG 4 9 4 43 2,748 274 180 33 152 3 - - - 3,450
PIGKAWAYAN 3 6 260 2,609 44 214 271 2 186 2 - - - 3,597
PIKIT 4 5 399 8,733 44 468 1,340 195 278 1 - - - 11,467
PRESIDENT ROXAS
2 7 354 1,959 74 312 200 19 74 1 - 896 - 3,898
TULUNAN 3 4 5 2,357 55 78 544 29 190 - - - - 3,265
COTABATO (NORTH COTABATO) Total
62 104 4,296 36,318 17,321 5,128 5,416 2,135 2,909 12 - 3,326 - 77,027
COTABATO CITY COTABATO CITY 4 5 1,139 7,998 160 907 377 526 550 2 - - - 11,668
COTABATO CITY Total
4 5 1,139 7,998 160 907 377 526 550 2 - - - 11,668
MARAWI CITY MARAWI CITY (Capital)
3 5 7 9,733 834 112 562 62 4 - - - - 11,322
MARAWI CITY Total
3 5 7 9,733 834 112 562 62 4 - - - - 11,322
SARANGANI ALABEL (Capital) 9 16 387 38 3,253 112 137 9 140 2 - 1,310 - 5,413
GLAN 10 17 580 5,271 77 408 305 7 307 - - 1,193 - 8,175
KIAMBA 3 10 311 2,625 49 252 167 10 236 - - - - 3,663
MAASIM 1,975 4 8 41 14 161 78 13 151 - - - - 2,445
MAITUM 2 2 308 1,458 38 332 98 19 101 - - - - 2,358
MALAPATAN 3,193 3 4 20 16 500 80 768 194 - - 1,286 - 6,064

MONTHLY REPORT ON PANTAWID PAMILYA COVERAGE 88
MALUNGON 1 9 503 4,491 176 845 232 12 245 - - 2,628 - 9,142
SARANGANI Total
5,193 61 2,101 13,944 3,623 2,610 1,097 838 1,374 2 - 6,417 - 37,260
SOUTH COTABATO
BANGA 4 12 5 3,282 119 132 697 42 223 - - - - 4,516
CITY OF KORONADAL (Capital)
11 10 14 78 3,256 243 290 306 171 1 - - - 4,380
GENERAL SANTOS CITY (DADIANGAS)
33 74 1,058 6,018 173 3,339 338 2,259 492 3 - - - 13,787
LAKE SEBU - 3,727 6 39 24 1,279 264 10 233 - - 1,768 - 7,350
NORALA 1 2 3 26 1,888 158 120 1 102 - - - - 2,301
POLOMOLOK 13 14 7 69 2,769 198 173 9 104 - - 575 - 3,931
SANTO NIÑO 1 1 1 13 6 1,468 88 156 93 - - - - 1,827
SURALLAH 4 16 9 40 3,521 150 165 4 171 - - - - 4,080
TAMPAKAN 2 3 4 12 1,295 153 65 6 85 - - 698 - 2,323
TANTANGAN 1 4 3 33 1,744 77 107 234 103 - - - - 2,306
T'BOLI 2 4,420 8 28 20 2,251 265 739 297 - - 2,128 - 10,158
TUPI 10 16 7 41 3,196 160 200 291 157 1 - 1,002 - 5,081
SOUTH COTABATO Total
82 8,299 1,125 9,679 18,011 9,608 2,772 4,057 2,231 5 - 6,171 - 62,040
SULTAN KUDARAT
BAGUMBAYAN 3 15 3 2,776 47 278 116 19 166 - - 707 - 4,130
CITY OF TACURONG
4 6 6 37 1,470 66 65 428 113 1 - - - 2,196
COLUMBIO 1 6 1 1,839 68 61 87 489 51 - - - - 2,603
ESPERANZA 2 5 3 2,260 27 186 78 236 131 1 - - - 2,929
ISULAN (Capital) 3 9 1 30 2,641 105 59 44 178 2 - - - 3,072
KALAMANSIG 5 12 3 2,189 360 78 83 98 86 - - 765 - 3,679
LAMBAYONG (MARIANO MARCOS)
4 3 - 2,874 137 623 412 124 197 1 - - - 4,375
LEBAK 2 3 3 4,897 184 313 252 202 203 - - 840 - 6,899
LUTAYAN 2 3 - 3,888 184 141 201 8 226 1 - - - 4,654
PALIMBANG 2 2 5,444 36 221 345 749 98 101 - - 974 - 7,972
PRESIDENT QUIRINO
1 - - 1,505 12 122 81 62 139 1 - - - 1,923

MONTHLY REPORT ON PANTAWID PAMILYA COVERAGE 89
SEN. NINOY AQUINO
- 2,294 6 16 8 612 165 103 77 - - 807 - 4,088
SULTAN KUDARAT Total
29 2,358 5,470 22,347 5,359 2,930 2,348 1,911 1,668 7 - 4,093 - 48,520
XII Total 5,373 10,832 14,138 100,019 45,308 21,295 12,572 9,529 8,736 28 - 20,007 - 247,837
CARAGA AGUSAN DEL NORTE
BUENAVISTA 19 26 6 2,919 54 557 241 12 237 - - 283 - 4,354
BUTUAN CITY (Capital)
129 136 1,086 5,575 165 4,309 820 1,888 327 1 246 147 - 14,829
CARMEN 8 5 2 1,177 34 306 98 8 111 - - - - 1,749
CITY OF CABADBARAN
23 22 17 2,605 26 80 513 11 119 - - 460 - 3,876
JABONGA 13 1,341 10 30 16 327 109 8 89 - - 211 - 2,154
KITCHARAO 9 18 7 974 15 105 72 6 51 - - 258 - 1,515
LAS NIEVES 24 1,712 3 55 14 711 137 3 131 - - 314 - 3,104
MAGALLANES 3 3 2 27 801 40 85 22 40 - - - - 1,023
NASIPIT 2 7 5 45 1,592 74 121 7 111 - - 284 - 2,248
REMEDIOS T. ROMUALDEZ
9 2 8 807 18 124 59 10 63 - - 25 - 1,125
SANTIAGO 12 12 966 51 157 31 89 6 70 - - 279 - 1,673
TUBAY 11 10 1,052 98 146 47 105 10 57 - - 366 - 1,902
AGUSAN DEL NORTE Total
262 3,294 3,164 14,363 3,038 6,711 2,449 1,991 1,406 1 246 2,627 - 39,552
AGUSAN DEL SUR
BUNAWAN 37 1,982 3 64 33 630 768 24 160 - - 530 - 4,231
CITY OF BAYUGAN
80 61 14 4,371 78 1,001 360 104 245 - - 7 - 6,321
ESPERANZA 3,331 21 7 54 19 45 175 16 208 1 - 1,811 - 5,688
LA PAZ 1,030 20 66 41 13 75 119 25 35 1 - 1,982 - 3,407
LORETO 1,768 20 101 61 10 34 207 14 197 - - 1,808 - 4,220
PROSPERIDAD (Capital)
52 4,536 17 110 34 1,161 249 236 327 1 - - - 6,723
ROSARIO 29 2,180 8 69 21 406 104 25 115 - - 509 - 3,466
SAN FRANCISCO 40 64 10 2,688 28 800 183 23 175 - - - - 4,011
SAN LUIS 1,986 31 5 24 4 15 194 16 82 - - 1,381 - 3,738
SANTA JOSEFA 1,245 16 3 24 11 30 914 57 118 - - 64 - 2,482
SIBAGAT 1,684 11 6 40 8 116 89 481 192 - - 765 - 3,392
TALACOGON 33 2,298 3 35 14 601 144 13 158 - - 684 - 3,983
TRENTO 21 26 3 2,139 42 697 809 94 167 - - 730 - 4,728

MONTHLY REPORT ON PANTAWID PAMILYA COVERAGE 90
VERUELA 1,744 16 - 29 20 54 1,306 385 113 - - 303 - 3,970
AGUSAN DEL SUR Total
13,080 11,282 246 9,749 335 5,665 5,621 1,513 2,292 3 - 10,574 - 60,360
DINAGAT ISLANDS
BASILISA (RIZAL) 1,356 8 16 44 17 346 125 2 102 - - - - 2,016
CAGDIANAO 1,064 4 9 25 6 271 60 3 92 - - - - 1,534
DINAGAT 11 694 7 12 8 153 54 5 53 - - - - 997
LIBJO (ALBOR) 1,102 4 5 13 12 383 98 3 81 - - - - 1,701
LORETO 12 - 3 588 17 113 52 2 36 - - - - 823
SAN JOSE (Capital)
32 15 957 85 183 54 141 7 78 - - - - 1,552
TUBAJON 432 3 2 13 2 148 42 3 47 - - - - 692
DINAGAT ISLANDS Total
4,009 728 999 780 245 1,468 572 25 489 - - - - 9,315
SURIGAO DEL NORTE
ALEGRIA 6 1 799 64 127 44 90 5 67 - - 40 - 1,243
BACUAG 13 3 8 655 4 225 84 5 70 - - 1 - 1,068
BURGOS 6 1 292 2 36 1 40 2 30 - - - - 410
CLAVER 61 1,371 27 73 32 264 155 10 84 - - 2 - 2,079
DAPA 1,304 5 8 20 5 13 530 12 93 - - - - 1,990
DEL CARMEN 1,063 2 3 15 3 6 335 6 134 - - - - 1,567
GENERAL LUNA 1,032 6 6 17 10 16 415 3 112 - - - - 1,617
GIGAQUIT 984 7 1 17 8 14 84 10 83 1 - 149 - 1,358
MAINIT 18 7 317 1,177 17 229 155 5 120 - - 24 - 2,069
MALIMONO 935 9 5 29 10 20 75 5 53 - - 14 - 1,155
PILAR 627 - 1 7 1 3 157 10 70 - - - - 876
PLACER 16 6 8 1,268 13 27 318 22 94 - - 1 - 1,773
SAN BENITO 309 1 2 9 1 2 127 4 29 - - - - 484
SAN FRANCISCO (ANAO-AON)
8 6 1 778 4 139 91 6 46 - - 22 - 1,101
SAN ISIDRO 472 - 5 8 3 4 136 - 49 - - - - 677
SANTA MONICA (SAPAO)
11 1 568 15 34 11 70 3 50 - - - - 763
SISON 12 8 4 728 8 109 65 16 43 - - 19 - 1,012
SOCORRO 1,235 8 5 27 1 13 594 8 125 - - - - 2,016
SURIGAO CITY (Capital)
128 55 47 6,136 118 178 835 54 350 - - 22 - 7,923

MONTHLY REPORT ON PANTAWID PAMILYA COVERAGE 91
TAGANA-AN 11 880 6 23 3 246 105 7 63 - - - - 1,344
TUBOD 4 2 3 632 10 14 219 1 43 - - 18 - 946
SURIGAO DEL NORTE Total
8,255 2,379 2,116 11,700 448 1,578 4,680 194 1,808 1 - 312 - 33,471
SURIGAO DEL SUR
BAROBO 54 48 22 2,571 82 266 196 30 158 - - 2 - 3,429
BAYABAS 3 2 324 205 5 81 49 5 32 - - 47 - 753
CAGWAIT 16 4 298 641 16 121 71 2 57 - - - - 1,226
CANTILAN 15 14 347 951 19 377 157 17 95 - - 90 - 2,082
CARMEN 11 10 340 171 2 148 34 13 33 - - - - 762
CARRASCAL 20 17 338 539 15 284 147 2 70 - - - - 1,432
CITY OF BISLIG 50 47 14 74 3,703 241 1,063 444 407 - - - - 6,043
CITY OF TANDAG (Capital)
63 16 621 37 1,920 122 230 10 123 - - - - 3,142
CORTES 11 10 851 24 304 44 116 1 106 - - - - 1,467
HINATUAN 37 2,588 9 38 30 518 618 211 328 - - - - 4,377
LANUZA 10 712 8 5 15 227 58 14 63 - - 1 - 1,113
LIANGA 21 30 385 1,335 9 311 140 14 95 1 - - - 2,341
LINGIG 1,895 18 6 34 15 17 945 6 180 - - 662 - 3,778
MADRID 9 2 347 353 14 171 73 5 86 - - 1 - 1,061
MARIHATAG 1,198 5 18 20 6 9 65 11 90 - - - - 1,422
SAN AGUSTIN 17 6 1,031 67 148 38 128 6 80 - - - - 1,521
SAN MIGUEL 2,251 27 35 41 28 21 106 5 92 - - 1,224 - 3,830
TAGBINA 2,181 57 17 59 34 36 139 6 254 - - 311 - 3,094
TAGO 25 15 2,255 77 98 400 257 2 161 1 - - - 3,291
SURIGAO DEL SUR Total
7,887 3,628 7,266 7,242 6,463 3,432 4,592 804 2,510 2 - 2,338 - 46,164
CARAGA Total
33,493 21,311 13,791 43,834 10,529 18,854 17,914 4,527 8,505 7 246 15,851 - 188,862
BARMM BASILAN AKBAR - - - 1,180 45 2 21 1 - - - - - 1,249
AL-BARKA - - - 2,723 46 3 2 - - - - 16 - 2,790
CITY OF LAMITAN - 4 4 17 3,296 29 38 6 - 1 - 1,065 - 4,460
HADJI MOHAMMAD AJUL
- 3 - 1,350 387 6 111 18 - - - 714 - 2,589
HADJI MUHTAMAD
- 2 - 1,099 55 9 38 11 - - - 180 - 1,394
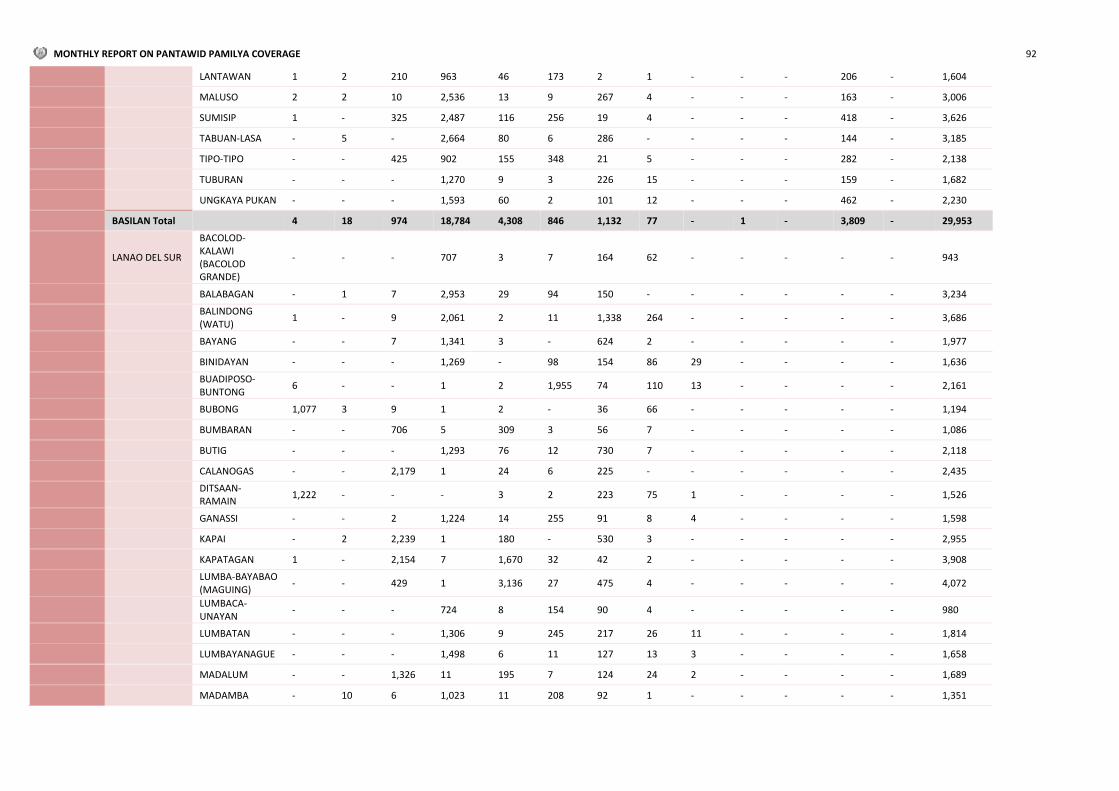
MONTHLY REPORT ON PANTAWID PAMILYA COVERAGE 92
LANTAWAN 1 2 210 963 46 173 2 1 - - - 206 - 1,604
MALUSO 2 2 10 2,536 13 9 267 4 - - - 163 - 3,006
SUMISIP 1 - 325 2,487 116 256 19 4 - - - 418 - 3,626
TABUAN-LASA - 5 - 2,664 80 6 286 - - - - 144 - 3,185
TIPO-TIPO - - 425 902 155 348 21 5 - - - 282 - 2,138
TUBURAN - - - 1,270 9 3 226 15 - - - 159 - 1,682
UNGKAYA PUKAN - - - 1,593 60 2 101 12 - - - 462 - 2,230
BASILAN Total 4 18 974 18,784 4,308 846 1,132 77 - 1 - 3,809 - 29,953
LANAO DEL SUR
BACOLOD-KALAWI (BACOLOD GRANDE)
- - - 707 3 7 164 62 - - - - - 943
BALABAGAN - 1 7 2,953 29 94 150 - - - - - - 3,234
BALINDONG (WATU)
1 - 9 2,061 2 11 1,338 264 - - - - - 3,686
BAYANG - - 7 1,341 3 - 624 2 - - - - - 1,977
BINIDAYAN - - - 1,269 - 98 154 86 29 - - - - 1,636
BUADIPOSO-BUNTONG
6 - - 1 2 1,955 74 110 13 - - - - 2,161
BUBONG 1,077 3 9 1 2 - 36 66 - - - - - 1,194
BUMBARAN - - 706 5 309 3 56 7 - - - - - 1,086
BUTIG - - - 1,293 76 12 730 7 - - - - - 2,118
CALANOGAS - - 2,179 1 24 6 225 - - - - - - 2,435
DITSAAN-RAMAIN
1,222 - - - 3 2 223 75 1 - - - - 1,526
GANASSI - - 2 1,224 14 255 91 8 4 - - - - 1,598
KAPAI - 2 2,239 1 180 - 530 3 - - - - - 2,955
KAPATAGAN 1 - 2,154 7 1,670 32 42 2 - - - - - 3,908
LUMBA-BAYABAO (MAGUING)
- - 429 1 3,136 27 475 4 - - - - - 4,072
LUMBACA-UNAYAN
- - - 724 8 154 90 4 - - - - - 980
LUMBATAN - - - 1,306 9 245 217 26 11 - - - - 1,814
LUMBAYANAGUE - - - 1,498 6 11 127 13 3 - - - - 1,658
MADALUM - - 1,326 11 195 7 124 24 2 - - - - 1,689
MADAMBA - 10 6 1,023 11 208 92 1 - - - - - 1,351

MONTHLY REPORT ON PANTAWID PAMILYA COVERAGE 93
MAGUING - - - 1,102 5 1 858 5 - - - - - 1,971
MALABANG 2 4 - 3,309 8 176 218 18 - - - - - 3,735
MARANTAO 2 - 2 1,811 18 6 510 353 1 - - - - 2,703
MAROGONG - 3 2,915 62 919 17 194 4 - - - - - 4,114
MASIU - - - 1,030 472 970 252 37 - - - - - 2,761
MULONDO - - 9 - 625 3 288 - - - - - - 925
PAGAYAWAN (TATARIKAN)
- - 1,282 6 367 3 99 5 - - - - - 1,762
PIAGAPO - - 3,134 8 891 1 235 - - - - - - 4,269
PICONG (SULTAN GUMANDER)
- 1,497 - 1 - 1,907 184 135 - - - - - 3,724
POONA BAYABAO (GATA)
1 - - 1,178 12 - 512 53 - - - - - 1,756
PUALAS - 14 1,270 6 38 7 159 21 9 - - - - 1,524
SAGUIARAN - 1 73 1,890 19 4 977 72 - - - - - 3,036
SULTAN DUMALONDONG
- - - 685 9 324 84 4 - - - - - 1,106
TAGOLOAN II 8 - 1,111 8 482 - 410 - - - - - - 2,019
TAMPARAN - 1 424 580 36 685 177 20 - - - - - 1,923
TARAKA - - - 3 1,067 3 177 181 - - - - - 1,431
TUBARAN - 1,376 1 - - 1,002 217 1 - - - - - 2,597
TUGAYA - - 117 914 4 2 526 23 - - - - - 1,586
WAO - 1 3 1,864 91 25 378 2 - - - 391 - 2,755
LANAO DEL SUR Total
2,320 2,913 19,414 29,884 10,745 8,263 12,017 1,698 73 - - 391 - 87,718
MAGUINDANAO AMPATUAN - - 1 2,530 45 2 750 53 - - - 448 - 3,829
BARIRA - - 327 1,836 21 1,232 216 1 - - - - - 3,633
BULDON - - 359 2,718 11 - 684 10 1 - - - - 3,783
BULUAN - - 510 1,437 5 1,301 554 194 3 - - - - 4,004
DATU ABDULLAH SANGKI
- - - 2,675 2 9 978 - - - - 273 - 3,937
DATU ANGGAL MIDTIMBANG
- - 1,102 15 850 5 1,099 99 1 - - - - 3,171
DATU BLAH T. SINSUAT
- - - 2,386 47 1 51 1 - - - 698 - 3,184
DATU HOFFER AMPATUAN
120 - 179 743 781 112 63 118 1 - - 1,231 - 3,348
DATU ODIN SINSUAT (DINAIG)
- 2 1 5,177 45 11 1,456 37 1 1 - 1,725 - 8,456

MONTHLY REPORT ON PANTAWID PAMILYA COVERAGE 94
DATU PAGLAS - 1 754 545 29 1,474 330 64 1 - - 227 - 3,425
DATU PIANG - - 518 362 395 939 72 12 2 - - - - 2,300
DATU SALIBO 144 2 579 1,183 775 1,507 493 8 1 - - - - 4,692
DATU SAUDI-AMPATUAN
408 - - - 2 1,694 174 - - - - 606 - 2,884
DATU UNSAY 339 - - 8 - 895 78 - - - - 113 - 1,433
GEN. S. K. PENDATUN
- - 1,470 902 4 1,932 231 125 2 - - - - 4,666
GUINDULUNGAN 1 - 1,874 - 844 - 1,273 - - - - 475 - 4,467
KABUNTALAN (TUMBAO)
- - 387 540 107 1,662 69 7 - - - - - 2,772
MAMASAPANO 840 - - - - 2,021 325 181 1 - - - - 3,368
MANGUDADATU - - 156 2,309 2 827 152 88 1 - - - - 3,535
MATANOG - 2,226 - - - 956 78 12 1 1 - - - 3,274
NORTHERN KABUNTALAN
1 - - 2,252 5 - 381 - - - - - - 2,639
PAGAGAWAN - 1 1,043 927 7 956 2,025 10 - - - - - 4,969
PAGALUNGAN - - 281 2,288 50 752 820 - - - - - - 4,191
PAGLAT - - 324 924 61 808 67 215 3 - - - - 2,402
PANDAG - - 92 1,006 7 429 193 29 - - - - - 1,756
PARANG - - 1 5 4,217 672 395 1 1 - - - - 5,292
RAJAH BUAYAN - - 1,035 867 2 1,074 77 64 - - - - - 3,119
SHARIFF AGUAK (MAGANOY) (Capital)
- 1 2,067 1,211 565 3,207 256 91 2 - - - - 7,400
SHARIFF SAYDONA MUSTAPHA
395 - - 289 554 2,137 216 67 3 - - - - 3,661
SOUTH UPI - - 1,147 1,471 23 1,299 165 32 - - - 1,789 - 5,926
SULTAN KUDARAT (NULING)
- 1 1 10 7,506 164 2,870 255 12 - - - - 10,819
SULTAN MASTURA
- - - 1,942 11 3 232 74 7 - - - - 2,269
SULTAN SA BARONGIS (LAMBAYONG)
- - 780 1,379 7 1,212 846 103 1 - - - - 4,328
TALAYAN - - 2,136 - 1,836 9 1,569 - - - - 325 - 5,875
TALITAY - - 782 6 546 8 254 - - - - - - 1,596

MONTHLY REPORT ON PANTAWID PAMILYA COVERAGE 95
UPI 1 - 1,374 2,212 194 544 124 2 - 2 - 2,499 - 6,952
MAGUINDANAO Total
2,249 2,234 19,280 42,155 19,556 29,854 19,616 1,953 45 4 - 10,409 - 147,355
SULU HADJI PANGLIMA TAHIL (MARUNGGAS)
645 - 2 4 - 7 163 1 - - - 171 - 993
INDANAN 5 3 691 3,277 82 1,406 217 - - 3 - 11 - 5,695
JOLO (Capital) 1,842 3 48 42 1,834 16 2,252 25 1 - - 145 - 6,208
KALINGALAN CALUANG
1 1,485 - 427 34 967 120 - - - - 12 - 3,046
LUGUS 1 - 1,154 7 290 - 60 - - - - 47 - 1,559
LUUK - 2,168 1 2 28 1,093 170 - - - - - - 3,462
MAIMBUNG - 1 4,168 35 528 1 251 - - - - 109 - 5,093
OLD PANAMAO - 11 259 3,415 88 96 127 - - - - - - 3,996
OMAR - 1,844 2 - 45 670 6 13 - - - 130 - 2,710
PANDAMI - - 2,737 977 152 4 15 - - - - - - 3,885
PANGLIMA ESTINO (NEW PANAMAO)
- 2,601 1 2 49 1,794 840 1 - - - - - 5,288
PANGUTARAN - 1 3,096 183 1,420 7 753 6 - - - 362 - 5,828
PARANG - - 830 6,471 200 467 2,066 3 - - - 102 - 10,139
PATA - - 1,328 2 269 1 52 2 - - - - - 1,654
PATIKUL - 4 528 4,026 360 2,266 255 4 - 2 - 6 - 7,451
SIASI 1 - 290 4,573 81 2,199 147 - - - - 190 - 7,481
TALIPAO 1 3 1,118 6,270 51 104 332 - - - - - - 7,879
TAPUL - - 1,406 355 155 - 312 4 - - - 28 - 2,260
TONGKIL - 2 1,267 37 587 2 180 35 - - - 71 - 2,181
SULU Total 2,496 8,126 18,926 30,105 6,253 11,100 8,318 94 1 5 - 1,384 - 86,808
TAWI-TAWI BONGAO (Capital)
2,222 10 75 73 56 104 2,488 31 - - - 4,136 - 9,195
LANGUYAN 6 1 201 990 109 235 111 1 - - - 648 - 2,302
MAPUN (CAGAYAN DE TAWI-TAWI)
- - - 971 126 346 30 3 - - - 930 - 2,406
PANGLIMA SUGALA (BALIMBING)
4 - 1,084 990 772 71 89 2 - - - 1,875 - 4,887
SAPA-SAPA 1 - 1,349 5 391 81 14 5 - - - 1,433 - 3,279

MONTHLY REPORT ON PANTAWID PAMILYA COVERAGE 96
SIBUTU 3 - 756 25 425 8 13 10 1 - - 1,264 - 2,505
SIMUNUL 4 - 294 17 445 42 8 - - - - 1,511 - 2,321
SITANGKAI 2 1 874 126 276 402 147 2 - - - 1,361 - 3,191
SOUTH UBIAN - - 971 - 363 35 84 - - - - 1,059 - 2,512
TANDUBAS - 4 1,012 3 232 417 114 - - - - 858 - 2,640
TURTLE ISLANDS - - - 260 63 173 19 - - - - 217 - 732
TAWI-TAWI Total
2,242 16 6,616 3,460 3,258 1,914 3,117 54 1 - - 15,292 - 35,970
BARMM Total
9,311 13,307 65,210 124,388 44,120 51,977 44,200 3,876 120 10 - 31,285 - 387,804
Grand Total 260,486 225,189 346,147 1,088,424 763,858 809,405 352,616 71,692 179,686 26,445 3,929 175,501 353 4,303,731
Related Documents