November 18, 2011 Weekly REIT Insights NAREIT Convention Roundup This week we focus on the top themes at NAREIT. Chasing growth through portfolio reinvention. It was hard not to be struck during our 46 NAREIT Convention meetings by the prevalence of strategic initiatives to upgrade asset portfolios, recycling capital from weak to strong markets, submarkets, asset niches, and even countries. We view the trends as a reflection of (1) a fundamental realization that growth is likely to remain biased towards highly-educated industries and the locations where they are concentrated (e.g., tech in San Francisco, biotech in Boston, etc.) and (2) the fact that core internal growth outweighs the potential impact of external investment as REITs mature – meaning it is not worth sacrificing long-term rent growth for short-term FFO-accretive deals in scattered markets. Another way that scale matters – marketing. Outside the mall, industrial, and possibly healthcare REIT sectors, we have long been skeptical of the merits of scale in commercial real estate. There are too many examples of underperforming, overextended operators set against outperforming, focused players to convince us that scale beyond a minimum threshold (~$1B equity cap) adds enough value to be an end unto itself. Recently, however, the apartment & self-storage REITs have demonstrated that scale offers the ability to absorb technology investments in operations & marketing that lend sustainable competitive advantages in customer acquisition and retention, as well as pricing. Apart from PSA, we are not convinced these merits are reflected in current valuations. DC concerns mount. While concerns about BRAC realignment, potential federal cuts, challenging Y/Y comps, and 2012-13 supply growth have become well-known for Washington, DC, we were nevertheless struck by the caution now being expressed by the largest REIT players in the market, as opposed to stemming from those throwing stones from afar. Recent Reports Title Date American Assets Trust: Index Addition a Positive, Reiterate OW Nov 16, 2011 Paul Morgan / Chris Caton Weekly REIT Insights: NAREIT Convention Preview: A Lone Star Hoedown Nov 11, 2011 REIT Valuation Analyst: Yield spreads still attractive Nov 11, 2011 Hudson Pacific Properties: Delivering Its Growth Strategy Nov 9, 2011 Paul Morgan / Chris Caton American Assets Trust: Operating Stats Belie ’12 Growth Opportunity Nov 8, 2011 Paul Morgan / Chris Caton Health Care Reit Incorporated: Guidance raise following acquisitions Nov 4, 2011 Paul Morgan / Jorel Guilloty Weekly REIT Insights: Helpful highlights to navigate the earnings deluge Nov 4, 2011 Paul Morgan / Chris Caton / Swaroop Yalla, PhD / Jorel Guilloty / Stephen Bakke REITs: Mall Sales Monitor: Below expectations for October Nov 3, 2011 Paul Morgan / Stephen Bakke Equity One Inc.: Entering the late innings of portfolio transformation Nov 3, 2011 Paul Morgan / Stephen Bakke Kimco Realty Corp.: International drives ss-NOI; offers new 2012 guidance Nov 2, 2011 Paul Morgan / Stephen Bakke Essex Property Trust: Guidance raised for 2011, ss-NOI accelerates 200bps Nov 2, 2011 Paul Morgan / Swaroop Yalla, PhD HCP, Inc.: Core Upside in Q3, With All Quiet on the Transaction Front Nov 2, 2011 Paul Morgan / Jorel Guilloty BRE Properties, Inc.: Steady acceleration across BRE markets Nov 2, 2011 Paul Morgan / Swaroop Yalla, PhD Kilroy Realty Corp.: Strong Execution Amid Improving Markets Nov 2, 2011 Paul Morgan / Chris Caton Morgan Stanley does and seeks to do business with companies covered in Morgan Stanley Research. As a result, investors should be aware that the firm may have a conflict of interest that could affect the objectivity of Morgan Stanley Research. Investors should consider Morgan Stanley Research as only a single factor in making their investment decision. For analyst certification and other important disclosures, refer to the Disclosure Section, located at the end of this report. Morgan Stanley & Co. LLC Paul Morgan [email protected] +1 415 576 2627 Chris Caton [email protected] +1 415 576 2637 Swaroop Yalla, PhD [email protected] +1 415 576 2361 Jorel Guilloty [email protected] +1 415 576 2631 MORGAN STANLEY RESEARCH NORTH AMERICA Industry View Attractive

Welcome message from author
This document is posted to help you gain knowledge. Please leave a comment to let me know what you think about it! Share it to your friends and learn new things together.
Transcript
November 18, 2011
Weekly REIT Insights NAREIT Convention Roundup
This week we focus on the top themes at NAREIT.
Chasing growth through portfolio reinvention. It was hard not to be struck during our 46 NAREIT Convention meetings by the prevalence of strategic initiatives to upgrade asset portfolios, recycling capital from weak to strong markets, submarkets, asset niches, and even countries. We view the trends as a reflection of (1) a fundamental realization that growth is likely to remain biased towards highly-educated industries and the locations where they are concentrated (e.g., tech in San Francisco, biotech in Boston, etc.) and (2) the fact that core internal growth outweighs the potential impact of external investment as REITs mature – meaning it is not worth sacrificing long-term rent growth for short-term FFO-accretive deals in scattered markets.
Another way that scale matters – marketing. Outside the mall, industrial, and possibly healthcare REIT sectors, we have long been skeptical of the merits of scale in commercial real estate. There are too many examples of underperforming, overextended operators set against outperforming, focused players to convince us that scale beyond a minimum threshold (~$1B equity cap) adds enough value to be an end unto itself. Recently, however, the apartment & self-storage REITs have demonstrated that scale offers the ability to absorb technology investments in operations & marketing that lend sustainable competitive advantages in customer acquisition and retention, as well as pricing. Apart from PSA, we are not convinced these merits are reflected in current valuations.
DC concerns mount. While concerns about BRAC realignment, potential federal cuts, challenging Y/Y comps, and 2012-13 supply growth have become well-known for Washington, DC, we were nevertheless struck by the caution now being expressed by the largest REIT players in the market, as opposed to stemming from those throwing stones from afar.
Recent Reports
Title Date
American Assets Trust: Index Addition a Positive, Reiterate OW
Nov 16, 2011
Paul Morgan / Chris Caton Weekly REIT Insights: NAREIT Convention Preview: A Lone Star Hoedown
Nov 11, 2011
REIT Valuation Analyst: Yield spreads still attractive
Nov 11, 2011
Hudson Pacific Properties: Delivering Its Growth Strategy
Nov 9, 2011
Paul Morgan / Chris Caton American Assets Trust: Operating Stats Belie ’12 Growth Opportunity
Nov 8, 2011
Paul Morgan / Chris Caton Health Care Reit Incorporated: Guidance raise following acquisitions
Nov 4, 2011
Paul Morgan / Jorel Guilloty Weekly REIT Insights: Helpful highlights to navigate the earnings deluge
Nov 4, 2011
Paul Morgan / Chris Caton / Swaroop Yalla, PhD / Jorel Guilloty / Stephen Bakke
REITs: Mall Sales Monitor: Below expectations for October
Nov 3, 2011
Paul Morgan / Stephen Bakke Equity One Inc.: Entering the late innings of portfolio transformation
Nov 3, 2011
Paul Morgan / Stephen Bakke Kimco Realty Corp.: International drives ss-NOI; offers new 2012 guidance
Nov 2, 2011
Paul Morgan / Stephen Bakke Essex Property Trust: Guidance raised for 2011, ss-NOI accelerates 200bps
Nov 2, 2011
Paul Morgan / Swaroop Yalla, PhD HCP, Inc.: Core Upside in Q3, With All Quiet on the Transaction Front
Nov 2, 2011
Paul Morgan / Jorel Guilloty BRE Properties, Inc.: Steady acceleration across BRE markets
Nov 2, 2011
Paul Morgan / Swaroop Yalla, PhD Kilroy Realty Corp.: Strong Execution Amid Improving Markets
Nov 2, 2011
Paul Morgan / Chris Caton
Morgan Stanley does and seeks to do business with companies covered in Morgan Stanley Research. As a result, investors should be aware that the firm may have a conflict of interest that could affect the objectivity of Morgan Stanley Research. Investors should consider Morgan Stanley Research as only a single factor in making their investment decision. For analyst certification and other important disclosures, refer to the Disclosure Section, located at the end of this report.
Morgan Stanley & Co. LLC Paul Morgan
[email protected] +1 415 576 2627
Chris Caton [email protected] +1 415 576 2637
Swaroop Yalla, PhD [email protected] +1 415 576 2361
Jorel Guilloty [email protected] +1 415 576 2631
M O R G A N S T A N L E Y R E S E A R C H N O R T H A M E R I C A
Industry View Attractive

2
M O R G A N S T A N L E Y R E S E A R C H
November 18, 2011 Weekly REIT Insights
Retail REIT Roundup How will the holiday season matter? With Black Friday fast approaching and retailers reporting Q3 results, the topic of tenant health and the outlook for the holiday shopping season was the lead in our meetings with regional mall REITs. Strong year-to-date sales growth has boosted the prospects for rent growth in 2012, as occupancy costs have returned to levels that offer landlords greater pricing power. While the bulk of the tenant base appears to have a gradually improving mindset, exceptions exist in the form of chains that survived the Great Recession intact, but without their prior vibrancy – as reflected, for example, by stock prices in the $3-and-under range for PacSun, Talbot’s, New York & Co, Coldwater Creek, Christopher & Banks and BonTon. These concepts operate over 3,300 stores and are among the chains whose ongoing or potential store closings could partly offset the upside to ss-NOI growth in 2012-13, especially if the broader holiday season disappoints. Nevertheless, managing these combinations of vibrant, growth-oriented tenants and their more challenged peers is part of playbook for mall operators and we expect the shifts to translate into greater market share for REIT-owned assets and among these, the most productive, trade-area dominant malls.
Can small shops recover in 2012? The lack of a recovery in small shop leasing has plagued strip center REITs this year, despite a strong rebound in demand from public retailers with stronger balance sheets and better access to growth capital. Signs of modest improvements exist, for example, in the form of Regency’s strong leasing velocity and a sharp decline in “midnight moveouts” by mom’n’pop shops. Several factors contribute to the ongoing weakness – one new candidate being delayed permitting approvals by under-staffed municipalities – though in our view the biggest challenge remains simply an oversupply of newly-built small-shop retail in housing bust submarkets across the country. These lessons should translate into more conservative development projects for the next cycle, with less reliance on building excess non-anchor space in order to pad development yields to offset the impact of falling cap rates.
LatAm and Asia still enticing the bigger players. Taubman continues to expect an announcement of project plans for China by 1H12 as originally outlined, while management highlighted the potential for TCO to exploit opportunities stemming from liquidity challenges facing local residential
developers (who also build much of the new retail space in China). We are constructive on the Taubman Asia potential, however, given past failures, we do not expect the upside potential to be built into TCO’s valuation until investors have had an opportunity to assess the details behind future project announcements. Meanwhile, LatAm continues to entice both companies with existing ventures in the market (incl. DDR, KIM & GGP), as well as potential new entrants (e.g., SPG). Kimco is also enthusiastic about potential growth in less crowded investment markets Peru & Chile.
Outlet competition harkens back to the old days. With both public and private developers in pursuit of avenues to kickstart their value-creation platforms, the outlet center has burst into activity and reminds us of the pre-1990s regional mall industry and the 2003-08 lifestyle center wave. Both generations of development led to a mix of highly successful projects, failures, and many projects that never achieved liftoff at all. Simon and Tanger are appropriately highlighting that a marketing pamphlet doesn’t mean a project will happen, so it is premature to talk of oversupply, and both competitors are certain to make efforts to defend their profitable territory, with one battleground appearing in St. Louis where TCO & SPG have announced competing projects a few miles apart.
AAT MSCI REIT Index addition: This week, MSCI announced that AAT will be added to the MSCI REIT Index (RMZ) on December 1, along with four other REITs (EXL, RLJ, INN, and MNR). We analyzed the last 10 RMZ index additions during the past five years and on average, stocks saw a ~+550bp outperformance driven by index buyers. AAT outperformed the index by ~400bp on Wednesday and Thursday, leaving some potential upside from here. Also, ave. daily trading volume doubled upon index addition
Exhibit 1 AAT: RMZ index inclusion a near-term catalyst
DEI
DCT
DFT
GOV
PEB
CHSP
PDM
HPPCORCCG
Avg (xGOV)
-20
-15
-10
-5
0
5
10
15
-15 -10 -5 0 5 10 15 20 25 30 35 40 45
Performance Relative to RMZ, %, Indexed to MSCI REIT Index Set vs. Date of Announcement of Addition to the MSCI REIT Index (RMZ)
Source: FactSet, MSCI, Morgan Stanley Research
NAREIT Roundup

3
M O R G A N S T A N L E Y R E S E A R C H
November 18, 2011 Weekly REIT Insights
Apartment REIT Roundup Demand intact but 2012 more dependent on job growth. Our management meetings with various apartment REITs (CPT, HME, MAA, AIV) confirmed our thesis of a bifurcation in certain submarkets/price points. AIMCO management, for example, acknowledged seeing higher pressure at its lower price point assets and plans continued dispositions to improve the portfolio exposure to more robust markets. Meanwhile, operators with assets in higher-growth markets continue to show momentum: Camden reported sending renewal notices in the 7-8% in Oct/Nov and ss-revenue growth for Q4 is trending towards low to mid 6s, in line with guidance. Camden and MAA also reported seeing their rent to income ratio drop sequentially, as residents leaving due to rent increases are replaced by higher-income tenants. An eye on same-store expenses in 2012. Management teams voiced some concerns for 2012 after two years of little to no expense growth, helped by tax appeals and various technology initiatives that conserved marketing spend. Camden is anticipating 3-4% increases in taxes, while AIV also anticipates similar rates of increase. MAA, with its exposure to Florida and Texas markets, has seen earlier tax adjustments than peers (which may set them up for better comps next year). Expense guidance in February (post-budgeting and tax appeal discussions) should provide better color on the sustainability of peak NOI growth into 2012 and beyond. Development risks not as high as last cycle. With macro factors posing some risk to core revenue growth, apartment REITs are dialing up development pipelines. With little competition from merchant builders, the risk of development – at least at this phase of the cycle – is not as high as last cycle for well-capitalized REITs. Camden has $500M in current development and is planning $250-400M in new starts for 2012 (maintaining CIP/EV of ~10%). Land costs continue to rise in response to this demand – Camden mentioned that land costs in California have doubled in six months, which bodes well for the pipeline value for BRE and ESS. Development yields continue to pencil at a 150bps spread to comparable acquisitions – e.g., CPT is developing a 310-unit deal in the Buckhead submarket of Atlanta, where they are looking at a +6.5% yield on un-trended rents (vs. 5% cap rate for a core acquisition).
Industrial REIT Roundup Filling vacancy. Management teams remain constructive on filling vacancy into 2012 and beyond, although with some pressure from recent macroeconomic uncertainty. While market wide rent momentum is expected to be modest next year, replacing expiring rent levels are making for easier comps as 2012 renewals will include shorter-term leases signed at low 2008 and 2009 rents.
Development starts expanding. Management highlighted the dwindling availability of large spaces as a catalyst for rent growth across a range of markets (e.g., Los Angeles / Inland Empire, Houston, Lehigh Valley, New Jersey). Lack of availability is spurring new development, much of it led by REITs over private market competitors, likely due to differences in balance sheets.
Prologis (PLD-OW): Along with leasing, we look for progress on the deleveraging front at Prologis. Private capital markets remain robust and are not a limiting factor at this point: for example, we expect Prologis to form two funds in Japan in 2012, an open-ended core fund and a development fund. Development starts are likely to remain dominated by build to suits, with a healthy near-term pipeline supporting a moderate level of activity until a broader pickup in the market resumes.
EastGroup Properties (EGP-EW): We expect external growth sources to increasingly supplement growth as portfolio occupancy has reverted to the low- to mid-90s. Management seemed incrementally more positive on sourcing investments as more assets become available for sale (e.g., Prologis’ non-core dispositions in the Sunbelt). We look for the company to reach stabilized $100m of annual development starts, led initially by Houston and Orlando, although reaching this full potential will require recovery in other of their core markets.
Office REIT Roundup
Limited visibility on core growth: Increased macro uncertainty has led users to delay leasing decisions where they can, which has reduced the REITs’ leasing pipelines and added some uncertainty on filling vacancy in 2012. The upward momentum of rents in NYC has been checked, while tech-oriented submarkets (e.g., Cambridge, SoMa, Silicon Valley) continue to lead the way.
Intense competition for core assets: Acquisition markets remain strong, standing in contrast to the latest slowing in leasing activity. Competition remains intense as institutional
4
M O R G A N S T A N L E Y R E S E A R C H
November 18, 2011 Weekly REIT Insights
buyers continue to seek the safe inflation-protected yields. Activity has consolidated in the top markets (e.g., 24 hour cities), which could slow the portfolio repositioning of REITs looking to sell weaker properties in secondary cities. In contrast, those management teams willing to take leasing risk in their acquisition programs continue to believe they can find better-priced opportunities.
Highlights from covered companies:
Kilroy Realty (KRC-EW): Portfolio repositioning continues to be successful, with disposition activities on track. The recent 370 Third St acquisition (largest block of availability in San Francisco’s SoMa submarket) has a handful of prospects which should give clarity on a stabilized yield in the low- to mid-7s at the property. The recovery in San Diego has continued and has not seen a setback amidst weaker macroeconomic data – rents are rising in the best submarkets.
Piedmont Office (PDM-UW): 2012 & 2013 will be years of transitioning tenants and will likely pressure operating metrics. As a result, we expect a dividend cut to $0.80 as new tenants require capital, which will pressure AFFO. Crain’s has reported that PDM renewed Aon for 400ksf (currently a sublease tenant from BP), the largest lease deal in Chicago this year. With this lease, PDM would have successfully pre-leased the BP expiration (along with new leases to Integrys and others), although the replacement rents are as much as $7/ft NNN above market (would result in upwards of ~$5m reduced NOI in 2014+).
Highwoods Properties (HIW-EW): We came away incrementally more constructive on the new PPG Place acquisition as HIW appears to have increased their forward looking budget on better expense management and opportunities to drive better revenues through the retail. We look for the stabilized NOI yield to rise into the 9s as HIW adds occupancy over time. With regard to development, management may be working on a handful of small build-to-suits, although activity is otherwise likely to remain quite. We think HIW will be patient on finding permanent financing for 3Q acquisitions and their 4Q debt retirement; a new fixed rate financing seems likely in the near term, although new cash will introduced at a more measured pace (~$100M/yr of asset dispositions and occasional equity issuance via the ATM, in our view).
First Potomac (FPO-EW): Management has executed amidst a slower DC leasing environment. The company has over 500ksf of leases to commence by the end of 2012 (predominantly mid-2012). The First Street and 1200 17th St.
redevelopments are both likely to move forward in 2012 (although a deeper market setback could delay 1200) and could show some preleasing by mid- to late-2012.
Hudson Pacific (HPP-EW): Management is focused on creating value across a handful of their leasing opportunities. On the margin, we look for progress across all of their leasing challenges (i.e., 1455, Rincon retail, Arizona, 275 Brannan, City Plaza), although results are more likely to hit in early- to mid-2012. On the margin, HPP seemed to have a reduced focus on exposure to studio/media assets.
Gov’t Properties (GOV-EW): We look for portfolio occupancy to settle in the mid-90s over time from the current 97% level. Management is exploring term loans as well as watching the unsecured bond markets as a permanent financing solution for the current elevated line of credit balance.
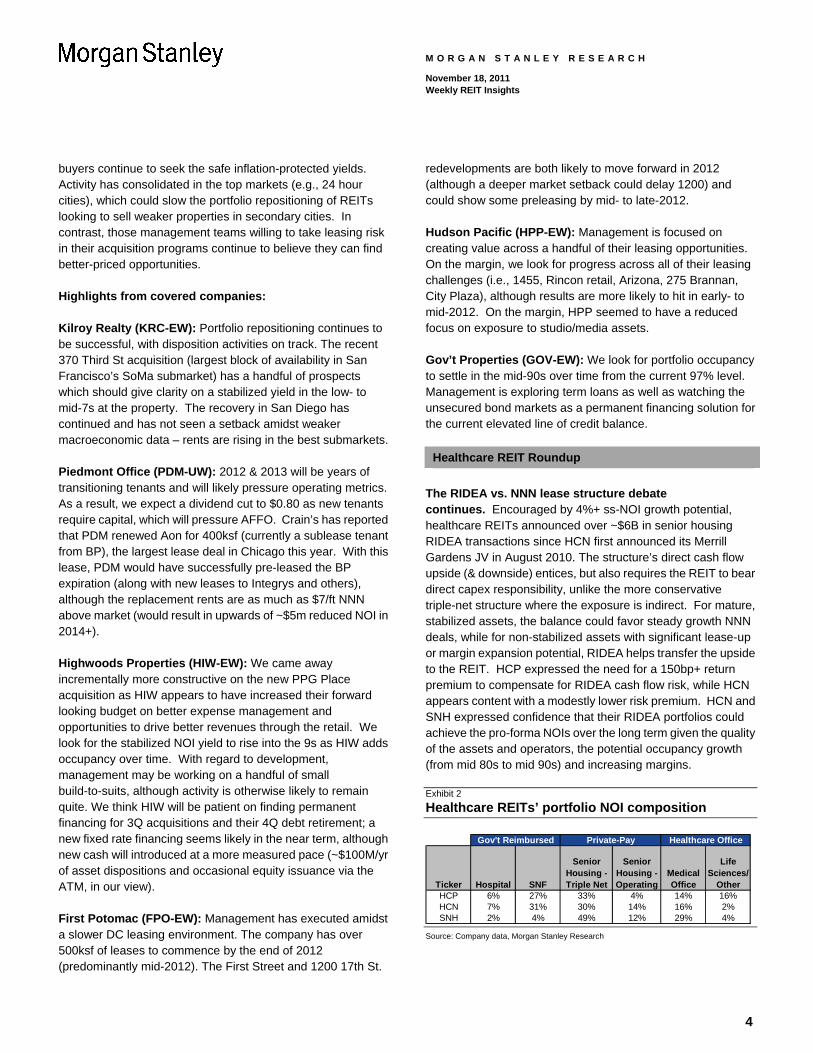
Healthcare REIT Roundup The RIDEA vs. NNN lease structure debate continues. Encouraged by 4%+ ss-NOI growth potential, healthcare REITs announced over ~$6B in senior housing RIDEA transactions since HCN first announced its Merrill Gardens JV in August 2010. The structure’s direct cash flow upside (& downside) entices, but also requires the REIT to bear direct capex responsibility, unlike the more conservative triple-net structure where the exposure is indirect. For mature, stabilized assets, the balance could favor steady growth NNN deals, while for non-stabilized assets with significant lease-up or margin expansion potential, RIDEA helps transfer the upside to the REIT. HCP expressed the need for a 150bp+ return premium to compensate for RIDEA cash flow risk, while HCN appears content with a modestly lower risk premium. HCN and SNH expressed confidence that their RIDEA portfolios could achieve the pro-forma NOIs over the long term given the quality of the assets and operators, the potential occupancy growth (from mid 80s to mid 90s) and increasing margins. Exhibit 2 Healthcare REITs’ portfolio NOI composition
Ticker Hospital SNF
Senior Housing - Triple Net
Senior Housing - Operating
Medical Office
Life Sciences/
OtherHCP 6% 27% 33% 4% 14% 16%HCN 7% 31% 30% 14% 16% 2%SNH 2% 4% 49% 12% 29% 4%
Gov't Reimbursed Private-Pay Healthcare Office
Source: Company data, Morgan Stanley Research
5
M O R G A N S T A N L E Y R E S E A R C H
November 18, 2011 Weekly REIT Insights
Much ado about reimbursement. Healthcare REIT management teams almost unanimously indicated that the most asked topic during NAREIT had been government reimbursement, specifically how operators will mitigate current and future government cuts and the ultimate impact on lease coverage. Teams reiterated that their operators were well under way mitigating 1/3 to 2/3 of the 11% Medicare cuts, mostly through labor costs, which allows for rent coverage for HCN (1.3 x to 1.4x) and HCP's (1.5x) major SNF portfolios. HCN believes that Genesis could offset this impact by increasing the portfolio’s quality mix (SNF revenue stemming from Medicare + private pay sources) from the current 53% to the 60% to 65% range (with every 1% increase in quality mix equating to a 6bps increase in rent coverage). HCP reiterated its belief that deal activity within the SNF space could pick up in 1Q12 assuming some budget clarity emerges from the Supercommittee negotiations – even if the news is somewhat worse than expected. Management teams were not as worried about potential additional Medicare cuts given current overall coverage ratios and potential offsets arising from regular market basket updates.
Self-storage REIT Roundup Market rents rising, with discounting mixed. EXR and PSA reported seeing increasing market rents (approximately 4-5%); however, interestingly, EXR reported that discounting is down 9% y/y while PSA reported seeing a flat to modest increase in discounting. Given that they are both operating near their “optimal” occupancy levels given frictional turnover rates, revenue growth in 2012 will likely be driven by rental rate growth. While early signs of market rent growth are promising, the divergence across discounting strategies reduces clarity regarding true underlying pricing power. Consolidation still a theme in self-storage. SDSS data (which includes a survey of 5,000 properties including 1,500 REIT properties) showed a +10bps y/y increase for overall self-storage market occupancies, at a time when storage companies are reporting almost +150bps increase in occupancies. We believe this is driven partly by the significant economies of scale being exercised by the large public operators, particularly in an increasingly sophisticated Internet marketing landscape. As this gulf continues to widen and the top operators gain share from locals, we believe the industry pressure to consolidate will continue, potentially contributing to the acquisitions pipelines of the REITs.

6
M O R G A N S T A N L E Y R E S E A R C H
November 18, 2011 Weekly REIT Insights
Weekly News Flow
Industry
CRE Pricing Recovery Continues With September Rebound – Third-Quarter CoStar Sales data reflects less distress, firmer retail pricing and broadening strength across the spectrum of CRE properties. (CoStar, Nov 16) Global Office Rents, Values Continue To Rise In 3Q, Says CBRE Index – The CBRE Global Office Rent Index posted a YoY increase of 5.1%, and a QoQ increase of 0.9%, a sixth straight quarterly rise for the world's prime office markets. (World Property Channel, Nov 14)
Apartments Campus Apartments To Break Ground On $200M Project – On the first phase of a $200m student housing project at Shippensburg University in Philadelphia this week. (Business Journals, Nov 16) $159M Sale of Chicago Apartments Completed – Crescent Heights sold its Regents Part Apartment Complex in Chicago to an affiliate of Antheus Capital for $159 M. (Commercial Real Estate Direct, Nov 16)
Commercial Cleveland Announces $1b Waterfront Plan – The city announced a new development plan that could transform the lakefront area, with the potential for 1.5m SF of commercial projects. (GlobeSt, Nov 15) Crescent Closes Regents Park Sale For $159m – RP Holdings LLC, purchased the two towers with 1,031 units in Chicago from Crescent Heights. (GlobeSt, Nov 15) Genessee Executive Plaza Sells For $47m – DivcoWest and Stockbridge Capital Group have jointly purchased the 159,425 SF office complex in San Diego's University Town Center submarket, for $46.8m. (GlobeSt, Nov 11)
Rosslyn Office Trades For $57m – Has acquired 1400 Wilson Blvd., a 108,296 SF office building in Virginia for $57m. (GlobeSt, Nov 11)
7
M O R G A N S T A N L E Y R E S E A R C H
November 18, 2011 Weekly REIT Insights
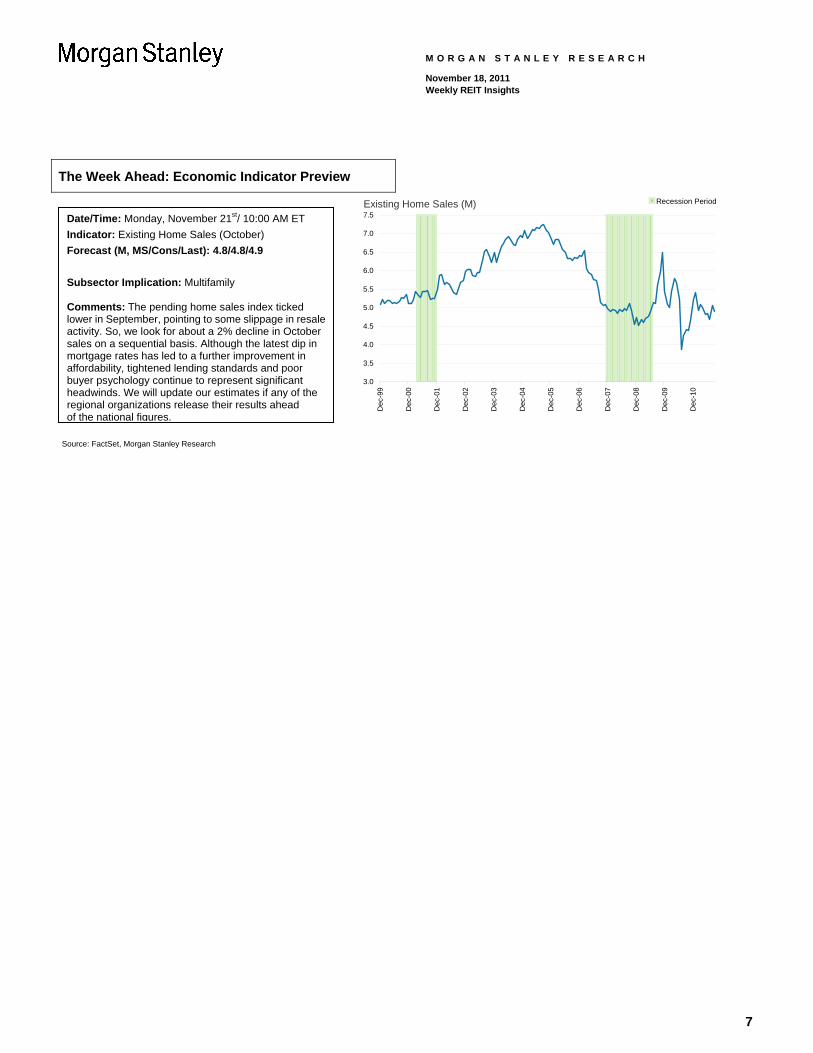
The Week Ahead: Economic Indicator Preview
Existing Home Sales (M)
3.0
3.5
4.0
4.5
5.0
5.5
6.0
6.5
7.0
7.5
Dec
-99
Dec
-00
Dec
-01
Dec
-02
Dec
-03
Dec
-04
Dec
-05
Dec
-06
Dec
-07
Dec
-08
Dec
-09
Dec
-10
Recession Period
Source: FactSet, Morgan Stanley Research
Date/Time: Monday, November 21st/ 10:00 AM ET Indicator: Existing Home Sales (October) Forecast (M, MS/Cons/Last): 4.8/4.8/4.9 Subsector Implication: Multifamily Comments: The pending home sales index ticked lower in September, pointing to some slippage in resale activity. So, we look for about a 2% decline in October sales on a sequential basis. Although the latest dip in mortgage rates has led to a further improvement in affordability, tightened lending standards and poor buyer psychology continue to represent significant headwinds. We will update our estimates if any of the regional organizations release their results ahead of the national figures.
8
M O R G A N S T A N L E Y R E S E A R C H
November 18, 2011 Weekly REIT Insights
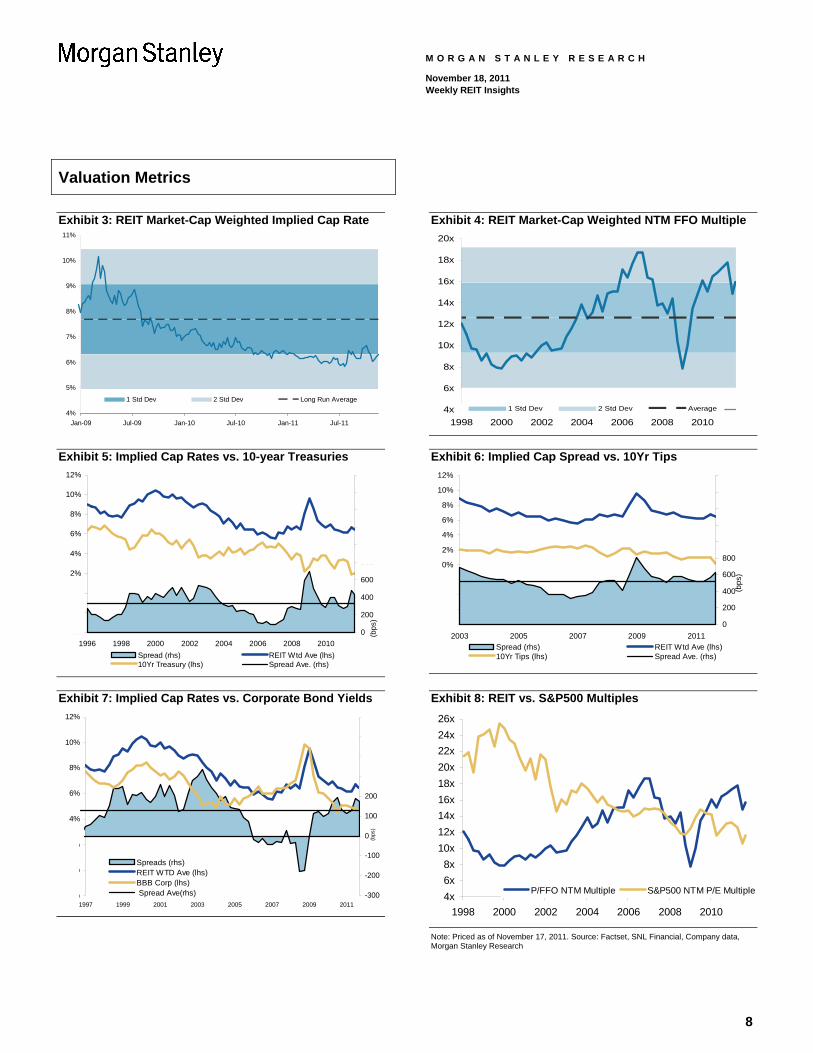
Valuation Metrics
Exhibit 3: REIT Market-Cap Weighted Implied Cap Rate
4%
5%
6%
7%
8%
9%
10%
11%
Jan-09 Jul-09 Jan-10 Jul-10 Jan-11 Jul-11
1 Std Dev 2 Std Dev Long Run Average
Exhibit 4: REIT Market-Cap Weighted NTM FFO Multiple
4x
6x
8x
10x
12x
14x
16x
18x
20x
1998 2000 2002 2004 2006 2008 20101 Std Dev 2 Std Dev Average
Exhibit 5: Implied Cap Rates vs. 10-year Treasuries
-4%
-2%
0%
2%
4%
6%
8%
10%
12%
1996 1998 2000 2002 2004 2006 2008 20100
200
400
600
800
1000
1200
1400
1600
1800
(bps
)
Spread (rhs) REIT Wtd Ave (lhs)10Yr Treasury (lhs) Spread Ave. (rhs)
Exhibit 6: Implied Cap Spread vs. 10Yr Tips
-8%
-6%
-4%
-2%
0%
2%
4%
6%
8%
10%
12%
2003 2005 2007 2009 20110
200
400
600
800
1000
1200
1400
1600
1800
(bps
)
Spread (rhs) REIT Wtd Ave (lhs)10Yr Tips (lhs) Spread Ave. (rhs)
Exhibit 7: Implied Cap Rates vs. Corporate Bond Yields
-2%
0%
2%
4%
6%
8%
10%
12%
1997 1999 2001 2003 2005 2007 2009 2011-300
-200
-100
0
100
200
300
400
500
600
(bps
)
Spreads (rhs)REIT WTD Ave (lhs)BBB Corp (lhs) Spread Ave(rhs)
Exhibit 8: REIT vs. S&P500 Multiples
4x6x8x
10x12x14x16x18x20x22x24x26x
1998 2000 2002 2004 2006 2008 2010
P/FFO NTM Multiple S&P500 NTM P/E Multiple
Note: Priced as of November 17, 2011. Source: Factset, SNL Financial, Company data, Morgan Stanley Research

9
M O R G A N S T A N L E Y R E S E A R C H
November 18, 2011 Weekly REIT Insights
REIT Weekly Price Performance Heat Maps Exhibit 9: Trailing 5D Relative to RMZ Heat Map (Sorted by Implied Cap Rate; Color Intensity Represents Return Quartile)
Subsectors Malls Strips Office Mixed OI Industrial Apartments Healthcare Hotels StorageStorage TCO FRT BXP MSW EGP AVB UHT PEB PSA
Apts SPG SKT MPG DLR PLD ESS HCP FCH EXRMalls MAC AKR SLG WRE TRNO ACC VTR HST SSSOffice GGP AAT DEI DFT DCT EQR NHI CHSP CUBEHcare GRT ROIC VNO PSB FR BRE HR LHOStrips CBL BFS BPO DRE UDR HCN DRH
Mixed O/I PEI EQY BMR LRY PPS LTC CLDTIndustrial KIM KRC COR EDR CSA HT
REG ARE FPO CPT SNH SHOWRI PDM MAA MPW HPTIRC OFC HME OHI AHT
1 +207< DDR BDN AIV SBRA BEE2 +25 < x <+207 KRG HIW3 -123 < x <+25 CDR GOV4 -123> RPT CLI
EXL PKYHPPCUZCWH
Rel. Performance in bpsQuar.
Exhibit 10: Trailing 5D Absolute Price Performance Heat Map Sorted by Subsector Lease Duration (Color Intensity Represents Quartile)
HO
T.ST
O.
APA
RTM
ENTS
STR
IPS
IND
MIX
OFF
ICE
MA
LLS
H.C
AR
E
VTR-2.4
HCP-0.9
HCN-1.5 M
PW
HST+1.3
HPT-4.4
LHO-2.5
DRH+1.4
PSA-0.5
SNH+0.6
ESS-2.7
EXR+2.7
OHI-0.5 H
R
MAA-2.8
OFC
EQR-5.1
AVB-2.3
SSS+1.1
CUBE+0.4
CLPACC
+3.4 PPS
CBL-3.2
HIW
NH
I
AIV-4.0
BRE-2.9
HME-2.9
DCT+0.4
EGP-1.7
FR-1.4
UDR-3.4
CPT-2.2
DFT+2.1
PSB-1.1 FP
O
MSW
PLD+0.8
DLR+2.3
LRY-1.4
DRE-2.0
WRE-0.5
KRC
CW
HBD
N
DEIARE
-1.1
AAT
AKR
IRC
VNO-3.4
BXP-1.7
BPO-3.5
SLG-3.3
PDM-1.0
CLI-2.3
BFS
BMR
KIM-2.9
FRT-0.4
REG-2.0
DDR-3.6
WRI+0.2
SKT+1.1
EQY-2.0
SHO-1.1
HT-1.4
AHT-4.1
BEE-4.0 FC
HPE
B
SPG-3.0
MAC-1.0
GGP-3.3
TCO+0.4
Note: REIT box size indicates relative equity market capitalization. Row height represents relative subsector market cap and column width with rows represents stock market cap relative to subsector. Both exhibits as of November 17, 2011. Source: FactSet, Morgan Stanley Research

10
M O R G A N S T A N L E Y R E S E A R C H
November 18, 2011 Weekly REIT Insights
REIT YTD Price Performance Heat Maps Exhibit 11: YTD Relative to RMZ Heat Map (Sorted by Implied Cap Rate; Color Intensity Represents Return Quartile)
Subsectors Malls Strips Office Mixed OI Industrial Apartments Healthcare Hotels StorageStorage TCO FRT BXP MSW EGP AVB UHT PEB PSA
Apts SPG SKT MPG DLR PLD ESS HCP FCH EXRMalls MAC AKR SLG WRE TRNO ACC VTR HST SSSOffice GGP AAT DEI DFT DCT EQR NHI CHSP CUBEHcare GRT ROIC VNO PSB FR BRE HR LHOStrips CBL BFS BPO DRE UDR HCN DRH
Mixed O/I PEI EQY BMR LRY PPS LTC CLDTIndustrial KIM KRC COR EDR CSA HT
REG ARE FPO CPT SNH SHOWRI PDM MAA MPW HPTIRC OFC HME OHI AHT
1 +428< DDR BDN AIV SBRA BEE2 -795 < x <+428 KRG HIW3 -1991 < x <-795 CDR GOV4 -1991> RPT CLI
EXL PKYHPPCUZCWH
Quar.Rel. Performance
in bps
Exhibit 12: YTD Absolute Price Performance Heat Map Sorted by Subsector Lease Duration (Color Intensity Represents Quartile)
HO
T.ST
O.
APA
RTM
ENTS
STR
IPS
IND
MIX
OFF
ICE
MA
LLS
H.C
AR
E
VTR-1.9
HCP+1.6
HCN+2.4 M
PW
HST-24.2
HPT-8.6
LHO-14.3
DRH-28.0
PSA+21.7
SNH-2.3
ESS+14.4
EXR+31.4
OHI-23.7 H
R
MAA-8.2
OFC
EQR+4.6
AVB+8.7
SSS+11.7
CUBE+0.1
CLP
ACC+22.
6 PPS
CBL-21.1
HIW
NH
I
AIV-15.2
BRE+7.5
HME-0.9
DCT-11.7
EGP-1.7
FR+5.0
UDR-0.6
CPT+7.2
DFT+5.5
PSB-6.9 FP
O
MSW
PLD-13.4
DLR+24.7
LRY-3.6
DRE-10.2
WRE-10.8
KRC
CW
HBD
N
DEIARE
-9.9
AAT
AKR
IRC
VNO-9.6
BXP+8.9
BPO-12.9
SLG-3.5
PDM-17.6
CLI-22.7
BFS
BMR
KIM-13.4
FRT+10.3
REG-13.1
DDR-20.0
WRI-12.3
SKT+8.7
EQY-10.7
SHO-28.9
HT-35.3
AHT-24.7
BEE-5.7 FC
HPE
B
SPG+22.7
MAC+1.8
GGP-11.6
TCO+20.5
Note: REIT box size indicates relative equity market capitalization. Row height represents relative subsector market cap and column width with rows represents stock market cap relative to subsector. Both exhibits as of November 17, 2011. Source: FactSet, Morgan Stanley Research

11
M O R G A N S T A N L E Y R E S E A R C H
November 18, 2011 Weekly REIT Insights
REIT Price Performance Charts Exhibit 13: REIT Subsector Relative Performance
-40
-30
-20
-10
0
10
20
Dec-10 Feb-11 Apr-11 Jun-11 Aug-11 Oct-11
Apartments Regional MallsShopping Centers OfficeIndustrial Health Care Self Storage Lodging/Resorts
Exhibit 14: REIT Subsector Price Performance - YTD -30% -20% -10% 0% 10% 20% 30%
Self Storage
Regional Malls
Apartments
Health Care
RMZ
Office
Shopping Centers
Industrial
Lodging
Exhibit 15: REIT Subsector Price Performance-Trailing 5D -1% -1% 0% 1% 1% 2% 2% 3% 3%
Self Storage
Lodging
Industrial
Health Care
Apartments
RMZ
Shopping Centers
Regional Malls
Office
Exhibit 16: REIT Subsector Dividend Yields 0% 1% 2% 3% 4% 5% 6%
Health Care
Shopping Centers
Industrial
REITs
Office
Regional Malls
Self Storage
Apartments
Lodging
Exhibit 17: REIT Subsector Price Performance - MTD -7% -6% -5% -4% -3% -2% -1% 0%
Self Storage
Lodging
Regional Malls
RMZ
Apartments
Office
Health Care
Industrial
Shopping Centers
Exhibit 18: Top 10 REIT Dividend Yields 0% 2% 4% 6% 8% 10% 12% 14%
SBRA
CWH
CDR
STIR
CSA
OHI
HPT
MPW
IRC
GOV
Note: Price performance charts as of November 16, 2011. Dividend yield charts as of November 17, 2011. Source: FactSet, Morgan Stanley Research
12
M O R G A N S T A N L E Y R E S E A R C H
November 18, 2011 Weekly REIT Insights
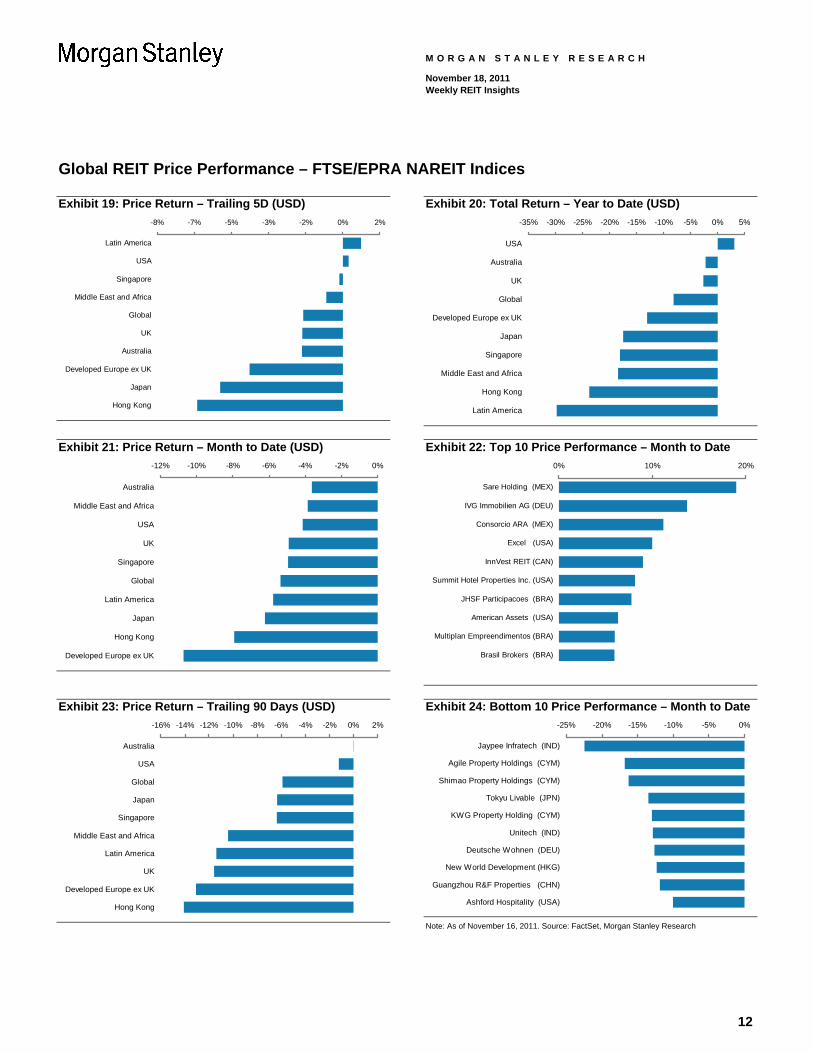
Global REIT Price Performance – FTSE/EPRA NAREIT Indices Exhibit 19: Price Return – Trailing 5D (USD)
-8% -7% -5% -3% -2% 0% 2%
Latin America
USA
Singapore
Middle East and Africa
Global
UK
Australia
Developed Europe ex UK
Japan
Hong Kong
Exhibit 20: Total Return – Year to Date (USD) -35% -30% -25% -20% -15% -10% -5% 0% 5%
USA
Australia
UK
Global
Developed Europe ex UK
Japan
Singapore
Middle East and Africa
Hong Kong
Latin America
Exhibit 21: Price Return – Month to Date (USD) -12% -10% -8% -6% -4% -2% 0%
Australia
Middle East and Africa
USA
UK
Singapore
Global
Latin America
Japan
Hong Kong
Developed Europe ex UK
Exhibit 22: Top 10 Price Performance – Month to Date 0% 10% 20%
Sare Holding (MEX)
IVG Immobilien AG (DEU)
Consorcio ARA (MEX)
Excel (USA)
InnVest REIT (CAN)
Summit Hotel Properties Inc. (USA)
JHSF Participacoes (BRA)
American Assets (USA)
Multiplan Empreendimentos (BRA)
Brasil Brokers (BRA)
Exhibit 23: Price Return – Trailing 90 Days (USD) -16% -14% -12% -10% -8% -6% -4% -2% 0% 2%
Australia
USA
Global
Japan
Singapore
Middle East and Africa
Latin America
UK
Developed Europe ex UK
Hong Kong
Exhibit 24: Bottom 10 Price Performance – Month to Date -25% -20% -15% -10% -5% 0%
Jaypee Infratech (IND)
Agile Property Holdings (CYM)
Shimao Property Holdings (CYM)
Tokyu Livable (JPN)
KWG Property Holding (CYM)
Unitech (IND)
Deutsche Wohnen (DEU)
New World Development (HKG)
Guangzhou R&F Properties (CHN)
Ashford Hospitality (USA)
Note: As of November 16, 2011. Source: FactSet, Morgan Stanley Research
13
M O R G A N S T A N L E Y R E S E A R C H
November 18, 2011 Weekly REIT Insights
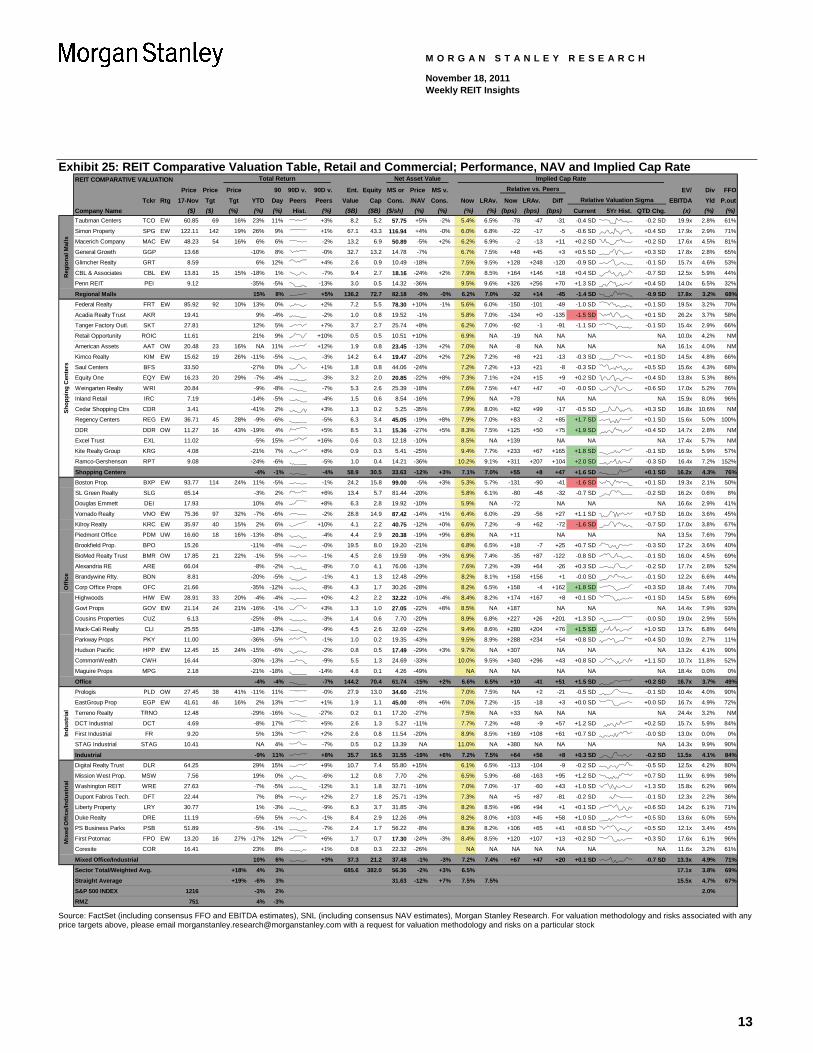
Exhibit 25: REIT Comparative Valuation Table, Retail and Commercial; Performance, NAV and Implied Cap Rate REIT COMPARATIVE VALUATION Total Return Net Asset Value Implied Cap Rate
Price Price Price 90 90D v. 90D v. Ent. Equity MS or Price MS v. Relative vs. Peers EV/ Div FFOTckr Rtg 17-Nov Tgt Tgt YTD Day Peers Peers Value Cap Cons. /NAV Cons. Now LRAv. Now LRAv. Diff Relative Valuation Sigma EBITDA Yld P.out
Company Name ($) ($) (%) (%) (%) Hist. (%) ($B) ($B) ($/sh) (%) (%) (%) (%) (bps) (bps) (bps) Current 5Yr Hist. QTD Chg. (x) (%) (%)Taubman Centers TCO EW 60.85 69 16% 23% 11% +3% 8.2 5.2 57.75 +5% -2% 5.4% 6.5% -78 -47 -31 -0.4 SD -0.2 SD 19.9x 2.8% 61% Simon Property SPG EW 122.11 142 19% 26% 9% +1% 67.1 43.3 116.94 +4% -0% 6.0% 6.8% -22 -17 -5 -0.6 SD +0.4 SD 17.9x 2.9% 71%
Macerich Company MAC EW 48.23 54 16% 6% 6% -2% 13.2 6.9 50.89 -5% +2% 6.2% 6.9% -2 -13 +11 +0.2 SD +0.2 SD 17.6x 4.5% 81%
General Growth GGP 13.68 -10% 8% -0% 32.7 13.2 14.78 -7% 6.7% 7.5% +48 +45 +3 +0.5 SD +0.3 SD 17.8x 2.8% 65%
Glimcher Realty GRT 8.59 6% 12% +4% 2.6 0.9 10.49 -18% 7.5% 9.5% +128 +248 -120 -0.9 SD -0.1 SD 15.7x 4.6% 53%
CBL & Associates CBL EW 13.81 15 15% -18% 1% -7% 9.4 2.7 18.16 -24% +2% 7.9% 8.5% +164 +146 +18 +0.4 SD -0.7 SD 12.5x 5.9% 44%
Penn REIT PEI 9.12 -35% -5% -13% 3.0 0.5 14.32 -36% 9.5% 9.6% +326 +256 +70 +1.3 SD +0.4 SD 14.0x 6.5% 32%
Regional Malls 15% 8% +5% 136.2 72.7 82.18 -0% -0% 6.2% 7.0% -32 +14 -45 -1.4 SD -0.9 SD 17.8x 3.2% 68%Federal Realty FRT EW 85.92 92 10% 13% 0% +2% 7.2 5.5 78.30 +10% -1% 5.6% 6.0% -150 -101 -49 -1.0 SD +0.1 SD 19.5x 3.2% 70%
Acadia Realty Trust AKR 19.41 9% -4% -2% 1.0 0.8 19.52 -1% 5.8% 7.0% -134 +0 -135 -1.5 SD +0.1 SD 26.2x 3.7% 58%
Tanger Factory Outl. SKT 27.81 12% 5% +7% 3.7 2.7 25.74 +8% 6.2% 7.0% -92 -1 -91 -1.1 SD -0.1 SD 15.4x 2.9% 66%
Retail Opportunity ROIC 11.61 21% 9% +10% 0.5 0.5 10.51 +10% 6.9% NA -19 NA NA NA NA 10.0x 4.2% NM
American Assets AAT OW 20.48 23 16% NA 11% +12% 1.9 0.8 23.45 -13% +2% 7.0% NA -8 NA NA NA NA 16.1x 4.0% NM
Kimco Realty KIM EW 15.62 19 26% -11% -5% -3% 14.2 6.4 19.47 -20% +2% 7.2% 7.2% +8 +21 -13 -0.3 SD +0.1 SD 14.5x 4.8% 66%
Saul Centers BFS 33.50 -27% 0% +1% 1.8 0.8 44.06 -24% 7.2% 7.2% +13 +21 -8 -0.3 SD +0.5 SD 15.6x 4.3% 68%
Equity One EQY EW 16.23 20 29% -7% -4% -3% 3.2 2.0 20.85 -22% +8% 7.3% 7.1% +24 +15 +9 +0.2 SD +0.4 SD 13.8x 5.3% 86%
Weingarten Realty WRI 20.84 -9% -8% -7% 5.3 2.6 25.39 -18% 7.6% 7.5% +47 +47 +0 -0.0 SD +0.6 SD 17.0x 5.2% 76%
Inland Retail IRC 7.19 -14% -5% -4% 1.5 0.6 8.54 -16% 7.9% NA +78 NA NA NA 15.9x 8.0% 96%
Cedar Shopping Ctrs CDR 3.41 -41% 2% +3% 1.3 0.2 5.25 -35% 7.9% 8.0% +82 +99 -17 -0.5 SD +0.3 SD 16.8x 10.6% NM
Regency Centers REG EW 36.71 45 28% -9% -6% -5% 6.3 3.4 45.05 -19% +8% 7.9% 7.0% +83 -2 +85 +1.7 SD +0.1 SD 15.6x 5.0% 100%
DDR DDR OW 11.27 16 43% -19% 4% +5% 8.5 3.1 15.36 -27% +5% 8.3% 7.5% +125 +50 +75 +1.9 SD +0.4 SD 14.7x 2.8% NM
Excel Trust EXL 11.02 -5% 15% +16% 0.6 0.3 12.18 -10% 8.5% NA +139 NA NA NA 17.4x 5.7% NM
Kite Realty Group KRG 4.08 -21% 7% +8% 0.9 0.3 5.41 -25% 9.4% 7.7% +233 +67 +165 +1.8 SD -0.1 SD 16.9x 5.9% 57%
Ramco-Gershenson RPT 9.08 -24% -6% -5% 1.0 0.4 14.21 -36% 10.2% 9.1% +311 +207 +104 +2.0 SD -0.3 SD 16.4x 7.2% 152%
Shopping Centers -4% -1% -4% 58.9 30.5 33.63 -12% +3% 7.1% 7.0% +55 +8 +47 +1.6 SD +0.1 SD 16.2x 4.3% 76%Boston Prop. BXP EW 93.77 114 24% 11% -5% -1% 24.2 15.8 99.00 -5% +3% 5.3% 5.7% -131 -90 -41 -1.6 SD +0.1 SD 19.3x 2.1% 50%
SL Green Realty SLG 65.14 -3% 2% +6% 13.4 5.7 81.44 -20% 5.8% 6.1% -80 -48 -32 -0.7 SD -0.2 SD 16.2x 0.6% 8%
Douglas Emmett DEI 17.93 10% 4% +8% 6.3 2.8 19.92 -10% 5.9% NA -72 NA NA NA 16.6x 2.9% 41%
Vornado Realty VNO EW 75.36 97 32% -7% -6% -2% 28.8 14.9 87.42 -14% +1% 6.4% 6.0% -29 -56 +27 +1.1 SD +0.7 SD 16.0x 3.6% 45%
Kilroy Realty KRC EW 35.97 40 15% 2% 6% +10% 4.1 2.2 40.75 -12% +0% 6.6% 7.2% -9 +62 -72 -1.6 SD -0.7 SD 17.0x 3.8% 67%
Piedmont Office PDM UW 16.60 18 16% -13% -8% -4% 4.4 2.9 20.38 -19% +9% 6.8% NA +11 NA NA NA 13.5x 7.6% 79%
Brookfield Prop. BPO 15.26 -11% -4% -0% 19.5 8.0 19.20 -21% 6.8% 6.5% +18 -7 +25 +0.7 SD -0.3 SD 17.2x 3.6% 40%
BioMed Realty Trust BMR OW 17.85 21 22% -1% 5% -1% 4.5 2.6 19.59 -9% +3% 6.9% 7.4% -35 +87 -122 -0.8 SD -0.1 SD 16.0x 4.5% 69%
Alexandria RE ARE 66.04 -8% -2% -8% 7.0 4.1 76.06 -13% 7.6% 7.2% +39 +64 -26 +0.3 SD -0.2 SD 17.7x 2.8% 52%
Brandywine Rlty. BDN 8.81 -20% -5% -1% 4.1 1.3 12.48 -29% 8.2% 8.1% +158 +156 +1 -0.0 SD -0.1 SD 12.2x 6.6% 44%
Corp Office Props OFC 21.66 -35% -12% -8% 4.3 1.7 30.26 -28% 8.2% 6.5% +158 -4 +162 +1.8 SD +0.3 SD 18.4x 7.4% 70%
Highwoods HIW EW 28.91 33 20% -4% -4% +0% 4.2 2.2 32.22 -10% -4% 8.4% 8.2% +174 +167 +8 +0.1 SD +0.1 SD 14.5x 5.8% 69%
Govt Props GOV EW 21.14 24 21% -16% -1% +3% 1.3 1.0 27.05 -22% +8% 8.5% NA +187 NA NA NA 14.4x 7.9% 93%
Cousins Properties CUZ 6.13 -25% -8% -3% 1.4 0.6 7.70 -20% 8.9% 6.8% +227 +26 +201 +1.3 SD -0.0 SD 19.0x 2.9% 55%
Mack-Cali Realty CLI 25.55 -18% -13% -9% 4.5 2.6 32.69 -22% 9.4% 8.6% +280 +204 +76 +1.5 SD +1.0 SD 13.7x 6.8% 64%
Parkway Props PKY 11.00 -36% -5% -1% 1.0 0.2 19.35 -43% 9.5% 8.9% +288 +234 +54 +0.8 SD +0.4 SD 10.9x 2.7% 11%
Hudson Pacific HPP EW 12.45 15 24% -15% -6% -2% 0.8 0.5 17.49 -29% +3% 9.7% NA +307 NA NA NA 13.2x 4.1% 90%
CommonWealth CWH 16.44 -30% -13% -9% 5.5 1.3 24.69 -33% 10.0% 9.5% +340 +296 +43 +0.8 SD +1.1 SD 10.7x 11.8% 52%
Maguire Props MPG 2.18 -21% -18% -14% 4.8 0.1 4.26 -49% NA NA NA NA NA NA 18.4x 0.0% 0%
Office -4% -4% -7% 144.2 70.4 61.74 -15% +2% 6.6% 6.5% +10 -41 +51 +1.5 SD +0.2 SD 16.7x 3.7% 49%Prologis PLD OW 27.45 38 41% -11% 11% -0% 27.9 13.0 34.60 -21% 7.0% 7.5% NA +2 -21 -0.5 SD -0.1 SD 10.4x 4.0% 90%
EastGroup Prop EGP EW 41.61 46 16% 2% 13% +1% 1.9 1.1 45.00 -8% +6% 7.0% 7.2% -15 -18 +3 +0.0 SD +0.0 SD 16.7x 4.9% 72%
Terreno Realty TRNO 12.48 -29% -16% -27% 0.2 0.1 17.20 -27% 7.5% NA +33 NA NA NA NA 24.4x 3.2% NM
DCT Industrial DCT 4.69 -8% 17% +5% 2.6 1.3 5.27 -11% 7.7% 7.2% +48 -9 +57 +1.2 SD +0.2 SD 15.7x 5.9% 84%
First Industrial FR 9.20 5% 13% +2% 2.6 0.8 11.54 -20% 8.9% 8.5% +169 +108 +61 +0.7 SD -0.0 SD 13.0x 0.0% 0%
STAG Industrial STAG 10.41 NA 4% -7% 0.5 0.2 13.39 NA 11.0% NA +380 NA NA NA NA 14.3x 9.9% 90%
Industrial -9% 11% +8% 35.7 16.5 31.55 -19% +6% 7.2% 7.5% +64 +56 +8 +0.3 SD -0.2 SD 11.5x 4.1% 84%Digital Realty Trust DLR 64.25 29% 15% +9% 10.7 7.4 55.80 +15% 6.1% 6.5% -113 -104 -9 -0.2 SD -0.5 SD 12.5x 4.2% 80%
Mission West Prop. MSW 7.56 19% 0% -6% 1.2 0.8 7.70 -2% 6.5% 5.9% -68 -163 +95 +1.2 SD +0.7 SD 11.9x 6.9% 98%
Washington REIT WRE 27.63 -7% -5% -12% 3.1 1.8 32.71 -16% 7.0% 7.0% -17 -60 +43 +1.0 SD +1.3 SD 15.8x 6.2% 96%
Dupont Fabros Tech. DFT 22.44 7% 8% +2% 2.7 1.8 25.71 -13% 7.3% NA +5 +87 -81 -0.2 SD -0.1 SD 12.3x 2.2% 36%
Liberty Property LRY 30.77 1% -3% -9% 6.3 3.7 31.85 -3% 8.2% 8.5% +96 +94 +1 +0.1 SD +0.6 SD 14.2x 6.1% 71%
Duke Realty DRE 11.19 -5% 5% -1% 8.4 2.9 12.26 -9% 8.2% 8.0% +103 +45 +58 +1.0 SD +0.5 SD 13.6x 6.0% 55%
PS Business Parks PSB 51.89 -5% -1% -7% 2.4 1.7 56.22 -8% 8.3% 8.2% +106 +65 +41 +0.8 SD +0.5 SD 12.1x 3.4% 45%
First Potomac FPO EW 13.20 16 27% -17% 12% +6% 1.7 0.7 17.30 -24% -3% 8.4% 8.5% +120 +107 +13 +0.2 SD +0.3 SD 17.6x 6.1% 96%
Coresite COR 16.41 23% 8% +1% 0.8 0.3 22.32 -26% NA NA NA NA NA NA NA 11.6x 3.2% 61%
Mixed Office/Industrial 10% 6% +3% 37.3 21.2 37.48 -1% -3% 7.2% 7.4% +67 +47 +20 +0.1 SD -0.7 SD 13.3x 4.9% 71%
Sector Total/Weighted Avg. +18% 4% 3% 685.6 382.0 56.36 -2% +3% 6.5% 17.1x 3.8% 69%
Straight Average +19% -6% 3% 31.63 -12% +7% 7.5% 7.5% 15.5x 4.7% 67%
S&P 500 INDEX 1216 -3% 2% 2.0%
RMZ 751 4% -3%
Indu
stria
lM
ixed
Offi
ce/In
dust
rial
Shop
ping
Cen
ters
Offi
ceR
egio
nal M
alls
Source: FactSet (including consensus FFO and EBITDA estimates), SNL (including consensus NAV estimates), Morgan Stanley Research. For valuation methodology and risks associated with any price targets above, please email [email protected] with a request for valuation methodology and risks on a particular stock

14
M O R G A N S T A N L E Y R E S E A R C H
November 18, 2011 Weekly REIT Insights
Exhibit 26: REIT Comparative Valuation Table, Retail and Commercial; FFO and Leverage Parameters REIT COMPARATIVE VALUATION Funds from Operations (FFO) Leverage Parameters Short Int.
Price 11E MS/ MS v 12E MS/ MS v Growth Multiple Relative vs. Peers Debt / Debt/ S.Debt/ Fxd % of 2wkTckr 17-Nov Cons. Cons. Cons. Cons. 11E 12E 11E 12E LRAvg Now LRAvg Diff Relative Valuation Sigma EBITDA GAV Assets Chg S/O Chg
Company Name ($) ($/sh) ($/sh) ($/sh) ($/sh) (%) (%) (x) (x) (x) (%) (%) (%) Current 5Yr Hist. QTD Chg. (x) (%) (%) (x) (%) (bps)Taubman Centers TCO 60.85 2.70 (0.01) 2.94 (0.11) -2% 9% 22.5x 20.7x 15.7x +32% +18% +14% +1.0 SD +0.5 SD 7.3x 38% 67% 2.4x 5% -41
Simon Property SPG 122.11 6.86 0.00 7.35 0.10 37% 7% 17.8x 16.6x 14.1x +4% +6% -2% +0.3 SD -0.2 SD 6.5x 37% 19% 3.1x 4% -66
Macerich Company MAC 48.23 2.87 0.27 3.16 0.01 5% 11% 16.8x 15.3x 13.2x -2% -7% +5% +0.1 SD +0.0 SD 8.8x 47% 35% 2.5x 6% -23
General Growth GGP 13.68 0.92 0.97 53% 5% 14.9x 14.1x 10.5x -13% -1% -12% NA NA 11.1x 58% 55% 1.3x 2% -4
Glimcher Realty GRT 8.59 0.46 0.74 -38% 61% 18.7x 11.6x 7.5x +9% -48% +58% +1.0 SD +0.3 SD 11.3x 59% 52% 1.6x 6% +2
CBL & Associates CBL 13.81 1.89 (0.03) 2.00 (0.04) 13% -9% 7.3x 6.9x 6.9x -57% -51% -6% -0.4 SD +0.3 SD 9.0x 66% 52% 2.2x 12% +69
Penn REIT PEI 9.12 0.86 1.74 -54% 102% 10.6x 5.2x 6.7x -38% -53% +15% -0.9 SD +0.1 SD 11.8x 75% 55% 1.8x 7% +103
Regional Malls 31% 8% 17.1x 15.8x 13.1x +0% -11% +14% +1.6 SD +0.5 SD 7.8x 44% 32% 2.6x 4% -42Federal Realty FRT 85.92 4.04 0.01 4.16 (0.03) 3% 3% 21.3x 20.7x 19.4x +36% +35% +2% +0.6 SD -0.0 SD 4.7x 26% 11% 3.7x 6% -36
Acadia Realty Trust AKR 19.41 0.96 1.06 -22% 10% 20.2x 18.3x 17.7x +30% +23% +6% +0.5 SD -0.4 SD 4.7x 28% 47% 2.3x 8% -7
Tanger Factory Outl. SKT 27.81 1.44 1.60 19% 11% 19.3x 17.4x 15.7x +24% +10% +14% +0.4 SD -0.2 SD 5.3x 28% 5% 4.1x 8% +92
Retail Opportunity ROIC 11.61 0.12 0.22 -12% 83% NM NM NA NA NA NA NA NA 0.7x 6% 10% 3.7x 6% -31
American Assets AAT 20.48 1.09 (0.03) 1.25 (0.04) NM 15% 18.8x 16.4x NA +21% NA NA NA NA 7.2x 39% 48% 2.1x 3% -13
Kimco Realty KIM 15.62 1.20 0.01 1.25 (0.00) 3% 3% 13.0x 12.5x 13.4x -17% -9% -8% -0.4 SD +0.2 SD 8.1x 50% 10% 2.5x 5% +4
Saul Centers BFS 33.50 2.06 2.37 -3% 15% 16.3x 14.1x +4% NA NA NA 9.0x 49% 55% 1.7x 2% +9
Equity One EQY 16.23 1.03 (0.33) 1.11 0.03 26% -17% 15.8x 14.6x 15.7x +1% +10% -9% -0.7 SD +0.5 SD 5.1x 31% 17% 2.6x 5% -77
Weingarten Realty WRI 20.84 1.63 1.85 15% 13% 12.8x 11.3x 11.6x -18% -21% +3% -0.4 SD -0.4 SD 7.6x 47% 18% 1.9x 8% -82
Inland Retail IRC 7.19 0.81 0.86 35% 6% 8.9x 8.4x 10.1x -43% -30% -13% -2.4 SD -0.7 SD 9.8x 57% 29% 2.4x 4% -7
Cedar Shopping Ctrs CDR 3.41 -0.09 0.43 NM NM NM 7.9x NA NA NA NA 12.1x 74% 49% 1.6x 5% -1
Regency Centers REG 36.71 2.42 0.04 2.50 (0.03) 32% 6% 15.2x 14.7x 15.3x -3% +6% -8% -0.9 SD -0.0 SD 7.5x 42% 9% 2.3x 9% +46
DDR DDR 11.27 1.00 0.03 1.03 (0.01) NM 44% 11.3x 10.9x 10.4x -28% -33% +5% +0.4 SD +0.0 SD 9.4x 56% 20% 1.8x 6% +50
Excel Trust EXL 11.02 0.92 1.09 NM 18% 12.0x 10.1x -23% NA NA NA 8.2x 41% 39% 1.9x 7% -25
Kite Realty Group KRG 4.08 0.43 0.47 2% 9% 9.5x 8.7x 10.2x -39% -32% -7% -0.7 SD +0.1 SD 10.5x 63% 40% 2.0x 3% -8
Ramco-Gershenson RPT 9.08 0.95 0.96 121% 1% 9.6x 9.5x 9.3x -39% -38% -0% +0.3 SD +0.5 SD 10.1x 52% 26% 2.0x 8% +27
Shopping Centers 13% 10% 15.6x 14.4x 14.0x -8% -2% -4% -0.9 SD -0.8 SD 7.0x 41% 17% 2.7x 6% -0Boston Prop. BXP 93.77 4.81 (0.02) 5.03 0.22 26% 0% 19.5x 18.6x 18.4x +37% +25% +12% +1.8 SD +0.6 SD 7.6x 36% 19% 2.9x 7% +1
SL Green Realty SLG 65.14 4.81 4.33 -1% -10% 13.5x 15.0x 15.1x -5% -3% -2% +0.4 SD +0.2 SD 11.7x 53% 29% 1.9x 7% -12
Douglas Emmett DEI 17.93 1.37 1.39 10% 1% 13.1x 12.9x 14.7x -8% -1% -7% -0.3 SD -0.3 SD 10.7x 55% 50% 2.4x 11% +88
Vornado Realty VNO 75.36 6.08 0.02 5.38 (0.10) 0% -12% 12.4x 14.0x 15.1x -13% +4% -17% -0.9 SD -0.3 SD 8.2x 46% 37% 2.2x 4% -44
Kilroy Realty KRC 35.97 2.22 (0.01) 2.47 0.00 8% 11% 16.2x 14.6x 15.2x +14% +3% +11% -0.3 SD +0.5 SD 7.8x 43% 12% 2.2x 7% +17
Piedmont Office PDM 16.60 1.55 0.00 1.40 (0.07) -1% -10% 10.7x 11.9x -25% NA NA NA 4.8x 30% 25% 4.9x 6% -40
Brookfield Prop. BPO 15.26 1.12 1.13 -18% 1% 13.6x 13.5x 12.4x -4% -18% +14% +1.4 SD +0.5 SD 9.8x 54% 33% NA 1% -13
BioMed Realty Trust BMR 17.85 1.20 0.01 1.30 0.01 3% 9% 14.9x 13.7x 12.6x +5% -14% +19% +1.0 SD -0.0 SD 6.9x 40% 14% 2.4x 9% +134
Alexandria RE ARE 66.04 4.40 4.59 25% 4% 15.0x 14.4x 14.6x +6% +0% +5% -0.0 SD -0.0 SD 8.3x 39% 11% 4.2x 2% +17
Brandywine Rlty. BDN 8.81 1.38 1.38 3% 0% 6.4x 6.4x 8.0x -55% -47% -8% -0.7 SD +0.2 SD 8.4x 60% 9% 2.2x 8% +35
Corp Office Props OFC 21.66 1.21 2.14 -47% 77% 17.9x 10.1x 15.2x +26% +7% +19% -1.6 SD +0.1 SD 10.3x 53% 25% 2.3x 5% -5
Highwoods HIW 28.91 2.48 (0.04) 2.65 (0.03) 2% 7% 11.6x 10.9x 12.6x -18% -11% -7% -1.1 SD -0.3 SD 7.1x 46% 23% 2.6x 10% -19
Govt Props GOV 21.14 2.01 (0.00) 1.98 (0.02) 2% -1% 10.5x 10.7x -26% NA NA NA 3.6x 20% 3% 7.9x 4% -26
Cousins Properties CUZ 6.13 0.43 0.49 34% 14% 14.3x 12.5x 18.2x +0% +24% -23% -1.2 SD -0.0 SD 9.7x 50% 22% 2.2x 4% +6
Mack-Cali Realty CLI 25.55 2.77 2.68 2% -3% 9.2x 9.5x 10.8x -35% -25% -10% -1.0 SD -0.6 SD 4.9x 37% 13% 3.2x 4% +85
Parkway Props PKY 11.00 1.49 2.19 -44% 47% 7.4x 5.0x 8.0x -48% -46% -2% -1.7 SD +0.0 SD 6.2x 66% 49% 1.9x 9% -10
Hudson Pacific HPP 12.45 1.03 (0.06) 1.12 (0.19) 61% 7% 12.1x 11.1x -15% NA NA NA 6.4x 37% 29% NA 4% -28
CommonWealth CWH 16.44 3.45 3.38 -8% -2% 4.8x 4.9x 6.9x -67% -53% -13% -2.5 SD -1.2 SD 9.0x 68% 8% 1.9x 2% -36
Maguire Props MPG 2.18 1.92 -0.56 NM NM 1.1x NM -92% NA NA NA 24.3x 95% 103% 0.8x 10% -75
Office 6% -1% 14.2x 14.2x 13.9x -16% -2% -6% -0.5 SD +0.0 SD 8.3x 45% 26% 2.8x 5% -2Prologis PLD 27.45 1.00 (0.36) 1.67 0.01 109% 32% 27.6x 16.4x 17.0x +14% +12% +2% -0.8 SD +0.1 SD 9.0x 48% 11% 2.7x 3% -33
EastGroup Prop EGP 41.61 3.11 0.15 3.28 0.17 3% 6% 13.4x 12.7x 13.5x -45% -7% -37% -0.3 SD -0.1 SD 6.8x 39% 38% 3.3x 7% -32
Terreno Realty TRNO 12.48 -0.52 -0.08 NM NM NM NM NA NA NA NA NA NA NA NA 26% 2.4x 4% -10
DCT Industrial DCT 4.69 0.37 0.38 12% 3% 12.7x 12.3x 12.7x -48% -14% -33% -0.4 SD -0.3 SD 8.4x 49% 9% 2.4x 7% -84
First Industrial FR 9.20 0.86 0.85 NM -1% 10.7x 10.8x 7.7x -56% -50% -6% +1.3 SD +0.2 SD 9.1x 63% 21% 1.5x 5% -20
STAG Industrial STAG 10.41 1.04 1.10 -9% 6% 10.0x 9.5x NA -59% NA NA NA NA NA NA 56% 2.3x 6% -1
Industrial 92% 26% 24.2x 15.4x 15.9x +42% +3% -2% -0.3 SD +0.2 SD 8.8x 48% 14% 2.6x 4% -36Digital Realty Trust DLR 64.25 4.04 4.41 19% 9% 15.9x 14.6x 15.7x +17% +22% -5% -0.9 SD +0.2 SD 5.3x 34% 15% 3.7x 14% +53
Mission West Prop. MSW 7.56 0.54 0.55 2% 2% 14.0x 13.7x 16.0x +3% +25% -22% -0.8 SD -0.9 SD 4.6x 30% 30% 3.5x 3% -1
Washington REIT WRE 27.63 1.92 1.99 7% 4% 14.4x 13.9x 14.4x +6% +12% -6% -0.6 SD -1.0 SD 6.6x 37% 16% 2.6x 9% +127
Dupont Fabros Tech. DFT 22.44 1.60 1.81 20% 13% 14.0x 12.4x +3% NA NA NA 4.8x 30% 5% 4.7x 18% -217
Liberty Property LRY 30.77 2.57 2.61 -3% 2% 12.0x 11.8x 11.5x -12% -12% -0% +0.9 SD -0.2 SD 6.1x 41% 5% 3.4x 3% -3
Duke Realty DRE 11.19 1.13 1.09 -8% -4% 9.9x 10.3x 10.2x -27% -23% -4% +0.3 SD +0.3 SD 9.2x 63% 13% 1.8x 5% +80
PS Business Parks PSB 51.89 4.72 4.50 22% -5% 11.0x 11.5x 12.7x -19% -1% -18% -1.8 SD -1.2 SD 4.1x 31% 2% 4.1x 3% -22
First Potomac FPO 13.20 0.88 (0.17) 1.12 (0.01) 5% 27% 14.9x 11.7x 11.1x +10% -27% +37% +0.1 SD -0.4 SD 10.6x 52% 25% 1.9x 5% -10
Coresite COR 16.41 1.21 1.35 42% 12% 13.6x 12.2x NA -0% NA NA NA NA NA NA 14% 18.8x 4% -13
Mixed Office/Industrial 10% 5% 13.6x 12.8x 12.3x -20% -12% -4% -0.9 SD +0.2 SD 6.1x 39% 12% 3.6x 9% +19
Sector Total/Weighted Avg. 20% 10% 17.0x 15.3x 14.2x 7.2x 40% 21% 3.1x 6% -11
Straight Average 13% 17% 14.7x 13.2x 13.4x 7.8x 45% 26% 3.2x 6% -2
S&P 500 INDEX SPX
Indu
stria
lO
ffice
Reg
iona
l Mal
lsM
ixed
Offi
ce/In
dust
rial
Shop
ping
Cen
ters
Source: FactSet (including consensus FFO and EBITDA estimates), SNL (including consensus NAV estimates), Morgan Stanley Research. For valuation methodology and risks associated with any price targets above, please email [email protected] with a request for valuation methodology and risks on a particular stock

15
M O R G A N S T A N L E Y R E S E A R C H
November 18, 2011 Weekly REIT Insights
Exhibit 27: REIT Comparative Valuation Table, Residential and Other; Performance, NAV and Implied Cap Rate REIT COMPARATIVE VALUATION Total Return Net Asset Value Implied Cap Rate
Price Price Price 90 90D v. 90D v. Ent. Equity MS or Price MS v. Relative vs. Peers EV/ Div FFORtg 17-Nov Tgt Tgt YTD Day Peers Peers Value Cap Cons. /NAV Cons. Now LRAv. Now LRAv. Diff Relative Valuation Sigma EBITDA Yld P.out
Company Name ($) ($) (%) (%) (%) Hist. (%) ($B) ($B) ($/sh) (%) (%) (%) (%) (bps) (bps) (bps) Current 5Yr Hist. QTD Chg. (x) (%) (%)AvalonBay AVB 122.29 11% -4% +1% 14.3 11.6 122.93 -1% 4.9% 5.8% -70 -42 -28 -0.6 SD -0.2 SD 22.3x 2.8% 87%
Essex Property ESS OW 130.65 163 28% 17% -3% +2% 7.0 4.7 139.45 -6% +10% 5.0% 5.5% -63 -69 +6 +0.2 SD -0.1 SD 23.4x 3.1% 75%
BRE Properties BRE OW 46.76 56 23% 10% -1% +5% 5.3 3.5 51.15 -9% +7% 5.2% 6.1% -43 -13 -30 -0.6 SD -0.4 SD 22.4x 3.1% 93%
Equity Residential EQR 54.36 7% -6% -0% 25.9 16.8 55.57 -2% 5.3% 5.8% -36 -40 +5 +0.6 SD +0.4 SD 20.0x 2.4% 63%
UDR UDR 23.39 3% -6% -1% 9.7 5.3 24.66 -5% 5.4% 6.1% -29 -10 -19 -0.3 SD +0.1 SD 24.2x 3.3% 71%
MAA MAA EW 58.30 72 28% -4% -12% -6% 3.9 2.3 65.71 -11% +4% 6.2% 6.6% +51 +43 +8 +0.2 SD +0.5 SD 18.0x 4.2% 69%
Post Properties PPS 39.32 10% 0% +5% 3.1 2.0 44.39 -11% 6.2% 6.9% +56 +75 -19 -0.3 SD -0.7 SD 18.7x 2.2% 71%
Camden Property CPT 57.86 10% -8% -2% 7.2 4.4 62.83 -8% 6.4% 6.9% +78 +67 +11 +0.6 SD +0.1 SD 17.6x 3.3% 70%
Home Properties HME EW 55.01 66 24% 3% -12% -6% 5.5 3.2 65.29 -16% +2% 6.5% 6.7% +90 +49 +41 +0.7 SD +0.6 SD 17.3x 4.4% 78%
AIMCO AIV EW 21.90 28 30% -14% -10% -5% 7.7 2.8 31.53 -31% +12% 7.2% 7.3% +160 +112 +48 +1.5 SD +0.7 SD 14.5x 2.1% 34%
Associated Estates AEC 16.30 11% -1% +4% 1.3 0.7 20.70 -21% 7.4% 8.7% +179 +252 -73 -1.1 SD +0.0 SD 13.2x 4.1% 78%
Colonial Properties CLP 19.03 9% -3% +2% 3.6 1.8 22.26 -15% 8.8% 8.5% +315 +229 +85 +1.2 SD -0.0 SD 16.3x 3.1% 57%
Apartments 7% -5% -8% 94.5 59.3 70.83 -7% +7% 5.6% 6.2% -91 -71 -20 -0.4 SD +0.2 SD 20.3x 2.9% 71%
American Campus ACC 38.93 27% 6% +11% 4.0 2.8 33.98 +15% 4.5% 5.3% -118 -18 -100 -1.1 SD -0.2 SD 16.4x 3.4% 82%
Education Realty EDR 9.19 22% 11% +17% 0.9 0.7 9.18 +0% 5.9% 6.4% +29 +89 -60 +0.4 SD -0.2 SD 19.2x 3.0% NM
Student Housing 26% 7% +4% 4.9 3.5 29.21 +12% 4.7% 5.5% -180 -141 -40 -0.6 SD +0.4 SD 17.0x 3.4% 82%Equity Lifestyle ELS 61.89 13% -3% -2% 4.4 2.4 63.69 -3% 6.9% NA -20 NA NA NA 13.3x 2.4% 43%
Sun Communities SUI 36.11 16% 4% +5% 2.2 0.8 32.42 +11% 7.8% NA +62 NA NA NA 13.1x 6.9% 85%
Manu. Homes 14% -1% -4% 6.6 3.2 56.06 +1% 7.1% NA +59 NA NA NA NA 12.2x 3.5% 53%
Universal Health UHT 35.95 3% 3% -1% 0.6 0.5 34.50 +4% 5.7% NA -109 NA NA NA NA 25.4x 6.6% 90%
HCP HCP EW 37.38 40 12% 7% 8% +4% 23.4 15.2 29.16 +28% -0% 6.3% 6.4% -56 -70 +14 +0.4 SD -0.1 SD 17.0x 5.0% 93%
Ventas Inc. VTR 51.46 1% 3% -1% 22.2 14.8 39.91 +29% 6.4% 7.0% -44 -13 -31 -1.5 SD +0.4 SD 21.7x 4.4% 84%
National Health Inv. NHI 42.43 -2% -1% -5% 1.2 1.2 33.91 +25% 6.8% 8.1% -5 +103 -108 -0.9 SD +0.2 SD 14.2x 5.8% 87%
Healthcare Realty HR 17.05 -14% 6% +2% 2.8 1.3 17.82 -4% 6.8% 6.3% -3 -79 +76 +1.4 SD +1.1 SD 16.1x 7.0% 104%
Health Care REIT HCN EW 48.80 53 14% 9% 3% -1% 13.9 8.7 42.99 +14% +5% 7.1% 7.1% +28 -6 +35 +0.9 SD +0.3 SD 14.2x 5.7% 91%
LTC Properties LTC 28.24 6% 15% +11% 1.0 0.9 25.41 +11% 7.9% 8.4% +104 +129 -25 -0.7 SD -1.3 SD 12.1x 5.9% 90%
Senior Housing Prop. SNH EW 21.44 24 19% 4% -2% -6% 4.9 3.3 23.73 -10% +8% 8.3% 8.6% +142 +148 -6 -0.1 SD +0.6 SD 13.6x 7.0% 88%
Cogdell Spencer CSA 3.96 -28% 3% -2% 0.8 0.2 5.59 -29% 8.7% 8.1% +188 +99 +89 +0.6 SD +0.5 SD 15.3x 9.8% NM
Medical Props Trust MPW 9.59 -6% -2% -6% 1.7 1.1 8.30 +16% 8.9% 8.3% +210 +119 +91 +1.0 SD +0.6 SD 11.3x 8.2% NM
Omega Healthcare OHI 17.12 -18% 2% -2% 3.1 1.8 14.33 +19% 9.6% 8.3% +281 +120 +161 +2.0 SD -0.2 SD 12.3x 9.2% 111%
Sabra Health Care SBRA 10.23 -40% -4% -9% 0.7 0.4 17.02 -40% NA NA NA NA NA NA NA NA 12.5% NM
Healthcare 3% 4% +1% 76.3 49.3 33.07 +20% +2% 6.8% 7.0% +29 +14 +15 +0.3 SD +0.0 SD 17.3x 5.5% 90%
Public Storage PSA UW 123.45 115 -4% 25% 6% -0% 24.2 21.1 92.56 +33% -2% 5.1% 6.9% -38 -15 -22 -1.4 SD +0.3 SD 22.1x 3.1% 80%
Extra Space Storage EXR EW 22.87 23 3% 34% 13% +7% 3.5 2.3 20.83 +10% +7% 6.8% 7.6% +137 +58 +79 +0.8 SD -0.5 SD 21.4x 2.4% 60%
Sovran Self Storage SSS 41.12 17% 8% +2% 1.9 1.2 41.60 -1% 6.9% 7.8% +150 +82 +68 +1.1 SD +0.2 SD 14.2x 4.3% 73%
CubeSmart CUBE 9.54 3% -5% -11% 1.6 1.0 10.20 -6% 8.6% NA +318 NA NA NA NA 14.0x 2.9% 54%
Storage 24% 6% +3% 31.2 25.5 80.68 +28% -1% 5.4% 7.0% -111 +5 -116 -1.7 SD -0.4 SD 21.4x 3.1% 77%
Realty Income Corp O 33.36 2% 1% -4% 6.6 4.4 27.57 +21% 6.3% NA -66 NA NA NA 14.5x 5.2% 95%
National Retail Props NNN 26.26 5% 5% -1% 3.9 2.5 24.26 +8% 6.6% NA -35 NA NA NA 15.6x 5.8% 117%
Entertainment Props EPR 44.23 0% 15% +10% 3.6 2.1 42.36 +4% 8.2% NA +127 NA NA NA 14.6x 6.3% 93%
CapLease LSE 3.92 -30% 11% +5% 1.5 0.3 5.90 -34% 11.4% NA +440 NA NA NA NA 6.6% 49%
Triple Net 1% 6% +3% 15.6 9.3 29.36 +12% 7.0% NA +42 NA NA NA NA 14.9x 5.7% 99%Host Hotels HST OW 13.54 14 4% -24% 28% +5% 16.0 9.6 21.00 -36% +24% 8.0% 8.1% -84 -79 NA NA NA 16.1x 1.1% 23%
LaSalle Hotel Props LHO EW 22.62 20 -10% -13% 45% +22% 3.3 1.9 30.00 -25% +15% 8.1% 8.7% -79 -14 NA NA NA 14.6x 1.9% 53%
Diamondrock Hosp. DRH EW 8.64 8 -4% -26% 20% -3% 2.4 1.4 12.00 -28% +18% 8.3% 8.3% -52 -60 NA NA NA 14.3x 3.6% 57%
Strategic Hotels BEE OW 4.99 7 30% -6% 17% -6% 2.7 0.9 8.00 -38% +31% 8.5% 8.8% -37 -6 NA NA NA 14.4x 0.0% 0%
Hersha Hospitality HT EW 4.27 5 11% -33% 14% -9% 1.8 0.7 6.00 -29% +12% 9.2% 9.3% +28 +45 NA NA NA 13.2x 5.5% 65%
Ashford Hospitality AHT OW 7.27 10 43% -22% 1% -22% 4.3 0.5 14.00 -48% +33% 9.3% 9.3% +42 +42 NA NA NA 11.1x 5.5% 27%
Sunstone Hotel Inv SHO EW 7.34 6 -16% -29% 40% +17% 2.9 0.9 12.00 -39% +16% 9.5% 8.1% +67 -80 NA NA NA 10.2x 0.0% 0%
Hospitality Prop. HPT EW 21.05 24 23% -2% -3% -26% 5.3 2.6 28.00 -25% +6% 12.6% 11.7% +370 +284 NA NA NA 9.5x 8.3% 54%
FelCor Lodging FCH 2.99 -58% 16% -7% 2.4 0.4 3.81 -22% NA NA NA NA NA NA NA 11.6x 0.0% 0%
Pebblebrook Trust PEB 18.44 -7% 26% +3% 1.6 0.9 18.27 +1% NA NA NA NA NA NA NA 7.2x 2.6% NM
Chesapeake Lodging CHSP 14.71 -19% 20% -3% 0.7 0.5 18.00 -18% NA NA NA NA NA NA NA 6.8x 5.4% NM
Chatham Lodging CLDT 10.71 -35% 9% -14% 0.3 0.1 11.02 -3% NA NA NA NA NA NA NA 6.5x 6.5% 131%
Summit INN 8.25 NA 17% -6% 0.5 0.2 8.41 -2% NA NA NA NA NA NA NA NA 5.4% 108%
Lodging -20% 23% +20% 44.2 20.7 19.71 -30% +20% 8.9% 8.8% +232 +187 NA NA NA 13.6x 2.7% 34%
Sector Total/Weighted Avg. 18% 4% 3% 685.6 382.0 56.36 -2% +3% 6.5% 17.1x 3.8% 69%
Straight Average +19% -6% 3% 31.63 -12% +7% 7.5% 7.5% 15.5x 4.7% 67%
S&P 500 INDEX 1216 -3% 2% 2.0%
RMZ 751 4% -3%
Hea
lthca
reM
anu.
HA
part
men
tsSt
uden
t H.
Lodg
ing
Stor
age
Trip
le N
et
Source: FactSet (including consensus FFO and EBITDA estimates), SNL (including consensus NAV estimates), Morgan Stanley Research. For valuation methodology and risks associated with any price targets above, please email [email protected] with a request for valuation methodology and risks on a particular stock

16
M O R G A N S T A N L E Y R E S E A R C H
November 18, 2011 Weekly REIT Insights
Exhibit 28: REIT Comparative Valuation Table, Residential and Other; FFO and Leverage Parameters REIT COMPARATIVE VALUATION Funds from Operations (FFO) Leverage Parameters Short Int.
Price 11E MS/ MS v 12E MS/ MS v Growth Multiple Relative vs. Peers Debt / Debt/ S.Debt/ Fxd % of 2wkTckr 17-Nov Cons. Cons. Cons. Cons. 11E 12E 11E 12E LRAvg Now LRAvg Diff Relative Valuation Sigma EBITDA GAV Assets Chg S/O Chg
Company Name ($) ($/sh) ($/sh) ($/sh) ($/sh) (%) (%) (x) (x) (x) (%) (%) (%) Current 5Yr Hist. QTD Chg. (x) (%) (%) (x) (%) (bps)AvalonBay AVB 122.29 4.61 5.44 15% 18% 26.5x 22.5x 21.4x +24% +22% +2% -0.6 SD +0.2 SD 5.8x 23% 21% 3.4x 10% -19
Essex Property ESS 130.65 5.71 0.01 6.49 0.02 7% 14% 22.9x 20.1x 19.2x +7% +10% -3% -0.5 SD +0.1 SD 8.2x 33% 40% 2.9x 8% 13
BRE Properties BRE 46.76 2.16 0.02 2.39 0.01 35% 10% 21.6x 19.6x 18.2x +1% +3% -2% +0.2 SD +0.6 SD 7.4x 31% 20% 3.1x 5% 56
Equity Residential EQR 54.36 2.43 2.78 17% 14% 22.4x 19.6x 17.9x +4% +2% +2% +1.7 SD +0.2 SD 7.3x 34% 21% 2.6x 5% 18
UDR UDR 23.39 1.27 1.42 17% 12% 18.4x 16.5x 15.1x -14% -14% -0% +0.2 SD -0.0 SD 10.9x 44% 24% 2.6x 3% -12
MAA MAA 58.30 3.97 (0.02) 4.39 0.03 11% 10% 14.7x 13.3x 13.8x -31% -20% -12% -1.3 SD -0.7 SD 7.6x 39% 43% 3.4x 5% -48
Post Properties PPS 39.32 1.89 2.02 56% 7% 20.8x 19.5x 19.6x -3% +12% -15% -1.0 SD +0.2 SD 7.2x 32% 22% 2.5x 7% -28
Camden Property CPT 57.86 2.71 3.41 0% 26% 21.4x 17.0x 15.4x -0% -12% +12% +0.3 SD -0.5 SD 8.0x 37% 17% 3.1x 5% 35
Home Properties HME 55.01 3.49 0.00 3.79 0.00 12% 9% 15.8x 14.5x 15.1x -26% -12% -14% -1.2 SD -0.7 SD 7.1x 37% 48% 2.4x 8% 138
AIMCO AIV 21.90 1.49 0.05 1.83 0.05 3% 23% 14.7x 12.0x 12.4x -31% -32% +0% -0.1 SD -0.2 SD 9.7x 56% 53% 1.7x 8% -37
Associated Estates AEC 16.30 1.04 1.23 22% 18% 15.7x 13.3x 11.5x -27% -36% +9% +0.8 SD +0.0 SD 8.4x 42% 35% 2.4x 6% 98
Colonial Properties CLP 19.03 1.16 1.26 14% 9% 16.4x 15.1x 12.1x -23% -33% +10% +0.9 SD -0.1 SD 9.2x 46% 18% 2.0x 6% -19
Apartments 16% 15% 21.4x 18.6x 17.5x +26% +18% +4% +1.0 SD -0.2 SD 7.6x 35% 26% 2.8x 6% 11
American Campus ACC 38.93 1.79 1.95 9% 9% 21.7x 20.0x 18.1x -1% +5% -6% -1.6 SD -0.4 SD 6.4x 33% 33% 2.7x 8% 7
Education Realty EDR 9.19 0.40 0.47 NM 18% 23.0x 19.6x 14.0x +5% -21% +25% +1.2 SD +0.3 SD 5.9x 27% 34% 1.1x 7% -23
Student Housing 7% 11% 22.0x 19.9x 0.0x +29% +18% +16% +0.9 SD -1.0 SD 6.8x 35% 36% 2.6x 9% 1
Equity Lifestyle ELS 61.89 3.44 4.46 -1% 30% 18.0x 13.9x +10% NA NA NA 8.2x 47% 47% 1.9x 4% -46
Sun Communities SUI 36.11 3.15 3.39 8% 8% 11.5x 10.7x -30% NA NA NA 9.8x 67% 68% 2.1x 6% -13
Manu. Homes 1% 24% 16.4x 13.1x 13.8x -4% +10% -23% NA NA 8.6x 52% 52% 1.9x 5% -38
Universal Health UHT 35.95 2.52 2.55 -5% 1% 14.3x 14.1x NA -3% NA NA NA NA 5.3x 20% 5% 8.2x 4% 6
HCP HCP 37.38 2.54 0.02 2.79 (0.01) 22% 10% 14.7x 13.4x 14.3x +0% +1% -1% -0.1 SD +0.3 SD 6.0x 41% 10% 3.5x 8% -47
Ventas Inc. VTR 51.46 3.24 3.61 21% 11% 15.9x 14.3x 15.3x +8% +8% -0% +0.2 SD -0.7 SD 7.4x 39% 15% 4.3x 6% -37
National Health Inv. NHI 42.43 2.92 3.08 4% 5% 14.5x 13.8x -1% NA NA NA 0.8x 7% 0% 33.8x 3% -26
Healthcare Realty HR 17.05 1.14 1.31 0% 15% 15.0x 13.0x 15.9x +2% +13% -11% -1.7 SD -0.1 SD 9.0x 51% 7% 2.3x 6% -14
Health Care REIT HCN 48.80 3.39 0.04 3.81 0.03 10% 12% 14.4x 12.8x 13.5x -2% -3% +2% +0.4 SD -0.1 SD 8.2x 51% 13% 2.4x 8% 31
LTC Properties LTC 28.24 2.14 2.29 17% 7% 13.2x 12.3x 12.6x -10% -10% -0% +0.4 SD +0.8 SD 2.4x 19% 0% 7.4x 4% -46
Senior Housing Prop. SNH 21.44 1.75 (0.01) 1.84 (0.05) 4% 5% 12.3x 11.7x 12.3x -17% -13% -4% -0.8 SD -1.5 SD 4.6x 32% 16% 3.6x 2% 1
Cogdell Spencer CSA 3.96 0.30 0.41 NM 37% 13.2x 9.7x -10% NA NA NA 12.3x 63% 54% 2.0x 5% 4
Medical Props Trust MPW 9.59 0.74 0.90 100% 22% 13.0x 10.7x 10.5x -12% -26% +15% +0.5 SD -0.2 SD 6.1x 44% 1% 1.4x 5% -20
Omega Healthcare OHI 17.12 1.78 1.93 25% 8% 9.6x 8.9x 11.5x -34% -17% -17% -1.9 SD +0.1 SD 4.9x 47% 7% 3.3x 9% 89
Sabra Health Care SBRA 10.23 0.39 0.43 NM 10% 26.2x 23.8x NA +79% NA NA NA NA NA NA 18% 2.2x 4% -36
Healthcare 19% 11% 14.7x 13.3x 11.7x -14% -3% -12% -1.1 SD -0.2 SD 6.6x 41% 12% 4.3x 6% -19
Public Storage PSA 123.45 5.84 0.01 6.15 (0.07) 24% 5% 21.1x 20.1x 17.4x +2% +3% -1% +0.4 SD -0.2 SD 3.0x 17% 2% 4.6x 3% 2
Extra Space Storage EXR 22.87 1.11 (0.04) 1.27 (0.02) 22% 14% 20.6x 18.1x 14.6x -0% -15% +14% +0.4 SD +0.4 SD 7.9x 38% NA 2.9x 7% 3
Sovran Self Storage SSS 41.12 2.43 2.93 -1% 21% 16.9x 14.0x 13.3x -18% -21% +3% -0.8 SD -0.4 SD 6.6x 38% 5% 3.0x 4% 30
CubeSmart YSI 9.54 0.62 0.69 22% 11% 15.4x 13.8x NA -26% NA NA NA NA 5.7x 38% 19% 2.9x NA NA
Storage 22% 7% 20.7x 19.4x 14.2x +21% +16% +8% +0.6 SD +0.0 SD 3.7x 21% 3% 4.3x 3% 3
Realty Income Corp O 33.36 1.98 2.10 8% 6% 16.8x 15.9x 14.5x -1% -2% +1% NA NA 6.1x 39% 1% 2.8x 6% 3
National Retail Props NNN 26.26 1.55 1.63 18% 5% 16.9x 16.1x 13.4x -0% -13% +12% NA NA 6.7x 39% 1% 2.6x 14% -84
Entertainment Props EPR 44.23 2.40 3.54 -20% 48% 18.4x 12.5x 11.0x +8% -26% +34% NA NA 6.1x 44% 22% 2.6x 9% 16
CapLease LSE 3.92 0.47 0.64 -11% 36% 8.3x 6.1x 6.9x -51% -29% -22% NA NA NA 77% 59% 1.7x 4% 2
Triple Net 4% 16% 17.0x 14.9x 9.2x -0% -30% +26% NA NA 6.2x 41% 8% 2.7x 9% -18
Host Hotels HST 13.54 0.88 (0.00) 1.13 0.04 27% 28% 15.4x 12.0x 13.8x +33% +16% +17% -0.5 SD +0.4 SD 6.3x 29% 5% 2.4x 5% -35
LaSalle Hotel Props LHO 22.62 1.55 (0.01) 1.97 (0.04) 12% 27% 14.6x 11.5x 12.7x +26% +8% +18% -0.6 SD -0.8 SD 7.1x 36% 21% NA 7% -25
Diamondrock Hosp. DRH 8.64 0.65 0.01 0.69 (0.07) 4% 7% 13.4x 12.5x 11.5x +16% -1% +16% -0.0 SD -0.5 SD 6.9x 36% 29% 3.0x 6% -41
Strategic Hotels BEE 4.99 0.14 0.01 0.26 (0.01) NM 88% NM 19.0x NA NA NA NA 12.1x 55% 38% 1.5x 5% -30
Hersha Hospitality HT 4.27 0.38 0.01 0.43 0.01 -3% 14% 11.4x 10.0x 9.1x -2% -22% +21% NA NA 8.7x 49% 41% 2.1x 4% 21
Ashford Hospitality AHT 7.27 1.97 (0.00) 2.28 0.30 31% 16% 3.7x 3.2x 5.3x -68% -54% -14% NA NA 12.9x 76% 57% 1.1x 6% 32
Sunstone Hotel Inv SHO 7.34 0.81 (0.02) 1.03 0.06 44% 26% 9.0x 7.1x 10.2x -22% -19% -3% -0.6 SD +0.4 SD 10.7x 61% 42% 1.7x 6% 34
Hospitality Prop. HPT 21.05 3.32 0.01 3.41 0.15 2% 3% 6.3x 6.2x 6.9x -45% -36% -9% NA NA 4.8x 44% 0% 3.4x 4% -21
FelCor Lodging FCH 2.99 0.18 0.32 NM 78% 16.6x 9.3x +44% NA NA NA 10.8x 83% 46% 1.0x 6% -5
Pebblebrook Trust PEB 18.44 0.12 0.47 NM NM NM NM NA NA NA NA 7.3x 36% 17% 2.8x 8% 43
Chesapeake Lodging CHSP 14.71 0.32 0.87 -11% 172% NM 16.9x NA NA NA NA 8.8x 40% 41% 3.8x 5% 14
Chatham Lodging CLDT 10.71 0.94 1.46 77% 55% 11.4x 7.3x -2% NA NA NA 8.7x 57% 44% 1.8x 4% -19
Summit INN 8.25 0.71 0.91 73% 28% 11.6x 9.1x NA +0% NA NA NA NA 6.8x 54% NA 3.6x 4% -48
Lodging 20% 30% 11.6x 10.5x 9.4x -32% -22% -2% -0.1 SD +0.3 SD 7.1x 39% 16% 2.5x 5% -21
Sector Total/Weighted Avg. 20% 10% 17.0x 15.3x 14.2x 7.2x 40% 21% 3.1x 6% -11
Straight Average 13% 17% 14.7x 13.2x 13.4x 7.8x 45% 26% 3.2x 6% -2
S&P 500 INDEX SPX
Apa
rtm
ents
Stud
ent H
.M
anu.
HLo
dgin
gH
ealth
care
Stor
age
Trip
le N
et
Source: FactSet (including consensus FFO and EBITDA estimates), SNL (including consensus NAV estimates), Morgan Stanley Research. For valuation methodology and risks associated with any price targets above, please email [email protected] with a request for valuation methodology and risks on a particular stock

17
M O R G A N S T A N L E Y R E S E A R C H
November 18, 2011 Weekly REIT Insights
Glossary for Comparative Valuation Tables
For estimates (including NAV & Funds from Operations) bold denotes MS covered company estimate.
• Total Return: 90 D v. Peers = Past 90 days total return performance relative to subsector weighted average. The peer for the subsector averages themselves is the overall industry average.
• Equity Cap ($B) = Equity market cap taking into account OP units and other potentially dilutive securities.
• LRAv. = Long-run average: the 5yr quarterly valuation metric average.
• Relative vs. Peers Sections (Implied Cap Rate; Funds From Operations)
o Now (bps) = Current valuation metric premium relative to subsector peer average.
o Diff. (bps) = Difference between current valuation metric premium and 5 yr average
• Relative Valuation Sigma (from Implied Cap Rate and Funds from Operations)
o Current: The Z-score of the valuation metric premium relative to peer group average, which is expressed in standard deviations from the same metric’s long run (5yr) average. For implied cap rates, if a stock is trading at or above +1.5 SD we highlight it as cheap (green) by this metric alone; when trading below -1.5 SD we highlight as expensive (red); for FFO multiples, the sign is reversed.
o QTD Chg.: The difference between reported relative valuation sigma at the end of the previous quarter (based on earnings reporting periods, not calendar dates) and the current sigma.

18
M O R G A N S T A N L E Y R E S E A R C H
November 18, 2011 Weekly REIT Insights
Disclosure Section The information and opinions in Morgan Stanley Research were prepared by Morgan Stanley & Co. LLC, and/or Morgan Stanley C.T.V.M. S.A., and/or Morgan Stanley Mexico, Casa de Bolsa, S.A. de C.V. As used in this disclosure section, "Morgan Stanley" includes Morgan Stanley & Co. LLC, Morgan Stanley C.T.V.M. S.A., Morgan Stanley Mexico, Casa de Bolsa, S.A. de C.V. and their affiliates as necessary. For important disclosures, stock price charts and equity rating histories regarding companies that are the subject of this report, please see the Morgan Stanley Research Disclosure Website at www.morganstanley.com/researchdisclosures, or contact your investment representative or Morgan Stanley Research at 1585 Broadway, (Attention: Research Management), New York, NY, 10036 USA. For valuation methodology and risks associated with any price targets referenced in this research report, please email [email protected] with a request for valuation methodology and risks on a particular stock or contact your investment representative or Morgan Stanley Research at 1585 Broadway, (Attention: Research Management), New York, NY 10036 USA. Analyst Certification The following analysts hereby certify that their views about the companies and their securities discussed in this report are accurately expressed and that they have not received and will not receive direct or indirect compensation in exchange for expressing specific recommendations or views in this report: Paul Morgan. Unless otherwise stated, the individuals listed on the cover page of this report are research analysts. Global Research Conflict Management Policy Morgan Stanley Research has been published in accordance with our conflict management policy, which is available at www.morganstanley.com/institutional/research/conflictpolicies. Important US Regulatory Disclosures on Subject Companies As of October 31, 2011, Morgan Stanley beneficially owned 1% or more of a class of common equity securities of the following companies covered in Morgan Stanley Research: AIMCO, BioMed Realty Trust, Inc, Boston Properties, Inc., BRE Properties, Inc., Camden Property Trust, Essex Property Trust, Inc., Federal Realty Investment Trust, Government Properties Income Trust, HCP, Inc., Health Care Reit Incorporated, Highwoods Properties, Home Properties, Inc., Hudson Pacific Properties, Macerich Company, Mid-America Apartment Communities, Inc., Piedmont Office Realty Trust Inc., Prologis, Inc., Public Storage, Regency Centers Corporation, Senior Housing Properties Trust, Simon Property Group, Inc., Taubman Centers, Inc., Vornado Realty Trust. Within the last 12 months, Morgan Stanley managed or co-managed a public offering (or 144A offering) of securities of American Assets Trust Inc., BioMed Realty Trust, Inc, Boston Properties, Inc., BRE Properties, Inc., Camden Property Trust, DDR Corp, Government Properties Income Trust, HCP, Inc., Health Care Reit Incorporated, Hudson Pacific Properties, Prologis, Inc., Public Storage, Senior Housing Properties Trust, Simon Property Group, Inc., Vornado Realty Trust. Within the last 12 months, Morgan Stanley has received compensation for investment banking services from AIMCO, American Assets Trust Inc., BioMed Realty Trust, Inc, Boston Properties, Inc., BRE Properties, Inc., Camden Property Trust, DDR Corp, Extra Space Storage Inc., First Potomac Realty Trust, Government Properties Income Trust, HCP, Inc., Health Care Reit Incorporated, Highwoods Properties, Home Properties, Inc., Hudson Pacific Properties, Kimco Realty Corp., Macerich Company, Piedmont Office Realty Trust Inc., Prologis, Inc., Public Storage, Senior Housing Properties Trust, Simon Property Group, Inc., Vornado Realty Trust. In the next 3 months, Morgan Stanley expects to receive or intends to seek compensation for investment banking services from AIMCO, American Assets Trust Inc., BioMed Realty Trust, Inc, Boston Properties, Inc., BRE Properties, Inc., Camden Property Trust, DDR Corp, Equity One Inc., First Potomac Realty Trust, Government Properties Income Trust, HCP, Inc., Health Care Reit Incorporated, Highwoods Properties, Hudson Pacific Properties, Kimco Realty Corp., Piedmont Office Realty Trust Inc., Prologis, Inc., Public Storage, Regency Centers Corporation, Senior Housing Properties Trust, Simon Property Group, Inc., Taubman Centers, Inc., Vornado Realty Trust. Within the last 12 months, Morgan Stanley has received compensation for products and services other than investment banking services from AIMCO, American Assets Trust Inc., BioMed Realty Trust, Inc, Boston Properties, Inc., BRE Properties, Inc., Camden Property Trust, DDR Corp, Government Properties Income Trust, HCP, Inc., Health Care Reit Incorporated, Highwoods Properties, Hudson Pacific Properties, Kimco Realty Corp., Macerich Company, Piedmont Office Realty Trust Inc., Prologis, Inc., Public Storage, Senior Housing Properties Trust, Simon Property Group, Inc., Vornado Realty Trust. Within the last 12 months, Morgan Stanley has provided or is providing investment banking services to, or has an investment banking client relationship with, the following company: AIMCO, American Assets Trust Inc., BioMed Realty Trust, Inc, Boston Properties, Inc., BRE Properties, Inc., Camden Property Trust, DDR Corp, Equity One Inc., First Potomac Realty Trust, Government Properties Income Trust, HCP, Inc., Health Care Reit Incorporated, Highwoods Properties, Hudson Pacific Properties, Kimco Realty Corp., Macerich Company, Piedmont Office Realty Trust Inc., Prologis, Inc., Public Storage, Regency Centers Corporation, Senior Housing Properties Trust, Simon Property Group, Inc., Taubman Centers, Inc., Vornado Realty Trust. Within the last 12 months, Morgan Stanley has either provided or is providing non-investment banking, securities-related services to and/or in the past has entered into an agreement to provide services or has a client relationship with the following company: AIMCO, American Assets Trust Inc., BioMed Realty Trust, Inc, Boston Properties, Inc., BRE Properties, Inc., Camden Property Trust, CBL & Associates Properties, Inc., DDR Corp, Government Properties Income Trust, HCP, Inc., Health Care Reit Incorporated, Highwoods Properties, Hudson Pacific Properties, Kimco Realty Corp., Macerich Company, Piedmont Office Realty Trust Inc., Prologis, Inc., Public Storage, Senior Housing Properties Trust, Simon Property Group, Inc., Vornado Realty Trust. Morgan Stanley & Co. LLC makes a market in the securities of AIMCO, American Assets Trust Inc., BioMed Realty Trust, Inc, Boston Properties, Inc., BRE Properties, Inc., Camden Property Trust, CBL & Associates Properties, Inc., DDR Corp, EastGroup Properties Inc., Equity One Inc., Essex Property Trust, Inc., Extra Space Storage Inc., Federal Realty Investment Trust, First Potomac Realty Trust, Government Properties Income Trust, HCP, Inc., Health Care Reit Incorporated, Highwoods Properties, Home Properties, Inc., Hudson Pacific Properties, Kilroy Realty Corp., Kimco Realty Corp., Macerich Company, Mid-America Apartment Communities, Inc., Piedmont Office Realty Trust Inc., Prologis, Inc., Public Storage, Regency Centers Corporation, Senior Housing Properties Trust, Simon Property Group, Inc., Tanger Factory Outlet Centers Inc., Taubman Centers, Inc., Vornado Realty Trust. The equity research analysts or strategists principally responsible for the preparation of Morgan Stanley Research have received compensation based upon various factors, including quality of research, investor client feedback, stock picking, competitive factors, firm revenues and overall investment banking revenues. Morgan Stanley and its affiliates do business that relates to companies/instruments covered in Morgan Stanley Research, including market making, providing liquidity and specialized trading, risk arbitrage and other proprietary trading, fund management, commercial banking, extension of credit, investment services and investment banking. Morgan Stanley sells to and buys from customers the securities/instruments of companies covered in Morgan Stanley Research on a principal basis. Morgan Stanley may have a position in the debt of the Company or instruments discussed in this report. Certain disclosures listed above are also for compliance with applicable regulations in non-US jurisdictions. STOCK RATINGS Morgan Stanley uses a relative rating system using terms such as Overweight, Equal-weight, Not-Rated or Underweight (see definitions below). Morgan Stanley does not assign ratings of Buy, Hold or Sell to the stocks we cover. Overweight, Equal-weight, Not-Rated and Underweight are not the equivalent of buy, hold and sell. Investors should carefully read the definitions of all ratings used in Morgan Stanley Research. In addition, since Morgan Stanley Research contains more complete information concerning the analyst's views, investors should carefully read Morgan Stanley Research, in its entirety, and not infer the contents from the rating alone. In any case, ratings (or research) should not be used or relied upon as
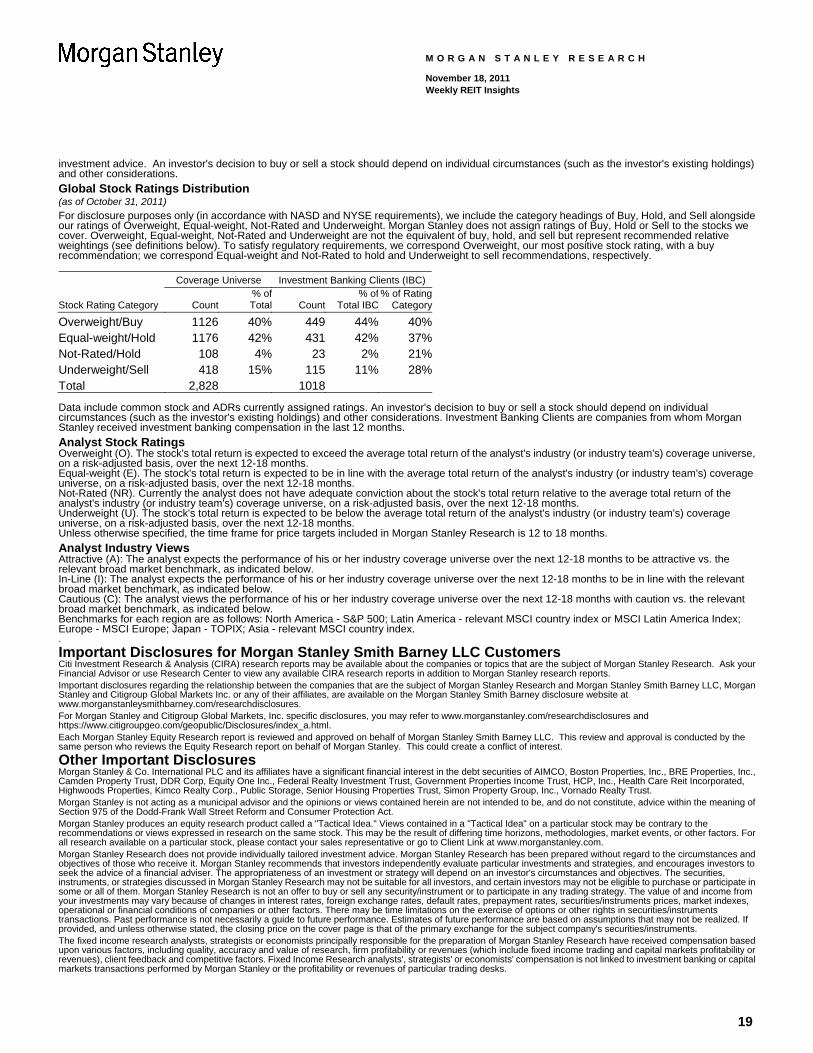
19
M O R G A N S T A N L E Y R E S E A R C H
November 18, 2011 Weekly REIT Insights
investment advice. An investor's decision to buy or sell a stock should depend on individual circumstances (such as the investor's existing holdings) and other considerations. Global Stock Ratings Distribution (as of October 31, 2011) For disclosure purposes only (in accordance with NASD and NYSE requirements), we include the category headings of Buy, Hold, and Sell alongside our ratings of Overweight, Equal-weight, Not-Rated and Underweight. Morgan Stanley does not assign ratings of Buy, Hold or Sell to the stocks we cover. Overweight, Equal-weight, Not-Rated and Underweight are not the equivalent of buy, hold, and sell but represent recommended relative weightings (see definitions below). To satisfy regulatory requirements, we correspond Overweight, our most positive stock rating, with a buy recommendation; we correspond Equal-weight and Not-Rated to hold and Underweight to sell recommendations, respectively. Coverage Universe Investment Banking Clients (IBC)
Stock Rating Category Count % of Total Count
% of Total IBC
% of Rating Category
Overweight/Buy 1126 40% 449 44% 40%Equal-weight/Hold 1176 42% 431 42% 37%Not-Rated/Hold 108 4% 23 2% 21%Underweight/Sell 418 15% 115 11% 28%Total 2,828 1018 Data include common stock and ADRs currently assigned ratings. An investor's decision to buy or sell a stock should depend on individual circumstances (such as the investor's existing holdings) and other considerations. Investment Banking Clients are companies from whom Morgan Stanley received investment banking compensation in the last 12 months. Analyst Stock Ratings Overweight (O). The stock's total return is expected to exceed the average total return of the analyst's industry (or industry team's) coverage universe, on a risk-adjusted basis, over the next 12-18 months. Equal-weight (E). The stock's total return is expected to be in line with the average total return of the analyst's industry (or industry team's) coverage universe, on a risk-adjusted basis, over the next 12-18 months. Not-Rated (NR). Currently the analyst does not have adequate conviction about the stock's total return relative to the average total return of the analyst's industry (or industry team's) coverage universe, on a risk-adjusted basis, over the next 12-18 months. Underweight (U). The stock's total return is expected to be below the average total return of the analyst's industry (or industry team's) coverage universe, on a risk-adjusted basis, over the next 12-18 months. Unless otherwise specified, the time frame for price targets included in Morgan Stanley Research is 12 to 18 months. Analyst Industry Views Attractive (A): The analyst expects the performance of his or her industry coverage universe over the next 12-18 months to be attractive vs. the relevant broad market benchmark, as indicated below. In-Line (I): The analyst expects the performance of his or her industry coverage universe over the next 12-18 months to be in line with the relevant broad market benchmark, as indicated below. Cautious (C): The analyst views the performance of his or her industry coverage universe over the next 12-18 months with caution vs. the relevant broad market benchmark, as indicated below. Benchmarks for each region are as follows: North America - S&P 500; Latin America - relevant MSCI country index or MSCI Latin America Index; Europe - MSCI Europe; Japan - TOPIX; Asia - relevant MSCI country index. . Important Disclosures for Morgan Stanley Smith Barney LLC Customers Citi Investment Research & Analysis (CIRA) research reports may be available about the companies or topics that are the subject of Morgan Stanley Research. Ask your Financial Advisor or use Research Center to view any available CIRA research reports in addition to Morgan Stanley research reports. Important disclosures regarding the relationship between the companies that are the subject of Morgan Stanley Research and Morgan Stanley Smith Barney LLC, Morgan Stanley and Citigroup Global Markets Inc. or any of their affiliates, are available on the Morgan Stanley Smith Barney disclosure website at www.morganstanleysmithbarney.com/researchdisclosures. For Morgan Stanley and Citigroup Global Markets, Inc. specific disclosures, you may refer to www.morganstanley.com/researchdisclosures and https://www.citigroupgeo.com/geopublic/Disclosures/index_a.html. Each Morgan Stanley Equity Research report is reviewed and approved on behalf of Morgan Stanley Smith Barney LLC. This review and approval is conducted by the same person who reviews the Equity Research report on behalf of Morgan Stanley. This could create a conflict of interest. Other Important Disclosures Morgan Stanley & Co. International PLC and its affiliates have a significant financial interest in the debt securities of AIMCO, Boston Properties, Inc., BRE Properties, Inc., Camden Property Trust, DDR Corp, Equity One Inc., Federal Realty Investment Trust, Government Properties Income Trust, HCP, Inc., Health Care Reit Incorporated, Highwoods Properties, Kimco Realty Corp., Public Storage, Senior Housing Properties Trust, Simon Property Group, Inc., Vornado Realty Trust. Morgan Stanley is not acting as a municipal advisor and the opinions or views contained herein are not intended to be, and do not constitute, advice within the meaning of Section 975 of the Dodd-Frank Wall Street Reform and Consumer Protection Act. Morgan Stanley produces an equity research product called a "Tactical Idea." Views contained in a "Tactical Idea" on a particular stock may be contrary to the recommendations or views expressed in research on the same stock. This may be the result of differing time horizons, methodologies, market events, or other factors. For all research available on a particular stock, please contact your sales representative or go to Client Link at www.morganstanley.com. Morgan Stanley Research does not provide individually tailored investment advice. Morgan Stanley Research has been prepared without regard to the circumstances and objectives of those who receive it. Morgan Stanley recommends that investors independently evaluate particular investments and strategies, and encourages investors to seek the advice of a financial adviser. The appropriateness of an investment or strategy will depend on an investor's circumstances and objectives. The securities, instruments, or strategies discussed in Morgan Stanley Research may not be suitable for all investors, and certain investors may not be eligible to purchase or participate in some or all of them. Morgan Stanley Research is not an offer to buy or sell any security/instrument or to participate in any trading strategy. The value of and income from your investments may vary because of changes in interest rates, foreign exchange rates, default rates, prepayment rates, securities/instruments prices, market indexes, operational or financial conditions of companies or other factors. There may be time limitations on the exercise of options or other rights in securities/instruments transactions. Past performance is not necessarily a guide to future performance. Estimates of future performance are based on assumptions that may not be realized. If provided, and unless otherwise stated, the closing price on the cover page is that of the primary exchange for the subject company's securities/instruments. The fixed income research analysts, strategists or economists principally responsible for the preparation of Morgan Stanley Research have received compensation based upon various factors, including quality, accuracy and value of research, firm profitability or revenues (which include fixed income trading and capital markets profitability or revenues), client feedback and competitive factors. Fixed Income Research analysts', strategists' or economists' compensation is not linked to investment banking or capital markets transactions performed by Morgan Stanley or the profitability or revenues of particular trading desks.

20
M O R G A N S T A N L E Y R E S E A R C H
November 18, 2011 Weekly REIT Insights
Morgan Stanley Research is not an offer to buy or sell or the solicitation of an offer to buy or sell any security/instrument or to participate in any particular trading strategy. The "Important US Regulatory Disclosures on Subject Companies" section in Morgan Stanley Research lists all companies mentioned where Morgan Stanley owns 1% or more of a class of common equity securities of the companies. For all other companies mentioned in Morgan Stanley Research, Morgan Stanley may have an investment of less than 1% in securities/instruments or derivatives of securities/instruments of companies and may trade them in ways different from those discussed in Morgan Stanley Research. Employees of Morgan Stanley not involved in the preparation of Morgan Stanley Research may have investments in securities/instruments or derivatives of securities/instruments of companies mentioned and may trade them in ways different from those discussed in Morgan Stanley Research. Derivatives may be issued by Morgan Stanley or associated persons. With the exception of information regarding Morgan Stanley, Morgan Stanley Research is based on public information. Morgan Stanley makes every effort to use reliable, comprehensive information, but we make no representation that it is accurate or complete. We have no obligation to tell you when opinions or information in Morgan Stanley Research change apart from when we intend to discontinue equity research coverage of a subject company. Facts and views presented in Morgan Stanley Research have not been reviewed by, and may not reflect information known to, professionals in other Morgan Stanley business areas, including investment banking personnel. Morgan Stanley Research personnel may participate in company events such as site visits and are generally prohibited from accepting payment by the company of associated expenses unless pre-approved by authorized members of Research management. Morgan Stanley may make investment decisions or take proprietary positions that are inconsistent with the recommendations or views in this report. To our readers in Taiwan: Information on securities/instruments that trade in Taiwan is distributed by Morgan Stanley Taiwan Limited ("MSTL"). Such information is for your reference only. Information on any securities/instruments issued by a company owned by the government of or incorporated in the PRC and listed in on the Stock Exchange of Hong Kong ("SEHK"), namely the H-shares, including the component company stocks of the Stock Exchange of Hong Kong ("SEHK")'s Hang Seng China Enterprise Index is distributed only to Taiwan Securities Investment Trust Enterprises ("SITE"). The reader should independently evaluate the investment risks and is solely responsible for their investment decisions. Morgan Stanley Research may not be distributed to the public media or quoted or used by the public media without the express written consent of Morgan Stanley. To our readers in Hong Kong: Information is distributed in Hong Kong by and on behalf of, and is attributable to, Morgan Stanley Asia Limited as part of its regulated activities in Hong Kong. If you have any queries concerning Morgan Stanley Research, please contact our Hong Kong sales representatives. Information on securities/instruments that do not trade in Taiwan is for informational purposes only and is not to be construed as a recommendation or a solicitation to trade in such securities/instruments. MSTL may not execute transactions for clients in these securities/instruments. Morgan Stanley is not incorporated under PRC law and the research in relation to this report is conducted outside the PRC. Morgan Stanley Research does not constitute an offer to sell or the solicitation of an offer to buy any securities in the PRC. PRC investors shall have the relevant qualifications to invest in such securities and shall be responsible for obtaining all relevant approvals, licenses, verifications and/or registrations from the relevant governmental authorities themselves. Morgan Stanley Research is disseminated in Brazil by Morgan Stanley C.T.V.M. S.A.; in Japan by Morgan Stanley MUFG Securities Co., Ltd. and, for Commodities related research reports only, Morgan Stanley Capital Group Japan Co., Ltd; in Hong Kong by Morgan Stanley Asia Limited (which accepts responsibility for its contents); in Singapore by Morgan Stanley Asia (Singapore) Pte. (Registration number 199206298Z) and/or Morgan Stanley Asia (Singapore) Securities Pte Ltd (Registration number 200008434H), regulated by the Monetary Authority of Singapore (which accepts legal responsibility for its contents and should be contacted with respect to any matters arising from, or in connection with, Morgan Stanley Research); in Australia to "wholesale clients" within the meaning of the Australian Corporations Act by Morgan Stanley Australia Limited A.B.N. 67 003 734 576, holder of Australian financial services license No. 233742, which accepts responsibility for its contents; in Australia to "wholesale clients" and "retail clients" within the meaning of the Australian Corporations Act by Morgan Stanley Smith Barney Australia Pty Ltd (A.B.N. 19 009 145 555, holder of Australian financial services license No. 240813, which accepts responsibility for its contents; in Korea by Morgan Stanley & Co International plc, Seoul Branch; in India by Morgan Stanley India Company Private Limited; in Canada by Morgan Stanley Canada Limited, which has approved of and takes responsibility for its contents in Canada; in Germany by Morgan Stanley Bank AG, Frankfurt am Main and Morgan Stanley Private Wealth Management Limited, Niederlassung Deutschland, regulated by Bundesanstalt fuer Finanzdienstleistungsaufsicht (BaFin); in Spain by Morgan Stanley, S.V., S.A., a Morgan Stanley group company, which is supervised by the Spanish Securities Markets Commission (CNMV) and states that Morgan Stanley Research has been written and distributed in accordance with the rules of conduct applicable to financial research as established under Spanish regulations; in the US by Morgan Stanley & Co. LLC, which accepts responsibility for its contents. Morgan Stanley & Co. International plc, authorized and regulated by the Financial Services Authority, disseminates in the UK research that it has prepared, and approves solely for the purposes of section 21 of the Financial Services and Markets Act 2000, research which has been prepared by any of its affiliates. Morgan Stanley Private Wealth Management Limited, authorized and regulated by the Financial Services Authority, also disseminates Morgan Stanley Research in the UK. Private UK investors should obtain the advice of their Morgan Stanley & Co. International plc or Morgan Stanley Private Wealth Management representative about the investments concerned. RMB Morgan Stanley (Proprietary) Limited is a member of the JSE Limited and regulated by the Financial Services Board in South Africa. RMB Morgan Stanley (Proprietary) Limited is a joint venture owned equally by Morgan Stanley International Holdings Inc. and RMB Investment Advisory (Proprietary) Limited, which is wholly owned by FirstRand Limited. The information in Morgan Stanley Research is being communicated by Morgan Stanley & Co. International plc (DIFC Branch), regulated by the Dubai Financial Services Authority (the DFSA), and is directed at Professional Clients only, as defined by the DFSA. The financial products or financial services to which this research relates will only be made available to a customer who we are satisfied meets the regulatory criteria to be a Professional Client. The information in Morgan Stanley Research is being communicated by Morgan Stanley & Co. International plc (QFC Branch), regulated by the Qatar Financial Centre Regulatory Authority (the QFCRA), and is directed at business customers and market counterparties only and is not intended for Retail Customers as defined by the QFCRA. As required by the Capital Markets Board of Turkey, investment information, comments and recommendations stated here, are not within the scope of investment advisory activity. Investment advisory service is provided in accordance with a contract of engagement on investment advisory concluded between brokerage houses, portfolio management companies, non-deposit banks and clients. Comments and recommendations stated here rely on the individual opinions of the ones providing these comments and recommendations. These opinions may not fit to your financial status, risk and return preferences. For this reason, to make an investment decision by relying solely to this information stated here may not bring about outcomes that fit your expectations. The trademarks and service marks contained in Morgan Stanley Research are the property of their respective owners. Third-party data providers make no warranties or representations relating to the accuracy, completeness, or timeliness of the data they provide and shall not have liability for any damages relating to such data. The Global Industry Classification Standard (GICS) was developed by and is the exclusive property of MSCI and S&P. Morgan Stanley bases projections, opinions, forecasts and trading strategies regarding the MSCI Country Index Series solely on public information. MSCI has not reviewed, approved or endorsed these projections, opinions, forecasts and trading strategies. Morgan Stanley has no influence on or control over MSCI's index compilation decisions. Morgan Stanley Research or portions of it may not be reprinted, sold or redistributed without the written consent of Morgan Stanley. Morgan Stanley research is disseminated and available primarily electronically, and, in some cases, in printed form. Additional information on recommended securities/instruments is available on request. Morgan Stanley Research, or any portion thereof may not be reprinted, sold or redistributed without the written consent of Morgan Stanley. Morgan Stanley Research is disseminated and available primarily electronically, and, in some cases, in printed form. Additional information on recommended securities/instruments is available on request.

© 2011 Morgan Stanley
M O R G A N S T A N L E Y R E S E A R C H
Industry Coverage:Real Estate Investment Trusts
Company (Ticker) Rating (as of)Price* (11/17/2011)
Paul Morgan AIMCO (AIV.N) E (10/31/2011) $21.9American Assets Trust Inc. (AAT.N) O (05/18/2011) $20.48BRE Properties, Inc. (BRE.N) O (06/05/2011) $46.76BioMed Realty Trust, Inc (BMR.N) O (05/18/2011) $17.85Boston Properties, Inc. (BXP.N) E (05/18/2011) $93.77CBL & Associates Properties, Inc. (CBL.N)
E (09/23/2011) $13.81
DDR Corp (DDR.N) O (09/23/2011) $11.27EastGroup Properties Inc. (EGP.N) E (09/23/2011) $41.61Equity One Inc. (EQY.N) E (05/18/2011) $16.23Essex Property Trust, Inc. (ESS.N) O (05/18/2011) $130.65Extra Space Storage Inc. (EXR.N) E (05/18/2011) $22.87Federal Realty Investment Trust (FRT.N)
E (05/18/2011) $85.92
First Potomac Realty Trust (FPO.N) E (05/18/2011) $13.2Government Properties Income Trust (GOV.N)
E (05/18/2011) $21.14
HCP, Inc. (HCP.N) E (10/05/2011) $37.38Health Care Reit Incorporated (HCN.N)
E (05/18/2011) $48.8
Highwoods Properties (HIW.N) E (05/18/2011) $28.91Home Properties, Inc. (HME.N) E (05/18/2011) $55.01Hudson Pacific Properties (HPP.N) E (05/18/2011) $12.45Kilroy Realty Corp. (KRC.N) E (05/18/2011) $35.97Kimco Realty Corp. (KIM.N) E (05/18/2011) $15.62Macerich Company (MAC.N) E (05/18/2011) $48.23Mid-America Apartment Communities, Inc. (MAA.N)
E (05/18/2011) $58.3
Piedmont Office Realty Trust Inc. (PDM.N)
U (09/23/2011) $16.6
Prologis, Inc. (PLD.N) O (07/07/2011) $27.45Public Storage (PSA.N) U (05/18/2011) $123.45Regency Centers Corporation (REG.N)
E (05/18/2011) $36.71
Senior Housing Properties Trust (SNH.N)
E (05/18/2011) $21.44
Simon Property Group, Inc. (SPG.N)
E (05/18/2011) $122.11
Taubman Centers, Inc. (TCO.N) E (05/18/2011) $60.85Vornado Realty Trust (VNO.N) E (05/18/2011) $75.36
Stock Ratings are subject to change. Please see latest research for each company. * Historical prices are not split adjusted.
The Americas 1585 Broadway New York, NY 10036-8293 United States Tel: +1 (1) 212 761 4000
Europe 20 Bank Street, Canary Wharf London E14 4AD United Kingdom Tel: +44 (0) 20 7 425 8000
Japan 4-20-3 Ebisu, Shibuya-ku Tokyo 150-6008 Japan Tel: +81 (0) 3 5424 5000
Asia/Pacific 1 Austin Road West Kowloon Hong Kong Tel: +852 2848 5200
Related Documents