© 2018 Envestnet, Inc. All rights reserved. FOR ONE-ON-ONE USE WITH A CLIENT’S FINANCIAL ADVISOR ONLY. Weekly Market Review Chart of the Week November 9, 2018 1 Talking Points • Stocks pushed higher in US equity markets despite a moderate pullback on Friday, whereas growth and value stocks produced similar results. Meanwhile, large cap outperformed small cap stocks. Non- US developed equities also rose for the week, albeit to a lesser degree than their US counterparts, and value outperformed growth stocks. In emerging markets, stocks were slightly lower for the week, as Latin American equities sold off sharply, led by Brazil, which was one of the worst-performing markets around the globe. • Treasury yields were stable for the week, as the curve slightly flattened. Yields shorter than 10 years rose marginally, whereas yields on the 20- and 30 year notes fell. Overall, moves in the yield curve were muted, as the Fed decided to hold rates steady, with one more meeting to come before the end of the year. • Commodity prices retreated during the week, led by a sharp drop in the price of oil. In fact, oil entered bear market territory, as it was down 21% from its October highs. Global economic growth concerns have dampened the demand outlook and have left market participants searching for a bottom. • Volatility declined significantly during the week, as the CBOE Volatility Index (VIX) fell more than 10%. The US dollar was slightly higher for the week. •Consumer sentiment remained high in the US. The University of Michigan Index of Consumer Sentiment was 98.3 in November, which was down from 98.6 in October. Weekly Highlights • The Federal Reserve kept rates at their current level. In a statement released after the most recent meeting on rates, the Federal Open Market Committee (FOMC) maintained its positive outlook for the US economy, and indicated that another rate rise is likely in December, the last meeting of the year. The Committee voted unanimously to keep rates steady, and will monitor economic data closely in the coming year to determine the number of rate hikes in 2019. • Initial jobless claims fell for the week ended November 3. In the latest of strong economic data, initial jobless claims fell from a seasonally adjusted 215,000 the previous week to 214,000. In other labor market news, the number of unfilled jobs exceeds the number of unemployed persons in the US by more than one million. • Producer prices rose 0.6% in October from the prior month. The Producer Price Index, a measure of prices businesses receive for their goods and services, also increased from a year earlier, gaining 2.9% in value. The index has risen each year since 2016. The gains largely were driven by rising prices for services, signaling that the economy is on solid footing. 0 50 100 150 200 250 300 350 Nov-17 Jan-18 Mar-18 May-18 Jul-18 Sep-18 Thousands Non-Farm Payrolls-Trailing 12 Mos. Source: Bloomberg

Welcome message from author
This document is posted to help you gain knowledge. Please leave a comment to let me know what you think about it! Share it to your friends and learn new things together.
Transcript

© 2018 Envestnet, Inc. All rights reserved. FOR ONE-ON-ONE USE WITH A CLIENT’S FINANCIAL ADVISOR ONLY.
Weekly Market Review
Chart of the Week
November 9, 2018
1
Talking Points • Stocks pushed higher in US equity markets despite a moderate pullback on Friday, whereas growth and value stocks produced similar results. Meanwhile, large cap outperformed small cap stocks. Non-US developed equities also rose for the week, albeit to a lesser degree than their US counterparts, and value outperformed growth stocks. In emerging markets, stocks were slightly lower for the week, as Latin American equities sold off sharply, led by Brazil, which was one of the worst-performing markets around the globe. • Treasury yields were stable for the week, as the curve slightly flattened. Yields shorter than 10 years rose marginally, whereas yields on the 20- and 30 year notes fell. Overall, moves in the yield curve were muted, as the Fed decided to hold rates steady, with one more meeting to come before the end of the year. • Commodity prices retreated during the week, led by a sharp drop in the price of oil. In fact, oil entered bear market territory, as it was down 21% from its October highs. Global economic growth concerns have dampened the demand outlook and have left market participants searching for a bottom. • Volatility declined significantly during the week, as the CBOE Volatility Index (VIX) fell more than 10%. The US dollar was slightly higher for the week. •Consumer sentiment remained high in the US. The University of Michigan Index of Consumer Sentiment was 98.3 in November, which was down from 98.6 in October.
Weekly Highlights
• The Federal Reserve kept rates at their current level. In a statement released after the most recent meeting on rates, the Federal Open Market Committee (FOMC) maintained its positive outlook for the US economy, and indicated that another rate rise is likely in December, the last meeting of the year. The Committee voted unanimously to keep rates steady, and will monitor economic data closely in the coming year to determine the number of rate hikes in 2019.
• Initial jobless claims fell for the week ended November 3. In the latest of strong economic data, initial jobless claims fell from a seasonally adjusted 215,000 the previous week to 214,000. In other labor market news, the number of unfilled jobs exceeds the number of unemployed persons in the US by more than one million.
• Producer prices rose 0.6% in October from the prior month. The Producer Price Index, a measure of prices businesses receive for their goods and services, also increased from a year earlier, gaining 2.9% in value. The index has risen each year since 2016. The gains largely were driven by rising prices for services, signaling that the economy is on solid footing.
0
50
100
150
200
250
300
350
Nov-17 Jan-18 Mar-18 May-18 Jul-18 Sep-18
Thou
sand
s
Non-Farm Payrolls-Trailing 12 Mos.
Source: Bloomberg

© 2018 Envestnet, Inc. All rights reserved. FOR ONE-ON-ONE USE WITH A CLIENT’S FINANCIAL ADVISOR ONLY.
PMC Weekly Market Review
2
November 9, 2018
0.70.80.9
11.11.21.31.41.51.6
Oct-16 Dec-16 Feb-17 Apr-17 Jun-17 Aug-17 Oct-17 Dec-17 Feb-18 Apr-18 Jun-18 Aug-18 Oct-18Source: Bloomberg
Wealth Index|Growth of $1: Trailing 24 Months
S&P 500 Dow Industrials Small Cap EAFE Emerging Mkts.
L
S
Source: Bloomberg
YTDValue Growth
0.66% 5.19% 9.03%
-3.35% -0.27% 3.67%
3.10%0.91%-1.45%
One WeekValue Growth
0.67% 0.10% -0.45%
2.43% 2.19% 1.97%
1.65% 1.21% 0.58%
245025002550260026502700275028002850290029503000
5/14 5/28 6/11 6/25 7/9 7/23 8/6 8/20 9/3 9/17 10/1 10/1510/29
Source: Bloomberg
S&P 500 Index: Trailing 180 Days
% Wgt in S&P 500
Week % Chg. YTD % Chg.
Consumer Discretionary 10.0 1.99% 10.9%Consumer Staples 7.4 2.88% -0.5%Energy 5.6 0.94% -5.2%Financials 13.7 2.61% -3.2%Health Care 15.3 4.01% 12.4%Industrials 9.4 2.05% -4.6%Information Technology 20.4 1.40% 10.6%Materials 2.6 1.86% -9.3%Real Estate 2.8 3.65% 0.4%Communication Services 9.8 -0.20% -9.9%Utilities 3.1 3.10% 3.9%
Source: Bloomberg
Sector Performance: S&P/Global Industry Classification Sectors (GICS)
Market Dashboard Last Price Change % Chg. YTD % Last Price Change % Chg. YTD %
S&P 500 2,781.01 57.95 2.1% 4.0% Russell Global EM 3,101.38 -5.13 -0.2% -14.9% Dow Industrials 25,989.30 718.47 2.8% 5.1% 10-Year US Treas. 3.19 -3 bps NM 8 bps Nasdaq 7,406.90 49.91 0.7% 7.3% Bloomberg Cmdts. Idx. 82.89 -0.99 -1.2% -6.0% Russell 2000 1,549.49 1.51 0.1% 0.9% Gold $1,209.70 -$23.22 -1.9% -7.1% Euro Stoxx Index 365.74 1.66 0.5% -6.0% Crude Oil $59.84 -$3.28 -5.2% 3.1%
Shanghai Composite 2,598.87 -77.60 -2.9% -21.4% Dollar Index 96.89 0.35 0.4% 5.2%
Russell Global 2,080.02 38.84 1.9% -3.0% VIX Index 17.36 -2.15 -11.0% 57.2% Source: Bloomberg; Index % change is based on price.
10
12
14
16
18
20
22
24
26
May-18 Jun-18 Jul-18 Aug-18 Sep-18 Oct-18Source: Bloomberg
VIX Index: Trailing 180 Days

© 2018 Envestnet, Inc. All rights reserved. FOR ONE-ON-ONE USE WITH A CLIENT’S FINANCIAL ADVISOR ONLY.
PMC Weekly Market Review
3
November 9, 2018
The Economy and Markets
A Macro View: Beyond the US Mid-Term Elections: Emerging Markets Look To Turn the Corner Now that the US mid-term elections are behind us, it is a good time to reflect on the potential implications for an asset class that might not spring to mind: emerging markets equity. To appreciate the effect of the US elections on emerging markets, it is necessary to take a step back and review the issues affecting the asset class. On the back of surging earnings and global synchronized economic growth, emerging markets soared in 2017, with the MSCI Emerging Markets Index (USD) up 37% in a market driven by growth and momentum. The euphoric highs of 2017 faded relatively quickly, as a variety of macroeconomic events and adverse headline news created a distinct headwind for emerging markets equities, which are now down more than 12% year to date. We believe that several factors will be vital for emerging markets to turn the corner and get out of the doldrums. The champagne-induced hangovers had barely subsided in 2018 when the global synchronized economic growth story that helped lift markets around the world disintegrated. Data indicated that the European economy was decelerating, which negatively affected non-US equity markets. Despite positive economic data in the US, which normally bolsters emerging markets, the Federal Reserve (the Fed) has moved to normalize monetary policy by increasing rates to head off the potential of an overheated economy. The US dollar strengthened as a result, which adversely affected emerging markets currencies, particularly in countries with a negative current account balance. Given the economic momentum in the US, it is likely that the Fed will continue to tighten monetary policy in the near term. That being said, the Fed policy futures market indicates that in mid-2019, rate hikes are expected to slow, which undoubtedly can help ease the pressure on emerging markets. The larger cloud hanging over emerging markets equity is the escalating trade conflict between the world’s two largest economies: the US and China. In a sequence of tit-for-tat announcements, the two nations have introduced a series of escalating tariffs on a wide range of goods. The trade spat has effectively dampened the mood of emerging markets participants as they try to decipher the implications of a broader trade war involving China—the most important of the emerging markets. Many portfolio managers feel that after losing the House of Representatives, President Trump, after applying heavy pressure on China to change its trade practices, will take a more conciliatory approach and ultimately strike a deal, as he did in renegotiating NAFTA (now known as the US-Mexico-Canada Agreement or “USMCA”). Alternatively, some portfolio managers believe that given the resistance the President’s legislative agenda will face from the opposition party now in power in the House, he will seek trade policy that does not require legislative approval to make sweeping changes. Either way, it seems the issue of trade policy with China will come to a head later this month when President Trump and President Xi Jinping of China meet to hammer out an agreement. If the two sides can come to an acceptable agreement, the broader emerging markets space will no longer be threatened by a trade war. There is no doubt that emerging markets have faced a variety of headwinds so far in 2018. Although their economies continue to develop, market reforms continue apace, and earnings remain strong, significant macroeconomic and headline issues have distracted market participants from good news in the asset class. With the mid-term elections in the rear view mirror and a potential thawing of trade relations between the US and China on the horizon, there is hope that emerging markets will move past their recent difficulties. Dan Homan, CFA

© 2018 Envestnet, Inc. All rights reserved. FOR ONE-ON-ONE USE WITH A CLIENT’S FINANCIAL ADVISOR ONLY.
PMC Weekly Market Review
4
November 9, 2018
195
200
205
210
215
220
8/17 8/31 9/14 9/28 10/12 10/26
Thou
sand
s
Initial Jobless Claims-Trailing 12 Wks.
Source: Bloomberg
Economic Data
-0.2
-0.1
0
0.1
0.2
0.3
0.4
0.5
0.6
Nov-17 Jan-18 Mar-18 May-18 Jul-18 Sep-18
Mon
thly
% C
hg.
Consumer Price Index-Trailing 12 Mos.
Headline CPI Core CPISource: Bloomberg
115.0
120.0
125.0
130.0
135.0
140.0
Nov-17 Jan-18 Mar-18 May-18 Jul-18 Sep-18
Inde
x
Consumer Board Confidence Index - Trailing 12 Mos.
Source: Bloomberg
0
50
100
150
200
250
300
350
Nov-17 Jan-18 Mar-18 May-18 Jul-18 Sep-18
Thou
sand
s
Non-Farm Payrolls-Trailing 12 Mos.
Source: Bloomberg
0.0
0.5
1.0
1.5
2.0
2.5
3.0
3.5
4.0
4.5
Dec-15 Jun-16 Dec-16 Jun-17 Dec-17 Jun-18
%
Real GDP Growth Rate - Annualized - 12 Qtrs.
Source: Bloomberg
3.5
3.6
3.7
3.8
3.9
4.0
4.1
4.2
Nov-17 Jan-18 Mar-18 May-18 Jul-18 Sep-18
%
Unemployment Rate-Trailing 12 Mos.
Source: Bloomberg
© 2018 Envestnet, Inc. All rights reserved. FOR ONE-ON-ONE USE WITH A CLIENT’S FINANCIAL ADVISOR ONLY.
PMC Weekly Market Review November 9, 2018
5
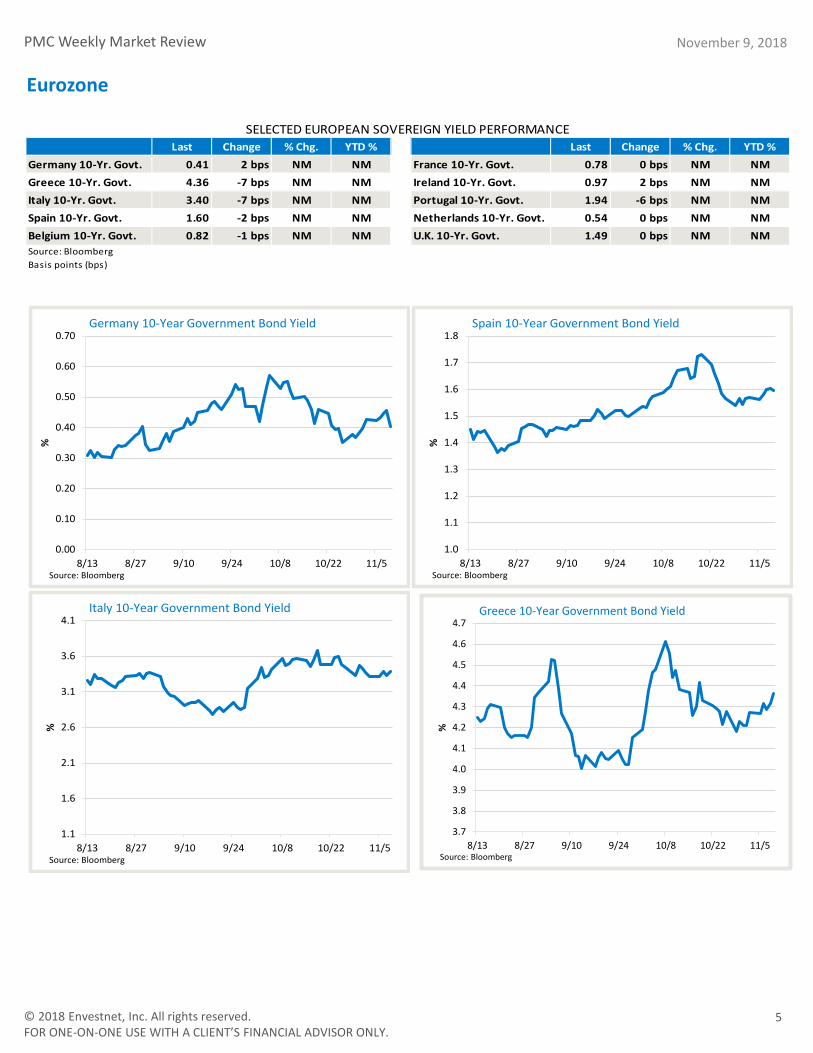
Last Change % Chg. YTD % Last Change % Chg. YTD %Germany 10-Yr. Govt. 0.41 2 bps NM NM France 10-Yr. Govt. 0.78 0 bps NM NMGreece 10-Yr. Govt. 4.36 -7 bps NM NM Ireland 10-Yr. Govt. 0.97 2 bps NM NMItaly 10-Yr. Govt. 3.40 -7 bps NM NM Portugal 10-Yr. Govt. 1.94 -6 bps NM NMSpain 10-Yr. Govt. 1.60 -2 bps NM NM Netherlands 10-Yr. Govt. 0.54 0 bps NM NMBelgium 10-Yr. Govt. 0.82 -1 bps NM NM U.K. 10-Yr. Govt. 1.49 0 bps NM NM
SELECTED EUROPEAN SOVEREIGN YIELD PERFORMANCE
Source: BloombergBasis points (bps)
0.00
0.10
0.20
0.30
0.40
0.50
0.60
0.70
8/13 8/27 9/10 9/24 10/8 10/22 11/5
%
Germany 10-Year Government Bond Yield
Source: Bloomberg
1.0
1.1
1.2
1.3
1.4
1.5
1.6
1.7
1.8
8/13 8/27 9/10 9/24 10/8 10/22 11/5
%
Spain 10-Year Government Bond Yield
Source: Bloomberg
1.1
1.6
2.1
2.6
3.1
3.6
4.1
8/13 8/27 9/10 9/24 10/8 10/22 11/5
%
Italy 10-Year Government Bond Yield
Source: Bloomberg
Eurozone
3.7
3.8
3.9
4.0
4.1
4.2
4.3
4.4
4.5
4.6
4.7
8/13 8/27 9/10 9/24 10/8 10/22 11/5
%
Greece 10-Year Government Bond Yield
Source: Bloomberg

© 2018 Envestnet, Inc. All rights reserved. FOR ONE-ON-ONE USE WITH A CLIENT’S FINANCIAL ADVISOR ONLY.
PMC Weekly Market Review November 9, 2018
6
6,400
6,600
6,800
7,000
7,200
7,400
7,600
7,800
8,000
8,200
8/13 8/27 9/10 9/24 10/8 10/22 11/5
Inde
xNasdaq Composite-Trailing 90 Days
Source: Bloomberg
2,000
2,100
2,200
2,300
2,400
2,500
2,600
2,700
2,800
2,900
8/13 8/27 9/10 9/24 10/8 10/22 11/5
Inde
x
Shanghai Composite Index-Trailing 90 Days
Source: Bloomberg
300
310
320
330
340
350
360
370
380
390
400
8/13 8/27 9/10 9/24 10/8 10/22 11/5
Inde
x
Euro Stoxx Index-Trailing 90 Days
Source: Bloomberg
23,000
23,500
24,000
24,500
25,000
25,500
26,000
26,500
27,000
27,500
8/13 8/27 9/10 9/24 10/8 10/22 11/5
Inde
x
Dow Jones Industrial Average -Trailing 90 Days
Source: Bloomberg
Equities WORLD MARKET PERFORMANCE
Last Change % Chg. YTD % Last Change % Chg. YTD % S&P 500 2,781.01 57.95 2.13% 4.02% Swiss Market Index 9,074.03 81.73 0.91% -3.28% Dow Industrials 25,989.30 718.47 2.84% 5.14% CAC 40 Index (France) 5,106.75 4.62 0.09% -3.87% Nasdaq Composite 7,406.90 49.91 0.68% 7.29% DAX Index (Germany) 11,529.16 10.17 0.09% -10.75% Russell Global 2,080.02 38.84 1.90% -3.0% Irish Overall Index 6,172.13 -51.94 -0.83% -12.31% Russell Global EM 3,101.38 -5.13 -0.17% -14.9% Nikkei 225 22,250.25 6.59 0.03% -2.26% S&P/TSX (Canada) 15,274.44 155.16 1.03% -5.77% Hang Seng Index 25,601.92 -884.43 -3.34% -14.43% Mexico IPC 44,263.74 -1269.55 -2.79% -10.49% Shanghai Composite 2,598.87 -77.60 -2.90% -21.42% Brazil Bovespa 85,641.19 -2777.84 -3.14% 12.09% Kospi Index (S. Korea) 2,086.09 -9.91 -0.47% -15.46% Euro Stoxx 600 365.74 1.66 0.46% -6.02% Taiwan Taiex Index 9,830.01 -76.58 -0.77% -7.64% FTSE 100 7,105.34 11.22 0.16% -7.58% Tel Aviv 25 Index 1,657.49 46.06 2.86% 9.78%
IBEX 35 (Spain) 9,134.80 141.80 1.58% -9.05% MOEX Index (Russia) 2,403.47 25.52 1.07% 13.92% Source: Bloomberg; Index % change is based on price.

© 2018 Envestnet, Inc. All rights reserved. FOR ONE-ON-ONE USE WITH A CLIENT’S FINANCIAL ADVISOR ONLY.
PMC Weekly Market Review November 9, 2018
7
30,000
40,000
50,000
60,000
70,000
80,000
90,000
100,000
8/13 8/27 9/10 9/24 10/8 10/22 11/5
Inde
x
Brazil (Bovespa Index)-Trailing 90 Days
Source: Bloomberg
30,000
31,000
32,000
33,000
34,000
35,000
36,000
37,000
38,000
39,000
40,000
8/13 8/27 9/10 9/24 10/8 10/22 11/5
Inde
x
India (Sensex Index)-Trailing 90 Days
Source: Bloomberg
400
600
800
1,000
1,200
1,400
1,600
8/12 8/26 9/9 9/23 10/7 10/21 11/4
Inde
x
Egypt (Hermes Index)-Trailing 90 Days
Source: Bloomberg
2,800
2,850
2,900
2,950
3,000
3,050
3,100
3,150
3,200
3,250
3,300
8/13 8/27 9/10 9/24 10/8 10/22 11/5
Inde
x
Singapore (Straits Times Index)-Trailing 90 Days
Source: Bloomberg
Equities – Emerging and Frontier Markets
Last Change % Chg. YTD % Last Change % Chg. YTD %Mexico IPC 44,263.74 -1269.55 -2.8% -10.5% Hang Seng Index 25,601.92 -884.43 -3.3% -14.4%Brazil (Bovespa Index) 85,641.19 -2777.84 -3.1% 12.1% India (Sensex 30) 35,158.55 146.90 0.4% 3.2%MOEX Index (Russia) 2,403.47 25.52 1.1% 13.9% Malaysia (KLCI Index) 1,708.09 1.17 0.1% -4.9%Czech Republic (Prague) 1,089.08 21.35 2.0% 1.0% Singapore (Straits Times Index) 3,077.97 17.12 0.6% -9.5%Turkey (Istanbul) 92,839.19 -1283.81 -1.4% -19.5% Thailand (SET Index) 1,668.52 -13.32 -0.8% -4.9%Egypt (Hermes Index) 1,321.68 55.39 4.4% -8.0% Indonesia (Jakarta) 5,874.15 -32.14 -0.5% -7.6%Kenya (Nairobi 20 Index) 2,833.29 2.19 0.1% -23.7% Pakistan (Karachi KSE 100) 41,388.88 -615.21 -1.5% 2.3%Saudi Arabia (TASI Index) 7,743.39 -135.98 -1.7% 7.2% Vietnam (Ho Chi Minh) 914.29 -10.57 -1.1% -7.1%Lebanon (Beirut BLOM Index) 973.59 -5.82 -0.6% -15.2% Sri Lanka (Colombo) 5,978.63 -135.50 -2.2% -6.1%Palestine 529.13 1.94 0.4% -7.9% Cambodia (Laos) 828.57 -10.40 -1.2% -17.0%
EMERGING AND FRONTIER MARKET PERFORMANCE
Source: Bloomberg; Index % change is based on price.
© 2018 Envestnet, Inc. All rights reserved. FOR ONE-ON-ONE USE WITH A CLIENT’S FINANCIAL ADVISOR ONLY.
PMC Weekly Market Review November 9, 2018
YIELD CURVES
8
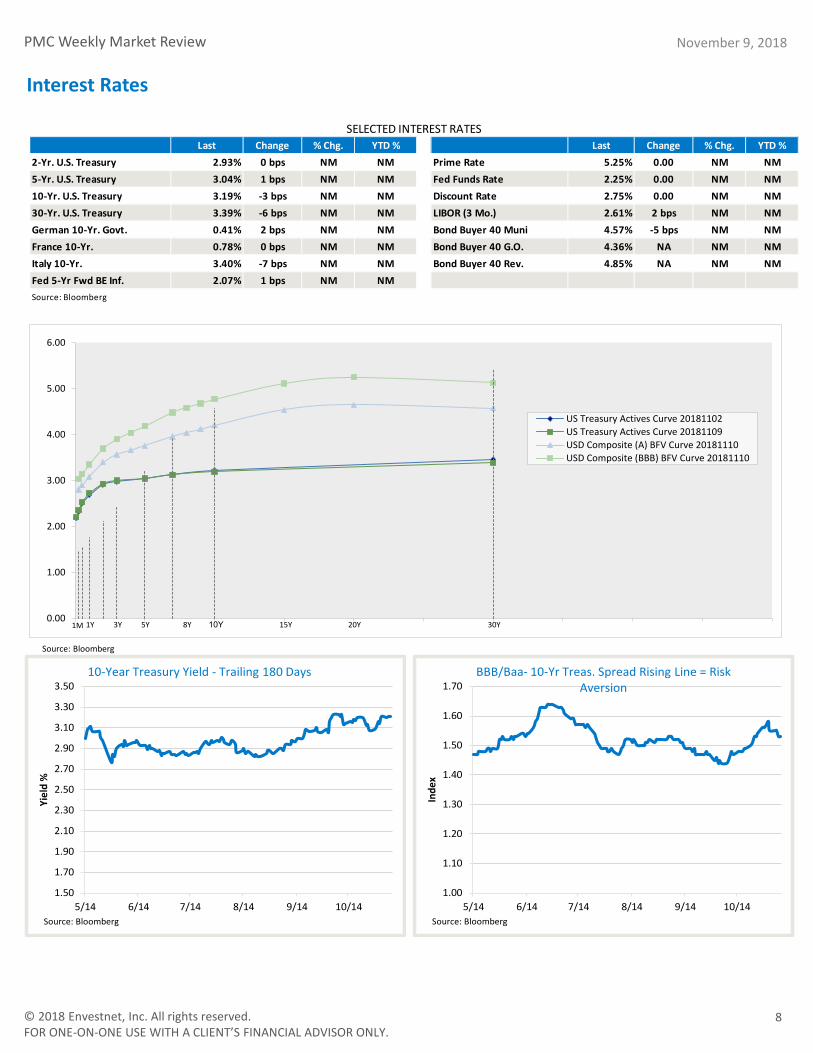
Last Change % Chg. YTD % Last Change % Chg. YTD %2-Yr. U.S. Treasury 2.93% 0 bps NM NM Prime Rate 5.25% 0.00 NM NM5-Yr. U.S. Treasury 3.04% 1 bps NM NM Fed Funds Rate 2.25% 0.00 NM NM10-Yr. U.S. Treasury 3.19% -3 bps NM NM Discount Rate 2.75% 0.00 NM NM30-Yr. U.S. Treasury 3.39% -6 bps NM NM LIBOR (3 Mo.) 2.61% 2 bps NM NMGerman 10-Yr. Govt. 0.41% 2 bps NM NM Bond Buyer 40 Muni 4.57% -5 bps NM NMFrance 10-Yr. 0.78% 0 bps NM NM Bond Buyer 40 G.O. 4.36% NA NM NMItaly 10-Yr. 3.40% -7 bps NM NM Bond Buyer 40 Rev. 4.85% NA NM NMFed 5-Yr Fwd BE Inf. 2.07% 1 bps NM NM
SELECTED INTEREST RATES
Source: Bloomberg
1M 1Y 3Y 5Y 8Y 10Y 15Y 20Y 30Y0.00
1.00
2.00
3.00
4.00
5.00
6.00
US Treasury Actives Curve 20181102US Treasury Actives Curve 20181109USD Composite (A) BFV Curve 20181110USD Composite (BBB) BFV Curve 20181110
1.50
1.70
1.90
2.10
2.30
2.50
2.70
2.90
3.10
3.30
3.50
5/14 6/14 7/14 8/14 9/14 10/14
Yiel
d %
10-Year Treasury Yield - Trailing 180 Days
Source: Bloomberg
1.00
1.10
1.20
1.30
1.40
1.50
1.60
1.70
5/14 6/14 7/14 8/14 9/14 10/14
Inde
x
BBB/Baa- 10-Yr Treas. Spread Rising Line = Risk Aversion
Source: Bloomberg
Source: Bloomberg
Interest Rates

© 2018 Envestnet, Inc. All rights reserved. FOR ONE-ON-ONE USE WITH A CLIENT’S FINANCIAL ADVISOR ONLY.
PMC Weekly Market Review November 9, 2018
9
90
91
92
93
94
95
96
97
98
5/14 6/14 7/14 8/14 9/14 10/14
U.S. Dollar Index - Trailing Six Months
Source: Bloomberg
0.80
0.85
0.90
0.95
1.00
1.05
1.10
1.15
1.20
1.25
5/14 6/14 7/14 8/14 9/14 10/14
Euro - U.S. Dollars per Euro
Source: Bloomberg
105.00
106.00
107.00
108.00
109.00
110.00
111.00
112.00
113.00
114.00
115.00
5/14 6/14 7/14 8/14 9/14 10/14
Japanese yen - Yen per U.S. Dollar
Source: Bloomberg
Last Change % Chg. YTD % Last Change % Chg. YTD %Dollar Index 96.89 0.349 0.36% 5.17% Chinese Yuan 6.96 0.066 -0.95% -6.47%Euro 1.13 -0.005 -0.45% -5.56% Swiss Franc 1.01 0.002 -0.21% -3.11%Japanese Yen 113.79 0.590 -0.52% -0.97% New Zealand Dollar 0.67 0.008 1.17% -5.06%British Pound 1.30 0.000 0.02% -4.00% Brazilian Real 3.73 0.031 -0.82% -11.31%Canadian Dollar 1.32 0.009 -0.65% -4.74% Mexican Peso 20.09 0.088 -0.44% -2.20%
SELECTED CURRENCY PERFORMANCE
Source: Bloomberg
6.00
6.20
6.40
6.60
6.80
7.00
7.20
5/14 6/14 7/14 8/14 9/14 10/14
Chinese yuan - yuan per U.S. Dollar
Source: Bloomberg
Currencies

© 2018 Envestnet, Inc. All rights reserved. FOR ONE-ON-ONE USE WITH A CLIENT’S FINANCIAL ADVISOR ONLY.
PMC Weekly Market Review November 9, 2018
10
0
10
20
30
40
50
60
70
80
90
5/14 6/14 7/14 8/14 9/14 10/14
$ pe
r bar
rel
Crude Oil - Light Crude ($ per barrel)
Source: Bloomberg
1,100
1,150
1,200
1,250
1,300
1,350
5/14 6/14 7/14 8/14 9/14 10/14
$ pe
r oun
ce
Gold - Spot gold price ($ per ounce)
Source: Bloomberg
320
340
360
380
400
420
440
5/14 6/14 7/14 8/14 9/14 10/14
$ pe
r bus
hel
Corn - Active Contract
Source: Bloomberg
Last Change % Chg. YTD % Last Change % Chg. YTD %Bloomberg Comm. Idx. 82.89 -0.99 -1.18% -5.98% Platinum Spot $853.31 -$14.75 -1.70% -8.06%Crude Oil $59.80 -$3.28 -5.19% 3.08% Corn 369.75 -1.50 -0.40% -3.71%Natural Gas $3.72 $0.43 13.19% 24.02% Wheat 502.00 -6.75 -1.33% 4.15%Gasoline ($/Gal.) $2.72 -$0.05 -1.84% 9.49% Soybeans 886.75 -1.00 -0.11% -9.79%Heating Oil 215.67 -1.52 -0.70% 10.38% Sugar 12.73 -0.71 -5.28% -18.87%Gold Spot $1,209.51 -$23.22 -1.88% -7.15% Orange Juice 136.15 -2.00 -1.45% -4.99%Silver Spot $14.16 -$0.55 -3.75% -16.38% Aluminum 1,990.00 17.00 0.86% -12.26%Source: Bloomberg; % change is based on price. Copper 6,155.00 -128.00 -2.04% -15.07%
SELECTED COMMODITY MARKET PERFORMANCE
Commodities
0
1,000
2,000
3,000
4,000
5,000
6,000
7,000
8,000
5/14 6/14 7/14 8/14 9/14 10/14
Inde
x
Copper
Source: Bloomberg
© 2018 Envestnet, Inc. All rights reserved. FOR ONE-ON-ONE USE WITH A CLIENT’S FINANCIAL ADVISOR ONLY.
PMC Weekly Market Review November 9, 2018
11
1,180
1,190
1,200
1,210
1,220
1,230
1,240
1,250
1,260
1,270
1,280
8/13 8/27 9/10 9/24 10/8 10/22 11/5
Inde
x
HFRX Global Hedge Fund Index - Trailing 90 Days
Source: Bloomberg
975
980
985
990
995
1,000
1,005
1,010
8/13 8/27 9/10 9/24 10/8 10/22 11/5
Inde
x
HFRX Equity Market Neutral - Trailing 90 Days
Source: Bloomberg
1,475
1,480
1,485
1,490
1,495
1,500
1,505
8/13 8/27 9/10 9/24 10/8 10/22 11/5
Inde
x
IQ Fixed Income Beta Arb Index - Trailing 90 Days
Source: Bloomberg
1,120
1,140
1,160
1,180
1,200
1,220
1,240
1,260
1,280
1,300
8/13 8/27 9/10 9/24 10/8 10/22 11/5
Inde
x
HFRX Equity Hedge Index - Trailing 90 Days
Source: Bloomberg
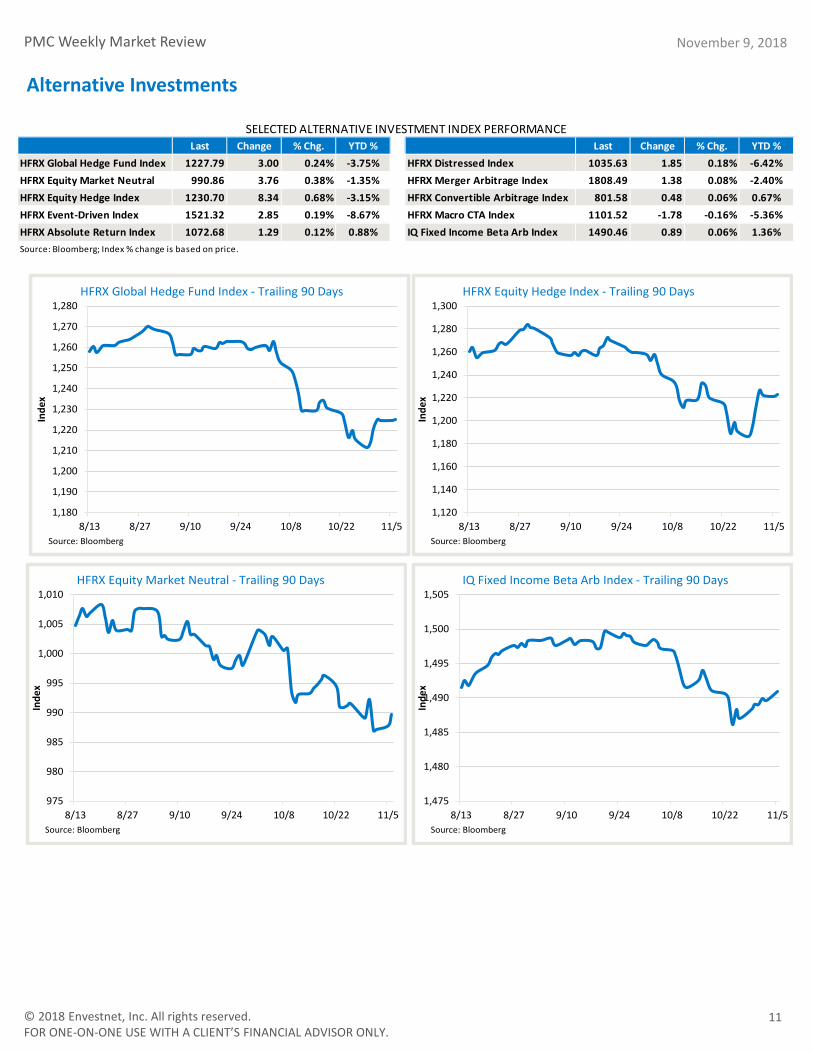
Last Change % Chg. YTD % Last Change % Chg. YTD %HFRX Global Hedge Fund Index 1227.79 3.00 0.24% -3.75% HFRX Distressed Index 1035.63 1.85 0.18% -6.42%HFRX Equity Market Neutral 990.86 3.76 0.38% -1.35% HFRX Merger Arbitrage Index 1808.49 1.38 0.08% -2.40%HFRX Equity Hedge Index 1230.70 8.34 0.68% -3.15% HFRX Convertible Arbitrage Index 801.58 0.48 0.06% 0.67%HFRX Event-Driven Index 1521.32 2.85 0.19% -8.67% HFRX Macro CTA Index 1101.52 -1.78 -0.16% -5.36%HFRX Absolute Return Index 1072.68 1.29 0.12% 0.88% IQ Fixed Income Beta Arb Index 1490.46 0.89 0.06% 1.36%
SELECTED ALTERNATIVE INVESTMENT INDEX PERFORMANCE
Source: Bloomberg; Index % change is based on price.
Alternative Investments
© 2018 Envestnet, Inc. All rights reserved. FOR ONE-ON-ONE USE WITH A CLIENT’S FINANCIAL ADVISOR ONLY.
PMC Weekly Market Review
3.40
3.50
3.60
3.70
3.80
3.90
4.00
4.10
4.20
4.30
4.40
4.50
5/14 6/14 7/14 8/14 9/14 10/14
Inde
x
S&P 500/MSCI EAFE - Trailing 180 Days
Source: Bloomberg
1.40
1.45
1.50
1.55
1.60
1.65
5/14 6/14 7/14 8/14 9/14 10/14
Inde
x
MSCI EAFE/MSCI EM - Trailing 180 Days
Source: Bloomberg
0.35
0.36
0.37
0.38
0.39
0.40
0.41
0.42
0.43
5/14 6/14 7/14 8/14 9/14 10/14
Inde
xLarge Cap/Small Cap - Trailing 180 Days
Source: Bloomberg
0.88
0.89
0.90
0.91
0.92
0.93
0.94
0.95
0.96
0.97
0.98
5/14 6/14 7/14 8/14 9/14 10/14
Inde
x
Growth/Value - Trailing 180 Days
Source: Bloomberg
November 9, 2018
12
3.00
3.50
4.00
4.50
5.00
5.50
6.00
6.50
7.00
7.50
5/14 6/14 7/14 8/14 9/14 10/14
Inde
x
S&P 500/MSCI EM - Trailing 180 Days
Source: Bloomberg
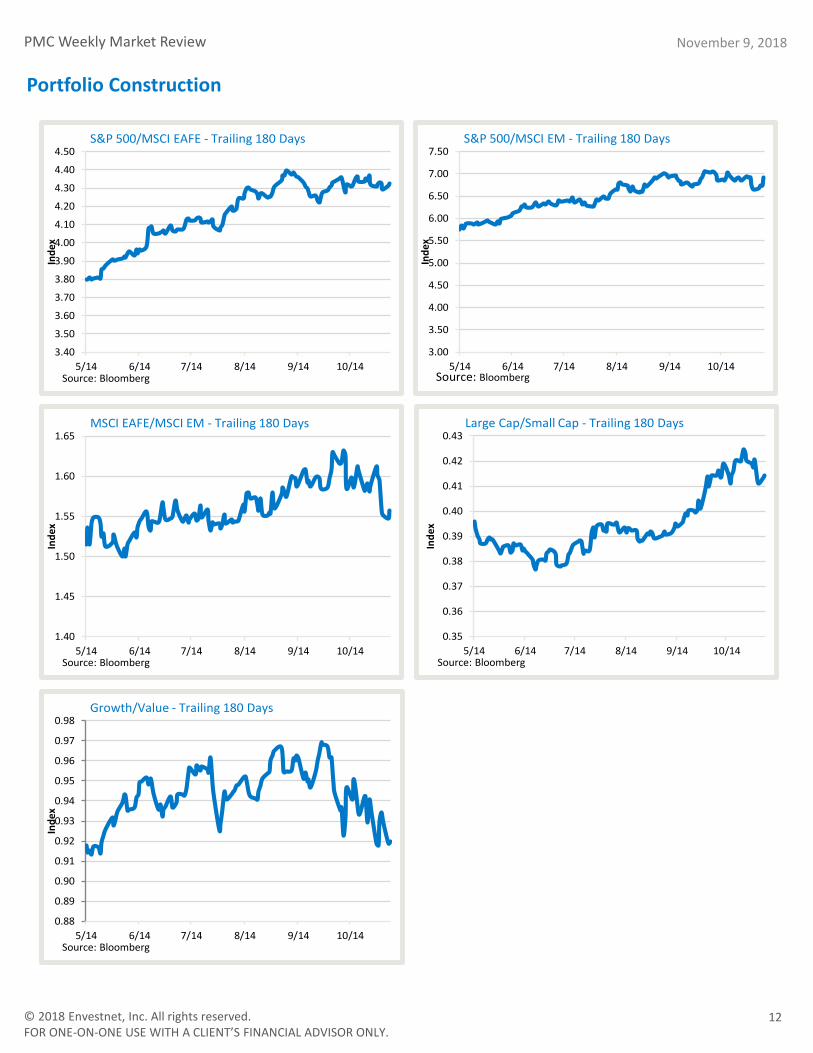
Portfolio Construction
© 2018 Envestnet, Inc. All rights reserved. FOR ONE-ON-ONE USE WITH A CLIENT’S FINANCIAL ADVISOR ONLY.
PMC Weekly Market Review
0.300
0.302
0.304
0.306
0.308
0.310
0.312
0.314
0.316
5/14 6/14 7/14 8/14 9/14 10/14
Inde
xHigh Yield/Inv. Grade Bonds - Trailing 180 Days
Source: Bloomberg
0.244
0.246
0.248
0.250
0.252
0.254
0.256
0.258
0.260
0.262
0.264
5/14 6/14 7/14 8/14 9/14 10/14
Inde
x
Info Tech/S&P 500 - Trailing 180 Days
Source: Bloomberg
1.78
1.79
1.80
1.81
1.82
1.83
1.84
1.85
1.86
5/14 6/14 7/14 8/14 9/14 10/14
Inde
x
Inv. Grade Bonds/Int. Govt. Bonds - Trailing 180 Days
Source: Bloomberg
0.56
0.56
0.57
0.57
0.58
0.58
0.59
5/14 6/14 7/14 8/14 9/14 10/14
Inde
x
High Yield Bonds/Int. Govt. Bonds - Trailing 180 Days
Source: Bloomberg
November 9, 2018
13
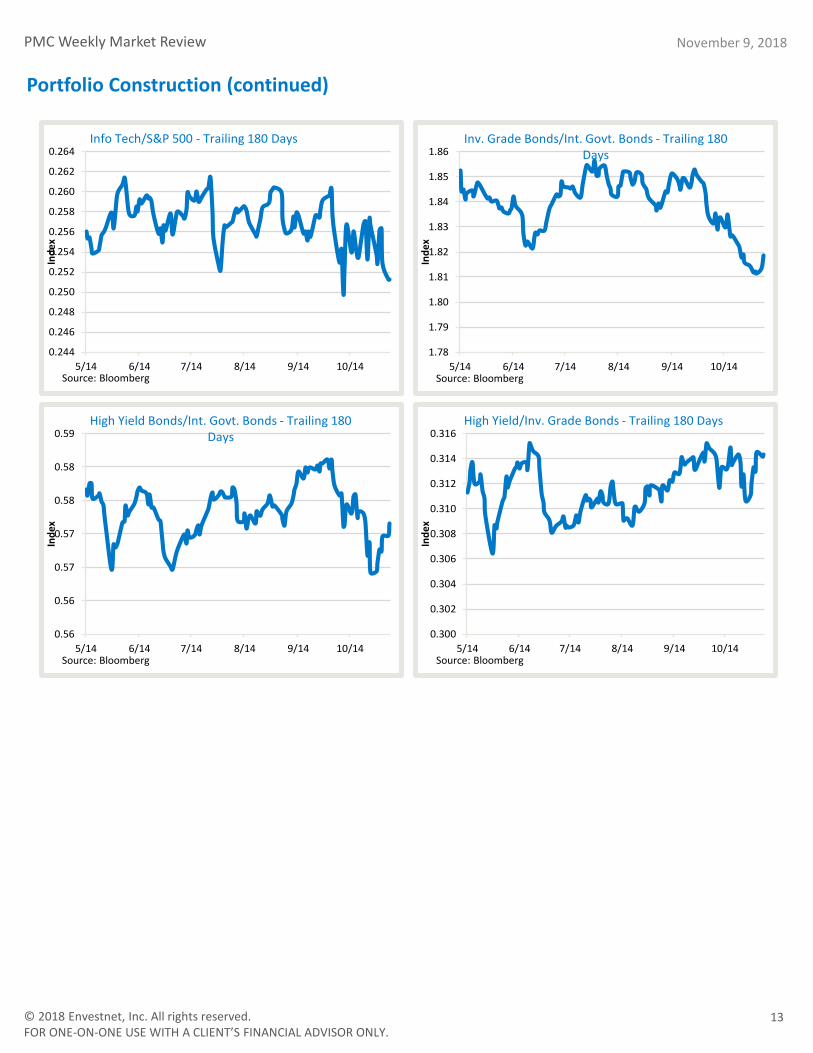
Portfolio Construction (continued)
© 2018 Envestnet, Inc. All rights reserved. FOR ONE-ON-ONE USE WITH A CLIENT’S FINANCIAL ADVISOR ONLY.
PMC Weekly Market Review
14
November 9, 2018
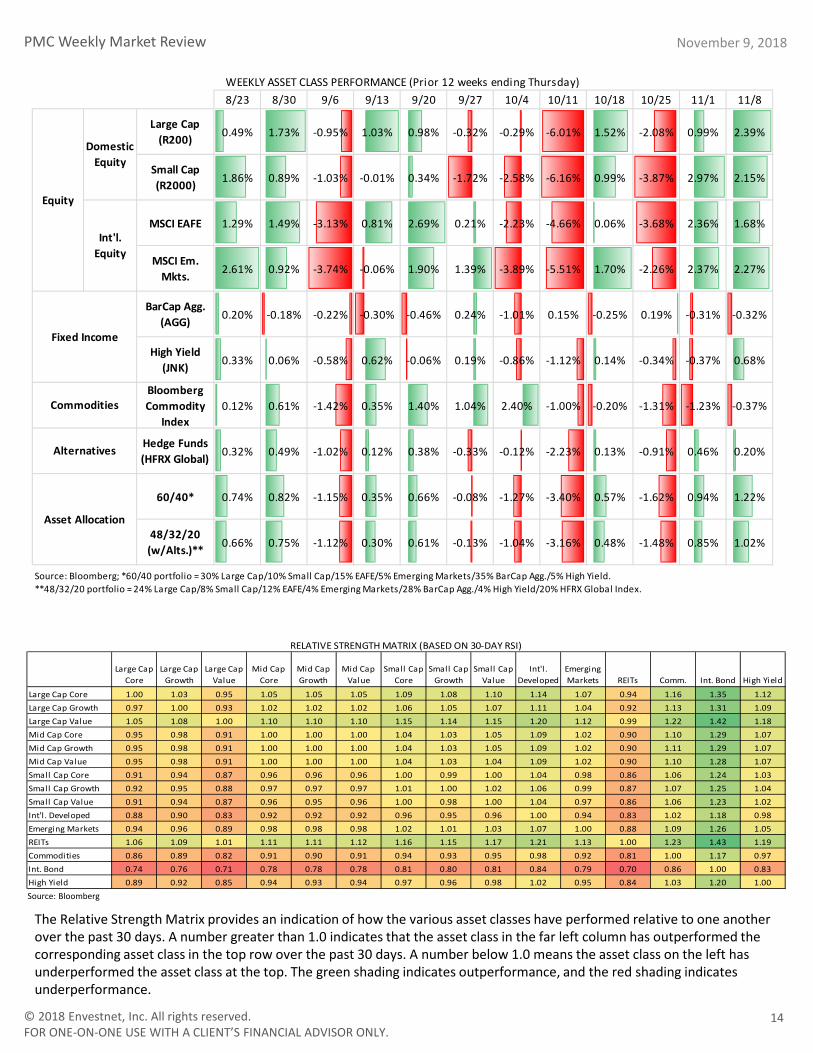
The Relative Strength Matrix provides an indication of how the various asset classes have performed relative to one another over the past 30 days. A number greater than 1.0 indicates that the asset class in the far left column has outperformed the corresponding asset class in the top row over the past 30 days. A number below 1.0 means the asset class on the left has underperformed the asset class at the top. The green shading indicates outperformance, and the red shading indicates underperformance.
Source: Bloomberg
Large Cap Core
Large Cap Growth
Large Cap Value
Mid Cap Core
Mid Cap Growth
Mid Cap Value
Small Cap Core
Small Cap Growth
Small Cap Value
Int'l . Developed
Emerging Markets REITs Comm. Int. Bond High Yield
Large Cap Core 1.00 1.03 0.95 1.05 1.05 1.05 1.09 1.08 1.10 1.14 1.07 0.94 1.16 1.35 1.12Large Cap Growth 0.97 1.00 0.93 1.02 1.02 1.02 1.06 1.05 1.07 1.11 1.04 0.92 1.13 1.31 1.09Large Cap Value 1.05 1.08 1.00 1.10 1.10 1.10 1.15 1.14 1.15 1.20 1.12 0.99 1.22 1.42 1.18Mid Cap Core 0.95 0.98 0.91 1.00 1.00 1.00 1.04 1.03 1.05 1.09 1.02 0.90 1.10 1.29 1.07Mid Cap Growth 0.95 0.98 0.91 1.00 1.00 1.00 1.04 1.03 1.05 1.09 1.02 0.90 1.11 1.29 1.07Mid Cap Value 0.95 0.98 0.91 1.00 1.00 1.00 1.04 1.03 1.04 1.09 1.02 0.90 1.10 1.28 1.07Small Cap Core 0.91 0.94 0.87 0.96 0.96 0.96 1.00 0.99 1.00 1.04 0.98 0.86 1.06 1.24 1.03Small Cap Growth 0.92 0.95 0.88 0.97 0.97 0.97 1.01 1.00 1.02 1.06 0.99 0.87 1.07 1.25 1.04Small Cap Value 0.91 0.94 0.87 0.96 0.95 0.96 1.00 0.98 1.00 1.04 0.97 0.86 1.06 1.23 1.02Int'l . Developed 0.88 0.90 0.83 0.92 0.92 0.92 0.96 0.95 0.96 1.00 0.94 0.83 1.02 1.18 0.98Emerging Markets 0.94 0.96 0.89 0.98 0.98 0.98 1.02 1.01 1.03 1.07 1.00 0.88 1.09 1.26 1.05REITs 1.06 1.09 1.01 1.11 1.11 1.12 1.16 1.15 1.17 1.21 1.13 1.00 1.23 1.43 1.19Commodities 0.86 0.89 0.82 0.91 0.90 0.91 0.94 0.93 0.95 0.98 0.92 0.81 1.00 1.17 0.97Int. Bond 0.74 0.76 0.71 0.78 0.78 0.78 0.81 0.80 0.81 0.84 0.79 0.70 0.86 1.00 0.83High Yield 0.89 0.92 0.85 0.94 0.93 0.94 0.97 0.96 0.98 1.02 0.95 0.84 1.03 1.20 1.00
RELATIVE STRENGTH MATRIX (BASED ON 30-DAY RSI)
8/23 8/30 9/6 9/13 9/20 9/27 10/4 10/11 10/18 10/25 11/1 11/8
Large Cap (R200) 0.49% 1.73% -0.95% 1.03% 0.98% -0.32% -0.29% -6.01% 1.52% -2.08% 0.99% 2.39%
Small Cap (R2000) 1.86% 0.89% -1.03% -0.01% 0.34% -1.72% -2.58% -6.16% 0.99% -3.87% 2.97% 2.15%
MSCI EAFE 1.29% 1.49% -3.13% 0.81% 2.69% 0.21% -2.23% -4.66% 0.06% -3.68% 2.36% 1.68%
MSCI Em. Mkts. 2.61% 0.92% -3.74% -0.06% 1.90% 1.39% -3.89% -5.51% 1.70% -2.26% 2.37% 2.27%
BarCap Agg. (AGG) 0.20% -0.18% -0.22% -0.30% -0.46% 0.24% -1.01% 0.15% -0.25% 0.19% -0.31% -0.32%
High Yield (JNK) 0.33% 0.06% -0.58% 0.62% -0.06% 0.19% -0.86% -1.12% 0.14% -0.34% -0.37% 0.68%
Bloomberg Commodity
Index0.12% 0.61% -1.42% 0.35% 1.40% 1.04% 2.40% -1.00% -0.20% -1.31% -1.23% -0.37%
Hedge Funds (HFRX Global) 0.32% 0.49% -1.02% 0.12% 0.38% -0.33% -0.12% -2.23% 0.13% -0.91% 0.46% 0.20%
60/40* 0.74% 0.82% -1.15% 0.35% 0.66% -0.08% -1.27% -3.40% 0.57% -1.62% 0.94% 1.22%
48/32/20 (w/Alts.)** 0.66% 0.75% -1.12% 0.30% 0.61% -0.13% -1.04% -3.16% 0.48% -1.48% 0.85% 1.02%
Source: Bloomberg; *60/40 portfolio = 30% Large Cap/10% Small Cap/15% EAFE/5% Emerging Markets/35% BarCap Agg./5% High Yield.**48/32/20 portfolio = 24% Large Cap/8% Small Cap/12% EAFE/4% Emerging Markets/28% BarCap Agg./4% High Yield/20% HFRX Global Index.
WEEKLY ASSET CLASS PERFORMANCE (Prior 12 weeks ending Thursday)
Alternatives
Asset Allocation
Domestic Equity
Int'l. Equity
Fixed Income
Commodities
Equity
© 2018 Envestnet, Inc. All rights reserved. FOR ONE-ON-ONE USE WITH A CLIENT’S FINANCIAL ADVISOR ONLY.
PMC Weekly Market Review November 9, 2018
15
Index Overview & Key Definitions Fed, The Fed or FED refers to the Federal Reserve System, the central bank of the United States. The Federal Open Market Committee (FOMC) is the monetary policymaking body of the Federal Reserve System. Fed Funds Rate, the interest rate at which a depository institution lends funds maintained at the Federal Reserve to another depository institution overnight. The European Central Bank (ECB) is the central bank for Europe's single currency, the euro. The ECB’s main task is to maintain the euro's purchasing power and thus price stability in the euro area. The euro area comprises the 19 European Union countries that have introduced the euro since 1999. The Gross Domestic Product (GDP) rate is a measurement of the output of goods and services produced by labor and property located in the United States. Basis Point(s) is a unit that is equal to 1/100th of 1%, and is used to denote the change in a financial instrument. The basis point is commonly used for calculating changes in interest rates, equity indexes and the yield of a fixed-income security. A separately managed account (SMA) is an individual managed investment account offered typically by a brokerage firm through one of their brokers or financial consultants and managed by independent investment management firms (often called money managers for short) and have varying fee structures. The Consumer Price Index (CPI) measures the change in the cost of a fixed basket of products and services. The Producer Price Index (PPI) program measures the average change over time in the selling prices received by domestic producers for their output. The prices included in the PPI are from the first commercial transaction for many products and some services. Core CPI is an additional CPI Index, excludes energy and food item price changes, and measures the “core” or “underlying” rate of inflation. The PCE (Personal Consumption Expenditure) Index of Prices is a US---wide indicator of the average increase in prices for all domestic personal consumption. Using a variety of data including U.S. Consumer Price Index and Producer Price Index prices, it is derived from personal consumption expenditures; essentially a measure of goods and services targeted towards individuals and consumed by individuals. The Purchasing Managers' Index (PMI) is an indicator of the economic health of the manufacturing sector. The PMI is based on five major indicators: new orders, inventory levels, production, supplier deliveries and the employment environment. Brexit is a commonly used term for the United Kingdom's withdrawal from the European Union. The Kansas City Fed Manufacturing Survey monitors manufacturing plants selected according to geographic distribution, industry mix and size in the Tenth Federal Reserve District. West Texas Intermediate (WTI), also known as Texas light sweet, is a grade of crude oil used as a benchmark in oil pricing. Risk Premium is the return in excess of the risk-free rate of return an investment is expected to yield. LIBOR or ICE LIBOR (previously BBA LIBOR) is a benchmark rate, which some of the world’s leading banks charge each other for short-term loans. It stands for Intercontinental Exchange London Interbank Offered Rate and serves as the first step to calculating interest rates on various loans throughout the world. The Dow Jones Industrial Average (DOW or DJIA) is an unmanaged index of 30 common stocks comprised of 30 actively traded blue chip stocks, primarily industrials and assumes reinvestment of dividends. The S&P 500 Index is an unmanaged index comprised of 500 widely held securities considered to be representative of the stock market in general. The S&P/Case-Shiller Home Price Indices measure the residential housing market, tracking changes in the value of the residential real estate market in 20 metropolitan regions across the United States. The Nasdaq Composite Index is a stock market index of the common stocks and similar securities listed on the NASDAQ stock market. The US Dollar Index is a measure of the value of the United States dollar relative to a basket of foreign currencies. It is a weighted geometric mean of the dollar's value relative to other select currencies (Euro, Japanese yen, Pound sterling, Canadian dollar, Swedish krona (SEK) & Swiss franc). The FTSE 100 Index (FTSE 100) is a share index of the 100 companies listed on the London Stock Exchange (LSE) with the highest market capitalization. The Bloomberg Commodity Index (formerly the Dow Jones-UBS Commodity Index) tracks prices of futures contracts on physical commodities on the commodity markets and is designed to minimize concentration in any one commodity or sector (currently 22 commodity futures in seven sectors). The Barclays Capital US Credit Index is an unmanaged index considered representative of publicly issued, SEC-registered US corporate and specified foreign debentures and secured notes. The Barclays Capital US Aggregate Bond Index is a market capitalization-weighted index of investment-grade, fixed-rate debt issues, including government, corporate, asset-backed, and mortgage-backed securities, with maturities of at least one year. The Barclays Capital US Corporate High Yield Index covers the USD-denominated, non-investment grade, fixed-rate, taxable corporate bond market. Securities are classified as high-yield if the middle rating of Moody’s, Fitch and S&P is Ba1/BB+/BB+ or below. The index may include emerging market debt. The Barclays Capital Municipal Bond Index is an unmanaged index comprised of investment-grade, fixed-rate municipal securities representative of the tax-exempt bond market in general. The Barclays Capital US Treasury Total Return Index is an unmanaged index of public obligations of the US Treasury with a remaining maturity of one year or more. The Barclays Capital Global Aggregate ex-U.S. Index is a market capitalization-weighted index, meaning the securities in the index are weighted according to the market size of each bond type. Most U.S. traded investment grade bonds are represented. Municipal bonds, and Treasury Inflation-Protected Securities are excluded, due to tax treatment issues. The index includes Treasury securities, Government agency bonds, Mortgage-backed bonds, Corporate bonds, and a small amount of foreign bonds traded in U.S. The Barclays Capital U.S. 5-10 Year Corporate Bond Index measures the investment return of U.S. dollar denominated, investment-grade, fixed rate, taxable securities issued by industrial, utility, and financial companies with maturities between 5 and 10 years. Treasury securities, mortgage-backed securities (MBS) foreign bonds, government agency bonds and corporate bonds are some of the categories included in the index. The Barclays Capital U.S Corporate High-Yield Index is composed of fixed-rate, publicly issued, non-investment grade debt. The Barclays Capital U.S. Corporate 5-10 Year Index includes U.S. dollar-denominated, investment-grade, fixed-rate, taxable securities issued by industrial, utility, & financial companies, with maturities between 5 & 10 years. The Russell 1000 Index is a market capitalization-weighted benchmark index made up of the 1000 largest U.S. companies in the Russell 3000 Index. The Russell 1000 Growth Index is an unmanaged index considered representative of large-cap growth stocks. The Russell 1000 Value Index is an unmanaged index considered representative of large-cap value stocks. The Russell 2000 Index is an unmanaged index considered representative of small-cap stocks. The Russell 2000 Growth Index is an unmanaged index considered representative of small-cap growth stocks. The Russell 2000 Growth Index is an unmanaged index considered representative of small-cap value stocks. The Russell 3000 Index is an unmanaged index considered representative of the US stock market. The Russell Midcap Index is a subset of the Russell 1000 Index. It includes approximately 800 of the smallest securities based on a combination of their market cap and current index membership. The Russell Midcap Growth Index is an unmanaged index considered representative of mid-cap growth stocks. The Russell Midcap Value Index is an unmanaged index considered representative of mid-cap value stocks. The HFRX Indices are a series of benchmarks of hedge fund industry performance which are engineered to achieve representative performance of a larger universe of hedge fund strategies. Hedge Fund Research, Inc. employs the HFRX Methodology (UCITS compliant), a proprietary and highly quantitative process by which hedge funds are selected as constituents for the HFRX Indices. The University of Michigan Consumer Sentiment Index (MCSI) is a survey of consumer confidence conducted by the University of Michigan using telephone surveys to gather information on consumer expectations regarding the overall economy. The CBOE Volatility Index (VIX) is an up-to-the-minute market estimate of expected volatility that is calculated by using real-time S&P 500 Index option bid/ask quotes. The Index uses nearby and second nearby options with at least 8 days left to expiration and then weights them to yield a constant, 30-day measure of the expected volatility of the S&P 500 Index. The MSCI EAFE Index is designed to measure the equity market performance of developed markets outside of the U.S. & Canada. The MSCI EAFE Growth Index is an unmanaged index considered representative of growth stocks of Europe, Australasia and the Far East. The MSCI EAFE Value Index is an unmanaged index considered representative of value stocks of Europe, Australasia and the Far East. The MSCI EM (Emerging Markets) Latin America Index is a free float-adjusted market capitalization weighted index that is designed to measure the equity market performance of emerging markets in Latin America. The MSCI World ex-U.S. Index captures large and mid-cap representation across 22 of 23 Developed Markets (DM) countries - excluding the US. With 1,002 constituents, the index covers approximately 85% of the free float-adjusted market capitalization in each country. The MSCI Japan Index is designed to measure the performance of the large and mid-cap segments of the Japanese market. With 320 constituents, the index covers approximately 85% of the free float-adjusted market capitalization in Japan. The MSCI Emerging Markets Index is a free float-adjusted market capitalization index that is designed to measure equity market performance in the global emerging markets. The MSCI Europe Index is an unmanaged index considered representative of stocks of developed European countries. The MSCI Pacific Index is a free float-adjusted market capitalization weighted index that is designed to measure the equity market performance of the developed markets in the Pacific region. The Barclays Intermediate US Government/Credit Bond Index is a market capitalization-weighted index of investment-grade, fixed-rate debt issues, including Treasuries, government-related and U.S. corporate securities, with maturities of at least one year and less than 10 years. The NY Empire State Manufacturing Index is based on the monthly survey of manufacturers in New York State – known as the Empire State Manufacturing Survey – conducted by the Federal Reserve Bank of New York. The S&P The Dow Jones Wilshire U.S. REIT Index tracks the performance of publicly traded REITs and REIT-like securities and is designed to serve as a proxy for direct real estate investment, in part by excluding companies whose performance may be driven by factors other than the value of real estate. The Russell Top 200 Index measures the performance of the 200 largest companies in the Russell 1000 Index, with a weighted average market capitalization of $186 billion. The Barclays 1-3 Year US Treasury Bond Index measures public US Treasury obligations with remaining maturities of one to three years. The S&P LSTA Leveraged Loan Index is an unmanaged capitalization-weighted syndicated loan index based upon market weightings, spreads and interest payments. It covers the US market back to 1997 and currently calculates on a daily basis. The NFIB Small Business Optimism Index is compiled from a survey that is conducted each month by the National Federation of Independent Business (NFIB) of its members
© 2018 Envestnet, Inc. All rights reserved. FOR ONE-ON-ONE USE WITH A CLIENT’S FINANCIAL ADVISOR ONLY.
PMC Weekly Market Review November 9, 2018
16
The information, analysis, and opinions expressed herein are for general and educational purposes only. Nothing contained in this weekly review is intended to constitute legal, tax, accounting, securities, or investment advice, nor an opinion regarding the appropriateness of any investment, nor a solicitation of any type. All investments carry a certain risk, and there is no assurance that an investment will provide positive performance over any period of time. An investor may experience loss of principal. Investment decisions should always be made based on the investor’s specific financial needs and objectives, goals, time horizon, and risk tolerance. The asset classes and/or investment strategies described may not be suitable for all investors and investors should consult with an investment advisor to determine the appropriate investment strategy. Past performance is not indicative of future results. Information obtained from third party sources are believed to be reliable but not guaranteed. Envestnet|PMC™ makes no representation regarding the accuracy or completeness of information provided herein. All opinions and views constitute our judgments as of the date of writing and are subject to change at any time without notice. Investments in smaller companies carry greater risk than is customarily associated with larger companies for various reasons such as volatility of earnings and prospects, higher failure rates, and limited markets, product lines or financial resources. Investing overseas involves special risks, including the volatility of currency exchange rates and, in some cases, limited geographic focus, political and economic instability, and relatively illiquid markets. Income (bond) securities are subject to interest rate risk, which is the risk that debt securities in a portfolio will decline in value because of increases in market interest rates. Exchange Traded Funds (ETFs) are subject to risks similar to those of stocks, such as market risk. Investing in ETFs may bear indirect fees and expenses charged by ETFs in addition to its direct fees and expenses, as well as indirectly bearing the principal risks of those ETFs. ETFs may trade at a discount to their net asset value and are subject to the market fluctuations of their underlying investments. Investing in commodities can be volatile and can suffer from periods of prolonged decline in value and may not be suitable for all investors. Index Performance is presented for illustrative purposes only and does not represent the performance of any specific investment product or portfolio. An investment cannot be made directly into an index. Alternative Investments may have complex terms and features that are not easily understood and are not suitable for all investors. You should conduct your own due diligence to ensure you understand the features of the product before investing. Alternative investment strategies may employ a variety of hedging techniques and non-traditional instruments such as inverse and leveraged products. Certain hedging techniques include matched combinations that neutralize or offset individual risks such as merger arbitrage, long/short equity, convertible bond arbitrage and fixed-income arbitrage. Leveraged products are those that employ financial derivatives and debt to try to achieve a multiple (for example two or three times) of the return or inverse return of a stated index or benchmark over the course of a single day. Inverse products utilize short selling, derivatives trading, and other leveraged investment techniques, such as futures trading to achieve their objectives, mainly to track the inverse of their benchmarks. As with all investments, there is no assurance that any investment strategies will achieve their objectives or protect against losses. Neither Envestnet, Envestnet|PMC™ nor its representatives render tax, accounting or legal advice. Any tax statements contained herein are not intended or written to be used, and cannot be used, for the purpose of avoiding U.S. federal, state, or local tax penalties. Taxpayers should always seek advice based on their own particular circumstances from an independent tax advisor. SR# 1408601 © 2018 Envestnet Asset Management, Inc. All rights reserved. ABOUT ENVESTNET® Envestnet, Inc. (NYSE: ENV) is a leading provider of intelligent systems for wealth management and financial wellness. Envestnet’s unified technology enhances advisor productivity and strengthens the wealth management process, delivering unparalleled flexibility, accuracy, performance, and value. Envestnet enables a transparent, independent, objective, and fiduciary standard of care, and empowers enterprises and advisors to more fully understand their clients and deliver better outcomes. For more information on Envestnet, please visit www.envestnet.com.
Related Documents