1 June 14, 2013 This Document is for distribution to Canadian clients only. Please refer to Appendix A in this report for important information. In this Week’s Issue Canadian Equities Canadian Stock Idea: Sun Life Financial Inc. (SLF-T) ............................................................ 2 Canadian Earnings – Week in Review .................................................................................... 3 U.S. Equities Tapering Fears Put Markets on Edge ................................................................................. 4 - 5 Fixed Income Update ................................................................................................ 6 - 7 Market Statistics.......................................................................................................... 8 - 9 Key Charts ................................................................................................................ 10 - 11 Calendars Upcoming U.S. Earnings........................................................................................................ 12

Welcome message from author
This document is posted to help you gain knowledge. Please leave a comment to let me know what you think about it! Share it to your friends and learn new things together.
Transcript
1
June 14, 2013
This Document is for distribution to Canadian clients only. Please refer to Appendix A in this report for important information.
In this Week’s Issue Canadian Equities Canadian Stock Idea: Sun Life Financial Inc. (SLF-T) ............................................................ 2 Canadian Earnings – Week in Review .................................................................................... 3 U.S. Equities Tapering Fears Put Markets on Edge ................................................................................. 4 - 5 Fixed Income Update ................................................................................................ 6 - 7 Market Statistics .......................................................................................................... 8 - 9 Key Charts ................................................................................................................ 10 - 11
Calendars Upcoming U.S. Earnings........................................................................................................ 12
Weekly Insights June 14, 2013
Page 2
Canadian Equities Martha Hill, CFA
Canadian Stock Idea: Sun Life Financial Inc. (SLF-T)
Sector: FinancialsMarket Cap ($mil): $18,015
Current Dividend Price/Price Yield Book Trailing Forward 5-Yr Avg
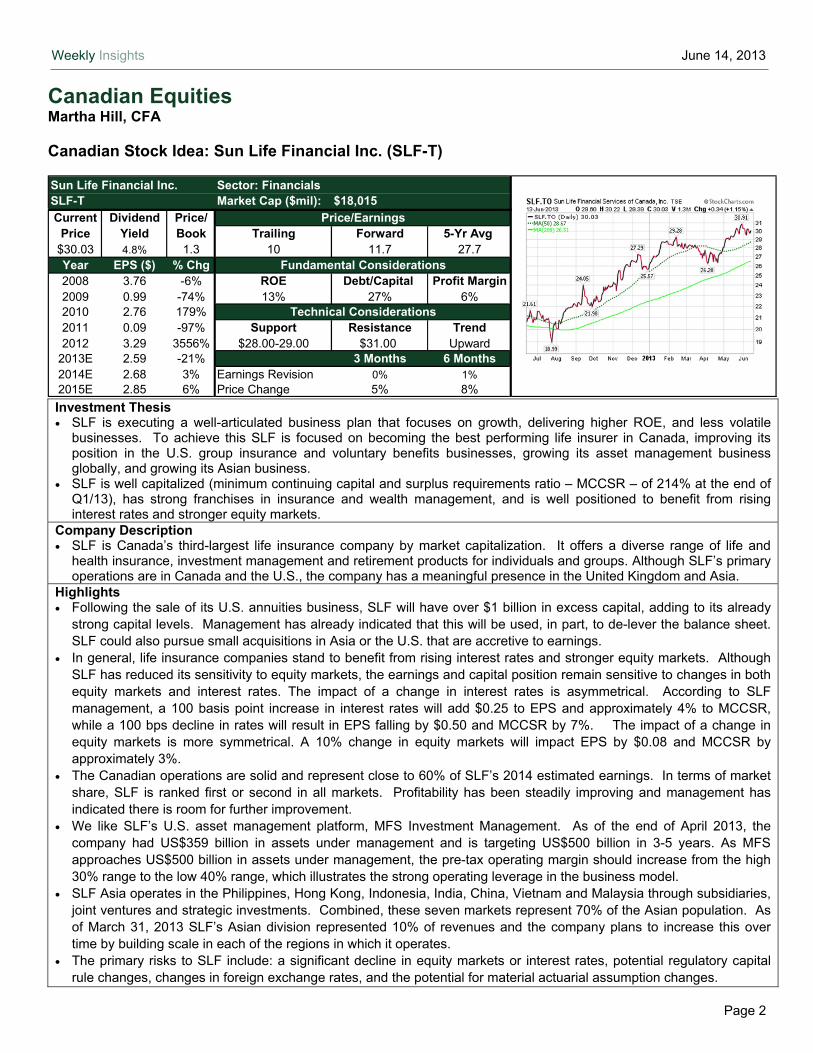
$30.03 4.8% 1.3 10 11.7 27.7Year EPS ($) % Chg2008 3.76 -6% ROE Debt/Capital Profit Margin2009 0.99 -74% 13% 27% 6%2010 2.76 179%2011 0.09 -97% Support Resistance Trend2012 3.29 3556% $28.00-29.00 $31.00 Upward
2013E 2.59 -21% 3 Months 6 Months2014E 2.68 3% Earnings Revision 0% 1%2015E 2.85 6% Price Change 5% 8%
Sun Life Financial Inc.SLF-T
Price/Earnings
Fundamental Considerations
Technical Considerations
Investment Thesis • SLF is executing a well-articulated business plan that focuses on growth, delivering higher ROE, and less volatile
businesses. To achieve this SLF is focused on becoming the best performing life insurer in Canada, improving its position in the U.S. group insurance and voluntary benefits businesses, growing its asset management business globally, and growing its Asian business.
• SLF is well capitalized (minimum continuing capital and surplus requirements ratio – MCCSR – of 214% at the end of Q1/13), has strong franchises in insurance and wealth management, and is well positioned to benefit from rising interest rates and stronger equity markets.
Company Description • SLF is Canada’s third-largest life insurance company by market capitalization. It offers a diverse range of life and
health insurance, investment management and retirement products for individuals and groups. Although SLF’s primary operations are in Canada and the U.S., the company has a meaningful presence in the United Kingdom and Asia.
Highlights • Following the sale of its U.S. annuities business, SLF will have over $1 billion in excess capital, adding to its already
strong capital levels. Management has already indicated that this will be used, in part, to de-lever the balance sheet. SLF could also pursue small acquisitions in Asia or the U.S. that are accretive to earnings.
• In general, life insurance companies stand to benefit from rising interest rates and stronger equity markets. Although SLF has reduced its sensitivity to equity markets, the earnings and capital position remain sensitive to changes in both equity markets and interest rates. The impact of a change in interest rates is asymmetrical. According to SLF management, a 100 basis point increase in interest rates will add $0.25 to EPS and approximately 4% to MCCSR, while a 100 bps decline in rates will result in EPS falling by $0.50 and MCCSR by 7%. The impact of a change in equity markets is more symmetrical. A 10% change in equity markets will impact EPS by $0.08 and MCCSR by approximately 3%.
• The Canadian operations are solid and represent close to 60% of SLF’s 2014 estimated earnings. In terms of market share, SLF is ranked first or second in all markets. Profitability has been steadily improving and management has indicated there is room for further improvement.
• We like SLF’s U.S. asset management platform, MFS Investment Management. As of the end of April 2013, the company had US$359 billion in assets under management and is targeting US$500 billion in 3-5 years. As MFS approaches US$500 billion in assets under management, the pre-tax operating margin should increase from the high 30% range to the low 40% range, which illustrates the strong operating leverage in the business model.
• SLF Asia operates in the Philippines, Hong Kong, Indonesia, India, China, Vietnam and Malaysia through subsidiaries, joint ventures and strategic investments. Combined, these seven markets represent 70% of the Asian population. As of March 31, 2013 SLF’s Asian division represented 10% of revenues and the company plans to increase this over time by building scale in each of the regions in which it operates.
• The primary risks to SLF include: a significant decline in equity markets or interest rates, potential regulatory capital rule changes, changes in foreign exchange rates, and the potential for material actuarial assumption changes.

Weekly Insights June 14, 2013
Page 3
Canadian Equities Shawn Levine, CFA Canadian Earnings – Week in Review
Dollarama Inc. (DOL-T) Consumer Discretionary
EPS ($/share)
Actual Cons Est +/- surprise
0.62
0.67 -
Revenue ($ mln) Actual Cons Est +/- surprise
448
449 -
• DOL delivered a rare miss in its Q1/F14, sending the shares down over 3% on the day of announcement. The miss was due in large part to costs incurred to accelerate its growth platform.
• DOL opened 21 new stores in Q1/14 and reiterated its target to open at least 80 new stores this fiscal year. Management highlighted that additional costs associated with new store openings, notably rent and labour expenses, weighed on margins and impacted EPS by three cents.
• Management noted it incurred other expenses to roll out various productivity initiatives that appear to have been accelerated. TD Securities expects Q2/F14 to be another challenging quarter as similar accelerated growth takes place, but expects these upfront costs to deliver improved results in H2/F14 and into FY2015.
• Same-store sales grew 3.7%, driven by a 4.6% increase in transaction size and a 0.9% decline in traffic that was largely weather related.
• The normal course issuer bid was renewed and increased to 5% of DOL’s float, from 3.5% under the previous program.
Bottom line: TD Securities upgraded DOL to Buy (from Hold) following the negative share price reaction. While the miss was clearly disappointing, we believe future quarters could benefit from the pace of new store openings and expect the investments in productivity initiatives to bear fruit. DOL’s solid balance sheet, strong free cash flow generation and defensive growth characteristics are expected to lead to further shareholder-friendly uses of excess capital, including being active on their share buyback plan and potential dividend increases.
Weekly Insights June 14, 2013
Page 4
1.20
1.40
1.60
1.80
2.00
2.20
2.40
1,400
1,450
1,500
1,550
1,600
1,650
1,700
01-J
an-1
3
08-J
an-1
3
15-J
an-1
3
22-J
an-1
3
29-J
an-1
3
05-F
eb-1
3
12-F
eb-1
3
19-F
eb-1
3
26-F
eb-1
3
05-M
ar-1
3
12-M
ar-1
3
19-M
ar-1
3
26-M
ar-1
3
02-A
pr-1
3
09-A
pr-1
3
16-A
pr-1
3
23-A
pr-1
3
30-A
pr-1
3
07-M
ay-1
3
14-M
ay-1
3
21-M
ay-1
3
28-M
ay-1
3
04-J
un-1
3
11-J
un-1
3
Yield
(%)
S&
P 5
00 I
nd
ex
S&P 500
10-Yr U.S. Treasury Yield
Source: Bloomberg Finance L.P. as of June 13, 2013
-2.4%-2.9% -3.0% -3.0% -3.1% -3.4%
-3.9% -4.0% -4.2%-4.6%
-7.5%-8%
-7%
-6%
-5%
-4%
-3%
-2%
-1%
0%
Info
rmat
ion
Tec
h
Con
sum
er S
tapl
es
Fin
anci
als
Hea
lth C
are
Indu
stria
ls
S&
P 5
00
Con
sum
er D
isc
Mat
eria
ls
Tel
ecom
Ene
rgy
Util
ities
Source: Bloomberg Finance L.P. as of June 13, 2013
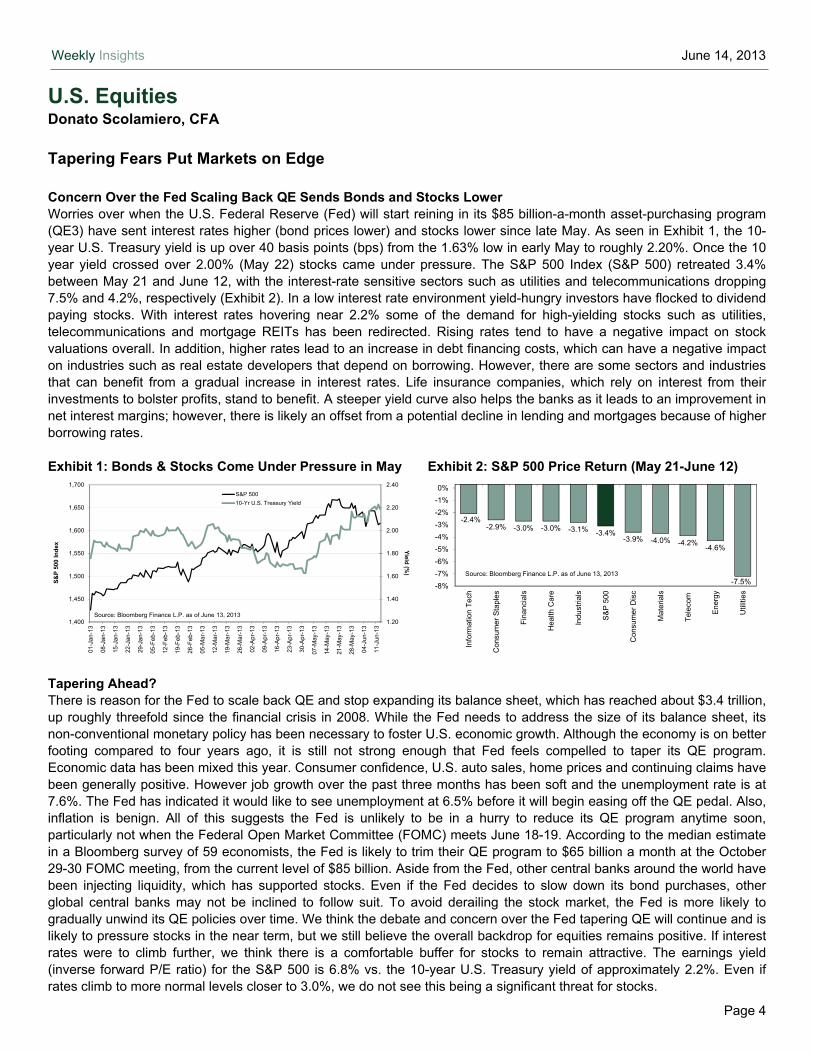
U.S. Equities Donato Scolamiero, CFA Tapering Fears Put Markets on Edge Concern Over the Fed Scaling Back QE Sends Bonds and Stocks Lower Worries over when the U.S. Federal Reserve (Fed) will start reining in its $85 billion-a-month asset-purchasing program (QE3) have sent interest rates higher (bond prices lower) and stocks lower since late May. As seen in Exhibit 1, the 10-year U.S. Treasury yield is up over 40 basis points (bps) from the 1.63% low in early May to roughly 2.20%. Once the 10 year yield crossed over 2.00% (May 22) stocks came under pressure. The S&P 500 Index (S&P 500) retreated 3.4% between May 21 and June 12, with the interest-rate sensitive sectors such as utilities and telecommunications dropping 7.5% and 4.2%, respectively (Exhibit 2). In a low interest rate environment yield-hungry investors have flocked to dividend paying stocks. With interest rates hovering near 2.2% some of the demand for high-yielding stocks such as utilities, telecommunications and mortgage REITs has been redirected. Rising rates tend to have a negative impact on stock valuations overall. In addition, higher rates lead to an increase in debt financing costs, which can have a negative impact on industries such as real estate developers that depend on borrowing. However, there are some sectors and industries that can benefit from a gradual increase in interest rates. Life insurance companies, which rely on interest from their investments to bolster profits, stand to benefit. A steeper yield curve also helps the banks as it leads to an improvement in net interest margins; however, there is likely an offset from a potential decline in lending and mortgages because of higher borrowing rates. Exhibit 1: Bonds & Stocks Come Under Pressure in May Exhibit 2: S&P 500 Price Return (May 21-June 12)
Tapering Ahead? There is reason for the Fed to scale back QE and stop expanding its balance sheet, which has reached about $3.4 trillion, up roughly threefold since the financial crisis in 2008. While the Fed needs to address the size of its balance sheet, its non-conventional monetary policy has been necessary to foster U.S. economic growth. Although the economy is on better footing compared to four years ago, it is still not strong enough that Fed feels compelled to taper its QE program. Economic data has been mixed this year. Consumer confidence, U.S. auto sales, home prices and continuing claims have been generally positive. However job growth over the past three months has been soft and the unemployment rate is at 7.6%. The Fed has indicated it would like to see unemployment at 6.5% before it will begin easing off the QE pedal. Also, inflation is benign. All of this suggests the Fed is unlikely to be in a hurry to reduce its QE program anytime soon, particularly not when the Federal Open Market Committee (FOMC) meets June 18-19. According to the median estimate in a Bloomberg survey of 59 economists, the Fed is likely to trim their QE program to $65 billion a month at the October 29-30 FOMC meeting, from the current level of $85 billion. Aside from the Fed, other central banks around the world have been injecting liquidity, which has supported stocks. Even if the Fed decides to slow down its bond purchases, other global central banks may not be inclined to follow suit. To avoid derailing the stock market, the Fed is more likely to gradually unwind its QE policies over time. We think the debate and concern over the Fed tapering QE will continue and is likely to pressure stocks in the near term, but we still believe the overall backdrop for equities remains positive. If interest rates were to climb further, we think there is a comfortable buffer for stocks to remain attractive. The earnings yield (inverse forward P/E ratio) for the S&P 500 is 6.8% vs. the 10-year U.S. Treasury yield of approximately 2.2%. Even if rates climb to more normal levels closer to 3.0%, we do not see this being a significant threat for stocks.
Weekly Insights June 14, 2013
Page 5
Where Can Investors Go? Although higher interest rates would hurt dividend paying stocks, we still find these attractive. For investors searching for yield, we suggest they focus on quality companies that have a history of growing dividends and a sustainable payout ratio, rather than focusing only on the level of the yield. According to our research, companies that grow dividends outperform those that do not. Dividend growers also fared better than non-dividend paying stocks. Companies that have a history of growing their dividends that we would highlight include Corning Inc. (GLW-N; 2.7% yield), Kraft Foods Group Inc. (KRFT-N), Norfolk Southern Corp. (NSC-N; 2.6% yield), Procter & Gamble Co. (PG-N; 3.1% yield) and United Technologies Inc. (UTX-N; 2.3% yield). In general, the banks and life insurance companies have not been increasing dividends in recent years, however, they could benefit from higher interest rates. In these industries we would highlight MetLife Inc. (MET-N; 2.5% yield), and JPMorgan Chase & Co. (JPM-N; 2.8% yield).

Weekly Insights June 14, 2013
Page 6
U.S. Treasuries
(bps) 2 Year 5 Year 10 Year 30 Year1 Week Change -0.03 -0.08 -0.06 -0.041 Month Change 0.03 0.16 0.15 0.12
Government of Canada Bonds
(bps) 2 Year 5 Year 10 Year 30 Year1 Week Change -0.03 -0.05 -0.04 -0.041 Month Change 0.07 0.07 0.16 0.11
Charts as of June 14, 2013. Source: Bloomberg Finance L.P.
0.00
0.50
1.00
1.50
2.00
2.50
3.00
3.50
4.00
1 2 5 10 30Term
U.S. Treasury Yield Curve
Today 1 Week Ago 1 Month Ago
%
1.20
1.40
1.60
1.80
2.00
2.20
Jun-12 Aug-12 Oct-12 Dec-12 Feb-13 Apr-13 Jun-13
U.S. 10-YR Treasury Yield
Value
50 DMA
%
0.50
1.00
1.50
2.00
2.50
3.00
1 2 5 10 30Term
Government of Canada Yield Curve
Today 1 Week Ago 1 Month Ago
%
1.50
1.70
1.90
2.10
2.30
Jun-12 Aug-12 Oct-12 Dec-12 Feb-13 Apr-13 Jun-13
Government of Canada 10-YR Yield
Value
50 DMA
%
Fixed Income Update Scott Booth, CFA
The U.S. Treasury yield curve is higher and steeper than it was a month ago, with 5-year yields having made the largest move, rising 15 basis points (bps) over the period. Moderation of concerns about the Fed moving to taper asset purchases has contributed to a decline in U.S. Treasuries yields in recent trading sessions.
At 2.15%, the 10-year U.S. Treasury yield has risen dramatically from its 2013 lows but is down from a recent peak. There is price support for the 10-year U.S. Treasury at 2.40% and resistance around 2.00% in the medium term.
Over the past month the Canadian yield curve has shifted higher and steeper in sympathy with U.S. Treasuries. The Government of Canada 10-year yield has marched higher from its early May lows and now sits at 2.14%. From a technical perspective there appears to be price resistance at 2.05% and support for prices at the 2.30% mark in the medium term.
Weekly Insights June 14, 2013
Page 7
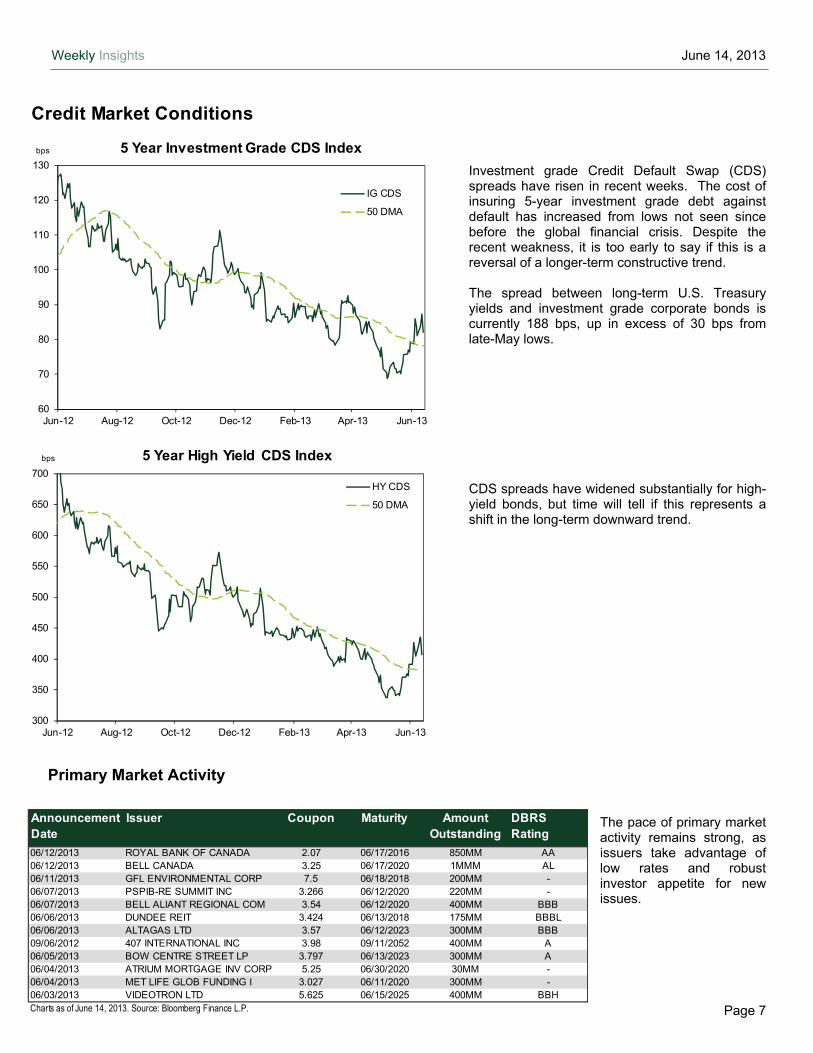
Credit Market Conditions
60
70
80
90
100
110
120
130
Jun-12 Aug-12 Oct-12 Dec-12 Feb-13 Apr-13 Jun-13
5 Year Investment Grade CDS Index
IG CDS
50 DMA
bps
300
350
400
450
500
550
600
650
700
Jun-12 Aug-12 Oct-12 Dec-12 Feb-13 Apr-13 Jun-13
5 Year High Yield CDS Index
HY CDS
50 DMA
bps
Announcement Date
Issuer Coupon Maturity Amount Outstanding
DBRS Rating
06/12/2013 ROYAL BANK OF CANADA 2.07 06/17/2016 850MM AA06/12/2013 BELL CANADA 3.25 06/17/2020 1MMM AL06/11/2013 GFL ENVIRONMENTAL CORP 7.5 06/18/2018 200MM -06/07/2013 PSPIB-RE SUMMIT INC 3.266 06/12/2020 220MM -06/07/2013 BELL ALIANT REGIONAL COM 3.54 06/12/2020 400MM BBB06/06/2013 DUNDEE REIT 3.424 06/13/2018 175MM BBBL06/06/2013 ALTAGAS LTD 3.57 06/12/2023 300MM BBB09/06/2012 407 INTERNATIONAL INC 3.98 09/11/2052 400MM A06/05/2013 BOW CENTRE STREET LP 3.797 06/13/2023 300MM A06/04/2013 ATRIUM MORTGAGE INV CORP 5.25 06/30/2020 30MM -06/04/2013 MET LIFE GLOB FUNDING I 3.027 06/11/2020 300MM -06/03/2013 VIDEOTRON LTD 5.625 06/15/2025 400MM BBHCharts as of June 14, 2013. Source: Bloomberg Finance L.P.
Investment grade Credit Default Swap (CDS) spreads have risen in recent weeks. The cost of insuring 5-year investment grade debt against default has increased from lows not seen since before the global financial crisis. Despite the recent weakness, it is too early to say if this is a reversal of a longer-term constructive trend. The spread between long-term U.S. Treasury yields and investment grade corporate bonds is currently 188 bps, up in excess of 30 bps from late-May lows.
CDS spreads have widened substantially for high-yield bonds, but time will tell if this represents a shift in the long-term downward trend.
Primary Market Activity
The pace of primary market activity remains strong, as issuers take advantage of low rates and robust investor appetite for new issues.

Weekly Insights June 14, 2013
Page 8

Weekly Insights June 14, 2013
Page 9
Market Statistics
S&P/TSX Composite SectorsClose TSX Sector Weekly YTD Div P/E Rel to 5 Yr EPS
13-Jun-13 Weight Position* Change Change Yield Trail Forward 10 Yr Avg P/B Growth RateCONSUMER DISCRET C$ 1,228 5.3% Market -1.2% 14.9% 2.4% 14.6 13.6 0.8 2.0 10%CONSUMER STAPLES C$ 2,309 3.1% Market 0.6% 9.2% 1.7% 16.9 15.2 1 2.4 10%ENERGY C$ 2,662 24.9% Market -0.9% 0.2% 3.4% 20.6 16.4 1.2 1.7 4%FINANCIALS C$ 1,786 33.9% Market -0.5% 1.6% 4.0% 11.8 11.2 0.9 1.7 8%HEALTH CARE C$ 1,223 2.6% Under 2.2% 34.5% 0.3% 21.7 20.4 0.9 4.3 N/AINDUSTRIALS C$ 1,670 6.9% Over -1.6% 11.8% 2.0% 17.5 15.3 1 3.5 15%INFORMATION TECH C$ 135 1.7% Over 0.3% 28.0% 0.5% 36.5 15.6 1.1 1.8 3%MATERIALS C$ 2,232 14.2% Market -2.0% -25.2% 2.1% 13 12.7 0.5 1.2 14%TELECOMMUNICATION C$ 1,119 5.4% Under -1.1% 4.4% 4.5% 16.2 14.9 1 3.4 5%UTILITIES C$ 1,831 2.0% Under -0.6% -4.8% 5.0% 19.6 20.2 1 2.0 8%
S&P/TSX Composite 12,277 -0.9% -1.3% 3.2% 14.9 13.5 0.9 1.8 4%
S&P 500 SectorsClose S&P 500 Sector Weekly YTD Div P/E Rel to 5 Yr EPS
13-Jun-13 Weight Position* Change Change Yield Trail Forward 10 Yr Avg P/B Growth RateCONSUMER DISCRETION 447 12.1% Under -0.4% 19.0% 1.3% 19.7 17.2 0.9 3.9 15%CONSUMER STAPLES 419 10.6% Market 0.6% 16.8% 2.6% 19.5 17 1.1 4.3 10%ENERGY 592 10.6% Market -0.8% 10.9% 2.0% 12.3 12.3 1 1.9 9%FINANCIALS 266 16.6% Market -0.9% 20.3% 1.5% 13.7 12.7 0.8 1.2 11%HEALTH CARE 561 12.8% Over 0.4% 21.6% 1.8% 16 15.5 1 3.3 10%INDUSTRIALS 376 10.2% Over -0.1% 14.8% 2.1% 16.2 15 1 3.0 11%INFORMATION TECH 505 18.0% Over -0.7% 8.8% 1.4% 14.1 13.4 0.7 3.2 13%MATERIALS 253 3.4% Under 0.5% 6.6% 2.3% 17 14.6 0.9 2.7 9%TELECOMMUNICATION 160 2.9% Under 1.8% 10.2% 4.3% 22.8 18.5 1.4 2.4 8%UTILITIES 191 3.2% Market 0.2% 8.1% 3.9% 15 15.2 1 1.6 3%
S&P 500 1,636 -0.5% 14.7% 2.0% 15.5 14.7 1 2.4 N/A
Global IndicesClose Weekly YTD Div 52 Week 52 Week
13-Jun-13 Change Change Yield Trail Forward P/B High Low NIKKEI 225 12,445 -1.5% 22.0% 1.6% 23.3 15.8 1.4 15,943 8,328HANG SENG 20,887 -4.0% -7.4% 3.5% 9.6 9.9 1.3 23,945 18,711SHANGHAI COMPOSITE 2,148 -4.9% -4.7% 2.7% 11.7 9.4 1.5 2,445 1,949FTSE 100 6,305 -1.5% 7.1% 3.8% 16.2 11.9 1.8 6,876 5,424DAX 8,095 -1.2% 7.1% 3.4% 15.2 11.9 1.5 8,558 6,078Source: Bloomberg Finance L.P., Baseline. As of June 14, 2013.
* Sector Position is Portfolio Advice & Investment Research's recommended sector weighting versus the benchmark
P/E
P/E
P/E

Weekly Insights June 14, 2013
Page 10
Interest Rates - CanadaClose Weekly Monthly YTD
13-Jun-13 Change Change ChangeGoC 3-Month 1.02% 0bps 0bps 10bpsGoC 6-Month 1.05% 1bps 1bps 4bpsGoC 1-Year 1.10% 1bps 1bps -1bpsGoC 2-Year 1.12% -3bps 2bps -3bpsGoC 5-Year 1.56% -5bps 4bps 14bpsGoC 10-Year 2.14% -5bps 4bps 31bpsGoC 30-Year 2.69% -5bps 4bps 31bps
Interest Rates - U.S.Close Weekly Monthly YTD
13-Jun-13 Change Change ChangeUS Gov 3-Month 0.04% 0bps 2bps 0bpsUS Gov 6-Month 0.08% 0bps 1bps -4bpsUS Gov 1-Year 0.12% -1bps -2bps -2bpsUS Gov 2-Year 0.28% -3bps -2bps 3bpsUS Gov 5-Year 1.06% -9bps -1bps 30bpsUS Gov 10-Year 2.15% -7bps -2bps 37bpsUS Gov 30-Year 3.32% -5bps 1bps 36bps
CommoditiesClose Weekly Monthly YTD
13-Jun-13 Change Change ChangeGold $1,386.02 0.52% 0.17% -17.44%Silver $21.87 1.94% -0.79% -27.23%Natural Gas $3.81 -1.65% -5.50% 13.25%Crude Oil $96.69 2.06% 6.57% 6.74%Copper $3.22 -3.87% -3.60% -11.24%Nickel $6.44 -6.80% -5.19% -17.71%Aluminum $0.83 -5.85% -3.30% -11.03%Zinc $0.83 -4.99% -4.79% -12.03%CRB Index $285.30 -0.46% 1.60% -3.20%
CurrenciesClose Weekly Monthly YTD
13-Jun-13 Change Change ChangeCAD$/US$ 0.9841 -0.35% 0.02% 2.42%US$ Trade Wt. 80.849 -1.00% -2.53% 1.35%Euro/US$ 1.3314 0.89% 0.03% 0.92%Yen/US$ 94.86 2.60% -5.36% -8.55%Pound/US$ 1.5648 0.72% 0.05% -3.73%
Charts as of June 14, 2013. Source: Bloomberg Finance L.P.
Canadian Yield Curve
0.50
1.00
1.50
2.00
2.50
3.00
3M 6M 1Y 2Y 5Y 10Y 30Y
Current
1 Month Ago
%
U.S. Yield Curve
0.00
0.50
1.00
1.50
2.00
2.50
3.00
3.50
3M 6M 1Y 2Y 5Y 10Y 30Y
Current
1 Month Ago
%
CRB Commodity Index
160
190
220
250
280
310
340
370
400
Jan-09
Jul-09
Jan-10
Jul-10
Jan-11
Jul-11
Jan-12
Jul-12
Jan-13
CAD$/US$
0.70
0.75
0.80
0.850.90
0.95
1.00
1.05
1.10
Jan-09
Jul-09
Jan-10
Jul-10
Jan-11
Jul-11
Jan-12
Jul-12
Jan-13

Weekly Insights June 14, 2013
Page 11
Key Charts
Level MTD (%) YTD (%) Level MTD (%) YTD (%)12,277 -3.0 -1.3 S&P 500 1,636 0.3 14.7
Yield MTD (bps) YTD (bps) Yield MTD (bps) YTD (bps)2.14 4 30 US 10-YR 2.15 -2 35
Charts as of June 14, 2013. Source Bloomberg Finance L.P.
S&P/TSX Comp
GoC 10-Yr
S&P 500 Index
600
800
1000
1200
1400
1600
1800
Jan-08 Jan-09 Jan-10 Jan-11 Jan-12 Jan-13
Value
200 DMA
US 10-YR Treasury Yield
1.00
2.00
3.00
4.00
5.00
Jan-08 Jan-09 Jan-10 Jan-11 Jan-12 Jan-13
Value
200 DMA
%GoC 10-YR Yield
1.50
2.00
2.50
3.00
3.50
4.00
4.50
Jan-08 Jan-09 Jan-10 Jan-11 Jan-12 Jan-13
Value
200 DMA
%
S&P/TSX Composite Index
7000
8000
9000
10000
11000
12000
13000
14000
15000
16000
Jan-08 Jan-09 Jan-10 Jan-11 Jan-12 Jan-13
Value
200 DMA

Weekly Insights June 14, 2013
Page 12
Level MTD (%) YTD (%) Level MTD (%) YTD (%)3.81 -5.6 12.3 Crude Oil 96.69 6.6 4.6
Level MTD (%) YTD (%) Level MTD (%) YTD (%)Gold 1,386.02 0.2 -17.0 Copper 3.22 -3.6 -11.2
Charts as of June 14, 2013. Source Bloomberg Finance L.P.
Natural Gas
Crude Oil (WTI US$/barrel)
30
50
70
90
110
130
150
Jan-08 Jan-09 Jan-10 Jan-11 Jan-12 Jan-13
Value
200 DMA
Natural Gas (NYMEX US$/mcf)
0
2
4
6
8
10
12
14
Jan-08 Jan-09 Jan-10 Jan-11 Jan-12 Jan-13
Value
200 DMA
Gold (US$/ounce)
600
800
1000
1200
1400
1600
1800
2000
Jan-08 Jan-09 Jan-10 Jan-11 Jan-12 Jan-13
Value
200 DMA
Copper (US$/lb)
1
2
3
4
5
Jan-08 Jan-09 Jan-10 Jan-11 Jan-12 Jan-13
Value
200 DMA

Weekly Insights June 14, 2013
Page 13
Upcoming U.S. Earnings
Before the Open Company Ticker Consensus EPS ($) Year Ago EPS ($) Revenue Estimates ($MM)HJ Heinz HNZ 0.82 0.81 3,018.20
After the Close Company Ticker Consensus EPS ($) Year Ago EPS ($) Revenue Estimates ($MM)Adobe Systems ADBE 0.34 0.60 1,009.80
Before the Open Company Ticker Consensus EPS ($) Year Ago EPS ($) Revenue Estimates ($MM)FedEx FDX 1.97 1.99 11,447.85
After the Close Company Ticker Consensus EPS ($) Year Ago EPS ($) Revenue Estimates ($MM)Jabil Circuit JBL 0.54 0.64 4,398.89 Micron MU 0.03 -0.32 2,243.14
Before the Open Company Ticker Consensus EPS ($) Year Ago EPS ($) Revenue Estimates ($MM)Kroger KR 0.89 0.78 30,183.40 Rite Aid RAD 0.10 -0.03 6,292.29
After the Close Company Ticker Consensus EPS ($) Year Ago EPS ($) Revenue Estimates ($MM)Oracle ORCL 0.88 0.82 11,126.54
Before the Open Company Ticker Consensus EPS ($) Year Ago EPS ($) Revenue Estimates ($MM)Carnival CCL 0.07 0.20 3,551.04
Source: Briefing.com. Consensus is Thomson Reuters.Release time and date tentative. Estimates subject to change.
Friday, June 21, 2013
Thursday, June 20, 2013
Tuesday, June 18, 2013
Wednesday, June 19, 2013

Weekly Insights June 14, 2013
Page 14
Appendix A – Important Information Full disclosures for all companies covered by TD Securities Inc. can be viewed at https://www.tdsresearch.com/equities/coverage.disclosure.action Research Ratings Action List BUY: The stock’s total return is expected to exceed a minimum of 15%, on a risk-adjusted basis, over the next 12 months and it is a top pick in the Analyst’s sector. BUY: The stock’s total return is expected to exceed a minimum of 15%, on a risk-adjusted basis, over the next 12 months. SPECULATIVE BUY: The stock’s total return is expected to exceed 30% over the next 12 months; however, there is material event risk associated with the investment that could result in significant loss. HOLD: The stock’s total return is expected to be between 0% and 15%, on a risk-adjusted basis, over the next 12 months. TENDER: Investors are advised to tender their shares to a specific offer for the company’s securities. REDUCE: The stock’s total return is expected to be negative over the next 12 months.
^ Percentage of subject companies under each ratingcategory—BUY (covering Action List BUY, BUY andSpec. BUY ratings), HOLD and REDUCE (coveringTENDER and REDUCE ratings).
* Percentage of subject companies within each of thethree categories (BUY, HOLD and REDUCE) for whichTD Securities Inc. has provided investment bankingservices within the last 12 months.
Current as of June 4, 2013
Investment Banking Services Provided*
42%
57%
1%
0%
10%
20%
30%
40%
50%
60%
70%
80%
BUY HOLD REDUCE
Distribution of Research Ratings^
HOLD42%
REDUCE4%
BUY54%
Overall Risk Rating in order of increasing risk: Low (10.1% of coverage universe), Medium (28.9%), High (49.5%), Speculative (11.6%) Technical Research Disclaimer The opinions expressed herein reflect a technical perspective and may differ from fundamental research on these issuers. Fundamental research can be obtained through your TD Waterhouse Investment Advisor or on the Markets and Research site within WebBroker. The technical research opinions contained in this report are based on historical technical data and expectations of the most likely direction of a market or security. No guarantee of that outcome is ever implied. Research Dissemination Policy TD Waterhouse makes its research products available in electronic format. TD Waterhouse posts its research products to its proprietary websites for all eligible clients to access by password and distributes the information to its sales personnel who may then distribute it to their retail clients under the appropriate circumstances either by email, fax or regular mail. No recipient may pass on to any other person, or reproduce by any means, the information contained in this report without the prior written consent of TD Waterhouse. Analyst Certification The TD Waterhouse Portfolio Advice & Investment Research analyst(s) responsible for this report hereby certify that (i) the recommendations and technical research opinions expressed in the research report accurately reflect the personal views of the analyst(s) about any and all of the securities or issuers discussed herein and (ii) no part of the research analyst's compensation was, is, or will be, directly or indirectly, related to the provision of specific recommendations or views contained in the research report.
Distribution of Research Ratings

Weekly Insights June 14, 2013
Page 15
Conflicts of Interest The TD Waterhouse Portfolio Advice & Investment Research analyst(s) responsible for this report may own securities of the issuer(s) discussed in this report. As with most other TD Waterhouse employees, the analyst(s) who prepared this report are compensated based upon (among other factors) the overall profitability of TD Waterhouse and its affiliates, which includes the overall profitability of investment banking services, however TD Waterhouse does not compensate analysts based on specific investment banking transactions. Mutual Fund Disclaimers Commissions, trailing commissions, management fees and expenses all may be associated with mutual fund investments. Please read the prospectus, which contains detailed investment information, before investing. The indicated rates of return are the historical annual compounded total returns for the period indicated including changes in unit value and reinvestment of all distributions and do not take into account sales, redemption, distribution or optional charges or income taxes payable by any unitholder that would have reduced returns. Mutual funds are not guaranteed or insured, their values change frequently and past performance may not be repeated. TD Waterhouse Disclaimer The statements and statistics contained herein are based on material believed to be reliable, but are not guaranteed to be accurate or complete. This report is for information purposes only and is not an offer or solicitation with respect to the purchase or sale of any investment fund, security or other product. Particular investments or trading strategies should be evaluated relative to each individual’s objectives. Graphs and charts are used for illustrative purposes only and do not reflect future values or future performance. This document does not provide individual, financial, legal, investment or tax advice. Please consult your own legal, investment, and tax advisor. All opinions and other information included in this document are subject to change without notice. The Toronto-Dominion Bank and its affiliates and related entities are not liable for any errors or omissions in the information or for any loss or damage suffered. TD Waterhouse Canada Inc. and/or its affiliated persons or companies may hold a position in the securities mentioned, including options, futures and other derivative instruments thereon, and may, as principal or agent, buy or sell such securities. Affiliated persons or companies may also make a market in and participate in an underwriting of such securities. TD Waterhouse represents the products and services offered by TD Waterhouse Canada Inc. (Member – Canadian Investor Protection Fund), TD Waterhouse Private Investment Counsel Inc., TD Waterhouse Private Banking (offered by The Toronto-Dominion Bank) and TD Waterhouse Private Trust (offered by The Canada Trust Company). The Portfolio Advice and Investment Research team is part of TD Waterhouse, which is a subsidiary of The Toronto-Dominion Bank. TD Securities Disclaimer “TD Securities” is the trade name which TD Securities Inc. and TD Securities (USA) LLC jointly use to market their institutional equity services. TD Securities is a trade-mark of The Toronto-Dominion Bank representing TD Securities Inc., TD Securities (USA) LLC, TD Securities Limited and certain corporate and investment banking activities of The Toronto-Dominion Bank. Trade-mark Disclosure Bloomberg and Bloomberg.com are trademarks and service marks of Bloomberg Finance L.P., a Delaware limited partnership, or its subsidiaries. All rights reserved. All trademarks are the property of their respective owners. ®/ The TD logo and other trade-marks are the property of The Toronto-Dominion Bank or a wholly-owned subsidiary, in Canada and/or in other countries.
Related Documents